Exhibit 99.2
WHATON PRECIOUS METALS Second Quarter Report 2026
Exhibit 99.2
WHATON PRECIOUS METALS Second Quarter Report 2026
Management’s Discussion and Analysis of Results of Operations and Financial Condition for the Three and Six Months Ended June 30, 2026
This Management’s Discussion and Analysis (“MD&A”) should be read in conjunction with Wheaton Precious Metals Corp.’s (“Wheaton” or the “Company”) unaudited condensed interim consolidated financial statements for the three and six months ended June 30, 2026 and related notes thereto which have been prepared in accordance with IAS 34, Interim Financial Reporting (“IAS 34”) as issued by the International Accounting Standards Board. In addition, the following should be read in conjunction with the audited consolidated financial statements for the year ended December 31, 2025, the related MD&A and the 2025 Annual Information Form as well as other information relating to Wheaton on file with the Canadian securities regulatory authorities and on SEDAR+ at www.sedarplus.ca. Reference to Wheaton or the Company includes the Company’s wholly-owned subsidiaries. This MD&A contains “forward-looking” statements that are subject to risk factors set out in the cautionary note contained on page 54 of this MD&A as well as throughout this document. All figures are presented in United States dollars unless otherwise noted. This MD&A has been prepared as of August 6, 2026.
Table of Contents
| Highlights |
5 | |||
| Outlook |
7 | |||
| Mineral Stream Interests |
8 | |||
| Acquisition of Mineral Stream Interests |
10 | |||
| Updates on the Operating Mineral Stream Interests |
10 | |||
| Updates on the Development Stage Mineral Stream Interests |
11 | |||
| Early Deposit Mineral Stream Interests |
12 | |||
| Mineral Royalty Interests |
12 | |||
| Long-Term Equity Investments |
13 | |||
| Summary of Units Produced |
15 | |||
| Summary of Units Sold |
16 | |||
| Quarterly Financial Review |
17 | |||
| Results of Operations and Operational Review |
20 | |||
| General and Administrative |
28 | |||
| Share Based Compensation |
28 | |||
| Donations and Community Investments |
28 | |||
| Other Income (Expense) |
29 | |||
| Finance Costs |
29 | |||
| Income Tax Expense |
29 | |||
| Liquidity and Capital Resources |
30 | |||
| Share Capital |
39 | |||
| Financial Instruments |
39 | |||
| Future Changes to Accounting Policies |
39 | |||
| Non-GAAP Measures |
40 | |||
| Subsequent Events |
44 | |||
| Controls and Procedures |
44 | |||
| Attributable Reserves and Resources |
44 | |||
| Cautionary Note Regarding Forward-Looking Statements |
54 | |||
WHEATON PRECIOUS METALS 2026 SECOND QUARTER REPORT - MANAGEMENT DISCUSSION & ANALYSIS [2]
Overview
Wheaton Precious Metals Corp. is a precious metal streaming company which generates its revenue primarily from the sale of precious metals (gold, silver and palladium) and cobalt. The Company is listed on the New York Stock Exchange (“NYSE”), the Toronto Stock Exchange (“TSX”) and the London Stock Exchange (“LSE”) and trades under the symbol WPM.
As of June 30, 2026, the Company has entered into 45 long-term agreements with 38 mining companies, comprised of 35 precious metal purchase agreements, or “PMPAs”, three early deposit PMPAs and seven royalty agreements. These agreements relate to precious metals and cobalt from 57 mining assets located in 19 countries, including 22 operating mines, 20 development stage projects, and 15 exploration stage projects (including three in care and maintenance). Pursuant to the PMPAs, Wheaton acquires metal production from the counterparties for an initial upfront payment plus an additional cash payment for each ounce or pound delivered which is fixed by contract, generally at or below the prevailing market price. Attributable metal production as referred to in this MD&A is the metal production to which Wheaton is entitled pursuant to the various PMPAs. During the three months ended June 30, 2026, the per ounce price paid by the Company for the metals acquired under the agreements averaged $543 for gold, $9.57 for silver, $264 for palladium and $5.21 per pound for cobalt. The primary drivers of the Company’s financial results are the volume of metal production at the various mining assets to which the PMPAs relate and the price realized by Wheaton upon the sale of the metals received. Throughout this MD&A, the production and sales volume of gold, silver, palladium and platinum are reported in ounces, while cobalt is reported in pounds.
WHEATON PRECIOUS METALS 2026 SECOND QUARTER REPORT - MANAGEMENT DISCUSSION & ANALYSIS [3]
Operational Overview
| Q2 2026 | Q2 2025 | Change | YTD 2026 | YTD 2025 | Change | |||||||||||||||||||
|
|
||||||||||||||||||||||||
| Units produced |
||||||||||||||||||||||||
| Gold ounces |
90,434 | 92,883 | (2.6)% | 187,542 | 185,552 | 1.1 % | ||||||||||||||||||
| Silver ounces |
6,400 | 5,590 | 14.5 % | 13,070 | 10,275 | 27.2 % | ||||||||||||||||||
| Palladium ounces |
2,788 | 2,435 | 14.5 % | 5,379 | 5,096 | 5.6 % | ||||||||||||||||||
| Platinum ounces |
281 | - | n.a. | 321 | - | n.a. | ||||||||||||||||||
| Cobalt pounds |
796 | 647 | 23.1 % | 1,453 | 1,187 | 22.4 % | ||||||||||||||||||
| Gold equivalent ounces 2 |
202,229 | 190,179 | 6.3 % | 414,755 | 364,570 | 13.8 % | ||||||||||||||||||
| Units sold |
||||||||||||||||||||||||
| Gold ounces |
96,099 | 98,973 | (2.9)% | 191,171 | 210,270 | (9.1)% | ||||||||||||||||||
| Silver ounces |
6,522 | 4,868 | 34.0 % | 11,571 | 9,351 | 23.7 % | ||||||||||||||||||
| Palladium ounces |
2,069 | 2,575 | (19.7)% | 4,975 | 5,032 | (1.1)% | ||||||||||||||||||
| Cobalt pounds |
705 | 353 | 99.7 % | 1,014 | 618 | 64.1 % | ||||||||||||||||||
| Gold equivalent ounces 2 |
209,115 | 182,750 | 14.4 % | 390,859 | 370,911 | 5.4 % | ||||||||||||||||||
| Change in PBND 3 |
||||||||||||||||||||||||
| Gold ounces |
(11,540) | (10,228) | 1,312 | (13,737) | (33,227) | (19,490) | ||||||||||||||||||
| Silver ounces |
(960) | 33 | 993 | (157) | (405) | (248) | ||||||||||||||||||
| Palladium ounces |
620 | (182) | (802) | 254 | (25) | (279) | ||||||||||||||||||
| Platinum ounces |
225 | - | (225) | 257 | - | (257) | ||||||||||||||||||
| Cobalt pounds |
37 | 251 | 214 | 342 | 490 | 148 | ||||||||||||||||||
| Gold equivalent ounces 2 |
(27,056) | (8,423) | 18,633 | (14,391) | (37,431) | (23,040) | ||||||||||||||||||
|
|
||||||||||||||||||||||||
| Per unit metrics |
||||||||||||||||||||||||
| Sales price |
||||||||||||||||||||||||
| Gold per ounce |
$ | 4,452 | $ | 3,318 | 34.2 % | $ | 4,649 | $ | 3,082 | 50.8 % | ||||||||||||||
| Silver per ounce |
$ | 73.41 | $ | 34.05 | 115.6 % | $ | 78.26 | $ | 33.22 | 135.6 % | ||||||||||||||
| Palladium per ounce |
$ | 1,429 | $ | 996 | 43.5 % | $ | 1,581 | $ | 981 | 61.2 % | ||||||||||||||
| Cobalt per pound |
$ | 27.93 | $ | 18.60 | 50.2 % | $ | 28.06 | $ | 16.15 | 73.7 % | ||||||||||||||
| Gold equivalent per ounce 2 |
$ | 4,443 | $ | 2,754 | 61.3 % | $ | 4,684 | $ | 2,625 | 78.4 % | ||||||||||||||
| Cash costs 4 |
||||||||||||||||||||||||
| Gold per ounce 4 |
$ | 543 | $ | 470 | (15.5)% | $ | 550 | $ | 457 | (20.4)% | ||||||||||||||
| Silver per ounce 4 |
$ | 9.57 | $ | 5.33 | (79.5)% | $ | 11.30 | $ | 5.25 | (115.2)% | ||||||||||||||
| Palladium per ounce 4 |
$ | 264 | $ | 175 | (50.9)% | $ | 291 | $ | 174 | (67.2)% | ||||||||||||||
| Cobalt per pound 4 |
$ | 5.21 | $ | 3.57 | (45.9)% | $ | 5.21 | $ | 3.09 | (68.6)% | ||||||||||||||
| Gold equivalent per ounce 2, 4 |
$ | 568 | $ | 406 | (39.9)% | $ | 621 | $ | 399 | (55.6)% | ||||||||||||||
| Cash operating margin 4 |
||||||||||||||||||||||||
| Gold per ounce 4 |
$ | 3,909 | $ | 2,848 | 37.3 % | $ | 4,099 | $ | 2,625 | 56.2 % | ||||||||||||||
| Silver per ounce 4 |
$ | 63.84 | $ | 28.72 | 122.3 % | $ | 66.96 | $ | 27.97 | 139.4 % | ||||||||||||||
| Palladium per ounce 4 |
$ | 1,165 | $ | 821 | 41.9 % | $ | 1,290 | $ | 807 | 59.9 % | ||||||||||||||
| Cobalt per pound 4 |
$ | 22.72 | $ | 15.03 | 51.2 % | $ | 22.85 | $ | 13.06 | 75.0 % | ||||||||||||||
| Gold equivalent per ounce 2, 4 |
$ | 3,875 | $ | 2,348 | 65.0 % | $ | 4,063 | $ | 2,226 | 82.5 % | ||||||||||||||
|
|
||||||||||||||||||||||||
| Total revenue |
$ | 929,201 | $ | 503,218 | 84.7 % | $ | 1,830,670 | $ | 973,629 | 88.0 % | ||||||||||||||
| Gold revenue |
$ | 427,785 | $ | 328,354 | 30.3 % | $ | 888,823 | $ | 648,049 | 37.2 % | ||||||||||||||
| Silver revenue |
$ | 478,758 | $ | 165,739 | 188.9 % | $ | 905,528 | $ | 310,677 | 191.5 % | ||||||||||||||
| Palladium revenue |
$ | 2,957 | $ | 2,564 | 15.3 % | $ | 7,866 | $ | 4,936 | 59.4 % | ||||||||||||||
| Cobalt revenue |
$ | 19,701 | $ | 6,561 | 200.3 % | $ | 28,453 | $ | 9,967 | 185.5 % | ||||||||||||||
| Net earnings |
$ | 543,236 | $ | 292,270 | 85.9 % | $ | 1,125,280 | $ | 546,254 | 106.0 % | ||||||||||||||
| Per share |
$ | 1.196 | $ | 0.644 | 85.7 % | $ | 2.478 | $ | 1.204 | 105.8 % | ||||||||||||||
| Adjusted net earnings 4 |
$ | 542,542 | $ | 286,004 | 89.7 % | $ | 1,125,315 | $ | 536,830 | 109.6 % | ||||||||||||||
| Per share 4 |
$ | 1.195 | $ | 0.630 | 89.7 % | $ | 2.478 | $ | 1.183 | 109.5 % | ||||||||||||||
| Operating cash flows |
$ | 649,518 | $ | 414,959 | 56.5 % | $ | 1,415,340 | $ | 775,752 | 82.4 % | ||||||||||||||
| Per share 4 |
$ | 1.430 | $ | 0.914 | 56.5 % | $ | 3.117 | $ | 1.709 | 82.4 % | ||||||||||||||
| Dividends declared 5 |
$ | 88,556 | $ | 74,899 | 18.2 % | $ | 177,105 | $ | 149,780 | 18.2 % | ||||||||||||||
| Per share |
$ | 0.195 | $ | 0.165 | 18.2 % | $ | 0.390 | $ | 0.330 | 18.2 % | ||||||||||||||
|
|
||||||||||||||||||||||||
| 1) | All amounts in thousands except gold, palladium and platinum ounces produced and sold, per ounce amounts and per share amounts. |
| 2) | Gold-equivalent ounces (“GEOs”), which are provided to assist the reader, are based on the following commodity price assumptions: $4,800 per ounce gold; $80.00 per ounce silver; $1,500 per ounce palladium; $2,000 per ounce platinum; and $25.00 per pound cobalt; consistent with those used in estimating the Company’s production guidance for 2026. |
| 3) | Represents the increase (decrease) in payable ounces produced but not delivered (“PBND”) relative to the various mines that the Company derives precious metals from and, for cobalt, the increase (decrease) of payable pounds PBND. Payable units PBND will be recognized in future sales as they are delivered to the Company under the terms of their contracts. Payable ounces PBND to Wheaton is expected to average approximately two to three months of annualized production for both gold and palladium and two months for silver but may vary from quarter to quarter due to a number of factors, including mine ramp-up and the timing of shipments. Please see “Cautionary Note Regarding Forward-Looking Statements” for material risks, assumptions and important disclosures associated with this information. |
| 4) | Refer to discussion on non-GAAP measures beginning on page 40 of this MD&A. |
| 5) | As at June 30, 2026, cumulative dividends of $2.8 billion have been declared and paid by the Company. |
WHEATON PRECIOUS METALS 2026 SECOND QUARTER REPORT - MANAGEMENT DISCUSSION & ANALYSIS [4]
Highlights
Operations
| ● | For the three months ended June 30, 2026, relative to the comparable period of the prior year: |
| o | Production amounted to 202,200 gold equivalent ounces (“GEOs”), an increase of 6%, resulting from the realization of the Company’s growth profile including the acquisition of the PMPA with BHP Group Limited (“BHP”) for their 33.75% portion of the silver produced at Antamina (the “BHP Antamina PMPA”) in addition to the commencement of production at Fenix, Hemlo and Goose, coupled with the recommencement of production at Aljustrel, partially offset by lower production at Salobo. |
| o | Sales volumes amounted to 209,100 GEOs, an increase of 14%, primarily the result of relative changes to GEOs produced but not delivered (“PBND”), coupled with the higher production. PBND GEOs decreased 27,100 GEOs during the quarter, compared to a decrease of 8,400 GEOs in the same period of the prior year. |
| o | Revenue increased 85% or $426 million to $929 million (46% gold, 52% silver, 0.3% palladium and 2% cobalt), representing a record for the Company, with the increase being primarily due to a 61% increase in realized commodity prices, coupled with the higher sales volumes. |
| o | Gross margin amounted to $688 million (74% of revenue), representing an increase of $335 million (a 4% increase as a percentage of revenue). |
| o | Net earnings amounted to $543 million, an increase of $251 million, primarily due to the increased gross margin, partially offset by higher income taxes resulting from the higher net earnings and higher interest expense resulting from debt drawn to partially fund the acquisition of the BHP Antamina PMPA. |
| o | Operating cash flow amounted to $650 million, with the $235 million increase being primarily the result of the higher gross margin, partially offset by the scheduled global minimum tax payment (“GMT”) for the 2024 year in the amount of $109 million (Cdn$155 million) made during the second quarter of 2026. |
| ● | For the six months ended June 30, 2026 relative to the prior year: |
| o | Production amounted to 414,800 GEOs, an increase of 14%, resulting from the realization of the Company’s growth profile including the acquisition of the BHP Antamina PMPA in addition to the commencement of production at Fenix, Hemlo and Goose, coupled with higher production at Peñasquito and the recommencement of production at Aljustrel, partially offset by lower production at Salobo. |
| o | Sales volumes amounted to 390,900 GEOs, an increase of 5% resulting from higher production, partially offset by relative changes in the number of GEOs PBND, with PBND decreasing by 14,400 GEOs, compared to a 37,400 GEO decrease during the comparable period of the prior year. |
| o | Revenue increased 88% or $857 million to $1.8 billion (49% gold, 49% silver, 0.4% palladium and 2% cobalt), representing a record for the Company, with the increase being primarily due to a 78% increase in realized commodity prices coupled with the 5% increase in sales volumes. |
| o | Gross margin amounted to $1.4 billion (76% of revenue), representing an increase of $715 million (a 7% increase as a percentage of revenue). |
| o | Net earnings amounted to $1.1 billion, representing a record for the Company and an increase of $579 million, primarily due to the higher gross margin, partially offset by higher income taxes driven by higher income and higher interest expense. |
| o | Adjusted net earnings increased 110% or $588 million to $1.1 billion, representing a record for the Company. |
| o | Operating cash flow amounted to $1.4 billion, representing a record for the Company, with the $640 million increase being due primarily to the higher gross margin, partially offset by the GMT payment. |
| ● | On August 6, 2026, the Board of Directors declared a dividend in the amount of $0.195 per common share. |
Corporate Development
| ● | On April 1, 2026, the Company entered into a PMPA with KGL Resources Limited (“KGL”) for a portion of the gold and silver produced at the Jervois project located in Australia. |
| ● | On April 20, 2026, the Company entered into a Royalty agreement with Spanish Mountain Gold Limited (“Spanish Mountain Gold”) for a 1.5% net smelter returns royalty on gold and silver production from the Spanish Mountain Gold project. In return, the Company also obtained a right of first refusal on any future precious metal streams, royalties, prepays or similar transactions with respect to the Spanish Mountain Gold Project. |
WHEATON PRECIOUS METALS 2026 SECOND QUARTER REPORT - MANAGEMENT DISCUSSION & ANALYSIS [5]
| ● | On June 4, 2026, the Company entered into a Royalty agreement with Cipango Limited (“Cipango”) for a 1.5% net smelter returns royalty covering seven mineral exploration properties located in Japan. |
Asset Updates
| ● | The Company received its first deliveries during the second quarter of 2026 related to the recently acquired BHP Antamina PMPA. |
| ● | Ivanhoe Mines Ltd. (“Ivanhoe”) reports that the Platreef mine is advancing on track, with commercial production expected in Q4 2026. |
| ● | Rio2 reports that based on current ramp-up progress, they anticipate achieving commercial production at the Fenix mine in Q4 2026. |
| ● | Silvercorp Metals Inc. (“Silvercorp”) reports that they remain focused on achieving first commissioning of the operation by July 2027, in line with the El Domo project schedule. |
| ● | Allied Gold Corporation (“Allied”) reports that the Kurmuk project continued to advance during the second quarter, with the start of operations expected in August and first gold following a few weeks thereafter. |
| ● | Aris Mining Corporation (“Aris”) reports that underground access connecting the Bulk Mining Zone to the new plant area at the Marmato mine is complete, with SAG and ball mills on site, and mechanical installation underway. Construction of the 5,000 TPD CIP plant continues to advance toward first gold and is on schedule for Q4 2026. |
| ● | Waterton Copper LP (“Waterton Copper”) substantially completed the commissioning stage of the mill restart at Mineral Park during Q2 2026, with production expected to increase throughout the second half of the year as operations ramp up toward the mill’s 16.5 Mtpa nameplate capacity. |
| ● | Montage Gold Corp. (“Montage”) reports that first gold pour through the oxide circuit at the Koné project is anticipated in late Q4 2026, while the hard-rock comminution circuit remains on track for completion in Q2 2027. |
| ● | Hudbay Minerals Inc. (“Hudbay”) reported that the definitive feasibility study (“DFS”) at Copper World is progressing well, and a project sanctioning decision continues to be on track for late 2026. The DFS is expected to include scope for future mill expansion optionality. |
| ● | BMC Minerals Ltd. (“BMC”) announced receipt of a positive decision document related to the Kudz Ze Kayah project issued by the Government of Yukon, Natural Resources Canada and the Department of Fisheries and Oceans Canada, with BMC reporting that they now aim to make a final investment decision in late 2027, subject to receipt of permits. |
| ● | Equinox Gold Corp. (“Equinox”) reports that it has signed 20-year land access agreements with all three communities that host its Los Filos mine and has initiated activities to support the gradual restart of heap leach operations and to advance technical studies to evaluate potential expansion opportunities. |
Other
| ● | During the second quarter of 2026: |
| o | The Company increased its existing revolving credit facility (the “Revolving Credit Facility”) by $500 million to $2.5 billion and extended its maturity by one year to June 30, 2031. |
| o | The Company made two quarterly dividend payments totaling $177 million. |
| o | The Company made total upfront cash payments of $4.5 billion related to the BHP Antamina PMPA ($4.3 billion), the Koné PMPA ($156 million), the Spanish Mountain Royalty ($23 million), the Jervois PMPA ($16 million) and the Cipango Royalty ($4.5 million). |
| ● | On April 1, 2026, the Company drew on the previously announced new $1.5 billion non-revolving credit facility (the “Term Loan”) with a two-year term, as further described in Note 16 to the financial statements. Proceeds from the Term Loan, together with a draw on the Company’s Revolving Credit Facility, were used to partially fund the BHP Antamina PMPA. |
| ● | At June 30, 2026, the Company’s net debt position1 was $1.9 billion. |
| ● | Subsequent to the quarter, the Company made an additional upfront cash payment of $44 million related to the El Domo PMPA. |
| 1 | Refer to discussion on non-GAAP measure (v) on page 43 of this MD&A. |
WHEATON PRECIOUS METALS 2026 SECOND QUARTER REPORT - MANAGEMENT DISCUSSION & ANALYSIS [6]
Outlook1
Wheaton’s estimated attributable production in 2026 is forecast to be 400,000 to 430,000 ounces of gold, 27 to 29 million ounces of silver, and 19,000 to 21,000 GEOs of other metals, resulting in annual production of approximately 860,000 to 940,000 GEOs2, unchanged from previous guidance. Approximately 3% of the Company’s forecast 2026 production is estimated to be delivered from assets currently in construction or various stages of ramp-up.
Annual production is forecast to increase by approximately 50% to 1,200,000 GEOs2 by 2030, with average annual production forecast to remain at 1,200,000 GEOs2 in years 2031 to 2035, also unchanged from previous guidance.
| 1 | Statements made in this section contain forward-looking information with respect to forecast production, funding outstanding commitments and continuing to acquire accretive mineral stream interests and readers are cautioned that actual outcomes may vary. Please see “Cautionary Note Regarding Forward-Looking Statements” for material risks, assumptions and important disclosures associated with this information. |
| 2 | Ounces produced represent the quantity of silver, gold, palladium, platinum and cobalt contained in concentrate or doré prior to smelting or refining deductions. Gold equivalent forecast production for 2026 and the longer-term outlook are based on the following updated commodity price assumptions: $4,800 per ounce of gold, $80 per ounce of silver, $1,500 per ounce of palladium, $2,000 per ounce of platinum and $25.00 per pound of cobalt. |
WHEATON PRECIOUS METALS 2026 SECOND QUARTER REPORT - MANAGEMENT DISCUSSION & ANALYSIS [7]
Mineral Stream Interests
The following table summarizes the mineral stream interests currently owned by the Company:
| Total Upfront Consideration | ||||||||||||||||||||||||||||||||||||||||
| Mineral Stream Interests | |
Mine Owner |
¹ |
Location¹ | |
Attributable Production |
|
Production Payment Per Unit 2,3 |
|
Depletion Rate Per Unit ¹ |
|
Paid to June 30, 2026 3 |
To be Paid 2 | |
Cash Flow Generated to Date 3 |
|
|
Units Received & Sold to Date ³ |
|
|
Q2-2026 PBND 3, 4 |
|||||||||||||||||||
| Gold |
||||||||||||||||||||||||||||||||||||||||
| Salobo |
Vale | BRA | 75% | $433 | $404 | $ | 3,573,360 | $ | - | $ | 4,060,286 | 2,622,735 | 75,115 | |||||||||||||||||||||||||||
| Sudbury 5 |
Vale | CAN | 70% | $400 | $1,399 | 623,572 | - | 411,070 | 320,629 | 9,826 | ||||||||||||||||||||||||||||||
| Constancia |
Hudbay | PER | 50% | $429 | $338 | 135,000 | - | 494,505 | 277,854 | 158 | ||||||||||||||||||||||||||||||
| San Dimas |
FM | MEX | variable 6 | $650 | $428 | 220,000 | - | 450,887 | 311,200 | 2,646 | ||||||||||||||||||||||||||||||
| Stillwater 7 |
Sibanye | USA | 100% | 18% | $570 | 237,880 | - | 129,086 | 78,042 | 4,574 | ||||||||||||||||||||||||||||||
| Blackwater |
Artemis Gold | CAN | 8% 8 | 35% | $606 | 340,000 | - | 75,149 | 26,249 | 27 | ||||||||||||||||||||||||||||||
| Platreef |
Ivanhoe | SA | 62.5% 9 | $100 | NP | 275,300 | - | - | - | 453 | ||||||||||||||||||||||||||||||
| Other |
||||||||||||||||||||||||||||||||||||||||
| Copper World |
Hudbay | USA | 100% | $450 | NP | - | 39,296 | - | - | - | ||||||||||||||||||||||||||||||
| Marmato |
Aris | CO | 10.5% 10 | 18% | $527 | 122,431 | 40,569 | 30,605 | 14,364 | 324 | ||||||||||||||||||||||||||||||
| Santo Domingo |
Capstone | CHL | 100% 11 | 18% | NP | (6,214) | 290,000 | 7,683 | 2,319 | - | ||||||||||||||||||||||||||||||
| Fenix |
Rio2 | CHL | 22% 12 | 18% | $925 | 150,000 | - | 4,657 | 1,295 | 1,183 | ||||||||||||||||||||||||||||||
| El Domo |
Silvercorp | ECU | 50% 13 | 18% | NP | 31,981 | 96,655 | 1,203 | 467 | - | ||||||||||||||||||||||||||||||
| Marathon |
Gen Mining | CAN | 100% 14 | 18% | NP | 21,857 | 98,522 | - | - | - | ||||||||||||||||||||||||||||||
| Goose |
B2Gold | CAN | 2.78% 15 | 18% | $1,212 | 83,750 | - | 10,609 | 2,821 | 70 | ||||||||||||||||||||||||||||||
| Cangrejos |
CMOC | ECU | 4.4% 16 | 18% | NP | 32,160 | 168,840 | - | - | - | ||||||||||||||||||||||||||||||
| Curraghinalt |
Dalradian | UK | 3.05% 17 | 18% | NP | 20,000 | 55,000 | - | - | - | ||||||||||||||||||||||||||||||
| Kudz Ze Kayah |
BMC | CAN | 7.375% 18 | 20% | NP | 14,760 | 5,400 | - | - | - | ||||||||||||||||||||||||||||||
| Koné |
Montage | CIV | 19.5% 19 | 20% | NP | 625,000 | - | - | - | - | ||||||||||||||||||||||||||||||
| Kurmuk |
Allied | ETH | 6.7% 20 | 15% | NP | 175,000 | - | - | - | - | ||||||||||||||||||||||||||||||
| Spring Valley |
Waterton Gold | USA | 8% 21 | 20% | NP | 100,000 | 570,000 | - | - | - | ||||||||||||||||||||||||||||||
| Hemlo |
Hemlo | CAN | 10.13% 22 | 20% | $1,425 | 300,000 | - | 25,455 | 6,761 | 412 | ||||||||||||||||||||||||||||||
| Jervois |
KGL | AUS | 75% 23 | 20% | NP | 5,946 | 96,250 | - | - | - | ||||||||||||||||||||||||||||||
| $ | 7,081,783 | $ | 1,460,532 | $ | 5,701,195 | 3,664,736 | 94,788 | |||||||||||||||||||||||||||||||||
| Silver |
||||||||||||||||||||||||||||||||||||||||
| Peñasquito |
Newmont | MEX | 25% | $4.62 | $5.09 | $ | 485,000 | $ | - | $ | 2,120,582 | 98,668 | 895 | |||||||||||||||||||||||||||
| Antamina |
Glencore /BHP | PER | 67.50% 24 | 20% | $26.53 | 5,200,000 | - | 1,171,862 | 56,718 | 1,412 | ||||||||||||||||||||||||||||||
| Constancia |
Hudbay | PER | 100% | $6.32 | $6.43 | 294,900 | - | 434,750 | 22,890 | 284 | ||||||||||||||||||||||||||||||
| Blackwater |
Artemis Gold | CAN | 50% 8 | 18% | $7.55 | 170,800 | - | 32,455 | 679 | 18 | ||||||||||||||||||||||||||||||
| Other |
||||||||||||||||||||||||||||||||||||||||
| Los Filos 25 |
Equinox | MEX | 100% | $4.81 | $0.00 | 4,463 | - | 45,849 | 2,383 | 43 | ||||||||||||||||||||||||||||||
| Zinkgruvan |
Boliden | SWE | 100% | $4.81 | $1.00 | 77,866 | - | 670,046 | 37,929 | 145 | ||||||||||||||||||||||||||||||
| Stratoni |
Eldorado | GRC | 100% | $11.54 | NP | 57,500 | - | 155,868 | 10,378 | - | ||||||||||||||||||||||||||||||
| Neves-Corvo 26 |
Boliden | PRT | 100% | $4.60 | $1.36 | 35,350 | - | 254,436 | 11,760 | 102 | ||||||||||||||||||||||||||||||
| Aljustrel 26 |
Almina | PRT | 100% 27 | 50% | $0.00 | 2,451 | - | 99,903 | 5,595 | 87 | ||||||||||||||||||||||||||||||
| El Alto |
Barrick | CHL / ARG | 25% | $3.90 | NP | 625,000 | - | 372,767 | 19,775 | - | ||||||||||||||||||||||||||||||
| Copper World |
Hudbay | USA | 100% | $3.90 | NP | - | 191,855 | - | - | - | ||||||||||||||||||||||||||||||
| Navidad |
PAAS | ARG | 12.5% | $4.00 | NP | 10,788 | 32,400 | - | - | - | ||||||||||||||||||||||||||||||
| Marmato |
Aris | CO | 100% 10 | 18% | $6.60 | 10,601 | 1,399 | 5,378 | 204 | 3 | ||||||||||||||||||||||||||||||
| Cozamin |
Capstone | MEX | 50% 28 | 10% | $21.62 | 150,000 | - | 98,760 | 3,390 | 130 | ||||||||||||||||||||||||||||||
| El Domo |
Silvercorp | ECU | 75% 13 | 18% | NP | 11,531 | 34,969 | - | - | - | ||||||||||||||||||||||||||||||
| Mineral Park |
Waterton | US | 100% | 18% | $12.29 | 115,000 | - | 2,242 | 36 | 17 | ||||||||||||||||||||||||||||||
| Kudz Ze Kayah |
BMC | CAN | 6.875% 18 | 20% | NP | 26,240 | 9,600 | - | - | - | ||||||||||||||||||||||||||||||
| Jervois |
KGL | AUS | 75% 23 | 20% | NP | 10,054 | 162,750 | - | - | - | ||||||||||||||||||||||||||||||
| $ | 7,287,544 | $ | 432,973 | $ | 5,464,898 | 270,405 | 3,136 | |||||||||||||||||||||||||||||||||
| Palladium |
||||||||||||||||||||||||||||||||||||||||
| Stillwater 7 |
Sibanye | USA | 4.5% 29 | 18% | $492 | $ | 262,120 | $ | - | $ | 177,878 | 129,389 | 5,179 | |||||||||||||||||||||||||||
| Platreef |
Ivanhoe | SA | 5.25% 9 | 30% | NP | 78,700 | - | - | - | 244 | ||||||||||||||||||||||||||||||
| $ | 340,820 | $ | - | $ | 177,878 | 129,389 | 5,423 | |||||||||||||||||||||||||||||||||
| Platinum |
||||||||||||||||||||||||||||||||||||||||
| Marathon |
Gen Mining | CAN | 22% 14 | 18% | NP | $ | 9,367 | $ | 42,224 | $ | - | - | - | |||||||||||||||||||||||||||
| Platreef |
Ivanhoe | SA | 5.25% 9 | 30% | NP | 57,500 | - | - | - | 257 | ||||||||||||||||||||||||||||||
| $ | 66,867 | $ | 42,224 | $ | - | - | 257 | |||||||||||||||||||||||||||||||||
| Cobalt |
||||||||||||||||||||||||||||||||||||||||
| Voisey’s Bay |
Vale | CAN | 42.4% 30 | 18% | $9.02 | $ | 390,000 | $ | - | $ | 103,477 | 6,614 | 1,683 | |||||||||||||||||||||||||||
| Total PMPAs Currently Owned |
|
$ | 15,167,014 | $ | 1,935,729 | $ | 11,447,448 | |||||||||||||||||||||||||||||||||
| Terminated / Matured PMPAs |
|
1,358,502 | - | 3,376,971 | ||||||||||||||||||||||||||||||||||||
| Total |
$ | 16,525,516 | $ | 1,935,729 | $ | 14,824,419 | ||||||||||||||||||||||||||||||||||
WHEATON PRECIOUS METALS 2026 SECOND QUARTER REPORT - MANAGEMENT DISCUSSION & ANALYSIS [8]
| 1) | Abbreviations as follows: FM = First Majestic Silver Corp; BMC = BMC Minerals; PAAS = Pan American Silver Corp; Gen Mining = Generation Mining Ltd.; Waterton = Waterton Copper LP; Waterton Gold = Waterton Gold LP; BHP = BHP Group Limited; KGL = KGL Resources Limited; ARG = Argentina; AUS = Australia; BRA = Brazil; CAN = Canada; CHL = Chile; CIV = Côte d’Ivoire; CO = Colombia; ECU = Ecuador; ETH = Ethiopia; GRC = Greece; MEX = Mexico; PER = Peru; PRT = Portugal; SA = South Africa; SWE = Sweden; USA = United States; UK = United Kingdom; NP = Not Producing; and LOM = Life of Mine. |
| 2) | The term of the PMPAs is generally life of mine, subject to certain exceptions. A comprehensive summary of the respective agreement terms, including the original agreement dates, production payment increases and attributable production dropdowns is provided in the section entitled “Contractual Obligations and Commitments – Mineral Stream Interests” beginning on page 34 of this MD&A. |
| 3) | All figures in thousands except gold, palladium and platinum ounces and per ounce amounts. The total upfront consideration paid to date excludes closing costs and capitalized interest, where applicable. Please refer to the section entitled “Other Contractual Obligations and Commitments” on page 36 of this MD&A for details of when the remaining upfront consideration is forecasted to be paid. Certain contracts, including Santo Domingo and El Domo, contain delay ounce provisions whereby should construction of the mine not be completed by an agreed to date, the mine operator must compensate the Company for the delay until certain conditions are satisfied by delivering additional ounces. The value of these ounces on the date first due, net of amounts owed to the mine operator, is treated as a reduction to the upfront consideration paid. Sale of the resulting ounces received is treated as revenue, with the associated cost of sales being equal to the fair value of the ounces on the date received. |
| 4) | Payable gold, silver, palladium, platinum and cobalt PBND are based on management estimates. These figures may be updated in the future as additional information is received. Please see “Cautionary Note Regarding Forward-Looking Statements” for material risks, assumptions and important disclosures associated with this information. |
| 5) | Comprised of the operating Coleman, Copper Cliff, Garson, Creighton, Stobie and Totten gold interests as well as the non-operating Victor gold interest. As of June 30, 2026, the Company has received approximately $411 million of operating cash flows from the Sudbury stream. Should the market value of gold delivered to Wheaton through the 20-year term of the contract, net of the per ounce cash payment, be lower than the initial $670 million refundable deposit, the Company will be entitled to a refund of the difference at the conclusion of the term. The term of the Sudbury PMPA ends on May 11, 2033. |
| 6) | The original San Dimas SPA, entered into on October 15, 2004, was terminated on May 10, 2018 and concurrently the Company entered into the new San Dimas PMPA. Under the terms of the San Dimas PMPA, the Company is entitled to an amount equal to 25% of the payable gold production plus an additional amount of gold equal to 25% of the payable silver production converted to gold at a fixed gold to silver exchange ratio of 70:1 from the San Dimas mine. If the average gold to silver price ratio decreases to less than 50:1 or increases to more than 90:1 for a period of 6 months or more, then the “70” shall be revised to “50” or “90”, as the case may be, until such time as the average gold to silver price ratio is between 50:1 to 90:1 for a period of 6 months or more in which event the “70” shall be reinstated. During the period of April 30, 2025 to October 28, 2025, the fixed gold to silver exchange ratio was revised from 70:1 to 90:1. The current gold to silver exchange ratio is 70:1. |
| 7) | Comprised of the Stillwater and East Boulder gold and palladium interests. |
| 8) | Once the Company has received 464,000 ounces of gold under the amended Blackwater Gold PMPA, the attributable gold production will be reduced to 4%. Once the Company has received 17.8 million ounces of silver under the Blackwater Silver PMPA, the attributable silver production will be reduced to 33%. |
| 9) | Once the Company has received 218,750 ounces of gold under the Platreef Gold PMPA, the attributable gold production will reduce to 50% until 428,300 ounces have been delivered, after which the stream drops to 3.125%. Under the Platreef Palladium and Platinum PMPA, once the Company has received 350,000 ounces of combined palladium and platinum, the attributable palladium and platinum production will reduce to 3% until 485,115 ounces have been delivered, after which the stream drops to 0.1% of the payable palladium and platinum production. If certain thresholds are met, including if production through the Platreef project concentrator achieves 5.5 million tonnes per annum (“Mtpa”), the 3.125% residual gold stream and the 0.1% residual palladium and platinum stream will terminate. Under the Platreef Gold PMPA, a subsidiary of Royal Gold Inc. (formerly Sandstorm Gold Ltd./Nomad Royalty Ltd.) (“Royal Gold”) is entitled to purchase 37.5% of payable gold. The decrease in the percentage of payable metal that Wheaton will be entitled to purchase is conditional on delivery of the total amount of payable gold to all purchasers (Wheaton and Royal Gold combined). The values set out herein pertain only to Wheaton’s share of the payable gold. |
| 10) | Once the Company has received 310,000 ounces of gold and 2.15 million ounces of silver under the Marmato PMPA, the attributable gold and silver production will be reduced to 5.25% and 50%, respectively. |
| 11) | Once the Company has received 285,000 ounces of gold under the Santo Domingo PMPA, the Company’s attributable gold production will be reduced to 67%. The units sold under Santo Domingo relate to ounces received due to the delay ounce provision (see footnote 3, above). |
| 12) | On October 21, 2024, the Company amended the Fenix PMPA. Under the original agreement, the Company was to acquire an amount of gold equal to 6% of the gold production until 90,000 ounces have been delivered, 4% of the gold production until the delivery of a further 140,000 ounces and 3.5% gold production thereafter for the life of mine. Under the revised agreement, the Company is entitled to purchase an additional 16% of payable gold production (22% in total) (subject to adjustment if there are delays in deliveries relative to an agreed schedule). Once Rio2 delivers the incremental 95,000 ounces (as adjusted), the stream reverts to the percentages and thresholds under the original Fenix PMPA (as described). Rio2 has a one-time option to terminate the requirement to deliver the incremental gold production from the end of 2027 until the end of 2029 by delivering 95,000 ounces (as adjusted) less previously delivered gold ounces, excluding those gold ounces which would have been delivered under the original Fenix PMPA. |
| 13) | Once the Company has received 145,000 ounces of gold under the El Domo PMPA, the attributable gold production will be reduced to 33%, and once the Company has received 4.6 million ounces of silver, the attributable silver production will be reduced to 50%. The units sold under El Domo relate to ounces received due to the delay ounce provision (see footnote 3, above). |
| 14) | Once the Company has received 150,000 ounces of gold and 120,000 ounces of platinum under the Marathon PMPA, the attributable gold and platinum production will be reduced to 67% and 15%. |
| 15) | Once the Company has received 87,100 ounces of gold under the Goose PMPA, the Company’s attributable gold production will be 1.44%, and once the Company has received 134,000 ounces of gold under the agreement, the Company’s attributable gold production will be reduced to 1.0%. |
| 16) | Once the Company has received 469,000 ounces of gold under the Cangrejos PMPA, the Company’s attributable gold production will be reduced to 2.9%. |
| 17) | Once the Company has received 125,000 ounces of gold under the Curraghinalt PMPA, the Company’s attributable gold production will be reduced to 1.5%. |
| 18) | Once the Company has received 330,000 ounces of gold and 43.30 million ounces of silver under the Kudz Ze Kayah PMPA, the Company’s attributable gold and silver production will be reduced to 6.125%, with a further reduction to 5.5% until the Company has received an additional 59,800 ounces of gold and 7.96 million ounces of silver, with a further reduction to 5.5% until the Company has received an additional 270,200 ounces of gold and 35.34 million ounces of silver, thereafter increased to 6.75%. |
| 19) | Once the Company has received 400,000 ounces of gold under the Koné PMPA, subject to adjustment if there are delays in deliveries relative to an agreed schedule, the attributable gold production will reduce to 10.8% until an additional 130,000 ounces of gold has been delivered, after which the stream drops to 5.4%. |
| 20) | Once the Company has received 220,000 ounces of gold under the Kurmuk PMPA, the Company’s attributable gold production will be reduced to 4.8%. During any period in which debt exceeding $150 million ranks ahead of the gold stream, the stream percentage increases to 7.15% and decreases to 5.25% once the drop-down threshold is reached. |
| 21) | Once the Company has received 300,000 ounces of gold under the Spring Valley PMPA, the Company’s attributable gold production will be reduced to 6%. |
| 22) | Once the Company has received 135,750 ounces of gold under the Hemlo PMPA (the “First Dropdown Threshold”), the Company’s attributable gold production will be reduced to 6.75% until an additional 117,998 ounces of gold has been delivered (the “Second Dropdown Threshold”), at which point the Company’s attributable gold production will be 4.50% for the life of the mine. Each of the First Dropdown Threshold and the Second Dropdown Threshold will be subject to adjustment if there are delays in deliveries relative to an agreed schedule, and commencing in 2033, if deliveries fall behind the agreed schedule by 10,000 ounces or more, the stream percentage will be increased by 5% until deliveries catch up with the agreed schedule. The payable gold will be reduced by half with respect to gold production from certain claims comprising the Interlake deposit. |
| 23) | Once the Company has received 45,000 ounces of gold under the Jervois PMPA (the “First Gold Dropdown Threshold”), the Company will purchase 37.5% of the payable gold until an additional 15,000 ounces has been received (the “Second Gold Dropdown Threshold”), at which point the Company will purchase 25% of the payable gold for the life of mine. Additionally, once the Company has received 4.3 million ounces (“Moz”) under the Jervois PMPA (the “First Silver Dropdown Threshold”), the Company will purchase 37.5% of the payable silver until an additional 1.7 Moz has been delivered (the “Second Silver Dropdown Threshold”), at which point the Company will purchase 25% of the payable silver for the life of mine. Each of the First Gold Dropdown Threshold and First Silver Dropdown Threshold will be subject to adjustment if there are delays in deliveries relative to an agreed schedule. |
| 24) | Comprised of 33.75% under the Glencore Antamina PMPA and 33.75% under the BHP Antamina PMPA, which is effective April 1, 2026. Under the Glencore Antamina PMPA, once Wheaton has received 140 million ounces of silver, the Company’s attributable silver production will be reduced to 22.5% while under the BHP Antamina PMPA, once the Company has received 100 million ounces of silver, the Company’s attributable silver production will be reduced to 22.5% of the payable silver for the life of mine. |
| 25) | The term of the Los Filos PMPA ends on October 15, 2029. |
| 26) | The term of the Neves-Corvo and Aljustrel PMPAs ends on June 5, 2057. |
| 27) | Wheaton only has the rights to silver contained in concentrate containing less than 15% copper at the Aljustrel mine. |
| 28) | Once Wheaton has received 10 million ounces of silver under the Cozamin PMPA, the Company’s attributable silver production will be reduced to 33%. |
| 29) | Once the Company has received 375,000 ounces of palladium under the Stillwater PMPA, the Company’s attributable palladium production will be reduced to 2.25%, and once the Company has received 550,000 ounces of palladium under the agreement, the Company’s attributable palladium production will be reduced to 1%. |
| 30) | Once the Company has received 31 million pounds of cobalt under the Voisey’s Bay PMPA, the Company’s attributable cobalt production will be reduced to 21.2%. |
WHEATON PRECIOUS METALS 2026 SECOND QUARTER REPORT - MANAGEMENT DISCUSSION & ANALYSIS [9]
Significant amendments and acquisitions (if any) of mineral stream interests during Q2 2026 are outlined below. The percentage of payable production and other key PMPA terms for all mineral stream interests are described in the Contractual Obligations and Commitments section of this MD&A starting on page 34 of the MD&A.
Acquisition of Mineral Stream Interests
Antamina
On February 16, 2026, the Company entered into a PMPA with BHP (the “BHP Antamina PMPA”) for their 33.75% portion of the silver produced at the Antamina mine located in Peru. Effective April 1, 2026, Wheaton will receive a combined 67.5% of all the silver produced from Antamina, up from the 33.75% being delivered under the pre-existing Glencore silver stream. Under the terms of the BHP Antamina PMPA, the Company paid BHP total upfront cash consideration of $4.3 billion on April 1, 2026, being the date of closing.
Jervois
On April 1, 2026, the Company entered into a PMPA with KGL (the “Jervois PMPA”) for a portion of the gold and silver produced at the Jervois project located in Australia. In return, the Company also obtained a right of first refusal on any future precious metal streams, royalties, prepays or similar transactions with respect to the Jervois project. Under the terms of the Jervois PMPA, the Company will pay KGL total upfront cash consideration of $275 million, subject to certain customary conditions. The upfront cash consideration will be paid in a total of six installments, with the first installment of $16 million being made as an early deposit payment on June 16, 2026. The second installment of $16 million is also expected to be made as an early deposit payment, once certain conditions are satisfied, and is expected to be paid in Q3 2026. The remaining balance of $243 million will be paid in four equal installments over the construction period as various conditions are satisfied.
Updates on the Operating Mineral Stream Interests
Constancia
On July 2, 2026, Hudbay announced that it had received approval from the National Environmental Certification Service for Sustainable Investments in Perú (“SENACE”) to amend its environmental permit and further increase annual mill processing capacity at Constancia. The amended permit increases the processing capacity of the Constancia mill to 34 million tonnes of ore per annum from the previously permitted 31 million tonnes per annum. Hudbay states that the environmental permit amendment also approves further optimization of the mine plan, extends the operational life of Constancia, and incorporates the implementation of additional infrastructure to improve tailings transport infrastructure and water management systems.
Los Filos
On June 25, 2026, Equinox Gold Corp. (“Equinox”), announced that it has signed 20-year land access agreements with all three communities, Carrizalillo, Mezcala and Xochipala, that host its Los Filos mine. With these agreements in place, Equinox has initiated activities to support the gradual restart of heap leach operations and to advance technical studies to evaluate potential expansion opportunities.
Blackwater
On August 4, 2026, Artemis Gold Inc. (“Artemis Gold”) provided an update on the Phase 1A expansion at Blackwater, which is anticipated to increase the plant’s nameplate capacity by 33%, from 6 to 8 million tonnes per annum (“Mtpa”). Artemis Gold reported that Phase 1A was 57% complete at the end of Q2 2026 and remains on schedule for commissioning in Q4 2026, with the expansion expected to contribute to production beginning in 2027. Further, Artemis Gold reported that the early works program for EP2 is nearing completion, with the first concrete pour for the ball mill foundations completed ahead of schedule. EP2 represents a significant addition to processing plant capacity above Phase 1A, and once complete, Phase 1A and EP2 are expected to expand throughput capacity to 250%, from the existing 6 Mtpa to 21 Mtpa by Q4 2028.
Hemlo
On July 20, 2026, Hemlo Mining Corp. (“Hemlo Mining”) announced that gold production in Q2 2026 was lower than Q1 2026, reflecting a strategic refinement to the mining sequence. During the quarter, portions of the operation transitioned from a top-down to a bottom-up mining approach to reduce waste handling and improve long-term mining efficiency, resulting in delayed access to certain higher-grade stopes. Hemlo Mining expects higher production in future quarters as newly developed mining areas progress into the production sequence.
Marmato
On July 29, 2026, Aris Mining (“Aris”) reported that underground access connecting the Bulk Mining Zone to the new plant area is complete, with SAG and ball mills on site, and mechanical installation underway. Construction of the 5,000 TPD CIP plant continues to advance toward first gold and is on schedule for Q4 2026. Aris plans to exit 2026 operating the new CIP plant at approximately 3,000 TPD, before ramping up through 2027 to approximately 4,000 TPD by mid-2027 and the full 5,000 TPD design capacity by the end of 2027, following commissioning of the paste backfill plant.
WHEATON PRECIOUS METALS 2026 SECOND QUARTER REPORT - MANAGEMENT DISCUSSION & ANALYSIS [10]
Updates on the Development Stage Mineral Stream Interests
Mineral Park
During Q2 2026, Waterton Copper substantially completed the commissioning stage of the mill restart. Production is expected to increase throughout the second half of the year as operations ramp up toward the mill’s 16.5 Mtpa nameplate capacity. Copper concentrate sales continued in the second quarter and molybdenum concentrate sales were initiated during this quarter. Monthly delivery of silver to Wheaton under the PMPA has occurred throughout 2026.
Platreef
On July 8, 2026, Ivanhoe announced that commercial production at the Platreef mine is now expected in Q4 2026. Ivanhoe states that construction of Shaft #3 was completed on schedule in late March and commissioning was finalized in June. Shaft #3 increases Platreef’s hoisting capacity fivefold and enables concurrent hoisting of stoping ore and development waste. Shaft #3 is now also hoisting development waste, as the underground infrastructure is constructed in preparation for the Phase 2 expansion, which is expected to be completed by the end of 2027. In addition, stoping of higher-grade ore within the Flatreef orebody commenced at the end of the second quarter, with mining rates expected to ramp up throughout H2 2026.
Fenix
On May 15, 2026, Rio2 reported that planned tonnes and grade at its Fenix mine were not achieved during Q1 2026, though the key drivers were identified early and corrective actions have been implemented or are underway. Rio2 further states that based on current ramp-up progress, they anticipate achieving commercial production in Q4 2026.
Kurmuk
On July 29, 2026, Allied announced that the previously announced arrangement agreement with Zijin Gold International Company Limited (“Zijin Gold”), where Zijin Gold was to acquire all of the issued and outstanding shares of Allied, has been terminated. Allied states further that Zijin Gold has agreed to make a strategic investment in Allied of approximately $295 million, at a subscription price representing a premium to the current market price of Allied’s common shares on the TSX.
Allied also reported that development of the Kurmuk project continued to advance during the second quarter, with the start of operations expected in August and first gold pour following a few weeks thereafter. Allied states that key execution milestones continue to be met, and the project remains on budget and on schedule while advancing commissioning activities.
Koné
On June 15, 2026, Montage reported that construction of the Koné project remains on-budget and ahead of schedule with first gold pour targeted in late Q4 2026 through the oxide circuit, while the hard-rock comminution circuit remains on track for completion in Q2 2027. Montage also reported that it has significantly exceeded its target of delineating more than 1Moz of M&I Resources at a grade at least 50% higher than that of the Koné deposit and is continuing to aggressively advance exploration through the ongoing 90,000 meter drill program, with further resource updates expected throughout the year.
El Domo
On July 15, 2026, Silvercorp Metals Inc. (“Silvercorp”) reported that construction advanced steadily despite rainfall challenges in the period. Advancements were achieved on infrastructure, including the non-contact water channel, processing plant foundations, and the initial tailings storage facility dam. In addition, open-pit pre-stripping activities commenced and major equipment for the processing plant and water treatment facility have been procured and shipped. Silvercorp noted that it remains focused on achieving first commissioning of the operation by July 2027, in line with the project schedule.
Copper World
On July 29, 2026, Hudbay reported that the Copper World definitive feasibility study (“DFS”) is progressing well, with 95% of the engineering work completed, and a sanctioning decision remains on track for later in 2026. Hudbay reports the DFS is expected to include scope for future mill expansion optionality.
Santo Domingo
On July 30, 2026, Capstone Copper Corp. (“Capstone”) reported that detailed engineering advanced during the second quarter, alongside continued evaluation of opportunities to optimize district infrastructure. Capstone expects to make a final investment decision on the Santo Domingo project in Q4 2026.
Kudz Ze Kayah
On July 29, 2026, BMC announced that during the quarter it received receipt of a positive decision document issued by the Government of Yukon, Natural Resources Canada and the Department of Fisheries and Oceans Canada, after the Yukon Environmental and Socio-economic Assessment Board had recommended approval of the project in 2020.
WHEATON PRECIOUS METALS 2026 SECOND QUARTER REPORT - MANAGEMENT DISCUSSION & ANALYSIS [11]
BMC reports it will now progress mining permit and license applications with the aim to make a final investment decision in late 2027, subject to receipt of permits.
Early Deposit Mineral Stream Interests
Early deposit mineral stream interests represent agreements relative to early-stage development projects whereby Wheaton can choose not to proceed with the agreement once certain documentation has been received including, but not limited to, feasibility studies, environmental studies and impact assessment studies. Once Wheaton has elected to proceed with the agreement, the carrying value of the stream will be transferred to Mineral Stream Interests.
The following table summarizes the early deposit mineral stream interests currently owned by the Company:
| Attributable Production to be Purchased |
||||||||||||||||||||||||||||||||||||
| Early Deposit Mineral Stream Interests |
Mine Owner |
Location of Mine |
Upfront Consideration Paid to Date 1 |
Upfront Consideration to be Paid 1, 2 |
Total Upfront Consideration¹ |
Gold | Silver | Term of Agreement |
Date of Original Contract |
|||||||||||||||||||||||||||
| Toroparu |
Aris Mining | Guyana | $ | 15,500 | $ | 138,000 | $ | 153,500 | 10% | 50% | Life of Mine | 11-Nov-13 | ||||||||||||||||||||||||
| Cotabambas |
Panoro | Peru | 14,000 | 126,000 | 140,000 | 25% | ³ | 100% | ³ | Life of Mine | 21-Mar-16 | |||||||||||||||||||||||||
| Kutcho |
Kutcho | Canada | 16,852 | 58,000 | 74,852 | 100% | 100% | Life of Mine | 14-Dec-17 | |||||||||||||||||||||||||||
| $ | 46,352 | $ | 322,000 | $ | 368,352 | |||||||||||||||||||||||||||||||
| 1) | Expressed in thousands; excludes closing costs and capitalized interest, where applicable. |
| 2) | Please refer to the section entitled “Other Contractual Obligations and Commitments” on page 36 of this MD&A for details of when the remaining upfront consideration is forecast to be paid. |
| 3) | Once 90 million silver equivalent ounces attributable to Wheaton have been produced, the attributable production will decrease to 16.67% of gold production and 66.67% of silver production for the life of mine. |
Toroparu
On July 29, 2026, Aris reported that the Prefeasibility Study (“PFS”) remains on schedule for completion in H2 2026, supporting a construction decision targeted for early 2027. Project optimization work in support of the PFS includes updated mine scheduling, engineering studies and other activities to advance to construction readiness.
Mineral Royalty Interests
The following table summarizes the mineral royalty interests owned by the Company as at June 30, 2026:
| Royalty Interests | Mine Owner |
Location of Mine |
Royalty 1 | Upfront Consideration Paid to Date 2 |
Upfront Consideration to be Paid 2 |
Total Upfront Consideration 2 |
Term of Agreement |
Date of Original | ||||||||||||||
| Metates |
Chesapeake | Mexico | 0.5% NSR | $ | 3,000 | $ | - | $ | 3,000 | Life of Mine | 07-Aug-2014 | |||||||||||
| Brewery Creek 3 |
Victoria Gold | Canada | 2.0% NSR | 3,529 | - | 3,529 | Life of Mine | 04-Jan-2021 | ||||||||||||||
| Black Pine 4 |
Liberty Gold | USA | 0.5% NSR | 3,600 | - | 3,600 | Life of Mine | 10-Sep-2023 | ||||||||||||||
| Mt Todd 5 |
Vista | Australia | 1.0% GR | 20,000 | - | 20,000 | Life of Mine | 13-Dec-2023 | ||||||||||||||
| DeLamar 6 |
Integra | USA | 1.5% NSR | 9,750 | - | 9,750 | Life of Mine | 20-Feb-2024 | ||||||||||||||
| Spanish Mountain |
Spanish Mountain | Canada | 1.5% NSR | 22,500 | 32,500 | 55,000 | Life of Mine | 20-Apr-2026 | ||||||||||||||
| Cipango 7 |
Cipango | Japan | 1.5% NSR | 4,500 | 3,000 | 7,500 | Life of Mine | 04-Jun-2026 | ||||||||||||||
| $ | 66,879 | $ | 35,500 | $ | 102,379 | |||||||||||||||||
| 1) | Abbreviation as follows: NSR = Net Smelter Return Royalty; and GR = Gross Royalty. |
| 2) | Expressed in thousands; excludes closing costs. |
| 3) | The Company paid $3 million for an existing 2.0% net smelter return royalty interests on the first 600,000 ounces of gold mined and a 2.75% net smelter returns royalty interest thereafter. The Brewery Creek Royalty agreement provides, among other things, that Golden Predator Mining Corp., (subsidiary of Victoria Gold) may reduce the 2.75% net smelter royalty interest to 2.125% on payment of the sum of Cdn$2 million to the Company. On August 14, 2024, the Ontario Superior Court of Justice placed Victoria Gold Corp. into receivership following the failure of the heap leach pad at its Eagle Mine in June 2024. |
| 4) | Liberty Gold has been granted an option to repurchase 50% of the NSR for $4 million at any point in time up to the earlier of commercial production at Black Pine or January 1, 2030. |
| 5) | The Mt Todd royalty is at a rate of 1% of gross revenue with such rate being subject to increase to a maximum rate of 2%, depending on the timing associated with the achievement of certain operational milestones. |
| 6) | Under the DeLamar royalty, if completion is not achieved by January 1, 2029, the DeLamar royalty will increase annually by 0.15% of net smelter returns to a maximum of 2.7% of net smelter returns. |
| 7) | Comprised of the Hoshino, Onuki, Hasami, Bosawa, Miyata, Kato and Tashiro properties. |
Spanish Mountain
On April 20, 2026, the Company entered into a Royalty agreement with Spanish Mountain Gold (the “Spanish Mountain Royalty”) for a 1.5% net smelter returns royalty on gold and silver production from the Spanish Mountain Gold project. In return, the Company also obtained a right of first refusal on any future precious metal streams, royalties, prepays or similar transactions with respect to the Spanish Mountain Gold Project. Under the terms of the Spanish Mountain Royalty, the Company will pay Spanish Mountain Gold total upfront cash consideration of $55 million, subject to certain customary conditions. The upfront cash consideration will be paid in three installments consisting of a $22.5 million payment made on May 1, 2026, a $12.5 million payment due after 60,000 meters of
WHEATON PRECIOUS METALS 2026 SECOND QUARTER REPORT - MANAGEMENT DISCUSSION & ANALYSIS [12]
drilling, and a $20 million payment due upon receiving approval under the Environmental Assessment Act (British Columbia) for the construction and operation of the project.
Cipango
On June 4, 2026, the Company entered into a Royalty agreement with Cipango (“Cipango Royalty”) for a 1.5% net smelter returns royalty covering seven mineral exploration properties located in Japan for total upfront cash consideration of $7.5 million, subject to certain customary conditions. The Company also obtained a right of first refusal on any future precious metal streams, royalties, prepays or similar transactions with respect to such properties and an additional nine properties located in Japan.
Long-Term Equity Investments
The Company will, from time to time, invest in securities of companies for strategic purposes including, but not limited to, exploration and mining companies. The Company held the following investments as at June 30, 2026 and December 31, 2025:
| (in thousands) | June 30 2026 |
December 31 2025 |
||||||||
| Common shares held |
$ | 144,789 | $ | 407,230 | ||||||
| Warrants held |
2,830 | 3,265 | ||||||||
| Total long-term equity investments |
$ | 147,619 | $ | 410,495 | ||||||
The Company’s long-term investments in common shares (“LTIs”) are held for long-term strategic purposes and not for trading purposes. As such, the Company has elected to reflect any fair value adjustments, net of tax, as a component of other comprehensive income (“OCI”). The cumulative gain or loss will not be reclassified to net earnings on disposal of these LTIs but is reclassified to retained earnings.
While long-term investments in warrants are also held for long-term strategic purposes, they meet the definition of a derivative and therefore are classified as financial assets with fair value adjustments being recorded as a component of net earnings under the classification Other Income (Expense). Warrants that do not have a quoted market price are valued using a Black-Scholes option pricing model.
By holding these long-term investments, the Company is inherently exposed to various risk factors including currency risk, market price risk and liquidity risk.
A summary of the fair value of these equity investments and the fair value changes recognized as a component of the Company’s OCI during the three months ended June 30, 2026 and 2025 is presented below. Please see the Liquidity and Capital Resources on page 30 of this MD&A for more information.
WHEATON PRECIOUS METALS 2026 SECOND QUARTER REPORT - MANAGEMENT DISCUSSION & ANALYSIS [13]
Common Shares Held
| Three Months Ended June 30, 2026 | ||||||||||||||||||||||||
| (in thousands) | Fair Value at Mar 31, 2026 |
Additions | Disposals | Fair Value Adjustment Losses 1 |
Fair Value at Jun 30, 2026 |
Realized Gain (Loss) on Disposal |
||||||||||||||||||
|
|
||||||||||||||||||||||||
| Held at end of period |
||||||||||||||||||||||||
| Streaming or royalty partners |
$ | 114,737 | $ | - | $ | - | $ | (11,511 | ) | $ | 103,226 | $ | - | |||||||||||
| Strategic investments |
47,142 | - | - | (5,579 | ) | 41,563 | - | |||||||||||||||||
|
|
||||||||||||||||||||||||
| Total |
$ | 161,879 | $ | - | $ | - | $ | (17,090 | ) | $ | 144,789 | $ | - | |||||||||||
|
|
||||||||||||||||||||||||
| 1) | Fair Value Gains (Losses) are reflected as a component of OCI. |
| Three Months Ended June 30, 2025 | ||||||||||||||||||||||||
| (in thousands) | Fair Value at Mar 31, 2025 |
Additions | Disposals | Fair Value Adjustment Gains 1 |
Fair Value at Jun 30, 2025 |
Realized Gain on Disposal |
||||||||||||||||||
|
|
||||||||||||||||||||||||
| Held at end of period |
||||||||||||||||||||||||
| Streaming or royalty partners |
$ | 121,799 | $ | - | $ | - | $ | 39,595 | $ | 161,394 | $ | - | ||||||||||||
| Strategic investments |
5,669 | - | - | 925 | 6,594 | - | ||||||||||||||||||
|
|
||||||||||||||||||||||||
| Total |
$ | 127,468 | $ | - | $ | - | $ | 40,520 | $ | 167,988 | $ | - | ||||||||||||
|
|
||||||||||||||||||||||||
| 1) | Fair Value Gains (Losses) are reflected as a component of OCI. |
| Six Months Ended June 30, 2026 | ||||||||||||||||||||||||
| (in thousands) | Fair Value at Dec 31, 2025 |
Additions | Disposals 2 | Fair Value (Losses) Gains 1 |
Fair Value at Jun 30, 2026 |
Realized Gain (Loss) on Disposal |
||||||||||||||||||
|
|
||||||||||||||||||||||||
| Held at end of period |
||||||||||||||||||||||||
| Streaming or royalty partners |
$ | 109,211 | $ | - | $ | - | $ | (5,985) | $ | 103,226 | $ | - | ||||||||||||
| Strategic investments |
17,294 | 14,608 | - | 9,661 | 41,563 | - | ||||||||||||||||||
| Derecognized during period |
||||||||||||||||||||||||
| Streaming or royalty partners |
273,417 | - | (313,106) | 39,689 | - | 204,846 | ||||||||||||||||||
| Strategic investments |
7,308 | - | (10,315) | 3,008 | - | (53,327) | ||||||||||||||||||
|
|
||||||||||||||||||||||||
| Total |
$ | 407,230 | $ | 14,608 | $ | (323,421) | $ | 46,373 | $ | 144,789 | $ | 151,519 | ||||||||||||
|
|
||||||||||||||||||||||||
| 1) | Fair Value Gains (Losses) are reflected as a component of OCI. |
| 2) | The disposals during the quarter were made to partially fund the BHP Antamina PMPA. |
| Six Months Ended June 30, 2025 | ||||||||||||||||||||||||
| (in thousands) | Fair Value at Dec 31, 2024 |
Additions | Disposals | Fair Value Adjustment Gains (Losses) 1 |
Fair Value at Jun 30, 2025 |
Realized (Loss) Gain on Disposal |
||||||||||||||||||
|
|
||||||||||||||||||||||||
| Held at end of period |
||||||||||||||||||||||||
| Streaming or royalty partners |
$ | 93,915 | $ | - | $ | - | $ | 67,479 | $ | 161,394 | $ | - | ||||||||||||
| Strategic investments |
4,275 | 3,117 | - | (798) | 6,594 | - | ||||||||||||||||||
|
|
||||||||||||||||||||||||
| Total |
$ | 98,190 | $ | 3,117 | $ | - | $ | 66,681 | $ | 167,988 | $ | - | ||||||||||||
|
|
||||||||||||||||||||||||
| 1) | Fair Value Gains (Losses) are reflected as a component of OCI. |
WHEATON PRECIOUS METALS 2026 SECOND QUARTER REPORT - MANAGEMENT DISCUSSION & ANALYSIS [14]
|
Q2 2026 |
Q1 2026 | Q4 2025 | Q3 2025 | Q2 2025 | Q1 2025 | Q4 2024 | Q3 2024 | |||||||||||||||||||||||||
| Gold ounces produced ² |
||||||||||||||||||||||||||||||||
| Salobo |
62,116 | 69,201 | 88,907 | 66,997 | 69,418 | 71,384 | 84,291 | 62,689 | ||||||||||||||||||||||||
| Sudbury 3 |
4,726 | 4,115 | 7,412 | 4,852 | 5,403 | 4,880 | 5,259 | 3,593 | ||||||||||||||||||||||||
| Constancia |
2,978 | 4,571 | 15,396 | 12,797 | 4,604 | 4,876 | 18,727 | 10,760 | ||||||||||||||||||||||||
| San Dimas 4 |
6,890 | 7,341 | 8,206 | 7,507 | 6,987 | 8,416 | 7,263 | 6,882 | ||||||||||||||||||||||||
| Stillwater 5 |
1,423 | 1,424 | 1,518 | 1,717 | 1,654 | 1,339 | 2,166 | 2,247 | ||||||||||||||||||||||||
| Blackwater |
5,925 | 4,954 | 5,479 | 4,879 | 4,050 | 1,017 | - | - | ||||||||||||||||||||||||
| Platreef |
491 | 76 | - | - | - | - | - | - | ||||||||||||||||||||||||
| Other |
||||||||||||||||||||||||||||||||
| Marmato |
979 | 816 | 705 | 807 | 748 | 757 | 622 | 648 | ||||||||||||||||||||||||
| Goose |
362 | 1,096 | 1,027 | 387 | 19 | - | - | - | ||||||||||||||||||||||||
| Hemlo |
2,561 | 3,007 | 1,630 | - | - | - | - | - | ||||||||||||||||||||||||
| Fenix |
1,983 | 507 | - | - | - | - | - | - | ||||||||||||||||||||||||
| Total Other |
5,885 | 5,426 | 3,362 | 1,194 | 767 | 757 | 622 | 648 | ||||||||||||||||||||||||
| Total gold ounces produced |
90,434 | 97,108 | 130,280 | 99,943 | 92,883 | 92,669 | 118,328 | 86,819 | ||||||||||||||||||||||||
| Silver ounces produced 2 |
||||||||||||||||||||||||||||||||
| Peñasquito |
1,807 | 2,559 | 1,821 | 2,087 | 2,103 | 1,754 | 2,465 | 1,785 | ||||||||||||||||||||||||
| Antamina |
2,319 | 1,553 | 1,600 | 1,672 | 1,482 | 1,047 | 1,071 | 931 | ||||||||||||||||||||||||
| Constancia |
565 | 531 | 731 | 577 | 552 | 555 | 970 | 648 | ||||||||||||||||||||||||
| Blackwater |
147 | 129 | 148 | 136 | 138 | 35 | - | - | ||||||||||||||||||||||||
| Other |
||||||||||||||||||||||||||||||||
| Los Filos 6 |
- | - | - | - | - | 68 | 29 | 26 | ||||||||||||||||||||||||
| Zinkgruvan |
438 | 532 | 513 | 688 | 684 | 585 | 637 | 537 | ||||||||||||||||||||||||
| Neves-Corvo |
461 | 483 | 549 | 431 | 449 | 459 | 494 | 425 | ||||||||||||||||||||||||
| Aljustrel 7 |
461 | 691 | 548 | 195 | - | - | - | - | ||||||||||||||||||||||||
| Cozamin |
161 | 165 | 170 | 169 | 174 | 174 | 192 | 185 | ||||||||||||||||||||||||
| Marmato |
10 | 8 | 8 | 10 | 8 | 8 | 7 | 7 | ||||||||||||||||||||||||
| Mineral Park |
31 | 19 | 8 | - | - | - | - | - | ||||||||||||||||||||||||
| Total Other |
1,562 | 1,898 | 1,796 | 1,493 | 1,315 | 1,294 | 1,359 | 1,180 | ||||||||||||||||||||||||
| Total silver ounces produced |
6,400 | 6,670 | 6,096 | 5,965 | 5,590 | 4,685 | 5,865 | 4,544 | ||||||||||||||||||||||||
| Palladium ounces produced ² |
||||||||||||||||||||||||||||||||
| Stillwater 5 |
2,513 | 2,561 | 2,519 | 2,650 | 2,435 | 2,661 | 2,797 | 4,034 | ||||||||||||||||||||||||
| Platreef |
275 | 30 | - | - | - | - | - | - | ||||||||||||||||||||||||
| Total palladium ounces produced |
2,788 | 2,591 | 2,519 | 2,650 | 2,435 | 2,661 | 2,797 | 4,034 | ||||||||||||||||||||||||
| Platinum ounces produced ² |
||||||||||||||||||||||||||||||||
| Platreef |
281 | 40 | - | - | - | - | - | - | ||||||||||||||||||||||||
| Cobalt pounds produced ² |
||||||||||||||||||||||||||||||||
| Voisey’s Bay |
796 | 657 | 670 | 604 | 647 | 540 | 393 | 397 | ||||||||||||||||||||||||
| GEOs produced 8 |
202,229 | 212,526 | 236,157 | 203,331 | 190,179 | 174,391 | 218,993 | 165,883 | ||||||||||||||||||||||||
| Average payable rate 2 |
||||||||||||||||||||||||||||||||
| Gold |
93.5% | 95.3% | 95.0% | 94.6% | 95.2% | 94.9% | 95.3% | 95.0% | ||||||||||||||||||||||||
| Silver |
86.9% | 87.7% | 87.4% | 87.7% | 87.7% | 86.3% | 84.6% | 83.9% | ||||||||||||||||||||||||
| Palladium |
97.7% | 98.2% | 96.9% | 96.7% | 97.4% | 96.4% | 97.5% | 98.4% | ||||||||||||||||||||||||
| Platinum |
80.0% | n.a. | n.a. | n.a. | n.a. | n.a. | n.a. | n.a. | ||||||||||||||||||||||||
| Cobalt |
93.3% | 93.3% | 93.3% | 93.3% | 93.3% | 93.3% | 93.3% | 93.3% | ||||||||||||||||||||||||
| GEOs 8 |
90.0% | 91.3% | 91.7% | 91.2% | 91.5% | 91.1% | 90.5% | 90.0% | ||||||||||||||||||||||||
| 1) | All figures in thousands except gold, palladium and platinum ounces produced. |
| 2) | Quantity produced represents the amount of gold, silver, palladium, platinum and cobalt contained in concentrate or doré prior to smelting or refining deductions. Production figures and payable rates are based on information provided by the operators of the mining operations to which the mineral stream interests relate or management estimates in those situations where other information is not available. Certain production figures and payable rates may be updated in future periods as additional information is received. |
| 3) | Comprised of the Coleman, Copper Cliff, Garson, Creighton, Stobie and Totten gold interests. |
| 4) | Under the terms of the San Dimas PMPA, the Company is entitled to an amount equal to 25% of the payable gold production plus an additional amount of gold equal to 25% of the payable silver production converted to gold at a fixed gold to silver exchange ratio of 70:1 from the San Dimas mine. If the average gold to silver price ratio decreases to less than 50:1 or increases to more than 90:1 for a period of 6 months or more, then the “70” shall be revised to “50” or “90”, as the case may be, until such time as the average gold to silver price ratio is between 50:1 to 90:1 for a period of 6 months or more in which event the “70” shall be reinstated. From April 30, 2025 to October 28, 2025, the fixed gold to silver exchange ratio was revised to 90:1. Effective October 29, 2025, the fixed gold to silver exchange ratio was returned to 70:1. For reference, attributable silver production from prior periods is as follows: Q2 2026 - 266,000 ounces; Q1 2026 - 294,000 ounces; Q4 2025 - 329,000 ounces; Q3 2025 - 364,000 ounces; Q2 2025 - 311,000 ounces; Q1 2025 - 340,000 ounces; Q4 2024 - 295,000 ounces; Q3 2024 - 262,000 ounces. |
| 5) | Comprised of the Stillwater and East Boulder gold and palladium interests. On September 12, 2024, Sibanye Stillwater (“Sibanye”) announced that as a result of low palladium prices it was placing the Stillwater West operations into care and maintenance, while using Stillwater East and East Boulder operations to improve efficiencies that could get Stillwater West back to production as prices permit. |
| 6) | On April 1, 2025, Equinox Gold Corp., (“Equinox”) reported it has indefinitely suspended operations at Los Filos following the expiry of its land access agreement with the community of Carrizalillo on March 31, 2025. |
| 7) | On September 12, 2023, it was announced that the production of the zinc and lead concentrates at the Aljustrel mine will be halted from September 24, 2023 until the third quarter of 2025. |
| 8) | GEOs, which are provided to assist the reader, are based on the following commodity price assumptions: $4,800 per ounce gold; $80.00 per ounce silver; $1,500 per ounce palladium; $2,000 per ounce platinum; and $25.00 per pound cobalt; consistent with those used in estimating the Company’s production guidance for 2026. |
WHEATON PRECIOUS METALS 2026 SECOND QUARTER REPORT - MANAGEMENT DISCUSSION & ANALYSIS [15]
| Q2 2026 | Q1 2026 | Q4 2025 | Q3 2025 | Q2 2025 | Q1 2025 | Q4 2024 | Q3 2024 | |||||||||||||||||||||||||
| Gold ounces sold |
||||||||||||||||||||||||||||||||
| Salobo |
70,106 | 58,675 | 83,697 | 55,768 | 76,331 | 83,809 | 55,170 | 58,101 | ||||||||||||||||||||||||
| Sudbury 2 |
4,471 | 4,412 | 3,715 | 4,729 | 2,849 | 5,632 | 4,048 | 2,495 | ||||||||||||||||||||||||
| Constancia |
2,990 | 10,886 | 17,029 | 2,708 | 6,827 | 9,788 | 17,873 | 5,186 | ||||||||||||||||||||||||
| San Dimas |
5,984 | 7,670 | 8,686 | 6,655 | 7,235 | 8,962 | 6,990 | 7,022 | ||||||||||||||||||||||||
| Stillwater 3 |
1,275 | 1,394 | 1,790 | 1,465 | 1,386 | 1,947 | 2,410 | 1,635 | ||||||||||||||||||||||||
| Blackwater |
6,246 | 4,914 | 5,225 | 6,463 | 3,291 | 110 | - | - | ||||||||||||||||||||||||
| Other |
||||||||||||||||||||||||||||||||
| Marmato |
864 | 718 | 809 | 749 | 742 | 737 | 650 | 550 | ||||||||||||||||||||||||
| Goose |
859 | 1,339 | 528 | 95 | - | - | - | - | ||||||||||||||||||||||||
| Hemlo |
2,283 | 4,478 | - | - | - | - | - | - | ||||||||||||||||||||||||
| Fenix |
1,021 | 274 | - | - | - | - | - | - | ||||||||||||||||||||||||
| Santo Domingo 4 |
- | 312 | 312 | 312 | 312 | 312 | 312 | 447 | ||||||||||||||||||||||||
| El Domo 4 |
- | - | - | - | - | - | 209 | 258 | ||||||||||||||||||||||||
| Total Other |
5,027 | 7,121 | 1,649 | 1,156 | 1,054 | 1,049 | 1,171 | 1,255 | ||||||||||||||||||||||||
| Total gold ounces sold |
96,099 | 95,072 | 121,791 | 78,944 | 98,973 | 111,297 | 87,662 | 75,694 | ||||||||||||||||||||||||
| Silver ounces sold |
||||||||||||||||||||||||||||||||
| Peñasquito |
2,723 | 1,444 | 1,878 | 1,609 | 2,112 | 1,976 | 1,852 | 1,667 | ||||||||||||||||||||||||
| Antamina |
2,063 | 1,504 | 1,893 | 1,552 | 1,073 | 884 | 858 | 989 | ||||||||||||||||||||||||
| Constancia |
453 | 674 | 613 | 275 | 625 | 730 | 797 | 366 | ||||||||||||||||||||||||
| Blackwater |
136 | 127 | 137 | 137 | 143 | - | - | - | ||||||||||||||||||||||||
| Other |
||||||||||||||||||||||||||||||||
| Los Filos |
2 | 7 | - | 3 | 8 | 57 | 29 | 26 | ||||||||||||||||||||||||
| Zinkgruvan |
451 | 347 | 358 | 708 | 520 | 446 | 452 | 488 | ||||||||||||||||||||||||
| Neves-Corvo |
203 | 271 | 245 | 212 | 224 | 218 | 154 | 185 | ||||||||||||||||||||||||
| Aljustrel |
312 | 505 | 382 | 122 | - | - | - | - | ||||||||||||||||||||||||
| Cozamin |
147 | 149 | 169 | 133 | 154 | 164 | 158 | 148 | ||||||||||||||||||||||||
| Marmato |
9 | 8 | 10 | 9 | 9 | 8 | 7 | 6 | ||||||||||||||||||||||||
| Mineral Park |
23 | 13 | - | - | - | - | - | - | ||||||||||||||||||||||||
| Total Other |
1,147 | 1,300 | 1,164 | 1,187 | 915 | 893 | 800 | 853 | ||||||||||||||||||||||||
| Total silver ounces sold |
6,522 | 5,049 | 5,685 | 4,760 | 4,868 | 4,483 | 4,307 | 3,875 | ||||||||||||||||||||||||
| Palladium ounces sold |
||||||||||||||||||||||||||||||||
| Stillwater 3 |
2,069 | 2,906 | 1,730 | 2,594 | 2,575 | 2,457 | 4,434 | 3,761 | ||||||||||||||||||||||||
| Cobalt pounds sold |
||||||||||||||||||||||||||||||||
| Voisey’s Bay |
705 | 309 | 485 | 529 | 353 | 265 | 485 | 88 | ||||||||||||||||||||||||
| GEOs sold 5 |
209,115 | 181,743 | 219,605 | 161,845 | 182,750 | 188,162 | 163,355 | 141,918 | ||||||||||||||||||||||||
| Cumulative payable units PBND 6 |
||||||||||||||||||||||||||||||||
| Gold ounces |
94,788 | 106,328 | 108,525 | 106,222 | 90,284 | 100,512 | 123,511 | 97,929 | ||||||||||||||||||||||||
| Silver ounces |
3,136 | 4,096 | 3,293 | 3,648 | 3,178 | 3,145 | 3,583 | 2,931 | ||||||||||||||||||||||||
| Palladium ounces |
5,423 | 4,803 | 5,169 | 4,424 | 4,414 | 4,596 | 4,439 | 6,186 | ||||||||||||||||||||||||
| Platinum ounces |
257 | 32 | - | - | - | - | - | - | ||||||||||||||||||||||||
| Cobalt pounds |
1,683 | 1,646 | 1,341 | 1,202 | 1,168 | 917 | 678 | 796 | ||||||||||||||||||||||||
| GEOs 5 |
157,617 | 184,673 | 172,008 | 174,661 | 150,713 | 159,136 | 188,144 | 152,858 | ||||||||||||||||||||||||
| 1) | All figures in thousands except gold and palladium ounces sold. |
| 2) | Comprised of the Coleman, Copper Cliff, Garson, Creighton, Stobie and Totten gold interests. |
| 3) | Comprised of the Stillwater and East Boulder gold and palladium interests. |
| 4) | The ounces sold under Santo Domingo and El Domo relate to ounces received due to the delay ounce provision as per the respective PMPA (see footnote 3 on page 9 of this MD&A for more information). |
| 5) | GEOs, which are provided to assist the reader, are based on the following commodity price assumptions: $4,800 per ounce gold; $80.00 per ounce silver; $1,500 per ounce palladium; $2,000 per ounce platinum; and $25.00 per pound cobalt; consistent with those used in estimating the Company’s production guidance for 2026. |
| 6) | Payable gold, silver, palladium and platinum ounces PBND and cobalt pounds PBND are based on management estimates. These figures may be updated in future periods as additional information is received. |
WHEATON PRECIOUS METALS 2026 SECOND QUARTER REPORT - MANAGEMENT DISCUSSION & ANALYSIS [16]
| Q2 2026 | Q1 2026 | Q4 2025 | Q3 2025 | Q2 2025 | Q1 2025 | Q4 2024 | Q3 2024 | |||||||||||||||||||||||||
| Gold ounces sold |
96,099 | 95,072 | 121,791 | 78,944 | 98,973 | 111,297 | 87,662 | 75,694 | ||||||||||||||||||||||||
| Realized price 2 |
$ | 4,452 | $ | 4,849 | $ | 4,215 | $ | 3,481 | $ | 3,318 | $ | 2,872 | $ | 2,677 | $ | 2,491 | ||||||||||||||||
| Gold sales |
$ | 427,785 | $ | 461,038 | $ | 513,374 | $ | 274,797 | $ | 328,354 | $ | 319,696 | $ | 234,690 | $ | 188,521 | ||||||||||||||||
| Silver ounces sold |
6,522 | 5,049 | 5,685 | 4,760 | 4,868 | 4,483 | 4,307 | 3,875 | ||||||||||||||||||||||||
| Realized price 2 |
$ | 73.41 | $ | 84.52 | $ | 59.32 | $ | 39.66 | $ | 34.05 | $ | 32.33 | $ | 31.28 | $ | 29.71 | ||||||||||||||||
| Silver sales |
$ | 478,758 | $ | 426,770 | $ | 337,197 | $ | 188,795 | $ | 165,739 | $ | 144,937 | $ | 134,733 | $ | 115,149 | ||||||||||||||||
| Palladium ounces sold |
2,069 | 2,906 | 1,730 | 2,594 | 2,575 | 2,457 | 4,434 | 3,761 | ||||||||||||||||||||||||
| Realized price 2 |
$ | 1,429 | $ | 1,689 | $ | 1,479 | $ | 1,173 | $ | 996 | $ | 965 | $ | 1,008 | $ | 969 | ||||||||||||||||
| Palladium sales |
$ | 2,957 | $ | 4,909 | $ | 2,558 | $ | 3,042 | $ | 2,564 | $ | 2,372 | $ | 4,468 | $ | 3,644 | ||||||||||||||||
| Cobalt pounds sold |
705 | 309 | 485 | 529 | 353 | 265 | 485 | 88 | ||||||||||||||||||||||||
| Realized price 2 |
$ | 27.93 | $ | 28.36 | $ | 23.89 | $ | 18.19 | $ | 18.60 | $ | 12.88 | $ | 13.66 | $ | 10.65 | ||||||||||||||||
| Cobalt sales |
$ | 19,701 | $ | 8,752 | $ | 11,585 | $ | 9,623 | $ | 6,561 | $ | 3,406 | $ | 6,625 | $ | 939 | ||||||||||||||||
| Total sales |
$ | 929,201 | $ | 901,469 | $ | 864,714 | $ | 476,257 | $ | 503,218 | $ | 470,411 | $ | 380,516 | $ | 308,253 | ||||||||||||||||
| Cash cost 2, 3 |
||||||||||||||||||||||||||||||||
| Gold / oz |
$ | 543 | $ | 556 | $ | 495 | $ | 515 | $ | 470 | $ | 445 | $ | 440 | $ | 440 | ||||||||||||||||
| Silver / oz |
$ | 9.57 | $ | 13.53 | $ | 8.95 | $ | 6.35 | $ | 5.33 | $ | 5.17 | $ | 5.16 | $ | 5.03 | ||||||||||||||||
| Palladium / oz |
$ | 264 | $ | 310 | $ | 244 | $ | 205 | $ | 175 | $ | 172 | $ | 184 | $ | 173 | ||||||||||||||||
| Cobalt / lb |
$ | 5.21 | $ | 5.23 | $ | 4.33 | $ | 3.44 | $ | 3.57 | $ | 2.46 | $ | 2.59 | $ | 2.15 | ||||||||||||||||
| Depletion 2 |
||||||||||||||||||||||||||||||||
| Gold / oz 4 |
$ | 503 | $ | 534 | $ | 452 | $ | 497 | $ | 433 | $ | 423 | $ | 420 | $ | 418 | ||||||||||||||||
| Silver / oz |
$ | 10.24 | $ | 4.63 | $ | 4.79 | $ | 4.57 | $ | 5.93 | $ | 6.03 | $ | 5.90 | $ | 5.89 | ||||||||||||||||
| Palladium / oz |
$ | 492 | $ | 492 | $ | 492 | $ | 492 | $ | 429 | $ | 429 | $ | 429 | $ | 429 | ||||||||||||||||
| Cobalt / lb |
$ | 9.02 | $ | 9.02 | $ | 9.02 | $ | 9.02 | $ | 9.18 | $ | 9.18 | $ | 12.78 | $ | 12.78 | ||||||||||||||||
| Gain on disposal of PMPA |
$ | - | $ | - | $ | - | $ | 85,724 | $ | - | $ | - | $ | - | $ | - | ||||||||||||||||
| Impairment |
$ | - | $ | - | $ | - | $ | - | $ | - | $ | - | $ | 108,861 | $ | - | ||||||||||||||||
| Net earnings |
$ | 543,236 | $ | 582,044 | $ | 558,250 | $ | 367,216 | $ | 292,270 | $ | 253,984 | $ | 88,148 | $ | 154,635 | ||||||||||||||||
| Per share |
||||||||||||||||||||||||||||||||
| Basic |
$ | 1.196 | $ | 1.282 | $ | 1.230 | $ | 0.809 | $ | 0.644 | $ | 0.560 | $ | 0.194 | $ | 0.341 | ||||||||||||||||
| Diluted |
$ | 1.194 | $ | 1.279 | $ | 1.227 | $ | 0.807 | $ | 0.643 | $ | 0.559 | $ | 0.194 | $ | 0.340 | ||||||||||||||||
| Adjusted net earnings 3 |
$ | 542,542 | $ | 582,772 | $ | 554,979 | $ | 281,054 | $ | 286,004 | $ | 250,825 | $ | 198,969 | $ | 152,803 | ||||||||||||||||
| Per share |
||||||||||||||||||||||||||||||||
| Basic |
$ | 1.195 | $ | 1.284 | $ | 1.222 | $ | 0.619 | $ | 0.630 | $ | 0.553 | $ | 0.439 | $ | 0.337 | ||||||||||||||||
| Diluted |
$ | 1.192 | $ | 1.281 | $ | 1.220 | $ | 0.618 | $ | 0.629 | $ | 0.552 | $ | 0.438 | $ | 0.336 | ||||||||||||||||
| Cash flow from operations |
$ | 649,518 | $ | 765,823 | $ | 746,277 | $ | 382,953 | $ | 414,959 | $ | 360,793 | $ | 319,471 | $ | 254,337 | ||||||||||||||||
| Per share 3 |
||||||||||||||||||||||||||||||||
| Basic |
$ | 1.430 | $ | 1.687 | $ | 1.644 | $ | 0.844 | $ | 0.914 | $ | 0.795 | $ | 0.704 | $ | 0.561 | ||||||||||||||||
| Diluted |
$ | 1.428 | $ | 1.683 | $ | 1.641 | $ | 0.842 | $ | 0.913 | $ | 0.794 | $ | 0.703 | $ | 0.560 | ||||||||||||||||
| Dividends declared |
$ | 88,556 | $ | 88,549 | $ | 74,913 | $ | 74,903 | $ | 74,899 | $ | 74,881 | $ | 70,318 | $ | 70,314 | ||||||||||||||||
| Per share |
$ | 0.195 | $ | 0.195 | $ | 0.165 | $ | 0.165 | $ | 0.165 | $ | 0.165 | $ | 0.155 | $ | 0.155 | ||||||||||||||||
| Total assets |
$ | 12,161,186 | $ | 9,846,195 | $ | 9,125,781 | $ | 8,419,518 | $ | 7,982,385 | $ | 7,739,297 | $ | 7,424,457 | $ | 7,386,179 | ||||||||||||||||
| Total liabilities |
$ | 2,470,741 | $ | 602,917 | $ | 435,273 | $ | 326,761 | $ | 256,679 | $ | 273,155 | $ | 165,078 | $ | 126,165 | ||||||||||||||||
| Total shareholders’ equity |
$ | 9,690,445 | $ | 9,243,278 | $ | 8,690,508 | $ | 8,092,757 | $ | 7,725,706 | $ | 7,466,142 | $ | 7,259,379 | $ | 7,260,014 | ||||||||||||||||
| 1) | All figures in thousands except gold and palladium ounces produced and sold, per unit amounts and per share amounts. |
| 2) | Expressed as dollars per ounce for gold, silver and palladium; and dollars per pound for cobalt. |
| 3) | Refer to discussion on non-GAAP measures beginning on page 40 of this MD&A. |
| 4) | Includes the non-cash per ounce cost of sale associated with delay ounces. Please see footnote 3 on page 9 of this MD&A for more information. |
Changes in sales, net earnings and cash flow from operations from quarter to quarter are affected primarily by fluctuations in production at the mines, the timing of shipments, changes in the price of commodities, the commencement of operations of mines under construction, as well as acquisitions of PMPAs and any related capital raising activities.
WHEATON PRECIOUS METALS 2026 SECOND QUARTER REPORT - MANAGEMENT DISCUSSION & ANALYSIS [17]
Revenue by Commodity
Revenue was $1.8 billion (48.6% gold, 49.5% silver, 0.4% palladium and 1.6% cobalt) during the six months ended June 30, 2026, with the $857 million increase from the comparable period of the previous year due primarily to a 78% increase in the average realized price per GEO sold; and a 5% increase in the number of GEOs sold.
The following two tables present (i) a summary of the key factors driving changes in revenue, specifically the number of GEOs sold and the average realized price per GEO for the periods H1 2024, H1 2025 and H1 2026; and (ii) the commodity mix for H1 2025 and H1 2026.
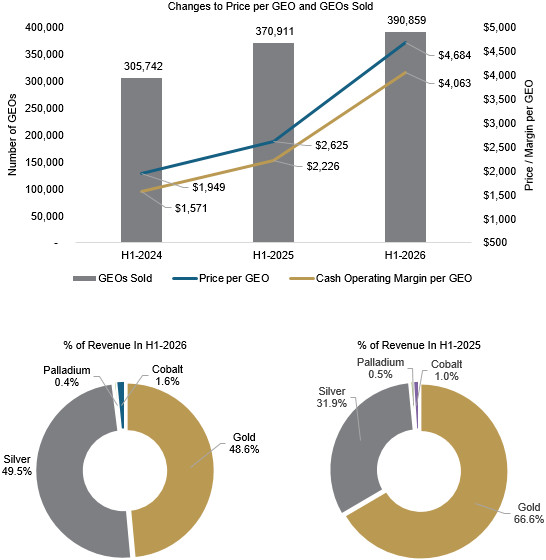
WHEATON PRECIOUS METALS 2026 SECOND QUARTER REPORT - MANAGEMENT DISCUSSION & ANALYSIS [18]
Cash Operating Margin 1
From 2024 to 2026, average cash costs¹ rose 64%, increasing from $378 per GEO in H1 2024 to $621 per GEO in H1 2026. Over the same period, cash operating margin¹ expanded by 159%, climbing from $1,571 per GEO to $4,063 per GEO.
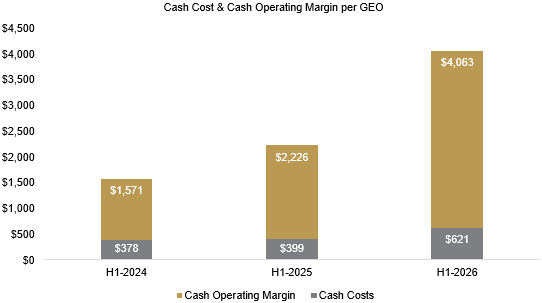
| 1 | Refer to discussion on non-GAAP measures beginning on page 43 of this MD&A |
WHEATON PRECIOUS METALS 2026 SECOND QUARTER REPORT - MANAGEMENT DISCUSSION & ANALYSIS [19]
Results of Operations and Operational Review
The operating results of the Company’s reportable operating segments are summarized in the tables and commentary below.
Results of Operations for the Three Months Ended June 30, 2026 and 2025
The following two tables present the results of operations based on the Company’s reportable operating segments.
| Three Months Ended June 30, 2026 | ||||||||||||||||||||||||||||||||||||
| Units Produced² |
Units Sold |
Average Realized Price ($’s Per Unit) |
Average Cash Cost ($’s Per Unit) 3 |
Average Depletion ($’s Per Unit) 4 |
Sales | Net Earnings |
Cash Flow From Operations |
Total Assets |
||||||||||||||||||||||||||||
| Gold |
||||||||||||||||||||||||||||||||||||
| Salobo |
62,116 | 70,106 | $ | 4,452 | $ | 433 | $ | 404 | $ | 312,112 | $ | 253,413 | $ | 278,505 | $ | 2,568,665 | ||||||||||||||||||||
| Sudbury 5 |
4,726 | 4,471 | 4,449 | 400 | 1,399 | 19,891 | 11,848 | 18,041 | 206,067 | |||||||||||||||||||||||||||
| Constancia |
2,978 | 2,990 | 4,452 | 429 | 338 | 13,313 | 11,018 | 12,030 | 47,588 | |||||||||||||||||||||||||||
| San Dimas |
6,890 | 5,984 | 4,452 | 648 | 428 | 26,642 | 20,202 | 22,764 | 119,371 | |||||||||||||||||||||||||||
| Stillwater |
1,423 | 1,275 | 4,452 | 833 | 570 | 5,676 | 3,887 | 4,614 | 202,680 | |||||||||||||||||||||||||||
| Blackwater |
5,925 | 6,246 | 4,448 | 1,489 | 606 | 27,785 | 14,697 | 20,862 | 324,284 | |||||||||||||||||||||||||||
| Platreef |
491 | - | n.a. | n.a. | n.a. | - | - | - | 275,702 | |||||||||||||||||||||||||||
| Other 6 |
5,885 | 5,027 | 4,450 | 902 | 1,133 | 22,366 | 12,141 | 17,835 | 1,662,005 | |||||||||||||||||||||||||||
| 90,434 | 96,099 | $ | 4,452 | $ | 543 | $ | 503 | $ | 427,785 | $ | 327,206 | $ | 374,651 | $ | 5,406,362 | |||||||||||||||||||||
| Silver |
||||||||||||||||||||||||||||||||||||
| Peñasquito |
1,807 | 2,723 | $ | 72.99 | $ | 4.62 | $ | 5.09 | $ | 198,793 | $ | 172,351 | $ | 186,211 | $ | 185,656 | ||||||||||||||||||||
| Antamina |
2,319 | 2,063 | 72.99 | 13.82 | 21.68 | 150,549 | 77,323 | 122,039 | 4,708,329 | |||||||||||||||||||||||||||
| Constancia |
565 | 453 | 72.99 | 6.32 | 6.43 | 33,055 | 27,283 | 30,193 | 144,161 | |||||||||||||||||||||||||||
| Blackwater |
147 | 136 | 67.77 | 12.46 | 7.55 | 9,189 | 6,476 | 7,539 | 165,522 | |||||||||||||||||||||||||||
| Other 7 |
1,562 | 1,147 | 75.97 | 14.62 | 3.70 | 87,172 | 66,158 | 64,443 | 562,150 | |||||||||||||||||||||||||||
| 6,400 | 6,522 | $ | 73.41 | $ | 9.57 | $ | 10.24 | $ | 478,758 | $ | 349,591 | $ | 410,425 | $ | 5,765,818 | |||||||||||||||||||||
| Palladium |
||||||||||||||||||||||||||||||||||||
| Stillwater |
2,513 | 2,069 | $ | 1,429 | $ | 264 | $ | 492 | $ | 2,957 | $ | 1,392 | $ | 2,410 | $ | 206,444 | ||||||||||||||||||||
| Platreef |
275 | - | n.a. | n.a. | n.a. | - | - | - | 78,814 | |||||||||||||||||||||||||||
| 2,788 | 2,069 | $ | 1,429 | $ | 264 | $ | 492 | $ | 2,957 | $ | 1,392 | $ | 2,410 | $ | 285,258 | |||||||||||||||||||||
| Platinum |
||||||||||||||||||||||||||||||||||||
| Marathon |
- | - | $ | n.a. | $ | n.a. | $ | n.a. | $ | - | $ | - | $ | - | $ | 9,451 | ||||||||||||||||||||
| Platreef |
281 | - | n.a. | n.a. | n.a. | - | - | - | 57,584 | |||||||||||||||||||||||||||
| 281 | - | $ | n.a. | $ | n.a. | $ | n.a. | $ | - | $ | - | $ | - | $ | 67,035 | |||||||||||||||||||||
| Cobalt |
||||||||||||||||||||||||||||||||||||
| Voisey’s Bay |
796 | 705 | $ | 27.93 | $ | 5.21 | $ | 9.02 | $ | 19,701 | $ | 9,667 | $ | 12,940 | $ | 206,733 | ||||||||||||||||||||
| Operating results |
$ | 929,201 | $ | 687,856 | $ | 800,426 | $ | 11,731,206 | ||||||||||||||||||||||||||||
| Other |
||||||||||||||||||||||||||||||||||||
| General and administrative |
|
$ | (11,327) | $ | (10,489) | |||||||||||||||||||||||||||||||
| Share based compensation |
|
(4,806) | - | |||||||||||||||||||||||||||||||||
| Donations and community investments |
|
(4,665) | (3,899) | |||||||||||||||||||||||||||||||||
| Finance costs |
|
(31,097) | (30,780) | |||||||||||||||||||||||||||||||||
| Other |
|
9,071 | 3,522 | |||||||||||||||||||||||||||||||||
| Income tax |
|
(101,796) | (109,262) | |||||||||||||||||||||||||||||||||
| Total other |
$ | (144,620) | $ | (150,908) | $ | 429,980 | ||||||||||||||||||||||||||||||
| $ | 543,236 | $ | 649,518 | $ | 12,161,186 | |||||||||||||||||||||||||||||||
| 1) | Units of gold, silver, palladium and platinum produced and sold are reported in ounces, while cobalt is reported in pounds. All figures in thousands except gold, palladium and platinum ounces produced and sold and per unit amounts. |
| 2) | Quantity produced represents the amount of gold, silver, palladium, platinum and cobalt contained in concentrate or doré prior to smelting or refining deductions. Production figures are based on information provided by the operators of the mining operations to which the mineral stream interests relate or management estimates in those situations where other information is not available. Certain production figures may be updated in future periods as additional information is received. |
| 3) | Refer to discussion on non-GAAP measure (iii) on page 42 of this MD&A. |
| 4) | Includes the non-cash per ounce cost of sale associated with delay ounces. Please see footnote 3 on page 9 of this MD&A for more information. |
| 5) | Comprised of the operating Coleman, Copper Cliff, Garson, Creighton, Stobie and Totten gold interests and the non-operating Victor gold interest. |
| 6) | Other gold interests comprised of the Copper World, Marmato, Santo Domingo, Fenix, El Domo, Marathon, Goose, Cangrejos, Curraghinalt, Kudz Ze Kayah, Koné, Kurmuk, Spring Valley, Hemlo and Jervois gold interests. |
| 7) | Other silver interests comprised of the Los Filos, Zinkgruvan, Stratoni, Neves-Corvo, Aljustrel, El Alto, Copper World, Navidad, Marmato, Cozamin, El Domo, Mineral Park, Kudz Ze Kayah and Jervois silver interests. |
WHEATON PRECIOUS METALS 2026 SECOND QUARTER REPORT - MANAGEMENT DISCUSSION & ANALYSIS [20]
| Three Months Ended June 30, 2025 | ||||||||||||||||||||||||||||||||||||
| Units Produced² |
Units Sold |
Average Realized Price ($’s Per Unit) |
Average Cash Cost ($’s Per Unit) 3 |
Average Depletion ($’s Per Unit) 4 |
Sales | Net Earnings |
Cash Flow From Operations |
Total Assets |
||||||||||||||||||||||||||||
| Gold |
||||||||||||||||||||||||||||||||||||
| Salobo |
69,418 | 76,331 | $ | 3,315 | $ | 429 | $ | 402 | $ | 252,997 | $ | 189,543 | $ | 220,263 | $ | 2,677,073 | ||||||||||||||||||||
| Sudbury 5 |
5,403 | 2,849 | 3,368 | 400 | 1,326 | 9,597 | 4,679 | 8,457 | 230,307 | |||||||||||||||||||||||||||
| Constancia |
4,604 | 6,827 | 3,315 | 425 | 323 | 22,629 | 17,527 | 19,730 | 58,963 | |||||||||||||||||||||||||||
| San Dimas |
6,987 | 7,235 | 3,315 | 640 | 290 | 23,982 | 17,253 | 19,350 | 131,787 | |||||||||||||||||||||||||||
| Stillwater |
1,654 | 1,386 | 3,315 | 590 | 421 | 4,594 | 3,193 | 3,776 | 206,058 | |||||||||||||||||||||||||||
| Blackwater |
4,050 | 3,291 | 3,368 | 1,172 | 617 | 11,084 | 5,196 | 7,227 | 338,133 | |||||||||||||||||||||||||||
| Platreef |
- | - | n.a. | n.a. | n.a. | - | - | - | 275,702 | |||||||||||||||||||||||||||
| Other 6 |
767 | 1,054 | 3,293 | 414 | 1,329 | 3,471 | 1,634 | 3,034 | 592,372 | |||||||||||||||||||||||||||
| 92,883 | 98,973 | $ | 3,318 | $ | 470 | $ | 433 | $ | 328,354 | $ | 239,025 | $ | 281,837 | $ | 4,510,395 | |||||||||||||||||||||
| Silver |
||||||||||||||||||||||||||||||||||||
| Peñasquito |
2,103 | 2,112 | $ | 33.83 | $ | 4.56 | $ | 4.86 | $ | 71,467 | $ | 51,574 | $ | 61,835 | $ | 224,608 | ||||||||||||||||||||
| Antamina |
1,482 | 1,073 | 33.83 | 6.85 | 8.46 | 36,303 | 19,871 | 28,948 | 474,215 | |||||||||||||||||||||||||||
| Constancia |
552 | 625 | 33.83 | 6.26 | 6.10 | 21,138 | 13,413 | 17,227 | 157,109 | |||||||||||||||||||||||||||
| Blackwater |
138 | 143 | 36.69 | 6.55 | 9.67 | 5,239 | 2,923 | 4,519 | 169,566 | |||||||||||||||||||||||||||
| Other 7 |
1,315 | 915 | 34.52 | 4.48 | 4.72 | 31,592 | 23,170 | 22,961 | 551,926 | |||||||||||||||||||||||||||
| 5,590 | 4,868 | $ | 34.05 | $ | 5.33 | $ | 5.93 | $ | 165,739 | $ | 110,951 | $ | 135,490 | $ | 1,577,424 | |||||||||||||||||||||
| Palladium |
||||||||||||||||||||||||||||||||||||
| Stillwater |
2,435 | 2,575 | $ | 996 | $ | 175 | $ | 429 | $ | 2,564 | $ | 1,009 | $ | 2,114 | $ | 211,019 | ||||||||||||||||||||
| Platreef |
- | - | n.a. | n.a. | n.a. | - | - | - | 78,814 | |||||||||||||||||||||||||||
| 2,435 | 2,575 | $ | 996 | $ | 175 | $ | 429 | $ | 2,564 | $ | 1,009 | $ | 2,114 | $ | 289,833 | |||||||||||||||||||||
| Platinum |
||||||||||||||||||||||||||||||||||||
| Marathon |
- | - | $ | n.a. | $ | n.a. | $ | n.a. | $ | - | $ | - | $ | - | $ | 9,451 | ||||||||||||||||||||
| Platreef |
- | - | n.a. | n.a. | n.a. | - | - | - | 57,584 | |||||||||||||||||||||||||||
| - | - | $ | n.a. | $ | n.a. | $ | n.a. | $ | - | $ | - | $ | - | $ | 67,035 | |||||||||||||||||||||
| Cobalt |
||||||||||||||||||||||||||||||||||||
| Voisey’s Bay |
647 | 353 | $ | 18.60 | $ | 3.57 | $ | 9.18 | $ | 6,561 | $ | 2,062 | $ | 2,907 | $ | 225,020 | ||||||||||||||||||||
| Operating results |
$ | 503,218 | $ | 353,047 | $ | 422,348 | $ | 6,669,707 | ||||||||||||||||||||||||||||
| Other |
||||||||||||||||||||||||||||||||||||
| General and administrative |
|
$ | (11,022) | $ | (10,498) | |||||||||||||||||||||||||||||||
| Share based compensation |
|
(9,962) | - | |||||||||||||||||||||||||||||||||
| Donations and community investments |
|
(2,368) | (2,096) | |||||||||||||||||||||||||||||||||
| Finance costs |
|
(1,427) | (2,025) | |||||||||||||||||||||||||||||||||
| Other |
|
9,736 | 8,179 | |||||||||||||||||||||||||||||||||
| Income tax |
|
(45,734) | (949) | |||||||||||||||||||||||||||||||||
| Total other |
$ | (60,777) | $ | (7,389) | $ | 1,312,678 | ||||||||||||||||||||||||||||||
| $ | 292,270 | $ | 414,959 | $ | 7,982,385 | |||||||||||||||||||||||||||||||
| 1) | Units of gold, silver and palladium produced and sold are reported in ounces, while cobalt is reported in pounds. All figures in thousands except gold and palladium ounces produced and sold and per unit amounts. |
| 2) | Quantity produced represents the amount of gold, silver, palladium and cobalt contained in concentrate or doré prior to smelting or refining deductions. Production figures are based on information provided by the operators of the mining operations to which the mineral stream interests relate or management estimates in those situations where other information is not available. Certain production figures may be updated in future periods as additional information is received. |
| 3) | Refer to discussion on non-GAAP measure (iii) on page 42 of this MD&A. |
| 4) | Includes the non-cash per ounce cost of sale associated with delay ounces. Please see footnote 3 on page 9 of this MD&A for more information. |
| 5) | Comprised of the operating Coleman, Copper Cliff, Garson, Creighton and Totten gold interests as well as the non-operating Stobie and Victor gold interests. |
| 6) | Other gold interests comprised of the Marmato, Copper World, Santo Domingo, Fenix, El Domo, Marathon, Goose, Cangrejos, Curraghinalt, Kudz Ze Kayah, Koné and Kurmuk gold interests. |
| 7) | Other silver interests comprised of the Los Filos, Zinkgruvan, Neves-Corvo, Marmato, Cozamin, Stratoni, Aljustrel, El Alto, Copper World, Navidad, El Domo, Mineral Park and Kudz Ze Kayah silver interests. |
WHEATON PRECIOUS METALS 2026 SECOND QUARTER REPORT - MANAGEMENT DISCUSSION & ANALYSIS [21]
Comparative Results of Operations on a GEO Basis
| Q2 2026 | Q2 2025 | Change | Change | |||||||||||||
| GEO Production 1, 2 |
202,229 | 190,179 | 12,050 | 6.3 % | ||||||||||||
| GEO Sales 2 |
209,115 | 182,750 | 26,366 | 14.4 % | ||||||||||||
| Average price per GEO sold 2 |
$ | 4,443 | $ | 2,754 | $ | 1,689 | 61.3 % | |||||||||
| Revenue |
$ | 929,201 | $ | 503,218 | $ | 425,983 | 84.7 % | |||||||||
| Cost of sales, excluding depletion |
$ | 118,843 | $ | 75,169 | $ | (43,674) | (58.1)% | |||||||||
| Depletion |
122,502 | 75,002 | (47,500) | (63.3)% | ||||||||||||
| Cost of sales |
$ | 241,345 | $ | 150,171 | $ | (91,174) | (60.7)% | |||||||||
| Gross margin |
$ | 687,856 | $ | 353,047 | $ | 334,809 | 94.8 % | |||||||||
| General and administrative |
11,327 | 11,022 | (305) | (2.8)% | ||||||||||||
| Share based compensation |
4,806 | 9,962 | 5,156 | 51.8 % | ||||||||||||
| Donations and community investments |
4,665 | 2,368 | (2,297) | (97.0)% | ||||||||||||
| Earnings from operations |
$ | 667,058 | $ | 329,695 | $ | 337,363 | 102.3 % | |||||||||
| Other income (expense) |
9,071 | 9,736 | (665) | (6.8)% | ||||||||||||
| Earnings before finance costs and income taxes |
$ | 676,129 | $ | 339,431 | $ | 336,698 | 99.2 % | |||||||||
| Finance costs |
31,097 | 1,427 | (29,670) | (2,079.2)% | ||||||||||||
| Earnings before income taxes |
$ | 645,032 | $ | 338,004 | $ | 307,028 | 90.8 % | |||||||||
| Income tax expense |
101,796 | 45,734 | (56,062) | (122.6)% | ||||||||||||
| Net earnings |
$ | 543,236 | $ | 292,270 | $ | 250,966 | 85.9 % | |||||||||
| 1) | Quantity produced represents the amount of gold, silver, palladium, platinum and cobalt contained in concentrate or doré prior to smelting or refining deductions. Production figures are based on information provided by the operators of the mining operations to which the mineral stream interests relate or management estimates in those situations where other information is not available. Certain production figures may be updated in future periods as additional information is received. |
| 2) | GEOs, which are provided to assist the reader, are based on the following commodity price assumptions: $4,800 per ounce gold; $80.00 per ounce silver; $1,500 per ounce palladium; $2,000 per ounce platinum; and $25.00 per pound cobalt; consistent with those used in estimating the Company’s production guidance for 2026. |
GEO Production
For the three months ended June 30, 2026, attributable GEO production was 202,200 ounces, with the 12,000 ounce increase from the comparable period in 2025 being primarily attributable to the following factors:
| ● | 13,900 ounce or 56% increase from Antamina (837,000 silver ounces). The increase was primarily driven by the newly acquired BHP Antamina PMPA, which increased the Company’s share of silver production at Antamina from 33.75% to 67.5%, effective April 1, 2026. The benefit of the increased production share was partially offset by lower silver grades and the timing of planned maintenance, as a scheduled July maintenance shutdown was advanced into June. Lower grades were attributable to pit sequencing, with a greater proportion of copper-only ore processed during the quarter relative to copper-zinc ore, which contains more silver; |
| ● | 9,200 ounce or 41% increase from the Other mines (comprised of 5,100 gold ounces and 248,000 silver ounces), primarily due to the resumption of mining at Aljustrel, coupled with the commencement of production at Goose, Hemlo, Mineral Park and Fenix, partially offset by lower production at Zinkgruvan; |
| ● | 2,000 ounce or 32% increase from Blackwater (comprised of 1,900 gold ounces and 9,000 silver ounces), primarily the result of higher recoveries; and |
| ● | 800 ounce or 23% increase from Voisey’s Bay (149,000 cobalt pounds) as the underground mine at Voisey’s Bay continues ramp-up to full production, with full ramp-up expected by the second half of 2026; partially offset by |
| ● | 7,300 ounce or 11% decrease from Salobo primarily the result of lower grades; |
| ● | 4,900 ounce or 14% decrease from Peñasquito (296,000 silver ounces), primarily the result of lower grades and recovery resulting from planned mine sequencing, partially offset by higher throughput; and |
| ● | 1,400 ounce or 10% decrease from Constancia (comprised of a decrease of 1,600 gold ounces and an increase of 13,000 silver ounces), primarily due to lower gold grades and recoveries. Mining activities in the Pampacancha pit were completed during the fourth quarter of 2025 and the remaining stockpiled Pampacancha ore was fully processed during January 2026. |
WHEATON PRECIOUS METALS 2026 SECOND QUARTER REPORT - MANAGEMENT DISCUSSION & ANALYSIS [22]
Net Earnings
For the three months ended June 30, 2026, net earnings amounted to $543 million, with the $251 million increase relative to the comparable period of the prior year being attributable to the following factors:
| Net earnings for the three months ended June 30, 2025 |
$ | 292,270 | ||
| Changes in: |
||||
| Revenue: GEO production |
$ | 22,281 | ||
| Revenue: PBND |
51,332 | |||
| Revenue: Delay ounces received |
(1,012) | |||
| Revenue: Prices realized per GEO sold |
353,382 | |||
| Cost of sales: Sales volume |
(22,748) | |||
| Cost of sales: Sales mix differences |
(20,097) | |||
| Cost of sales: Cash cost per ounce |
(20,232) | |||
| Cost of sales: Depletion per ounce |
(29,106) | |||
| Cost of sales: Delay ounces received 1 |
1,009 | |||
| General and administrative and share based compensation |
4,851 | |||
| Donations and community investments |
(2,297) | |||
| Finance costs |
(29,670) | |||
| Other income / expense |
(665) | |||
| Income taxes |
(56,062) | |||
| Total increase in net earnings |
$ | 250,966 | ||
| Net earnings for the three months ended June 30, 2026 |
$ | 543,236 | ||
| 1) | The cost of sales related to delay ounces is a non-cash expense (see footnote 3 on page 9 of this MD&A for more information). |
WHEATON PRECIOUS METALS 2026 SECOND QUARTER REPORT - MANAGEMENT DISCUSSION & ANALYSIS [23]
Results of Operations For The Six Months Ended June 30, 2026 and 2025
The following two tables present the results of operations based on the Company’s reportable operating segments.
| Six Months Ended June 30, 2026 | ||||||||||||||||||||||||||||||||||||
| Units Produced² |
Units Sold |
Average Realized Price ($’s Per Unit) |
Average Cash Cost ($’s Per Unit) 3 |
Average Depletion ($’s Per Unit) 4 |
Sales | Net Earnings |
Cash Flow From Operations |
Total Assets |
||||||||||||||||||||||||||||
| Gold |
||||||||||||||||||||||||||||||||||||
| Salobo |
131,317 | 128,781 | $ | 4,630 | $ | 433 | $ | 404 | $ | 596,292 | $ | 488,467 | $ | 540,512 | $ | 2,568,665 | ||||||||||||||||||||
| Sudbury 5 |
8,841 | 8,883 | 4,663 | 400 | 1,399 | 41,424 | 25,444 | 37,893 | 206,067 | |||||||||||||||||||||||||||
| Constancia |
7,549 | 13,876 | 4,759 | 429 | 338 | 66,038 | 55,391 | 60,087 | 47,588 | |||||||||||||||||||||||||||
| San Dimas |
14,231 | 13,654 | 4,672 | 645 | 428 | 63,790 | 49,131 | 54,978 | 119,371 | |||||||||||||||||||||||||||
| Stillwater |
2,847 | 2,669 | 4,656 | 853 | 570 | 12,428 | 8,629 | 10,151 | 202,680 | |||||||||||||||||||||||||||
| Blackwater |
10,879 | 11,160 | 4,639 | 1,588 | 606 | 51,769 | 27,279 | 34,607 | 324,284 | |||||||||||||||||||||||||||
| Platreef |
567 | - | n.a. | n.a. | n.a. | - | - | - | 275,702 | |||||||||||||||||||||||||||
| Other 6 |
11,311 | 12,148 | 4,699 | 904 | 1,303 | 57,082 | 30,262 | 46,095 | 1,662,005 | |||||||||||||||||||||||||||
| 187,542 | 191,171 | $ | 4,649 | $ | 550 | $ | 519 | $ | 888,823 | $ | 684,603 | $ | 784,323 | $ | 5,406,362 | |||||||||||||||||||||
| Silver |
||||||||||||||||||||||||||||||||||||
| Peñasquito |
4,366 | 4,167 | $ | 76.96 | $ | 4.62 | $ | 5.09 | $ | 320,748 | $ | 280,284 | $ | 301,494 | $ | 185,656 | ||||||||||||||||||||
| Antamina |
3,872 | 3,567 | 77.83 | 15.52 | 14.39 | 277,563 | 170,901 | 222,223 | 4,708,329 | |||||||||||||||||||||||||||
| Constancia |
1,096 | 1,127 | 79.85 | 6.32 | 6.43 | 89,999 | 75,633 | 82,875 | 144,161 | |||||||||||||||||||||||||||
| Blackwater |
276 | 263 | 74.09 | 13.16 | 7.55 | 19,435 | 14,003 | 15,894 | 165,522 | |||||||||||||||||||||||||||
| Other 7 |
3,460 | 2,447 | 80.81 | 18.62 | 3.43 | 197,783 | 143,814 | 172,291 | 562,150 | |||||||||||||||||||||||||||
| 13,070 | 11,571 | $ | 78.26 | $ | 11.30 | $ | 7.79 | $ | 905,528 | $ | 684,635 | $ | 794,777 | $ | 5,765,818 | |||||||||||||||||||||
| Palladium |
||||||||||||||||||||||||||||||||||||
| Stillwater |
5,074 | 4,975 | $ | 1,581 | $ | 291 | $ | 492 | $ | 7,866 | $ | 3,970 | $ | 6,418 | $ | 206,444 | ||||||||||||||||||||
| Platreef |
305 | - | n.a. | n.a. | n.a. | - | - | - | 78,814 | |||||||||||||||||||||||||||
| 5,379 | 4,975 | $ | 1,581 | $ | 291 | $ | 492 | $ | 7,866 | $ | 3,970 | $ | 6,418 | $ | 285,258 | |||||||||||||||||||||
| Platinum |
||||||||||||||||||||||||||||||||||||
| Marathon |
- | - | $ | n.a. | $ | n.a. | $ | n.a. | $ | - | $ | - | $ | - | $ | 9,451 | ||||||||||||||||||||
| Platreef |
321 | - | n.a. | n.a. | n.a. | - | - | - | 57,584 | |||||||||||||||||||||||||||
| 321 | - | $ | n.a. | $ | n.a. | $ | n.a. | $ | - | $ | - | $ | - | $ | 67,035 | |||||||||||||||||||||
| Cobalt |
||||||||||||||||||||||||||||||||||||
| Voisey’s Bay |
1,453 | 1,014 | $ | 28.06 | $ | 5.21 | $ | 9.02 | $ | 28,453 | $ | 14,022 | $ | 19,437 | $ | 206,733 | ||||||||||||||||||||
| Operating results |
$ | 1,830,670 | $ | 1,387,230 | $ | 1,604,955 | $ | 11,731,206 | ||||||||||||||||||||||||||||
| Other |
||||||||||||||||||||||||||||||||||||
| General and administrative |
|
$ | (24,299) | $ | (30,944) | |||||||||||||||||||||||||||||||
| Share based compensation |
|
(14,918) | (29,257) | |||||||||||||||||||||||||||||||||
| Donations and community investments |
|
(6,162) | (5,306) | |||||||||||||||||||||||||||||||||
| Finance costs |
|
(32,502) | (31,852) | |||||||||||||||||||||||||||||||||
| Other |
|
26,807 | 17,188 | |||||||||||||||||||||||||||||||||
| Income tax |
|
(210,876) | (109,444) | |||||||||||||||||||||||||||||||||
| Total other |
$ | (261,950) | $ | (189,615) | $ | 429,980 | ||||||||||||||||||||||||||||||
| $ | 1,125,280 | $ | 1,415,340 | $ | 12,161,186 | |||||||||||||||||||||||||||||||
| 1) | Units of gold, silver, palladium and platinum produced and sold are reported in ounces, while cobalt is reported in pounds. All figures in thousands except gold, palladium and platinum ounces produced and sold and per unit amounts. |
| 2) | Quantity produced represents the amount of gold, silver, palladium, platinum and cobalt contained in concentrate or doré prior to smelting or refining deductions. Production figures are based on information provided by the operators of the mining operations to which the mineral stream interests relate or management estimates in those situations where other information is not available. Certain production figures may be updated in future periods as additional information is received. |
| 3) | Refer to discussion on non-GAAP measure (iii) on page 42 of this MD&A. |
| 4) | Includes the non-cash per ounce cost of sale associated with delay ounces. Please see footnote 3 on page 9 of this MD&A for more information. |
| 5) | Comprised of the operating Coleman, Copper Cliff, Garson, Creighton, Stobie and Totten gold interests and the non-operating Victor gold interest. |
| 6) | Other gold interests comprised of the Copper World, Marmato, Santo Domingo, Fenix, El Domo, Marathon, Goose, Cangrejos, Curraghinalt, Kudz Ze Kayah, Koné, Kurmuk, Spring Valley, Hemlo and Jervois gold interests. |
| 7) | Other silver interests comprised of the Los Filos, Zinkgruvan, Stratoni, Neves-Corvo, Aljustrel, El Alto, Copper World, Navidad, Marmato, Cozamin, El Domo, Mineral Park, Kudz Ze Kayah and Jervois silver interests. |
WHEATON PRECIOUS METALS 2026 SECOND QUARTER REPORT - MANAGEMENT DISCUSSION & ANALYSIS [24]
| Six Months Ended June 30, 2025 | ||||||||||||||||||||||||||||||||||||
| Units Produced² |
Units Sold |
Average Realized Price ($’s Per Unit) |
Average Cash Cost ($’s Per Unit) 3 |
Average Depletion ($’s Per Unit) 4 |
Sales | Net Earnings |
Cash Flow From Operations |
Total Assets |
||||||||||||||||||||||||||||
| Gold |
||||||||||||||||||||||||||||||||||||
| Salobo |
140,802 | 160,140 | $ | 3,084 | $ | 429 | $ | 390 | $ | 493,802 | $ | 362,714 | $ | 425,126 | $ | 2,677,073 | ||||||||||||||||||||
| Sudbury 5 |
10,283 | 8,481 | 3,032 | 400 | 1,326 | 25,714 | 11,077 | 22,307 | 230,307 | |||||||||||||||||||||||||||
| Constancia |
9,480 | 16,615 | 3,055 | 425 | 323 | 50,752 | 38,335 | 43,698 | 58,963 | |||||||||||||||||||||||||||
| San Dimas |
15,403 | 16,197 | 3,070 | 638 | 290 | 49,733 | 34,698 | 39,392 | 131,787 | |||||||||||||||||||||||||||
| Stillwater |
2,993 | 3,333 | 3,057 | 536 | 421 | 10,188 | 7,000 | 8,402 | 206,058 | |||||||||||||||||||||||||||
| Blackwater |
5,067 | 3,401 | 3,351 | 1,167 | 617 | 11,398 | 5,331 | 7,429 | 338,133 | |||||||||||||||||||||||||||
| Platreef |
- | - | n.a. | n.a. | n.a. | - | - | - | 275,702 | |||||||||||||||||||||||||||
| Other 6 |
1,524 | 2,103 | 3,073 | 385 | 1,261 | 6,462 | 3,001 | 5,653 | 592,372 | |||||||||||||||||||||||||||
| 185,552 | 210,270 | $ | 3,082 | $ | 457 | $ | 427 | $ | 648,049 | $ | 462,156 | $ | 552,007 | $ | 4,510,395 | |||||||||||||||||||||
| Silver |
||||||||||||||||||||||||||||||||||||
| Peñasquito |
3,857 | 4,088 | $ | 32.96 | $ | 4.56 | $ | 4.86 | $ | 134,738 | $ | 96,240 | $ | 116,097 | $ | 224,608 | ||||||||||||||||||||
| Antamina |
2,529 | 1,957 | 33.02 | 6.65 | 8.46 | 64,614 | 35,040 | 51,596 | 474,215 | |||||||||||||||||||||||||||
| Constancia |
1,107 | 1,355 | 32.86 | 6.26 | 6.10 | 44,514 | 27,764 | 36,034 | 157,109 | |||||||||||||||||||||||||||
| Blackwater |
173 | 143 | 36.69 | 6.55 | 9.67 | 5,239 | 2,923 | 4,519 | 169,566 | |||||||||||||||||||||||||||
| Other 7 |
2,609 | 1,808 | 34.04 | 4.45 | 5.42 | 61,572 | 43,714 | 46,030 | 551,926 | |||||||||||||||||||||||||||
| 10,275 | 9,351 | $ | 33.22 | $ | 5.25 | $ | 5.98 | $ | 310,677 | $ | 205,681 | $ | 254,276 | $ | 1,577,424 | |||||||||||||||||||||
| Palladium |
||||||||||||||||||||||||||||||||||||
| Stillwater |
5,096 | 5,032 | $ | 981 | $ | 174 | $ | 429 | $ | 4,936 | $ | 1,903 | $ | 4,063 | $ | 211,019 | ||||||||||||||||||||
| Platreef |
- | - | n.a. | n.a. | n.a. | - | - | - | 78,814 | |||||||||||||||||||||||||||
| 5,096 | 5,032 | $ | 981 | $ | 174 | $ | 429 | $ | 4,936 | $ | 1,903 | $ | 4,063 | $ | 289,833 | |||||||||||||||||||||
| Platinum |
||||||||||||||||||||||||||||||||||||
| Marathon |
- | - | $ | n.a. | $ | n.a. | $ | n.a. | $ | - | $ | - | $ | - | $ | 9,451 | ||||||||||||||||||||
| Platreef |
- | - | n.a. | n.a. | n.a. | - | - | - | 57,584 | |||||||||||||||||||||||||||
| - | - | $ | n.a. | $ | n.a. | $ | n.a. | $ | - | $ | - | $ | - | $ | 67,035 | |||||||||||||||||||||
| Cobalt |
||||||||||||||||||||||||||||||||||||
| Voisey’s Bay |
1,187 | 618 | $ | 16.15 | $ | 3.09 | $ | 9.18 | $ | 9,967 | $ | 2,389 | $ | 6,869 | $ | 225,020 | ||||||||||||||||||||
| Operating results |
$ | 973,629 | $ | 672,129 | $ | 817,215 | $ | 6,669,707 | ||||||||||||||||||||||||||||
| Other |
||||||||||||||||||||||||||||||||||||
| General and administrative |
|
$ | (24,547) | $ | (29,875) | |||||||||||||||||||||||||||||||
| Share based compensation |
|
(22,143) | (17,209) | |||||||||||||||||||||||||||||||||
| Donations and community investments |
|
(5,060) | (4,975) | |||||||||||||||||||||||||||||||||
| Finance costs |
|
(2,868) | (3,186) | |||||||||||||||||||||||||||||||||
| Other |
|
17,256 | 16,964 | |||||||||||||||||||||||||||||||||
| Income tax |
|
(88,513) | (3,182) | |||||||||||||||||||||||||||||||||
| Total other |
$ | (125,875) | $ | (41,463) | $ | 1,312,678 | ||||||||||||||||||||||||||||||
| $ | 546,254 | $ | 775,752 | $ | 7,982,385 | |||||||||||||||||||||||||||||||
| 1) | Units of gold, silver and palladium produced and sold are reported in ounces, while cobalt is reported in pounds. All figures in thousands except gold and palladium ounces produced and sold and per unit amounts. |
| 2) | Quantity produced represents the amount of gold, silver, palladium and cobalt contained in concentrate or doré prior to smelting or refining deductions. Production figures are based on information provided by the operators of the mining operations to which the mineral stream interests relate or management estimates in those situations where other information is not available. Certain production figures may be updated in future periods as additional information is received. |
| 3) | Refer to discussion on non-GAAP measure (iii) on page 42 of this MD&A. |
| 4) | Includes the non-cash per ounce cost of sale associated with delay ounces. Please see footnote 3 on page 9 of this MD&A for more information. |
| 5) | Comprised of the operating Coleman, Copper Cliff, Garson, Creighton and Totten gold interests as well as the non-operating Stobie and Victor gold interests. |
| 6) | Other gold interests comprised of the Marmato, Copper World, Santo Domingo, Fenix, El Domo, Marathon, Goose, Cangrejos, Curraghinalt, Kudz Ze Kayah, Koné and Kurmuk gold interests. |
| 7) | Other silver interests comprised of the Los Filos, Zinkgruvan, Neves-Corvo, Marmato, Cozamin, Stratoni, Aljustrel, El Alto, Copper World, Navidad, El Domo, Mineral Park and Kudz Ze Kayah silver interests. |
WHEATON PRECIOUS METALS 2026 SECOND QUARTER REPORT - MANAGEMENT DISCUSSION & ANALYSIS [25]
Comparative Results of Operations on a GEO Basis
| YTD 2026 | YTD 2025 | Change | Change | |||||||||||||
| GEO Production 1, 2 |
414,755 | 364,570 | 50,185 | 13.8 % | ||||||||||||
| GEO Sales 2 |
390,859 | 370,911 | 19,948 | 5.4 % | ||||||||||||
| Average price per GEO sold 2 |
$ | 4,684 | $ | 2,625 | $ | 2,059 | 78.4 % | |||||||||
| Revenue |
$ | 1,830,670 | $ | 973,629 | $ | 857,041 | 88.0 % | |||||||||
| Cost of sales, excluding depletion |
$ | 244,086 | $ | 149,805 | $ | (94,281) | (62.9)% | |||||||||
| Depletion |
199,354 | 151,695 | (47,659) | (31.4)% | ||||||||||||
| Cost of sales |
$ | 443,440 | $ | 301,500 | $ | (141,940) | (47.1)% | |||||||||
| Gross margin |
$ | 1,387,230 | $ | 672,129 | $ | 715,101 | 106.4 % | |||||||||
| General and administrative |
24,299 | 24,547 | 248 | 1.0 % | ||||||||||||
| Share based compensation |
14,918 | 22,143 | 7,225 | 32.6 % | ||||||||||||
| Donations and community investments |
6,162 | 5,060 | (1,102) | (21.8)% | ||||||||||||
| Earnings from operations |
$ | 1,341,851 | $ | 620,379 | $ | 721,472 | 116.3 % | |||||||||
| Other income (expense) |
26,807 | 17,256 | 9,551 | 55.3 % | ||||||||||||
| Earnings before finance costs and income taxes |
$ | 1,368,658 | $ | 637,635 | $ | 731,023 | 114.6 % | |||||||||
| Finance costs |
32,502 | 2,868 | (29,634) | (1,033.3)% | ||||||||||||
| Earnings before income taxes |
$ | 1,336,156 | $ | 634,767 | $ | 701,389 | 110.5 % | |||||||||
| Income tax expense |
210,876 | 88,513 | (122,363) | (138.2)% | ||||||||||||
| Net earnings |
$ | 1,125,280 | $ | 546,254 | $ | 579,026 | 106.0 % | |||||||||
| 1) | Quantity produced represents the amount of gold, silver, palladium, platinum and cobalt contained in concentrate or doré prior to smelting or refining deductions. Production figures are based on information provided by the operators of the mining operations to which the mineral stream interests relate or management estimates in those situations where other information is not available. Certain production figures may be updated in future periods as additional information is received. |
| 2) | GEOs, which are provided to assist the reader, are based on the following commodity price assumptions: $4,800 per ounce gold; $80.00 per ounce silver; $1,500 per ounce palladium; $2,000 per ounce platinum; and $25.00 per pound cobalt; consistent with those used in estimating the Company’s production guidance for 2026. |
WHEATON PRECIOUS METALS 2026 SECOND QUARTER REPORT - MANAGEMENT DISCUSSION & ANALYSIS [26]
GEO Production
For the six months ended June 30, 2026, attributable GEO production was 414,800 ounces, with the 50,200 ounce increase from the comparable period in 2025 being primarily attributable to the following factors:
| ● | 24,000 ounce or 53% increase from the Other mines (comprised of 9,800 gold ounces and 851,000 silver ounces), primarily due to the resumption of mining at Aljustrel, coupled with the commencement of production at Goose, Hemlo, Mineral Park and Fenix, partially offset by lower production at Zinkgruvan; |
| ● | 22,400 ounce or 53% increase from Antamina (1,341,000 silver ounces), primarily due to the newly acquired BHP Antamina PMPA, which increased the Company’s share of silver production at Antamina from 33.75% to 67.5%, effective April 1, 2026; |
| ● | 8,500 ounce or 13% increase from Peñasquito (511,000 silver ounces), primarily the result of higher throughput; |
| ● | 7,500 ounce or 95% increase from Blackwater (comprised of 5,800 gold ounces and 104,000 silver ounces), primarily due to higher throughput and recovery; |
| ● | 1,400 ounce or 22% increase from Voisey’s Bay (266,000 cobalt pounds) as the underground mine at Voisey’s Bay continues ramp-up to full production, with full ramp-up expected by the second half of 2026; and |
| ● | 800 ounce increase from Platreef (comprised of 600 gold ounces, 300 palladium ounces and 300 platinum ounces), with the mine commencing production during 2026; partially offset by |
| ● | 9,500 ounce or 7% decrease from Salobo primarily the result of lower grades, partially offset by higher throughput and recoveries; |
| ● | 2,100 ounce or 8% decrease from Constancia (comprised of 1,900 gold ounces and 11,000 silver ounces), primarily due to lower gold grades and lower recoveries; |
| ● | 1,400 ounce or 14% decrease from Sudbury, primarily due to lower throughput, grades and recoveries; and |
| ● | 1,200 ounce or 8% decrease from San Dimas, with lower grades being partially offset by the change of the gold to silver conversion ratio from 90:1 to 70:1 on October 29, 2025, noting that for the period April 30, 2025 to October 28, 2025, the gold to silver conversion ratio was 90:1. |
Net Earnings
For the six months ended June 30, 2026, net earnings amounted to $1.1 billion, with the $579 million increase relative to the comparable period of the prior year being attributable to the following factors:
| Net earnings for the six months ended June 30, 2025 |
$ | 546,254 | ||
| Changes in: |
||||
| Revenue: GEO production |
$ | 113,165 | ||
| Revenue: PBND |
(60,440 | ) | ||
| Revenue: Delay ounces received |
(363 | ) | ||
| Revenue: Prices realized per GEO sold |
804,679 | |||
| Cost of sales: Sales volume |
(22,262 | ) | ||
| Cost of sales: Sales mix differences |
(48,800 | ) | ||
| Cost of sales: Cash cost per ounce |
(44,621 | ) | ||
| Cost of sales: Depletion per ounce |
(26,616 | ) | ||
| Cost of sales: Delay ounces received 1 |
359 | |||
| General and administrative and share based compensation |
7,473 | |||
| Donations and community investments |
(1,102 | ) | ||
| Finance costs |
(29,634 | ) | ||
| Other income / expense |
9,551 | |||
| Income taxes |
(122,363 | ) | ||
| Total increase in net earnings |
$ | 579,026 | ||
| Net earnings for the six months ended June 30, 2026 |
$ | 1,125,280 | ||
| 1) | The cost of sales related to delay ounces is a non-cash expense (see footnote 3 on page 9 of this MD&A for more information). |
WHEATON PRECIOUS METALS 2026 SECOND QUARTER REPORT - MANAGEMENT DISCUSSION & ANALYSIS [27]
General and Administrative
The following table provides a breakdown of general and administrative expenses incurred for the three and six months ended June 30, 2026 and 2025, respectively:
| Three Months Ended June 30 |
Six Months Ended June 30 |
|||||||||||||||
| (in thousands) | 2026 | 2025 | 2026 | 2025 | ||||||||||||
| Salaries and benefits |
$ | 5,413 | $ | 5,631 | $ | 12,055 | $ | 13,442 | ||||||||
| Depreciation |
306 | 320 | 737 | 620 | ||||||||||||
| Professional fees, audit and regulatory |
2,317 | 2,648 | 4,386 | 4,499 | ||||||||||||
| Business travel |
483 | 398 | 1,166 | 983 | ||||||||||||
| Business taxes |
131 | 260 | 998 | 882 | ||||||||||||
| Insurance |
522 | 492 | 1,013 | 985 | ||||||||||||
| Other |
2,155 | 1,273 | 3,944 | 3,136 | ||||||||||||
|
Total general and administrative |
$ | 11,327 | $ | 11,022 | $ | 24,299 | $ | 24,547 | ||||||||
Share Based Compensation
| Three Months Ended June 30 |
Six Months Ended June 30 |
|||||||||||||||
| (in thousands) | 2026 | 2025 | 2026 | 2025 | ||||||||||||
| Equity settled share based compensation 1 |
||||||||||||||||
| Share purchase options |
$ | 729 | $ | 711 | $ | 1,429 | $ | 1,290 | ||||||||
| Restricted share units |
1,014 | 1,098 | 1,961 | 1,944 | ||||||||||||
| Cash settled share based compensation |
||||||||||||||||
| Performance share units |
3,063 | 8,153 | 11,528 | 18,909 | ||||||||||||
| Total share based compensation |
$ | 4,806 | $ | 9,962 | $ | 14,918 | $ | 22,143 | ||||||||
| 1) | Equity settled share based compensation is a non-cash expense. |
For the three and six months ended June 30, 2026, share based compensation decreased by $5 million and $7 million, respectively, relative to the comparable periods in the previous year, primarily the result of differences in accrued costs related to the Company’s performance share units (PSUs), as the impact of a higher share price was offset by a lower estimated performance factor at maturity.
Donations and Community Investments
| Three Months Ended June 30 |
Six Months Ended June 30 |
|||||||||||||||
| (in thousands) | 2026 | 2025 | 2026 | 2025 | ||||||||||||
| Local donations and community investments 1 |
$ | 2,343 | $ | 793 | $ | 3,100 | $ | 1,625 | ||||||||
| Partner donations and community investments 2 |
1,153 | 1,551 | 1,815 | 2,308 | ||||||||||||
| Environmental and innovation investments 3 |
1,169 | 24 | 1,247 | 1,127 | ||||||||||||
| Total donations and community investments |
$ | 4,665 | $ | 2,368 | $ | 6,162 | $ | 5,060 | ||||||||
| 1) | The Local Community Investment Program supports organizations in Vancouver and the Cayman Islands, where Wheaton’s offices are located. |
| 2) | The Partner Community Investment Program supports the communities influenced by Mining Partners’ operations. |
| 3) | Includes the Company’s funding of initiatives that seek to reduce environmental impacts and support innovation and efficiency in mining, including costs associated with the Future of Mining Challenge. |
WHEATON PRECIOUS METALS 2026 SECOND QUARTER REPORT - MANAGEMENT DISCUSSION & ANALYSIS [28]
Other Income (Expense)
| Three Months Ended June 30 |
Six Months Ended June 30 |
|||||||||||||||
| (in thousands) | 2026 | 2025 | 2026 | 2025 | ||||||||||||
| Interest income |
$ | 2,655 | $ | 8,455 | $ | 15,671 | $ | 17,263 | ||||||||
| Dividend income |
- | 287 | - | 526 | ||||||||||||
| Foreign exchange gain (loss) |
5,601 | (1,379) | 8,241 | (1,532) | ||||||||||||
| Gain (loss) on fair value adjustment of share purchase warrants held |
492 | 2,134 | (436) | 2,757 | ||||||||||||
| Other |
323 | 239 | 3,331 | (1,758) | ||||||||||||
| Total other income (expense) |
$ | 9,071 | $ | 9,736 | $ | 26,807 | $ | 17,256 | ||||||||
Interest Income
For the three months ended June 30, 2026, interest income decreased by $5 million, a result of the average cash balance during the period decreasing from approximately $790 million with an average rate of return of 4.2% to approximately $260 million with an average rate of return of 3.5%.
For the six months ended June 30, 2026, interest income decreased by $1 million, a result of the average rate of return decreasing from approximately 4.2% to approximately 3.5%.
Finance Costs
| Three Months Ended June 30 |
Six Months Ended June 30 |
|||||||||||||||
| (in thousands) | 2026 | 2025 | 2026 | 2025 | ||||||||||||
| Average principal outstanding during period |
$ | 2,380,000 | $ | - | $ | 1,190,000 | $ | - | ||||||||
| Average effective interest rate during period |
5.09% | n.a. | 5.09% | n.a. | ||||||||||||
| Total interest costs incurred during period |
$ | 30,309 | $ | - | $ | 30,309 | $ | - | ||||||||
| Costs related to undrawn credit facilities |
687 | 1,317 | 1,991 | 2,667 | ||||||||||||
| Interest expense - lease liabilities |
101 | 110 | 202 | 201 | ||||||||||||
| Total finance costs |
$ | 31,097 | $ | 1,427 | $ | 32,502 | $ | 2,868 | ||||||||
Income Tax Expense
For the three months ended June 30, 2026, the Company recorded an increase in global minimum tax (“GMT”) expense of $41 million to $90 million, while for the six month period GMT expense increased $92 million to $187 million. The increases were primarily attributable to higher net earnings from the Cayman Islands subsidiaries, which rose by $270 million and $612 million, respectively.
GMT is payable to the Government of Canada 15 months after year-end (18 months after year-end for the year ended December 31, 2024), with the Company having made the payment for the 2024 year in the amount of $109 million (Cdn$155 million) on June 24, 2026, while the payment for the 2025 year in the amount of $243 million (Cdn$346 million) will be paid on or around March 31, 2027. To date, the government of the Cayman Islands has indicated that they do not intend to enact Pillar Two Legislation.
During the six months ended June 30, 2026, the Company recorded a current tax expense of $20 million in OCI as a result of the disposition of long-term equity investments. This was partially offset by a $12 million current income tax recovery recognized in net earnings.
WHEATON PRECIOUS METALS 2026 SECOND QUARTER REPORT - MANAGEMENT DISCUSSION & ANALYSIS [29]
Liquidity and Capital Resources1
As at June 30, 2026, the Company had cash and cash equivalents of $100 million (December 31, 2025 - $1.2 billion) and debt outstanding under its Term Loan and its Revolving Credit Facility totaling $2.0 billion (December 31, 2025 - $NIL), resulting in a net debt position of $1.9 billion.
On April 1, 2026, the Company made the $4.3 billion upfront payment related to the BHP Antamina PMPA. The upfront payment was funded through a combination of the cash on hand at closing, a new $1.5 billion Term Loan which carries a two-year term to maturity and otherwise aligns with the terms of the Company’s existing Revolving Credit Facility and a draw on the Company’s previously undrawn Revolving Credit Facility.
The Revolving Credit Facility and the Term Loan provide flexible, non-dilutive financing that may be repaid at any time without penalty. The remaining liquidity available from the Revolving Credit Facility, in addition to continued strong operating cash flows, provides healthy balance sheet capacity.
In the opinion of management, with the liquidity provided by the remaining available credit under the $2.5 billion Revolving Credit Facility coupled with the $500 million accordion and ongoing operating cash flows, the Company remains well positioned to fund all outstanding commitments, as detailed in the Contractual Obligations and Commitments section on pages 34 through 38 of this MD&A, as well as providing flexibility to acquire additional accretive mineral stream interests.
A summary of the Company’s cash flow activity is as follows:
Three Months Ended June 30, 2026
Cash Flows from Operating Activities
During the three months ended June 30, 2026, the Company generated operating cash flows of $650 million, with the $235 million increase relative to the comparable period of the prior year being attributable to the following factors:
| Operating cash inflow for the three months ended June 30, 2025 |
$ | 414,959 | ||
| Changes in: |
||||
| Revenue |
$ | 425,983 | ||
| Cost of sales (excluding depletion) |
(44,684) | |||
| Working Capital changes |
(3,221) | |||
| General and administrative |
9 | |||
| Donations and community investments |
(1,803) | |||
| Finance costs |
(28,755) | |||
| Income taxes |
(108,313) | |||
| Interest received |
(5,113) | |||
| Other |
456 | |||
| Total increase to net cash inflows |
$ | 234,559 | ||
| Operating cash inflow for the three months ended June 30, 2026 |
$ | 649,518 | ||
| 1) | The cost of sales related to delay ounces is a non-cash expense (see footnote 3 on page 9 of this MD&A for more information). |
| 1 | Statements made in this section contain forward-looking information with respect to funding outstanding commitments and continuing to acquire accretive mineral stream interests and readers are cautioned that actual outcomes may vary. Please see “Cautionary Note Regarding Forward-Looking Statements” for material risks, assumptions and important disclosures associated with this information. |
WHEATON PRECIOUS METALS 2026 SECOND QUARTER REPORT - MANAGEMENT DISCUSSION & ANALYSIS [30]
Cash Flows from Financing Activities
During the three months ended June 30, 2026, the Company had net cash inflows from financing activities of $1.8 billion, as compared to net cash outflows of $147 million for the comparable period of the previous year, with the major sources (uses) of cash flows being as follows:
| Three Months Ended June 30 |
||||||||
| (in thousands) |
2026 | 2025 | ||||||
| Bank debt drawn |
$ | 2,700,000 | - | |||||
| Bank debt repaid |
(728,000) | - | ||||||
| Debt issue costs |
(2,073) | (862) | ||||||
| Share purchase options exercised |
807 | 1,967 | ||||||
| Lease payments |
(124) | (89) | ||||||
| Dividends paid |
(171,292) | (147,939) | ||||||
| Cash (used for) generated from financing activities |
$ | 1,799,318 | $ | (146,923) | ||||
|
Cash Flows from Investing Activities During the three months ended June 30, 2026, the Company had net cash outflows from investing activities of $4.5 billion, as compared to $348 million during the comparable period of the previous year, with the major sources (uses) of cash flow being as follows:
|
| |||||||
| Three Months Ended June 30 |
||||||||
| (in thousands) | 2026 | 2025 | ||||||
| Payments for the acquisition of PMPAs 1: |
||||||||
| Antamina PMPA |
$ | (4,300,000) | $ | - | ||||
| Koné PMPA |
(156,250) | (156,250) | ||||||
| Jervois PMPA |
(16,000) | - | ||||||
| Salobo Expansion PMPA |
- | (144,000) | ||||||
| Kurmuk PMPA |
- | (43,750) | ||||||
| Cangrejos PMPA |
- | (3,100) | ||||||
| $ | (4,472,250) | ($347,100) | ||||||
| Payments for the acquisition of new royalty agreements: |
||||||||
| Spanish Mountain Royalty |
(22,500) | - | ||||||
| Cipango Royalty |
(4,500) | - | ||||||
| Increase in loans and advances |
(10,000) | - | ||||||
| Other |
(2,125) | (795) | ||||||
| Total cash used for investing activities |
$ | (4,511,375) | ($347,895) | |||||
| 1) | Excludes closing costs. |
WHEATON PRECIOUS METALS 2026 SECOND QUARTER REPORT - MANAGEMENT DISCUSSION & ANALYSIS [31]
Six Months Ended June 30, 2026
Cash Flows From Operating Activities
During the six months ended June 30, 2026, the Company generated operating cash flows of $1.4 billion, with the $640 million increase relative to the comparable period of the prior year being attributable to the following factors:
| Operating cash inflow for the six months ended June 30, 2025 |
$ | 775,752 | ||
| Changes in: |
||||
| Revenue |
$ | 857,041 | ||
| Cost of sales (excluding depletion) |
(94,642) | |||
| Working Capital changes |
25,341 | |||
| General and administrative |
(1,069) | |||
| Donations and community investments |
(331) | |||
| Share based compensation - PSUs |
(12,048) | |||
| Finance costs |
(28,666) | |||
| Income taxes |
(106,262) | |||
| Interest received |
195 | |||
| Other |
29 | |||
| Total increase to net cash inflows |
$ | 639,588 | ||
| Operating cash inflow for the six months ended June 30, 2026 |
$ | 1,415,340 | ||
1) The cost of sales related to delay ounces is a non-cash expense (see footnote 3 on page 9 of this MD&A for more information).
Share based compensation - PSUs Variance
The increase to cash outflows relative to PSUs during the period was due to a higher payout in the current year resulting from share price at maturity being 116% higher in 2026 relative to 2025.
Cash Flows From Financing Activities
During the six months ended June 30, 2026, the Company had net cash inflows from financing activities of $1.8 billion, as compared to net cash outflows of $145 million during the comparable period of the previous year, with the major sources (uses) of cash flow being as follows:
| Six Months Ended June 30 |
||||||||
| (in thousands) | 2026 | 2025 | ||||||
| Bank debt drawn |
$ | 2,700,000 | $ | - | ||||
| Bank debt repaid |
(728,000) | - | ||||||
| Debt issue costs |
(5,118) | (862) | ||||||
| Share purchase options exercised |
1,546 | 4,473 | ||||||
| Lease payments |
(283) | (211) | ||||||
| Dividends paid |
(171,292) | (147,939) | ||||||
| Cash (used for) generated from financing activities |
$ | 1,796,853 | $ | (144,539) | ||||
WHEATON PRECIOUS METALS 2026 SECOND QUARTER REPORT - MANAGEMENT DISCUSSION & ANALYSIS [32]
Cash Flows From Investing Activities
During the six months ended June 30, 2026, the Company had net cash outflows from investing activities of $4.3 billion, as compared to $444 million during the comparable period of the previous year, with the major sources (uses) of cash flow being as follows:
| Six Months Ended June 30 |
||||||||
| (in thousands) | 2026 | 2025 | ||||||
| Payments for the acquisition of PMPAs 1: |
||||||||
| Antamina PMPA |
$(4,300,000) | $ - | ||||||
| Koné PMPA |
(156,250) | (156,250) | ||||||
| Jervois PMPA |
(16,000) | - | ||||||
| Spring Valley PMPA |
(50,000) | - | ||||||
| Salobo Expansion PMPA |
- | (144,000) | ||||||
| Kurmuk PMPA |
- | (43,750) | ||||||
| Fenix PMPA |
- | (25,000) | ||||||
| Mineral Park PMPA |
- | (40,000) | ||||||
| Blackwater Silver PMPA |
- | (30,000) | ||||||
| Cangrejos PMPA |
- | (3,100) | ||||||
| Marmato PMPA |
(40,016) | - | ||||||
| Santo Domingo PMPA 2 |
30,000 | - | ||||||
| $(4,532,266) | ($442,100) | |||||||
| Acquisition of long-term equity investments |
(14,608) | - | ||||||
| Proceeds on disposal of long-term equity investments |
323,421 | - | ||||||
| Payments for the acquisition of new royalty agreements: |
||||||||
| Spanish Mountain Royalty |
(22,500) | - | ||||||
| Cipango Royalty |
(4,500) | - | ||||||
| Increase in loans and advances |
(10,000) | - | ||||||
| Other |
174 | (1,559) | ||||||
| Total cash used for investing activities |
$(4,260,279) | ($443,659) | ||||||
| 1) | Excludes closing costs. |
| 2) | On March 9, 2026, Capstone made a temporary repayment of amounts advanced under the Santo Domingo PMPA, which ended Capstone’s requirement to make delay ounce payments under the PMPA (see footnote 3 on page 9 of this MD&A for more information). |
WHEATON PRECIOUS METALS 2026 SECOND QUARTER REPORT - MANAGEMENT DISCUSSION & ANALYSIS [33]
Contractual Obligations and Commitments1
Mineral Stream Interests
The following tables summarize the Company’s commitments to make per ounce or per pound cash payments for gold, silver, palladium, platinum and cobalt to which it has the contractual right pursuant to the PMPAs:
Per Ounce Cash Payment for Gold
| Mineral Stream Interests |
Attributable Payable Production to be Purchased |
Per Ounce Cash Payment 1 |
|
Term of Agreement |
|
Date of |
| |||||
| Constancia |
50% | $429 ² | Life of Mine | 8-Aug-12 | ||||||||
| Salobo |
75% | $433 | Life of Mine | 28-Feb-13 | ||||||||
| Sudbury |
70% | $400 | 20 years | 28-Feb-13 | ||||||||
| San Dimas |
variable ³ | $650 | Life of Mine | 10-May-18 | ||||||||
| Stillwater |
100% | 18% 4 | Life of Mine | 16-Jul-18 | ||||||||
| Blackwater |
8% 5 | 35% | Life of Mine | 13-Dec-21 | ||||||||
| Platreef |
62.5% 5 | $100 5 | Life of Mine | 5 | 7-Dec-21 | 7 | ||||||
| Other |
||||||||||||
| Copper World |
100% | $450 | Life of Mine | 10-Feb-10 | ||||||||
| Marmato |
10.5% 5 | 18% 4 | Life of Mine | 5-Nov-20 | ||||||||
| Santo Domingo |
100% 5 | 18% 4 | Life of Mine | 24-Mar-21 | ||||||||
| Fenix |
22% 6 | 20% | Life of Mine | 15-Nov-21 | ||||||||
| El Domo |
50% 5 | 18% 4 | Life of Mine | 17-Jan-22 | ||||||||
| Marathon |
100% 5 | 18% 4 | Life of Mine | 26-Jan-22 | ||||||||
| Goose |
2.78% 5 | 18% 4 | Life of Mine | 8-Feb-22 | ||||||||
| Cangrejos |
4.4% 5 | 18% 4 | Life of Mine | 16-May-23 | ||||||||
| Curraghinalt |
3.05% 5 | 18% 4 | Life of Mine | 15-Nov-23 | ||||||||
| Kudz Ze Kayah |
7.375% 5 | 20% | Life of Mine | 22-Dec-21 | 7 | |||||||
| Koné |
19.5% 5 | 20% 8 | Life of Mine | 23-Oct-24 | ||||||||
| Kurmuk |
6.7% 5 | 15% | Life of Mine | 5-Dec-24 | ||||||||
| Spring Valley |
8% 5 | 20% 4 | Life of Mine | 6-Nov-25 | ||||||||
| Hemlo |
10.13% 5 | 20% | Life of Mine | 26-Nov-25 | ||||||||
| Jervois |
75% 5 | 20% | Life of Mine | 1-Apr-26 | ||||||||
| Early Deposit |
||||||||||||
| Toroparu |
10% | $400 | Life of Mine | 11-Nov-13 | ||||||||
| Cotabambas |
25% 5 | $450 | Life of Mine | 21-Mar-16 | ||||||||
| Kutcho |
100% | 20% | Life of Mine | 14-Dec-17 | ||||||||
| 1) | The production payment is measured as either a fixed amount per ounce of gold delivered, or as a percentage of the spot price of gold on the date of delivery. Contracts where the payment is a fixed amount per ounce of gold delivered are subject to an annual inflationary increase, with the exception of Sudbury. Additionally, should the prevailing market price for gold be lower than this fixed amount, the per ounce cash payment will be reduced to the prevailing market price, subject to an annual inflationary factor. |
| 2) | Subject to an increase to $550 per ounce of gold after the initial 40-year term. |
| 3) | Under the terms of the San Dimas PMPA, the Company is entitled to an amount equal to 25% of the payable gold production plus an additional amount of gold equal to 25% of the payable silver production converted to gold at a fixed gold to silver exchange ratio of 70:1 from the San Dimas mine. If the average gold to silver price ratio decreases to less than 50:1 or increases to more than 90:1 for a period of 6 months or more, then the “70” shall be revised to “50” or “90”, as the case may be, until such time as the average gold to silver price ratio is between 50:1 to 90:1 for a period of 6 months or more in which event the “70” shall be reinstated. Currently, the fixed gold to silver exchange ratio is 70:1. |
| 4) | To be increased to 22% once the market value of all metals delivered to Wheaton, net of the per ounce cash payment, exceeds the initial upfront cash deposit. |
| 5) | Under certain PMPAs, the Company’s attributable gold percentage will be reduced once certain thresholds are achieved: |
| a. | Blackwater – reduced to 4% once the Company has received 464,000 ounces of gold. |
| b. | Platreef - reduced to 50% once the Company has received 218,750 ounces of gold, with a further reduction to 3.125% once the Company has received 428,300 ounces, at which point the per ounce cash payment increases to 80% of the spot price of gold. If certain thresholds are met, including if production through the Platreef project concentrator achieves 5.5 Mtpa, the 3.125% residual gold stream will terminate. |
| c. | Marmato – reduced to 5.25% once Wheaton has received 310,000 ounces of gold. |
| d. | Santo Domingo – reduced to 67% once the Company has received 285,000 ounces of gold. |
| e. | El Domo – reduced to 33% once the Company has received 145,000 ounces of gold. |
| f. | Marathon – reduced to 67% once the Company has received 150,000 ounces of gold. |
| g. | Goose – reduced to 1.44% once the Company has received 87,100 ounces of gold, with a further reduction to 1% once the Company has received 134,000 ounces. |
| h. | Cangrejos – reduced to 2.9% once the Company has received 469,000 ounces of gold. |
| i. | Curraghinalt – reduced to 1.5% once the Company has received 125,000 ounces of gold. |
| j. | Koné - reduced to 10.8% once the Company has received 400,000 ounces of gold, subject to adjustment if there are delays in deliveries relative to an agreed schedule, with a further reduction to 5.4% once the Company has received an additional 130,000 ounces of gold. |
| k. | Kurmuk – reduced to 4.8% once the Company has received 220,000 ounces of gold. During any period in which debt exceeding $150 million ranks ahead of the gold stream, the stream percentage increases to 7.15% and decreases to 5.25% once the drop down threshold is reached. |
| l. | Kudz Ze Kayah – reduced to 6.125% once the Company has received 330,000 ounces of gold, with a further reduction to 5.5% until the Company has received an additional 59,800 ounces of gold, with a further reduction to 5.5% until the Company has received an additional 270,200 ounces of gold, thereafter increased to 6.75%. |
| 1 | Statements made in this section contain forward-looking information and readers are cautioned that actual outcomes may vary. Please see “Cautionary Note Regarding Forward-Looking Statements” for material risks, assumptions and important disclosures associated with this information. |
WHEATON PRECIOUS METALS 2026 SECOND QUARTER REPORT - MANAGEMENT DISCUSSION & ANALYSIS [34]
| m. | Cotabambas – reduced to 16.67% once the Company has received 90 million silver equivalent ounces. |
| n. | Spring Valley – reduced to 6% once the Company has received 300,000 ounces of gold. |
| o. | Hemlo – reduced to 6.75% once the Company has received 135,750 ounces of gold (the “First Dropdown Threshold”), with a further reduction to 4.5% once the Company has received an additional 117,998 ounces of gold (the “Second Dropdown Threshold”), at which point this rate will apply for the life of the mine. Each of the First Dropdown Threshold and the Second Dropdown Threshold will be subject to adjustment if there are delays in deliveries relative to an agreed schedule, and commencing in 2033, if deliveries fall behind the agreed schedule by 10,000 ounces or more, the stream percentage will be increased by 5% until deliveries catch up with the agreed schedule. The payable gold will be reduced by half with respect to gold production from certain claims comprising the Interlake deposit. |
| p. | Jervois – reduced to 37.5% once the Company has received 45,000 ounces of gold (the “First Dropdown Threshold”), with a further reduction to 25% once the Company has received an additional 15,000 ounces of gold (the “Second Dropdown Threshold”), at which point this rate will apply for the life of the mine. Each of the First Dropdown Threshold and the Second Dropdown Threshold will be subject to adjustment if there are delays in deliveries relative to an agreed schedule. |
| 6) | On October 21, 2024, the Company amended the Fenix PMPA. Under the original agreement, the Company was to acquire an amount of gold equal to 6% of the gold production until 90,000 ounces have been delivered, 4% of the gold production until the delivery of a further 140,000 ounces and 3.5% gold production thereafter for the life of mine. Under the revised agreement, the Company is entitled to purchase an additional 16% of payable gold production (22% in total) (subject to adjustment if there are delays in deliveries relative to an agreed schedule). Once Rio2 delivers the incremental 95,000 ounces (as adjusted), the stream reverts to the percentages and thresholds under the original Fenix PMPA (as described). Rio2 has a one-time option to terminate the requirement to deliver the incremental gold production from the end of 2027 until the end of 2029 by delivering 95,000 ounces (as adjusted) less previously delivered gold ounces, excluding those gold ounces which would have been delivered under the original Fenix PMPA. |
| 7) | On February 27, 2024, the Company closed the Orion Purchase Agreement to acquire the Platreef and Kudz Ze Kayah PMPAs. |
| 8) | Until October 23, 2029, there is a price adjustment mechanism under the Koné PMPA: |
| a. | if the spot price of gold is less than $2,100 per ounce, the Company will pay 20% of $2,100 less 25% of the difference between $2,100 and $1,800, less 30% of the difference between $1,800 and the spot price of gold; and |
| b. | if the spot price is greater than $2,700 per ounce, the Company will pay 25% of the difference between $3,000 and $2,700, plus 30% of the difference between the actual spot price of gold and $3,000. |
Per Ounce Cash Payment for Silver
| Mineral Stream Interests |
Attributable Payable Production to be Purchased |
Per Ounce Cash Payment 1 |
Term of Agreement |
Date of |
||||||||
| Peñasquito |
25% | $4.62 | Life of Mine | 24-Jul-07 | ||||||||
| Constancia |
100% | $6.32 ² | Life of Mine | 8-Aug-12 | ||||||||
| Antamina |
67.5% 5 | 20% | Life of Mine | 3-Nov-15 | ||||||||
| Blackwater |
50% 5 | 18% 7 | Life of Mine | 13-Dec-21 | ||||||||
| Other |
||||||||||||
| Los Filos |
100% | $4.81 | 25 years | 15-Oct-04 | ||||||||
| Zinkgruvan |
100% | $4.81 | Life of Mine | 8-Dec-04 | ||||||||
| Stratoni |
100% | $11.54 | Life of Mine | 23-Apr-07 | ||||||||
| Neves-Corvo |
100% | $4.60 | 50 years | 5-Jun-07 | ||||||||
| Aljustrel |
100% ³ | 50% | 50 years | 5-Jun-07 | ||||||||
| El Alto |
25% | $3.90 | Life of Mine | 8-Sep-09 | ||||||||
| Copper World |
100% | $3.90 | Life of Mine | 10-Feb-10 | ||||||||
| Loma de La Plata |
12.5% | $4.00 | Life of Mine | n/a | 4 | |||||||
| Marmato |
100% 5 | 18% 6 | Life of Mine | 5-Nov-20 | ||||||||
| Cozamin |
50% 5 | 10% | Life of Mine | 11-Dec-20 | ||||||||
| El Domo |
75% | 18% 6 | Life of Mine | 17-Jan-22 | ||||||||
| Mineral Park |
100% | 18% 6 | Life of Mine | 24-Oct-23 | ||||||||
| Kudz Ze Kayah |
7.375% 5 | 20% | Life of Mine | 22-Dec-21 | 7 | |||||||
| Jervois |
75% 5 | 20% | Life of Mine | 1-Apr-26 | ||||||||
| Early Deposit |
||||||||||||
| Toroparu |
50% | $3.90 | Life of Mine | 11-Nov-13 | ||||||||
| Cotabambas |
100% 5 | $5.90 | Life of Mine | 21-Mar-16 | ||||||||
| Kutcho |
100% | 20% | Life of Mine | 14-Dec-17 | ||||||||
| 1) | The production payment is measured as either a fixed amount per unit of silver delivered, or as a percentage of the spot price of silver on the date of delivery. Contracts where the payment is a fixed amount per ounce of silver delivered are subject to an annual inflationary increase, with the exception of Loma de La Plata. Additionally, should the prevailing market price for silver be lower than this fixed amount, the per ounce cash payment will be reduced to the prevailing market price, subject to an annual inflationary factor. |
| 2) | Subject to an increase to $9.90 per ounce of silver after the initial 40-year term. |
| 3) | Wheaton only has the rights to silver contained in concentrate containing less than 15% copper at the Aljustrel mine. |
| 4) | Terms of the agreement not yet finalized. |
| 5) | Under certain PMPAs, the Company’s attributable silver percentage will be reduced once certain thresholds are achieved: |
| a. | Antamina – reduced to 45%, comprised of 22.5% once the Company has received 140 million ounces of silver under the Glencore Antamina PMPA and 22.5% once the Company has received 100 million ounces of silver under the BHP Antamina PMPA, respectively. |
| b. | Blackwater – reduced to 33% once the Company has received 17.8 million ounces of silver. |
| c. | Marmato – reduced to 50% once the Company has received 2.15 million ounces of silver. |
| d. | Cozamin – reduced to 33% once the Company has received 10 million ounces of silver. |
| e. | Cotabambas – reduced to 66.67% once the Company has received 90 million silver equivalent ounces. |
| f. | Kudz Ze Kayah - reduced to 6.125% once the Company has received 43.30 million ounces of silver, with a further reduction to 5.5% until the Company has received an additional 7.96 million ounces of silver, with a further reduction to 5.5% until the Company has received an additional 35.34 million ounces of silver, thereafter increased to 6.75%. |
| g. | Jervois – reduced to 37.5% once the Company has received 4.3 million ounces (“Moz”) of silver (the “First Dropdown Threshold”), with a further reduction to 25% once the Company has received an additional 1.7 Moz of silver (the “Second Dropdown Threshold”), at which point this rate will apply for the life of the mine. Each of the First Dropdown Threshold and the Second Dropdown Threshold will be subject to adjustment if there are delays in deliveries relative to an agreed schedule. |
| 6) | To be increased to 22% once the total market value of all metals delivered to the Company, net of the per ounce cash payment, exceeds the initial upfront cash deposit. |
| 7) | On February 27, 2024, the Company closed the Orion Purchase Agreement to acquire the Platreef and Kudz Ze Kayah PMPAs. |
WHEATON PRECIOUS METALS 2026 SECOND QUARTER REPORT - MANAGEMENT DISCUSSION & ANALYSIS [35]
Per Ounce Cash Payment for Palladium and Platinum and Per Pound for Cobalt
| Mineral Stream Interests | Attributable Payable Production to be Purchased |
Per Unit of Measurement Cash Payment 1 |
Term of Agreement |
Date of Original Contract |
||||||
| Palladium |
||||||||||
| Stillwater |
4.5% ² | 18% ³ | Life of Mine | 16-Jul-18 | ||||||
| Platreef |
5.25% ² | 30% ² | Life of Mine ² | 7-Dec-21 | 4 | |||||
| Platinum |
||||||||||
| Marathon |
22% ² | 18% ³ | Life of Mine | 26-Jan-22 | ||||||
| Platreef |
5.25% ² | 30% ² | Life of Mine ² | 7-Dec-21 | 4 | |||||
| Cobalt |
||||||||||
| Voisey’s Bay |
42.4% ² | 18% ³ | Life of Mine | 11-Jun-18 | ||||||
| 1) | The production payment is measured as either a fixed amount per unit of metal delivered, or as a percentage of the spot price of the underlying metal on the date of delivery. |
| 2) | Under certain PMPAs, the Company’s attributable metal percentage will be reduced once certain thresholds are achieved: |
| a. | Stillwater – reduced to 2.25% once the Company has received 375,000 ounces of palladium, with a further reduction to 1% once the Company has received 550,000 ounces. |
| b. | Platreef – reduced to 3% once the Company has received 350,000 ounces of combined palladium and platinum, with a further reduction to 0.1% once the Company has received a combined 485,115 ounces, at which point the per ounce cash payment increases to 80% of the spot price of palladium and platinum. If certain thresholds are met, including if production through the Platreef project concentrator achieves 5.5 Mtpa, the 0.1% residual palladium and platinum stream will terminate. |
| c. | Marathon – reduced to 15% once the Company has received 120,000 ounces of platinum. |
| d. | Voisey’s Bay – reduced to 21.2% once the Company has received 31 million pounds of cobalt. |
| 3) | To be increased to 22% once the market value of all metals delivered to Wheaton, net of the per unit cash payment, exceeds the initial upfront cash deposit. |
| 4) | On February 27, 2024, the Company closed the Orion Purchase Agreement to acquire the Platreef and Kudz Ze Kayah PMPAs. |
Other Contractual Obligations and Commitments
| Projected Payment Dates 1 | ||||||||||||||||||||
| (in thousands) | 2026 | 2027 - 2028 | 2029 - 2030 | After 2030 | Total | |||||||||||||||
| Bank debt 2 |
$ | - | $ | 1,500,000 | $ | - | $ | 472,000 | $ | 1,972,000 | ||||||||||
| Interest 3 |
49,411 | 161,628 | 34,191 | - | 245,230 | |||||||||||||||
| Payments for mineral stream interests, early deposit mineral stream interest & royalties |
||||||||||||||||||||
| Salobo |
- | 8,000 | 16,000 | 56,000 | 80,000 | |||||||||||||||
| Copper World 4 |
- | 231,151 | - | - | 231,151 | |||||||||||||||
| Marmato |
41,968 | - | - | - | 41,968 | |||||||||||||||
| Santo Domingo |
- | 290,000 | - | - | 290,000 | |||||||||||||||
| El Domo |
43,875 | 87,750 | - | - | 131,625 | |||||||||||||||
| Marathon |
- | 98,522 | 42,224 | - | 140,746 | |||||||||||||||
| Cangrejos |
- | - | 168,840 | - | 168,840 | |||||||||||||||
| Curraghinalt |
- | - | - | 55,000 | 55,000 | |||||||||||||||
| Loma de La Plata |
- | - | - | 32,400 | 32,400 | |||||||||||||||
| Spring Valley |
210,000 | 360,000 | - | - | 570,000 | |||||||||||||||
| Kudz Ze Kayah |
- | 15,000 | - | - | 15,000 | |||||||||||||||
| Jervois |
16,000 | 243,000 | - | - | 259,000 | |||||||||||||||
| Cotabambas |
- | - | - | 126,000 | 126,000 | |||||||||||||||
| Toroparu |
- | - | - | 138,000 | 138,000 | |||||||||||||||
| Kutcho |
- | - | - | 58,000 | 58,000 | |||||||||||||||
| Spanish Mountain |
- | 32,500 | - | - | 32,500 | |||||||||||||||
| Cipango |
- | 3,000 | - | - | 3,000 | |||||||||||||||
| Equity Investment Commitment(s) |
23,115 | - | - | - | 23,115 | |||||||||||||||
| Leases liabilities |
516 | 2,010 | 2,099 | 4,797 | 9,422 | |||||||||||||||
| Total contractual obligations |
$ | 384,885 | $ | 3,032,561 | $ | 263,354 | $ | 942,197 | $ | 4,622,997 | ||||||||||
| 1) | Projected payment date based on management estimate. Dates may be updated in the future as additional information is received. |
| 2) | At June 30, 2026, the Company had $472 million and $1.5 billion drawn and outstanding on the Revolving Credit Facility and the Term Loan, respectively. |
| 3) | As the applicable interest rates are floating in nature, the interest charges are estimated based on market-based forward interest rate curves at the end of the reporting period combined with the assumption that the principal balance outstanding at June 30, 2026 does not change until the debt maturity date. |
| 4) | Figure includes contingent transaction costs of $1 million. |
WHEATON PRECIOUS METALS 2026 SECOND QUARTER REPORT - MANAGEMENT DISCUSSION & ANALYSIS [36]
Salobo
The Company will be required to make annual payments of $8 million over a 10-year period, if the Salobo mine implements a high-grade mine plan. Payments will be made for each year in which the high-grade plan is achieved.
Copper World Complex
The Company is committed to pay Hudbay total upfront cash payments of $230 million in two installments, with the first $50 million being advanced upon Hudbay’s receipt of permitting for the Copper World Complex and other customary conditions and the balance of $180 million being advanced once project costs incurred on the Copper World Complex exceed $98 million and certain other customary conditions. Under the Copper World Complex PMPA, the Company is permitted to elect to pay the deposit in cash or the delivery of common shares. Additionally, the Company will be entitled to certain delay payments, including where construction ceases in any material respect, or if completion is not achieved within agreed upon timelines.
Marmato
Under the terms of the Marmato PMPA, the Company is committed to pay Aris Mining additional upfront cash payments of $42 million, payable during the construction of the Marmato Lower Mine development portion of the Marmato mine, subject to customary conditions.
Santo Domingo
The Company is committed to pay Capstone total upfront cash payments of $290 million, which is payable during the construction of the Santo Domingo project, subject to customary conditions being satisfied, including Capstone attaining sufficient financing to cover total expected capital expenditures.
El Domo
Under the terms of the El Domo PMPA, the Company is committed to pay additional upfront cash payments of $131.6 million, which includes $0.25 million which will be paid to support certain local community development initiatives around the El Domo project. The payments will be payable in three staged installments during construction, subject to various customary conditions being satisfied.
Marathon
Under the terms of the Marathon PMPA, the Company is committed to pay additional upfront cash payments of $141 million (Cdn$200 million), which is to be paid in four staged installments during construction of the Marathon project, subject to various customary conditions being satisfied.
Cangrejos
Under the terms of the Cangrejos PMPA, the Company is committed to pay additional upfront consideration of $169 million, which is to be paid in two staged equal installments during construction of the mine, subject to various customary conditions being satisfied.
Curraghinalt
Under the terms of the Curraghinalt PMPA, the Company is committed to pay additional upfront cash payments of $55 million to be paid to an affiliate of Dalradian Gold during construction of the Curraghinalt project.
Loma de La Plata
Under the terms of the Loma de La Plata PMPA, the Company is committed to pay Pan American Silver Corp. (“PAAS”) total upfront cash payments of $32 million following the satisfaction of certain conditions, including PAAS receiving all necessary permits to proceed with the mine construction and the Company finalizing the definitive terms of the PMPA.
Spring Valley
Under the terms of the Spring Valley PMPA, the Company is committed to pay Waterton Gold Corp. (“Waterton Gold”) additional upfront cash payments of $570 million in installments as various conditions are satisfied. The Company has also provided a cost overrun facility (the “Spring Valley Facility”) of up to $150 million, accessible during an availability period commencing once the full upfront consideration has been paid under the Spring Valley PMPA. The Spring Valley Facility has a maturity date of three years following the first drawdown under the Spring Valley Facility.
Mineral Park
The Company has entered into a loan agreement to provide a secured debt facility of up to $25 million to Origin Mining Company, LLC, the Mineral Park owner and affiliate of Waterton Copper, to help support the mine construction, if necessary, once the full upfront consideration under the stream has been paid. On April 2, 2026, $10 million was advanced under this facility, with a further $15 million being advanced on July 23, 2026.
WHEATON PRECIOUS METALS 2026 SECOND QUARTER REPORT - MANAGEMENT DISCUSSION & ANALYSIS [37]
Kudz Ze Kayah
Under the terms of the amended KZK PMPA, an additional $15 million contingency payment is due to BMC if the KZK project achieves certain permitting milestones.
Jervois
Under the terms of the Jervois PMPA, the Company is committed to pay additional upfront cash payments of $259 million. Of this amount, $16 million is to be paid once certain conditions are satisfied, with the payment expected to be made in Q3-2026, while the remaining balance of $243 million will be paid in four equal installments over the construction period as various conditions are satisfied.
Cotabambas
Under the terms of the Cotabambas Early Deposit Agreement, the Company is committed to pay Panoro Minerals Ltd. additional upfront cash payments of $126 million. Following the delivery of a bankable definitive feasibility study, environmental study and impact assessment, and other related documents (collectively, the “Cotabambas Feasibility Documentation”), and receipt of permits and construction commencing, the Company may then advance the remaining deposit or elect to terminate the Cotabambas Early Deposit Agreement. If the Company elects to terminate, the Company will be entitled to a return of the portion of the amounts advanced less $2 million payable upon certain triggering events occurring.
Toroparu
Under the terms of the Toroparu Early Deposit Agreement, the Company is committed to pay a subsidiary of Aris Mining an additional $138 million, payable on an installment basis to partially fund construction of the mine. Aris Mining is to deliver certain feasibility documentation. Prior to the delivery of this feasibility documentation, Wheaton may elect to (i) not proceed with the agreement or (ii) not pay the balance of the upfront consideration and reduce the gold stream percentage from 10% to 0.909% and the silver stream percentage from 50% to nil. If option (i) is chosen, Wheaton will be entitled to a return of the amounts advanced less $2 million. If Wheaton elects option (ii), Aris Mining may elect to terminate the agreement and Wheaton will be entitled to a return of the amount of the deposit already advanced less $2 million.
Kutcho
Under the terms of the Kutcho Early Deposit Agreement, the Company is committed to pay Kutcho additional upfront cash payments of $58 million, which will be advanced on an installment basis to partially fund construction of the mine once certain conditions have been satisfied.
Spanish Mountain Royalty
Under the terms of the Spanish Mountain Royalty, the Company is committed to pay Spanish Mountain Gold Limited an additional $32.5 million, comprised of a $12.5 million payment due after 60,000 meters of drilling and a $20 million payment due upon receiving approval under the Environmental Assessment Act (British Columbia) for the construction and operation of the project.
Cipango Royalty
Under the terms of the Cipango Royalty, the Company is committed to pay Cipango Limited an additional payment of $3 million due upon completion of a geochemical survey with respect to any project.
Tax Contingencies
Due to the size, complexity and nature of the Company’s operations, various legal and tax matters are outstanding from time to time, including audits and disputes.
It is not known or determinable by the Company when any ongoing audits by CRA of international and domestic transactions will be completed, or whether reassessments will be issued, or the basis, quantum or timing of any such potential reassessments, and it is therefore not practicable for the Company to estimate the financial effect, if any, of any ongoing audits. From time to time there may also be proposed legislative changes to law or outstanding legal actions that may have an impact on the current or prior periods, the outcome, applicability and impact of which is also not known or determinable by the Company.
General
By their nature, contingencies will only be resolved when one or more future events occur or fail to occur. The assessment of contingencies inherently involves the exercise of significant judgment and estimates of the outcome of future events. If the Company is unable to resolve any of these matters favorably, there may be a material adverse impact on the Company’s financial performance, cash flows or results of operations. In the event that the Company’s estimate of the future resolution of any of the foregoing matters changes, the Company will recognize the effects of the change in its consolidated financial statements in the appropriate period relative to when such change occurs.
WHEATON PRECIOUS METALS 2026 SECOND QUARTER REPORT - MANAGEMENT DISCUSSION & ANALYSIS [38]
Share Capital
During the three months ended June 30, 2026, the Company received proceeds of $1 million from the exercise of 17,046 share purchase options at a weighted average exercise price of Cdn$65.22 per option (six months - $2 million from the exercise of 34,110 share purchase options at a weighted average exercise price of Cdn$62.43). During the three months ended June 30, 2025, a total of 50,229 share purchase options were exercised at a weighted average exercise price of Cdn$54.62 per option, resulting in total cash proceeds to the Company in the amount of $2 million (six months - $4 million from the exercise of 112,270 share purchase options at a weighted average exercise price of Cdn$55.33).
During the three months ended June 30, 2026, the Company released 370 RSUs (six months - 46,812 RSUs). During the three months ended June 30, 2025, the Company released 72,396 RSUs (six months - 141,525 RSUs).
The Company has implemented a dividend reinvestment plan (“DRIP”) whereby shareholders can elect to have dividends reinvested directly into additional Wheaton common shares. During the six months ended June 30, 2026, there were 45,216 common shares issued under the DRIP, with all the shares being issued during the three months ended June 30, 2026. During the six months ended June 30, 2025, there were 23,208 common shares issued under the DRIP, with all the shares being issued during the three months ended June 30, 2025.
As of August 6, 2026, there were 454,159,968 outstanding common shares, 1,095,850 share purchase options and 225,407 restricted share units.
Financial Instruments
The Company owns equity interests in several companies as long-term investments (see page 13 of this MD&A) and therefore is inherently exposed to various risk factors including currency risk, market price risk and liquidity risk.
In order to mitigate the effect of short-term volatility in gold, silver and palladium prices, the Company will occasionally enter into forward contracts in relation to gold, silver and palladium deliveries that it is highly confident will occur within a given quarter. The Company does not hedge its long-term exposure to commodity prices. The Company has not used derivative financial instruments to manage the risks associated with its operations and therefore, in the normal course of business, it is inherently exposed to currency, interest rate and commodity price fluctuations. Refer to Note 5 to the consolidated financial statements for further information.
Future Changes to Accounting Policies
IFRS 18 - Presentation and Disclosure in Financial Statements.
In April 2024, IFRS 18 Presentation and Disclosure in Financial Statements was issued. IFRS 18 replaces IAS 1 Presentation of Financial Statements while carrying forward many of the requirements in IAS 1. IFRS 18 introduces new requirements to: i) present specified categories and defined subtotals in the statement of earnings, ii) provide disclosures on management-defined performance measures (MPMs) in the notes to the financial statements, iii) improve aggregation and disaggregation. Some of the requirements in IAS 1 are moved to IAS 8 Accounting Policies, Changes in Accounting Estimates and Errors and IFRS 7 Financial Instruments: Disclosures. There were also minor amendments to IAS 7 Statement of Cash Flows and IAS 33 Earnings per Share in connection with the new standard. IFRS 18 requires retrospective application with specific transition provisions. The Company is required to apply IFRS 18 for annual reporting periods beginning on or after January 1, 2027 with early adoption permitted. The Company is currently evaluating the impact of IFRS 18 on its financial statements.
WHEATON PRECIOUS METALS 2026 SECOND QUARTER REPORT - MANAGEMENT DISCUSSION & ANALYSIS [39]
Non-GAAP Measures
Wheaton has included, throughout this document, certain non-GAAP performance measures, including (i) adjusted net earnings and adjusted net earnings per share; (ii) operating cash flow per share (basic and diluted); (iii) average cash costs of gold, silver and palladium on a per ounce basis and cobalt on a per pound basis; (iv) cash operating margin, and (v) net debt.
These non-GAAP measures do not have any standardized meaning prescribed by IFRS Accounting Standards, and other companies may calculate these measures differently. The presentation of these non-GAAP measures is intended to provide additional information and should not be considered in isolation or as a substitute for measures of performance prepared in accordance with IFRS Accounting Standards.
| i. | Adjusted net earnings and adjusted net earnings per share are calculated by removing the effects of non-cash impairment charges (reversals) (if any), non-cash fair value (gains) losses and the non-cash accretion of interest on the 777 PMPA refundable deposit as well as the reversal of non-cash income tax expense (recovery) which is offset by income tax expense (recovery) recognized in the Statements of Shareholders’ Equity and OCI, respectively. The Company believes that, in addition to conventional measures prepared in accordance with IFRS Accounting Standards, management and certain investors use this information to evaluate the Company’s performance. |
The following table provides a reconciliation of adjusted net earnings and adjusted net earnings per share (basic and diluted).
| Three Months Ended June 30 |
Six Months Ended June 30 |
|||||||||||||||
| (in thousands, except for per share amounts) | 2026 | 2025 | 2026 | 2025 | ||||||||||||
| Net earnings |
$ | 543,236 | $ | 292,270 | $ | 1,125,280 | $ | 546,254 | ||||||||
| Add back (deduct): |
||||||||||||||||
| (Gain) loss on fair value adjustment of share purchase warrants held |
(492) | (2,134) | 436 | (2,757) | ||||||||||||
| Deferred income tax (expense) recovery recognized in the Statement of OCI |
- | (3,945) | - | (6,295) | ||||||||||||
| Interest accretion on the 777 refundable deposit |
(202) | (187) | (401) | (372) | ||||||||||||
| Adjusted net earnings |
$ | 542,542 | $ | 286,004 | $ | 1,125,315 | $ | 536,830 | ||||||||
| Divided by: |
||||||||||||||||
| Basic weighted average number of shares outstanding |
454,133 | 453,889 | 454,089 | 453,791 | ||||||||||||
| Diluted weighted average number of shares outstanding |
454,991 | 454,663 | 454,973 | 454,550 | ||||||||||||
| Equals: |
||||||||||||||||
| Adjusted earnings per share - basic |
$ | 1.195 | $ | 0.630 | $ | 2.478 | $ | 1.183 | ||||||||
| Adjusted earnings per share - diluted |
$ | 1.192 | $ | 0.629 | $ | 2.473 | $ | 1.181 | ||||||||
WHEATON PRECIOUS METALS 2026 SECOND QUARTER REPORT - MANAGEMENT DISCUSSION & ANALYSIS [40]
| ii. | Operating cash flow per share (basic and diluted) is calculated by dividing cash generated by operating activities by the weighted average number of shares outstanding (basic and diluted). The Company presents operating cash flow per share as management and certain investors use this information to evaluate the Company’s performance in comparison to other companies in the precious metal mining industry who present results on a similar basis. |
The following table provides a reconciliation of operating cash flow per share (basic and diluted).
| Three Months Ended June 30 |
Six Months Ended June 30 |
|||||||||||||||
| (in thousands, except for per share amounts) | 2026 | 2025 | 2026 | 2025 | ||||||||||||
| Cash generated by operating activities |
$ | 649,518 | $ | 414,959 | $ | 1,415,340 | $ | 775,752 | ||||||||
| Divided by: |
||||||||||||||||
| Basic weighted average number of shares outstanding |
454,133 | 453,889 | 454,089 | 453,791 | ||||||||||||
| Diluted weighted average number of shares outstanding |
454,991 | 454,663 | 454,973 | 454,550 | ||||||||||||
| Equals: |
||||||||||||||||
| Operating cash flow per share - basic |
$ | 1.430 | $ | 0.914 | $ | 3.117 | $ | 1.709 | ||||||||
| Operating cash flow per share - diluted |
$ | 1.428 | $ | 0.913 | $ | 3.111 | $ | 1.707 | ||||||||
WHEATON PRECIOUS METALS 2026 SECOND QUARTER REPORT - MANAGEMENT DISCUSSION & ANALYSIS [41]
| iii. | Average cash cost of gold, silver and palladium on a per ounce basis and cobalt on a per pound basis is calculated by dividing the total cost of sales, less depletion and cost of sales related to delay ounces, by the ounces or pounds sold. In the precious metal mining industry, this is a common performance measure but does not have any standardized meaning prescribed by IFRS Accounting Standards. In addition to conventional measures prepared in accordance with IFRS Accounting Standards, management and certain investors use this information to evaluate the Company’s performance and ability to generate cash flow. |
The following table provides a calculation of average cash cost of gold, silver and palladium on a per ounce basis and cobalt on a per pound basis.
| Three Months Ended June 30 |
Six Months Ended June 30 |
|||||||||||||||
| (in thousands, except for gold and palladium ounces sold and per unit amounts) |
2026 | 2025 | 2026 | 2025 | ||||||||||||
| Cost of sales |
$ | 241,345 | $ | 150,171 | $ | 443,440 | $ | 301,500 | ||||||||
| Less: depletion |
(122,502) | (75,002) | (199,354) | (151,695) | ||||||||||||
| Less: cost of sales related to delay ounces 1 |
- | (1,009) | (1,514) | (1,873) | ||||||||||||
| Cash cost of sales |
$ | 118,843 | $ | 74,160 | $ | 242,572 | $ | 147,932 | ||||||||
| Cash cost of sales is comprised of: |
||||||||||||||||
| Total cash cost of gold sold |
$ | 52,210 | $ | 46,517 | $ | 105,086 | $ | 96,028 | ||||||||
| Total cash cost of silver sold |
62,413 | 25,934 | 130,751 | 49,122 | ||||||||||||
| Total cash cost of palladium sold |
547 | 450 | 1,448 | 873 | ||||||||||||
| Total cash cost of cobalt sold |
3,673 | 1,259 | 5,287 | 1,909 | ||||||||||||
| Total cash cost of sales |
$ | 118,843 | $ | 74,160 | $ | 242,572 | $ | 147,932 | ||||||||
| Divided by: |
||||||||||||||||
| Total gold ounces sold |
96,099 | 98,973 | 191,171 | 210,270 | ||||||||||||
| Total silver ounces sold |
6,522 | 4,868 | 11,571 | 9,351 | ||||||||||||
| Total palladium ounces sold |
2,069 | 2,575 | 4,975 | 5,032 | ||||||||||||
| Total cobalt pounds sold |
705 | 353 | 1,014 | 618 | ||||||||||||
| Equals: |
||||||||||||||||
| Average cash cost of gold (per ounce) |
$ | 543 | $ | 470 | $ | 550 | $ | 457 | ||||||||
| Average cash cost of silver (per ounce) |
$ | 9.57 | $ | 5.33 | $ | 11.30 | $ | 5.25 | ||||||||
| Average cash cost of palladium (per ounce) |
$ | 264 | $ | 175 | $ | 291 | $ | 174 | ||||||||
| Average cash cost of cobalt (per pound) |
$ | 5.21 | $ | 3.57 | $ | 5.21 | $ | 3.09 | ||||||||
| 1) | The cost of sales related to delay ounces is a non-cash expense (see footnote 3 on page 9 of this MD&A for more information). |
WHEATON PRECIOUS METALS 2026 SECOND QUARTER REPORT - MANAGEMENT DISCUSSION & ANALYSIS [42]
| iv. | Cash operating margin is calculated by adding back depletion and the cost of sales related to delay ounces to the gross margin. Cash operating margin on a per ounce or per pound basis is calculated by dividing the cash operating margin by the number of ounces or pounds sold during the period. The Company presents cash operating margin as management and certain investors use this information to evaluate the Company’s performance in comparison to other companies in the precious metal mining industry who present results on a similar basis as well as to evaluate the Company’s ability to generate cash flow. |
The following table provides a reconciliation of cash operating margin.
| Three Months Ended June 30 |
Six Months Ended June 30 |
|||||||||||||||
| (in thousands, except for gold and palladium ounces sold and per unit amounts) | 2026 | 2025 | 2026 | 2025 | ||||||||||||
| Gross margin |
$ | 687,856 | $ | 353,047 | $ | 1,387,230 | $ | 672,129 | ||||||||
| Add back: depletion |
122,502 | 75,002 | 199,354 | 151,695 | ||||||||||||
| Add back: cost of sales related to delay ounces 1 |
- | 1,009 | 1,514 | 1,873 | ||||||||||||
| Cash operating margin |
$ | 810,358 | $ | 429,058 | $ | 1,588,098 | $ | 825,697 | ||||||||
| Cash operating margin is comprised of: |
||||||||||||||||
| Total cash operating margin of gold sold |
$ | 375,575 | $ | 281,837 | $ | 783,737 | $ | 552,021 | ||||||||
| Total cash operating margin of silver sold |
416,345 | 139,805 | 774,777 | 261,555 | ||||||||||||
| Total cash operating margin of palladium sold |
2,410 | 2,114 | 6,418 | 4,063 | ||||||||||||
| Total cash operating margin of cobalt sold |
16,028 | 5,302 | 23,166 | 8,058 | ||||||||||||
| Total cash operating margin |
$ | 810,358 | $ | 429,058 | $ | 1,588,098 | $ | 825,697 | ||||||||
| Divided by: |
||||||||||||||||
| Total gold ounces sold |
96,099 | 98,973 | 191,171 | 210,270 | ||||||||||||
| Total silver ounces sold |
6,522 | 4,868 | 11,571 | 9,351 | ||||||||||||
| Total palladium ounces sold |
2,069 | 2,575 | 4,975 | 5,032 | ||||||||||||
| Total cobalt pounds sold |
705 | 353 | 1,014 | 618 | ||||||||||||
| Equals: |
||||||||||||||||
| Cash operating margin per gold ounce sold |
$ | 3,908 | $ | 2,847 | $ | 4,100 | $ | 2,624 | ||||||||
| Cash operating margin per silver ounce sold |
$ | 63.84 | $ | 28.72 | $ | 66.96 | $ | 27.97 | ||||||||
| Cash operating margin per palladium ounce sold |
$ | 1,165 | $ | 821 | $ | 1,290 | $ | 807 | ||||||||
| Cash operating margin per cobalt pound sold |
$ | 22.75 | $ | 15.04 | $ | 22.87 | $ | 13.06 | ||||||||
| 1) | The cost of sales related to delay ounces is a non-cash expense (see footnote 3 on page 9 of this MD&A for more information). |
| v. | Net debt is calculated by subtracting cash and cash equivalents from the outstanding bank debt under the Revolving Credit Facility and the Term Loan. The Company presents net debt as management and certain investors use this information to evaluate the Company’s liquidity and financial position. |
The following table provides a calculation of the Company’s net debt.
| As at June 30 |
As at December 31 |
|||||||
| (in thousands) |
2026 | 2025 | ||||||
| Bank debt |
$ | 1,969,282 | $ | - | ||||
| Less: cash and cash equivalents |
(100,192) | (1,153,593 | ) | |||||
| Net debt (net cash) |
$ | 1,869,090 | $ | (1,153,593 | ) | |||
WHEATON PRECIOUS METALS 2026 SECOND QUARTER REPORT - MANAGEMENT DISCUSSION & ANALYSIS [43]
Subsequent Events
Declaration of Dividend
On August 6, 2026, the Board of Directors declared a dividend in the amount of $0.195 per common share, with this dividend being payable to shareholders of record on August 20, 2026 and is expected to be distributed on or about September 3, 2026. The Company has implemented a dividend reinvestment plan (“DRIP”) whereby shareholders can elect to have dividends reinvested directly into additional Wheaton common shares based on the Average Market Price, as defined in the DRIP.
Controls and Procedures
Disclosure Controls and Procedures
Management is responsible for establishing and maintaining adequate internal control over financial reporting and disclosure controls and procedures, as those terms are defined in National Instrument 52-109 – Certification of Disclosure in Issuers’ Annual and Interim Filings, for the Company.
Together, the internal control frameworks provide internal control over financial reporting and disclosure. Due to its inherent limitations, internal control over financial reporting and disclosure may not prevent or detect all misstatements. Further, the effectiveness of internal control is subject to the risk that controls may become inadequate because of changes in conditions, or that the degree of compliance with policies or procedures may change.
There were no changes in the Company’s internal controls over financial reporting during the six months ended June 30, 2026 that have materially affected, or are reasonably likely to materially affect, the internal controls over financial reporting.
Under the supervision and with the participation of management, including the Chief Executive Officer and Chief Financial Officer, management will continue to monitor and evaluate the design and effectiveness of its internal control over financial reporting and disclosure controls and procedures, and may make modifications from time to time as considered necessary.
Limitation of Controls and Procedures
The Company’s management, including its Chief Executive Officer and Chief Financial Officer, believe that any disclosure controls and procedures or internal control over financial reporting, no matter how well conceived and operated, can provide only reasonable, not absolute, assurance that the objectives of the control system are met. Further, the design of a control system must reflect the fact that there are resource constraints, and the benefits of controls must be considered relative to their costs. Because of the inherent limitations in all control systems, they cannot provide absolute assurance that all control issues and instances of fraud, if any, within the Company have been prevented or detected. These inherent limitations include the realities that judgments in decision-making can be faulty, and that breakdowns can occur because of simple error or mistake. Additionally, controls can be circumvented by the individual acts of some persons, by collusion of two or more people, or by unauthorized override of the controls. The design of any system of controls also is based in part upon certain assumptions about the likelihood of future events, and there can be no assurance that any design will succeed in achieving its stated goals under all potential future conditions. Accordingly, because of the inherent limitations in a cost effective control system, misstatements due to error or fraud may occur and not be detected.
Attributable Reserves and Resources
The following tables set forth the estimated Mineral Reserves and Mineral Resources (metals attributable to Wheaton only) for the mines relating to which the Company has PMPAs, adjusted where applicable to reflect the Company’s percentage entitlement to such metals, as of December 31, 2025, unless otherwise noted.
WHEATON PRECIOUS METALS 2026 SECOND QUARTER REPORT - MANAGEMENT DISCUSSION & ANALYSIS [44]
Mineral Reserves Attributable to Wheaton Precious Metals (1,2,3,8,41)
| December 31, 2025 (6) | December 31, 2024 | |||||||||||||||||||||||||||||||||||||||||||||||||||||
| Proven | Probable | Proven & Probable | Proven & Probable | |||||||||||||||||||||||||||||||||||||||||||||||||||
| Tonnage | Grade | Contained | Tonnage | Grade | Contained | Tonnage | Grade | Contained | Process Recovery % (7) |
Tonnage | Grade | Contained | ||||||||||||||||||||||||||||||||||||||||||
| Asset | Interest | Mt | g/t / % | Moz / Mlbs | Mt | g/t / % | Moz / Mlbs | Mt | g/t / % | Moz / Mlbs | Mt | g/t / % | Moz / Mlbs | |||||||||||||||||||||||||||||||||||||||||
| Gold |
||||||||||||||||||||||||||||||||||||||||||||||||||||||
| Black Pine Royalty (32) |
0.5% | - | - | - | 1.5 | 0.32 | 0.02 | 1.5 | 0.32 | 0.02 | 70% | 1.5 | 0.32 | 0.02 | ||||||||||||||||||||||||||||||||||||||||
| Blackwater (11,27) |
8% | 23.5 | 0.73 | 0.55 | 0.7 | 0.80 | 0.02 | 24.1 | 0.73 | 0.57 | 91% | 24.1 | 0.74 | 0.57 | ||||||||||||||||||||||||||||||||||||||||
| Cangrejos (11,31) |
4.4% | - | - | - | 29.0 | 0.55 | 0.51 | 29.0 | 0.55 | 0.51 | 85% | 43.5 | 0.55 | 0.76 | ||||||||||||||||||||||||||||||||||||||||
| Constancia |
50% | 229.9 | 0.04 | 0.27 | 14.2 | 0.03 | 0.02 | 244.0 | 0.04 | 0.28 | 61% | 258.5 | 0.04 | 0.34 | ||||||||||||||||||||||||||||||||||||||||
| Copper World Complex (21) |
100% | 319.4 | 0.03 | 0.27 | 65.7 | 0.02 | 0.04 | 385.1 | 0.02 | 0.31 | 60% | 385.1 | 0.02 | 0.31 | ||||||||||||||||||||||||||||||||||||||||
| Curraghinalt (11,33) |
3.05% | 0.002 | 9.14 | 0.001 | 0.4 | 6.43 | 0.08 | 0.4 | 6.45 | 0.08 | 94% | 0.4 | 6.45 | 0.08 | ||||||||||||||||||||||||||||||||||||||||
| DeLamar Royalty(37) |
1.5% | 0.2 | 0.40 | 0.002 | 1.6 | 0.32 | 0.02 | 1.8 | 0.33 | 0.02 | 72% | 1.4 | 0.40 | 0.02 | ||||||||||||||||||||||||||||||||||||||||
| El Domo (11,29) |
50% | 1.6 | 2.83 | 0.14 | 1.7 | 2.23 | 0.12 | 3.2 | 2.52 | 0.26 | 53% | 3.2 | 2.52 | 0.26 | ||||||||||||||||||||||||||||||||||||||||
| Fenix (11,26) |
22% | 8.3 | 0.50 | 0.13 | 6.8 | 0.45 | 0.10 | 15.1 | 0.48 | 0.23 | 75% | 15.1 | 0.48 | 0.23 | ||||||||||||||||||||||||||||||||||||||||
| Goose (11,30) |
2.78% | - | - | - | 0.3 | 6.79 | 0.07 | 0.3 | 6.79 | 0.07 | 93% | 0.3 | 6.82 | 0.07 | ||||||||||||||||||||||||||||||||||||||||
| Hemlo (11,41) |
10.13% | |||||||||||||||||||||||||||||||||||||||||||||||||||||
| Hemlo O/P |
- | - | - | 2.6 | 0.85 | 0.07 | 2.6 | 0.85 | 0.07 | 93% | 2.6 | 0.85 | 0.07 | |||||||||||||||||||||||||||||||||||||||||
| Hemlo Interlake |
- | - | - | 0.2 | 3.93 | 0.02 | 0.2 | 3.93 | 0.02 | 93% | 0.2 | 3.94 | 0.03 | |||||||||||||||||||||||||||||||||||||||||
| Hemlo Non-Interlake |
- | - | - | 0.8 | 3.67 | 0.10 | 0.8 | 3.67 | 0.10 | 93% | 0.7 | 3.63 | 0.09 | |||||||||||||||||||||||||||||||||||||||||
| Jervois (44) |
75.0% | 3.1 | 0.29 | 0.03 | 7.6 | 0.25 | 0.06 | 10.8 | 0.26 | 0.09 | 45% | - | - | - | ||||||||||||||||||||||||||||||||||||||||
| Koné (11,38) |
19.5% | - | - | - | 26.7 | 0.72 | 0.62 | 26.7 | 0.72 | 0.62 | 89% | 26.7 | 0.72 | 0.62 | ||||||||||||||||||||||||||||||||||||||||
| Kudz Ze Kayah (11,34) |
7.27% | - | - | - | 1.1 | 1.32 | 0.05 | 1.1 | 1.32 | 0.05 | 64% | 1.1 | 1.32 | 0.05 | ||||||||||||||||||||||||||||||||||||||||
| Kurmuk (11,39) |
6.7% | 1.5 | 1.51 | 0.07 | 2.6 | 1.35 | 0.11 | 4.1 | 1.41 | 0.18 | 92% | 4.1 | 1.41 | 0.18 | ||||||||||||||||||||||||||||||||||||||||
| Kutcho (12) |
100% | 6.8 | 0.37 | 0.08 | 10.6 | 0.39 | 0.13 | 17.4 | 0.38 | 0.21 | 41% | 17.4 | 0.38 | 0.21 | ||||||||||||||||||||||||||||||||||||||||
| Marathon (11,28) |
100% | 111.6 | 0.07 | 0.26 | 12.3 | 0.06 | 0.03 | 123.8 | 0.07 | 0.28 | 71% | 123.8 | 0.07 | 0.28 | ||||||||||||||||||||||||||||||||||||||||
| Marmato (11,15) |
10.5% | 0.2 | 4.31 | 0.03 | 3.0 | 3.07 | 0.30 | 3.2 | 3.16 | 0.33 | 90% | 3.2 | 3.16 | 0.33 | ||||||||||||||||||||||||||||||||||||||||
| Mt Todd Royalty (11,36) |
1% | 0.7 | 0.95 | 0.02 | 0.9 | 0.93 | 0.03 | 1.6 | 0.94 | 0.05 | 89% | 2.4 | 0.77 | 0.06 | ||||||||||||||||||||||||||||||||||||||||
| Platreef (11,35) |
62.5% | - | - | - | 72.3 | 0.29 | 0.67 | 72.3 | 0.29 | 0.67 | 79% | 72.3 | 0.29 | 0.67 | ||||||||||||||||||||||||||||||||||||||||
| Salobo (10) |
75% | 262.2 | 0.34 | 2.87 | 505.5 | 0.33 | 5.43 | 767.7 | 0.34 | 8.29 | 72% | 793.2 | 0.35 | 8.85 | ||||||||||||||||||||||||||||||||||||||||
| San Dimas (14) |
25% | 0.4 | 2.64 | 0.03 | 0.6 | 2.29 | 0.04 | 0.9 | 2.43 | 0.07 | 95% | 0.8 | 2.84 | 0.07 | ||||||||||||||||||||||||||||||||||||||||
| Santo Domingo (11,25) |
100% | 125.9 | 0.07 | 0.28 | 293.5 | 0.04 | 0.33 | 419.4 | 0.05 | 0.61 | 56% | 419.4 | 0.05 | 0.61 | ||||||||||||||||||||||||||||||||||||||||
| Spring Valley (11,42) |
8% | - | - | - | 22.3 | 0.43 | 0.31 | 22.3 | 0.43 | 0.31 | 78% | 22.3 | 0.43 | 0.31 | ||||||||||||||||||||||||||||||||||||||||
| Stillwater (13) |
100% | 7.9 | 0.39 | 0.10 | 37.1 | 0.36 | 0.43 | 45.0 | 0.37 | 0.53 | 69% | 44.5 | 0.36 | 0.52 | ||||||||||||||||||||||||||||||||||||||||
| Sudbury (11) |
70% | 12.0 | 0.45 | 0.17 | 9.3 | 0.38 | 0.11 | 21.2 | 0.42 | 0.29 | 75% | 28.0 | 0.26 | 0.24 | ||||||||||||||||||||||||||||||||||||||||
| Total Gold |
5.30 | 9.81 | 15.12 | 15.85 | ||||||||||||||||||||||||||||||||||||||||||||||||||
WHEATON PRECIOUS METALS 2026 SECOND QUARTER REPORT - MANAGEMENT DISCUSSION & ANALYSIS [45]
Mineral Reserves Attributable to Wheaton Precious Metals (Continued) (1,2,3,8,41)
| December 31, 2025 (6) | December 31, 2024 | |||||||||||||||||||||||||||||||||||||||||||||||||||||
| Proven | Probable | Proven & Probable | Proven & Probable | |||||||||||||||||||||||||||||||||||||||||||||||||||
| Tonnage | Grade | Contained | Tonnage | Grade | Contained | Tonnage | Grade | Contained | Process Recovery % (7) |
Tonnage | Grade | Contained | ||||||||||||||||||||||||||||||||||||||||||
| Asset | Interest | Mt | g/t / % | Moz / Mlbs | Mt | g/t / % | Moz / Mlbs | Mt | g/t / % | Moz / Mlbs | Mt | g/t / % | Moz / Mlbs | |||||||||||||||||||||||||||||||||||||||||
| Silver |
||||||||||||||||||||||||||||||||||||||||||||||||||||||
| Aljustrel (19) |
100% | 7.8 | 46.2 | 11.7 | 19.2 | 39.4 | 24.3 | 27.0 | 41.4 | 36.0 | 26% | 24.3 | 43.4 | 33.9 | ||||||||||||||||||||||||||||||||||||||||
| Antamina (10,11,18,43) |
67.5% | |||||||||||||||||||||||||||||||||||||||||||||||||||||
| Copper |
143.1 | 7.9 | 36.3 | 118.1 | 9.6 | 36.4 | 261.2 | 8.7 | 72.8 | 75% | 130.6 | 8.7 | 36.7 | |||||||||||||||||||||||||||||||||||||||||
| Copper-Zinc |
32.5 | 18.7 | 19.6 | 63.0 | 19.4 | 39.3 | 95.5 | 19.2 | 58.8 | 75% | 55.0 | 18.8 | 33.3 | |||||||||||||||||||||||||||||||||||||||||
| Blackwater (11,27) |
50% | 165.0 | 5.7 | 30.3 | 4.7 | 5.8 | 0.9 | 169.7 | 5.7 | 31.2 | 61% | 169.9 | 5.8 | 31.6 | ||||||||||||||||||||||||||||||||||||||||
| Constancia |
100% | 459.7 | 2.4 | 35.3 | 28.3 | 2.0 | 1.8 | 488.0 | 2.4 | 37.1 | 70% | 516.9 | 2.5 | 42.1 | ||||||||||||||||||||||||||||||||||||||||
| Copper World Complex (21) |
100% | 319.4 | 5.7 | 58.3 | 65.7 | 4.3 | 9.1 | 385.1 | 5.4 | 67.4 | 76% | 385.1 | 5.4 | 67.4 | ||||||||||||||||||||||||||||||||||||||||
| Cozamin (11,20) |
50% | |||||||||||||||||||||||||||||||||||||||||||||||||||||
| Copper |
0.0 | 38.0 | 0.0 | 2.8 | 40.6 | 3.6 | 2.8 | 40.6 | 3.7 | 86% | 3.5 | 41.8 | 4.7 | |||||||||||||||||||||||||||||||||||||||||
| Zinc |
- | - | - | 0.5 | 50.9 | 0.9 | 0.5 | 50.9 | 0.9 | 60% | 0.5 | 50.9 | 0.9 | |||||||||||||||||||||||||||||||||||||||||
| DeLamar Royalty (37) |
1.5% | 0.2 | 16.3 | 0.1 | 1.6 | 13.3 | 0.7 | 1.8 | 13.6 | 0.8 | 37% | 1.4 | 17.3 | 0.8 | ||||||||||||||||||||||||||||||||||||||||
| El Domo (11,29) |
75% | 2.4 | 41.4 | 3.1 | 2.5 | 49.7 | 4.0 | 4.9 | 45.7 | 7.1 | 63% | 4.9 | 45.7 | 7.1 | ||||||||||||||||||||||||||||||||||||||||
| Jervois (44) |
75% | 3.0 | 31.0 | 3.0 | 7.4 | 26.3 | 6.2 | 10.4 | 27.7 | 9.2 | 86% | - | - | - | ||||||||||||||||||||||||||||||||||||||||
| Kudz Ze Kayah (11,34) |
7.21% | - | - | - | 1.1 | 137.5 | 4.8 | 1.1 | 137.5 | 4.8 | 86% | 1.1 | 137.5 | 4.8 | ||||||||||||||||||||||||||||||||||||||||
| Kutcho (12) |
100% | 6.8 | 24.5 | 5.4 | 10.6 | 30.1 | 10.2 | 17.4 | 27.9 | 15.6 | 46% | 17.4 | 27.9 | 15.6 | ||||||||||||||||||||||||||||||||||||||||
| Los Filos (11,40) |
100% | 13.0 | 4.2 | 1.8 | 57.8 | 6.0 | 11.1 | 70.7 | 5.6 | 12.8 | 10% | 70.7 | 5.6 | 12.8 | ||||||||||||||||||||||||||||||||||||||||
| Marmato (11,15) |
100% | 2.1 | 16.4 | 1.1 | 27.4 | 5.3 | 4.7 | 29.5 | 6.1 | 5.8 | 34% | 29.7 | 6.1 | 5.8 | ||||||||||||||||||||||||||||||||||||||||
| Mineral Park |
100% | 123.3 | 2.3 | 9.2 | 247.1 | 2.5 | 19.6 | 370.4 | 2.4 | 28.9 | 61% | 188.3 | 2.4 | 14.6 | ||||||||||||||||||||||||||||||||||||||||
| Neves-Corvo |
100% | |||||||||||||||||||||||||||||||||||||||||||||||||||||
| Copper |
3.9 | 29.0 | 3.7 | 20.0 | 31.0 | 20.0 | 24.0 | 30.7 | 23.6 | 24% | 20.1 | 31.6 | 20.5 | |||||||||||||||||||||||||||||||||||||||||
| Zinc |
6.7 | 66.0 | 14.1 | 17.5 | 57.0 | 32.0 | 24.1 | 59.5 | 46.1 | 30% | 18.7 | 62.2 | 37.4 | |||||||||||||||||||||||||||||||||||||||||
| Peñasquito (10) |
25% | 21.1 | 35.3 | 23.9 | 34.2 | 30.6 | 33.6 | 55.3 | 32.4 | 57.5 | 82% | 64.2 | 30.7 | 63.3 | ||||||||||||||||||||||||||||||||||||||||
| San Dimas (14) |
25% | 0.4 | 217.2 | 2.5 | 0.6 | 180.3 | 3.3 | 0.9 | 194.8 | 5.8 | 94% | 0.8 | 245.5 | 6.4 | ||||||||||||||||||||||||||||||||||||||||
| Zinkgruvan |
100% | |||||||||||||||||||||||||||||||||||||||||||||||||||||
| Zinc |
3.9 | 63.0 | 7.9 | 9.9 | 75.0 | 23.9 | 13.8 | 71.6 | 31.8 | 83% | 11.3 | 76.7 | 27.8 | |||||||||||||||||||||||||||||||||||||||||
| Copper |
1.4 | 32.0 | 1.4 | 0.2 | 34.0 | 0.3 | 1.6 | 32.3 | 1.7 | 70% | 1.6 | 33.1 | 1.7 | |||||||||||||||||||||||||||||||||||||||||
| Total Silver |
268.8 | 290.6 | 559.4 | 469.2 | ||||||||||||||||||||||||||||||||||||||||||||||||||
| Palladium |
||||||||||||||||||||||||||||||||||||||||||||||||||||||
| Platreef (11,35) |
5.25% | - | - | - | 5.7 | 1.9 | 0.35 | 5.7 | 1.9 | 0.35 | 87% | 5.7 | 1.9 | 0.35 | ||||||||||||||||||||||||||||||||||||||||
| Stillwater (11,13) |
4.5% | 0.3 | 11.6 | 0.09 | 1.2 | 10.2 | 0.39 | 1.4 | 10.5 | 0.48 | 90% | 1.4 | 10.3 | 0.48 | ||||||||||||||||||||||||||||||||||||||||
| Total Palladium |
0.09 | 0.74 | 0.83 | 0.83 | ||||||||||||||||||||||||||||||||||||||||||||||||||
| Platinum |
||||||||||||||||||||||||||||||||||||||||||||||||||||||
| Marathon (11,28) |
22% | 25.4 | 0.2 | 0.17 | 2.8 | 0.2 | 0.01 | 28.2 | 0.2 | 0.18 | 76% | 28.2 | 0.2 | 0.18 | ||||||||||||||||||||||||||||||||||||||||
| Platreef (11,35) |
5.25% | - | 0.0 | - | 5.7 | 1.9 | 0.34 | 5.7 | 1.9 | 0.34 | 87% | 5.7 | 1.9 | 0.34 | ||||||||||||||||||||||||||||||||||||||||
| Total Platinum |
0.17 | 0.35 | 0.52 | 0.52 | ||||||||||||||||||||||||||||||||||||||||||||||||||
| Cobalt |
||||||||||||||||||||||||||||||||||||||||||||||||||||||
| Voisey’s Bay (11,22) |
42.4% | 8.4 | 0.11 | 20.3 | 3.6 | 0.11 | 8.5 | 12.0 | 0.11 | 28.8 | 84% | 12.4 | 0.11 | 30.6 | ||||||||||||||||||||||||||||||||||||||||
| Total Cobalt |
20.3 | 8.5 | 28.8 | 30.6 | ||||||||||||||||||||||||||||||||||||||||||||||||||
WHEATON PRECIOUS METALS 2026 SECOND QUARTER REPORT - MANAGEMENT DISCUSSION & ANALYSIS [46]
Mineral Resources Attributable to Wheaton Precious Metals (1,2,3,4,5,9,41)
| December 31, 2025 (6) |
||||||||||||||||||||||||||||||||||||||||||||||||
| Measured | Indicated | Measured & Indicated | Inferred | |||||||||||||||||||||||||||||||||||||||||||||
| Tonnage | Grade | Contained | Tonnage | Grade | Contained | Tonnage | Grade | Contained | Tonnage | Grade | Contained | |||||||||||||||||||||||||||||||||||||
| Interest | Mt | g/t / % | Moz / Mlbs | Mt | g/t / % | Moz / Mlbs | Mt | g/t / % | Moz / Mlbs | Mt | g/t / % | Moz / Mlbs | ||||||||||||||||||||||||||||||||||||
| Gold |
||||||||||||||||||||||||||||||||||||||||||||||||
| Black Pine Royalty (32) |
0.5% | - | - | - | 1.0 | 0.26 | 0.01 | 1.0 | 0.26 | 0.01 | 0.8 | 0.21 | 0.005 | |||||||||||||||||||||||||||||||||||
| Blackwater (11,27) |
8% | 4.6 | 0.37 | 0.06 | 6.4 | 0.49 | 0.10 | 11.0 | 0.44 | 0.16 | 0.7 | 0.45 | 0.01 | |||||||||||||||||||||||||||||||||||
| Brewery Creek Royalty (24) |
2% | 0.3 | 1.06 | 0.01 | 0.5 | 1.02 | 0.02 | 0.8 | 1.03 | 0.03 | 1.0 | 0.88 | 0.03 | |||||||||||||||||||||||||||||||||||
| Cangrejos (11,31) |
4.4% | - | - | - | 13.7 | 0.38 | 0.17 | 13.7 | 0.38 | 0.17 | 8.7 | 0.39 | 0.11 | |||||||||||||||||||||||||||||||||||
| Constancia |
50% | 53.2 | 0.04 | 0.06 | 35.2 | 0.03 | 0.04 | 88.4 | 0.03 | 0.10 | 17.1 | 0.07 | 0.04 | |||||||||||||||||||||||||||||||||||
| Copper World Complex (21) |
100% | 424.0 | 0.02 | 0.30 | 191.0 | 0.02 | 0.10 | 615.0 | 0.02 | 0.40 | 192.0 | 0.01 | 0.08 | |||||||||||||||||||||||||||||||||||
| Cotabambas (12,23) |
25% | - | - | - | 126.8 | 0.20 | 0.82 | 126.8 | 0.20 | 0.82 | 105.9 | 0.17 | 0.57 | |||||||||||||||||||||||||||||||||||
| Curraghinalt (11,33) |
3.05% | - | - | - | - | - | - | - | - | - | 0.2 | 12.24 | 0.07 | |||||||||||||||||||||||||||||||||||
| DeLamar Royalty (37) |
1.5% | 0.4 | 0.49 | 0.006 | 1.5 | 0.38 | 0.02 | 1.9 | 0.40 | 0.02 | 0.6 | 0.31 | 0.006 | |||||||||||||||||||||||||||||||||||
| El Domo (11,29) |
50% | - | - | - | 1.2 | 1.63 | 0.06 | 1.2 | 1.63 | 0.06 | 0.4 | 1.62 | 0.02 | |||||||||||||||||||||||||||||||||||
| Fenix (11,26) |
22% | 2.4 | 0.34 | 0.03 | 8.5 | 0.34 | 0.09 | 10.9 | 0.34 | 0.12 | 3.2 | 0.33 | 0.03 | |||||||||||||||||||||||||||||||||||
| Goose (11,30) |
2.78% | - | - | - | 0.1 | 6.91 | 0.03 | 0.1 | 6.91 | 0.03 | 0.1 | 7.63 | 0.03 | |||||||||||||||||||||||||||||||||||
| Hemlo (11,41) |
10.13% | |||||||||||||||||||||||||||||||||||||||||||||||
| Hemlo O/P |
- | - | - | 1.9 | 0.85 | 0.05 | 1.9 | 0.85 | 0.05 | 0.4 | 0.42 | 0.01 | ||||||||||||||||||||||||||||||||||||
| Hemlo Interlake |
- | - | - | 0.03 | 5.37 | 0.01 | 0.03 | 5.37 | 0.01 | 0.04 | 7.13 | 0.01 | ||||||||||||||||||||||||||||||||||||
| Hemlo Non-Interlake |
- | - | - | 0.1 | 4.41 | 0.01 | 0.1 | 4.41 | 0.01 | 0.1 | 3.78 | 0.01 | ||||||||||||||||||||||||||||||||||||
| Jervois (44) |
75.0% | 0.3 | 0.10 | 0.001 | 2.1 | 0.21 | 0.01 | 2.4 | 0.20 | 0.02 | 4.6 | 0.14 | 0.02 | |||||||||||||||||||||||||||||||||||
| Koné (11,38) |
19.5% | - | - | - | 4.7 | 0.43 | 0.06 | 4.7 | 0.43 | 0.06 | 2.4 | 0.54 | 0.04 | |||||||||||||||||||||||||||||||||||
| Kudz Ze Kayah (11,34) |
7.27% | - | - | - | 0.2 | 1.23 | 0.01 | 0.2 | 1.23 | 0.01 | 0.04 | 1.15 | 0.002 | |||||||||||||||||||||||||||||||||||
| Kurmuk (11,39) |
6.7% | 0.2 | 1.30 | 0.01 | 0.5 | 1.35 | 0.02 | 0.6 | 1.34 | 0.03 | 0.4 | 1.62 | 0.02 | |||||||||||||||||||||||||||||||||||
| Kutcho (12) |
100% | 0.4 | 0.20 | 0.003 | 5.0 | 0.38 | 0.06 | 5.4 | 0.37 | 0.06 | 12.9 | 0.25 | 0.10 | |||||||||||||||||||||||||||||||||||
| Marathon (11,28) |
100% | 32.4 | 0.06 | 0.06 | 44.9 | 0.06 | 0.08 | 77.3 | 0.06 | 0.15 | 20.0 | 0.04 | 0.03 | |||||||||||||||||||||||||||||||||||
| Marmato (11,15) |
10.5% | 0.1 | 5.04 | 0.01 | 1.7 | 2.28 | 0.13 | 1.8 | 2.40 | 0.14 | 1.9 | 2.43 | 0.15 | |||||||||||||||||||||||||||||||||||
| Metates Royalty (17) |
0.5% | 0.2 | 0.86 | 0.004 | 4.5 | 0.56 | 0.08 | 4.6 | 0.57 | 0.08 | 0.7 | 0.47 | 0.01 | |||||||||||||||||||||||||||||||||||
| Mt Todd Royalty (11,36) |
1% | 0.4 | 0.60 | 0.007 | 0.8 | 0.73 | 0.02 | 1.2 | 0.69 | 0.03 | 0.4 | 0.78 | 0.01 | |||||||||||||||||||||||||||||||||||
| Platreef (11,35) |
62.5% | - | - | - | 7.7 | 0.26 | 0.07 | 7.7 | 0.26 | 0.07 | 15.8 | 0.26 | 0.13 | |||||||||||||||||||||||||||||||||||
| Salobo (10) |
75% | 8.7 | 0.25 | 0.07 | 459.9 | 0.22 | 3.25 | 468.6 | 0.22 | 3.32 | 148.3 | 0.30 | 1.43 | |||||||||||||||||||||||||||||||||||
| San Dimas (14) |
25% | 0.2 | 4.49 | 0.03 | 0.3 | 1.84 | 0.02 | 0.5 | 2.87 | 0.05 | 1.5 | 2.64 | 0.12 | |||||||||||||||||||||||||||||||||||
| Santo Domingo (11,25) |
100% | 2.0 | 0.02 | 0.001 | 72.3 | 0.03 | 0.07 | 74.3 | 0.03 | 0.07 | 154.1 | 0.03 | 0.13 | |||||||||||||||||||||||||||||||||||
| Spanish Mtn Royalty (45) |
2% | 1.2 | 0.53 | 0.020 | 3.2 | 0.41 | 0.04 | 4.4 | 0.44 | 0.06 | 0.6 | 0.40 | 0.01 | |||||||||||||||||||||||||||||||||||
| Spring Valley (11,42) |
100% | - | - | - | 5.1 | 0.37 | 0.06 | 5.1 | 0.37 | 0.06 | 4.6 | 0.37 | 0.05 | |||||||||||||||||||||||||||||||||||
| Stillwater (13) |
100% | 20.5 | 0.36 | 0.24 | 20.6 | 0.31 | 0.20 | 41.0 | 0.34 | 0.44 | 96.5 | 0.37 | 1.14 | |||||||||||||||||||||||||||||||||||
| Sudbury (11) |
70% | 1.0 | 0.25 | 0.01 | 2.0 | 0.28 | 0.02 | 3.0 | 0.27 | 0.03 | 1.4 | 0.34 | 0.02 | |||||||||||||||||||||||||||||||||||
| Toroparu (12,16) |
10% | 4.9 | 1.31 | 0.20 | 7.8 | 1.30 | 0.33 | 12.7 | 1.30 | 0.53 | 2.3 | 1.60 | 0.12 | |||||||||||||||||||||||||||||||||||
| Total Gold |
1.13 | 6.06 | 7.19 | 4.58 | ||||||||||||||||||||||||||||||||||||||||||||
WHEATON PRECIOUS METALS 2026 SECOND QUARTER REPORT - MANAGEMENT DISCUSSION & ANALYSIS [47]
Mineral Resources Attributable to Wheaton Precious Metals (Continued) (1,2,3,4,5,9,41)
| December 31, 2025 (6) |
||||||||||||||||||||||||||||||||||||||||||||||||
| Measured | Indicated | Measured & Indicated | Inferred | |||||||||||||||||||||||||||||||||||||||||||||
| Tonnage | Grade | Contained | Tonnage | Grade | Contained | Tonnage | Grade | Contained | Tonnage | Grade | Contained | |||||||||||||||||||||||||||||||||||||
| Interest | Mt | g/t / % | Moz / Mlbs | Mt | g/t / % | Moz / Mlbs | Mt | g/t / % | Moz / Mlbs | Mt | g/t / % | Moz / Mlbs | ||||||||||||||||||||||||||||||||||||
| Silver |
||||||||||||||||||||||||||||||||||||||||||||||||
| Aljustrel (19) |
100% | 14.2 | 45.3 | 20.7 | 11.5 | 45.2 | 16.8 | 25.8 | 45.2 | 37.5 | 27.1 | 41.7 | 36.3 | |||||||||||||||||||||||||||||||||||
| Antamina (10,11,18,43) |
67.5% | |||||||||||||||||||||||||||||||||||||||||||||||
| Copper |
57.2 | 6.6 | 12.1 | 118.1 | 8.2 | 31.0 | 175.2 | 7.7 | 43.1 | 488.1 | 8.9 | 140.0 | ||||||||||||||||||||||||||||||||||||
| Copper-Zinc |
9.5 | 25.5 | 7.8 | 43.9 | 18.4 | 25.9 | 53.4 | 19.6 | 33.7 | 132.1 | 16.2 | 69.0 | ||||||||||||||||||||||||||||||||||||
| Blackwater (11,27) |
50% | 37.8 | 4.7 | 5.7 | 52.9 | 8.7 | 14.8 | 90.8 | 7.0 | 20.5 | 5.6 | 12.8 | 2.3 | |||||||||||||||||||||||||||||||||||
| Constancia |
100% | 106.3 | 2.4 | 8.1 | 70.4 | 2.0 | 4.5 | 176.7 | 2.2 | 12.6 | 34.2 | 3.7 | 4.1 | |||||||||||||||||||||||||||||||||||
| Copper World Complex (21) |
100% | 424.0 | 4.1 | 55.9 | 191.0 | 3.5 | 21.5 | 615.0 | 3.9 | 77.4 | 192.0 | 3.1 | 19.1 | |||||||||||||||||||||||||||||||||||
| Cotabambas (12,23) |
100% | - | - | - | 507.3 | 2.4 | 39.5 | 507.3 | 2.4 | 39.5 | 423.6 | 2.5 | 34.5 | |||||||||||||||||||||||||||||||||||
| Cozamin (11,20) |
50% | |||||||||||||||||||||||||||||||||||||||||||||||
| Copper |
0.2 | 53.8 | 0.3 | 3.9 | 40.1 | 5.0 | 4.0 | 40.7 | 5.3 | 2.8 | 42.1 | 3.8 | ||||||||||||||||||||||||||||||||||||
| Zinc |
- | - | - | 1.4 | 36.4 | 1.6 | 1.4 | 36.4 | 1.6 | 1.7 | 33.8 | 1.8 | ||||||||||||||||||||||||||||||||||||
| DeLamar Royalty (37) |
1.5% | 0.4 | 32.3 | 0.40 | 1.5 | 19.5 | 1.0 | 1.9 | 22.1 | 1.4 | 0.6 | 11.7 | 0.2 | |||||||||||||||||||||||||||||||||||
| El Alto |
25% | 10.7 | 57.2 | 19.7 | 97.9 | 52.2 | 164.4 | 108.6 | 52.7 | 184.1 | 3.8 | 17.8 | 2.2 | |||||||||||||||||||||||||||||||||||
| El Domo (11,29) |
75% | - | - | - | 1.8 | 38.4 | 2.2 | 1.8 | 38.4 | 2.2 | 0.7 | 31.6 | 0.7 | |||||||||||||||||||||||||||||||||||
| Jervois (44) |
75% | 0.1 | 19.1 | 0.1 | 1.1 | 36.7 | 1.3 | 1.2 | 34.6 | 1.3 | 4.0 | 16.4 | 2.1 | |||||||||||||||||||||||||||||||||||
| Kudz Ze Kayah (11,34) |
7.21% | - | - | - | 0.2 | 134.7 | 0.9 | 0.2 | 134.7 | 0.9 | 0.04 | 144.2 | 0.2 | |||||||||||||||||||||||||||||||||||
| Kutcho (12) |
100% | 0.4 | 28.0 | 0.4 | 5.0 | 25.7 | 4.1 | 5.4 | 25.9 | 4.5 | 12.9 | 20.0 | 8.3 | |||||||||||||||||||||||||||||||||||
| Loma de La Plata |
12.5% | - | - | - | 3.6 | 169.0 | 19.8 | 3.6 | 169.0 | 19.8 | 0.2 | 76.0 | 0.4 | |||||||||||||||||||||||||||||||||||
| Marmato (11,15) |
100% | 0.7 | 25.3 | 0.6 | 16.3 | 6.0 | 3.1 | 17.0 | 6.8 | 3.7 | 17.8 | 3.2 | 1.8 | |||||||||||||||||||||||||||||||||||
| Metates Royalty (17) |
0.5% | 0.2 | 18.2 | 0.1 | 4.5 | 14.2 | 2.0 | 4.6 | 14.3 | 2.1 | 0.7 | 13.2 | 0.3 | |||||||||||||||||||||||||||||||||||
| Mineral Park |
100% | 13.6 | 1.9 | 0.8 | 233.4 | 1.9 | 14.1 | 246.9 | 1.9 | 15.0 | 391.2 | 1.2 | 15.5 | |||||||||||||||||||||||||||||||||||
| Neves-Corvo |
100% | |||||||||||||||||||||||||||||||||||||||||||||||
| Copper |
5.9 | 27.0 | 5.2 | 23.5 | 31.0 | 23.4 | 29.4 | 30.2 | 28.6 | 39.2 | 23.0 | 29.0 | ||||||||||||||||||||||||||||||||||||
| Zinc |
5.6 | 58.0 | 10.5 | 15.0 | 56.0 | 27.1 | 20.7 | 56.5 | 37.6 | 4.4 | 51.0 | 7.2 | ||||||||||||||||||||||||||||||||||||
| Peñasquito (10) |
25% | 13.2 | 28.3 | 12.0 | 43.0 | 25.3 | 35.0 | 56.2 | 26.0 | 47.0 | 2.3 | 24.2 | 1.8 | |||||||||||||||||||||||||||||||||||
| San Dimas (14) |
25% | 0.2 | 322.8 | 2.2 | 0.3 | 184.1 | 2.0 | 0.5 | 237.9 | 4.1 | 1.5 | 234.1 | 10.9 | |||||||||||||||||||||||||||||||||||
| Spanish Mtn Royalty (45) |
2% | 1.2 | 0.7 | 0.0 | 3.2 | 0.6 | 0.1 | 4.4 | 0.7 | 0.1 | 0.6 | 0.4 | 0.01 | |||||||||||||||||||||||||||||||||||
| Stratoni |
100% | - | - | - | 1.4 | 151.7 | 6.8 | 1.4 | 151.7 | 6.8 | 1.8 | 166.5 | 9.7 | |||||||||||||||||||||||||||||||||||
| Toroparu (12,16) |
50% | 24.3 | 1.8 | 1.4 | 39.2 | 1.2 | 1.5 | 63.5 | 1.4 | 2.9 | 11.5 | 0.7 | 0.3 | |||||||||||||||||||||||||||||||||||
| Zinkgruvan |
100% | |||||||||||||||||||||||||||||||||||||||||||||||
| Zinc |
3.7 | 70.0 | 8.3 | 3.0 | 53.0 | 5.1 | 6.7 | 62.4 | 13.4 | 16.0 | 96.0 | 49.4 | ||||||||||||||||||||||||||||||||||||
| Copper |
0.6 | 25.0 | 0.5 | 0.1 | 30.0 | 0.1 | 0.7 | 25.6 | 0.6 | 0.3 | 29.0 | 0.3 | ||||||||||||||||||||||||||||||||||||
| Total Silver |
172.7 | 474.4 | 647.1 | 451.1 | ||||||||||||||||||||||||||||||||||||||||||||
| Palladium |
||||||||||||||||||||||||||||||||||||||||||||||||
| Platreef (11,35) |
5.25% | - | - | - | 0.3 | 1.5 | 0.01 | 0.3 | 1.5 | 0.01 | 0.5 | 1.5 | 0.02 | |||||||||||||||||||||||||||||||||||
| Stillwater (11,13) |
4.5% | 0.2 | 10.7 | 0.07 | 0.2 | 8.7 | 0.06 | 0.4 | 9.7 | 0.13 | 1.0 | 10.3 | 0.32 | |||||||||||||||||||||||||||||||||||
| Total Palladium |
0.07 | 0.07 | 0.14 | 0.34 | ||||||||||||||||||||||||||||||||||||||||||||
| Platinum |
||||||||||||||||||||||||||||||||||||||||||||||||
| Marathon (11,28) |
22.0% | 7.6 | 0.1 | 0.04 | 10.5 | 0.1 | 0.04 | 18.1 | 0.1 | 0.08 | 4.5 | 0.1 | 0.01 | |||||||||||||||||||||||||||||||||||
| Platreef (11,35) |
5.25% | - | 0.0 | - | 0.3 | 1.5 | 0.01 | 0.3 | 1.5 | 0.01 | 0.5 | 1.4 | 0.02 | |||||||||||||||||||||||||||||||||||
| Total Platinum |
0.04 | 0.06 | 0.09 | 0.04 | ||||||||||||||||||||||||||||||||||||||||||||
| Cobalt |
||||||||||||||||||||||||||||||||||||||||||||||||
| Voisey’s Bay (11,22) |
42.4% | 0.5 | 0.07 | 0.7 | 3.5 | 0.11 | 8.5 | 3.9 | 0.11 | 9.2 | 2.9 | 0.08 | 5.3 | |||||||||||||||||||||||||||||||||||
| Total Cobalt |
0.7 | 8.5 | 9.2 | 5.3 | ||||||||||||||||||||||||||||||||||||||||||||
WHEATON PRECIOUS METALS 2026 SECOND QUARTER REPORT - MANAGEMENT DISCUSSION & ANALYSIS [48]
Notes on Mineral Reserves & Mineral Resources:
| 1. | All Mineral Reserves and Mineral Resources have been estimated in accordance with the 2014 Canadian Institute of Mining, Metallurgy and Petroleum (CIM) Standards for Mineral Resources and Mineral Reserves and National Instrument 43-101 – Standards for Disclosure for Mineral Projects (“NI 43-101”), or the 2012 Australasian Joint Ore Reserves Committee (JORC) Code for Reporting of Exploration Results, Mineral Resources and Ore Reserves. |
| 2. | Mineral Reserves and Mineral Resources are reported above in millions of metric tonnes (“Mt”), grams per metric tonne (“g/t”) for gold, silver, palladium and platinum, percent (“%”) for cobalt, millions of ounces (“Moz”) for gold, silver, palladium and platinum and millions of pounds (“Mlbs”) for cobalt. |
| 3. | Qualified persons (“QPs”), as defined by the NI 43-101, for the technical information contained in this document (including the Mineral Reserve and Mineral Resource estimates) are: |
| a. | Ryan Ulansky, M.A.Sc., P.Eng. (Vice President, Technical Services); and |
| b. | Jeremy Vincent, M.Sc., P.Geo. (Director, Geology & Resources), |
| both | employees of the Company (the “Company’s QPs”). |
| 4. | The Mineral Resources reported in the above tables are exclusive of Mineral Reserves. The Aljustrel mines, Black Pine project, Blackwater mine, Cangrejos project, Cozamin mine, Curraghinalt project, El Domo project, Fenix mine, Goose mine, Hemlo mine, Jervois project, Kudz Ze Kayah project, Kutcho project, Marathon project, Platreef project, San Dimas mine, Santo Domingo project, and Spring Valley project report Mineral Resources inclusive of Mineral Reserves. The Company’s QPs have made the exclusive Mineral Resource estimates for these mines based on average mine recoveries and dilution. |
| 5. | Mineral Resources, which are not Mineral Reserves do not have demonstrated economic viability. |
| 6. | Other than as detailed below, Mineral Reserves and Mineral Resources are reported as of December 31, 2025, based on information available to the Company as of the date of this document, and therefore will not reflect updates, if any, after such date. |
| a. | Mineral Resources for Aljustrel’s Moinho mine are reported as of June 30, 2025, for the Feitais mine as of May 31, 2025, the Estação mine as of April 2024, and the São João project as of December 31, 2023. Mineral Reserves for Moinho, Feitais, and Estação are reported as of December 31, 2024. |
| b. | Mineral Resources and Mineral Reserves for the Black Pine project are reported as of January 31, 2026. |
| c. | Mineral Resources for the Brewery Creek project are reported as of May 31, 2020. |
| d. | Mineral Resources for the Cangrejos project are reported as of January 30, 2023 and Mineral Reserves as of March 30, 2023. |
| e. | Mineral Resources and Mineral Reserves for the Copper World Complex project are reported as of July 1, 2023. |
| f. | Mineral Resources for the Cotabambas project are reported as of November 20, 2023. |
| g. | Mineral Resources for the Curraghinalt project are reported as of May 10, 2018 and Mineral Reserves as of February 25, 2022. |
| h. | Mineral Resources and Mineral Reserves for the DeLamar project are reported as of December 8, 2025. |
| i. | Mineral Resources for the El Domo project are reported as of October 26, 2021 and Mineral Reserves as of October 22, 2021. |
| j. | Mineral Resources and Mineral Reserves for the Fenix mine are reported as of October 16, 2023. |
| k. | Mineral Resources and Mineral Reserves for the Hemlo mine are reported as of December 31, 2024. |
| l. | Mineral Resources and Mineral Reserves for the Jervois project are reported as of February 10, 2025. |
| m. | Mineral Resources for the Koné project are reported as of January 31, 2025 for the satellite and Gbongogo deposits and as of February 20, 2025 for the Koné deposit. Mineral Reserves are reported as of January 14, 2024. |
| n. | Mineral Resources for the Kudz Ze Kayah project are reported as of January 3, 2025 for the ABM deposit and June 30, 2025 for the Kona Deposit, and Mineral Reserves as of October 30, 2023 for the ABM deposit. |
| o. | Mineral Resources for the Kutcho project are reported as of July 30, 2021 and Mineral Reserves are reported as of November 8, 2021. |
| p. | Mineral Resources for the Loma de La Plata project are reported as of May 20, 2009. |
| q. | Mineral Resources and Mineral Reserves for the Los Filos mine are reported as of June 30, 2022. |
| r. | Mineral Resources and Mineral Reserves for the Marathon project are reported as of November 1, 2024. |
| s. | Mineral Resources and Mineral Reserves for the Marmato mine are reported as of June 30, 2022. |
| t. | Mineral Resources for the Metates royalty are reported as of January 28, 2023. |
| u. | Mineral Resources for the Mineral Park mine are reported as of January 31, 2026 and Mineral Reserves as of February 11, 2026. |
| v. | Mineral Resources and Mineral Reserves for the Mt. Todd project are reported as of July 25, 2025. |
| w. | Mineral Resources and Mineral Reserves for the Santo Domingo project are reported as of March 31, 2024. |
| x. | Mineral Resources for the Spanish Mountain project are reported as of January 10, 2025 for the Main Deposit and as of June 17, 2025 for the Phoenix Deposit. |
| y. | Mineral Resources and Mineral Reserves for the Spring Valley project are reported as of October 31, 2025. |
| z. | Mineral Resources for the Stratoni mine are reported as of September 30, 2025. |
| aa. | Mineral Resources for the Toroparu project are reported as of February 10, 2023. |
| 7. | Process recoveries are the Company’s estimated average percentage of gold, silver, palladium, platinum, or cobalt in a saleable product (doré or concentrate) recovered from mined ore at the applicable site process plants. |
| 8. | Mineral Reserves are estimated using appropriate process and mine recovery rates, dilution, operating costs and the following commodity prices: |
| a. | Aljustrel mine – 2.5% zinc cut-off for the Moinho, Feitais, and Estação mines project. |
| b. | Antamina mine - $6,000 per hour of mill operation cut-off assuming $3.75 per pound copper, $1.21 per pound zinc, $15.00 per pound molybdenum and $27.00 per ounce silver. |
| c. | Black Pine – 0.1 grams per tonne gold cut-off assuming $1,650 per ounce gold. |
| d. | Blackwater mine – NSR cut-off of Cdn $13.00 per tonne assuming $1,400 per ounce gold and $15.00 per ounce silver. |
| e. | Cangrejos project - declining NSR cut-offs of between $23.00 and $7.76 per tonne assuming $1,500 per ounce gold, $3.00 per pound copper and $18.00 per ounce silver. |
| f. | Constancia mine – NSR cut-off of $7.30 per tonne for Pampacancha and Constancia assuming $2,800 per ounce gold, $32.00 per ounce silver, $4.40 per pound copper and $17.00 per pound molybdenum. |
| g. | Copper World Complex project – $4.00 per pound copper, $12.00 per pound molybdenum, $23.00 per ounce silver and $1,700 per |
WHEATON PRECIOUS METALS 2026 SECOND QUARTER REPORT - MANAGEMENT DISCUSSION & ANALYSIS [49]
| ounce gold. |
| h. | Cozamin mine - NSR cut-off of $60.54 per tonne for long-hole and $65.55 per tonne for cut and fill for MNV and MNFWZ, and $82.78 per tonne for both mining methods at MNV West, assuming $3.55 per pound copper for MNV and MNFWZ and $3.75 per pound for MNV West, $20.00 per ounce silver, $0.90 per pound lead and $1.15 per pound zinc. |
| i. | Curraghinalt project - 3.0 grams per tonne gold cut-off assuming $1,200 per ounce gold. |
| j. | DeLamar project – Variable cut-offs based on variable processing costs of $3.26-$5.30 per tonne and metallurgical recoveries of 45%-95% for gold and 15%-92% for silver, all assuming $2,000 per ounce gold and $25.00 per ounce silver. |
| k. | El Domo project - NSR cut-off of $32.99 per tonne assuming $1,630 per ounce gold, $21.00 per ounce silver, $3.31 per pound copper, $0.92 per pound lead and $1.16 per pound zinc. |
| l. | Fenix mine – 0.235 grams per tonne gold cut-off assuming $1,650 per ounce gold. |
| m. | Goose mine – 1.65 grams per tonne gold cut-off for open pit and 4.64 grams per tonne for underground, assuming $1,750 per ounce gold. |
| n. | Hemlo mine – NSR cut-off of $110.8 per tonne or $120.0 per tonne cut-off depending on underground mining method, and $34.13 per tonne for open pit material assuming $1,700 per ounce gold. |
| o. | Jervois project – 0.71 percent copper equivalent cut-off grade for open pit, 1.0 percent copper equivalent cut-off grade for underground with backfill, 0.83 percent copper equivalent cut-off grade for underground mining without backfill, all assuming $4.58 per pound copper, $2,400 per ounce gold, and $32.00 per ounce silver. |
| p. | Koné project – gold grade cut-offs ranging from 0.19 to 0.49 grams per tonne assuming $1,550 per ounce gold. |
| q. | Kudz Ze Kayah project - NSR cut-off of Cdn$29.30 per tonne for open pit and Cdn$173.23 per tonne for underground assuming $1,700 per ounce gold, $22.60 per ounce silver, $3.80 per pound copper, $0.95 per pound lead and $1.20 per pound zinc. |
| r. | Kurmuk project - gold grade cut-offs ranging from 0.30 to 0.45 grams per tonne assuming $1,500 per ounce gold. |
| s. | Kutcho project – NSR cut-offs of Cdn $38.40 per tonne for oxide ore and Cdn $55.00 per tonne for sulfide for the open pit and Cdn $129.45 per tonne for the underground assuming $3.50 per pound copper, $1.15 per pound zinc, $20.00 per ounce silver and $1,600 per ounce gold. |
| t. | Los Filos mine – Variable break-even cut-offs for the open pits depending on process destination and metallurgical recoveries and NSR cut-offs of $65.80—$96.60 per tonne for the underground mines, assuming $1,450 per ounce gold and $18.00 per ounce silver. |
| u. | Marathon project - NSR cut-off of Cdn $16.00 per tonne assuming $1,525 per ounce palladium, $950 per ounce platinum, $4.00 per pound copper, $2,000 per ounce gold and $24.00 per ounce silver. |
| v. | Marmato mine – 2.05 grams per tonne gold cut-off for the Upper Mine and 1.62 grams per tonne gold cut-off for the Lower Mine, all assuming $1,500 per ounce gold. |
| w. | Mineral Park mine - NSR cut-off of $8.50 per tonne assuming $4.50 per pound copper, $20.00 per pound molybdenum and $37.00 per ounce silver. |
| x. | Mt Todd project – 0.50 grams per tonne gold cut-off for the Batman deposit and zero cut-off for the Heap Leach, assuming $1,800 per ounce gold. |
| y. | Neves-Corvo mine – NSR cut-offs ranging from EUR 49 to 89 per tonne depending on area and mining method for both the copper and zinc Mineral Reserves assuming $4.04 per pound copper, $0.91 per pound lead and $1.27 per pound zinc. |
| z. | Peñasquito mine - $1,700 per ounce gold, $25.00 per ounce silver, $0.90 per pound lead and $1.20 per pound zinc. |
| aa. | Platreef project - declining NSR cut-offs of between $155 and $80 per tonne assuming $1,600 per ounce platinum, $815 per ounce palladium, $1,300 per ounce gold, $1,500 per ounce rhodium, $8.90 per pound nickel and $3.00 per pound copper. |
| bb. | Salobo mine – 0.248% copper equivalent cut-off assuming $1,925 per ounce gold and $4.15 per pound copper. |
| cc. | San Dimas mine – $3,100 per ounce gold and $35.00 per ounce silver. |
| dd. | Santo Domingo project – NSR cut-off of $9.77 per tonne assuming $3.75 per pound copper, $1,400 per ounce gold and $69 to $115 per tonne iron. |
| ee. | Spring Valley project – 0.10 grams per tonne gold cut-off assuming $1,800 per ounce gold. |
| ff. | Stillwater mines - combined platinum and palladium cut-off of 10.1 grams per tonne for Stillwater and 8.0 grams per tonne for East Boulder assuming $1,172 per ounce 2E PGM prices. |
| gg. | Sudbury mines - $1,300 to $1,450 per ounce gold, $6.07 to $8.53 per pound nickel, $2.77 to $3.40 per pound copper, $1,155 to $1,225 per ounce platinum, $925 to $1,400 per ounce palladium and $20.41 to $22.68 per pound cobalt. |
| hh. | Voisey’s Bay mines – NSR cut-offs of Cdn $28.35 per tonne for Discovery Hill Open Pit, Cdn$220 to $230 per tonne for Reid Brook and Cdn$220 per tonne for Eastern Deeps all assuming $3.40 per pound copper, $8.16 per pound nickel and $22.68 per pound cobalt. |
| ii. | Zinkgruvan mine – NSR cut-offs ranging from SEK 1,050 to 1,300 per tonne depending on area and mining method for both the zinc and copper Mineral Reserves assuming $3.85 per pound copper and $0.90 per pound lead and $1.20 per pound zinc and $4.83 per ounce silver. |
| 9. | Mineral Resources are estimated using appropriate recovery rates and the following commodity prices: |
| a. | Aljustrel mine – 2.5% zinc cut-off for Feitais, Moinho and São João mines and the Estação project. |
| b. | Antamina mine - $6,000 per hour of mill operation cut-off for the open pit and $58.70 per tonne NSR cut-off for the underground, both assuming $3.75 per pound copper, $1.33 per pound zinc, $21.00 per pound molybdenum and $31.38 per ounce silver. |
| c. | Black Pine – 0.1 grams per tonne gold cut-off assuming $2,000 per ounce gold. |
| d. | Blackwater mine – 0.2 grams per tonne gold equivalent cut-off assuming $2,002 per ounce gold and $21.45 per ounce silver. |
| e. | Brewery Creek project – 0.37 grams per tonne gold cut-off assuming $1,500 per ounce gold. |
| f. | Cangrejos project - 0.25 grams per tonne gold equivalent cut-off assuming $1,600 per ounce gold, $3.50 per pound copper, $11.00 per pound molybdenum and $21.00 per ounce silver. |
| g. | Constancia mine – NSR cut-off of $7.30 per tonne for open pit and 0.65% copper cut-off for underground, both assuming $2,800 per ounce gold, $32.00 per ounce silver, $4.40 per pound copper and $17.00 per pound molybdenum. |
| h. | Copper World Complex project – 0.1% copper cut-off and an oxidation ratio of lower than 50%, assuming $3.75 per pound copper, $12.00 per pound molybdenum, $22.00 per ounce silver, and $1,650 per ounce gold. |
| i. | Cotabambas project – 0.15% copper equivalent cut-off assuming $1,850 per ounce gold, $23.00 per ounce silver, $4.25 per pound copper and $20.00 per pound molybdenum. |
WHEATON PRECIOUS METALS 2026 SECOND QUARTER REPORT - MANAGEMENT DISCUSSION & ANALYSIS [50]
| j. | Cozamin mine – NSR cut-off of $59.00 per tonne assuming $3.75 per pound copper, $22.00 per ounce silver, $1.00 per pound lead and $1.35 per pound zinc. |
| k. | Curraghinalt project – 5.0 grams per tonne gold cut-off assuming $1,200 per ounce gold. |
| l. | DeLamar project – 0.17 grams per tonne gold equivalent cut-off for oxide leach and mixed leach and 0.1 grams per tonne gold equivalent cut-off for stockpile, all assuming $2,650 per ounce gold and $30.00 per ounce silver. |
| m. | El Domo project - NSR cut-off of $29.00 per tonne for the open pit and $105 per tonne for the underground assuming $1,800 per ounce gold, $24.00 per ounce silver, $4.00 per pound copper, $1.05 per pound lead and $1.30 per pound zinc. |
| n. | Fenix mine – 0.15 grams per tonne gold cut-off assuming $1,800 per ounce gold. |
| o. | Goose mine - 0.9 grams per tonne gold cut-off for open pit and 2.2 grams per tonne for underground, assuming $2,500 per ounce gold. |
| p. | Hemlo mine – 2.38 grams per tonne gold cut-off on average for underground and 0.21 grams per tonne gold cut-off for open pit. |
| q. | Jervois project – 0.35 percent copper equivalent cut-off grade for open pit and a 0.8 percent copper cut-off grade for underground, all assuming $4.90 per pound copper, $2,400 per ounce gold, and $32.00 per ounce silver. |
| r. | Koné project - 0.2 grams per tonne gold cut-off for the Koné deposit, 0.5 grams per tonne for the Gbongogo, Gbongogo South, Koban North, Sena, Diouma North and Lokolo Main deposits and 0.6 grams per tonne for the Yere North and ANV deposits, all assuming a gold price of $2,000 per ounce. |
| s. | Kudz Ze Kayah project – NSR cut-off of $40 per tonne for “shallow” and $150 per tonne for ”deep” mineralization at the ABM deposit, assuming $1,700 per ounce gold, $22.60 per ounce silver, $3.80 per pound copper, $0.95 per pound lead and $1.20 per pound zinc. |
| t. | Kurmuk project - gold grade cut-off of 0.5 grams per tonne assuming a gold price of $1,800 per ounce. |
| u. | Kutcho project – 0.45% copper equivalent cut-off for the Main open pit and underground copper equivalent cut-offs of 1.05%, 0.95% and 1.05% for Main, Esso and Sumac respectively, all assuming $3.50 per pound copper, $1.15 per pound zinc, $20.00 per ounce silver and $1,600 per ounce gold. |
| v. | Loma de La Plata project – 50 grams per tonne silver equivalent cut-off assuming $12.50 per ounce silver and $0.50 per pound lead. |
| w. | Marathon project – NSR cut-off of Cdn $13.60 per tonne for the Marathon project assuming $1,550 per ounce palladium, $1,100 per ounce platinum, $4.25 per pound copper, $2,300 per ounce gold and $27.00 per ounce silver. NSR cut-off of Cdn $13.00 per tonne for the Sally and Geordie projects assuming $1,600 per ounce palladium, $900 per ounce platinum, $3.00 per pound copper, $1,500 per ounce gold and $18.00 per ounce silver. |
| x. | Marmato mine – 1.8 grams per tonne gold cut-off for the Upper Mine and 1.3 grams per tonne gold cut-off for the Lower Mine, all assuming $1,700 per ounce gold. |
| y. | Metates royalty – 0.26 grams per tonne gold equivalent cut-off assuming $1,600 per ounce gold and $20.00 per ounce silver. |
| z. | Mineral Park mine – NSR cut-off of $8.00 per tonne assuming $4.50 per pound copper, $20.00 per pound molybdenum and $37.00 per ounce silver. |
| aa. | Mt Todd project – 0.4 grams per tonne gold cut-off for the Batman and Quigleys deposits and zero cut-off for Heap Leach, assuming $1,950 per ounce gold. |
| bb. | Neves-Corvo mine – 15% lower than the Mineral Reserve cut-off value for each mine zone and mining method. |
| cc. | El Alto project – $1,700 per ounce gold, $21.00 per ounce silver and $3.75 per pound copper. |
| dd. | Peñasquito mine - $2,000 per ounce gold, $28.00 per ounce silver, $1.00 per pound lead and $1.30 per pound zinc. |
| ee. | Platreef project - 2.0 grams per tonne 3PE + Au (platinum, palladium, rhodium and gold) cut-off assuming $1,200 per ounce platinum, $1,130 per ounce palladium, $2,170 per ounce gold, $5,000 per ounce rhodium, $8.50 per pound nickel and $4.25 per pound copper. |
| ff. | Salobo mine – 0.248% copper equivalent cut-off assuming $2,300 per ounce gold and $4.54 per pound copper. |
| gg. | San Dimas mine – NSR cut-off of $149 per tonne assuming $3,400 per ounce gold and $38.50 per ounce silver. |
| hh. | Santo Domingo project – NSR cut-off of $9.85 per tonne assuming $4.10 per pound copper, $1,600 per ounce gold and $95 to $140 per tonne iron. |
| ii. | Spanish Mountain – 0.15 grams per tonne and 0.20 grams per tonne gold cut-offs for the Main and Phoenix Deposits respectively, assuming $2,400 per ounce gold. |
| jj. | Spring Valley – 0.10 grams per tonne gold cut-off assuming $2,200 per ounce gold. |
| kk. | Stillwater mines – combined platinum and palladium cut-off of 8.8 grams per tonne for Stillwater and 6.5 grams per tonne for East Boulder assuming $1,350 per ounce 2E PGM prices. |
| ll. | Stratoni mine – NSR cut-off of $200 per tonne assuming $2.75 per pound copper, $0.91 per pound lead, $1.04 per pound zinc and $17.00 per ounce silver. |
| mm. | Sudbury mines - $1,000 to $1,950 per ounce gold, $6.07 to $9.44 per pound nickel, $2.77 to $4.31 per pound copper, $1,124 to $1,350 per ounce platinum, $925 to $1,450 per ounce palladium and $20.41 to $25.54 per pound cobalt. |
| nn. | Toroparu project – 0.45 grams per tonne gold cut-off for open pit and 1.5 grams per tonne gold for underground assuming $1,950 per ounce gold. |
| oo. | Voisey’s Bay mines – NSR cut-off of Cdn $28.35 per tonne for Discovery Hill Open Pit and Cdn$230 to $250 per tonne for Reid Brook, Cdn$145 to $220 per tonne for Eastern Deeps Underground, and Cdn$210 to $250 per tonne for Discovery Hill Underground, all assuming $3.40 per pound copper, $8.16 per pound nickel and $22.68 per pound cobalt. |
| pp. | Zinkgruvan mine – NSR cut-offs ranging from SEK 750 to 1,100 per tonne depending on area and mining method for the zinc Mineral Resources assuming $3.85 per pound copper and $0.90 per pound lead and $1.20 per pound zinc and $4.83 per ounce silver. |
| 10. | The scientific and technical information in these tables regarding the Antamina, Peñasquito and Salobo mines was sourced by the Company from the following filed documents: |
| a. | Antamina – Teck Resources Annual Information Form filed on SEDAR on February 18, 2026. |
| b. | Peñasquito – Newmont’s December 31, 2025 Resources and Reserves press release dated February 19, 2026 and |
| c. | Salobo – Vale has filed a technical report summary for the Salobo Mine, which is available on EDGAR at https://www.sec.gov/Archives/edgar/data/0000917851/000110465922040322/tm2210823d1_6k.htm. |
The Company QP’s have approved this partner disclosed scientific and technical information in respect of the Company’s Mineral Resource and Mineral Reserve estimates for the Antamina mine, Peñasquito mine and Salobo mine.
WHEATON PRECIOUS METALS 2026 SECOND QUARTER REPORT - MANAGEMENT DISCUSSION & ANALYSIS [51]
| 11. | The Company’s attributable Mineral Resources and Mineral Reserves have been constrained to the production expected for the various contracts. |
| 12. | The Company has the option in the Early Deposit agreements, to terminate the agreement following the delivery of a feasibility study or if the feasibility study is not delivered within a required time frame. |
| 13. | The Stillwater PMPA provides that effective July 1, 2018, Sibanye-Stillwater will deliver 100% of the gold production for the life of the mines and 4.5% of palladium production until 375,000 ounces are delivered, 2.25% of palladium production until a further 175,000 ounces are delivered and 1.0% of the palladium production thereafter for the life of the mines. Attributable palladium Mineral Reserves and Mineral Resources are calculated based upon the 4.5% / 2.25% / 1.0% production entitlements. |
The Stillwater mine has been in operation since 1986 and the East Boulder mine since 2002. Individual grades for platinum, palladium, gold and rhodium are estimated using ratios applied to the combined platinum plus palladium grades based upon average historic production results provided to the Company as of the date of this document. As such, the Attributable Mineral Resource and Mineral Reserve palladium and gold grades for the Stillwater mines have been estimated using the following ratios:
| a. | Stillwater mine: Pd = (Pt + Pd) / (1/3.46 + 1) and Au = (Pd + Pt) x 0.0238 |
| b. | East Boulder mine: Pd = (Pt + Pd) / (1/3.66 + 1) and Au = (Pd + Pt) x 0.0323 |
| 14. | Under the terms of the San Dimas PMPA, the Company is entitled to an amount equal to 25% of the payable gold production plus an additional amount of gold equal to 25% of the payable silver production converted to gold at a fixed gold to silver exchange ratio of 70:1 from the San Dimas mine. If the average gold to silver price ratio decreases to less than 50:1 or increases to more than 90:1 for a period of 6 months or more, then the “70” shall be revised to “50” or “90”, as the case may be, until such time as the average gold to silver price ratio is between 50:1 to 90:1 for a period of 6 months or more in which event the “70” shall be reinstated. |
| 15. | The Marmato PMPA provides that Aris Gold Corp will deliver 10.5% of the gold production until 310,000 ounces are delivered and 5.25% of gold production thereafter, as well as 100% of the silver production until 2.15 million ounces are delivered and 50% of silver production thereafter. Attributable reserves and resources have been calculated on the 10.5% / 5.25% basis for gold and 100% / 50% basis for silver. |
| 16. | Under the Company’s Toroparu Early Deposit Agreement, the Company will be entitled to purchase 10% of the gold production and 50% of the silver production from the Toroparu project for the life of mine. |
| 17. | The Company’s Metates Royalty entitles the Company to a 0.5% net smelter return royalty. |
| 18. | The Glencore Antamina PMPA provides that Glencore will deliver silver equal to 33.75% of the silver production until 140 million ounces are delivered and 22.5% of silver production thereafter. Attributable reserves and resources have been calculated on the 33.75% / 22.5% basis. |
| 19. | The Company only has the rights to silver contained in concentrates containing less than 15% copper at the Aljustrel mine. |
| 20. | The new Cozamin PMPA provides that Capstone will deliver silver equal to 50% of the silver production until 10 million ounces are delivered and 33% thereafter for the life of the mine. Attributable reserves and resources have been calculated on the 50% / 33% basis. |
| 21. | The Copper World Complex Mineral Resources and Mineral Reserves do not include the Leach material. |
| 22. | The Voisey’s Bay PMPA provides that Vale will deliver 42.4% of the cobalt production until 31 million pounds are delivered to the Company and 21.2% of cobalt production thereafter, for the life of the mine. Attributable reserves and resources have been calculated on the 42.4% / 21.2% basis. |
| 23. | Under the Cotabambas Early Deposit Agreement, the Company will be entitled to purchase 100% of the silver production and 25% of the gold production from the Cotabambas project until 90 million silver equivalent ounces have been delivered, at which point the stream will drop to 66.67% of silver production and 16.67% of gold production for the life of mine. |
| 24. | Under the Brewery Creek Royalty, the Company will be entitled to a 2.0% net smelter return royalty for the first 600,000 ounces of gold produced from the Brewery Creek project, above which the NSR will increase to 2.75%. Victoria Gold has the right to repurchase 0.625% of the increased NSR by paying the Company Cdn$2.0 million. Attributable resources have been calculated on the 2.0% / 2.75% basis. |
| 25. | The Santo Domingo PMPA provides that Capstone will deliver gold equal to 100% of the gold production until 285,000 ounces are delivered and 67% thereafter for the life of the mine. Attributable reserves and resources have been calculated on the 100% / 67% basis. |
| 26. | The Fenix PMPA provides that Rio2 will deliver gold equal to 22% of the gold production until 130,625 ounces are delivered, then 6% of the gold production until 185,000 ounces are delivered, then 4% of the gold production until 235,000 ounces are delivered and 3.5% thereafter for the life of the mine. Attributable reserves and resources have been calculated on this 22% / 6% / 4% / 3.5% basis. |
| 27. | The Blackwater Silver and Blackwater Gold PMPAs provide that Artemis will deliver respectively silver and gold equal to (i) a multiple ranging from 5.07 to 5.17 of the number of ounces of gold produced until 17.8 million ounces of silver are delivered and 33% of the payable silver thereafter for the life of the mine, and (ii) 8% of the payable gold production until 464,000 ounces are delivered and 4% thereafter for the life of the mine. Attributable reserves and resources have been calculated on the 5.17 ratio / 33% basis for silver and 8% / 4% basis for gold. |
| 28. | The Marathon PMPA provides that Gen Mining will deliver 100% of the gold production until 150,000 ounces are delivered and 67% thereafter for the life of the mine and 22% of the platinum production until 120,000 ounces are delivered and 15% thereafter for the life of the mine. Attributable reserves and resources have been calculated on the 100% / 67% basis for gold and 22% / 15% basis for platinum. |
| 29. | The El Domo PMPA provides that Adventus will deliver silver and gold equal to 75% of the silver production until 4.6 million ounces are delivered and 50% thereafter for the life of the mine and 50% of the gold production until 150,000 ounces are delivered and 33% thereafter for the life of the mine. Attributable reserves and resources have been calculated on the 75% / 50% basis for silver and 50% / 33% basis for gold. |
| 30. | In connection with Sabina’s exercise of its option to repurchase 33% of the Goose gold stream on a change in control, the gold delivery obligations under the Goose PMPA with Sabina, a subsidiary of B2Gold, were reduced so that Sabina will deliver gold equal to 2.78% of the gold production until 87,100 ounces are delivered, then 1.44% until 134,000 ounces are delivered and 1.0% thereafter for the life of the mine. Attributable reserves and resources have been calculated on the 2.78% / 1.44% / 1.0% basis. |
| 31. | The Cangrejos PMPA provides that Lumina will deliver gold equal to 4.40% of the gold production until 0.47 million ounces are delivered and 2.93% thereafter for the life of the mine. Attributable reserves and resources have been calculated on the 4.40% / 2.93% basis. On September 16, 2025, in connection with its acquisition of Lumina, CMOC exercised its 33% buy-back option under the Cangrejos PMPA, bringing the stream percentages and thresholds to the stated values. |
| 32. | The Black Pine Royalty provides that the Company will be entitled to a 0.5% net smelter return. Attributable resources have been calculated on the 0.5% basis. |
| 33. | The Curraghinalt PMPA provides that Dalradian will deliver gold equal to 3.05% of the payable gold production until 125,000 ounces of gold are delivered and 1.5% thereafter for the life of the mine. Attributable gold reserves and resources have been calculated on the 3.05% / 1.5% basis. |
WHEATON PRECIOUS METALS 2026 SECOND QUARTER REPORT - MANAGEMENT DISCUSSION & ANALYSIS [52]
| 34. | The Kudz Ze Kayah PMPA provides that BMC will deliver gold and silver equal to 7.375% of the metal contained in concentrates until 24,338 ounces of gold and 3,193,375 ounces of silver are delivered, then 6.125% until 28,000 ounces of gold and 3,680,803 ounces of silver are delivered, then 5.5% until 42,861 ounces of gold and 5,624,613 ounces of silver are delivered and 6.75% thereafter for the life of the mine. Attributable gold and silver reserves and resources have been calculated on the 7.375% / 6.125% / 5.5% / 6.75% basis. |
| 35. | The Platreef Gold PMPA provides that Ivanhoe will deliver gold equal to 62.5% of the payable gold production until 218,750 ounces of gold are delivered and 50% until 428,300 ounces of gold are delivered, then 3.125% thereafter for a tail period which will terminate on certain conditions being met. The Platreef Palladium and Platinum PMPA provides that Ivanhoe will deliver 5.25% of the platinum and palladium until 350,000 ounces are delivered and 3.0% until 485,115 ounces are delivered, then 0.1% for a tail period which will terminate on certain conditions being met. Attributable gold reserves and resources have been calculated on the 62.5% / 50% / 3.125% basis and attributable platinum and palladium on the 5.25% / 3.0% / 0.1% basis. |
| 36. | The Mt Todd Royalty provides that the Company will be entitled to 1.0% of gross revenue until 3.47 million ounces of gold are delivered to an offtaker, then 0.667% of gross revenue for the life of the mine. Attributable gold reserves and resources have been calculated on the 1.0% / 0.667% basis. |
| 37. | The DeLamar Royalty provides that the Company will be entitled to a 1.5% net smelter return on Oxide and Mixed material. Attributable reserves and resources have been calculated on the 1.5% basis. |
| 38. | The Koné PMPA provides that Montage will deliver gold equal to 19.5% of the payable gold production until 400,000 ounces of gold are delivered, then 10.8% until 530,000 ounces are delivered and 5.4% thereafter for the life of the mine. Attributable reserves and resources have been calculated on the 19.5% / 10.8% / 5.4% basis. |
| 39. | The Kurmuk PMPA provides that Allied will deliver gold equal to 6.7% of the payable gold production until 220,000 ounces of gold are delivered, then 4.8% thereafter for the life of the mine. Attributable reserves and resources have been calculated on the 6.7% / 4.8% basis. |
| 40. | The Los Filos PMPA has a 25-year term and is expected to terminate on October 15, 2029. Attributable reserves have been limited to this term and include only heap leach material as detailed in Equinox’s October 2022 technical report for the Los Filos mine. |
| 41. | The Hemlo PMPA provides that Hemlo Mining Corp. will deliver gold equal to 10.13% of the payable gold production until 135,750 ounces of gold are delivered, then 6.75% until an additional 117,998 ounces of gold are delivered, and 4.5% thereafter for the life of the mine. Attributable reserves and resources have been calculated on the 10.13% / 6.75% / 4.5% basis. |
| 42. | The Spring Valley PMPA provides that Waterton will deliver gold equal to 8% of the payable gold production until 300,000 ounces of gold are delivered, then 6% thereafter for the life of the mine. Attributable reserves and resources have been calculated on the 8% / 6% basis. |
| 43. | The BHP Antamina PMPA provides that BHP will deliver silver equal to 33.75% of the silver production until 100 million ounces are delivered and 22.5% of silver production thereafter. Attributable reserves and resources have been calculated on the 33.75% / 22.5% basis. |
| 44. | The Jervois PMPA provides that KGL will deliver gold and silver equal to 75% of the payable production until 45,000 / 4,300,000 ounces respectively are delivered, then 37.5% until an additional 15,000 / 1,700,000 ounces respectively are delivered, then 25% for the remaining life of the mine. |
| 45. | The Spanish Mountain Royalty provides that the Company will be entitled to a 1.5% net smelter return. Attributable resources have been calculated on a 1.5% basis. |
| 46. | Precious metals and cobalt are by-product metals at all of the Mining Operations, other than gold at the Marmato mine, Toroparu project, Fenix mine, Goose mine, Blackwater mine, Black Pine project, Curraghinalt project, Mt Todd project, DeLamar project, Koné project, Kurmuk project, Hemlo Mine, and Spring Valley project, silver at the Loma de La Plata zone of the Navidad project and palladium at the Stillwater mines and Platreef project, and therefore, the economic cut-off applied to the reporting of precious metals and cobalt reserves and resources will be influenced by changes in the commodity prices of other metals at the mines. |
Statements made in this section contain forward-looking information. Please see “Cautionary Note Regarding Forward-Looking Statements” for material risks, assumptions and important disclosures associated with this information.
WHEATON PRECIOUS METALS 2026 SECOND QUARTER REPORT - MANAGEMENT DISCUSSION & ANALYSIS [53]
Cautionary Note Regarding Forward-Looking Statements
The information contained herein contains “forward-looking statements” within the meaning of the United States Private Securities Litigation Reform Act of 1995 and “forward-looking information” within the meaning of applicable Canadian securities legislation. Forward-looking statements, which are all statements other than statements of historical fact, include, but are not limited to, statements with respect to:
| ● | the future price of commodities; |
| ● | the estimation of future production from Mining Operations (including in the estimation of production, mill throughput, grades, recoveries and exploration potential); |
| ● | the estimation of mineral reserves and mineral resources (including the estimation of reserve conversion rates and the realization of such estimations); |
| ● | the commencement, timing and achievement of construction, expansion or improvement projects by Wheaton’s PMPA counterparties at Mining Operations; |
| ● | the payment of upfront cash consideration to counterparties under PMPAs, the satisfaction of each party’s obligations in accordance with PMPAs and the receipt by the Company of precious metals and cobalt production or other payments in respect of the applicable Mining Operations under PMPAs or other payments under royalty arrangements; |
| ● | the ability of Wheaton’s PMPA counterparties to comply with the terms of a PMPA (including as a result of the business, mining operations and performance of Wheaton’s PMPA counterparties) and the potential impacts of such on Wheaton; |
| ● | future payments by the Company in accordance with PMPAs, including any acceleration of payments; |
| ● | the costs of future production; |
| ● | the ability of the Company to repay the existing Revolving Credit Facility and new Term Loan; |
| ● | the estimation of produced but not yet delivered ounces; |
| ● | continued listing of the Common Shares on the LSE, NYSE and TSX; |
| ● | any statements as to future dividends; |
| ● | the ability to fund outstanding commitments and the ability to continue to acquire accretive PMPAs; |
| ● | projected increases to Wheaton’s production and cash flow profile; |
| ● | projected changes to Wheaton’s production mix; |
| ● | the ability of Wheaton’s PMPA counterparties to comply with the terms of any other obligations under agreements with the Company; |
| ● | the ability to sell precious metals and cobalt production; |
| ● | confidence in the Company’s business structure; |
| ● | the Company’s assessment of taxes payable, and the Company’s ability to pay its taxes; |
| ● | possible CRA domestic or international audits; |
| ● | the Company’s assessment of the impact of any tax reassessments; |
| ● | the Company’s climate change and environmental commitments; and |
| ● | assessments of the impact and resolution of various legal and tax matters, including but not limited to audits. |
Generally, these forward-looking statements can be identified by the use of forward-looking terminology such as “plans”, “expects” or “does not expect”, “is expected”, “budget”, “scheduled”, “estimates”, “forecasts”, “projects”, “intends”, “anticipates” or “does not anticipate”, or “believes”, “potential”, or variations of such words and phrases or statements that certain actions, events or results “may”, “could”, “would”, “might” or “will be taken”, “occur” or “be achieved”. Forward-looking statements are subject to known and unknown risks, uncertainties and other factors that may cause the actual results, level of activity, performance or achievements of Wheaton to be materially different from those expressed or implied by such forward-looking statements, including but not limited to:
| ● | risks associated with fluctuations in the price of commodities (including Wheaton’s ability to sell its precious metals or cobalt production at acceptable prices or at all); |
| ● | risks related to the Mining Operations (including fluctuations in the price of the primary or other commodities mined at such operations, regulatory, political and other risks of the jurisdictions in which the Mining Operations are located, actual results of mining, risks associated with exploration, development, operating, expansions and improvement at the Mining Operations, environmental and economic risks of the Mining Operations, and changes in project parameters as Mining Operations plans continue to be refined); |
| ● | absence of control over the Mining Operations and having to rely on the accuracy of the public disclosure and other information Wheaton receives from the owners and operators of the Mining Operations as the basis for its analyses, forecasts and assessments relating to its own business; |
| ● | risks related to the uncertainty in the accuracy of mineral reserve and mineral resource estimation; |
| ● | risks related to the satisfaction of each party’s obligations in accordance with the terms of the Company’s PMPAs, including the ability of the companies with which the Company has PMPAs to perform their obligations under those PMPAs in the event of a material adverse effect on the results of operations, |
WHEATON PRECIOUS METALS 2026 SECOND QUARTER REPORT - MANAGEMENT DISCUSSION & ANALYSIS [54]
| financial condition, cash flows or business of such companies, any acceleration of payments, estimated throughput and exploration potential; |
| ● | risks relating to production estimates from Mining Operations, including anticipated timing of the commencement of production by certain Mining Operations; |
| ● | risks relating to the generation of sufficient cash flow to repay the existing Revolving Credit Facility and the new Term Loan; |
| ● | Wheaton’s interpretation of, or compliance with, or application of, tax laws and regulations or accounting policies and rules, being found to be incorrect, or the tax impact to the Company’s business operations being materially different than currently contemplated, or the ability to pay such taxes as and when due; |
| ● | any challenge or reassessment by the CRA of the Company’s tax filings being successful and the potential negative impact to the Company’s previous and future tax filings; |
| ● | risks related to any changes to the Income Tax Act (Canada) that may result in a material change to the amount of future taxes payable; |
| ● | counterparty credit and liquidity risks; |
| ● | mine operator and counterparty concentration risks; |
| ● | indebtedness and guarantees risks; |
| ● | hedging risk; |
| ● | competition in the streaming industry risk; |
| ● | risks relating to security over underlying assets; |
| ● | risks relating to third-party PMPAs; |
| ● | risks relating to revenue from royalty interests; |
| ● | risks related to Wheaton’s acquisition strategy; |
| ● | risks relating to third-party rights under PMPAs; |
| ● | risks relating to future financings and security issuances; |
| ● | risks relating to unknown defects and impairments; |
| ● | risks related to governmental regulations; |
| ● | risks related to international operations of Wheaton and the Mining Operations; |
| ● | risks relating to exploration, development, operating, expansions and improvements at the Mining Operations; |
| ● | risks related to environmental regulations; |
| ● | the ability of Wheaton and the Mining Operations to obtain and maintain necessary licenses, permits, approvals and rulings; |
| ● | the ability of Wheaton and the Mining Operations to comply with applicable laws, regulations and permitting requirements; |
| ● | lack of suitable supplies, infrastructure and employees to support the Mining Operations; |
| ● | risks related to underinsured Mining Operations; |
| ● | inability to replace and expand mineral reserves, including anticipated timing of the commencement of production by certain Mining Operations (including increases in production, estimated grades and recoveries); |
| ● | uncertainties related to title and indigenous rights with respect to the mineral properties of the Mining Operations; |
| ● | the ability of Wheaton and the Mining Operations to obtain adequate financing; |
| ● | the ability of the Mining Operations to complete permitting, construction, development and expansion; |
| ● | challenges related to global financial conditions; |
| ● | risks associated with sustainability-related matters; |
| ● | risks related to fluctuations in commodity prices of metals produced from the Mining Operations other than precious metals or cobalt; |
| ● | risks related to claims and legal proceedings against Wheaton or the Mining Operations; |
| ● | risks related to the market price of the Common Shares of Wheaton; |
| ● | the ability of Wheaton and the Mining Operations to retain key management employees or procure the services of skilled and experienced personnel; |
| ● | risks related to interest rates; |
| ● | risks related to the declaration, timing and payment of dividends; |
| ● | risks related to access to confidential information regarding Mining Operations; |
| ● | risks associated with multiple listings of the Common Shares on the LSE, NYSE and TSX; |
| ● | risks associated with a possible suspension of trading of Common Shares; |
| ● | equity price risks related to Wheaton’s holding of long-term investments in other companies; |
| ● | risks relating to activist shareholders; |
| ● | risks relating to reputational damage; |
| ● | risks relating to expression of views by industry analysts; |
| ● | risks related to the impacts of climate change and the transition to a low-carbon economy; |
WHEATON PRECIOUS METALS 2026 SECOND QUARTER REPORT - MANAGEMENT DISCUSSION & ANALYSIS [55]
| ● | risks associated with the ability to achieve climate change and environmental commitments at Wheaton and at the Mining Operations; |
| ● | risks related to ensuring the security and safety of information systems, including cyber security risks; |
| ● | risks relating to artificial intelligence; |
| ● | risks relating to compliance with anti-corruption and anti-bribery laws; |
| ● | risks relating to corporate governance and public disclosure compliance; |
| ● | risks of significant impacts on Wheaton or the Mining Operations as a result of an epidemic or pandemic; |
| ● | risks related to the adequacy of internal control over financial reporting; and |
| ● | other risks discussed in the section entitled “Description of the Business – Risk Factors” in Wheaton’s most recent Annual Information Form available on SEDAR+ at www.sedarplus.ca, and in Wheaton’s Form 40-F and Form 6-Ks, all on file with the U.S. Securities and Exchange Commission in Washington, D.C. and available on EDGAR (the “Disclosure”). |
Forward-looking statements are based on assumptions management currently believes to be reasonable, including but not limited to:
| ● | that there will be no material adverse change in the market price of commodities; |
| ● | that the Mining Operations will continue to operate and the mining projects will be completed in accordance with public statements and achieve their stated production estimates; |
| ● | that the mineral reserves and mineral resource estimates from Mining Operations (including reserve conversion rates) are accurate; |
| ● | that public disclosure and other information Wheaton receives from the owners and operators of the Mining Operations is accurate and complete; |
| ● | that the production estimates from Mining Operations are accurate; |
| ● | that each party will satisfy their obligations in accordance with the PMPAs; |
| ● | that Wheaton will continue to be able to fund or obtain funding for outstanding commitments; |
| ● | that Wheaton will be able to source and obtain accretive PMPAs; |
| ● | that the terms and conditions of a PMPA are sufficient to recover liabilities owed to the Company; |
| ● | that Wheaton has fully considered the value and impact of any third-party interests in PMPAs; |
| ● | that the Company will be able to repay the existing Revolving Credit Facility and new Term Loan; |
| ● | that expectations regarding the resolution of legal and tax matters will be achieved (including CRA audits involving the Company); |
| ● | that Wheaton has properly considered the application of Canadian tax laws to its structure and operations and that Wheaton will be able to pay taxes when due; |
| ● | that Wheaton has filed its tax returns and paid applicable taxes in compliance with applicable tax laws; |
| ● | that the trading of the Common Shares will not be adversely affected by the differences in liquidity, settlement and clearing systems as a result of multiple listings of the Common Shares on the LSE, the TSX and the NYSE; |
| ● | that the trading of the Company’s Common Shares will not be suspended; |
| ● | the estimate of the recoverable amount for any PMPA with an indicator of impairment; |
| ● | that neither Wheaton nor the Mining Operations will suffer significant impacts as a result of an epidemic or pandemic; and |
| ● | such other assumptions and factors as set out in the Disclosure. |
Although Wheaton has attempted to identify important factors that could cause actual results, level of activity, performance or achievements to differ materially from those contained in forward-looking statements, there may be other factors that cause results, level of activity, performance or achievements not to be as anticipated, estimated or intended. There can be no assurance that forward-looking statements will prove to be accurate and even if events or results described in the forward-looking statements are realized or substantially realized, there can be no assurance that they will have the expected consequences to, or effects on, Wheaton. Accordingly, readers should not place undue reliance on forward-looking statements and are cautioned that actual outcomes may vary. The forward-looking statements included herein are for the purpose of providing investors with information to assist them in understanding Wheaton’s expected financial and operational performance and may not be appropriate for other purposes. Any forward-looking statement speaks only as of the date on which it is made. Wheaton does not undertake to update any forward-looking statements that are included or incorporated by reference herein, except in accordance with applicable securities laws.
Cautionary Language Regarding Reserves and Resources
For further information on Mineral Reserves and Mineral Resources and on Wheaton more generally, readers should refer to Wheaton’s Annual Information Form for the year ended December 31, 2025 and other continuous disclosure documents filed by Wheaton since January 1, 2026, available on SEDAR+ at www.sedarplus.ca. Wheaton’s Mineral
WHEATON PRECIOUS METALS 2026 SECOND QUARTER REPORT - MANAGEMENT DISCUSSION & ANALYSIS [56]
Reserves and Mineral Resources are subject to the qualifications and notes set forth therein. Mineral Resources which are not Mineral Reserves do not have demonstrated economic viability.
Cautionary Note to United States Investors Concerning Estimates of Measured, Indicated and Inferred Resources:
The information contained herein has been prepared in accordance with the requirements of the securities laws in effect in Canada, which differ from the requirements of United States securities laws. The terms “mineral reserve”, “proven mineral reserve” and “probable mineral reserve” are Canadian mining terms defined in accordance with Canadian National Instrument 43-101 – Standards of Disclosure for Mineral Projects (“NI 43-101”) and the Canadian Institute of Mining, Metallurgy and Petroleum (the “CIM”) – CIM Definition Standards on Mineral Resources and Mineral Reserves, adopted by the CIM Council, as amended (the “CIM Definition Standards”). NI 43-101 differs significantly from the disclosure requirements of the SEC generally applicable to U.S. companies. For example, there is no assurance any mineral reserves or mineral resources that the Company may report as “proven mineral reserves”, “probable mineral reserves”, “measured mineral resources”, “indicated mineral resources” and “inferred mineral resources” under NI 43-101 would be the same had the Company prepared the reserve or resource estimates under the standards of the SEC generally applicable to U.S. companies. Accordingly, information contained herein that describes Wheaton’s mineral deposits may not be comparable to similar information made public by U.S. companies subject to reporting and disclosure requirements under the United States federal securities laws and the rules and regulations thereunder. United States investors are urged to consider closely the disclosure in Wheaton’s Form 40-F, a copy of which may be obtained from Wheaton or from http://www.sec.gov/edgar.html.
WHEATON PRECIOUS METALS 2026 SECOND QUARTER REPORT - MANAGEMENT DISCUSSION & ANALYSIS [57]

Corporate Information DIRECTORS George Brack, Lead Independent Director Jaimie Donovan Chantal Gosselin Haytham Hodaly Jeane Hull Glenn Ives Charles Jeannes Marilyn Schonberner Randy Smallwood, Chair Srinivasan Venkatakrishnan OFFICERS Haytham Hodaly President & Chief Executive Officer Curt Bernardi Executive Vice President1 Strategy & General Counsel Vincent Lau Senior Vice President & Chief Financial Officer Patrick Drouin President, Wheaton Precious Metals International & Chief Sustainability Officer TRANSFER AGENT Odyssey Trust Company 1310—1140 West Pender Street Vancouver, BC V6E 4Gl Toll free in Canada & USA 1 888 290 1175 Direct Dial 1 587 885 0960 AUDITORS Deloitte LLP VancouveG Canada INVESTOR CONTACT Emma Murray Vice President, Investor Relations Telephone: 1 604 684 9648 Toll Free: 1 844 288 9878 Email: info@wheatonpm.com CANADA - HEAD OFFICE Wheaton Precious Metals Corp. Suite 3500 1021 West Hastings Street Vancouver, BC V6E 0C3 Canada CAYMAN ISLANDS OFFICE Wheaton Precious Metals International Ltd. Suite 300, 94 Solaris Avenue Camana Bay P.O. Box 1791 GT, Grand Cayman Cayman Islands KYl-1109 STOCK EXCHANGE LISTING: Toronto Stock Exchange: WPM New York Stock Exchange: WPM London Stock Exchange: WPM Wheaton Precious Metals is a trademark of Wheaton Precious Metals Corp. in Canada, the United States and certain other jurisdictions.

Wheaton Precious Metals Corp. Suite 3500 - 1021 West Hastings St. Vancouver, BC Canada V6E OC3 T: 1604 684 9648 F: 1604 684 3123 TSX NYSE LSE:WPM wheatonpm.com value through streaming.