Q1 Fiscal 2027 Financial Results August 6, 2026
Management Presenters 2 Scott Barbour President and Chief Executive Officer Scott Cottrill Executive Vice President, Chief Financial Officer Craig Taylor President, Infiltrator Water Technologies Mike Higgins Vice President, Corporate Strategy & Investor Relations
Forward Looking Statements and Non - GAAP Financial Metrics 3 Forward Looking Statements Certain statements in this press release may be deemed to be forward - looking statements. These statements are not historical fac ts but rather are based on the Company’s current expectations, estimates and projections regarding the Company’s business, operations and other factors relating thereto. Words such as “may,” “will,” “could,” “would,” “should,” “anticipate,” “predict,” “potential,” “continue,” “expects,” “intends,” “plans,” “projects,” “believes,” “estimates,” “confident” and similar expressions are used to identify these forward - looking statements. Factors that could cause actual results to differ from those reflected in forward - looking statements relating to our operations and business include: fluctuations in the price and ava ilability of resins and other raw materials, new tariff and international trade policies, and our ability to pass any increased costs of raw materials and tariffs on to our customers in a timely manner; di sruption or volatility in general business, political and economic conditions in the markets in which we operate; cyclicality and seasonality of the non - residential and residential construction markets and infrast ructure spending; the risks of increasing competition in our existing and future markets; uncertainties surrounding the integration and realization of anticipated benefits of acquisitions or doing so within the intended timeframe, including our ability to successfully integrate NDS into our business; risks that the acquisition of NDS may involve unexpected costs, liabilities, risks that the cost savings and synerg ies from the acquisition of NDS may not be fully realized; the effect of any claims, litigation, investigations or proceedings; the effect of weather or seasonality; the loss of any of our significant customers ; the risks of doing business internationally; the risks of conducting a portion of our operations through joint ventures; our ability to expand into new geographic or product markets; the risk associated with man ufacturing processes; the effects of global climate change and any related regulatory responses; our ability to protect against cybersecurity incidents and disruptions or failures of our IT systems; o ur ability to assess and monitor the effects of artificial intelligence, machine learning, robotics and blockchain or other new approaches to data mining on our business and operations; our ability to manage our supp ly purchasing and customer credit policies; our ability to control labor costs and to attract, train and retain highly qualified employees and key personnel; our ability to protect our intellectual proper ty rights; changes in laws and regulations, including environmental laws and regulations; our ability to appropriately address any environmental, social or governance concerns that may arise from our activities; the risks associated with our current levels of indebtedness, including borrowings under our existing credit agreement and outstanding indebtedness under our existing senior notes; and other risks and uncerta inties described in the Company’s filings with the SEC. New risks and uncertainties emerge from time to time and it is not possible for the Company to predict all risks and uncertainties that cou ld have an impact on the forward - looking statements contained in this press release. In light of the significant uncertainties inherent in the forward - looking information included herein, the inclusion of such information sh ould not be regarded as a representation by the Company or any other person that the Company’s expectations, objectives or plans will be achieved in the timeframe anticipated or at all. Investor s a re cautioned not to place undue reliance on the Company’s forward - looking statements and the Company undertakes no obligation to publicly update or revise any forward - looking statements, whether as a result of new information, future events or otherwise, except as required by law. Non - GAAP Financial Measures This presentation includes references to Adjusted EBITDA and Free Cash Flow, non - GAAP financial measures. These non - GAAP financi al measures are used in addition to and in conjunction with results presented in accordance with GAAP. These measures are not intended to be substitutes for those reported in accordance with GA AP. Adjusted EBITDA and Free Cash Flow may be different from non - GAAP financial measures used by other companies, even when similar terms are used to identify such measures. EBITDA and Adjusted EBITDA are non - GAAP financial measures that comprise net income before interest, income taxes, depreciation and amortization, stock - based compensation, non - cash charges and certain other expenses. The Company’s definition of Adjusted EBITDA may differ from similar measures used by other companies, even when similar terms are used to identify such measures. Adjusted EBITDA is a key metric used by management and the Company’s board of directors to assess financial performance and evaluate t he effectiveness of the Company’s business strategies. Accordingly, management believes that Adjusted EBITDA provides useful information to investors and others in understanding and evaluating our operating results in the same manner as the Company’s management and board of directors. In order to provide investors with a meaningful reconciliation, the Company has provided reconciliations of Adjusted EBITDA to net income . Free Cash Flow is a non - GAAP financial measure that comprises cash flow from operating activities less capital expenditures. Free Cash Flow is a measure used by management and the Company’s board of directors to assess the Company’s ability to generate cash. Accordingly, management believes that Free Cash Flow provides us efu l information to investors and others in understanding and evaluating our ability to generate cash flow from operations after capital expenditures.
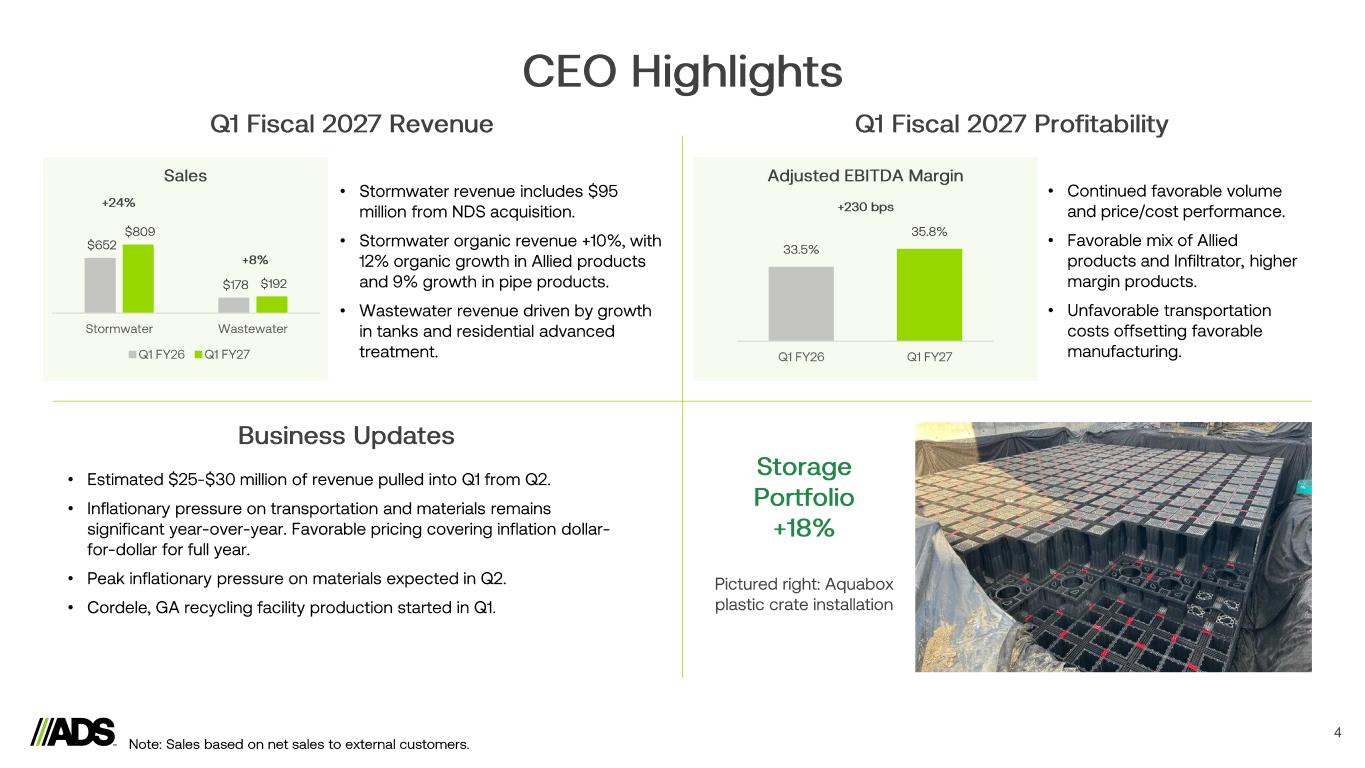
CEO Highlights 4 $652 $178 $809 $192 Stormwater Wastewater Q1 FY26 Q1 FY27 Sales +24% +8% • Stormwater revenue includes $95 million from NDS acquisition. • Stormwater organic revenue +10%, with 12% organic growth in Allied products and 9% growth in pipe products. • Wastewater revenue driven by growth in tanks and residential advanced treatment. Q1 Fiscal 2027 Revenue Q1 Fiscal 2027 Profitability 33.5% 35.8% Q1 FY26 Q1 FY27 Adjusted EBITDA Margin +230 bps • Continued favorable volume and price/cost performance. • Favorable mix of Allied products and Infiltrator, higher margin products. • Unfavorable transportation costs offsetting favorable manufacturing. Note: Sales based on net sales to external customers. Business Updates • Estimated $25 - $30 million of revenue pulled into Q1 from Q2. • Inflationary pressure on transportation and materials remains significant year - over - year. Favorable pricing covering inflation dollar - for- dollar for full year. • Peak inflationary pressure on materials expected in Q2. • Cordele, GA recycling facility production started in Q1. Storage Portfolio +18% Pictured right: Aquabox plastic crate installation
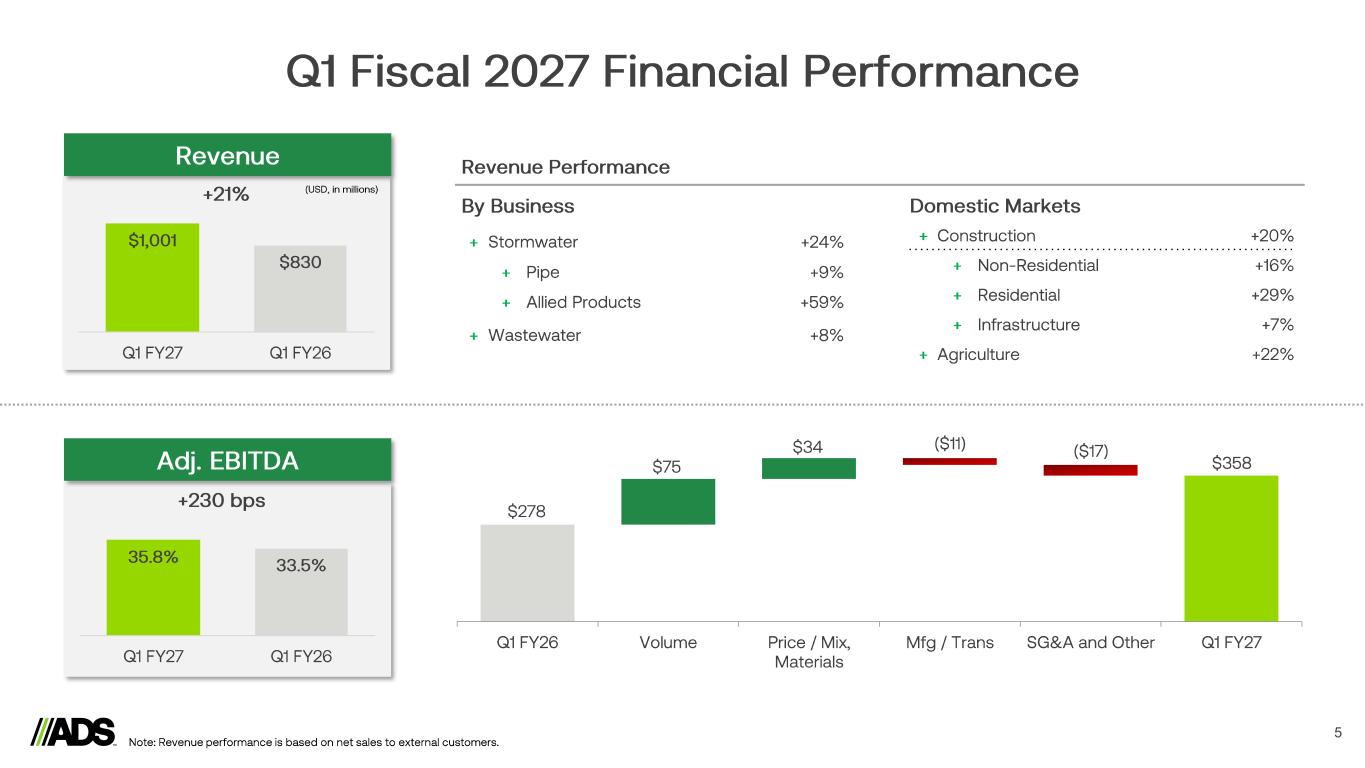
Q1 FY26 Volume Price / Mix, Materials Mfg / Trans SG&A and Other Q1 FY27 Q1 Fiscal 2027 Financial Performance 5 35.8% 33.5% Q1 FY27 Q1 FY26 $1,001 $830 Q1 FY27 Q1 FY26 +230 bps (USD, in millions)+21% Domestic Markets + Construction +20% + Non - Residential +16% + Residential +29% + Infrastructure +7% + Agriculture +22% Revenue Performance By Business + Stormwater +24% + Pipe +9% + Allied Products +59% + Wastewater +8% $278 $75 $34 ($17) $358 Revenue Adj. EBITDA ($11) Note: Revenue performance is based on net sales to external customers.
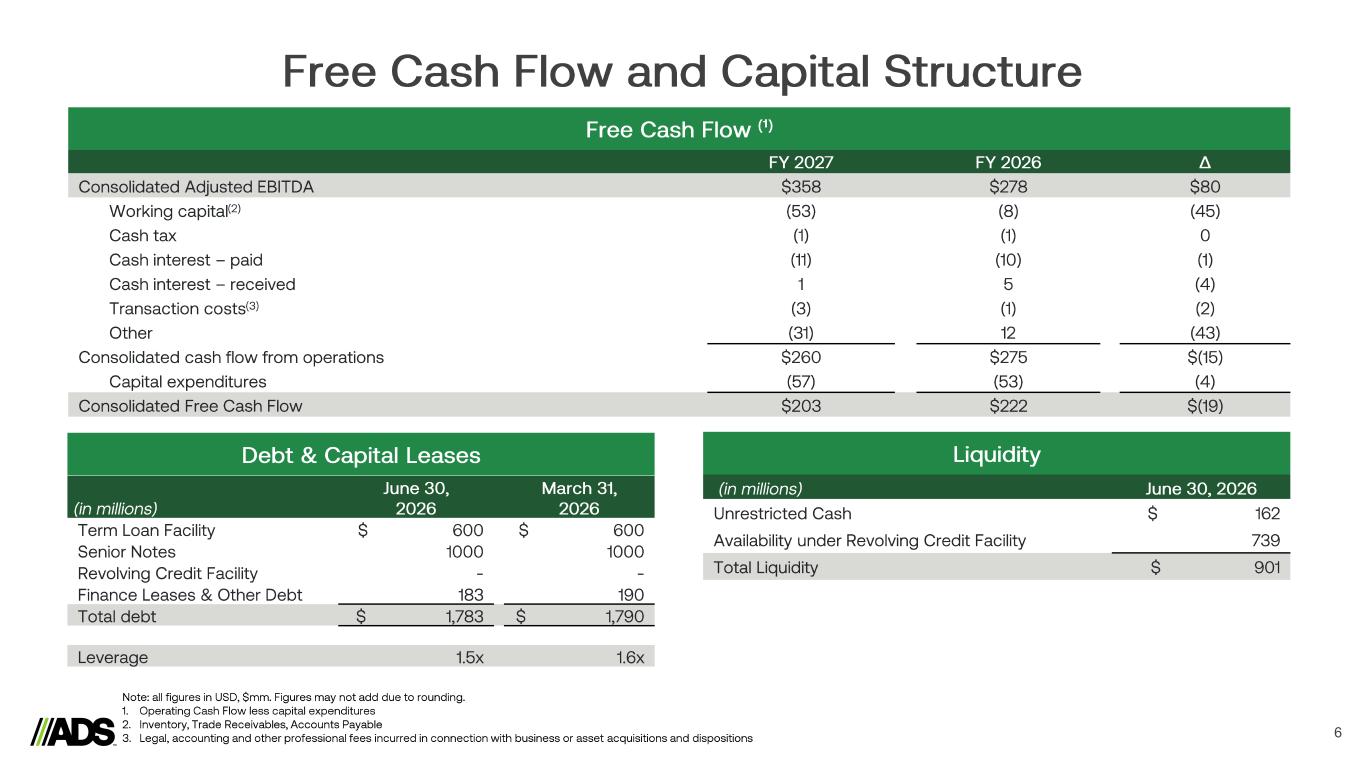
Free Cash Flow and Capital Structure 6 FY 2027 FY 2026 ∆ Consolidated Adjusted EBITDA $358 $278 $80 Working capital (2) (53) (8) (45) Cash tax (1) (1) 0 Cash interest – paid (11) (10) (1) Cash interest – received 1 5 (4) Transaction costs (3) (3) (1) (2) Other (31) 12 (43) Consolidated cash flow from operations $260 $275 $(15) Capital expenditures (57) (53) (4) Consolidated Free Cash Flow $203 $222 $(19) Free Cash Flow (¹) Note: all figures in USD, $mm. Figures may not add due to rounding. 1. Operating Cash Flow less capital expenditures 2. Inventory, Trade Receivables, Accounts Payable 3. Legal, accounting and other professional fees incurred in connection with business or asset acquisitions and dispositions (in millions) June 30, 2026 March 31, 2026 Term Loan Facility $ 600 $ 600 Senior Notes 1000 1000 Revolving Credit Facility - - Finance Leases & Other Debt 183 190 Total debt $ 1,783 $ 1,790 Leverage 1.5x 1.6x Debt & Capital Leases (in millions) June 30, 2026 Unrestricted Cash $ 162 Availability under Revolving Credit Facility 739 Total Liquidity $ 901 Liquidity
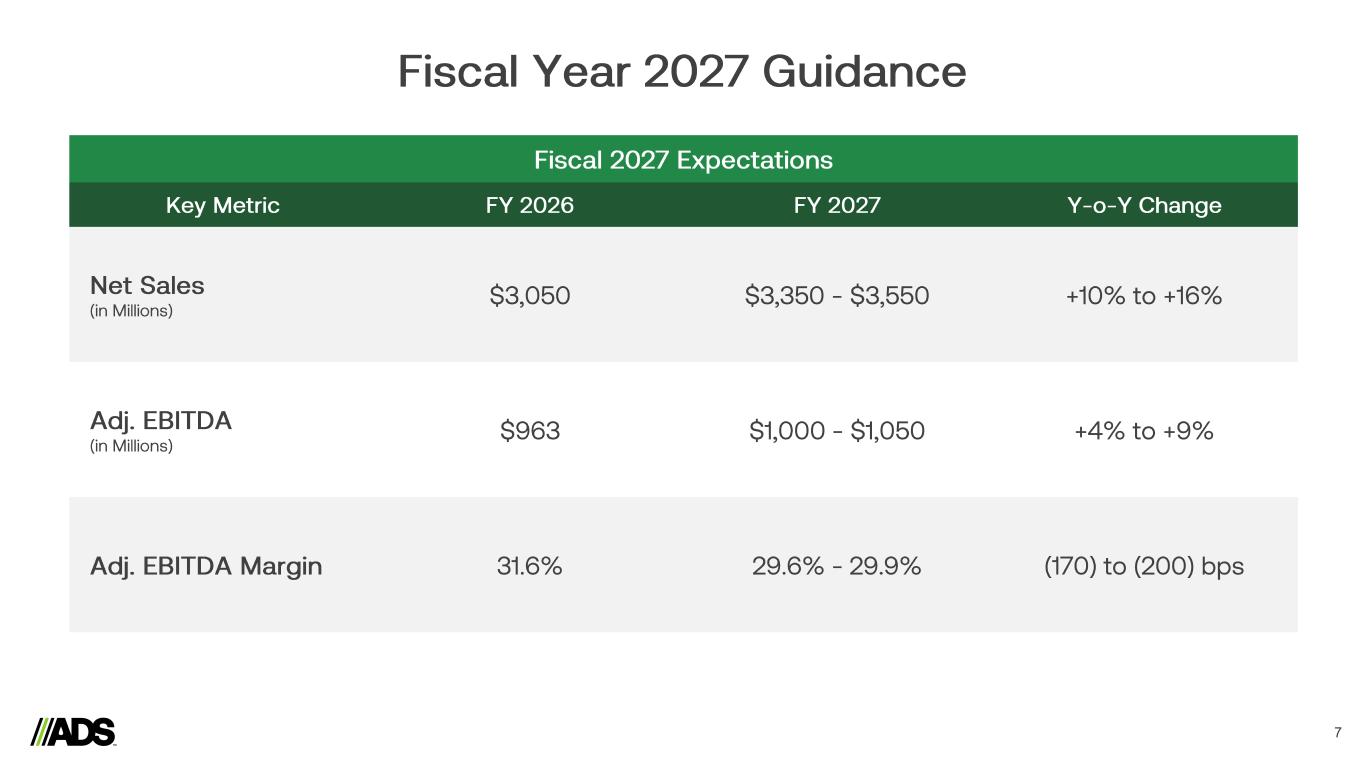
Fiscal Year 2027 Guidance 7 Key Metric FY 2026 FY 2027 Y - o- Y Change Net Sales (in Millions) $3,050 $3,350 - $3,550 +10% to +16% Adj. EBITDA (in Millions) $963 $1,000 - $1,050 +4% to +9% Adj. EBITDA Margin 31.6% 29.6% - 29.9% (170) to (200) bps Fiscal 2027 Expectations

Q&A

Appendix 9
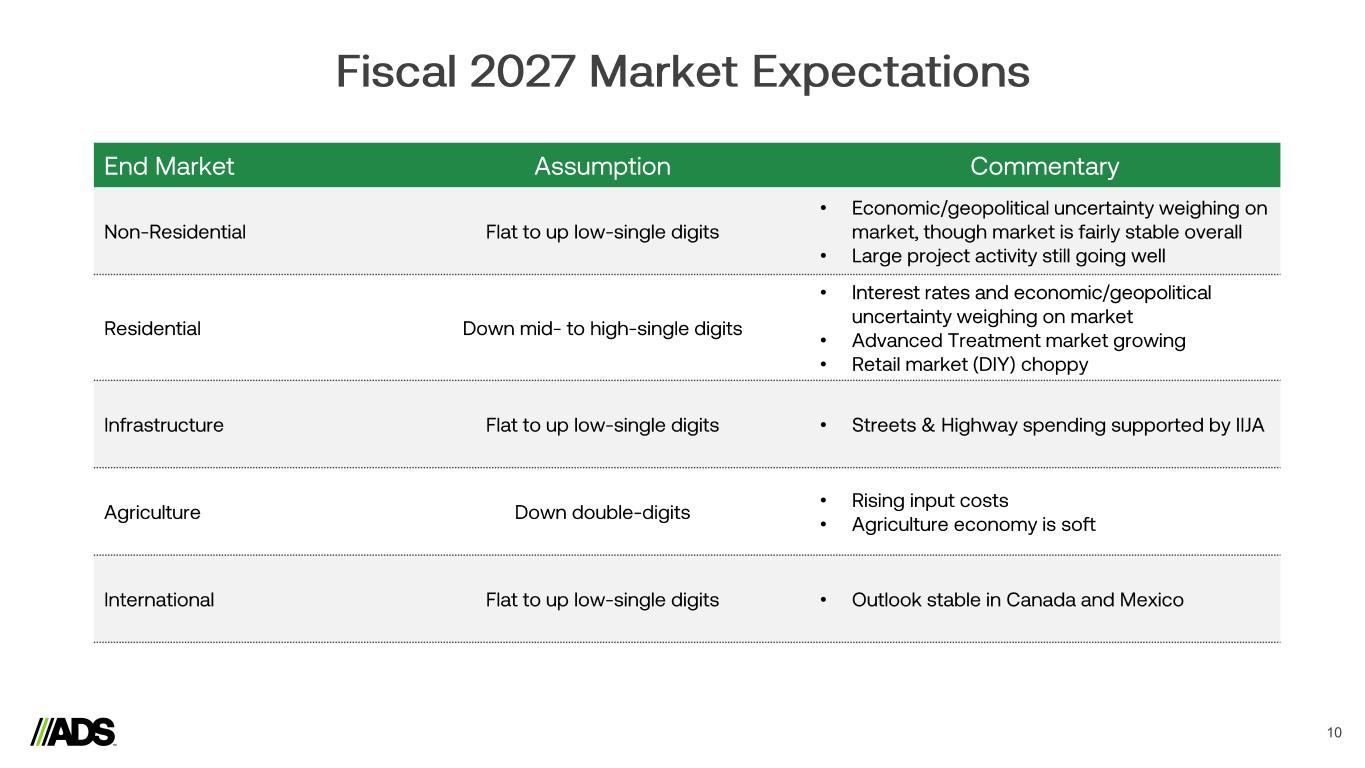
Fiscal 2027 Market Expectations 10 End Market Assumption Commentary Non - Residential Flat to up low - single digits • Economic/geopolitical uncertainty weighing on market, though market is fairly stable overall • Large project activity still going well Residential Down mid - to high - single digits • Interest rates and economic/geopolitical uncertainty weighing on market • Advanced Treatment market growing • Retail market (DIY) choppy Infrastructure Flat to up low - single digits • Streets & Highway spending supported by IIJA Agriculture Down double - digits • Rising input costs • Agriculture economy is soft International Flat to up low - single digits • Outlook stable in Canada and Mexico
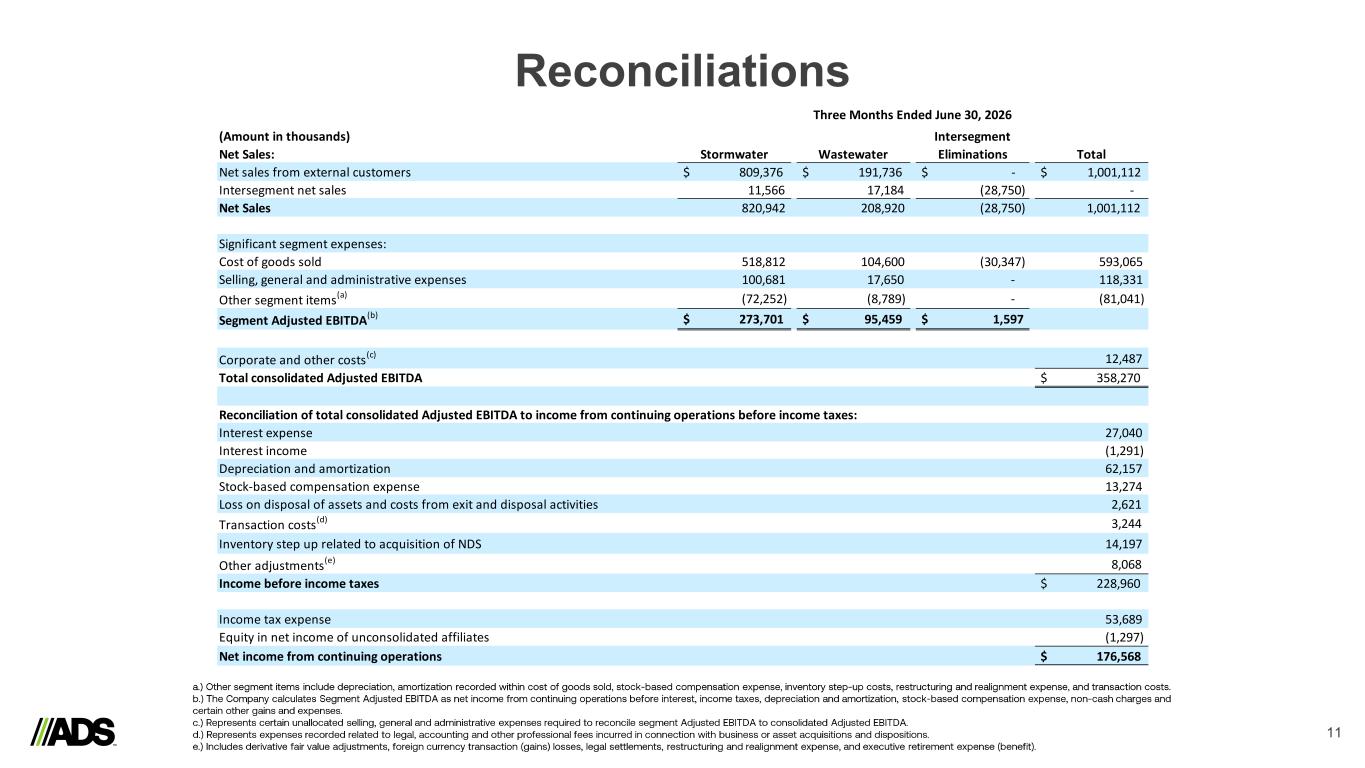
Reconciliations 11 a.) Other segment items include depreciation, amortization recorded within cost of goods sold, stock - based compensation expense, inventory step - up costs, restructuring and realignment expense, and transaction costs. b.) The Company calculates Segment Adjusted EBITDA as net income from continuing operations before interest, income taxes, de preciation and amortization, stock - based compensation expense, non - cash charges and certain other gains and expenses. c.) Represents certain unallocated selling, general and administrative expenses required to reconcile segment Adjusted EBITDA to consolidated Adjusted EBITDA. d.) Represents expenses recorded related to legal, accounting and other professional fees incurred in connection with busines s o r asset acquisitions and dispositions. e.) Includes derivative fair value adjustments, foreign currency transaction (gains) losses, legal settlements, restructuring and realignment expense, and executive retirement expense (benefit). (Amount in thousands) Net Sales: Stormwater Wastewater Intersegment Eliminations Total Net sales from external customers $ 809,376 $ 191,736 $ - $ 1,001,112 Intersegment net sales 11,566 17,184 (28,750) - Net Sales 820,942 208,920 (28,750) 1,001,112 Significant segment expenses: Cost of goods sold 518,812 104,600 (30,347) 593,065 Selling, general and administrative expenses 100,681 17,650 - 118,331 Other segment items(a) (72,252) (8,789) - (81,041) Segment Adjusted EBITDA(b) $ 273,701 $ 95,459 $ 1,597 Corporate and other costs(c) 12,487 Total consolidated Adjusted EBITDA $ 358,270 Interest expense 27,040 Interest income (1,291) Depreciation and amortization 62,157 Stock-based compensation expense 13,274 Loss on disposal of assets and costs from exit and disposal activities 2,621 Transaction costs(d) 3,244 Inventory step up related to acquisition of NDS 14,197 Other adjustments (e) 8,068 Income before income taxes $ 228,960 Income tax expense 53,689 Equity in net income of unconsolidated affiliates (1,297) Net income from continuing operations $ 176,568 Three Months Ended June 30, 2026 Reconciliation of total consolidated Adjusted EBITDA to income from continuing operations before income taxes:
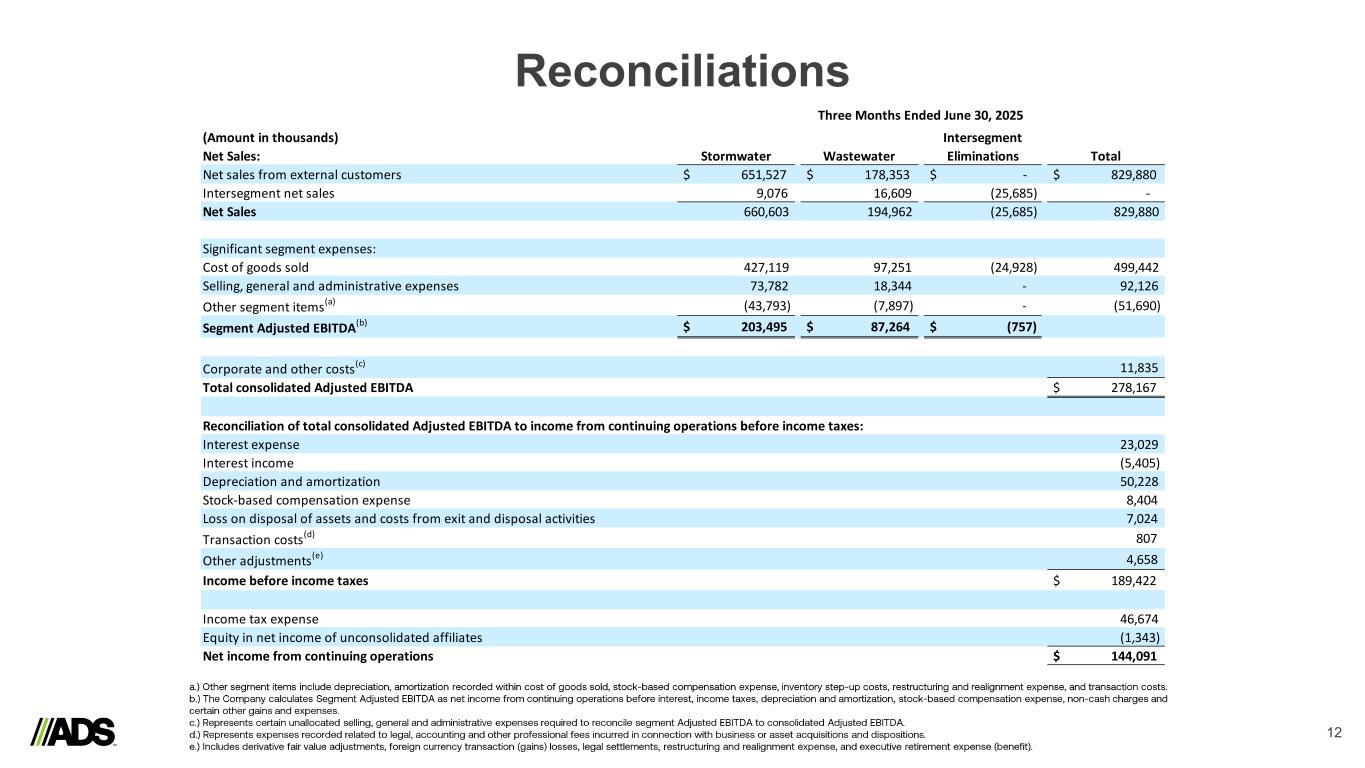
Reconciliations 12 (Amount in thousands) Net Sales: Stormwater Wastewater Intersegment Eliminations Total Net sales from external customers $ 651,527 $ 178,353 $ - $ 829,880 Intersegment net sales 9,076 16,609 (25,685) - Net Sales 660,603 194,962 (25,685) 829,880 Significant segment expenses: Cost of goods sold 427,119 97,251 (24,928) 499,442 Selling, general and administrative expenses 73,782 18,344 - 92,126 Other segment items (a) (43,793) (7,897) - (51,690) Segment Adjusted EBITDA(b) $ 203,495 $ 87,264 $ (757) Corporate and other costs(c) 11,835 Total consolidated Adjusted EBITDA $ 278,167 Interest expense 23,029 Interest income (5,405) Depreciation and amortization 50,228 Stock-based compensation expense 8,404 Loss on disposal of assets and costs from exit and disposal activities 7,024 Transaction costs(d) 807 Other adjustments(e) 4,658 Income before income taxes $ 189,422 Income tax expense 46,674 Equity in net income of unconsolidated affiliates (1,343) Net income from continuing operations $ 144,091 Three Months Ended June 30, 2025 Reconciliation of total consolidated Adjusted EBITDA to income from continuing operations before income taxes: a.) Other segment items include depreciation, amortization recorded within cost of goods sold, stock - based compensation expense, inventory step - up costs, restructuring and realignment expense, and transaction costs. b.) The Company calculates Segment Adjusted EBITDA as net income from continuing operations before interest, income taxes, de preciation and amortization, stock - based compensation expense, non - cash charges and certain other gains and expenses. c.) Represents certain unallocated selling, general and administrative expenses required to reconcile segment Adjusted EBITDA to consolidated Adjusted EBITDA. d.) Represents expenses recorded related to legal, accounting and other professional fees incurred in connection with busines s o r asset acquisitions and dispositions. e.) Includes derivative fair value adjustments, foreign currency transaction (gains) losses, legal settlements, restructuring and realignment expense, and executive retirement expense (benefit).
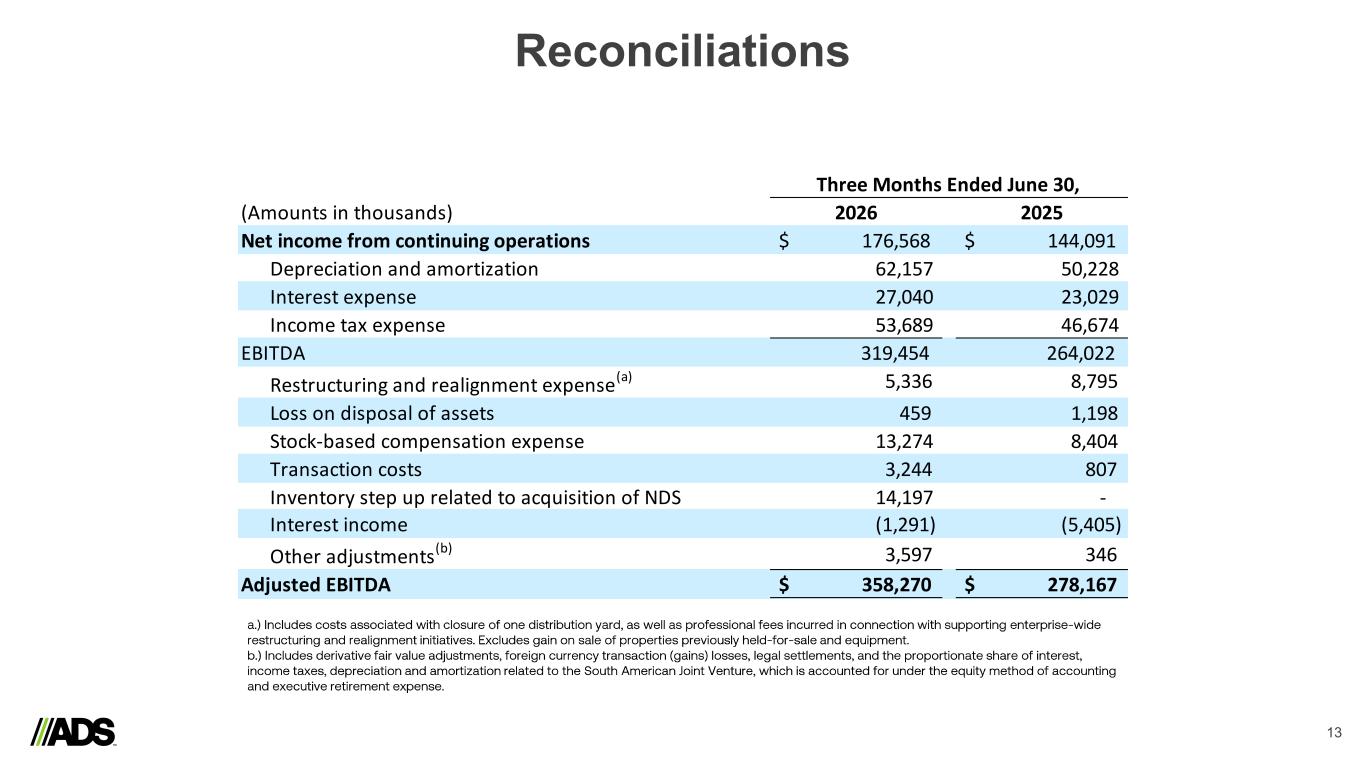
13 Reconciliations a.) Includes costs associated with closure of one distribution yard, as well as professional fees incurred in connection with su pporting enterprise - wide restructuring and realignment initiatives. Excludes gain on sale of properties previously held - for- sale and equipment. b.) Includes derivative fair value adjustments, foreign currency transaction (gains) losses, legal settlements, and the propo rtionate share of interest, income taxes, depreciation and amortization related to the South American Joint Venture, which is accounted for under the equ ity method of accounting and executive retirement expense. (Amounts in thousands) 2026 2025 Net income from continuing operations $ 176,568 $ 144,091 Depreciation and amortization 62,157 50,228 Interest expense 27,040 23,029 Income tax expense 53,689 46,674 EBITDA 319,454 264,022 Restructuring and realignment expense(a) 5,336 8,795 Loss on disposal of assets 459 1,198 Stock-based compensation expense 13,274 8,404 Transaction costs 3,244 807 Inventory step up related to acquisition of NDS 14,197 - Interest income (1,291) (5,405) Other adjustments(b) 3,597 346 Adjusted EBITDA $ 358,270 $ 278,167 Three Months Ended June 30,