Shareholder Report
May 31, 2026
USD ($)
$ / shares
WHAT WERE THE FUND COSTS FOR THE PAST YEAR? (based on a hypothetical $10,000 investment)
|
Class Name
|
Costs of a $10,000 investment
|
Costs paid as a percentage of a $10,000 investment
|
|
Class K1
|
$121
|
0.99%
|
HOW DID THE FUND PERFORM LAST YEAR AND WHAT AFFECTED ITS PERFORMANCE?
Iman Fund (IMANX) – One-Year Performance Summary
The Iman Fund delivered an exceptional year, outperforming both conventional and Islamic equity benchmarks while maintaining its disciplined Shariah-compliant investment strategy.
For the one-year period ending May 31, 2026, the Fund returned 44.98%, compared with 29.78% for the S&P 500, and 37.86% for the Dow Jones Islamic Market World Index. This represents outperformance of 15.13 percentage points over the S&P 500, and 7.05 percentage points over the Dow Jones Islamic Market World Index.
Factors Contributing to Performance:
• Technology Leadership: The Fund maintained a meaningful overweight position in high-quality technology companies. Continued investment in businesses benefiting from artificial intelligence, cloud computing, semiconductor demand, and digital infrastructure provided a significant tailwind as these segments remained among the strongest performers in the market.
• Energy Exposure: Unlike many traditional growth funds, the Iman Fund also benefited from a meaningful allocation to energy-related companies. Strong earnings, disciplined capital allocation, and resilient commodity prices enabled the energy sector to contribute positively to overall returns while providing diversification away from technology.
• High-Conviction Portfolio: The Fund’s focused investment approach allowed its strongest investment ideas to have a meaningful impact on performance. Rather than closely tracking an index, the portfolio emphasizes companies with durable competitive advantages, strong balance sheets, attractive valuations, and long-term earnings growth.
• Disciplined Shariah Screening: The Fund’s rigorous Shariah screening naturally excludes highly leveraged businesses and interest-based financial institutions. While these exclusions can create periods of relative underperformance, they also tend to result in a portfolio of companies with stronger financial characteristics and lower leverage, which has benefited investors during the recent market environment.
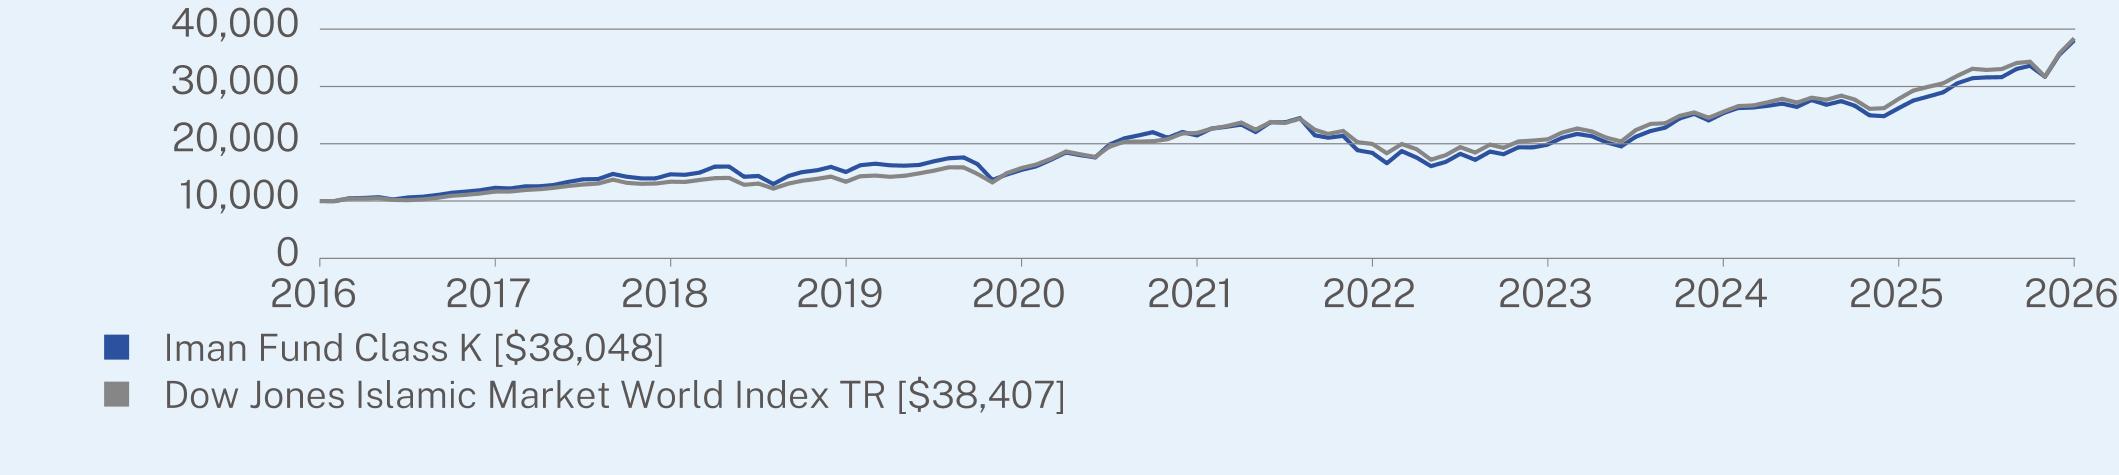
ANNUAL AVERAGE TOTAL RETURN (%)
|
|
1 Year
|
5 Year
|
10 Year
|
|
Class K (without sales charge)
|
44.98
|
12.14
|
14.30
|
|
Dow Jones Islamic Market World Index TR
|
37.86
|
11.90
|
14.40
|
Visit https://investaaa.com/literature/for more recent performance information.
KEY FUND STATISTICS (as of May 31, 2026)
|
Net Assets
|
$268,800,368
|
Net Advisory Fee
|
$1,575,446
|
|
|
Number of Holdings
|
119
|
Portfolio Turnover
|
41%
|
WHAT DID THE FUND INVEST IN? (as of May 31, 2026)
|
Industry
|
(%)
|
|
Semiconductor & Other Elec. Component Mfg.
|
26.2%
|
|
Computer Systems Design & Related Services
|
11.5%
|
|
Communications Equipment Manufacturing
|
9.1%
|
|
Software Publishers
|
6.3%
|
|
Pharmaceutical & Medicine Manufacturing
|
6.1%
|
|
Medical Equipment & Supplies Manufacturing
|
3.9%
|
|
Oil & Gas Extraction
|
3.8%
|
|
Petroleum & Coal Products Manufacturing
|
3.0%
|
|
Metal Ore Mining
|
3.0%
|
|
Cash & Other
|
27.1%
|
|
Top 10 Issuers
|
(%)
|
|
Alphabet, Inc.
|
9.5%
|
|
Apple, Inc.
|
8.0%
|
|
NVIDIA Corp.
|
6.5%
|
|
Taiwan Semiconductor Manufacturing Co. Ltd.
|
5.4%
|
|
Microsoft Corp.
|
5.3%
|
|
Micron Technology, Inc.
|
3.7%
|
|
Exxon Mobil Corp.
|
3.5%
|
|
Eli Lilly & Co.
|
3.4%
|
|
Broadcom, Inc.
|
3.0%
|
|
Meta Platforms, Inc.
|
2.8%
|
HOW HAS THE FUND CHANGED?
The Fund has not had any material changes during the period covered by this report.
| [1] |
|