Exhibit 99.2
| 1 Trademark of Trinseo PLC or its affiliates Second Quarter 2026 Financial Results August 6, 2026 |

| 2 Disclosure Rules This presentation may contain forward-looking statements including, without limitation, statements concerning plans, objectives, goals, projections, forecasts, strategies, future events or performance, and underlying assumptions and other statements, which are not statements of historical facts. Forward-looking statements may be identified by the use of words like “expect,” “anticipate,” “believe,” “intend,” “forecast,” ”estimate,” “see,” “outlook,” “will,” “may,” “might,” “potential,” “likely,” “target,” “plan,” “contemplate,” “seek,” “attempt,” “should,” “could,” “would,” or expressions of similar meaning. Forward-looking statements reflect management’s evaluation of information currently available and are based on our current expectations and assumptions regarding our business, the economy, our current indebtedness, and other future conditions. Because forward-looking statements relate to the future, they are subject to inherent uncertainties, risks and changes in circumstances that are difficult to predict. Factors that might cause future results to differ from those expressed by the forward-looking statements include, but are not limited to, our ability to obtain approval of the joint prepackaged plan of reorganization or other motions or requests made with respect to the voluntary petitions for relief under Chapter 11 of Title 11 of the United States Code in the United States Bankruptcy Court for the Southern District of Texas (the “Chapter 11 Cases”); our ability to consummate the plan of reorganization and emerge from Chapter 11 within our currently expected timeline or at all; the effects of the Chapter 11 Cases, including increased professional costs, on our liquidity, results of operations and business; the outcome of litigation related to the Chapter 11 Cases; the consummation of the transactions contemplated by the plan of reorganization, including the ability of the parties to negotiate definitive agreements and satisfy the other conditions of the plan of reorganization, including completion of the Irish examinership proceedings and other regulatory filings; our ability to continue as a going concern; our ongoing discussions with ou financial stakeholders; our significant levels of indebtedness and our ability to service, repay or refinance our indebtedness; our ability to meet the covenants under our existin indebtedness; deterioration of our credit profile limiting our access to commercial credit; unexpected payment obligations or liabilities which could create liquidit challenges; conditions in the global economy and capital markets, including persistent decreased customer demand and the impact of tariffs on global trade relations; our ability t successfully generate cost savings through restructuring and cost reduction initiatives; our ability to successfully execute our business and transformation strategy; increased costs o disruption in the supply of raw materials; increased energy costs; the timing of, and our ability to complete, a sale of our interest in Americas Styrenics; compliance with laws a regulations impacting our business; any disruptions in production at our chemical manufacturing facilities, including those resulting from accidental spills or discharges; our ability t generate cash flows from operations and achieve our forecasted cash flows; and those discussed in our Annual Report on Form 10-K, under Part I, Item 1A —"Risk Factors" and elsewhere in our other reports, filings and furnishings made with the U.S. Securities and Exchange Commission from time to time. As a result of these or other factors, our actual results, performance or achievements may differ materially from those contemplated by the forward-looking statements. Therefore, we caution you against relying on any of these forward-looking statements. The forward-looking statements included in this presentation are made only as of the date hereof. We undertake no obligation to publicly update or revise any forward-looking statement as a result of new information, future events or otherwise, except as otherwise required by law. This presentation contains financial measures that are not in accordance with generally accepted accounting principles in the US (“GAAP”) including EBITDA, Adjusted EBITDA, Adjusted Net Income, Adjusted EPS and Free Cash Flow. We believe these measures provide relevant and meaningful information to investors and lenders about the ongoing operating results and liquidity position of the Company. Such measures when referenced herein should not be viewed as an alternative to GAAP measures of performance or liquidity, as applicable. We have provided a reconciliation of these measures to the most comparable GAAP metric alongside of the respective measure or otherwise in the Appendix section and in the accompanying press release. |
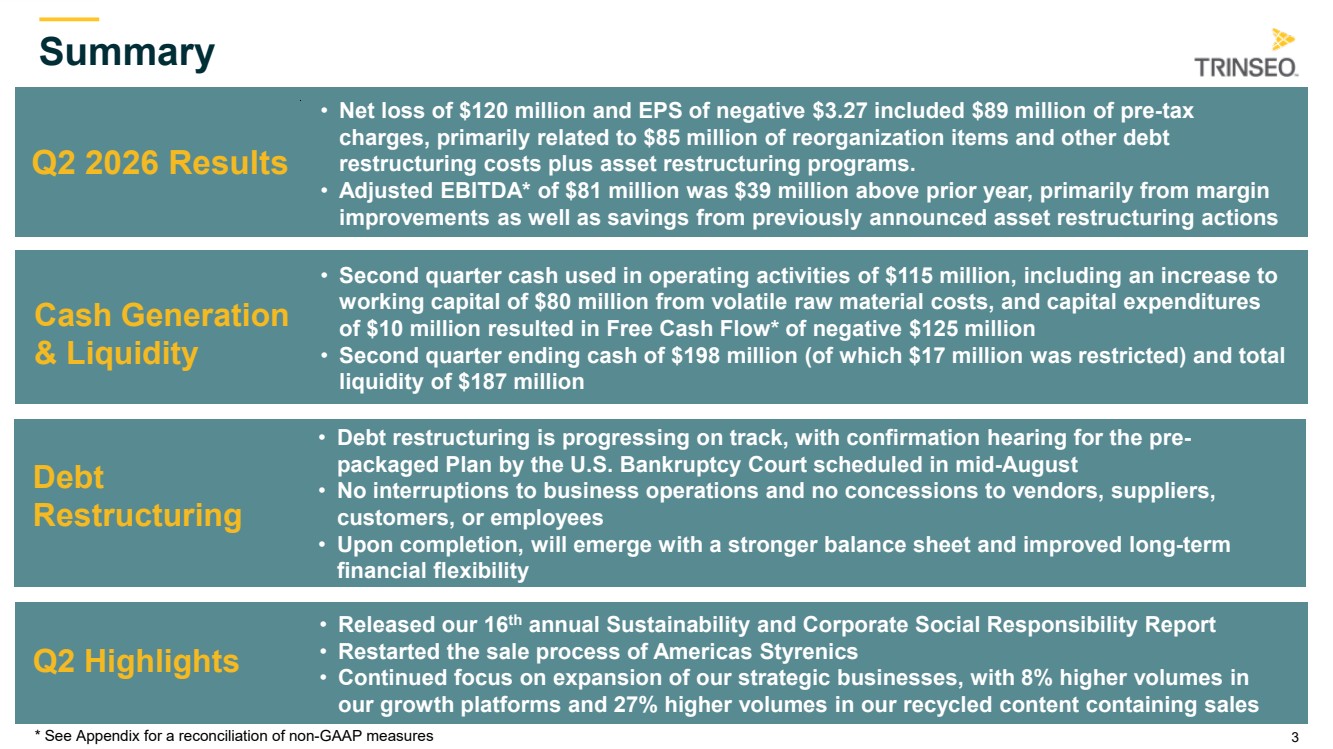
| 3 Summary Q2 2026 Results • Net loss of $120 million and EPS of negative $3.27 included $89 million of pre-tax charges, primarily related to $85 million of reorganization items and other debt restructuring costs plus asset restructuring programs. • Adjusted EBITDA* of $81 million was $39 million above prior year, primarily from margin improvements as well as savings from previously announced asset restructuring actions * See Appendix for a reconciliation of non-GAAP measures Cash Generation & Liquidity • Second quarter cash used in operating activities of $115 million, including an increase to working capital of $80 million from volatile raw material costs, and capital expenditures of $10 million resulted in Free Cash Flow* of negative $125 million • Second quarter ending cash of $198 million (of which $17 million was restricted) and total liquidity of $187 million Q2 Highlights • Released our 16th annual Sustainability and Corporate Social Responsibility Report • Restarted the sale process of Americas Styrenics • Continued focus on expansion of our strategic businesses, with 8% higher volumes in our growth platforms and 27% higher volumes in our recycled content containing sales Debt Restructuring • Debt restructuring is progressing on track, with confirmation hearing for the pre-packaged Plan by the U.S. Bankruptcy Court scheduled in mid-August • No interruptions to business operations and no concessions to vendors, suppliers, customers, or employees • Upon completion, will emerge with a stronger balance sheet and improved long-term financial flexibility |
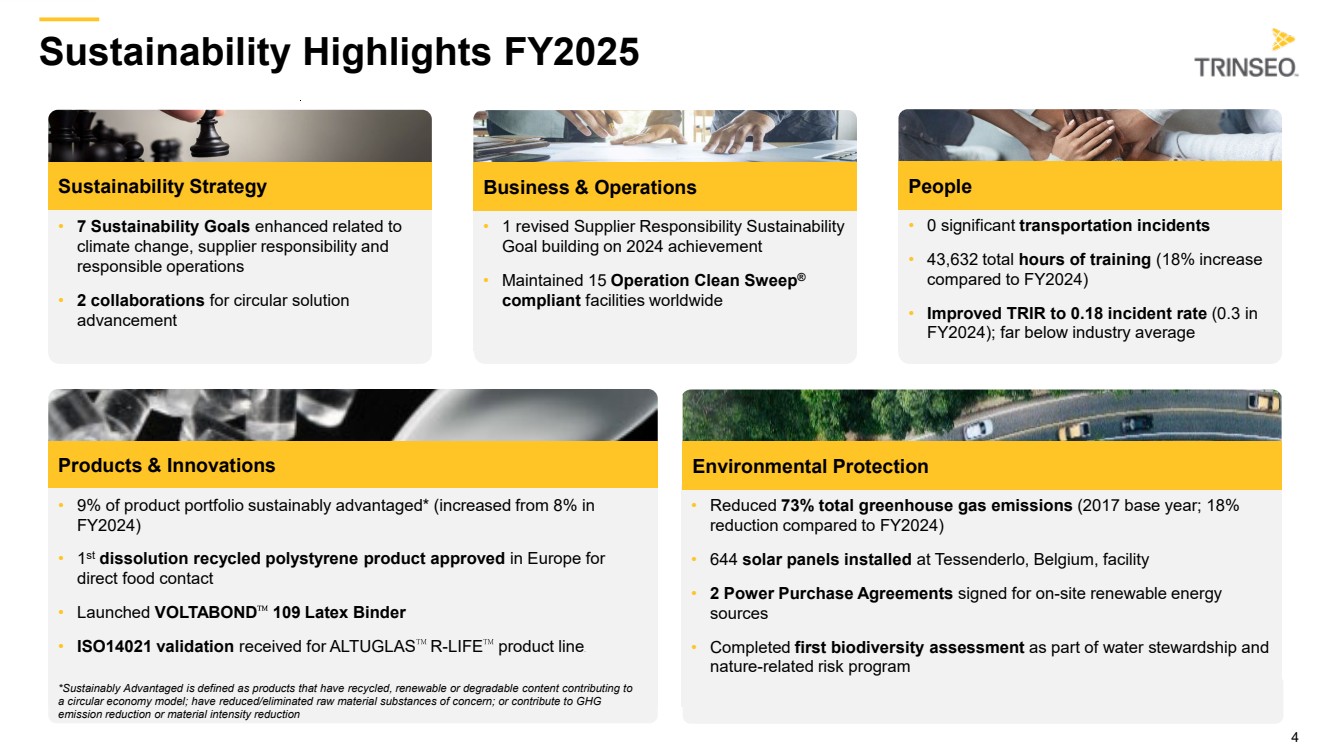
| 4 Sustainability Highlights FY2025 • 7 Sustainability Goals enhanced related to climate change, supplier responsibility and responsible operations • 2 collaborations for circular solution advancement • Reduced 73% total greenhouse gas emissions (2017 base year; 18% reduction compared to FY2024) • 644 solar panels installed at Tessenderlo, Belgium, facility • 2 Power Purchase Agreements signed for on-site renewable energy sources • Completed first biodiversity assessment as part of water stewardship and nature-related risk program • 1 revised Supplier Responsibility Sustainability Goal building on 2024 achievement • Maintained 15 Operation Clean Sweep® compliant facilities worldwide • 9% of product portfolio sustainably advantaged* (increased from 8% in FY2024) • 1st dissolution recycled polystyrene product approved in Europe for direct food contact • Launched VOLTABOND 109 Latex Binder • ISO14021 validation received for ALTUGLAS R-LIFE product line. • 0 significant transportation incidents • 43,632 total hours of training (18% increase compared to FY2024) • Improved TRIR to 0.18 incident rate (0.3 in FY2024); far below industry average *Sustainably Advantaged is defined as products that have recycled, renewable or degradable content contributing to a circular economy model; have reduced/eliminated raw material substances of concern; or contribute to GH emission reduction or material intensity reduction Products & Innovations Environmental Protection Sustainability Strategy Business & Operations People |
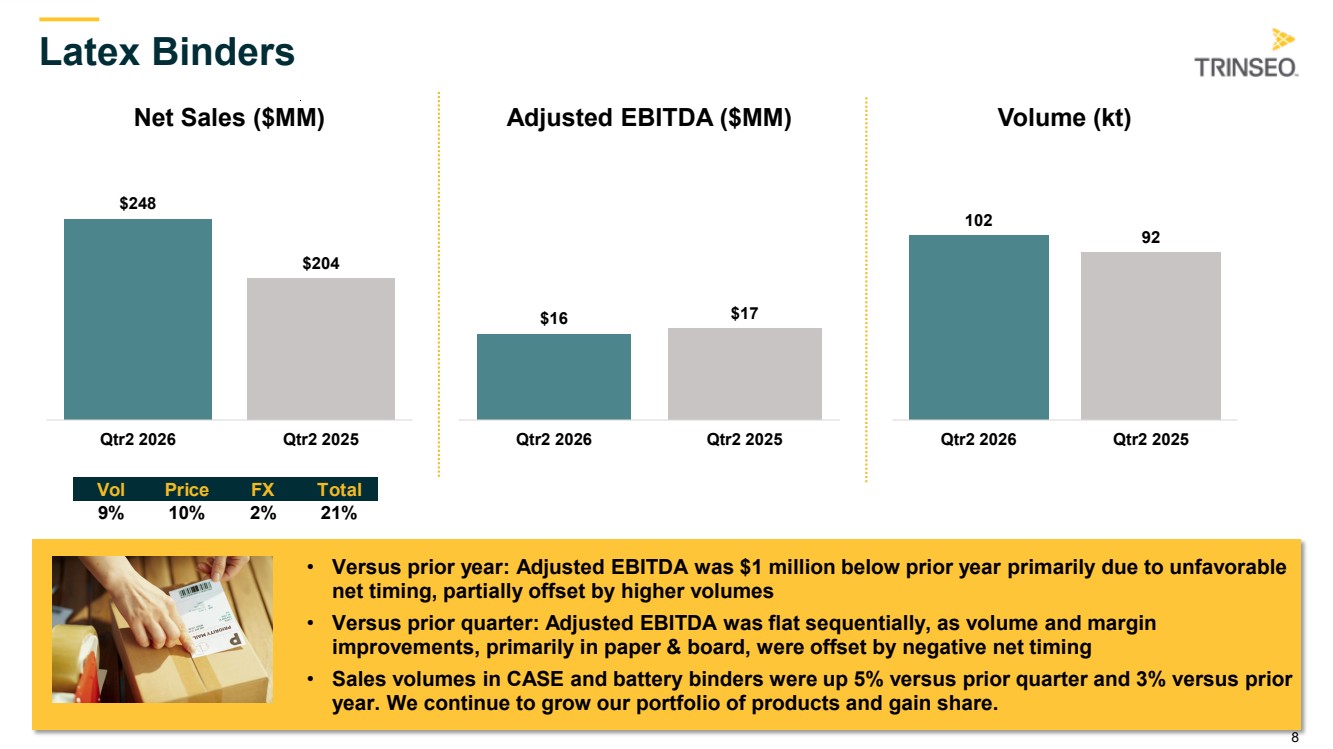
| 5 Q2 2026 Sales and Volume Summary Q2 Net sales in $millions Q2 Volume variances exclude styrene-related sales Second Quarter Volume Drivers: Europe • Lower volumes in polystyrene, primarily from Tessenderlo’s force majeure that resulted from damage to operating components of the plant caused by a severe storm in late March; operations were fully restored by the end of May • Lower volumes in MMA due to closure of our virgin MMA production facilities in Italy • Partial offset from higher Latex Binders volumes in paper & board and CASE applications U.S. • Higher volumes in paper & board and textile from commercial initiatives • Higher volumes in PMMA resins due to commercial wins • Lower volumes in ABS from destocking related to high raw material costs Asia • Higher volumes in paper & board and textile from commercial initiatives and prior year tariff headwinds • Higher volumes in battery binders from new products and continued strategic expansion • Lower demand in Polymer Solutions Net Sales Global $845 Sales Volume YoY: (8)% Sales Volume YoY: (17)% Sales Volume YoY: 4% Sales Volume YoY: 0% Europe $377 U.S. $253 Asia-Pacific $186 Rest of World $29 |
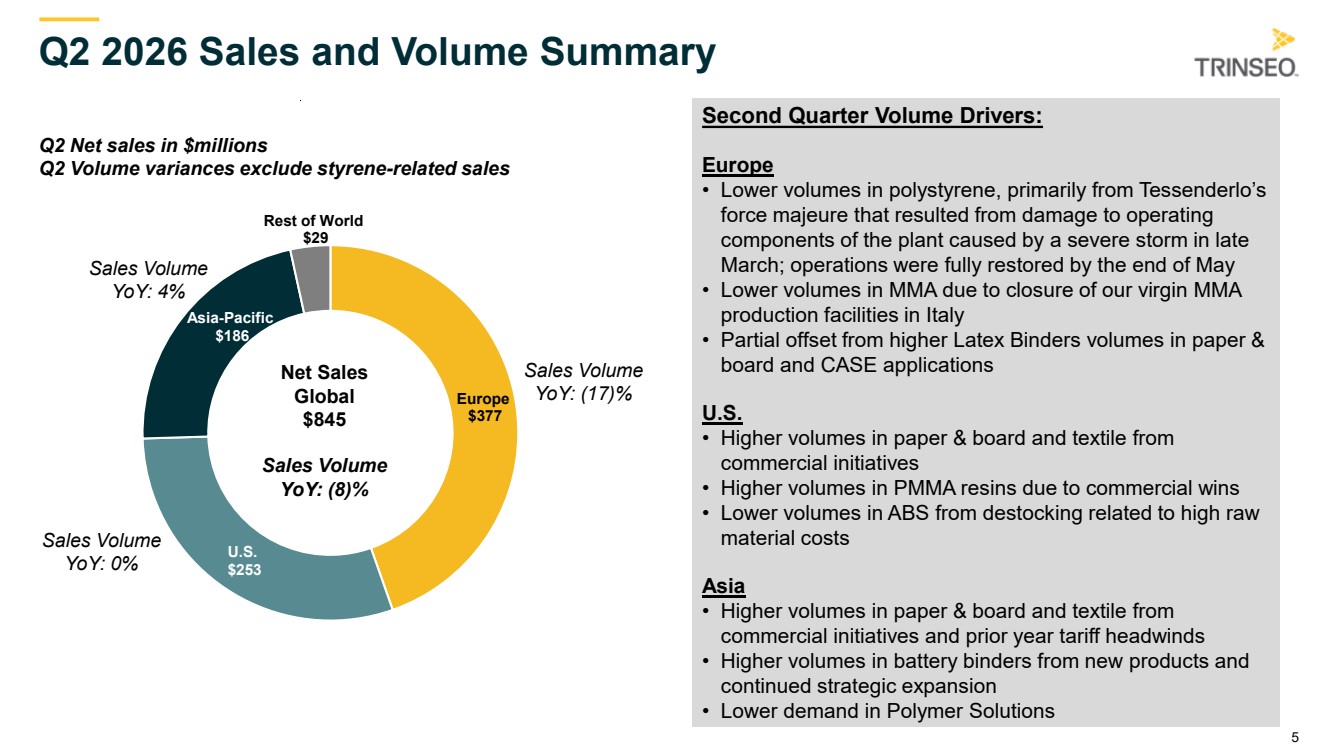
| 6 Vol Price FX Total (5%) 11% 2% 8% $845 ($120) $784 ($106) Net Sales Net Loss Net Sales & Net Loss ($MM) Q2'26 Q2'25 Trinseo Q2 2026 Financial Results Net Sales • Versus prior year: Adjusted EBITDA* of $81 million was $39 million above prior year primarily due to margin improvements in Polymer Solutions and Engineered Materials, commercial initiatives, and savings from previously announced asset restructuring actions in the current year; Q2 results included $17 million of net timing favorability as compared to prior year • Versus prior quarter: Adjusted EBITDA* increase of $28 million above prior year due to margin improvements in Polymer Solutions and higher volumes and margins in Engineered Materials • Equity affiliate income from Americas Styrenics was $1 million in the quarter, versus $8 million in prior year and $2 million in prior quarter, with the declines versus both periods primarily from higher raw material costs and soft end market demand * See Appendix for a reconciliation of non-GAAP measures $81 $42 Q2'26 Q2'25 Adjusted EBITDA* ($MM) ($3.27) ($0.74) ($2.95) ($2.12) Diluted EPS Adj EPS* EPS ($) Q2'26 Q2'25 |
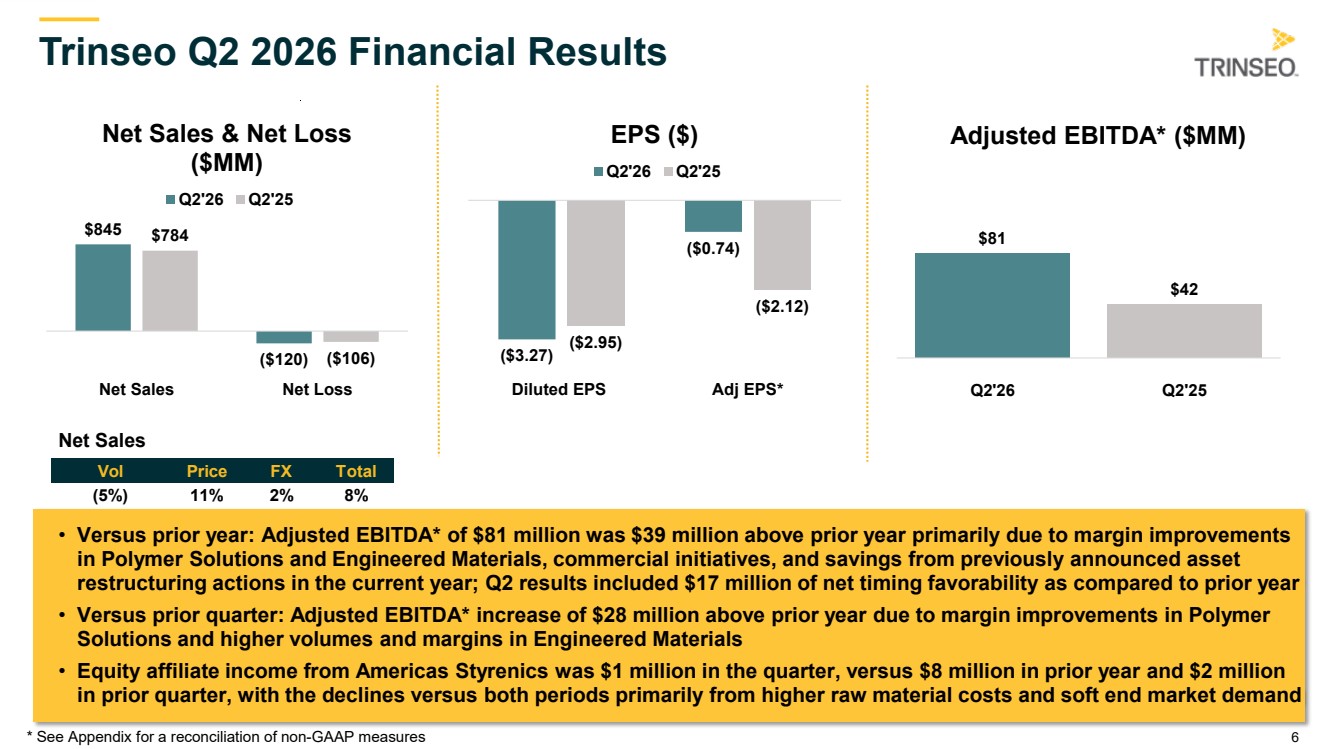
| 7 Engineered Materials • Versus prior year: Adjusted EBITDA was $12 million higher, due to global margin expansion from strategic product mix improvements with lower MMA and higher PMMA resin volumes, plus lower fixed costs driven by savings from the closure of our virgin MMA production facilities in Italy • Versus prior quarter: Adjusted EBITDA increase of $9 million was attributable to Compounding and PMMA Resins, primarily from improved margins particularly in Europe • Volumes of recycled content containing products in Engineered Materials grew 23% in the quarter versus prior year Vol Price FX Total (3%) 1% 1% (1%) $292 $293 Qtr2 2026 Qtr2 2025 Net Sales ($MM) $43 $31 Qtr2 2026 Qtr2 2025 Adjusted EBITDA ($MM) 70 76 Qtr2 2026 Qtr2 2025 Volume (kt) |
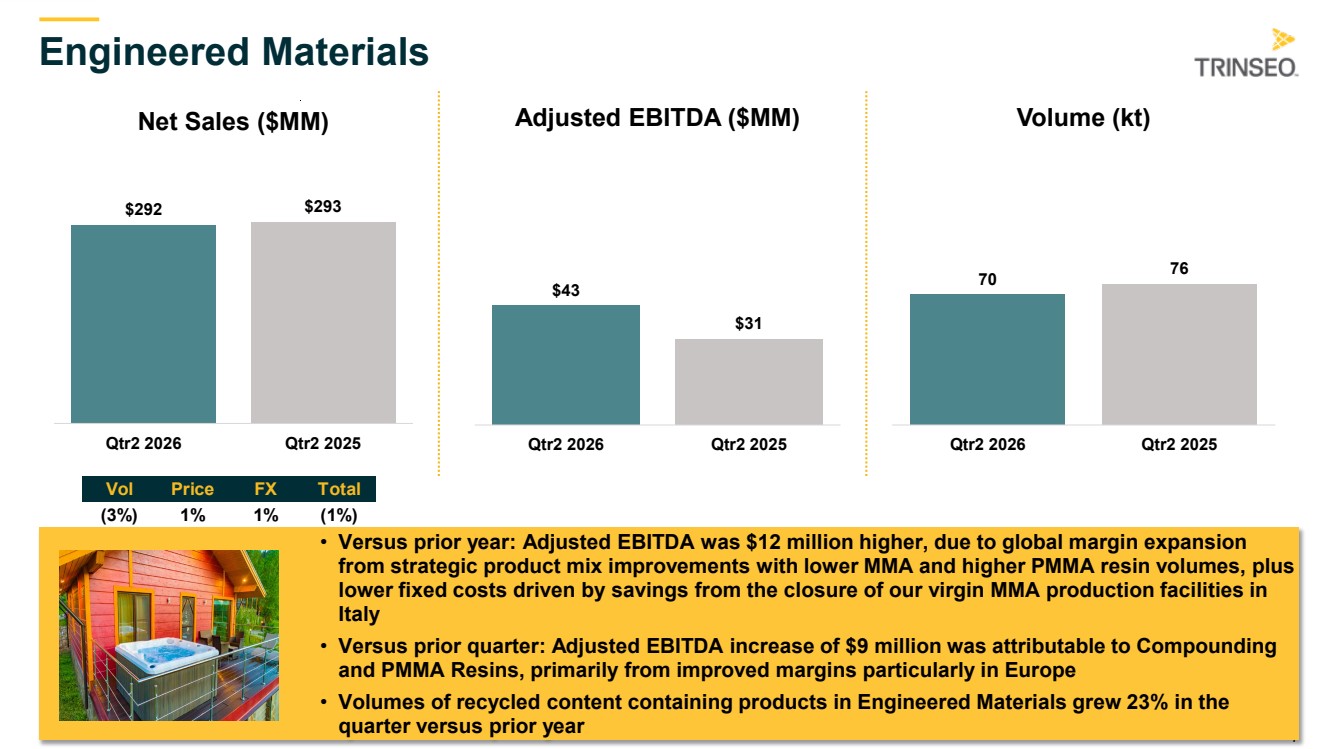
| 8 • Versus prior year: Adjusted EBITDA was $1 million below prior year primarily due to unfavorable net timing, partially offset by higher volumes • Versus prior quarter: Adjusted EBITDA was flat sequentially, as volume and margin improvements, primarily in paper & board, were offset by negative net timing • Sales volumes in CASE and battery binders were up 5% versus prior quarter and 3% versus prior year. We continue to grow our portfolio of products and gain share. Latex Binders Vol Price FX Total 9% 10% 2% 21% $248 $204 Qtr2 2026 Qtr2 2025 Net Sales ($MM) $16 $17 Qtr2 2026 Qtr2 2025 Adjusted EBITDA ($MM) 102 92 Qtr2 2026 Qtr2 2025 Volume (kt) |
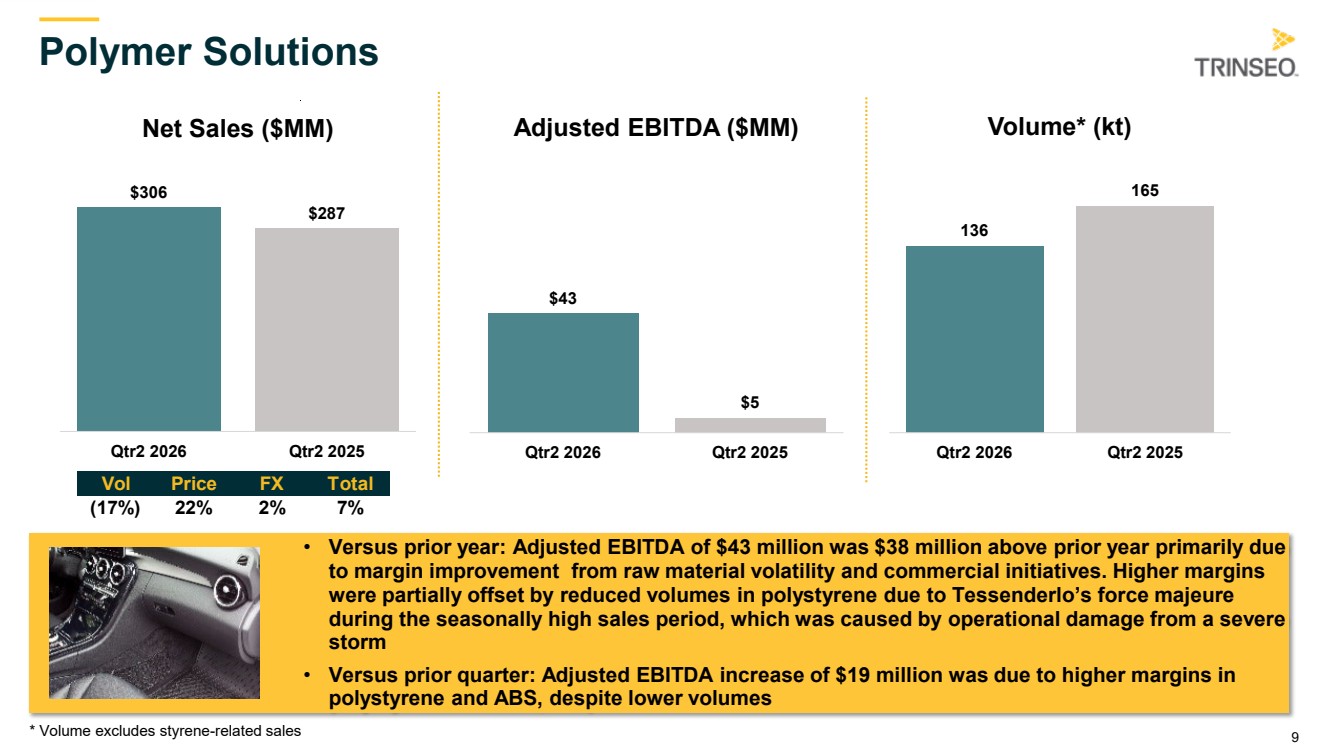
| 9 Polymer Solutions • Versus prior year: Adjusted EBITDA of $43 million was $38 million above prior year primarily due to margin improvement from raw material volatility and commercial initiatives. Higher margins were partially offset by reduced volumes in polystyrene due to Tessenderlo’s force majeure during the seasonally high sales period, which was caused by operational damage from a severe storm • Versus prior quarter: Adjusted EBITDA increase of $19 million was due to higher margins in polystyrene and ABS, despite lower volumes * Volume excludes styrene-related sales Vol Price FX Total (17%) 22% 2% 7% $306 $287 Qtr2 2026 Qtr2 2025 Net Sales ($MM) $43 $5 Qtr2 2026 Qtr2 2025 Adjusted EBITDA ($MM) 136 165 Qtr2 2026 Qtr2 2025 Volume* (kt) |
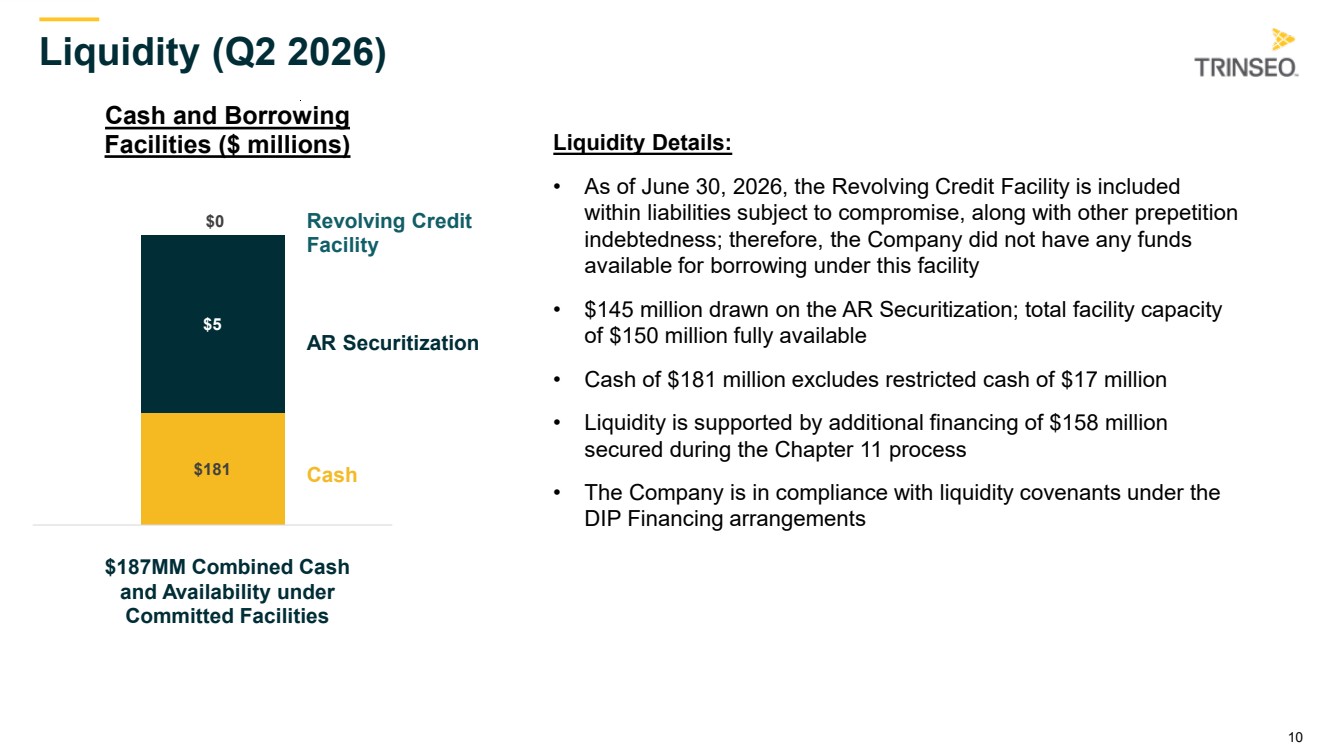
| 10 Liquidity (Q2 2026) Cash and Borrowing Facilities ($ millions) AR Securitization $181 $5 $0 Cash $187MM Combined Cash and Availability under Committed Facilities Liquidity Details: • As of June 30, 2026, the Revolving Credit Facility is included within liabilities subject to compromise, along with other prepetition indebtedness; therefore, the Company did not have any funds available for borrowing under this facility • $145 million drawn on the AR Securitization; total facility capacity of $150 million fully available • Cash of $181 million excludes restricted cash of $17 million • Liquidity is supported by additional financing of $158 million secured during the Chapter 11 process • The Company is in compliance with liquidity covenants under the DIP Financing arrangements Revolving Credit Facility |
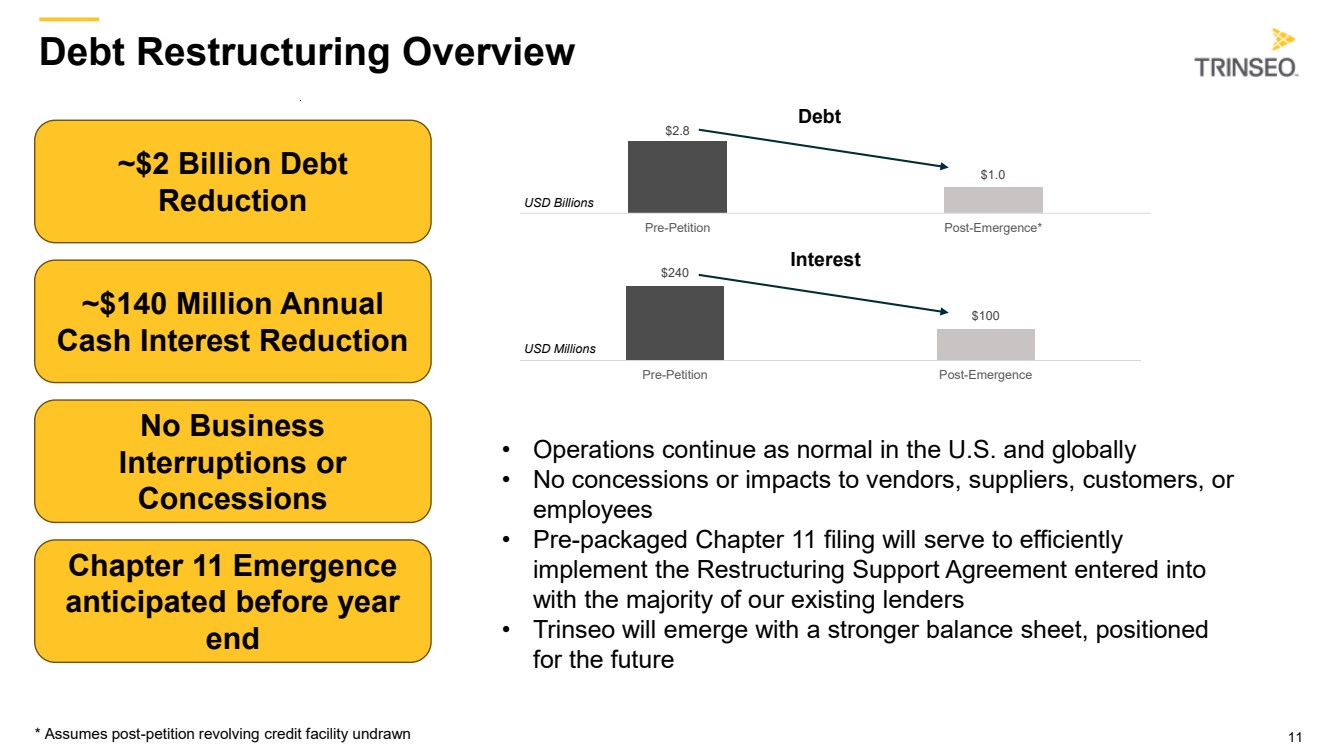
| 11 Debt Restructuring Overview * Assumes post-petition revolving credit facility undrawn ~$2 Billion Debt Reduction ~$140 Million Annual Cash Interest Reduction Chapter 11 Emergence anticipated before year end No Business Interruptions or Concessions $2.8 $1.0 Pre-Petition Post-Emergence* $240 $100 Pre-Petition Post-Emergence USD Billions USD Millions • Operations continue as normal in the U.S. and globally • No concessions or impacts to vendors, suppliers, customers, or employees • Pre-packaged Chapter 11 filing will serve to efficiently implement the Restructuring Support Agreement entered into with the majority of our existing lenders • Trinseo will emerge with a stronger balance sheet, positioned for the future Debt Interest |
| 12 Appendix |

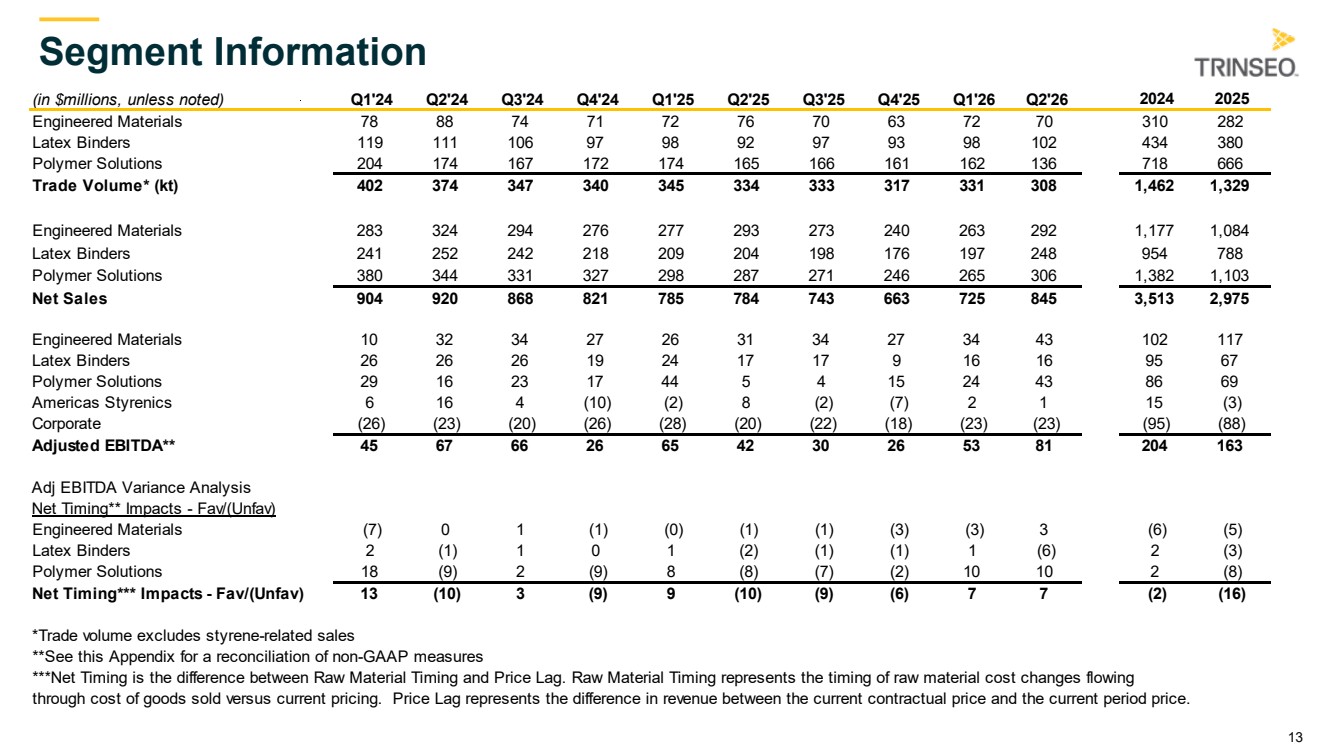
| 13 Segment Information (in $millions, unless noted) Q1'24 Q2'24 Q3'24 Q4'24 Q1'25 Q2'25 Q3'25 Q4'25 Q1'26 Q2'26 2024 2025 Engineered Materials 78 88 74 71 72 76 70 63 72 70 310 282 Latex Binders 119 111 106 97 98 92 97 93 98 102 434 380 Polymer Solutions 204 174 167 172 174 165 166 161 162 136 718 666 Trade Volume* (kt) 402 374 347 340 345 334 333 317 331 308 1,462 1,329 Engineered Materials 283 324 294 276 277 293 273 240 263 292 1,177 1,084 Latex Binders 241 252 242 218 209 204 198 176 197 248 954 788 Polymer Solutions 380 344 331 327 298 287 271 246 265 306 1,382 1,103 Net Sales 904 920 868 821 785 784 743 663 725 845 3,513 2,975 Engineered Materials 10 32 34 27 26 31 34 27 34 43 102 117 Latex Binders 26 26 26 19 24 17 17 9 16 16 95 67 Polymer Solutions 29 16 23 17 44 5 4 15 24 43 86 69 Americas Styrenics 6 16 4 (10) (2) 8 (2) (7) 2 1 15 (3) Corporate (26) (23) (20) (26) (28) (20) (22) (18) (23) (23) (95) (88) Adjusted EBITDA** 45 67 66 26 65 42 30 26 53 81 204 163 Adj EBITDA Variance Analysis Net Timing** Impacts - Fav/(Unfav) Engineered Materials (7) 0 1 (1) (0) (1) (1) (3) (3) 3 (6) (5) Latex Binders 2 (1) 1 0 1 (2) (1) (1) 1 (6) 2 (3) Polymer Solutions 18 (9) 2 (9) 8 (8) (7) (2) 10 10 2 (8) Net Timing*** Impacts - Fav/(Unfav) 13 (10) 3 (9) 9 (10) (9) (6) 7 7 (2) (16) *Trade volume excludes styrene-related sales **See this Appendix for a reconciliation of non-GAAP measures ***Net Timing is the difference between Raw Material Timing and Price Lag. Raw Material Timing represents the timing of raw material cost changes flowing through cost of goods sold versus current pricing. Price Lag represents the difference in revenue between the current contractual price and the current period price. |
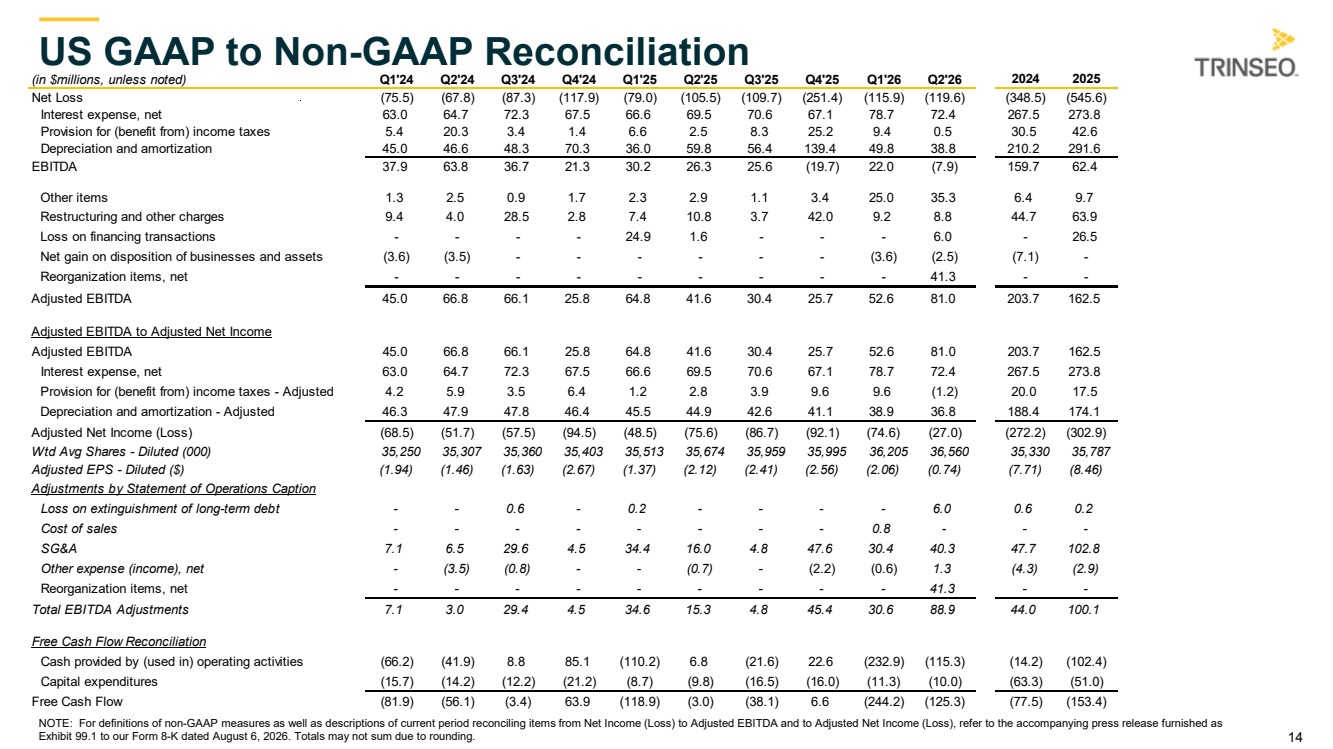
| 14 US GAAP to Non-GAAP Reconciliation NOTE: For definitions of non-GAAP measures as well as descriptions of current period reconciling items from Net Income (Loss) to Adjusted EBITDA and to Adjusted Net Income (Loss), refer to the accompanying press release furnished as Exhibit 99.1 to our Form 8-K dated August 6, 2026. Totals may not sum due to rounding. (in $millions, unless noted) Q1'24 Q2'24 Q3'24 Q4'24 Q1'25 Q2'25 Q3'25 Q4'25 Q1'26 Q2'26 2024 2025 Net Loss (75.5) (67.8) (87.3) (117.9) (79.0) (105.5) (109.7) (251.4) (115.9) (119.6) (348.5) (545.6) Interest expense, net 63.0 64.7 72.3 67.5 66.6 69.5 70.6 67.1 78.7 72.4 267.5 273.8 Provision for (benefit from) income taxes 5.4 20.3 3.4 1.4 6.6 2.5 8.3 25.2 9.4 0.5 30.5 42.6 Depreciation and amortization 45.0 46.6 48.3 70.3 36.0 59.8 56.4 139.4 49.8 38.8 210.2 291.6 EBITDA 37.9 63.8 36.7 21.3 30.2 26.3 25.6 (19.7) 22.0 (7.9) 159.7 62.4 Other items 1.3 2.5 0.9 1.7 2.3 2.9 1.1 3.4 25.0 35.3 6.4 9.7 Restructuring and other charges 9.4 4.0 28.5 2.8 7.4 10.8 3.7 42.0 9.2 8.8 44.7 63.9 Loss on financing transactions - - - - 24.9 1.6 - - - 6.0 - 26.5 Net gain on disposition of businesses and assets (3.6) (3.5) - - - - - - (3.6) (2.5) (7.1) - Reorganization items, net - - - - - - - - - 41.3 - - Adjusted EBITDA 45.0 66.8 66.1 25.8 64.8 41.6 30.4 25.7 52.6 81.0 203.7 162.5 Adjusted EBITDA to Adjusted Net Income Adjusted EBITDA 45.0 66.8 66.1 25.8 64.8 41.6 30.4 25.7 52.6 81.0 203.7 162.5 Interest expense, net 63.0 64.7 72.3 67.5 66.6 69.5 70.6 67.1 78.7 72.4 267.5 273.8 Provision for (benefit from) income taxes - Adjusted 4.2 5.9 3.5 6.4 1.2 2.8 3.9 9.6 9.6 (1.2) 20.0 17.5 Depreciation and amortization - Adjusted 46.3 47.9 47.8 46.4 45.5 44.9 42.6 41.1 38.9 36.8 188.4 174.1 Adjusted Net Income (Loss) (68.5) (51.7) (57.5) (94.5) (48.5) (75.6) (86.7) (92.1) (74.6) (27.0) (272.2) (302.9) Wtd Avg Shares - Diluted (000) 35,250 35,307 35,360 35,403 35,513 35,674 35,959 35,995 36,205 36,560 35,330 35,787 Adjusted EPS - Diluted ($) (1.94) (1.46) (1.63) (2.67) (1.37) (2.12) (2.41) (2.56) (2.06) (0.74) (7.71) (8.46) Adjustments by Statement of Operations Caption Loss on extinguishment of long-term debt - - 0.6 - 0.2 - - - - 6.0 0.6 0.2 Cost of sales - - - - - - - - 0.8 - - - SG&A 7.1 6.5 29.6 4.5 34.4 16.0 4.8 47.6 30.4 40.3 47.7 102.8 Other expense (income), net - (3.5) (0.8) - - (0.7) - (2.2) (0.6) 1.3 (4.3) (2.9) Reorganization items, net - - - - - - - - - 41.3 - - Total EBITDA Adjustments 7.1 3.0 29.4 4.5 34.6 15.3 4.8 45.4 30.6 88.9 44.0 100.1 Free Cash Flow Reconciliation Cash provided by (used in) operating activities (66.2) (41.9) 8.8 85.1 (110.2) 6.8 (21.6) 22.6 (232.9) (115.3) (14.2) (102.4) Capital expenditures (15.7) (14.2) (12.2) (21.2) (8.7) (9.8) (16.5) (16.0) (11.3) (10.0) (63.3) (51.0) Free Cash Flow (81.9) (56.1) (3.4) 63.9 (118.9) (3.0) (38.1) 6.6 (244.2) (125.3) (77.5) (153.4) |