Shareholder Report
May 31, 2026
USD ($)
Holding
This report describes changes to the Fund that occurred during the reporting period.
What were the Fund costs for the last year? (based on a hypothetical $10,000 investment)
| Cost of a $10,000 investment | Costs paid as a percentage of $10,000 investment* | |||
| Retirement Class Shares |
$45 | 0.42% | ||
| * | The Fund’s ratios include the expenses of the Underlying Funds, excluding the expenses of the Dividend Growth, Dividend Value, Floating Rate Income, Growth Opportunities ETF, International Value, Small Cap Select and the Nuveen Real Property Fund LP and exclude the income of the Underlying Funds. Annualized for period less than one year. |
How did the Fund perform last year? What affected the Fund’s performance?
| Performance Highlights The Nuveen Lifecycle 2010 Fund returned 12.32% for Retirement Class Shares at net asset value (NAV) for the 12 months ended May 31, 2026. The Fund underperformed the Lifecycle 2010 Fund Composite Index, which returned 13.34%. The Fund’s Composite Index consisted of: 34.5% Bloomberg U.S. Aggregate Bond Index; 22.2% Russell 3000® Index; 15.9% Bloomberg U.S. 1–3 Year Government/Credit Bond Index; 11.9% MSCI All Country World Index ex USA Investable Market Index; 10.0% Bloomberg U.S. Treasury Inflation Protected Securities (TIPS) 1-10 Year Index; and 5.5% Bloomberg Global Aggregate ex-USD Index (Hedged). Top contributors to relative performance • Strong overall performance of the underlying funds investing in fixed income, led by the Nuveen Emerging Markets Debt Fund. • An allocation to the Nuveen Short Term Bond Fund. • A position in the Nuveen Floating Rate Income Fund. Top detractors from relative performance • A position in the Nuveen Dividend Growth Fund. • Holding the Nuveen Real Property Fund LP. • An allocation to the Nuveen International Opportunities Fund. |
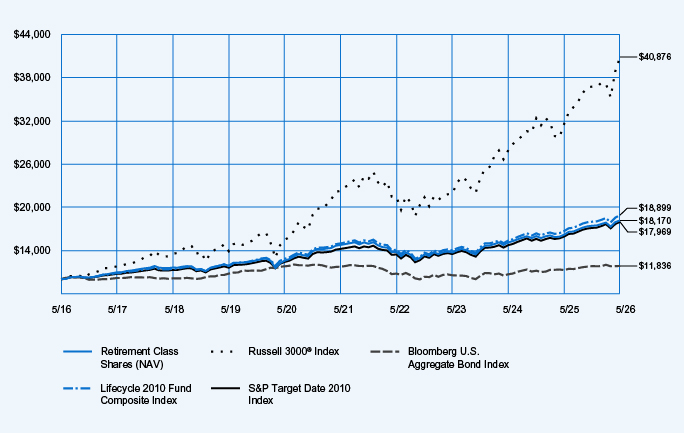
Average Annual Total Returns
| 1-Year | 5-Year | 10-Year | ||||||||||
| Retirement Class Shares at NAV |
12.32 | % | 4.25 | % | 6.15 | % | ||||||
| Russell 3000® Index |
29.45 | % | 12.92 | % | 15.12 | % | ||||||
| Bloomberg U.S. Aggregate Bond Index |
5.13 | % | 0.17 | % | 1.70 | % | ||||||
| Lifecycle 2010 Fund Composite Index |
13.34 | % | 4.78 | % | 6.57 | % | ||||||
| S&P Target Date 2010 Index |
12.87 | % | 4.81 | % | 6.04 | % | ||||||
Fund Statistics (as of May 31, 2026)
| Fund net assets |
$ | 672,958,097 | ||
| Total number of portfolio holdings |
24 | |||
| Portfolio turnover (%) |
28% | |||
| Total management fees paid for the year |
$ | 2,689,823 | ||
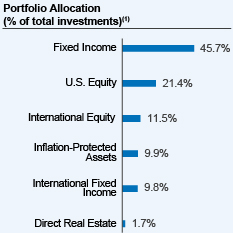 |
| (1) | Affiliated investment companies (Underlying Funds), except for repurchase agreements, where applicable. |
How has the Fund changed?
Portfolio manager update: Effective October 1, 2025, Jeff Sun, CFA was added as a portfolio manager of the Fund.
For more complete information, you may review the Fund’s next prospectus, which is expected to be available by October 1, 2026 at https://www.nuveen.com/en‑us/mutual‑funds/prospectuses or upon request at (800) 257‑8787.
For more complete information, you may review the Fund’s next prospectus, which is expected to be available by October 1, 2026 at https://www.nuveen.com/en‑us/mutual‑funds/prospectuses or upon request at (800) 257‑8787.
This report describes changes to the Fund that occurred during the reporting period.
What were the Fund costs for the last year? (based on a hypothetical $10,000 investment)
| Cost of a $10,000 investment | Costs paid as a percentage of $10,000 investment* | |||
| Class R6 Shares |
$18 | 0.17% | ||
| * | The Fund’s ratios include the expenses of the Underlying Funds, excluding the expenses of the Dividend Growth, Dividend Value, Floating Rate Income, Growth Opportunities ETF, International Value, Small Cap Select and the Nuveen Real Property Fund LP and exclude the income of the Underlying Funds. Annualized for period less than one year. |
How did the Fund perform last year? What affected the Fund’s performance?
| Performance Highlights The Nuveen Lifecycle 2010 Fund returned 12.55% for Class R6 Shares at net asset value (NAV) for the 12 months ended May 31, 2026. The Fund underperformed the Lifecycle 2010 Fund Composite Index, which returned 13.34%. The Fund’s Composite Index consisted of: 34.5% Bloomberg U.S. Aggregate Bond Index; 22.2% Russell 3000® Index; 15.9% Bloomberg U.S. 1–3 Year Government/Credit Bond Index; 11.9% MSCI All Country World Index ex USA Investable Market Index; 10.0% Bloomberg U.S. Treasury Inflation Protected Securities (TIPS) 1-10 Year Index; and 5.5% Bloomberg Global Aggregate ex-USD Index (Hedged). Top contributors to relative performance • Strong overall performance of the underlying funds investing in fixed income, led by the Nuveen Emerging Markets Debt Fund. • An allocation to the Nuveen Short Term Bond Fund. • A position in the Nuveen Floating Rate Income Fund. Top detractors from relative performance • A position in the Nuveen Dividend Growth Fund. • Holding the Nuveen Real Property Fund LP. • An allocation to the Nuveen International Opportunities Fund. |
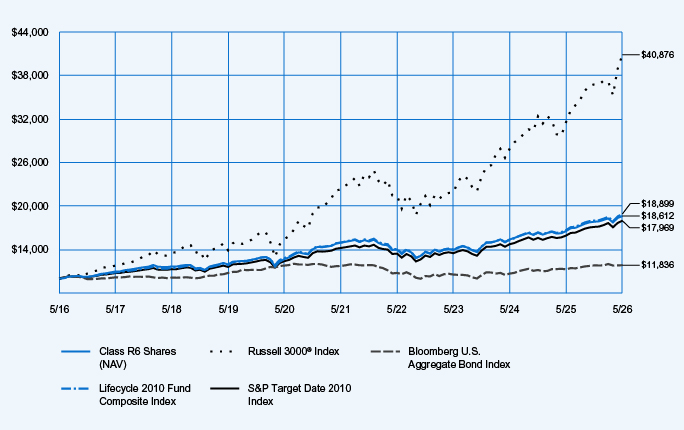
Average Annual Total Returns
| 1-Year | 5-Year | 10-Year | ||||||||||
| Class R6 Shares at NAV |
12.55 | % | 4.51 | % | 6.41 | % | ||||||
| Russell 3000® Index |
29.45 | % | 12.92 | % | 15.12 | % | ||||||
| Bloomberg U.S. Aggregate Bond Index |
5.13 | % | 0.17 | % | 1.70 | % | ||||||
| Lifecycle 2010 Fund Composite Index |
13.34 | % | 4.78 | % | 6.57 | % | ||||||
| S&P Target Date 2010 Index |
12.87 | % | 4.81 | % | 6.04 | % | ||||||
Fund Statistics (as of May 31, 2026)
| Fund net assets |
$ | 672,958,097 | ||
| Total number of portfolio holdings |
24 | |||
| Portfolio turnover (%) |
28% | |||
| Total management fees paid for the year |
$ | 2,689,823 | ||
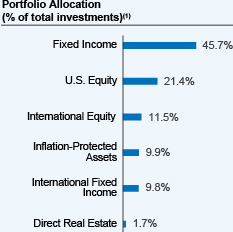 |
| (1) | Affiliated investment companies (Underlying Funds), except for repurchase agreements, where applicable. |
How has the Fund changed?
Portfolio manager update: Effective October 1, 2025, Jeff Sun, CFA was added as a portfolio manager of the Fund.
For more complete information, you may review the Fund’s next prospectus, which is expected to be available by October 1, 2026 at https://www.nuveen.com/en‑us/mutual‑funds/prospectuses or upon request at (800) 257‑8787.
For more complete information, you may review the Fund’s next prospectus, which is expected to be available by October 1, 2026 at https://www.nuveen.com/en‑us/mutual‑funds/prospectuses or upon request at (800) 257‑8787.
This report describes changes to the Fund that occurred during the reporting period.
What were the Fund costs for the last year? (based on a hypothetical $10,000 investment)
| Cost of a $10,000 investment | Costs paid as a percentage of $10,000 investment* | |||
| Premier Class Shares |
$34 | 0.32% | ||
| * | The Fund’s ratios include the expenses of the Underlying Funds, excluding the expenses of the Dividend Growth, Dividend Value, Floating Rate Income, Growth Opportunities ETF, International Value, Small Cap Select and the Nuveen Real Property Fund LP and exclude the income of the Underlying Funds. Annualized for period less than one year. |
How did the Fund perform last year? What affected the Fund’s performance?
| Performance Highlights The Nuveen Lifecycle 2010 Fund returned 12.29% for Premier Class Shares at net asset value (NAV) for the 12 months ended May 31, 2026. The Fund underperformed the Lifecycle 2010 Fund Composite Index, which returned 13.34%. The Fund’s Composite Index consisted of: 34.5% Bloomberg U.S. Aggregate Bond Index; 22.2% Russell 3000® Index; 15.9% Bloomberg U.S. 1–3 Year Government/Credit Bond Index; 11.9% MSCI All Country World Index ex USA Investable Market Index; 10.0% Bloomberg U.S. Treasury Inflation Protected Securities (TIPS) 1-10 Year Index; and 5.5% Bloomberg Global Aggregate ex-USD Index (Hedged). Top contributors to relative performance • Strong overall performance of the underlying funds investing in fixed income, led by the Nuveen Emerging Markets Debt Fund. • An allocation to the Nuveen Short Term Bond Fund. • A position in the Nuveen Floating Rate Income Fund. Top detractors from relative performance • A position in the Nuveen Dividend Growth Fund. • Holding the Nuveen Real Property Fund LP. • An allocation to the Nuveen International Opportunities Fund. |
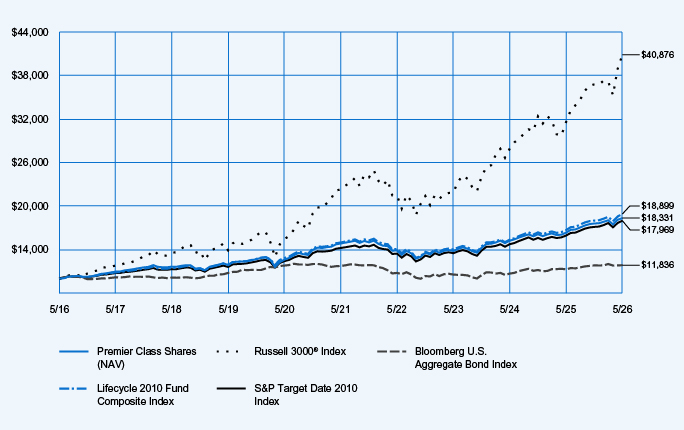
Average Annual Total Returns
| 1-Year | 5-Year | 10-Year | ||||||||||
| Premier Class Shares at NAV |
12.29 | % | 4.33 | % | 6.25 | % | ||||||
| Russell 3000® Index |
29.45 | % | 12.92 | % | 15.12 | % | ||||||
| Bloomberg U.S. Aggregate Bond Index |
5.13 | % | 0.17 | % | 1.70 | % | ||||||
| Lifecycle 2010 Fund Composite Index |
13.34 | % | 4.78 | % | 6.57 | % | ||||||
| S&P Target Date 2010 Index |
12.87 | % | 4.81 | % | 6.04 | % | ||||||
Fund Statistics (as of May 31, 2026)
| Fund net assets |
$ | 672,958,097 | ||
| Total number of portfolio holdings |
24 | |||
| Portfolio turnover (%) |
28% | |||
| Total management fees paid for the year |
$ | 2,689,823 | ||
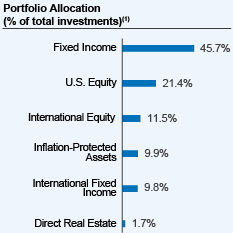 |
| (1) | Affiliated investment companies (Underlying Funds), except for repurchase agreements, where applicable. |
How has the Fund changed?
Portfolio manager update: Effective October 1, 2025, Jeff Sun, CFA was added as a portfolio manager of the Fund.
For more complete information, you may review the Fund’s next prospectus, which is expected to be available by October 1, 2026 at https://www.nuveen.com/en‑us/mutual‑funds/prospectuses or upon request at (800) 257‑8787.
For more complete information, you may review the Fund’s next prospectus, which is expected to be available by October 1, 2026 at https://www.nuveen.com/en‑us/mutual‑funds/prospectuses or upon request at (800) 257‑8787.
This report describes changes to the Fund that occurred during the reporting period.
What were the Fund costs for the last year? (based on a hypothetical $10,000 investment)
| Cost of a $10,000 investment | Costs paid as a percentage of $10,000 investment* | |||
| Class I Shares |
$31 | 0.29% | ||
| * | The Fund’s ratios include the expenses of the Underlying Funds, excluding the expenses of the Dividend Growth, Dividend Value, Floating Rate Income, Growth Opportunities ETF, International Value, Small Cap Select and the Nuveen Real Property Fund LP and exclude the income of the Underlying Funds. Annualized for period less than one year. |
How did the Fund perform last year? What affected the Fund’s performance?
| Performance Highlights The Nuveen Lifecycle 2010 Fund returned 12.46% for Class I Shares at net asset value (NAV) for the 12 months ended May 31, 2026. The Fund underperformed the Lifecycle 2010 Fund Composite Index, which returned 13.34%. The Fund’s Composite Index consisted of: 34.5% Bloomberg U.S. Aggregate Bond Index; 22.2% Russell 3000® Index; 15.9% Bloomberg U.S. 1–3 Year Government/Credit Bond Index; 11.9% MSCI All Country World Index ex USA Investable Market Index; 10.0% Bloomberg U.S. Treasury Inflation Protected Securities (TIPS) 1-10 Year Index; and 5.5% Bloomberg Global Aggregate ex-USD Index (Hedged). Top contributors to relative performance • Strong overall performance of the underlying funds investing in fixed income, led by the Nuveen Emerging Markets Debt Fund. • An allocation to the Nuveen Short Term Bond Fund. • A position in the Nuveen Floating Rate Income Fund. Top detractors from relative performance • A position in the Nuveen Dividend Growth Fund. • Holding the Nuveen Real Property Fund LP. • An allocation to the Nuveen International Opportunities Fund. |
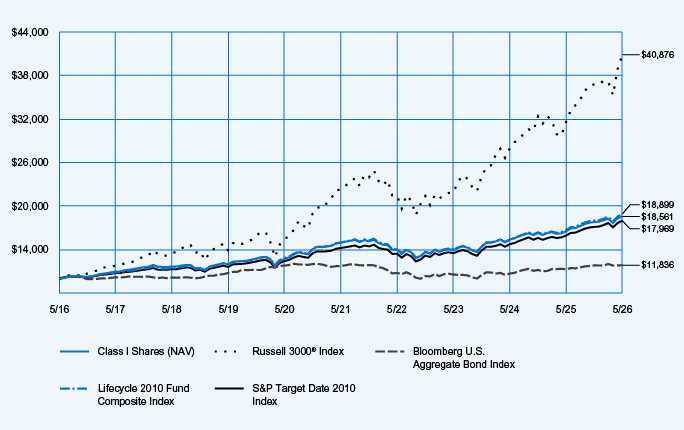
Average Annual Total Returns
| 1-Year | 5-Year | 10-Year | ||||||||||
| Class I Shares at NAV |
12.46 | % | 4.44 | % | 6.38 | % | ||||||
| Russell 3000® Index |
29.45 | % | 12.92 | % | 15.12 | % | ||||||
| Bloomberg U.S. Aggregate Bond Index |
5.13 | % | 0.17 | % | 1.70 | % | ||||||
| Lifecycle 2010 Fund Composite Index |
13.34 | % | 4.78 | % | 6.57 | % | ||||||
| S&P Target Date 2010 Index |
12.87 | % | 4.81 | % | 6.04 | % | ||||||
Fund Statistics (as of May 31, 2026)
| Fund net assets |
$ | 672,958,097 | ||
| Total number of portfolio holdings |
24 | |||
| Portfolio turnover (%) |
28% | |||
| Total management fees paid for the year |
$ | 2,689,823 | ||
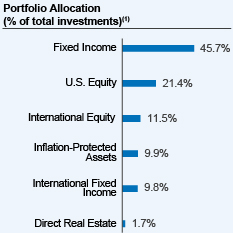 |
| (1) | Affiliated investment companies (Underlying Funds), except for repurchase agreements, where applicable. |
How has the Fund changed?
Portfolio manager update: Effective October 1, 2025, Jeff Sun, CFA was added as a portfolio manager of the Fund.
For more complete information, you may review the Fund’s next prospectus, which is expected to be available by October 1, 2026 at https://www.nuveen.com/en‑us/mutual‑funds/prospectuses or upon request at (800) 257‑8787.
For more complete information, you may review the Fund’s next prospectus, which is expected to be available by October 1, 2026 at https://www.nuveen.com/en‑us/mutual‑funds/prospectuses or upon request at (800) 257‑8787.
This report describes changes to the Fund that occurred during the reporting period.
What were the Fund costs for the last year? (based on a hypothetical $10,000 investment)
| Cost of a $10,000 investment | Costs paid as a percentage of $10,000 investment* | |||
| Class I Shares |
$34 | 0.32% | ||
| * | The Fund’s ratios include the expenses of the Underlying Funds, excluding the expenses of the Dividend Growth, Dividend Value, Floating Rate Income, Growth Opportunities ETF, International Value, Small Cap Select and the Nuveen Real Property Fund LP and exclude the income of the Underlying Funds. Annualized for period less than one year. |
How did the Fund perform last year? What affected the Fund’s performance?
| Performance Highlights The Nuveen Lifecycle 2015 Fund returned 12.95% for Class I Shares at net asset value (NAV) for the 12 months ended May 31, 2026. The Fund underperformed the Lifecycle 2015 Fund Composite Index, which returned 14.66%. The Fund’s Composite Index consisted of: 34.5% Bloomberg U.S. Aggregate Bond Index; 25.4% Russell 3000® Index; 13.7% MSCI All Country World Index ex USA Investable Market Index; 10.9% Bloomberg U.S. 1–3 Year Government/Credit Bond Index; 10.0% Bloomberg U.S. Treasury Inflation Protected Securities (TIPS) 1-10 Year Index; and 5.5% Bloomberg Global Aggregate ex-USD Index (Hedged). Top contributors to relative performance • Strong overall performance of the underlying funds investing in fixed income, led by the Nuveen Emerging Markets Debt Fund. • An allocation to the Nuveen Floating Rate Income Fund. • A position in the Nuveen Core Bond Fund. Top detractors from relative performance • A position in the Nuveen Real Property Fund LP. • Holding the Nuveen Dividend Growth Fund. • An allocation to the Nuveen International Opportunities Fund. |
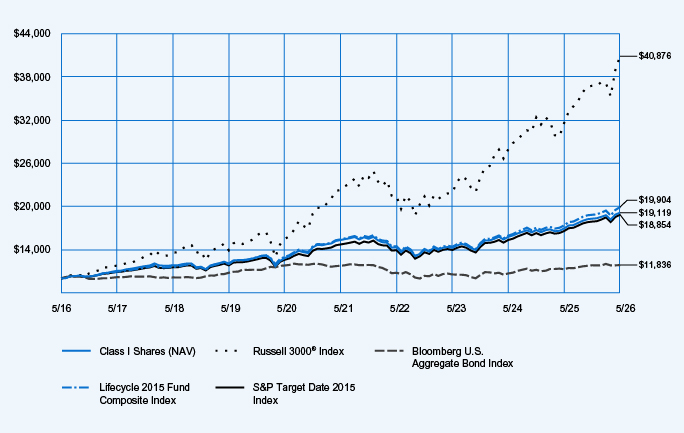
Average Annual Total Returns
| 1-Year | 5-Year | 10-Year | ||||||||||
| Class I Shares at NAV |
12.95 | % | 4.53 | % | 6.70 | % | ||||||
| Russell 3000® Index |
29.45 | % | 12.92 | % | 15.12 | % | ||||||
| Bloomberg U.S. Aggregate Bond Index |
5.13 | % | 0.17 | % | 1.70 | % | ||||||
| Lifecycle 2015 Fund Composite Index |
14.66 | % | 5.25 | % | 7.13 | % | ||||||
| S&P Target Date 2015 Index |
13.81 | % | 5.10 | % | 6.55 | % | ||||||
Fund Statistics (as of May 31, 2026)
| Fund net assets |
$ | 934,376,707 | ||
| Total number of portfolio holdings |
24 | |||
| Portfolio turnover (%) |
28% | |||
| Total management fees paid for the year |
$ | 3,748,293 | ||
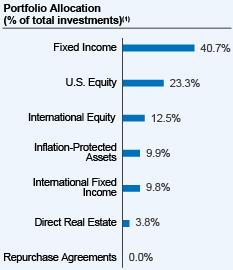 |
| (1) | Affiliated investment companies (Underlying Funds), except for repurchase agreements, where applicable. |
How has the Fund changed?
Portfolio manager update: Effective October 1, 2025, Jeff Sun, CFA was added as a portfolio manager of the Fund.
For more complete information, you may review the Fund’s next prospectus, which is expected to be available by October 1, 2026 at https://www.nuveen.com/en‑us/mutual‑funds/prospectuses or upon request at (800) 257‑8787.
For more complete information, you may review the Fund’s next prospectus, which is expected to be available by October 1, 2026 at https://www.nuveen.com/en‑us/mutual‑funds/prospectuses or upon request at (800) 257‑8787.
This report describes changes to the Fund that occurred during the reporting period.
What were the Fund costs for the last year? (based on a hypothetical $10,000 investment)
| Cost of a $10,000 investment | Costs paid as a percentage of $10,000 investment* | |||
| Premier Class Shares |
$43 | 0.40% | ||
| * | The Fund’s ratios include the expenses of the Underlying Funds, excluding the expenses of the Dividend Growth, Dividend Value, Floating Rate Income, Growth Opportunities ETF, International Value, Small Cap Select and the Nuveen Real Property Fund LP and exclude the income of the Underlying Funds. Annualized for period less than one year. |
How did the Fund perform last year? What affected the Fund’s performance?
| Performance Highlights The Nuveen Lifecycle 2015 Fund returned 12.87% for Premier Class Shares at net asset value (NAV) for the 12 months ended May 31, 2026. The Fund underperformed the Lifecycle 2015 Fund Composite Index, which returned 14.66%. The Fund’s Composite Index consisted of: 34.5% Bloomberg U.S. Aggregate Bond Index; 25.4% Russell 3000® Index; 13.7% MSCI All Country World Index ex USA Investable Market Index; 10.9% Bloomberg U.S. 1–3 Year Government/Credit Bond Index; 10.0% Bloomberg U.S. Treasury Inflation Protected Securities (TIPS) 1-10 Year Index; and 5.5% Bloomberg Global Aggregate ex-USD Index (Hedged). Top contributors to relative performance • Strong overall performance of the underlying funds investing in fixed income, led by the Nuveen Emerging Markets Debt Fund. • An allocation to the Nuveen Floating Rate Income Fund. • A position in the Nuveen Core Bond Fund. Top detractors from relative performance • A position in the Nuveen Real Property Fund LP. • Holding the Nuveen Dividend Growth Fund. • An allocation to the Nuveen International Opportunities Fund. |
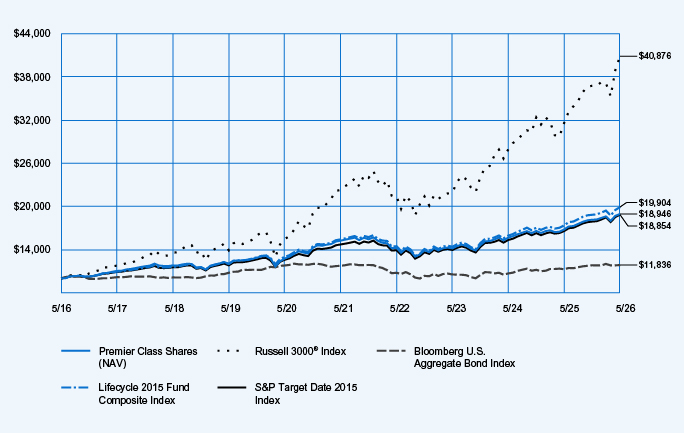
Average Annual Total Returns
| 1-Year | 5-Year | 10-Year | ||||||||||
| Premier Class Shares at NAV |
12.87 | % | 4.46 | % | 6.60 | % | ||||||
| Russell 3000® Index |
29.45 | % | 12.92 | % | 15.12 | % | ||||||
| Bloomberg U.S. Aggregate Bond Index |
5.13 | % | 0.17 | % | 1.70 | % | ||||||
| Lifecycle 2015 Fund Composite Index |
14.66 | % | 5.25 | % | 7.13 | % | ||||||
| S&P Target Date 2015 Index |
13.81 | % | 5.10 | % | 6.55 | % | ||||||
Fund Statistics (as of May 31, 2026)
| Fund net assets |
$ | 934,376,707 | ||
| Total number of portfolio holdings |
24 | |||
| Portfolio turnover (%) |
28% | |||
| Total management fees paid for the year |
$ | 3,748,293 | ||
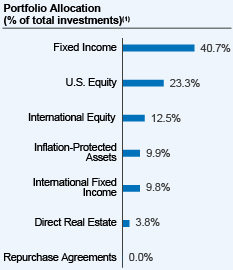 |
| (1) | Affiliated investment companies (Underlying Funds), except for repurchase agreements, where applicable. |
How has the Fund changed?
Portfolio manager update: Effective October 1, 2025, Jeff Sun, CFA was added as a portfolio manager of the Fund.
For more complete information, you may review the Fund’s next prospectus, which is expected to be available by October 1, 2026 at https://www.nuveen.com/en‑us/mutual‑funds/prospectuses or upon request at (800) 257‑8787.
For more complete information, you may review the Fund’s next prospectus, which is expected to be available by October 1, 2026 at https://www.nuveen.com/en‑us/mutual‑funds/prospectuses or upon request at (800) 257‑8787.
This report describes changes to the Fund that occurred during the reporting period.
What were the Fund costs for the last year? (based on a hypothetical $10,000 investment)
| Cost of a $10,000 investment | Costs paid as a percentage of $10,000 investment* | |||
| Class R6 Shares |
$27 | 0.25% | ||
| * | The Fund’s ratios include the expenses of the Underlying Funds, excluding the expenses of the Dividend Growth, Dividend Value, Floating Rate Income, Growth Opportunities ETF, International Value, Small Cap Select and the Nuveen Real Property Fund LP and exclude the income of the Underlying Funds. Annualized for period less than one year. |
How did the Fund perform last year? What affected the Fund’s performance?
| Performance Highlights The Nuveen Lifecycle 2015 Fund returned 12.99% for Class R6 Shares at net asset value (NAV) for the 12 months ended May 31, 2026. The Fund underperformed the Lifecycle 2015 Fund Composite Index, which returned 14.66%. The Fund’s Composite Index consisted of: 34.5% Bloomberg U.S. Aggregate Bond Index; 25.4% Russell 3000® Index; 13.7% MSCI All Country World Index ex USA Investable Market Index; 10.9% Bloomberg U.S. 1–3 Year Government/Credit Bond Index; 10.0% Bloomberg U.S. Treasury Inflation Protected Securities (TIPS) 1-10 Year Index; and 5.5% Bloomberg Global Aggregate ex-USD Index (Hedged). Top contributors to relative performance • Strong overall performance of the underlying funds investing in fixed income, led by the Nuveen Emerging Markets Debt Fund. • An allocation to the Nuveen Floating Rate Income Fund. • A position in the Nuveen Core Bond Fund. Top detractors from relative performance • A position in the Nuveen Real Property Fund LP. • Holding the Nuveen Dividend Growth Fund. • An allocation to the Nuveen International Opportunities Fund. |
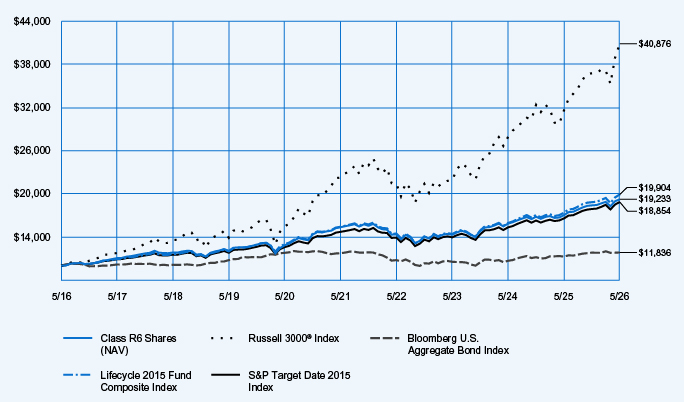
Average Annual Total Returns
| 1-Year | 5-Year | 10-Year | ||||||||||
| Class R6 Shares at NAV |
12.99 | % | 4.62 | % | 6.76 | % | ||||||
| Russell 3000® Index |
29.45 | % | 12.92 | % | 15.12 | % | ||||||
| Bloomberg U.S. Aggregate Bond Index |
5.13 | % | 0.17 | % | 1.70 | % | ||||||
| Lifecycle 2015 Fund Composite Index |
14.66 | % | 5.25 | % | 7.13 | % | ||||||
| S&P Target Date 2015 Index |
13.81 | % | 5.10 | % | 6.55 | % | ||||||
Fund Statistics (as of May 31, 2026)
| Fund net assets |
$ | 934,376,707 | ||
| Total number of portfolio holdings |
24 | |||
| Portfolio turnover (%) |
28% | |||
| Total management fees paid for the year |
$ | 3,748,293 | ||
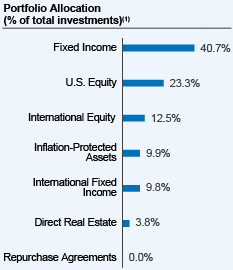 |
| (1) | Affiliated investment companies (Underlying Funds), except for repurchase agreements, where applicable. |
How has the Fund changed?
Portfolio manager update: Effective October 1, 2025, Jeff Sun, CFA was added as a portfolio manager of the Fund.
For more complete information, you may review the Fund’s next prospectus, which is expected to be available by October 1, 2026 at https://www.nuveen.com/en-us/mutual-funds/prospectuses or upon request at (800) 257-8787.
For more complete information, you may review the Fund’s next prospectus, which is expected to be available by October 1, 2026 at https://www.nuveen.com/en-us/mutual-funds/prospectuses or upon request at (800) 257-8787.
This report describes changes to the Fund that occurred during the reporting period.
What were the Fund costs for the last year? (based on a hypothetical $10,000 investment)
| Cost of a $10,000 investment | Costs paid as a percentage of $10,000 investment* | |||
| Retirement Class Shares |
$53 | 0.50% | ||
| * | The Fund’s ratios include the expenses of the Underlying Funds, excluding the expenses of the Dividend Growth, Dividend Value, Floating Rate Income, Growth Opportunities ETF, International Value, Small Cap Select and the Nuveen Real Property Fund LP and exclude the income of the Underlying Funds. Annualized for period less than one year. |
How did the Fund perform last year? What affected the Fund’s performance?
| Performance Highlights The Nuveen Lifecycle 2015 Fund returned 12.75% for Retirement Class Shares at net asset value (NAV) for the 12 months ended May 31, 2026. The Fund underperformed the Lifecycle 2015 Fund Composite Index, which returned 14.66%. The Fund’s Composite Index consisted of: 34.5% Bloomberg U.S. Aggregate Bond Index; 25.4% Russell 3000 Index; 13.7% MSCI All Country World Index ex USA Investable Market Index; 10.9% Bloomberg U.S. 1–3 Year Government/Credit Bond Index; 10.0% Bloomberg U.S. Treasury Inflation Protected Securities (TIPS) 1-10 Year Index; and 5.5% Bloomberg Global Aggregate ex-USD Index (Hedged). Top contributors to relative performance • Strong overall performance of the underlying funds investing in fixed income, led by the Nuveen Emerging Markets Debt Fund. • An allocation to the Nuveen Floating Rate Income Fund. • A position in the Nuveen Core Bond Fund. Top detractors from relative performance • A position in the Nuveen Real Property Fund LP. • Holding the Nuveen Dividend Growth Fund. • An allocation to the Nuveen International Opportunities Fund. |
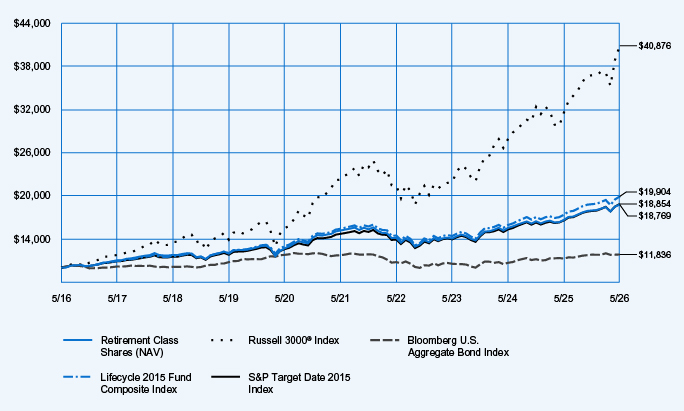
Average Annual Total Returns
| 1-Year | 5-Year | 10-Year | ||||||||||
| Retirement Class Shares at NAV |
12.75 | % | 4.36 | % | 6.50 | % | ||||||
| Russell 3000® Index |
29.45 | % | 12.92 | % | 15.12 | % | ||||||
| Bloomberg U.S. Aggregate Bond Index |
5.13 | % | 0.17 | % | 1.70 | % | ||||||
| Lifecycle 2015 Fund Composite Index |
14.66 | % | 5.25 | % | 7.13 | % | ||||||
| S&P Target Date 2015 Index |
13.81 | % | 5.10 | % | 6.55 | % | ||||||
Fund Statistics (as of May 31, 2026)
| Fund net assets |
$ | 934,376,707 | ||
| Total number of portfolio holdings |
24 | |||
| Portfolio turnover (%) |
28% | |||
| Total management fees paid for the year |
$ | 3,748,293 | ||
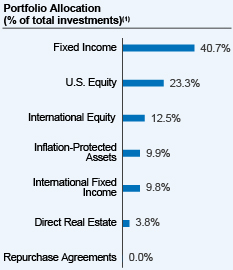 |
| (1) | Affiliated investment companies (Underlying Funds), except for repurchase agreements, where applicable. |
How has the Fund changed?
Portfolio manager update: Effective October 1, 2025, Jeff Sun, CFA was added as a portfolio manager of the Fund.
For more complete information, you may review the Fund’s next prospectus, which is expected to be available by October 1, 2026 at https://www.nuveen.com/en‑us/mutual‑funds/prospectuses or upon request at (800) 257‑8787.
This report describes changes to the Fund that occurred during the reporting period.
What were the Fund costs for the last year? (based on a hypothetical $10,000 investment)
| Cost of a $10,000 investment | Costs paid as a percentage of $10,000 investment* | |||
| Retirement Class Shares |
$53 | 0.50% | ||
| * | The Fund’s ratios include the expenses of the Underlying Funds, excluding the expenses of the Dividend Growth, Dividend Value, Floating Rate Income, Growth Opportunities ETF, International Value, Small Cap Select and the Nuveen Real Property Fund LP and exclude the income of the Underlying Funds. Annualized for period less than one year. |
How did the Fund perform last year? What affected the Fund’s performance?
| Performance Highlights The Nuveen Lifecycle 2020 Fund returned 13.77% for Retirement Class Shares at net asset value (NAV) for the 12 months ended May 31, 2026. The Fund underperformed the Lifecycle 2020 Fund Composite Index, which returned 15.96%. The Fund’s Composite Index consisted of: 33.8% Bloomberg U.S. Aggregate Bond Index; 28.6% Russell 3000® Index; 15.4% MSCI All Country World Index ex USA Investable Market Index; 8.4% Bloomberg U.S. 1–3 Year Government/Credit Bond Index; 8.4% Bloomberg U.S. Treasury Inflation Protected Securities (TIPS) 1-10 Year Index; and 5.4% Bloomberg Global Aggregate ex-USD Index (Hedged). Top contributors to relative performance • Strong overall performance of the underlying funds investing in fixed income, led by the Nuveen Emerging Markets Debt Fund. • An allocation to the Nuveen Floating Rate Income Fund. • A position in the Nuveen Core Bond Fund. Top detractors from relative performance • A position in the Nuveen Real Property Fund LP. • Holding the Nuveen Dividend Growth Fund. • An allocation to the Nuveen International Opportunities Fund. |
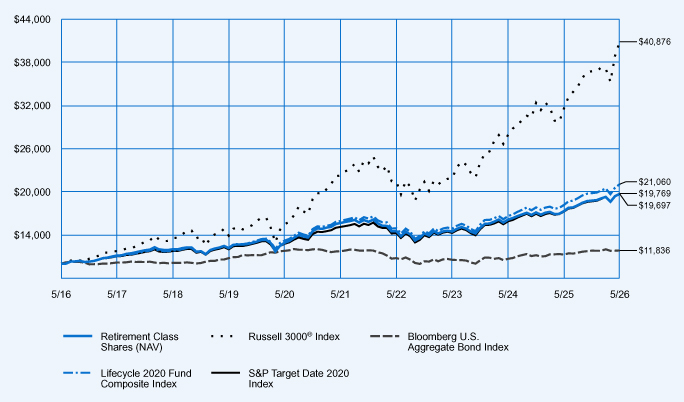
Average Annual Total Returns
| 1-Year | 5-Year | 10-Year | ||||||||||
| Retirement Class Shares at NAV |
13.77 | % | 4.70 | % | 7.01 | % | ||||||
| Russell 3000® Index |
29.45 | % | 12.92 | % | 15.12 | % | ||||||
| Bloomberg U.S. Aggregate Bond Index |
5.13 | % | 0.17 | % | 1.70 | % | ||||||
| Lifecycle 2020 Fund Composite Index |
15.96 | % | 5.74 | % | 7.73 | % | ||||||
| S&P Target Date 2020 Index |
14.70 | % | 5.52 | % | 7.05 | % | ||||||
Fund Statistics (as of May 31, 2026)
| Fund net assets |
$ | 1,998,504,066 | ||
| Total number of portfolio holdings |
24 | |||
| Portfolio turnover (%) |
28% | |||
| Total management fees paid for the year |
$ | 8,102,906 | ||
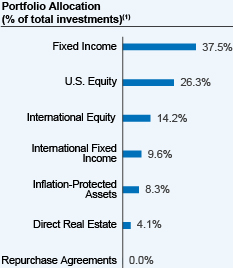 |
| (1) | Affiliated investment companies (Underlying Funds), except for repurchase agreements, where applicable. |
How has the Fund changed?
Portfolio manager update: Effective October 1, 2025, Jeff Sun, CFA was added as a portfolio manager of the Fund.
For more complete information, you may review the Fund’s next prospectus, which is expected to be available by October 1, 2026 at https://www.nuveen.com/en‑us/mutual‑funds/prospectuses or upon request at (800) 257‑8787.
For more complete information, you may review the Fund’s next prospectus, which is expected to be available by October 1, 2026 at https://www.nuveen.com/en‑us/mutual‑funds/prospectuses or upon request at (800) 257‑8787.
This report describes changes to the Fund that occurred during the reporting period.
What were the Fund costs for the last year? (based on a hypothetical $10,000 investment)
| Cost of a $10,000 investment | Costs paid as a percentage of $10,000 investment* | |||
| Class R6 Shares |
$27 | 0.25% | ||
| * | The Fund’s ratios include the expenses of the Underlying Funds, excluding the expenses of the Dividend Growth, Dividend Value, Floating Rate Income, Growth Opportunities ETF, International Value, Small Cap Select and the Nuveen Real Property Fund LP and exclude the income of the Underlying Funds. Annualized for period less than one year. |
How did the Fund perform last year? What affected the Fund’s performance?
| Performance Highlights The Nuveen Lifecycle 2020 Fund returned 14.00% for Class R6 Shares at net asset value (NAV) for the 12 months ended May 31, 2026. The Fund underperformed the Lifecycle 2020 Fund Composite Index, which returned 15.96%. The Fund’s Composite Index consisted of: 33.8% Bloomberg U.S. Aggregate Bond Index; 28.6% Russell 3000® Index; 15.4% MSCI All Country World Index ex USA Investable Market Index; 8.4% Bloomberg U.S. 1–3 Year Government/Credit Bond Index; 8.4% Bloomberg U.S. Treasury Inflation Protected Securities (TIPS) 1-10 Year Index; and 5.4% Bloomberg Global Aggregate ex-USD Index (Hedged). Top contributors to relative performance • Strong overall performance of the underlying funds investing in fixed income, led by the Nuveen Emerging Markets Debt Fund. • An allocation to the Nuveen Floating Rate Income Fund. • A position in the Nuveen Core Bond Fund. Top detractors from relative performance • A position in the Nuveen Real Property Fund LP. • Holding the Nuveen Dividend Growth Fund. • An allocation to the Nuveen International Opportunities Fund. |
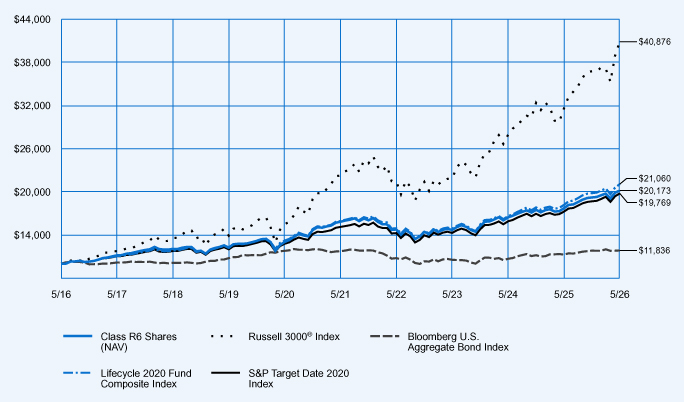
Average Annual Total Returns
| 1-Year | 5-Year | 10-Year | ||||||||||
| Class R6 Shares at NAV |
14.00 | % | 4.96 | % | 7.27 | % | ||||||
| Russell 3000® Index |
29.45 | % | 12.92 | % | 15.12 | % | ||||||
| Bloomberg U.S. Aggregate Bond Index |
5.13 | % | 0.17 | % | 1.70 | % | ||||||
| Lifecycle 2020 Fund Composite Index |
15.96 | % | 5.74 | % | 7.73 | % | ||||||
| S&P Target Date 2020 Index |
14.70 | % | 5.52 | % | 7.05 | % | ||||||
Fund Statistics (as of May 31, 2026)
| Fund net assets |
$ | 1,998,504,066 | ||
| Total number of portfolio holdings |
24 | |||
| Portfolio turnover (%) |
28% | |||
| Total management fees paid for the year |
$ | 8,102,906 | ||
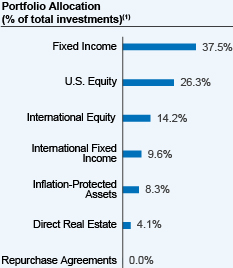 |
| (1) | Affiliated investment companies (Underlying Funds), except for repurchase agreements, where applicable. |
How has the Fund changed?
Portfolio manager update: Effective October 1, 2025, Jeff Sun, CFA was added as a portfolio manager of the Fund.
For more complete information, you may review the Fund’s next prospectus, which is expected to be available by October 1, 2026 at https://www.nuveen.com/en‑us/mutual‑funds/prospectuses or upon request at (800) 257‑8787.
For more complete information, you may review the Fund’s next prospectus, which is expected to be available by October 1, 2026 at https://www.nuveen.com/en‑us/mutual‑funds/prospectuses or upon request at (800) 257‑8787.
This report describes changes to the Fund that occurred during the reporting period.
What were the Fund costs for the last year? (based on a hypothetical $10,000 investment)
| Cost of a $10,000 investment | Costs paid as a percentage of $10,000 investment* | |||
| Premier Class Shares |
$43 | 0.40% | ||
| * | The Fund’s ratios include the expenses of the Underlying Funds, excluding the expenses of the Dividend Growth, Dividend Value, Floating Rate Income, Growth Opportunities ETF, International Value, Small Cap Select and the Nuveen Real Property Fund LP and exclude the income of the Underlying Funds. Annualized for period less than one year. |
How did the Fund perform last year? What affected the Fund’s performance?
| Performance Highlights The Nuveen Lifecycle 2020 Fund returned 13.96% for Premier Class Shares at net asset value (NAV) for the 12 months ended May 31, 2026. The Fund underperformed the Lifecycle 2020 Fund Composite Index, which returned 15.96%. The Fund’s Composite Index consisted of: 33.8% Bloomberg U.S. Aggregate Bond Index; 28.6% Russell 3000® Index; 15.4% MSCI All Country World Index ex USA Investable Market Index; 8.4% Bloomberg U.S. 1–3 Year Government/Credit Bond Index; 8.4% Bloomberg U.S. Treasury Inflation Protected Securities (TIPS) 1-10 Year Index; and 5.4% Bloomberg Global Aggregate ex-USD Index (Hedged). Top contributors to relative performance • Strong overall performance of the underlying funds investing in fixed income, led by the Nuveen Emerging Markets Debt Fund. • An allocation to the Nuveen Floating Rate Income Fund. • A position in the Nuveen Core Bond Fund. Top detractors from relative performance • A position in the Nuveen Real Property Fund LP. • Holding the Nuveen Dividend Growth Fund. • An allocation to the Nuveen International Opportunities Fund. |
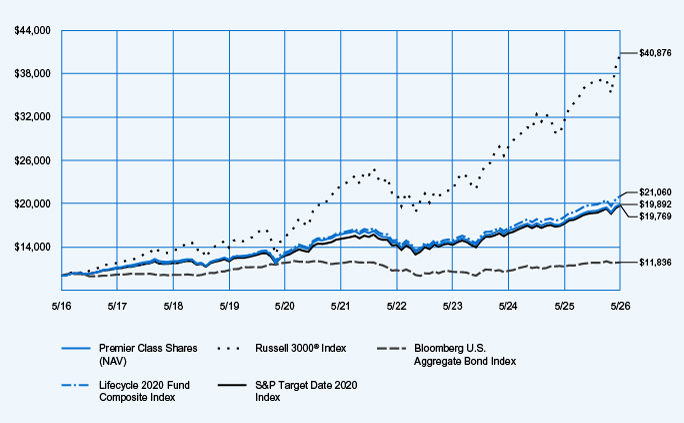
Average Annual Total Returns
| 1-Year | 5-Year | 10-Year | ||||||||||
| Premier Class Shares at NAV |
13.96 | % | 4.81 | % | 7.12 | % | ||||||
| Russell 3000® Index |
29.45 | % | 12.92 | % | 15.12 | % | ||||||
| Bloomberg U.S. Aggregate Bond Index |
5.13 | % | 0.17 | % | 1.70 | % | ||||||
| Lifecycle 2020 Fund Composite Index |
15.96 | % | 5.74 | % | 7.73 | % | ||||||
| S&P Target Date 2020 Index |
14.70 | % | 5.52 | % | 7.05 | % | ||||||
Fund Statistics (as of May 31, 2026)
| Fund net assets |
$ | 1,998,504,066 | ||
| Total number of portfolio holdings |
24 | |||
| Portfolio turnover (%) |
28% | |||
| Total management fees paid for the year |
$ | 8,102,906 | ||
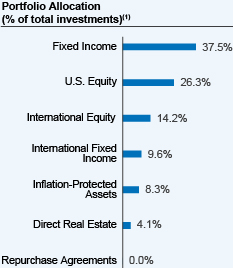 |
| (1) | Affiliated investment companies (Underlying Funds), except for repurchase agreements, where applicable. |
How has the Fund changed?
Portfolio manager update: Effective October 1, 2025, Jeff Sun, CFA was added as a portfolio manager of the Fund.
For more complete information, you may review the Fund’s next prospectus, which is expected to be available by October 1, 2026 at https://www.nuveen.com/en‑us/mutual‑funds/prospectuses or upon request at (800) 257‑8787.
For more complete information, you may review the Fund’s next prospectus, which is expected to be available by October 1, 2026 at https://www.nuveen.com/en‑us/mutual‑funds/prospectuses or upon request at (800) 257‑8787.
This report describes changes to the Fund that occurred during the reporting period.
What were the Fund costs for the last year? (based on a hypothetical $10,000 investment)
| Cost of a $10,000 investment | Costs paid as a percentage of $10,000 investment* | |||
| Class I Shares |
$39 | 0.36% | ||
| * | The Fund’s ratios include the expenses of the Underlying Funds, excluding the expenses of the Dividend Growth, Dividend Value, Floating Rate Income, Growth Opportunities ETF, International Value, Small Cap Select and the Nuveen Real Property Fund LP and exclude the income of the Underlying Funds. Annualized for period less than one year. |
How did the Fund perform last year? What affected the Fund’s performance?
| Performance Highlights The Nuveen Lifecycle 2020 Fund returned 13.98% for Class I Shares at net asset value (NAV) for the 12 months ended May 31, 2026. The Fund underperformed the Lifecycle 2020 Fund Composite Index, which returned 15.96%. The Fund’s Composite Index consisted of: 33.8% Bloomberg U.S. Aggregate Bond Index; 28.6% Russell 3000® Index; 15.4% MSCI All Country World Index ex USA Investable Market Index; 8.4% Bloomberg U.S. 1–3 Year Government/Credit Bond Index; 8.4% Bloomberg U.S. Treasury Inflation Protected Securities (TIPS) 1-10 Year Index; and 5.4% Bloomberg Global Aggregate ex-USD Index (Hedged). Top contributors to relative performance • Strong overall performance of the underlying funds investing in fixed income, led by the Nuveen Emerging Markets Debt Fund. • An allocation to the Nuveen Floating Rate Income Fund. • A position in the Nuveen Core Bond Fund. Top detractors from relative performance • A position in the Nuveen Real Property Fund LP. • Holding the Nuveen Dividend Growth Fund. • An allocation to the Nuveen International Opportunities Fund. |
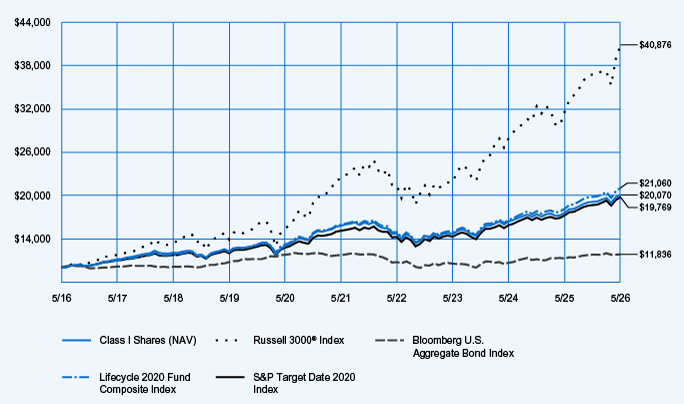
Average Annual Total Returns
| 1-Year | 5-Year | 10-Year | ||||||||||
| Class I Shares at NAV |
13.98 | % | 4.89 | % | 7.21 | % | ||||||
| Russell 3000® Index |
29.45 | % | 12.92 | % | 15.12 | % | ||||||
| Bloomberg U.S. Aggregate Bond Index |
5.13 | % | 0.17 | % | 1.70 | % | ||||||
| Lifecycle 2020 Fund Composite Index |
15.96 | % | 5.74 | % | 7.73 | % | ||||||
| S&P Target Date 2020 Index |
14.70 | % | 5.52 | % | 7.05 | % | ||||||
Fund Statistics (as of May 31, 2026)
| Fund net assets |
$ | 1,998,504,066 | ||
| Total number of portfolio holdings |
24 | |||
| Portfolio turnover (%) |
28% | |||
| Total management fees paid for the year |
$ | 8,102,906 | ||
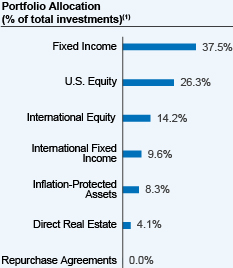 |
| (1) | Affiliated investment companies (Underlying Funds), except for repurchase agreements, where applicable. |
How has the Fund changed?
Portfolio manager update: Effective October 1, 2025, Jeff Sun, CFA was added as a portfolio manager of the Fund.
For more complete information, you may review the Fund’s next prospectus, which is expected to be available by October 1, 2026 at https://www.nuveen.com/en‑us/mutual‑funds/prospectuses or upon request at (800) 257‑8787.
This report describes changes to the Fund that occurred during the reporting period.
What were the Fund costs for the last year? (based on a hypothetical $10,000 investment)
| Cost of a $10,000 investment | Costs paid as a percentage of $10,000 investment* | |||
| Class I Shares |
$31 | 0.29% | ||
| * | The Fund’s ratios include the expenses of the Underlying Funds, excluding the expenses of the Dividend Growth, Dividend Value, Floating Rate Income, Growth Opportunities ETF, International Value, Small Cap Select and the Nuveen Real Property Fund LP and exclude the income of the Underlying Funds. Annualized for period less than one year. |
How did the Fund perform last year? What affected the Fund’s performance?
| Performance Highlights The Nuveen Lifecycle 2025 Fund returned 15.17% for Class I Shares at net asset value (NAV) for the 12 months ended May 31, 2026. The Fund underperformed the Lifecycle 2025 Fund Composite Index, which returned 17.26%. The Fund’s Composite Index consisted of: 32.9% Bloomberg U.S. Aggregate Bond Index; 31.9% Russell 3000® Index; 17.2% MSCI All Country World Index ex USA Investable Market Index; 6.4% Bloomberg U.S. 1–3 Year Government/Credit Bond Index; 6.4% Bloomberg U.S. Treasury Inflation Protected Securities (TIPS) 1-10 Year Index; and 5.2% Bloomberg Global Aggregate ex-USD Index (Hedged). Top contributors to relative performance • Strong overall performance of the underlying funds investing in fixed income, led by the Nuveen Emerging Markets Debt Fund. • An allocation to the Nuveen Quant International Small Cap Equity Fund. • A position in the Nuveen Floating Rate Income Fund. Top detractors from relative performance • A position in the Nuveen Real Property Fund LP. • Holding the Nuveen Dividend Growth Fund. • An allocation to the Nuveen International Opportunities Fund. |
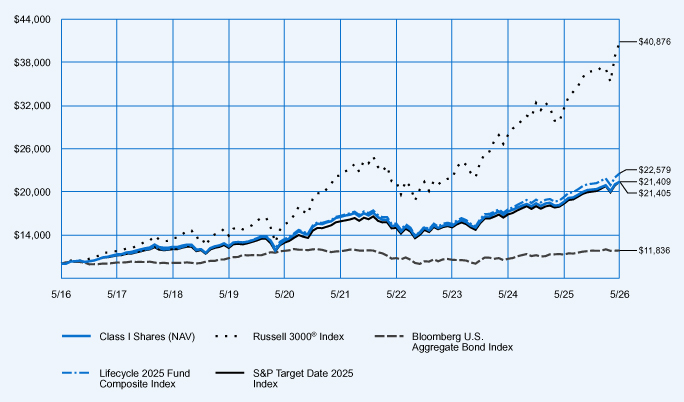
Average Annual Total Returns
| 1-Year | 5-Year | 10-Year | ||||||||||
| Class I Shares at NAV |
15.17 | % | 5.34 | % | 7.91 | % | ||||||
| Russell 3000® Index |
29.45 | % | 12.92 | % | 15.12 | % | ||||||
| Bloomberg U.S. Aggregate Bond Index |
5.13 | % | 0.17 | % | 1.70 | % | ||||||
| Lifecycle 2025 Fund Composite Index |
17.26 | % | 6.28 | % | 8.49 | % | ||||||
| S&P Target Date 2025 Index |
16.73 | % | 6.14 | % | 7.91 | % | ||||||
Fund Statistics (as of May 31, 2026)
| Fund net assets |
$ | 3,278,463,442 | ||
| Total number of portfolio holdings |
24 | |||
| Portfolio turnover (%) |
29% | |||
| Total management fees paid for the year |
$ | 13,215,459 | ||
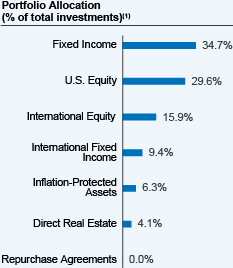 |
| (1) | Affiliated investment companies (Underlying Funds), except for repurchase agreements, where applicable. |
How has the Fund changed?
Portfolio manager update: Effective October 1, 2025, Jeff Sun, CFA was added as a portfolio manager of the Fund.
For more complete information, you may review the Fund’s next prospectus, which is expected to be available by October 1, 2026 at https://www.nuveen.com/en‑us/mutual‑funds/prospectuses or upon request at (800) 257‑8787.
For more complete information, you may review the Fund’s next prospectus, which is expected to be available by October 1, 2026 at https://www.nuveen.com/en‑us/mutual‑funds/prospectuses or upon request at (800) 257‑8787.
This report describes changes to the Fund that occurred during the reporting period.
What were the Fund costs for the last year? (based on a hypothetical $10,000 investment)
| Cost of a $10,000 investment | Costs paid as a percentage of $10,000 investment* | |||
| Premier Class Shares |
$43 | 0.40% | ||
| * | The Fund’s ratios include the expenses of the Underlying Funds, excluding the expenses of the Dividend Growth, Dividend Value, Floating Rate Income, Growth Opportunities ETF, International Value, Small Cap Select and the Nuveen Real Property Fund LP and exclude the income of the Underlying Funds. Annualized for period less than one year. |
How did the Fund perform last year? What affected the Fund’s performance?
| Performance Highlights The Nuveen Lifecycle 2025 Fund returned 14.94% for Premier Class Shares at net asset value (NAV) for the 12 months ended May 31, 2026. The Fund underperformed the Lifecycle 2025 Fund Composite Index, which returned 17.26%. The Fund’s Composite Index consisted of: 32.9% Bloomberg U.S. Aggregate Bond Index; 31.9% Russell 3000 Index; 17.2% MSCI All Country World Index ex USA Investable Market Index; 6.4% Bloomberg U.S. 1–3 Year Government/Credit Bond Index; 6.4% Bloomberg U.S. Treasury Inflation Protected Securities (TIPS) 1-10 Year Index; and 5.2% Bloomberg Global Aggregate ex-USD Index (Hedged). Top contributors to relative performance • Strong overall performance of the underlying funds investing in fixed income, led by the Nuveen Emerging Markets Debt Fund. • An allocation to the Nuveen Quant International Small Cap Equity Fund. • A position in the Nuveen Floating Rate Income Fund. Top detractors from relative performance • A position in the Nuveen Real Property Fund LP. • Holding the Nuveen Dividend Growth Fund. • An allocation to the Nuveen International Opportunities Fund. |
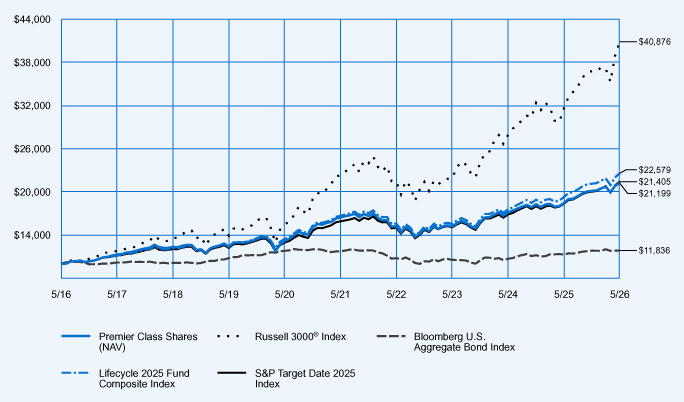
Average Annual Total Returns
| 1-Year | 5-Year | 10-Year | ||||||||||
| Premier Class Shares at NAV |
14.94 | % | 5.23 | % | 7.80 | % | ||||||
| Russell 3000® Index |
29.45 | % | 12.92 | % | 15.12 | % | ||||||
| Bloomberg U.S. Aggregate Bond Index |
5.13 | % | 0.17 | % | 1.70 | % | ||||||
| Lifecycle 2025 Fund Composite Index |
17.26 | % | 6.28 | % | 8.49 | % | ||||||
| S&P Target Date 2025 Index |
16.73 | % | 6.14 | % | 7.91 | % | ||||||
Fund Statistics (as of May 31, 2026)
| Fund net assets |
$ | 3,278,463,442 | ||
| Total number of portfolio holdings |
24 | |||
| Portfolio turnover (%) |
29% | |||
| Total management fees paid for the year |
$ | 13,215,459 | ||
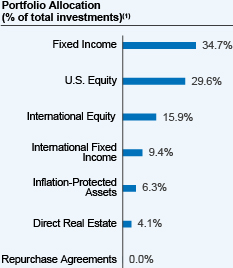 |
| (1) | Affiliated investment companies (Underlying Funds), except for repurchase agreements, where applicable. |
How has the Fund changed?
Portfolio manager update: Effective October 1, 2025, Jeff Sun, CFA was added as a portfolio manager of the Fund.
For more complete information, you may review the Fund’s next prospectus, which is expected to be available by October 1, 2026 at https://www.nuveen.com/en‑us/mutual‑funds/prospectuses or upon request at (800) 257‑8787.
For more complete information, you may review the Fund’s next prospectus, which is expected to be available by October 1, 2026 at https://www.nuveen.com/en‑us/mutual‑funds/prospectuses or upon request at (800) 257‑8787.
This report describes changes to the Fund that occurred during the reporting period.
What were the Fund costs for the last year? (based on a hypothetical $10,000 investment)
| Cost of a $10,000 investment | Costs paid as a percentage of $10,000 investment* | |||
| Class R6 Shares |
$27 | 0.25% | ||
| * | The Fund’s ratios include the expenses of the Underlying Funds, excluding the expenses of the Dividend Growth, Dividend Value, Floating Rate Income, Growth Opportunities ETF, International Value, Small Cap Select and the Nuveen Real Property Fund LP and exclude the income of the Underlying Funds. Annualized for period less than one year. |
How did the Fund perform last year? What affected the Fund’s performance?
| Performance Highlights The Nuveen Lifecycle 2025 Fund returned 15.15% for Class R6 Shares at net asset value (NAV) for the 12 months ended May 31, 2026. The Fund underperformed the Lifecycle 2025 Fund Composite Index, which returned 17.26%. The Fund’s Composite Index consisted of: 32.9% Bloomberg U.S. Aggregate Bond Index; 31.9% Russell 3000® Index; 17.2% MSCI All Country World Index ex USA Investable Market Index; 6.4% Bloomberg U.S. 1–3 Year Government/Credit Bond Index; 6.4% Bloomberg U.S. Treasury Inflation Protected Securities (TIPS) 1-10 Year Index; and 5.2% Bloomberg Global Aggregate ex-USD Index (Hedged). Top contributors to relative performance • Strong overall performance of the underlying funds investing in fixed income, led by the Nuveen Emerging Markets Debt Fund. • An allocation to the Nuveen Quant International Small Cap Equity Fund. • A position in the Nuveen Floating Rate Income Fund. Top detractors from relative performance • A position in the Nuveen Real Property Fund LP. • Holding the Nuveen Dividend Growth Fund. • An allocation to the Nuveen International Opportunities Fund. |
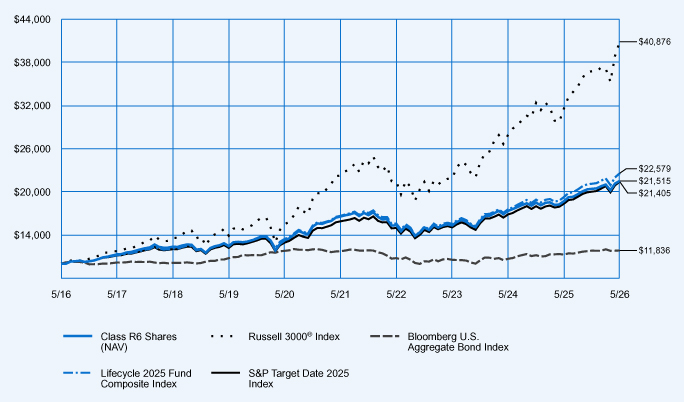
Average Annual Total Returns
| 1-Year | 5-Year | 10-Year | ||||||||||
| Class R6 Shares at NAV |
15.15 | % | 5.38 | % | 7.96 | % | ||||||
| Russell 3000® Index |
29.45 | % | 12.92 | % | 15.12 | % | ||||||
| Bloomberg U.S. Aggregate Bond Index |
5.13 | % | 0.17 | % | 1.70 | % | ||||||
| Lifecycle 2025 Fund Composite Index |
17.26 | % | 6.28 | % | 8.49 | % | ||||||
| S&P Target Date 2025 Index |
16.73 | % | 6.14 | % | 7.91 | % | ||||||
Fund Statistics (as of May 31, 2026)
| Fund net assets |
$ | 3,278,463,442 | ||
| Total number of portfolio holdings |
24 | |||
| Portfolio turnover (%) |
29% | |||
| Total management fees paid for the year |
$ | 13,215,459 | ||
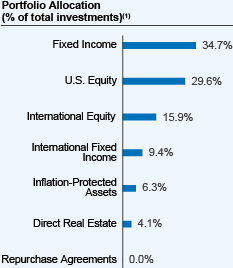 |
| (1) | Affiliated investment companies (Underlying Funds), except for repurchase agreements, where applicable. |
How has the Fund changed?
Portfolio manager update: Effective October 1, 2025, Jeff Sun, CFA was added as a portfolio manager of the Fund.
For more complete information, you may review the Fund’s next prospectus, which is expected to be available by October 1, 2026 at https://www.nuveen.com/en‑us/mutual‑funds/prospectuses or upon request at (800) 257‑8787.
For more complete information, you may review the Fund’s next prospectus, which is expected to be available by October 1, 2026 at https://www.nuveen.com/en‑us/mutual‑funds/prospectuses or upon request at (800) 257‑8787.
This report describes changes to the Fund that occurred during the reporting period.
What were the Fund costs for the last year? (based on a hypothetical $10,000 investment)
| Cost of a $10,000 investment | Costs paid as a percentage of $10,000 investment* | |||
| Retirement Class Shares |
$54 | 0.50% | ||
| * | The Fund’s ratios include the expenses of the Underlying Funds, excluding the expenses of the Dividend Growth, Dividend Value, Floating Rate Income, Growth Opportunities ETF, International Value, Small Cap Select and the Nuveen Real Property Fund LP and exclude the income of the Underlying Funds. Annualized for period less than one year. |
How did the Fund perform last year? What affected the Fund’s performance?
| Performance Highlights The Nuveen Lifecycle 2025 Fund returned 14.90% for Retirement Class Shares at net asset value (NAV) for the 12 months ended May 31, 2026. The Fund underperformed the Lifecycle 2025 Fund Composite Index, which returned 17.26%. The Fund’s Composite Index consisted of: 32.9% Bloomberg U.S. Aggregate Bond Index; 31.9% Russell 3000® Index; 17.2% MSCI All Country World Index ex USA Investable Market Index; 6.4% Bloomberg U.S. 1–3 Year Government/Credit Bond Index; 6.4% Bloomberg U.S. Treasury Inflation Protected Securities (TIPS) 1-10 Year Index; and 5.2% Bloomberg Global Aggregate ex-USD Index (Hedged). Top contributors to relative performance • Strong overall performance of the underlying funds investing in fixed income, led by the Nuveen Emerging Markets Debt Fund. • An allocation to the Nuveen Quant International Small Cap Equity Fund. • A position in the Nuveen Floating Rate Income Fund. Top detractors from relative performance • A position in the Nuveen Real Property Fund LP. • Holding the Nuveen Dividend Growth Fund. • An allocation to the Nuveen International Opportunities Fund. |
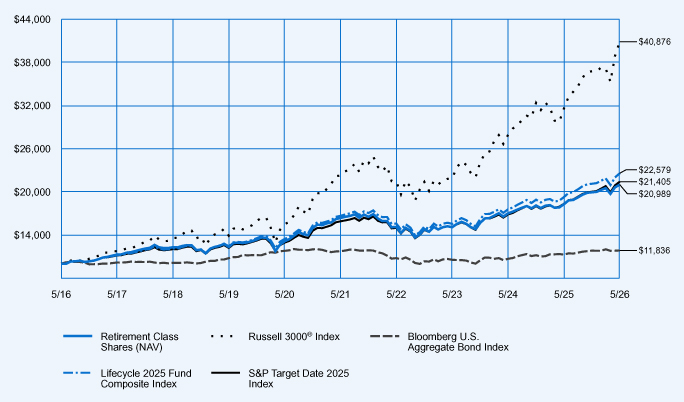
Average Annual Total Returns
| 1-Year | 5-Year | 10-Year | ||||||||||
| Retirement Class Shares at NAV |
14.90 | % | 5.12 | % | 7.70 | % | ||||||
| Russell 3000® Index |
29.45 | % | 12.92 | % | 15.12 | % | ||||||
| Bloomberg U.S. Aggregate Bond Index |
5.13 | % | 0.17 | % | 1.70 | % | ||||||
| Lifecycle 2025 Fund Composite Index |
17.26 | % | 6.28 | % | 8.49 | % | ||||||
| S&P Target Date 2025 Index |
16.73 | % | 6.14 | % | 7.91 | % | ||||||
Fund Statistics (as of May 31, 2026)
| Fund net assets |
$ | 3,278,463,442 | ||
| Total number of portfolio holdings |
24 | |||
| Portfolio turnover (%) |
29% | |||
| Total management fees paid for the year |
$ | 13,215,459 | ||
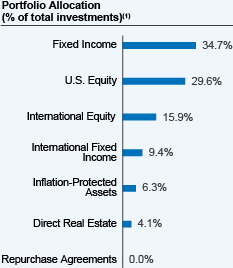 |
| (1) | Affiliated investment companies (Underlying Funds), except for repurchase agreements, where applicable. |
How has the Fund changed?
Portfolio manager update: Effective October 1, 2025, Jeff Sun, CFA was added as a portfolio manager of the Fund.
For more complete information, you may review the Fund’s next prospectus, which is expected to be available by October 1, 2026 at https://www.nuveen.com/en‑us/mutual‑funds/prospectuses or upon request at (800) 257‑8787.
For more complete information, you may review the Fund’s next prospectus, which is expected to be available by October 1, 2026 at https://www.nuveen.com/en‑us/mutual‑funds/prospectuses or upon request at (800) 257‑8787.
This report describes changes to the Fund that occurred during the reporting period.
What were the Fund costs for the last year? (based on a hypothetical $10,000 investment)
| Cost of a $10,000 investment | Costs paid as a percentage of $10,000 investment* | |||
| Retirement Class Shares |
$53 | 0.49% | ||
| * | The Fund’s ratios include the expenses of the Underlying Funds, excluding the expenses of the Dividend Growth, Dividend Value, Floating Rate Income, Growth Opportunities ETF, International Value, Small Cap Select and the Nuveen Real Property Fund LP and exclude the income of the Underlying Funds. Annualized for period less than one year. |
How did the Fund perform last year? What affected the Fund’s performance?
| Performance Highlights The Nuveen Lifecycle 2030 Fund returned 16.58% for Retirement Class Shares at net asset value (NAV) for the 12 months ended May 31, 2026. The Fund underperformed the Lifecycle 2030 Fund Composite Index, which returned 19.27%. The Fund’s Composite Index consisted of: 36.7% Russell 3000® Index; 29.5% Bloomberg U.S. Aggregate Bond Index; 19.8% MSCI All Country World Index ex USA Investable Market Index; 5.2% Bloomberg Global Aggregate ex-USD Index (Hedged); 4.4% Bloomberg U.S. 1–3 Year Government/Credit Bond Index; and 4.4% Bloomberg U.S. Treasury Inflation Protected Securities (TIPS) 1-10 Year Index. Top contributors to relative performance • Strong overall performance of the underlying funds investing in fixed income, led by the Nuveen Emerging Markets Debt Fund. • An allocation to the Nuveen Quant International Small Cap Equity Fund. • A position in the Nuveen International Equity Fund. Top detractors from relative performance • A position in the Nuveen Real Property Fund LP. • Holding the Nuveen Dividend Growth Fund. • An allocation to the Nuveen International Opportunities Fund. |
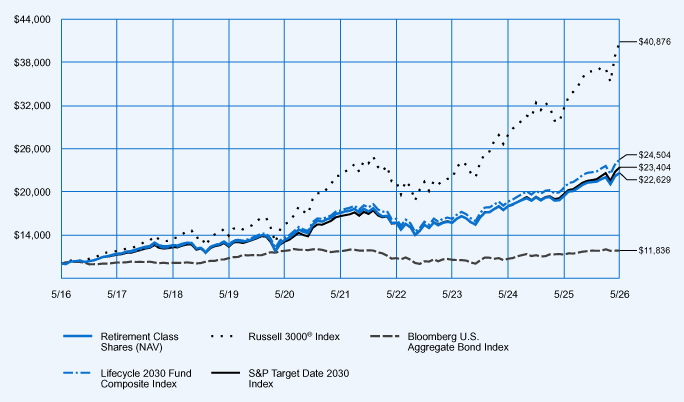
Average Annual Total Returns
| 1-Year | 5-Year | 10-Year | ||||||||||
| Retirement Class Shares at NAV |
16.58 | % | 5.81 | % | 8.51 | % | ||||||
| Russell 3000® Index |
29.45 | % | 12.92 | % | 15.12 | % | ||||||
| Bloomberg U.S. Aggregate Bond Index |
5.13 | % | 0.17 | % | 1.70 | % | ||||||
| Lifecycle 2030 Fund Composite Index |
19.27 | % | 7.08 | % | 9.38 | % | ||||||
| S&P Target Date 2030 Index |
19.00 | % | 7.09 | % | 8.88 | % | ||||||
Fund Statistics (as of May 31, 2026)
| Fund net assets |
$ | 4,540,353,936 | ||
| Total number of portfolio holdings |
24 | |||
| Portfolio turnover (%) |
28% | |||
| Total management fees paid for the year |
$ | 17,972,834 | ||
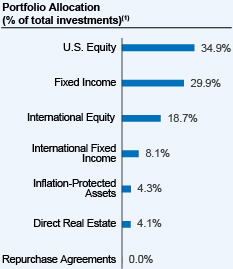 |
| (1) | Affiliated investment companies (Underlying Funds), except for repurchase agreements, where applicable. |
How has the Fund changed?
Portfolio manager update: Effective October 1, 2025, Jeff Sun, CFA was added as a portfolio manager of the Fund.
For more complete information, you may review the Fund’s next prospectus, which is expected to be available by October 1, 2026 at https://www.nuveen.com/en‑us/mutual‑funds/prospectuses or upon request at (800) 257‑8787.
For more complete information, you may review the Fund’s next prospectus, which is expected to be available by October 1, 2026 at https://www.nuveen.com/en‑us/mutual‑funds/prospectuses or upon request at (800) 257‑8787.
This report describes changes to the Fund that occurred during the reporting period.
What were the Fund costs for the last year? (based on a hypothetical $10,000 investment)
| Cost of a $10,000 investment | Costs paid as a percentage of $10,000 investment* | |||
| Class R6 Shares |
$26 | 0.24% | ||
| * | The Fund’s ratios include the expenses of the Underlying Funds, excluding the expenses of the Dividend Growth, Dividend Value, Floating Rate Income, Growth Opportunities ETF, International Value, Small Cap Select and the Nuveen Real Property Fund LP and exclude the income of the Underlying Funds. Annualized for period less than one year. |
How did the Fund perform last year? What affected the Fund’s performance?
| Performance Highlights The Nuveen Lifecycle 2030 Fund returned 16.82% for Class R6 Shares at net asset value (NAV) for the 12 months ended May 31, 2026. The Fund underperformed the Lifecycle 2030 Fund Composite Index, which returned 19.27%. The Fund’s Composite Index consisted of: 36.7% Russell 3000® Index; 29.5% Bloomberg U.S. Aggregate Bond Index; 19.8% MSCI All Country World Index ex USA Investable Market Index; 5.2% Bloomberg Global Aggregate ex-USD Index (Hedged); 4.4% Bloomberg U.S. 1–3 Year Government/Credit Bond Index; and 4.4% Bloomberg U.S. Treasury Inflation Protected Securities (TIPS) 1-10 Year Index. Top contributors to relative performance • Strong overall performance of the underlying funds investing in fixed income, led by the Nuveen Emerging Markets Debt Fund. • An allocation to the Nuveen Quant International Small Cap Equity Fund. • A position in the Nuveen International Equity Fund. Top detractors from relative performance • A position in the Nuveen Real Property Fund LP. • Holding the Nuveen Dividend Growth Fund. • An allocation to the Nuveen International Opportunities Fund. |
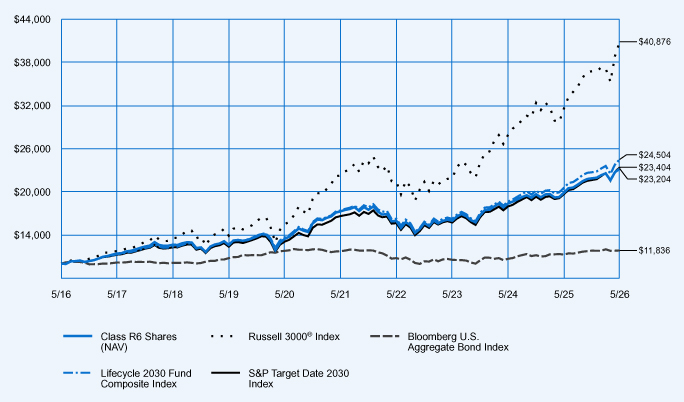
Average Annual Total Returns
| 1-Year | 5-Year | 10-Year | ||||||||||
| Class R6 Shares at NAV |
16.82 | % | 6.08 | % | 8.78 | % | ||||||
| Russell 3000® Index |
29.45 | % | 12.92 | % | 15.12 | % | ||||||
| Bloomberg U.S. Aggregate Bond Index |
5.13 | % | 0.17 | % | 1.70 | % | ||||||
| Lifecycle 2030 Fund Composite Index |
19.27 | % | 7.08 | % | 9.38 | % | ||||||
| S&P Target Date 2030 Index |
19.00 | % | 7.09 | % | 8.88 | % | ||||||
Fund Statistics (as of May 31, 2026)
| Fund net assets |
$ | 4,540,353,936 | ||
| Total number of portfolio holdings |
24 | |||
| Portfolio turnover (%) |
28% | |||
| Total management fees paid for the year |
$ | 17,972,834 | ||
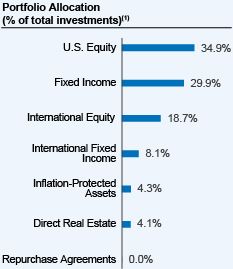 |
| (1) | Affiliated investment companies (Underlying Funds), except for repurchase agreements, where applicable. |
How has the Fund changed?
Portfolio manager update: Effective October 1, 2025, Jeff Sun, CFA was added as a portfolio manager of the Fund.
For more complete information, you may review the Fund’s next prospectus, which is expected to be available by October 1, 2026 at https://www.nuveen.com/en‑us/mutual‑funds/prospectuses or upon request at (800) 257‑8787.
For more complete information, you may review the Fund’s next prospectus, which is expected to be available by October 1, 2026 at https://www.nuveen.com/en‑us/mutual‑funds/prospectuses or upon request at (800) 257‑8787.
This report describes changes to the Fund that occurred during the reporting period.
What were the Fund costs for the last year? (based on a hypothetical $10,000 investment)
| Cost of a $10,000 investment | Costs paid as a percentage of $10,000 investment* | |||
| Premier Class Shares |
$42 | 0.39% | ||
| * | The Fund’s ratios include the expenses of the Underlying Funds, excluding the expenses of the Dividend Growth, Dividend Value, Floating Rate Income, Growth Opportunities ETF, International Value, Small Cap Select and the Nuveen Real Property Fund LP and exclude the income of the Underlying Funds. Annualized for period less than one year. |
How did the Fund perform last year? What affected the Fund’s performance?
| Performance Highlights The Nuveen Lifecycle 2030 Fund returned 16.64% for Premier Class Shares at net asset value (NAV) for the 12 months ended May 31, 2026. The Fund underperformed the Lifecycle 2030 Fund Composite Index, which returned 19.27%. The Fund’s Composite Index consisted of: 36.7% Russell 3000® Index; 29.5% Bloomberg U.S. Aggregate Bond Index; 19.8% MSCI All Country World Index ex USA Investable Market Index; 5.2% Bloomberg Global Aggregate ex-USD Index (Hedged); 4.4% Bloomberg U.S. 1–3 Year Government/Credit Bond Index; and 4.4% Bloomberg U.S. Treasury Inflation Protected Securities (TIPS) 1-10 Year Index. Top contributors to relative performance • Strong overall performance of the underlying funds investing in fixed income, led by the Nuveen Emerging Markets Debt Fund. • An allocation to the Nuveen Quant International Small Cap Equity Fund. • A position in the Nuveen International Equity Fund. Top detractors from relative performance • A position in the Nuveen Real Property Fund LP. • Holding the Nuveen Dividend Growth Fund. • An allocation to the Nuveen International Opportunities Fund. |
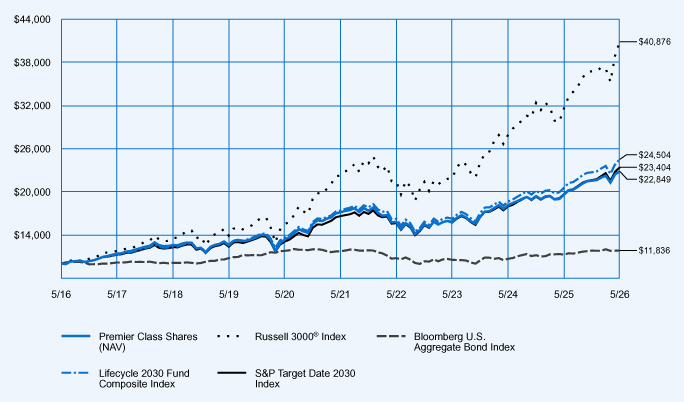
Average Annual Total Returns
| 1-Year | 5-Year | 10-Year | ||||||||||
| Premier Class Shares at NAV |
16.64 | % | 5.90 | % | 8.61 | % | ||||||
| Russell 3000® Index |
29.45 | % | 12.92 | % | 15.12 | % | ||||||
| Bloomberg U.S. Aggregate Bond Index |
5.13 | % | 0.17 | % | 1.70 | % | ||||||
| Lifecycle 2030 Fund Composite Index |
19.27 | % | 7.08 | % | 9.38 | % | ||||||
| S&P Target Date 2030 Index |
19.00 | % | 7.09 | % | 8.88 | % | ||||||
Fund Statistics (as of May 31, 2026)
| Fund net assets |
$ | 4,540,353,936 | ||
| Total number of portfolio holdings |
24 | |||
| Portfolio turnover (%) |
28% | |||
| Total management fees paid for the year |
$ | 17,972,834 | ||
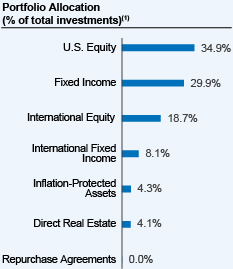 |
| (1) | Affiliated investment companies (Underlying Funds), except for repurchase agreements, where applicable. |
How has the Fund changed?
Portfolio manager update: Effective October 1, 2025, Jeff Sun, CFA was added as a portfolio manager of the Fund.
For more complete information, you may review the Fund’s next prospectus, which is expected to be available by October 1, 2026 at https://www.nuveen.com/en‑us/mutual‑funds/prospectuses or upon request at (800) 257‑8787.
For more complete information, you may review the Fund’s next prospectus, which is expected to be available by October 1, 2026 at https://www.nuveen.com/en‑us/mutual‑funds/prospectuses or upon request at (800) 257‑8787.
This report describes changes to the Fund that occurred during the reporting period.
What were the Fund costs for the last year? (based on a hypothetical $10,000 investment)
| Cost of a $10,000 investment | Costs paid as a percentage of $10,000 investment* | |||
| Class I Shares |
$29 | 0.27% | ||
| * | The Fund’s ratios include the expenses of the Underlying Funds, excluding the expenses of the Dividend Growth, Dividend Value, Floating Rate Income, Growth Opportunities ETF, International Value, Small Cap Select and the Nuveen Real Property Fund LP and exclude the income of the Underlying Funds. Annualized for period less than one year. |
How did the Fund perform last year? What affected the Fund’s performance?
| Performance Highlights The Nuveen Lifecycle 2030 Fund returned 16.87% for Class I Shares at net asset value (NAV) for the 12 months ended May 31, 2026. The Fund underperformed the Lifecycle 2030 Fund Composite Index, which returned 19.27%. The Fund’s Composite Index consisted of: 36.7% Russell 3000® Index; 29.5% Bloomberg U.S. Aggregate Bond Index; 19.8% MSCI All Country World Index ex USA Investable Market Index; 5.2% Bloomberg Global Aggregate ex-USD Index (Hedged); 4.4% Bloomberg U.S. 1–3 Year Government/Credit Bond Index; and 4.4% Bloomberg U.S. Treasury Inflation Protected Securities (TIPS) 1-10 Year Index. Top contributors to relative performance • Strong overall performance of the underlying funds investing in fixed income, led by the Nuveen Emerging Markets Debt Fund. • An allocation to the Nuveen Quant International Small Cap Equity Fund. • A position in the Nuveen International Equity Fund. Top detractors from relative performance • A position in the Nuveen Real Property Fund LP. • Holding the Nuveen Dividend Growth Fund. • An allocation to the Nuveen International Opportunities Fund. |
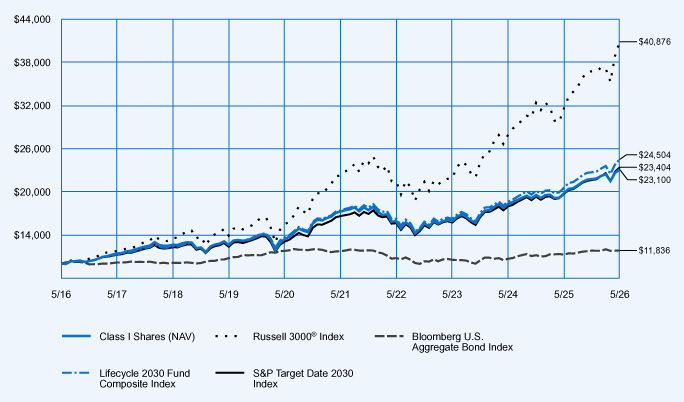
Average Annual Total Returns
| 1-Year | 5-Year | 10-Year | ||||||||||
| Class I Shares at NAV |
16.87 | % | 6.03 | % | 8.73 | % | ||||||
| Russell 3000® Index |
29.45 | % | 12.92 | % | 15.12 | % | ||||||
| Bloomberg U.S. Aggregate Bond Index |
5.13 | % | 0.17 | % | 1.70 | % | ||||||
| Lifecycle 2030 Fund Composite Index |
19.27 | % | 7.08 | % | 9.38 | % | ||||||
| S&P Target Date 2030 Index |
19.00 | % | 7.09 | % | 8.88 | % | ||||||
Fund Statistics (as of May 31, 2026)
| Fund net assets |
$ | 4,540,353,936 | ||
| Total number of portfolio holdings |
24 | |||
| Portfolio turnover (%) |
28% | |||
| Total management fees paid for the year |
$ | 17,972,834 | ||
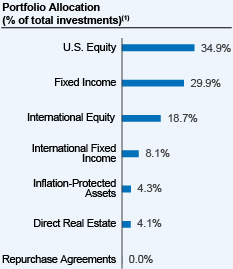 |
| (1) | Affiliated investment companies (Underlying Funds), except for repurchase agreements, where applicable. |
How has the Fund changed?
Portfolio manager update: Effective October 1, 2025, Jeff Sun, CFA was added as a portfolio manager of the Fund.
For more complete information, you may review the Fund’s next prospectus, which is expected to be available by October 1, 2026 at https://www.nuveen.com/en‑us/mutual‑funds/prospectuses or upon request at (800) 257‑8787.
For more complete information, you may review the Fund’s next prospectus, which is expected to be available by October 1, 2026 at https://www.nuveen.com/en‑us/mutual‑funds/prospectuses or upon request at (800) 257‑8787.
This report describes changes to the Fund that occurred during the reporting period.
What were the Fund costs for the last year? (based on a hypothetical $10,000 investment)
| Cost of a $10,000 investment | Costs paid as a percentage of $10,000 investment* | |||
| Class I Shares |
$30 | 0.27% | ||
| * | The Fund’s ratios include the expenses of the Underlying Funds, excluding the expenses of the Dividend Growth, Dividend Value, Floating Rate Income, Growth Opportunities ETF, International Value, Small Cap Select and the Nuveen Real Property Fund LP and exclude the income of the Underlying Funds. Annualized for period less than one year. |
How did the Fund perform last year? What affected the Fund’s performance?
| Performance Highlights The Nuveen Lifecycle 2035 Fund returned 18.72% for Class I Shares at net asset value (NAV) for the 12 months ended May 31, 2026. The Fund underperformed the Lifecycle 2035 Fund Composite Index, which returned 21.38%. The Fund’s Composite Index consisted of: 41.9% Russell 3000® Index; 25.7% Bloomberg U.S. Aggregate Bond Index; 22.6% MSCI All Country World Index ex USA Investable Market Index; 5.0% Bloomberg Global Aggregate ex-USD Index (Hedged); 2.4% Bloomberg U.S. 1–3 Year Government/Credit Bond Index; and 2.4% Bloomberg U.S. Treasury Inflation Protected Securities (TIPS) 1-10 Year Index. Top contributors to relative performance • Holding the Nuveen Quant International Small Cap Equity Fund. • An allocation to the Nuveen International Equity Fund. • A position in the Emerging Markets Debt Fund. Top detractors from relative performance • A position in the Nuveen Dividend Growth Fund. • Holding the Nuveen Real Property Fund LP. • An allocation to the Nuveen International Opportunities Fund. |
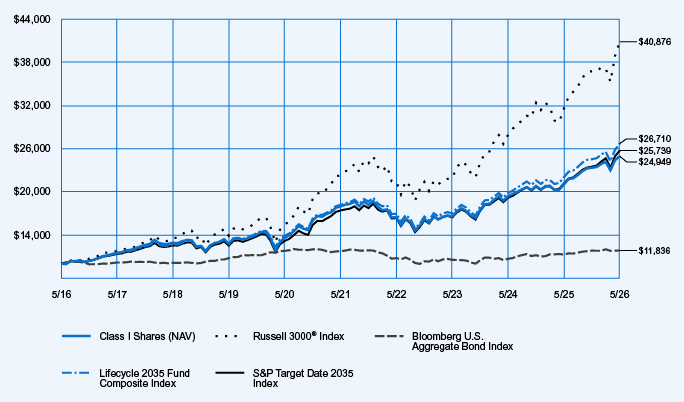
Average Annual Total Returns
| 1-Year | 5-Year | 10-Year | ||||||||||
| Class I Shares at NAV |
18.72 | % | 6.79 | % | 9.57 | % | ||||||
| Russell 3000® Index |
29.45 | % | 12.92 | % | 15.12 | % | ||||||
| Bloomberg U.S. Aggregate Bond Index |
5.13 | % | 0.17 | % | 1.70 | % | ||||||
| Lifecycle 2035 Fund Composite Index |
21.38 | % | 8.01 | % | 10.32 | % | ||||||
| S&P Target Date 2035 Index |
21.69 | % | 8.14 | % | 9.92 | % | ||||||
Fund Statistics (as of May 31, 2026)
| Fund net assets |
$ | 5,252,642,148 | ||
| Total number of portfolio holdings |
24 | |||
| Portfolio turnover (%) |
27% | |||
| Total management fees paid for the year |
$ | 20,452,966 | ||
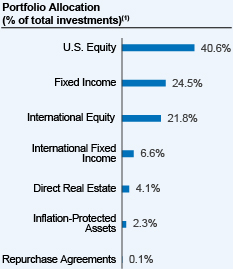 |
| (1) | Affiliated investment companies (Underlying Funds), except for repurchase agreements, where applicable. |
How has the Fund changed?
Portfolio manager update: Effective October 1, 2025, Jeff Sun, CFA was added as a portfolio manager of the Fund.
For more complete information, you may review the Fund’s next prospectus, which is expected to be available by October 1, 2026 at https://www.nuveen.com/en‑us/mutual‑funds/prospectuses or upon request at (800) 257‑8787.
For more complete information, you may review the Fund’s next prospectus, which is expected to be available by October 1, 2026 at https://www.nuveen.com/en‑us/mutual‑funds/prospectuses or upon request at (800) 257‑8787.
This report describes changes to the Fund that occurred during the reporting period.
What were the Fund costs for the last year? (based on a hypothetical $10,000 investment)
| Cost of a $10,000 investment | Costs paid as a percentage of $10,000 investment* | |||
| Premier Class Shares |
$42 | 0.38% | ||
| * | The Fund’s ratios include the expenses of the Underlying Funds, excluding the expenses of the Dividend Growth, Dividend Value, Floating Rate Income, Growth Opportunities ETF, International Value, Small Cap Select and the Nuveen Real Property Fund LP and exclude the income of the Underlying Funds. Annualized for period less than one year. |
How did the Fund perform last year? What affected the Fund’s performance?
| Performance Highlights The Nuveen Lifecycle 2035 Fund returned 18.45% for Premier Class Shares at net asset value (NAV) for the 12 months ended May 31, 2026. The Fund underperformed the Lifecycle 2035 Fund Composite Index, which returned 21.38%. The Fund’s Composite Index consisted of: 41.9% Russell 3000® Index; 25.7% Bloomberg U.S. Aggregate Bond Index; 22.6% MSCI All Country World Index ex USA Investable Market Index; 5.0% Bloomberg Global Aggregate ex-USD Index (Hedged); 2.4% Bloomberg U.S. 1–3 Year Government/Credit Bond Index; and 2.4% Bloomberg U.S. Treasury Inflation Protected Securities (TIPS) 1-10 Year Index. Top contributors to relative performance • Holding the Nuveen Quant International Small Cap Equity Fund. • An allocation to the Nuveen International Equity Fund. • A position in the Emerging Markets Debt Fund. Top detractors from relative performance • A position in the Nuveen Dividend Growth Fund. • Holding the Nuveen Real Property Fund LP. • An allocation to the Nuveen International Opportunities Fund. |
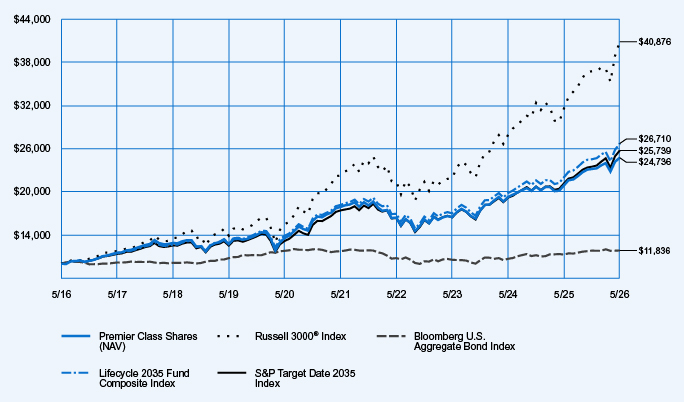
Average Annual Total Returns
| 1-Year | 5-Year | 10-Year | ||||||||||
| Premier Class Shares at NAV |
18.45 | % | 6.69 | % | 9.48 | % | ||||||
| Russell 3000® Index |
29.45 | % | 12.92 | % | 15.12 | % | ||||||
| Bloomberg U.S. Aggregate Bond Index |
5.13 | % | 0.17 | % | 1.70 | % | ||||||
| Lifecycle 2035 Fund Composite Index |
21.38 | % | 8.01 | % | 10.32 | % | ||||||
| S&P Target Date 2035 Index |
21.69 | % | 8.14 | % | 9.92 | % | ||||||
Fund Statistics (as of May 31, 2026)
| Fund net assets |
$ | 5,252,642,148 | ||
| Total number of portfolio holdings |
24 | |||
| Portfolio turnover (%) |
27% | |||
| Total management fees paid for the year |
$ | 20,452,966 | ||
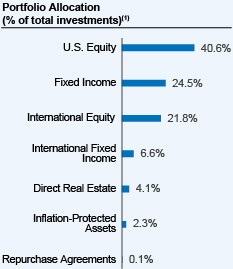 |
| (1) | Affiliated investment companies (Underlying Funds), except for repurchase agreements, where applicable. |
How has the Fund changed?
Portfolio manager update: Effective October 1, 2025, Jeff Sun, CFA was added as a portfolio manager of the Fund.
For more complete information, you may review the Fund’s next prospectus, which is expected to be available by October 1, 2026 at https://www.nuveen.com/en‑us/mutual‑funds/prospectuses or upon request at (800) 257‑8787.
For more complete information, you may review the Fund’s next prospectus, which is expected to be available by October 1, 2026 at https://www.nuveen.com/en‑us/mutual‑funds/prospectuses or upon request at (800) 257‑8787.
This report describes changes to the Fund that occurred during the reporting period.
What were the Fund costs for the last year? (based on a hypothetical $10,000 investment)
| Cost of a $10,000 investment | Costs paid as a percentage of $10,000 investment* | |||
| Class R6 Shares |
$25 | 0.23% | ||
| * | The Fund’s ratios include the expenses of the Underlying Funds, excluding the expenses of the Dividend Growth, Dividend Value, Floating Rate Income, Growth Opportunities ETF, International Value, Small Cap Select and the Nuveen Real Property Fund LP and exclude the income of the Underlying Funds. Annualized for period less than one year. |
How did the Fund perform last year? What affected the Fund’s performance?
| Performance Highlights The Nuveen Lifecycle 2035 Fund returned 18.67% for Class R6 Shares at net asset value (NAV) for the 12 months ended May 31, 2026. The Fund underperformed the Lifecycle 2035 Fund Composite Index, which returned 21.38%. The Fund’s Composite Index consisted of: 41.9% Russell 3000® Index; 25.7% Bloomberg U.S. Aggregate Bond Index; 22.6% MSCI All Country World Index ex USA Investable Market Index; 5.0% Bloomberg Global Aggregate ex-USD Index (Hedged); 2.4% Bloomberg U.S. 1–3 Year Government/Credit Bond Index; and 2.4% Bloomberg U.S. Treasury Inflation Protected Securities (TIPS) 1-10 Year Index. Top contributors to relative performance • Holding the Nuveen Quant International Small Cap Equity Fund. • An allocation to the Nuveen International Equity Fund. • A position in the Emerging Markets Debt Fund. Top detractors from relative performance • A position in the Nuveen Dividend Growth Fund. • Holding the Nuveen Real Property Fund LP. • An allocation to the Nuveen International Opportunities Fund. |
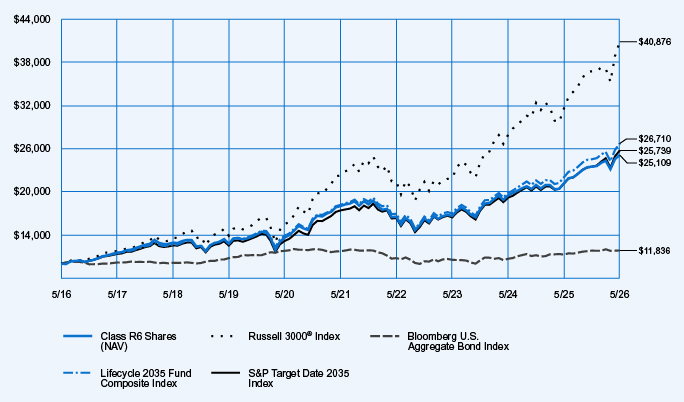
Average Annual Total Returns
| 1-Year | 5-Year | 10-Year | ||||||||||
| Class R6 Shares at NAV |
18.67 | % | 6.86 | % | 9.64 | % | ||||||
| Russell 3000® Index |
29.45 | % | 12.92 | % | 15.12 | % | ||||||
| Bloomberg U.S. Aggregate Bond Index |
5.13 | % | 0.17 | % | 1.70 | % | ||||||
| Lifecycle 2035 Fund Composite Index |
21.38 | % | 8.01 | % | 10.32 | % | ||||||
| S&P Target Date 2035 Index |
21.69 | % | 8.14 | % | 9.92 | % | ||||||
Fund Statistics (as of May 31, 2026)
| Fund net assets |
$ | 5,252,642,148 | ||
| Total number of portfolio holdings |
24 | |||
| Portfolio turnover (%) |
27% | |||
| Total management fees paid for the year |
$ | 20,452,966 | ||
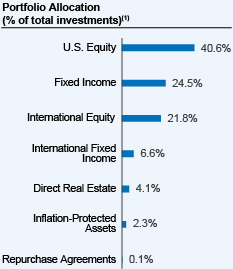 |
| (1) | Affiliated investment companies (Underlying Funds), except for repurchase agreements, where applicable. |
How has the Fund changed?
Portfolio manager update: Effective October 1, 2025, Jeff Sun, CFA was added as a portfolio manager of the Fund.
For more complete information, you may review the Fund’s next prospectus, which is expected to be available by October 1, 2026 at https://www.nuveen.com/en‑us/mutual‑funds/prospectuses or upon request at (800) 257‑8787.
For more complete information, you may review the Fund’s next prospectus, which is expected to be available by October 1, 2026 at https://www.nuveen.com/en‑us/mutual‑funds/prospectuses or upon request at (800) 257‑8787.
This report describes changes to the Fund that occurred during the reporting period.
What were the Fund costs for the last year? (based on a hypothetical $10,000 investment)
| Cost of a $10,000 investment | Costs paid as a percentage of $10,000 investment* | |||
| Retirement Class Shares |
$52 | 0.48% | ||
| * | The Fund’s ratios include the expenses of the Underlying Funds, excluding the expenses of the Dividend Growth, Dividend Value, Floating Rate Income, Growth Opportunities ETF, International Value, Small Cap Select and the Nuveen Real Property Fund LP and exclude the income of the Underlying Funds. Annualized for period less than one year. |
How did the Fund perform last year? What affected the Fund’s performance?
| Performance Highlights The Nuveen Lifecycle 2035 Fund returned 18.46% for Retirement Class Shares at net asset value (NAV) for the 12 months ended May 31, 2026. The Fund underperformed the Lifecycle 2035 Fund Composite Index, which returned 21.38%. The Fund’s Composite Index consisted of: 41.9% Russell 3000® Index; 25.7% Bloomberg U.S. Aggregate Bond Index; 22.6% MSCI All Country World Index ex USA Investable Market Index; 5.0% Bloomberg Global Aggregate ex-USD Index (Hedged); 2.4% Bloomberg U.S. 1–3 Year Government/Credit Bond Index; and 2.4% Bloomberg U.S. Treasury Inflation Protected Securities (TIPS) 1-10 Year Index. Top contributors to relative performance • Holding the Nuveen Quant International Small Cap Equity Fund. • An allocation to the Nuveen International Equity Fund. • A position in the Emerging Markets Debt Fund. Top detractors from relative performance • A position in the Nuveen Dividend Growth Fund. • Holding the Nuveen Real Property Fund LP. • An allocation to the Nuveen International Opportunities Fund. |
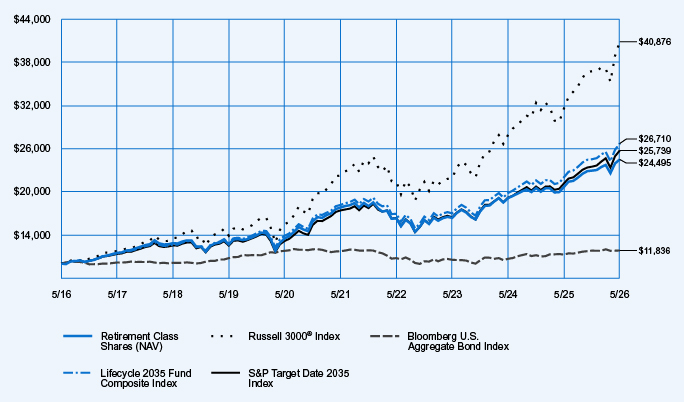
Average Annual Total Returns
| 1-Year | 5-Year | 10-Year | ||||||||||
| Retirement Class Shares at NAV |
18.46 | % | 6.60 | % | 9.37 | % | ||||||
| Russell 3000® Index |
29.45 | % | 12.92 | % | 15.12 | % | ||||||
| Bloomberg U.S. Aggregate Bond Index |
5.13 | % | 0.17 | % | 1.70 | % | ||||||
| Lifecycle 2035 Fund Composite Index |
21.38 | % | 8.01 | % | 10.32 | % | ||||||
| S&P Target Date 2035 Index |
21.69 | % | 8.14 | % | 9.92 | % | ||||||
Fund Statistics (as of May 31, 2026)
| Fund net assets |
$ | 5,252,642,148 | ||
| Total number of portfolio holdings |
24 | |||
| Portfolio turnover (%) |
27% | |||
| Total management fees paid for the year |
$ | 20,452,966 | ||
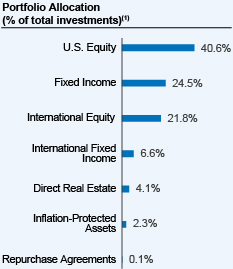 |
| (1) | Affiliated investment companies (Underlying Funds), except for repurchase agreements, where applicable. |
How has the Fund changed?
Portfolio manager update: Effective October 1, 2025, Jeff Sun, CFA was added as a portfolio manager of the Fund.
For more complete information, you may review the Fund’s next prospectus, which is expected to be available by October 1, 2026 at https://www.nuveen.com/en‑us/mutual‑funds/prospectuses or upon request at (800) 257‑8787.
For more complete information, you may review the Fund’s next prospectus, which is expected to be available by October 1, 2026 at https://www.nuveen.com/en‑us/mutual‑funds/prospectuses or upon request at (800) 257‑8787.
This report describes changes to the Fund that occurred during the reporting period.
What were the Fund costs for the last year? (based on a hypothetical $10,000 investment)
| Cost of a $10,000 investment | Costs paid as a percentage of $10,000 investment* | |||
| Retirement Class Shares |
$52 | 0.47% | ||
| * | The Fund’s ratios include the expenses of the Underlying Funds, excluding the expenses of the Dividend Growth, Dividend Value, Floating Rate Income, Growth Opportunities ETF, International Value, Small Cap Select and the Nuveen Real Property Fund LP and exclude the income of the Underlying Funds. Annualized for period less than one year. |
How did the Fund perform last year? What affected the Fund’s performance?
| Performance Highlights The Nuveen Lifecycle 2040 Fund returned 21.00% for Retirement Class Shares at net asset value (NAV) for the 12 months ended May 31, 2026. The Fund underperformed the Lifecycle 2040 Fund Composite Index, which returned 24.47%. The Fund’s Composite Index consisted of: 49.3% Russell 3000® Index; 26.5% MSCI All Country World Index ex USA Investable Market Index; 19.3% Bloomberg U.S. Aggregate Bond Index; 4.1% Bloomberg Global Aggregate ex-USD Index (Hedged); 0.4% Bloomberg U.S. 1–3 Year Government/Credit Bond Index; and 0.4% Bloomberg U.S. Treasury Inflation Protected Securities (TIPS) 1-10 Year Index. Top contributors to relative performance • Holding the Nuveen Quant International Small Cap Equity Fund. • An allocation to the Nuveen International Equity Fund. • A position in the Nuveen Growth Opportunities ETF. Top detractors from relative performance • A position in the Nuveen Dividend Growth Fund. • Holding the Nuveen International Opportunities Fund. • An allocation to the Nuveen Real Property Fund LP. |
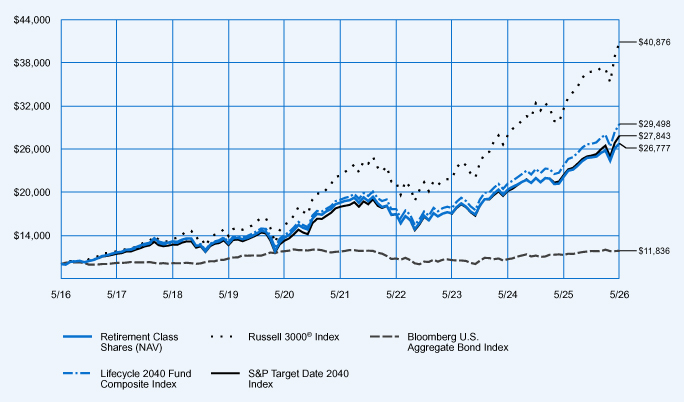
Average Annual Total Returns
| 1-Year | 5-Year | 10-Year | ||||||||||
| Retirement Class Shares at NAV |
21.00 | % | 7.63 | % | 10.35 | % | ||||||
| Russell 3000® Index |
29.45 | % | 12.92 | % | 15.12 | % | ||||||
| Bloomberg U.S. Aggregate Bond Index |
5.13 | % | 0.17 | % | 1.70 | % | ||||||
| Lifecycle 2040 Fund Composite Index |
24.47 | % | 9.26 | % | 11.42 | % | ||||||
| S&P Target Date 2040 Index |
24.41 | % | 9.16 | % | 10.78 | % | ||||||
Fund Statistics (as of May 31, 2026)
| Fund net assets |
$ | 6,540,225,997 | ||
| Total number of portfolio holdings |
24 | |||
| Portfolio turnover (%) |
25% | |||
| Total management fees paid for the year |
$ | 25,503,055 | ||
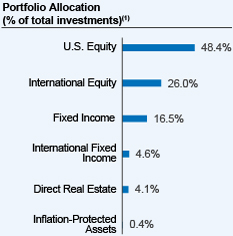 |
| (1) | Affiliated investment companies (Underlying Funds), except for repurchase agreements, where applicable. |
How has the Fund changed?
Portfolio manager update: Effective October 1, 2025, Jeff Sun, CFA was added as a portfolio manager of the Fund.
For more complete information, you may review the Fund’s next prospectus, which is expected to be available by October 1, 2026 at https://www.nuveen.com/en‑us/mutual‑funds/prospectuses or upon request at (800) 257‑8787.
For more complete information, you may review the Fund’s next prospectus, which is expected to be available by October 1, 2026 at https://www.nuveen.com/en‑us/mutual‑funds/prospectuses or upon request at (800) 257‑8787.
This report describes changes to the Fund that occurred during the reporting period.
What were the Fund costs for the last year? (based on a hypothetical $10,000 investment)
| Cost of a $10,000 investment | Costs paid as a percentage of $10,000 investment* | |||
| Class R6 Shares |
$24 | 0.22% | ||
| * | The Fund’s ratios include the expenses of the Underlying Funds, excluding the expenses of the Dividend Growth, Dividend Value, Floating Rate Income, Growth Opportunities ETF, International Value, Small Cap Select and the Nuveen Real Property Fund LP and exclude the income of the Underlying Funds. Annualized for period less than one year. |
How did the Fund perform last year? What affected the Fund’s performance?
| Performance Highlights The Nuveen Lifecycle 2040 Fund returned 21.29% for Class R6 Shares at net asset value (NAV) for the 12 months ended May 31, 2026. The Fund underperformed the Lifecycle 2040 Fund Composite Index, which returned 24.47%. The Fund’s Composite Index consisted of: 49.3% Russell 3000® Index; 26.5% MSCI All Country World Index ex USA Investable Market Index; 19.3% Bloomberg U.S. Aggregate Bond Index; 4.1% Bloomberg Global Aggregate ex-USD Index (Hedged); 0.4% Bloomberg U.S. 1–3 Year Government/Credit Bond Index; and 0.4% Bloomberg U.S. Treasury Inflation Protected Securities (TIPS) 1-10 Year Index. Top contributors to relative performance • Holding the Nuveen Quant International Small Cap Equity Fund. • An allocation to the Nuveen International Equity Fund. • A position in the Nuveen Growth Opportunities ETF. Top detractors from relative performance • A position in the Nuveen Dividend Growth Fund. • Holding the Nuveen International Opportunities Fund. • An allocation to the Nuveen Real Property Fund LP. |
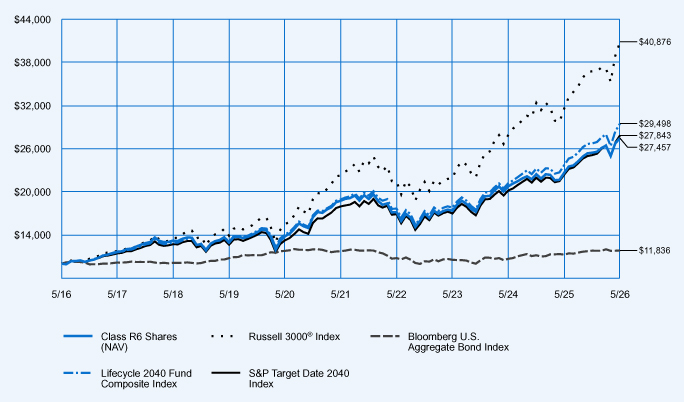
Average Annual Total Returns
| 1-Year | 5-Year | 10-Year | ||||||||||
| Class R6 Shares at NAV |
21.29 | % | 7.91 | % | 10.63 | % | ||||||
| Russell 3000® Index |
29.45 | % | 12.92 | % | 15.12 | % | ||||||
| Bloomberg U.S. Aggregate Bond Index |
5.13 | % | 0.17 | % | 1.70 | % | ||||||
| Lifecycle 2040 Fund Composite Index |
24.47 | % | 9.26 | % | 11.42 | % | ||||||
| S&P Target Date 2040 Index |
24.41 | % | 9.16 | % | 10.78 | % | ||||||
Fund Statistics (as of May 31, 2026)
| Fund net assets |
$ | 6,540,225,997 | ||
| Total number of portfolio holdings |
24 | |||
| Portfolio turnover (%) |
25% | |||
| Total management fees paid for the year |
$ | 25,503,055 | ||
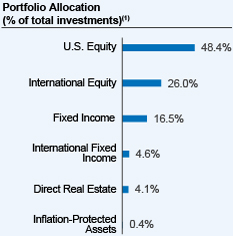 |
| (1) | Affiliated investment companies (Underlying Funds), except for repurchase agreements, where applicable. |
How has the Fund changed?
Portfolio manager update: Effective October 1, 2025, Jeff Sun, CFA was added as a portfolio manager of the Fund.
For more complete information, you may review the Fund’s next prospectus, which is expected to be available by October 1, 2026 at https://www.nuveen.com/en-us/mutual-funds/prospectuses or upon request at (800) 257-8787.
For more complete information, you may review the Fund’s next prospectus, which is expected to be available by October 1, 2026 at https://www.nuveen.com/en-us/mutual-funds/prospectuses or upon request at (800) 257-8787.
This report describes changes to the Fund that occurred during the reporting period.
What were the Fund costs for the last year? (based on a hypothetical $10,000 investment)
| Cost of a $10,000 investment | Costs paid as a percentage of $10,000 investment* | |||
| Premier Class Shares |
$41 | 0.37% | ||
| * | The Fund’s ratios include the expenses of the Underlying Funds, excluding the expenses of the Dividend Growth, Dividend Value, Floating Rate Income, Growth Opportunities ETF, International Value, Small Cap Select and the Nuveen Real Property Fund LP and exclude the income of the Underlying Funds. Annualized for period less than one year. |
How did the Fund perform last year? What affected the Fund’s performance?
| Performance Highlights The Nuveen Lifecycle 2040 Fund returned 21.19% for Premier Class Shares at net asset value (NAV) for the 12 months ended May 31, 2026. The Fund underperformed the Lifecycle 2040 Fund Composite Index, which returned 24.47%. The Fund’s Composite Index consisted of: 49.3% Russell 3000® Index; 26.5% MSCI All Country World Index ex USA Investable Market Index; 19.3% Bloomberg U.S. Aggregate Bond Index; 4.1% Bloomberg Global Aggregate ex-USD Index (Hedged); 0.4% Bloomberg U.S. 1–3 Year Government/Credit Bond Index; and 0.4% Bloomberg U.S. Treasury Inflation Protected Securities (TIPS) 1-10 Year Index. Top contributors to relative performance • Holding the Nuveen Quant International Small Cap Equity Fund. • An allocation to the Nuveen International Equity Fund. • A position in the Nuveen Growth Opportunities ETF. Top detractors from relative performance • A position in the Nuveen Dividend Growth Fund. • Holding the Nuveen International Opportunities Fund. • An allocation to the Nuveen Real Property Fund LP. |
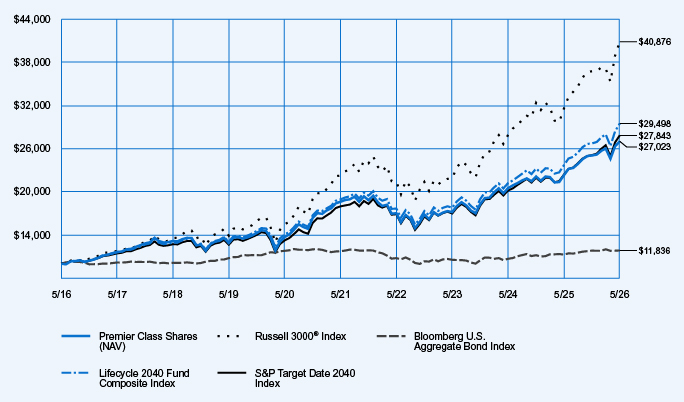
Average Annual Total Returns
| 1-Year | 5-Year | 10-Year | ||||||||||
| Premier Class Shares at NAV |
21.19 | % | 7.74 | % | 10.45 | % | ||||||
| Russell 3000® Index |
29.45 | % | 12.92 | % | 15.12 | % | ||||||
| Bloomberg U.S. Aggregate Bond Index |
5.13 | % | 0.17 | % | 1.70 | % | ||||||
| Lifecycle 2040 Fund Composite Index |
24.47 | % | 9.26 | % | 11.42 | % | ||||||
| S&P Target Date 2040 Index |
24.41 | % | 9.16 | % | 10.78 | % | ||||||
Fund Statistics (as of May 31, 2026)
| Fund net assets |
$ | 6,540,225,997 | ||
| Total number of portfolio holdings |
24 | |||
| Portfolio turnover (%) |
25% | |||
| Total management fees paid for the year |
$ | 25,503,055 | ||
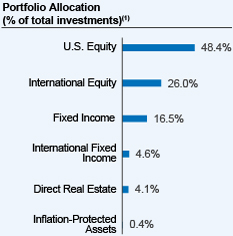 |
| (1) | Affiliated investment companies (Underlying Funds), except for repurchase agreements, where applicable. |
How has the Fund changed?
Portfolio manager update: Effective October 1, 2025, Jeff Sun, CFA was added as a portfolio manager of the Fund.
For more complete information, you may review the Fund’s next prospectus, which is expected to be available by October 1, 2026 at https://www.nuveen.com/en‑us/mutual‑funds/prospectuses or upon request at (800) 257‑8787.
For more complete information, you may review the Fund’s next prospectus, which is expected to be available by October 1, 2026 at https://www.nuveen.com/en‑us/mutual‑funds/prospectuses or upon request at (800) 257‑8787.
This report describes changes to the Fund that occurred during the reporting period.
What were the Fund costs for the last year? (based on a hypothetical $10,000 investment)
| Cost of a $10,000 investment | Costs paid as a percentage of $10,000 investment* | |||
| Class I Shares |
$29 | 0.26% | ||
| * | The Fund’s ratios include the expenses of the Underlying Funds, excluding the expenses of the Dividend Growth, Dividend Value, Floating Rate Income, Growth Opportunities ETF, International Value, Small Cap Select and the Nuveen Real Property Fund LP and exclude the income of the Underlying Funds. Annualized for period less than one year. |
How did the Fund perform last year? What affected the Fund’s performance?
| Performance Highlights The Nuveen Lifecycle 2040 Fund returned 21.27% for Class I Shares at net asset value (NAV) for the 12 months ended May 31, 2026. The Fund underperformed the Lifecycle 2040 Fund Composite Index, which returned 24.47%. The Fund’s Composite Index consisted of: 49.3% Russell 3000® Index; 26.5% MSCI All Country World Index ex USA Investable Market Index; 19.3% Bloomberg U.S. Aggregate Bond Index; 4.1% Bloomberg Global Aggregate ex-USD Index (Hedged); 0.4% Bloomberg U.S. 1–3 Year Government/Credit Bond Index; and 0.4% Bloomberg U.S. Treasury Inflation Protected Securities (TIPS) 1-10 Year Index. Top contributors to relative performance • Holding the Nuveen Quant International Small Cap Equity Fund. • An allocation to the Nuveen International Equity Fund. • A position in the Nuveen Growth Opportunities ETF. Top detractors from relative performance • A position in the Nuveen Dividend Growth Fund. • Holding the Nuveen International Opportunities Fund. • An allocation to the Nuveen Real Property Fund LP. |
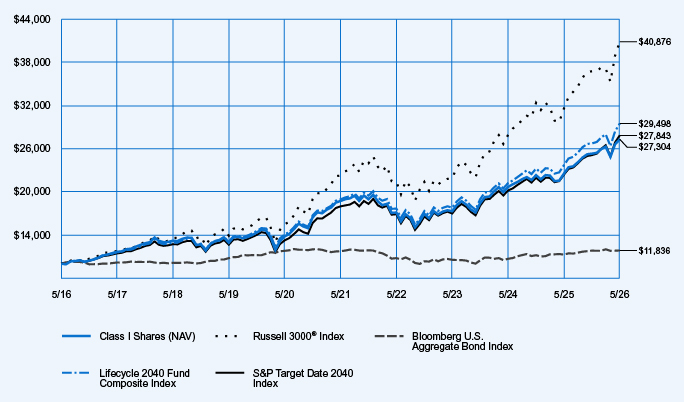
Average Annual Total Returns
| 1-Year | 5-Year | 10-Year | ||||||||||
| Class I Shares at NAV |
21.27 | % | 7.84 | % | 10.57 | % | ||||||
| Russell 3000® Index |
29.45 | % | 12.92 | % | 15.12 | % | ||||||
| Bloomberg U.S. Aggregate Bond Index |
5.13 | % | 0.17 | % | 1.70 | % | ||||||
| Lifecycle 2040 Fund Composite Index |
24.47 | % | 9.26 | % | 11.42 | % | ||||||
| S&P Target Date 2040 Index |
24.41 | % | 9.16 | % | 10.78 | % | ||||||
Fund Statistics (as of May 31, 2026)
| Fund net assets |
$ | 6,540,225,997 | ||
| Total number of portfolio holdings |
24 | |||
| Portfolio turnover (%) |
25% | |||
| Total management fees paid for the year |
$ | 25,503,055 | ||
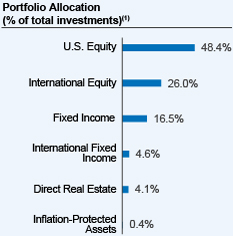 |
| (1) | Affiliated investment companies (Underlying Funds), except for repurchase agreements, where applicable. |
How has the Fund changed?
Portfolio manager update: Effective October 1, 2025, Jeff Sun, CFA was added as a portfolio manager of the Fund.
For more complete information, you may review the Fund’s next prospectus, which is expected to be available by October 1, 2026 at https://www.nuveen.com/en‑us/mutual‑funds/prospectuses or upon request at (800) 257‑8787.
For more complete information, you may review the Fund’s next prospectus, which is expected to be available by October 1, 2026 at https://www.nuveen.com/en‑us/mutual‑funds/prospectuses or upon request at (800) 257‑8787.
This report describes changes to the Fund that occurred during the reporting period.
What were the Fund costs for the last year? (based on a hypothetical $10,000 investment)
| Cost of a $10,000 investment | Costs paid as a percentage of $10,000 investment* | |||
| Class A Shares |
$27 | 0.25% | ||
| * | The Fund’s ratios do not include the expenses or income of the Underlying Funds. Annualized for period less than one year. |
How did the Fund perform last year? What affected the Fund’s performance?
| Performance Highlights The Nuveen Managed Allocation Fund returned 17.77% for Class A Shares at net asset value (NAV) for the 12 months ended May 31, 2026. The Fund underperformed the Managed Allocation Fund Composite Index, which returned 20.02%. The Fund’s Composite Index consisted of: 40.0% Bloomberg U.S. Aggregate Bond Index; 39.0% Russell 3000® Index; and 21.0% MSCI All Country World Index ex USA Investable Market Index. Top contributors to relative performance • Holding the Nuveen Core Plus Bond Fund. • An allocation to the Nuveen Quant International Small Cap Equity Fund. • A position in the Nuveen International Equity Fund. Top detractors from relative performance • A position in the Nuveen Dividend Growth Fund. • Holding the Nuveen International Opportunities Fund. • An allocation to the Nuveen Dividend Value Fund. |
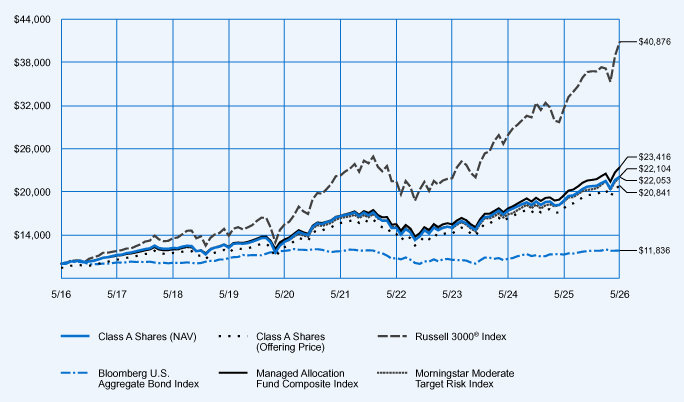
Average Annual Total Returns
| 1-Year | 5-Year | 10-Year | ||||||||||
| Class A Shares at NAV (excluding maximum sales charge) |
17.77 | % | 5.90 | % | 8.25 | % | ||||||
| Class A Shares at maximum sales charge (Offering Price) |
10.99 | % | 4.65 | % | 7.62 | % | ||||||
| Russell 3000® Index |
29.45 | % | 12.92 | % | 15.12 | % | ||||||
| Bloomberg U.S. Aggregate Bond Index |
5.13 | % | 0.17 | % | 1.70 | % | ||||||
| Managed Allocation Fund Composite Index |
20.02 | % | 7.04 | % | 8.88 | % | ||||||
| Morningstar Moderate Target Risk Index |
18.36 | % | 6.16 | % | 8.23 | % | ||||||
Fund Statistics (as of May 31, 2026)
| Fund net assets |
$ | 950,019,737 | ||
| Total number of portfolio holdings |
16 | |||
| Portfolio turnover (%) |
19% | |||
| Total management fees paid for the year |
$ | 0 | ||
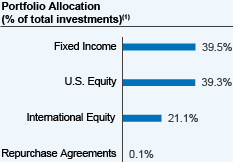 |
| (1) | Affiliated investment companies (Underlying Funds), except for repurchase agreements, where applicable. |
How has the Fund changed?
Portfolio manager update: Effective October 1, 2025, Jeff Sun, CFA was added as a portfolio manager of the Fund.
For more complete information, you may review the Fund’s next prospectus, which is expected to be available by October 1, 2026 at https://www.nuveen.com/en-us/mutual-funds/prospectuses or upon request at (800) 257-8787.
For more complete information, you may review the Fund’s next prospectus, which is expected to be available by October 1, 2026 at https://www.nuveen.com/en-us/mutual-funds/prospectuses or upon request at (800) 257-8787.
This report describes changes to the Fund that occurred during the reporting period.
What were the Fund costs for the last year? (based on a hypothetical $10,000 investment)
| Cost of a $10,000 investment | Costs paid as a percentage of $10,000 investment* | |||
| Class R6 Shares |
$0 | 0.00% | ||
| * | The Fund’s ratios do not include the expenses or income of the Underlying Funds. Annualized for period less than one year. |
How did the Fund perform last year? What affected the Fund’s performance?
| Performance Highlights The Nuveen Managed Allocation Fund returned 18.07% for Class R6 Shares at net asset value (NAV) for the 12 months ended May 31, 2026. The Fund underperformed the Managed Allocation Fund Composite Index, which returned 20.02%. The Fund’s Composite Index consisted of: 40.0% Bloomberg U.S. Aggregate Bond Index; 39.0% Russell 3000® Index; and 21.0% MSCI All Country World Index ex USA Investable Market Index. Top contributors to relative performance • Holding the Nuveen Core Plus Bond Fund. • An allocation to the Nuveen Quant International Small Cap Equity Fund. • A position in the Nuveen International Equity Fund. Top detractors from relative performance • A position in the Nuveen Dividend Growth Fund. • Holding the Nuveen International Opportunities Fund. • An allocation to the Nuveen Dividend Value Fund. |
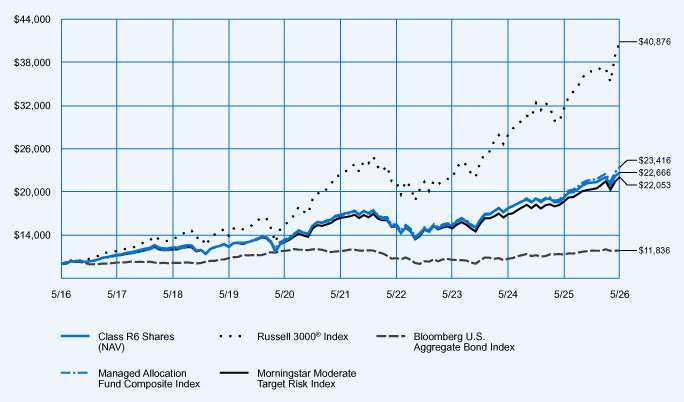
Average Annual Total Returns
| 1-Year | 5-Year | 10-Year | ||||||||||
| Class R6 Shares at NAV |
18.07 | % | 6.17 | % | 8.53 | % | ||||||
| Russell 3000® Index |
29.45 | % | 12.92 | % | 15.12 | % | ||||||
| Bloomberg U.S. Aggregate Bond Index |
5.13 | % | 0.17 | % | 1.70 | % | ||||||
| Managed Allocation Fund Composite Index |
20.02 | % | 7.04 | % | 8.88 | % | ||||||
| Morningstar Moderate Target Risk Index |
18.36 | % | 6.16 | % | 8.23 | % | ||||||
Fund Statistics (as of May 31, 2026)
| Fund net assets |
$ | 950,019,737 | ||
| Total number of portfolio holdings |
16 | |||
| Portfolio turnover (%) |
19% | |||
| Total management fees paid for the year |
$ | 0 | ||
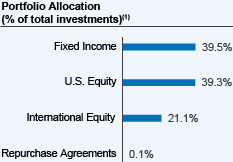 |
| (1) | Affiliated investment companies (Underlying Funds), except for repurchase agreements, where applicable. |
How has the Fund changed?
Portfolio manager update: Effective October 1, 2025, Jeff Sun, CFA was added as a portfolio manager of the Fund.
For more complete information, you may review the Fund’s next prospectus, which is expected to be available by October 1, 2026 at https://www.nuveen.com/en-us/mutual-funds/prospectuses or upon request at (800) 257-8787.
For more complete information, you may review the Fund’s next prospectus, which is expected to be available by October 1, 2026 at https://www.nuveen.com/en-us/mutual-funds/prospectuses or upon request at (800) 257-8787.
This report describes changes to the Fund that occurred during the reporting period.
What were the Fund costs for the last year? (based on a hypothetical $10,000 investment)
| Cost of a $10,000 investment | Costs paid as a percentage of $10,000 investment* | |||
| Retirement Class Shares |
$27 | 0.25% | ||
| * | The Fund’s ratios do not include the expenses or income of the Underlying Funds. Annualized for period less than one year. |
How did the Fund perform last year? What affected the Fund’s performance?
| Performance Highlights The Nuveen Managed Allocation Fund returned 17.80% for Retirement Class Shares at net asset value (NAV) for the 12 months ended May 31, 2026. The Fund underperformed the Managed Allocation Fund Composite Index, which returned 20.02%. The Fund’s Composite Index consisted of: 40.0% Bloomberg U.S. Aggregate Bond Index; 39.0% Russell 3000® Index; and 21.0% MSCI All Country World Index ex USA Investable Market Index. Top contributors to relative performance • Holding the Nuveen Core Plus Bond Fund. • An allocation to the Nuveen Quant International Small Cap Equity Fund. • A position in the Nuveen International Equity Fund. Top detractors from relative performance • A position in the Nuveen Dividend Growth Fund. • Holding the Nuveen International Opportunities Fund. • An allocation to the Nuveen Dividend Value Fund. |
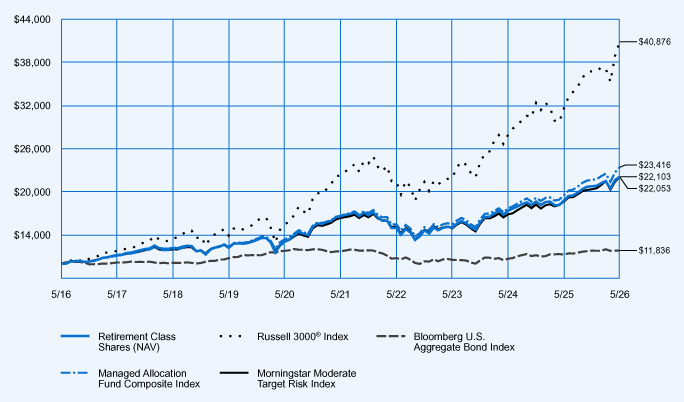
Average Annual Total Returns
| 1-Year | 5-Year | 10-Year | ||||||||||
| Retirement Class Shares at NAV |
17.80 | % | 5.90 | % | 8.25 | % | ||||||
| Russell 3000® Index |
29.45 | % | 12.92 | % | 15.12 | % | ||||||
| Bloomberg U.S. Aggregate Bond Index |
5.13 | % | 0.17 | % | 1.70 | % | ||||||
| Managed Allocation Fund Composite Index |
20.02 | % | 7.04 | % | 8.88 | % | ||||||
| Morningstar Moderate Target Risk Index |
18.36 | % | 6.16 | % | 8.23 | % | ||||||
Fund Statistics (as of May 31, 2026)
| Fund net assets |
$ | 950,019,737 | ||
| Total number of portfolio holdings |
16 | |||
| Portfolio turnover (%) |
19% | |||
| Total management fees paid for the year |
$ | 0 | ||
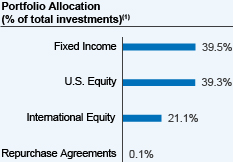 |
| (1) | Affiliated investment companies (Underlying Funds), except for repurchase agreements, where applicable. |
How has the Fund changed?
Portfolio manager update: Effective October 1, 2025, Jeff Sun, CFA was added as a portfolio manager of the Fund.
For more complete information, you may review the Fund’s next prospectus, which is expected to be available by October 1, 2026 at https://www.nuveen.com/en-us/mutual-funds/prospectuses or upon request at (800) 257-8787.
For more complete information, you may review the Fund’s next prospectus, which is expected to be available by October 1, 2026 at https://www.nuveen.com/en-us/mutual-funds/prospectuses or upon request at (800) 257-8787.
This report describes changes to the Fund that occurred during the reporting period.
What were the Fund costs for the last year? (based on a hypothetical $10,000 investment)
| Cost of a $10,000 investment | Costs paid as a percentage of $10,000 investment* | |||
| Retirement Class Shares |
$52 | 0.47% | ||
| * | The Fund’s ratios include the expenses of the Underlying Funds, excluding the expenses of the Dividend Growth, Dividend Value, Floating Rate Income, Growth Opportunities ETF, International Value, Small Cap Select and the Nuveen Real Property Fund LP and exclude the income of the Underlying Funds. Annualized for period less than one year. |
How did the Fund perform last year? What affected the Fund’s performance?
| Performance Highlights The Nuveen Lifecycle 2045 Fund returned 22.89% for Retirement Class Shares at net asset value (NAV) for the 12 months ended May 31, 2026. The Fund underperformed the Lifecycle 2045 Fund Composite Index, which returned 26.69%. The Fund’s Composite Index consisted of: 54.9% Russell 3000® Index; 29.6% MSCI All Country World Index ex USA Investable Market Index; 12.6% Bloomberg U.S. Aggregate Bond Index; and 2.9% Bloomberg Global Aggregate ex-USD Index (Hedged). Top contributors to relative performance • Holding the Nuveen Quant International Small Cap Equity Fund. • An allocation to the Nuveen International Equity Fund. • A position in the Nuveen Growth Opportunities ETF. Top detractors from relative performance • A position in the Nuveen Dividend Growth Fund. • Holding the Nuveen International Opportunities Fund. • An allocation to the Nuveen Real Property Fund LP. |
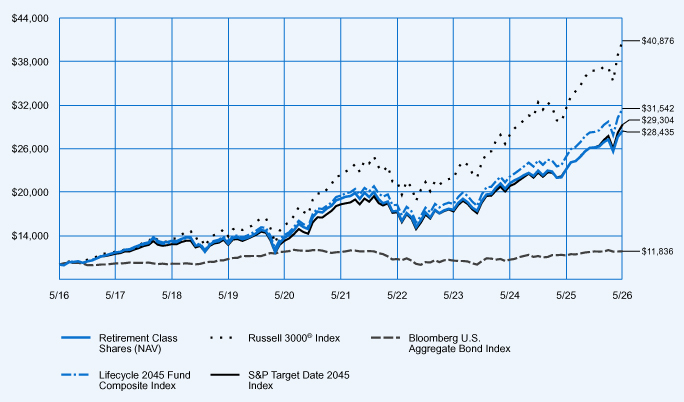
Average Annual Total Returns
| 1-Year | 5-Year | 10-Year | ||||||||||
| Retirement Class Shares at NAV |
22.89 | % | 8.29 | % | 11.02 | % | ||||||
| Russell 3000® Index |
29.45 | % | 12.92 | % | 15.12 | % | ||||||
| Bloomberg U.S. Aggregate Bond Index |
5.13 | % | 0.17 | % | 1.70 | % | ||||||
| Lifecycle 2045 Fund Composite Index |
26.69 | % | 10.06 | % | 12.17 | % | ||||||
| S&P Target Date 2045 Index |
26.31 | % | 9.86 | % | 11.35 | % | ||||||
Fund Statistics (as of May 31, 2026)
| Fund net assets |
$ | 4,992,782,632 | ||
| Total number of portfolio holdings |
22 | |||
| Portfolio turnover (%) |
26% | |||
| Total management fees paid for the year |
$ | 19,163,417 | ||
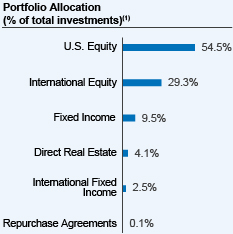 |
| (1) | Affiliated investment companies (Underlying Funds), except for repurchase agreements, where applicable. |
How has the Fund changed?
Portfolio manager update: Effective October 1, 2025, Jeff Sun, CFA was added as a portfolio manager of the Fund.
For more complete information, you may review the Fund’s next prospectus, which is expected to be available by October 1, 2026 at https://www.nuveen.com/en‑us/mutual‑funds/prospectuses or upon request at (800) 257‑8787.
For more complete information, you may review the Fund’s next prospectus, which is expected to be available by October 1, 2026 at https://www.nuveen.com/en‑us/mutual‑funds/prospectuses or upon request at (800) 257‑8787.
This report describes changes to the Fund that occurred during the reporting period.
What were the Fund costs for the last year? (based on a hypothetical $10,000 investment)
| Cost of a $10,000 investment | Costs paid as a percentage of $10,000 investment* | |||
| Class R6 Shares |
$25 | 0.22% | ||
| * | The Fund’s ratios include the expenses of the Underlying Funds, excluding the expenses of the Dividend Growth, Dividend Value, Floating Rate Income, Growth Opportunities ETF, International Value, Small Cap Select and the Nuveen Real Property Fund LP and exclude the income of the Underlying Funds. Annualized for period less than one year. |
How did the Fund perform last year? What affected the Fund’s performance?
| Performance Highlights The Nuveen Lifecycle 2045 Fund returned 23.23% for Class R6 Shares at net asset value (NAV) for the 12 months ended May 31, 2026. The Fund underperformed the Lifecycle 2045 Fund Composite Index, which returned 26.69%. The Fund’s Composite Index consisted of: 54.9% Russell 3000® Index; 29.6% MSCI All Country World Index ex USA Investable Market Index; 12.6% Bloomberg U.S. Aggregate Bond Index; and 2.9% Bloomberg Global Aggregate ex-USD Index (Hedged). Top contributors to relative performance • Holding the Nuveen Quant International Small Cap Equity Fund. • An allocation to the Nuveen International Equity Fund. • A position in the Nuveen Growth Opportunities ETF. Top detractors from relative performance • A position in the Nuveen Dividend Growth Fund. • Holding the Nuveen International Opportunities Fund. • An allocation to the Nuveen Real Property Fund LP. |
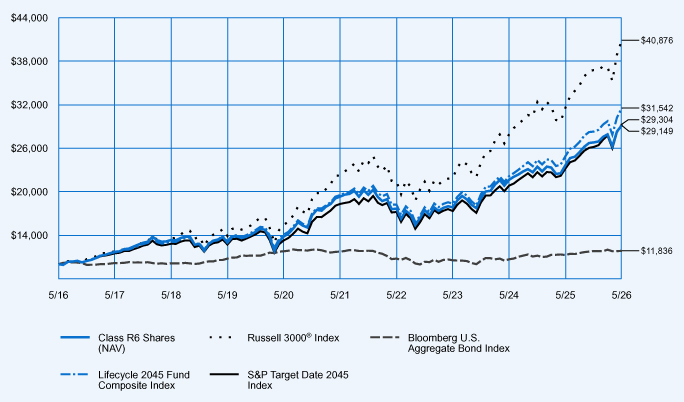
Average Annual Total Returns
| 1-Year | 5-Year | 10-Year | ||||||||||
| Class R6 Shares at NAV |
23.23 | % | 8.56 | % | 11.29 | % | ||||||
| Russell 3000® Index |
29.45 | % | 12.92 | % | 15.12 | % | ||||||
| Bloomberg U.S. Aggregate Bond Index |
5.13 | % | 0.17 | % | 1.70 | % | ||||||
| Lifecycle 2045 Fund Composite Index |
26.69 | % | 10.06 | % | 12.17 | % | ||||||
| S&P Target Date 2045 Index |
26.31 | % | 9.86 | % | 11.35 | % | ||||||
Fund Statistics (as of May 31, 2026)
| Fund net assets |
$ | 4,992,782,632 | ||
| Total number of portfolio holdings |
22 | |||
| Portfolio turnover (%) |
26% | |||
| Total management fees paid for the year |
$ | 19,163,417 | ||
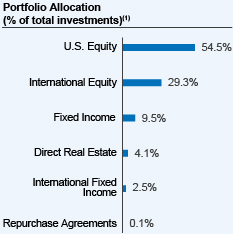 |
| (1) | Affiliated investment companies (Underlying Funds), except for repurchase agreements, where applicable. |
How has the Fund changed?
Portfolio manager update: Effective October 1, 2025, Jeff Sun, CFA was added as a portfolio manager of the Fund.
For more complete information, you may review the Fund’s next prospectus, which is expected to be available by October 1, 2026 at https://www.nuveen.com/en‑us/mutual‑funds/prospectuses or upon request at (800) 257‑8787.
For more complete information, you may review the Fund’s next prospectus, which is expected to be available by October 1, 2026 at https://www.nuveen.com/en‑us/mutual‑funds/prospectuses or upon request at (800) 257‑8787.
This report describes changes to the Fund that occurred during the reporting period.
What were the Fund costs for the last year? (based on a hypothetical $10,000 investment)
| Cost of a $10,000 investment | Costs paid as a percentage of $10,000 investment* | |||
| Premier Class Shares |
$41 | 0.37% | ||
| * | The Fund’s ratios include the expenses of the Underlying Funds, excluding the expenses of the Dividend Growth, Dividend Value, Floating Rate Income, Growth Opportunities ETF, International Value, Small Cap Select and the Nuveen Real Property Fund LP and exclude the income of the Underlying Funds. Annualized for period less than one year. |
How did the Fund perform last year? What affected the Fund’s performance?
| Performance Highlights The Nuveen Lifecycle 2045 Fund returned 23.11% for Premier Class Shares at net asset value (NAV) for the 12 months ended May 31, 2026. The Fund underperformed the Lifecycle 2045 Fund Composite Index, which returned 26.69%. The Fund’s Composite Index consisted of: 54.9% Russell 3000® Index; 29.6% MSCI All Country World Index ex USA Investable Market Index; 12.6% Bloomberg U.S. Aggregate Bond Index; and 2.9% Bloomberg Global Aggregate ex-USD Index (Hedged). Top contributors to relative performance • Holding the Nuveen Quant International Small Cap Equity Fund. • An allocation to the Nuveen International Equity Fund. • A position in the Nuveen Growth Opportunities ETF. Top detractors from relative performance • A position in the Nuveen Dividend Growth Fund. • Holding the Nuveen International Opportunities Fund. • An allocation to the Nuveen Real Property Fund LP. |
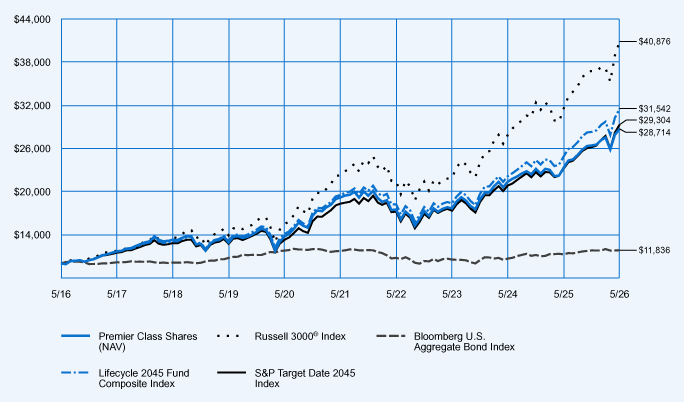
Average Annual Total Returns
| 1-Year | 5-Year | 10-Year | ||||||||||
| Premier Class Shares at NAV |
23.11 | % | 8.41 | % | 11.12 | % | ||||||
| Russell 3000® Index |
29.45 | % | 12.92 | % | 15.12 | % | ||||||
| Bloomberg U.S. Aggregate Bond Index |
5.13 | % | 0.17 | % | 1.70 | % | ||||||
| Lifecycle 2045 Fund Composite Index |
26.69 | % | 10.06 | % | 12.17 | % | ||||||
| S&P Target Date 2045 Index |
26.31 | % | 9.86 | % | 11.35 | % | ||||||
Fund Statistics (as of May 31, 2026)
| Fund net assets |
$ | 4,992,782,632 | ||
| Total number of portfolio holdings |
22 | |||
| Portfolio turnover (%) |
26% | |||
| Total management fees paid for the year |
$ | 19,163,417 | ||
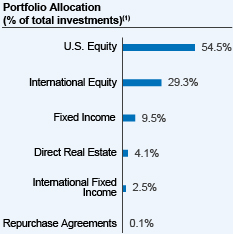 |
| (1) | Affiliated investment companies (Underlying Funds), except for repurchase agreements, where applicable. |
How has the Fund changed?
Portfolio manager update: Effective October 1, 2025, Jeff Sun, CFA was added as a portfolio manager of the Fund.
For more complete information, you may review the Fund’s next prospectus, which is expected to be available by October 1, 2026 at https://www.nuveen.com/en‑us/mutual‑funds/prospectuses or upon request at (800) 257‑8787.
For more complete information, you may review the Fund’s next prospectus, which is expected to be available by October 1, 2026 at https://www.nuveen.com/en‑us/mutual‑funds/prospectuses or upon request at (800) 257‑8787.
This report describes changes to the Fund that occurred during the reporting period.
What were the Fund costs for the last year? (based on a hypothetical $10,000 investment)
| Cost of a $10,000 investment | Costs paid as a percentage of $10,000 investment* | |||
| Class I Shares |
$28 | 0.25% | ||
| * | The Fund’s ratios include the expenses of the Underlying Funds, excluding the expenses of the Dividend Growth, Dividend Value, Floating Rate Income, Growth Opportunities ETF, International Value, Small Cap Select and the Nuveen Real Property Fund LP and exclude the income of the Underlying Funds. Annualized for period less than one year. |
How did the Fund perform last year? What affected the Fund’s performance?
| Performance Highlights The Nuveen Lifecycle 2045 Fund returned 23.27% for Class I Shares at net asset value (NAV) for the 12 months ended May 31, 2026. The Fund underperformed the Lifecycle 2045 Fund Composite Index, which returned 26.69%. The Fund’s Composite Index consisted of: 54.9% Russell 3000® Index; 29.6% MSCI All Country World Index ex USA Investable Market Index; 12.6% Bloomberg U.S. Aggregate Bond Index; and 2.9% Bloomberg Global Aggregate ex-USD Index (Hedged). Top contributors to relative performance • Holding the Nuveen Quant International Small Cap Equity Fund. • An allocation to the Nuveen International Equity Fund. • A position in the Nuveen Growth Opportunities ETF. Top detractors from relative performance • A position in the Nuveen Dividend Growth Fund. • Holding the Nuveen International Opportunities Fund. • An allocation to the Nuveen Real Property Fund LP. |
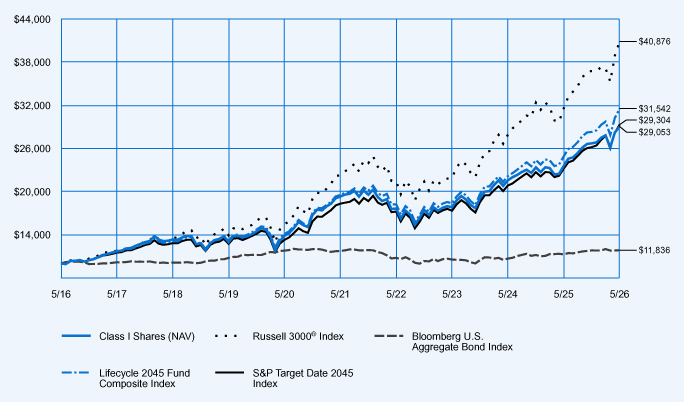
Average Annual Total Returns
| 1-Year | 5-Year | 10-Year | ||||||||||
| Class I Shares at NAV |
23.27 | % | 8.51 | % | 11.26 | % | ||||||
| Russell 3000® Index |
29.45 | % | 12.92 | % | 15.12 | % | ||||||
| Bloomberg U.S. Aggregate Bond Index |
5.13 | % | 0.17 | % | 1.70 | % | ||||||
| Lifecycle 2045 Fund Composite Index |
26.69 | % | 10.06 | % | 12.17 | % | ||||||
| S&P Target Date 2045 Index |
26.31 | % | 9.86 | % | 11.35 | % | ||||||
Fund Statistics (as of May 31, 2026)
| Fund net assets |
$ | 4,992,782,632 | ||
| Total number of portfolio holdings |
22 | |||
| Portfolio turnover (%) |
26% | |||
| Total management fees paid for the year |
$ | 19,163,417 | ||
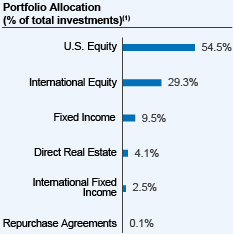 |
| (1) | Affiliated investment companies (Underlying Funds), except for repurchase agreements, where applicable. |
How has the Fund changed?
Portfolio manager update: Effective October 1, 2025, Jeff Sun, CFA was added as a portfolio manager of the Fund.
For more complete information, you may review the Fund’s next prospectus, which is expected to be available by October 1, 2026 at https://www.nuveen.com/en‑us/mutual‑funds/prospectuses or upon request at (800) 257‑8787.
For more complete information, you may review the Fund’s next prospectus, which is expected to be available by October 1, 2026 at https://www.nuveen.com/en‑us/mutual‑funds/prospectuses or upon request at (800) 257‑8787.
This report describes changes to the Fund that occurred during the reporting period.
What were the Fund costs for the last year? (based on a hypothetical $10,000 investment)
| Cost of a $10,000 investment | Costs paid as a percentage of $10,000 investment* | |||
| Class I Shares |
$28 | 0.25% | ||
| * | The Fund’s ratios include the expenses of the Underlying Funds, excluding the expenses of the Dividend Growth, Dividend Value, Floating Rate Income, Growth Opportunities ETF, International Value, Small Cap Select and the Nuveen Real Property Fund LP and exclude the income of the Underlying Funds. Annualized for period less than one year. |
How did the Fund perform last year? What affected the Fund’s performance?
| Performance Highlights The Nuveen Lifecycle 2050 Fund returned 24.34% for Class I Shares at net asset value (NAV) for the 12 months ended May 31, 2026. The Fund underperformed the Lifecycle 2050 Fund Composite Index, which returned 27.86%. The Fund’s Composite Index consisted of: 58.0% Russell 3000® Index; 31.3% MSCI All Country World Index ex USA Investable Market Index; 8.6% Bloomberg U.S. Aggregate Bond Index; and 2.1% Bloomberg Global Aggregate ex-USD Index (Hedged). Top contributors to relative performance • Holding the Nuveen Quant International Small Cap Equity Fund. • An allocation to the Nuveen International Equity Fund. • A position in the Nuveen Growth Opportunities ETF. Top detractors from relative performance • A position in the Nuveen Dividend Growth Fund. • Holding the Nuveen International Opportunities Fund. • An allocation to the Nuveen Dividend Value Fund. |
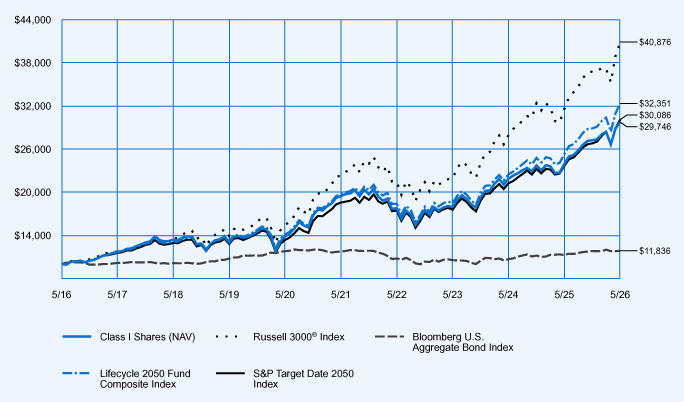
Average Annual Total Returns
| 1-Year | 5-Year | 10-Year | ||||||||||
| Class I Shares at NAV |
24.34 | % | 8.86 | % | 11.52 | % | ||||||
| Russell 3000® Index |
29.45 | % | 12.92 | % | 15.12 | % | ||||||
| Bloomberg U.S. Aggregate Bond Index |
5.13 | % | 0.17 | % | 1.70 | % | ||||||
| Lifecycle 2050 Fund Composite Index |
27.86 | % | 10.44 | % | 12.46 | % | ||||||
| S&P Target Date 2050 Index |
27.16 | % | 10.15 | % | 11.64 | % | ||||||
Fund Statistics (as of May 31, 2026)
| Fund net assets |
$ | 4,112,915,659 | ||
| Total number of portfolio holdings |
22 | |||
| Portfolio turnover (%) |
24% | |||
| Total management fees paid for the year |
$ | 15,614,924 | ||
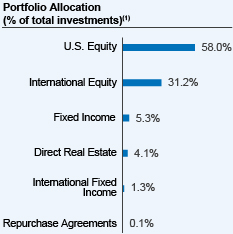 |
| (1) | Affiliated investment companies (Underlying Funds), except for repurchase agreements, where applicable. |
How has the Fund changed?
Portfolio manager update: Effective October 1, 2025, Jeff Sun, CFA was added as a portfolio manager of the Fund.
For more complete information, you may review the Fund’s next prospectus, which is expected to be available by October 1, 2026 at https://www.nuveen.com/en‑us/mutual‑funds/prospectuses or upon request at (800) 257‑8787.
For more complete information, you may review the Fund’s next prospectus, which is expected to be available by October 1, 2026 at https://www.nuveen.com/en‑us/mutual‑funds/prospectuses or upon request at (800) 257‑8787.
This report describes changes to the Fund that occurred during the reporting period.
What were the Fund costs for the last year? (based on a hypothetical $10,000 investment)
| Cost of a $10,000 investment | Costs paid as a percentage of $10,000 investment* | |||
| Premier Class Shares |
$41 | 0.37% | ||
| * | The Fund’s ratios include the expenses of the Underlying Funds, excluding the expenses of the Dividend Growth, Dividend Value, Floating Rate Income, Growth Opportunities ETF, International Value, Small Cap Select and the Nuveen Real Property Fund LP and exclude the income of the Underlying Funds. Annualized for period less than one year. |
How did the Fund perform last year? What affected the Fund’s performance?
| Performance Highlights The Nuveen Lifecycle 2050 Fund returned 24.15% for Premier Class Shares at net asset value (NAV) for the 12 months ended May 31, 2026. The Fund underperformed the Lifecycle 2050 Fund Composite Index, which returned 27.86%. The Fund’s Composite Index consisted of: 58.0% Russell 3000® Index; 31.3% MSCI All Country World Index ex USA Investable Market Index; 8.6% Bloomberg U.S. Aggregate Bond Index; and 2.1% Bloomberg Global Aggregate ex-USD Index (Hedged). Top contributors to relative performance • Holding the Nuveen Quant International Small Cap Equity Fund. • An allocation to the Nuveen International Equity Fund. • A position in the Nuveen Growth Opportunities ETF. Top detractors from relative performance • A position in the Nuveen Dividend Growth Fund. • Holding the Nuveen International Opportunities Fund. • An allocation to the Nuveen Dividend Value Fund. |
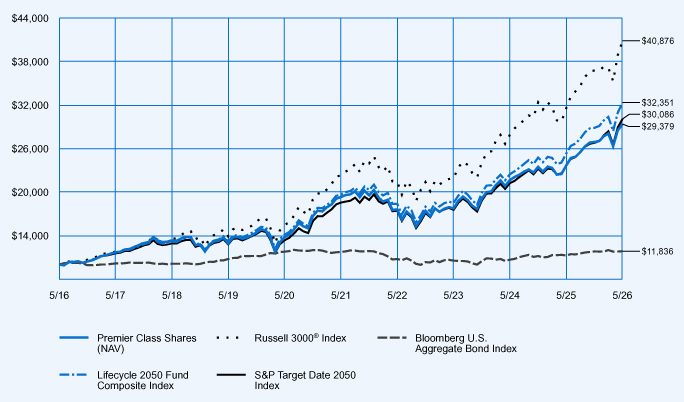
Average Annual Total Returns
| 1-Year | 5-Year | 10-Year | ||||||||||
| Premier Class Shares at NAV |
24.15 | % | 8.74 | % | 11.38 | % | ||||||
| Russell 3000® Index |
29.45 | % | 12.92 | % | 15.12 | % | ||||||
| Bloomberg U.S. Aggregate Bond Index |
5.13 | % | 0.17 | % | 1.70 | % | ||||||
| Lifecycle 2050 Fund Composite Index |
27.86 | % | 10.44 | % | 12.46 | % | ||||||
| S&P Target Date 2050 Index |
27.16 | % | 10.15 | % | 11.64 | % | ||||||
Fund Statistics (as of May 31, 2026)
| Fund net assets |
$ | 4,112,915,659 | ||
| Total number of portfolio holdings |
22 | |||
| Portfolio turnover (%) |
24% | |||
| Total management fees paid for the year |
$ | 15,614,924 | ||
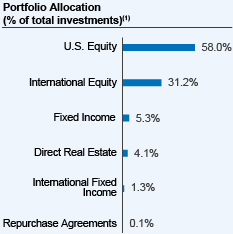 |
| (1) | Affiliated investment companies (Underlying Funds), except for repurchase agreements, where applicable. |
How has the Fund changed?
Portfolio manager update: Effective October 1, 2025, Jeff Sun, CFA was added as a portfolio manager of the Fund.
For more complete information, you may review the Fund’s next prospectus, which is expected to be available by October 1, 2026 at https://www.nuveen.com/en‑us/mutual‑funds/prospectuses or upon request at (800) 257‑8787.
For more complete information, you may review the Fund’s next prospectus, which is expected to be available by October 1, 2026 at https://www.nuveen.com/en‑us/mutual‑funds/prospectuses or upon request at (800) 257‑8787.
This report describes changes to the Fund that occurred during the reporting period.
What were the Fund costs for the last year? (based on a hypothetical $10,000 investment)
| Cost of a $10,000 investment | Costs paid as a percentage of $10,000 investment* | |||
| Class R6 Shares |
$25 | 0.22% | ||
| * | The Fund’s ratios include the expenses of the Underlying Funds, excluding the expenses of the Dividend Growth, Dividend Value, Floating Rate Income, Growth Opportunities ETF, International Value, Small Cap Select and the Nuveen Real Property Fund LP and exclude the income of the Underlying Funds. Annualized for period less than one year. |
How did the Fund perform last year? What affected the Fund’s performance?
| Performance Highlights The Nuveen Lifecycle 2050 Fund returned 24.29% for Class R6 Shares at net asset value (NAV) for the 12 months ended May 31, 2026. The Fund underperformed the Lifecycle 2050 Fund Composite Index, which returned 27.86%. The Fund’s Composite Index consisted of: 58.0% Russell 3000® Index; 31.3% MSCI All Country World Index ex USA Investable Market Index; 8.6% Bloomberg U.S. Aggregate Bond Index; and 2.1% Bloomberg Global Aggregate ex-USD Index (Hedged). Top contributors to relative performance • Holding the Nuveen Quant International Small Cap Equity Fund. • An allocation to the Nuveen International Equity Fund. • A position in the Nuveen Growth Opportunities ETF. Top detractors from relative performance • A position in the Nuveen Dividend Growth Fund. • Holding the Nuveen International Opportunities Fund. • An allocation to the Nuveen Dividend Value Fund. |
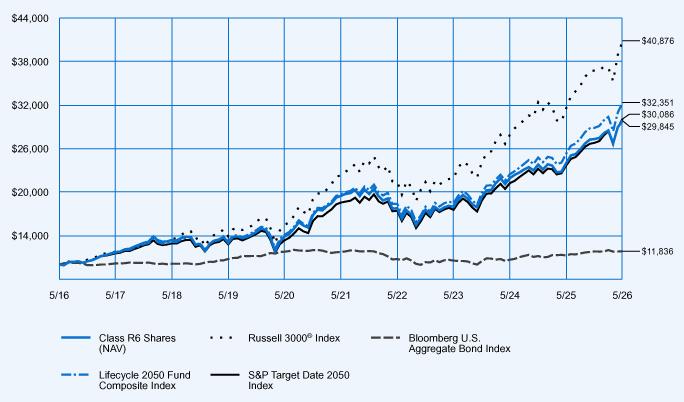
Average Annual Total Returns
| 1-Year | 5-Year | 10-Year | ||||||||||
| Class R6 Shares at NAV |
24.29 | % | 8.90 | % | 11.55 | % | ||||||
| Russell 3000® Index |
29.45 | % | 12.92 | % | 15.12 | % | ||||||
| Bloomberg U.S. Aggregate Bond Index |
5.13 | % | 0.17 | % | 1.70 | % | ||||||
| Lifecycle 2050 Fund Composite Index |
27.86 | % | 10.44 | % | 12.46 | % | ||||||
| S&P Target Date 2050 Index |
27.16 | % | 10.15 | % | 11.64 | % | ||||||
Fund Statistics (as of May 31, 2026)
| Fund net assets |
$ | 4,112,915,659 | ||
| Total number of portfolio holdings |
22 | |||
| Portfolio turnover (%) |
24% | |||
| Total management fees paid for the year |
$ | 15,614,924 | ||
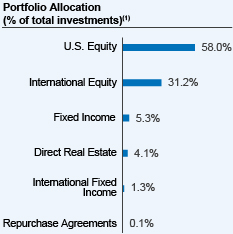 |
| (1) | Affiliated investment companies (Underlying Funds), except for repurchase agreements, where applicable. |
How has the Fund changed?
Portfolio manager update: Effective October 1, 2025, Jeff Sun, CFA was added as a portfolio manager of the Fund.
For more complete information, you may review the Fund’s next prospectus, which is expected to be available by October 1, 2026 at https://www.nuveen.com/en‑us/mutual‑funds/prospectuses or upon request at (800) 257‑8787.
For more complete information, you may review the Fund’s next prospectus, which is expected to be available by October 1, 2026 at https://www.nuveen.com/en‑us/mutual‑funds/prospectuses or upon request at (800) 257‑8787.
This report describes changes to the Fund that occurred during the reporting period.
What were the Fund costs for the last year? (based on a hypothetical $10,000 investment)
| Cost of a $10,000 investment | Costs paid as a percentage of $10,000 investment* | |||
| Retirement Class Shares |
$53 | 0.47% | ||
| * | The Fund’s ratios include the expenses of the Underlying Funds, excluding the expenses of the Dividend Growth, Dividend Value, Floating Rate Income, Growth Opportunities ETF, International Value, Small Cap Select and the Nuveen Real Property Fund LP and exclude the income of the Underlying Funds. Annualized for period less than one year. |
How did the Fund perform last year? What affected the Fund’s performance?
| Performance Highlights The Nuveen Lifecycle 2050 Fund returned 24.05% for Retirement Class Shares at net asset value (NAV) for the 12 months ended May 31, 2026. The Fund underperformed the Lifecycle 2050 Fund Composite Index, which returned 27.86%. The Fund’s Composite Index consisted of: 58.0% Russell 3000® Index; 31.3% MSCI All Country World Index ex USA Investable Market Index; 8.6% Bloomberg U.S. Aggregate Bond Index; and 2.1% Bloomberg Global Aggregate ex-USD Index (Hedged). Top contributors to relative performance • Holding the Nuveen Quant International Small Cap Equity Fund. • An allocation to the Nuveen International Equity Fund. • A position in the Nuveen Growth Opportunities ETF. Top detractors from relative performance • A position in the Nuveen Dividend Growth Fund. • Holding the Nuveen International Opportunities Fund. • An allocation to the Nuveen Dividend Value Fund. |
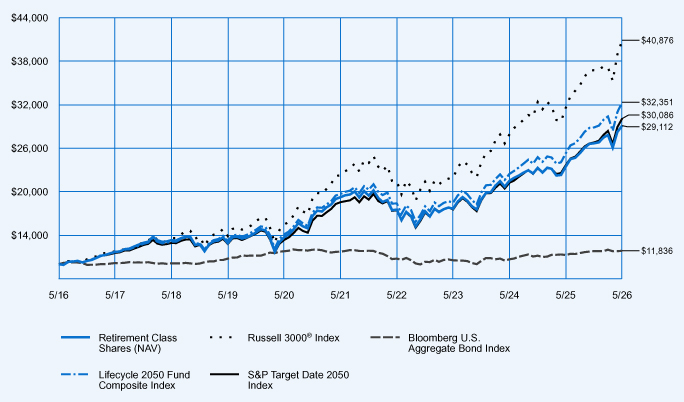
Average Annual Total Returns
| 1-Year | 5-Year | 10-Year | ||||||||||
| Retirement Class Shares at NAV |
24.05 | % | 8.64 | % | 11.28 | % | ||||||
| Russell 3000® Index |
29.45 | % | 12.92 | % | 15.12 | % | ||||||
| Bloomberg U.S. Aggregate Bond Index |
5.13 | % | 0.17 | % | 1.70 | % | ||||||
| Lifecycle 2050 Fund Composite Index |
27.86 | % | 10.44 | % | 12.46 | % | ||||||
| S&P Target Date 2050 Index |
27.16 | % | 10.15 | % | 11.64 | % | ||||||
Fund Statistics (as of May 31, 2026)
| Fund net assets |
$ | 4,112,915,659 | ||
| Total number of portfolio holdings |
22 | |||
| Portfolio turnover (%) |
24% | |||
| Total management fees paid for the year |
$ | 15,614,924 | ||
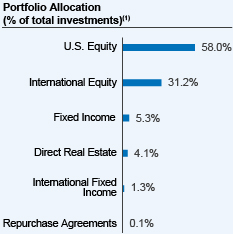 |
| (1) | Affiliated investment companies (Underlying Funds), except for repurchase agreements, where applicable. |
How has the Fund changed?
Portfolio manager update: Effective October 1, 2025, Jeff Sun, CFA was added as a portfolio manager of the Fund.
For more complete information, you may review the Fund’s next prospectus, which is expected to be available by October 1, 2026 at https://www.nuveen.com/en‑us/mutual‑funds/prospectuses or upon request at (800) 257‑8787.
For more complete information, you may review the Fund’s next prospectus, which is expected to be available by October 1, 2026 at https://www.nuveen.com/en‑us/mutual‑funds/prospectuses or upon request at (800) 257‑8787.
This report describes changes to the Fund that occurred during the reporting period.
What were the Fund costs for the last year? (based on a hypothetical $10,000 investment)
| Cost of a $10,000 investment | Costs paid as a percentage of $10,000 investment* | |||
| Retirement Class Shares |
$53 | 0.50% | ||
| * | The Fund’s ratios include the expenses of the Underlying Funds, excluding the expenses of the Dividend Growth, Dividend Value, Floating Rate Income, Growth Opportunities ETF, International Value, Small Cap Select and the Nuveen Real Property Fund LP and exclude the income of the Underlying Funds. Annualized for period less than one year. |
How did the Fund perform last year? What affected the Fund’s performance?
| Performance Highlights The Nuveen Lifecycle Retirement Income Fund returned 12.76% for Retirement Class Shares at net asset value (NAV) for the 12 months ended May 31, 2026. The Fund underperformed the Lifecycle Retirement Income Fund Composite Index, which returned 14.77%. The Fund’s Composite Index consisted of: 34.5% Bloomberg U.S. Aggregate Bond Index; 26.0% Russell 3000® Index; 14.0% MSCI All Country World Index ex USA Investable Market Index; 10.0% Bloomberg U.S. 1–3 Year Government/Credit Bond Index; 10.0% Bloomberg U.S. Treasury Inflation Protected Securities (TIPS) 1-10 Year Index; and 5.5% Bloomberg Global Aggregate ex-USD Index (Hedged). Top contributors to relative performance • Strong overall performance of the underlying funds investing in fixed income, led by the Nuveen Emerging Markets Debt Fund. • An allocation to the Nuveen Floating Rate Income Fund. • A position in the Nuveen Core Bond Fund. Top detractors from relative performance • A position in the Nuveen Real Property Fund LP. • Holding the Nuveen Dividend Growth Fund. • An allocation to the Nuveen International Opportunities Fund. |
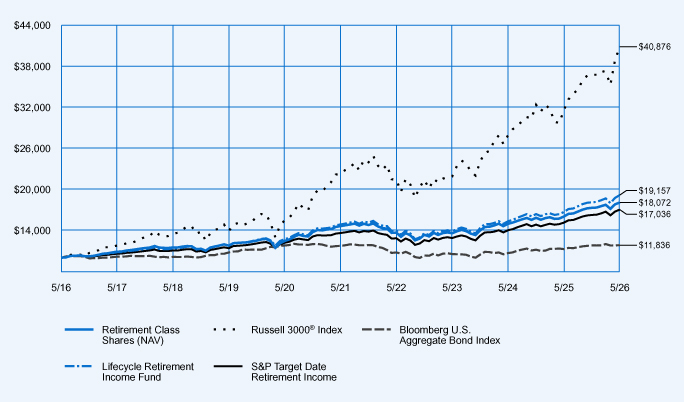
Average Annual Total Returns
| 1-Year | 5-Year | 10-Year | ||||||||||
| Retirement Class Shares at NAV |
12.76 | % | 4.33 | % | 6.10 | % | ||||||
| Russell 3000® Index |
29.45 | % | 12.92 | % | 15.12 | % | ||||||
| Bloomberg U.S. Aggregate Bond Index |
5.13 | % | 0.17 | % | 1.70 | % | ||||||
| Lifecycle Retirement Income Fund Composite Index |
14.77 | % | 5.22 | % | 6.72 | % | ||||||
| S&P Target Date Retirement Income Index |
12.59 | % | 4.59 | % | 5.47 | % | ||||||
Fund Statistics (as of May 31, 2026)
| Fund net assets |
$ | 395,536,057 | ||
| Total number of portfolio holdings |
24 | |||
| Portfolio turnover (%) |
29% | |||
| Total management fees paid for the year |
$ | 1,553,159 | ||
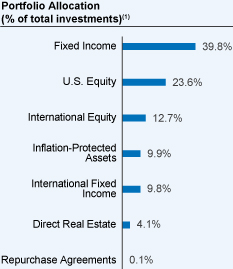 |
| (1) | Affiliated investment companies (Underlying Funds), except for repurchase agreements, where applicable. |
How has the Fund changed?
Portfolio manager update: Effective October 1, 2025, Jeff Sun, CFA was added as a portfolio manager of the Fund.
For more complete information, you may review the Fund’s next prospectus, which is expected to be available by October 1, 2026 at https://www.nuveen.com/en‑us/mutual‑funds/prospectuses or upon request at (800) 257‑8787.
For more complete information, you may review the Fund’s next prospectus, which is expected to be available by October 1, 2026 at https://www.nuveen.com/en‑us/mutual‑funds/prospectuses or upon request at (800) 257‑8787.
This report describes changes to the Fund that occurred during the reporting period.
What were the Fund costs for the last year? (based on a hypothetical $10,000 investment)
| Cost of a $10,000 investment | Costs paid as a percentage of $10,000 investment* | |||
| Class R6 Shares |
$27 | 0.25% | ||
| * | The Fund’s ratios include the expenses of the Underlying Funds, excluding the expenses of the Dividend Growth, Dividend Value, Floating Rate Income, Growth Opportunities ETF, International Value, Small Cap Select and the Nuveen Real Property Fund LP and exclude the income of the Underlying Funds. Annualized for period less than one year. |
How did the Fund perform last year? What affected the Fund’s performance?
| Performance Highlights The Nuveen Lifecycle Retirement Income Fund returned 13.10% for Class R6 Shares at net asset value (NAV) for the 12 months ended May 31, 2026. The Fund underperformed the Lifecycle Retirement Income Fund Composite Index, which returned 14.77%. The Fund’s Composite Index consisted of: 34.5% Bloomberg U.S. Aggregate Bond Index; 26.0% Russell 3000® Index; 14.0% MSCI All Country World Index ex USA Investable Market Index; 10.0% Bloomberg U.S. 1–3 Year Government/Credit Bond Index; 10.0% Bloomberg U.S. Treasury Inflation Protected Securities (TIPS) 1-10 Year Index; and 5.5% Bloomberg Global Aggregate ex-USD Index (Hedged). Top contributors to relative performance • Strong overall performance of the underlying funds investing in fixed income, led by the Nuveen Emerging Markets Debt Fund. • An allocation to the Nuveen Floating Rate Income Fund. • A position in the Nuveen Core Bond Fund. Top detractors from relative performance • A position in the Nuveen Real Property Fund LP. • Holding the Nuveen Dividend Growth Fund. • An allocation to the Nuveen International Opportunities Fund. |
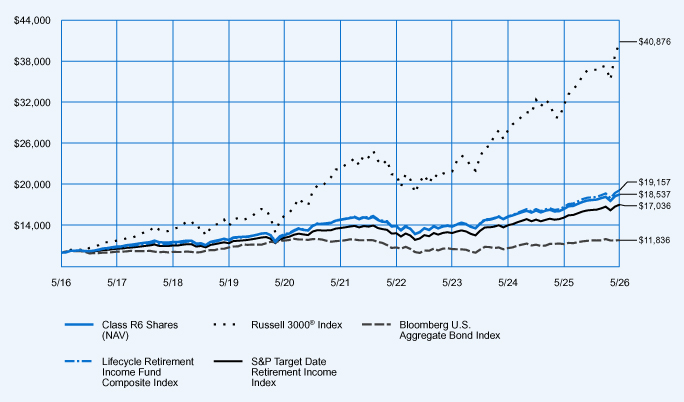
Average Annual Total Returns
| 1-Year | 5-Year | 10-Year | ||||||||||
| Class R6 Shares at NAV |
13.10 | % | 4.60 | % | 6.37 | % | ||||||
| Russell 3000® Index |
29.45 | % | 12.92 | % | 15.12 | % | ||||||
| Bloomberg U.S. Aggregate Bond Index |
5.13 | % | 0.17 | % | 1.70 | % | ||||||
| Lifecycle Retirement Income Fund Composite Index |
14.77 | % | 5.22 | % | 6.72 | % | ||||||
| S&P Target Date Retirement Income Index |
12.59 | % | 4.59 | % | 5.47 | % | ||||||
Fund Statistics (as of May 31, 2026)
| Fund net assets |
$ | 395,536,057 | ||
| Total number of portfolio holdings |
24 | |||
| Portfolio turnover (%) |
29% | |||
| Total management fees paid for the year |
$ | 1,553,159 | ||
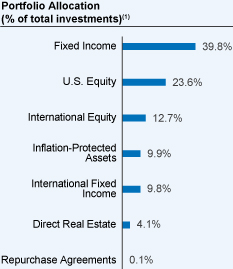 |
| (1) | Affiliated investment companies (Underlying Funds), except for repurchase agreements, where applicable. |
How has the Fund changed?
Portfolio manager update: Effective October 1, 2025, Jeff Sun, CFA was added as a portfolio manager of the Fund.
For more complete information, you may review the Fund’s next prospectus, which is expected to be available by October 1, 2026 at https://www.nuveen.com/en‑us/mutual‑funds/prospectuses or upon request at (800) 257‑8787.
For more complete information, you may review the Fund’s next prospectus, which is expected to be available by October 1, 2026 at https://www.nuveen.com/en‑us/mutual‑funds/prospectuses or upon request at (800) 257‑8787.
This report describes changes to the Fund that occurred during the reporting period.
What were the Fund costs for the last year? (based on a hypothetical $10,000 investment)
| Cost of a $10,000 investment | Costs paid as a percentage of $10,000 investment* | |||
| Premier Class Shares |
$43 | 0.40% | ||
| * | The Fund’s ratios include the expenses of the Underlying Funds, excluding the expenses of the Dividend Growth, Dividend Value, Floating Rate Income, Growth Opportunities ETF, International Value, Small Cap Select and the Nuveen Real Property Fund LP and exclude the income of the Underlying Funds. Annualized for period less than one year. |
How did the Fund perform last year? What affected the Fund’s performance?
| Performance Highlights The Nuveen Lifecycle Retirement Income Fund returned 12.93% for Premier Class Shares at net asset value (NAV) for the 12 months ended May 31, 2026. The Fund underperformed the Lifecycle Retirement Income Fund Composite Index, which returned 14.77%. The Fund’s Composite Index consisted of: 34.5% Bloomberg U.S. Aggregate Bond Index; 26.0% Russell 3000® Index; 14.0% MSCI All Country World Index ex USA Investable Market Index; 10.0% Bloomberg U.S. 1–3 Year Government/Credit Bond Index; 10.0% Bloomberg U.S. Treasury Inflation Protected Securities (TIPS) 1-10 Year Index; and 5.5% Bloomberg Global Aggregate ex-USD Index (Hedged). Top contributors to relative performance • Strong overall performance of the underlying funds investing in fixed income, led by the Nuveen Emerging Markets Debt Fund. • An allocation to the Nuveen Floating Rate Income Fund. • A position in the Nuveen Core Bond Fund. Top detractors from relative performance • A position in the Nuveen Real Property Fund LP. • Holding the Nuveen Dividend Growth Fund. • An allocation to the Nuveen International Opportunities Fund. |
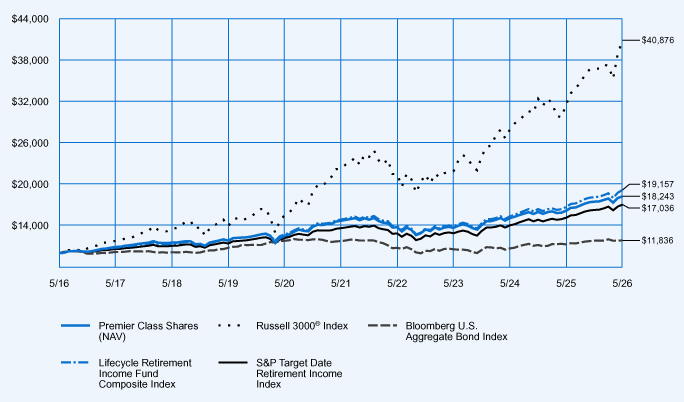
Average Annual Total Returns
| 1-Year | 5-Year | 10-Year | ||||||||||
| Premier Class Shares at NAV |
12.93 | % | 4.44 | % | 6.20 | % | ||||||
| Russell 3000® Index |
29.45 | % | 12.92 | % | 15.12 | % | ||||||
| Bloomberg U.S. Aggregate Bond Index |
5.13 | % | 0.17 | % | 1.70 | % | ||||||
| Lifecycle Retirement Income Fund Composite Index |
14.77 | % | 5.22 | % | 6.72 | % | ||||||
| S&P Target Date Retirement Income Index |
12.59 | % | 4.59 | % | 5.47 | % | ||||||
Fund Statistics (as of May 31, 2026)
| Fund net assets |
$ | 395,536,057 | ||
| Total number of portfolio holdings |
24 | |||
| Portfolio turnover (%) |
29% | |||
| Total management fees paid for the year |
$ | 1,553,159 | ||
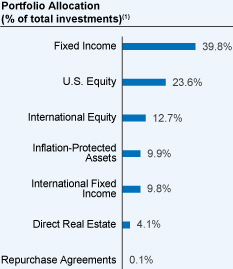 |
| (1) | Affiliated investment companies (Underlying Funds), except for repurchase agreements, where applicable. |
How has the Fund changed?
Portfolio manager update: Effective October 1, 2025, Jeff Sun, CFA was added as a portfolio manager of the Fund.
For more complete information, you may review the Fund’s next prospectus, which is expected to be available by October 1, 2026 at https://www.nuveen.com/en‑us/mutual‑funds/prospectuses or upon request at (800) 257‑8787.
For more complete information, you may review the Fund’s next prospectus, which is expected to be available by October 1, 2026 at https://www.nuveen.com/en‑us/mutual‑funds/prospectuses or upon request at (800) 257‑8787.
This report describes changes to the Fund that occurred during the reporting period.
What were the Fund costs for the last year? (based on a hypothetical $10,000 investment)
| Cost of a $10,000 investment | Costs paid as a percentage of $10,000 investment* | |||
| Class I Shares |
$34 | 0.32% | ||
| * | The Fund’s ratios include the expenses of the Underlying Funds, excluding the expenses of the Dividend Growth, Dividend Value, Floating Rate Income, Growth Opportunities ETF, International Value, Small Cap Select and the Nuveen Real Property Fund LP and exclude the income of the Underlying Funds. Annualized for period less than one year. |
How did the Fund perform last year? What affected the Fund’s performance?
| Performance Highlights The Nuveen Lifecycle Retirement Income Fund returned 13.02% for Class I Shares at net asset value (NAV) for the 12 months ended May 31, 2026. The Fund underperformed the Lifecycle Retirement Income Fund Composite Index, which returned 14.77%. The Fund’s Composite Index consisted of: 34.5% Bloomberg U.S. Aggregate Bond Index; 26.0% Russell 3000® Index; 14.0% MSCI All Country World Index ex USA Investable Market Index; 10.0% Bloomberg U.S. 1–3 Year Government/Credit Bond Index; 10.0% Bloomberg U.S. Treasury Inflation Protected Securities (TIPS) 1-10 Year Index; and 5.5% Bloomberg Global Aggregate ex-USD Index (Hedged). Top contributors to relative performance • Strong overall performance of the underlying funds investing in fixed income, led by the Nuveen Emerging Markets Debt Fund. • An allocation to the Nuveen Floating Rate Income Fund. • A position in the Nuveen Core Bond Fund. Top detractors from relative performance • A position in the Nuveen Real Property Fund LP. • Holding the Nuveen Dividend Growth Fund. • An allocation to the Nuveen International Opportunities Fund. |
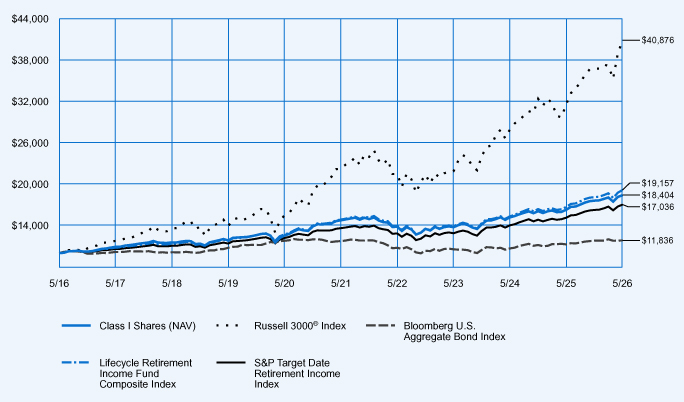
Average Annual Total Returns
| 1-Year | 5-Year | 10-Year | ||||||||||
| Class I Shares at NAV |
13.02 | % | 4.52 | % | 6.29 | % | ||||||
| Russell 3000® Index |
29.45 | % | 12.92 | % | 15.12 | % | ||||||
| Bloomberg U.S. Aggregate Bond Index |
5.13 | % | 0.17 | % | 1.70 | % | ||||||
| Lifecycle Retirement Income Fund Composite Index |
14.77 | % | 5.22 | % | 6.72 | % | ||||||
| S&P Target Date Retirement Income Index |
12.59 | % | 4.59 | % | 5.47 | % | ||||||
Fund Statistics (as of May 31, 2026)
| Fund net assets |
$ | 395,536,057 | ||
| Total number of portfolio holdings |
24 | |||
| Portfolio turnover (%) |
29% | |||
| Total management fees paid for the year |
$ | 1,553,159 | ||
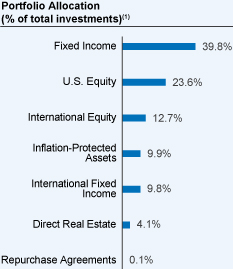 |
| (1) | Affiliated investment companies (Underlying Funds), except for repurchase agreements, where applicable. |
How has the Fund changed?
Portfolio manager update: Effective October 1, 2025, Jeff Sun, CFA was added as a portfolio manager of the Fund.
For more complete information, you may review the Fund’s next prospectus, which is expected to be available by October 1, 2026 at https://www.nuveen.com/en‑us/mutual‑funds/prospectuses or upon request at (800) 257‑8787.
For more complete information, you may review the Fund’s next prospectus, which is expected to be available by October 1, 2026 at https://www.nuveen.com/en‑us/mutual‑funds/prospectuses or upon request at (800) 257‑8787.
This report describes changes to the Fund that occurred during the reporting period.
What were the Fund costs for the last year? (based on a hypothetical $10,000 investment)
| Cost of a $10,000 investment | Costs paid as a percentage of $10,000 investment* | |||
| Class A Shares |
$53 | 0.50% | ||
| * | The Fund’s ratios include the expenses of the Underlying Funds, excluding the expenses of the Dividend Growth, Dividend Value, Floating Rate Income, Growth Opportunities ETF, International Value, Small Cap Select and the Nuveen Real Property Fund LP and exclude the income of the Underlying Funds. Annualized for period less than one year. |
How did the Fund perform last year? What affected the Fund’s performance?
| Performance Highlights The Nuveen Lifecycle Retirement Income Fund returned 12.84% for Class A Shares at net asset value (NAV) for the 12 months ended May 31, 2026. The Fund underperformed the Lifecycle Retirement Income Fund Composite Index, which returned 14.77%. The Fund’s Composite Index consisted of: 34.5% Bloomberg U.S. Aggregate Bond Index; 26.0% Russell 3000® Index; 14.0% MSCI All Country World Index ex USA Investable Market Index; 10.0% Bloomberg U.S. 1–3 Year Government/Credit Bond Index; 10.0% Bloomberg U.S. Treasury Inflation Protected Securities (TIPS) 1-10 Year Index; and 5.5% Bloomberg Global Aggregate ex-USD Index (Hedged). Top contributors to relative performance • Strong overall performance of the underlying funds investing in fixed income, led by the Nuveen Emerging Markets Debt Fund. • An allocation to the Nuveen Floating Rate Income Fund. • A position in the Nuveen Core Bond Fund. Top detractors from relative performance • A position in the Nuveen Real Property Fund LP. • Holding the Nuveen Dividend Growth Fund. • An allocation to the Nuveen International Opportunities Fund. |
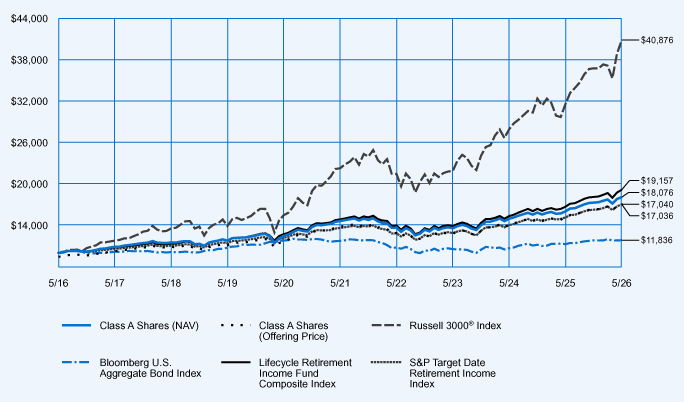
Average Annual Total Returns
| 1-Year | 5-Year | 10-Year | ||||||||||
| Class A Shares at NAV (excluding maximum sales charge) |
12.84 | % | 4.34 | % | 6.10 | % | ||||||
| Class A Shares at maximum sales charge (Offering Price) |
6.37 | % | 3.12 | % | 5.47 | % | ||||||
| Russell 3000® Index |
29.45 | % | 12.92 | % | 15.12 | % | ||||||
| Bloomberg U.S. Aggregate Bond Index |
5.13 | % | 0.17 | % | 1.70 | % | ||||||
| Lifecycle Retirement Income Fund Composite Index |
14.77 | % | 5.22 | % | 6.72 | % | ||||||
| S&P Target Date Retirement Income Index |
12.59 | % | 4.59 | % | 5.47 | % | ||||||
Fund Statistics (as of May 31, 2026)
| Fund net assets |
$ | 395,536,057 | ||
| Total number of portfolio holdings |
24 | |||
| Portfolio turnover (%) |
29% | |||
| Total management fees paid for the year |
$ | 1,553,159 | ||
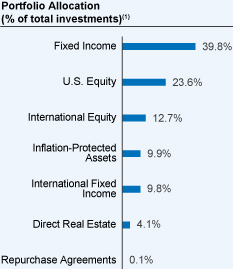 |
| (1) | Affiliated investment companies (Underlying Funds), except for repurchase agreements, where applicable. |
How has the Fund changed?
Portfolio manager update: Effective October 1, 2025, Jeff Sun, CFA was added as a portfolio manager of the Fund.
For more complete information, you may review the Fund’s next prospectus, which is expected to be available by October 1, 2026 at https://www.nuveen.com/en‑us/mutual‑funds/prospectuses or upon request at (800) 257‑8787.
For more complete information, you may review the Fund’s next prospectus, which is expected to be available by October 1, 2026 at https://www.nuveen.com/en‑us/mutual‑funds/prospectuses or upon request at (800) 257‑8787.
This report describes changes to the Fund that occurred during the reporting period.
What were the Fund costs for the last year? (based on a hypothetical $10,000 investment)
| Cost of a $10,000 investment |
Costs paid as a percentage of $10,000 investment* | |||
| Class I Shares |
$13 | 0.12% | ||
| * | The Fund’s ratios exclude the expenses of Underlying Funds that are exchange-traded funds, include the expenses of all other Underlying Funds, and exclude the income of all Underlying Funds. Annualized for a period less than one year. |
How did the Fund perform last year? What affected the Fund’s performance?
| Performance Highlights The Nuveen Lifecycle Index 2010 Fund returned 13.36% for Class I Shares at net asset value (NAV) for the 12 months ended May 31, 2026. The Fund performed in line with the Lifecycle Index 2010 Fund Composite Index, which returned 13.48%. The Fund’s Composite Index consisted of: 27.6% Bloomberg U.S. Aggregate Bond Index; 22.2% Russell 3000® Index; 15.9% Bloomberg U.S. 1‑3 Year Government/Credit Bond Index; 11.9% MSCI EAFE + Emerging Markets Index; 10.0% Bloomberg U.S. Treasury Inflation Protected Securities (TIPS) 1‑10 Year Index; 6.9% Bloomberg Global Aggregate ex‑USD Index (Hedged); and 5.5% ICE BofA BB‑B U.S. Cash Pay High Yield Constrained Index. Top contributors to absolute performance • Underlying equity and fixed income funds advanced for the period. U.S. and international equity funds recorded double-digit gains and contributed most. Top detractors from absolute performance • Management fees and other expenses incurred by the Fund. |
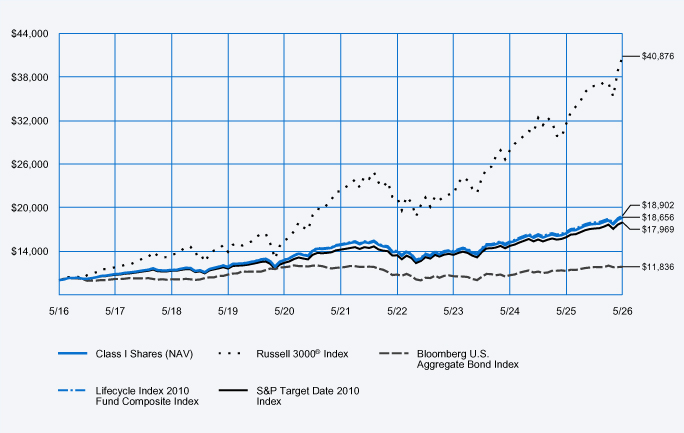
Average Annual Total Returns
| 1-Year | 5-Year | 10-Year | ||||||||||
| Class I Shares at NAV |
13.36 | % | 4.68 | % | 6.43 | % | ||||||
| Russell 3000® Index |
29.45 | % | 12.92 | % | 15.12 | % | ||||||
| Bloomberg U.S. Aggregate Bond Index |
5.13 | % | 0.17 | % | 1.70 | % | ||||||
| Lifecycle Index 2010 Fund Composite Index |
13.48 | % | 4.80 | % | 6.57 | % | ||||||
| S&P Target Date 2010 Index |
12.87 | % | 4.81 | % | 6.04 | % | ||||||
Fund Statistics (as of May 31, 2026)
| Fund net assets |
$ | 684,525,256 | ||
| Total number of portfolio holdings |
9 | |||
| Portfolio turnover (%) |
32% | |||
| Total management fees paid for the year |
$ | 1,111,638 | ||
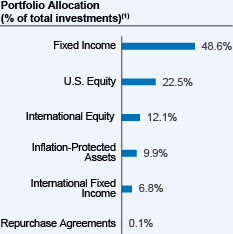 |
| (1) | Affiliated investment companies (Underlying Funds), except for repurchase agreements, where applicable. |
How has the Fund changed?
Portfolio manager update: Effective October 1, 2025, Jeff Sun, CFA was added as a portfolio manager of the Fund.
For more complete information, you may review the Fund’s next prospectus, which is expected to be available by October 1, 2026 at https://www.nuveen.com/en‑us/mutual‑funds/prospectuses or upon request at (800) 257‑8787.
For more complete information, you may review the Fund’s next prospectus, which is expected to be available by October 1, 2026 at https://www.nuveen.com/en‑us/mutual‑funds/prospectuses or upon request at (800) 257‑8787.
This report describes changes to the Fund that occurred during the reporting period.
What were the Fund costs for the last year? (based on a hypothetical $10,000 investment)
| Cost of a $10,000 investment | Costs paid as a percentage of $10,000 investment* | |||
| Premier Class Shares |
$26 | 0.24% | ||
| * | The Fund’s ratios exclude the expenses of Underlying Funds that are exchange-traded funds, include the expenses of all other Underlying Funds, and exclude the income of all Underlying Funds. Annualized for a period less than one year. |
How did the Fund perform last year? What affected the Fund’s performance?
| Performance Highlights The Nuveen Lifecycle Index 2010 Fund returned 13.16% for Premier Class Shares at net asset value (NAV) for the 12 months ended May 31, 2026. The Fund underperformed the Lifecycle Index 2010 Fund Composite Index, which returned 13.48%. The Fund’s Composite Index consisted of: 27.6% Bloomberg U.S. Aggregate Bond Index; 22.2% Russell 3000® Index; 15.9% Bloomberg U.S. 1‑3 Year Government/Credit Bond Index; 11.9% MSCI EAFE + Emerging Markets Index; 10.0% Bloomberg U.S. Treasury Inflation Protected Securities (TIPS) 1‑10 Year Index; 6.9% Bloomberg Global Aggregate ex‑USD Index (Hedged); and 5.5% ICE BofA BB‑B U.S. Cash Pay High Yield Constrained Index. Top contributors to absolute performance • Underlying equity and fixed income funds advanced for the period. U.S. and international equity funds recorded double-digit gains and contributed most. Top detractors from absolute performance • Management fees and other expenses incurred by the Fund. |
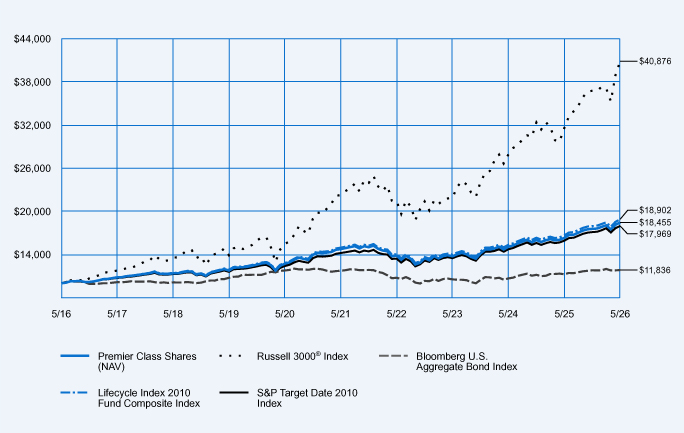
Average Annual Total Returns
| 1-Year | 5-Year | 10-Year | ||||||||||
| Premier Class Shares at NAV |
13.16 | % | 4.58 | % | 6.32 | % | ||||||
| Russell 3000® Index |
29.45 | % | 12.92 | % | 15.12 | % | ||||||
| Bloomberg U.S. Aggregate Bond Index |
5.13 | % | 0.17 | % | 1.70 | % | ||||||
| Lifecycle Index 2010 Fund Composite Index |
13.48 | % | 4.80 | % | 6.57 | % | ||||||
| S&P Target Date 2010 Index |
12.87 | % | 4.81 | % | 6.04 | % | ||||||
Fund Statistics (as of May 31, 2026)
| Fund net assets |
$ | 684,525,256 | ||
| Total number of portfolio holdings |
9 | |||
| Portfolio turnover (%) |
32% | |||
| Total management fees paid for the year |
$ | 1,111,638 | ||
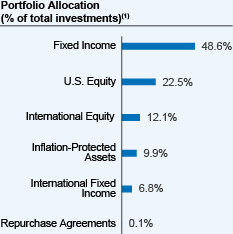 |
| (1) | Affiliated investment companies (Underlying Funds), except for repurchase agreements, where applicable. |
How has the Fund changed?
Portfolio manager update: Effective October 1, 2025, Jeff Sun, CFA was added as a portfolio manager of the Fund.
For more complete information, you may review the Fund’s next prospectus, which is expected to be available by October 1, 2026 at https://www.nuveen.com/en‑us/mutual‑funds/prospectuses or upon request at (800) 257‑8787.
For more complete information, you may review the Fund’s next prospectus, which is expected to be available by October 1, 2026 at https://www.nuveen.com/en‑us/mutual‑funds/prospectuses or upon request at (800) 257‑8787.
This report describes changes to the Fund that occurred during the reporting period.
What were the Fund costs for the last year? (based on a hypothetical $10,000 investment)
| Cost of a $10,000 investment | Costs paid as a percentage of $10,000 investment* | |||
| Class R6 Shares |
$10 | 0.09% | ||
| * | The Fund’s ratios exclude the expenses of Underlying Funds that are exchange-traded funds, include the expenses of all other Underlying Funds, and exclude the income of all Underlying Funds. Annualized for a period less than one year. |
How did the Fund perform last year? What affected the Fund’s performance?
| Performance Highlights The Nuveen Lifecycle Index 2010 Fund returned 13.34% for Class R6 Shares at net asset value (NAV) for the 12 months ended May 31, 2026. The Fund performed in line with the Lifecycle Index 2010 Fund Composite Index, which returned 13.48%. The Fund’s Composite Index consisted of: 27.6% Bloomberg U.S. Aggregate Bond Index; 22.2% Russell 3000® Index; 15.9% Bloomberg U.S. 1‑3 Year Government/Credit Bond Index; 11.9% MSCI EAFE + Emerging Markets Index; 10.0% Bloomberg U.S. Treasury Inflation Protected Securities (TIPS) 1‑10 Year Index; 6.9% Bloomberg Global Aggregate ex‑USD Index (Hedged); and 5.5% ICE BofA BB‑B U.S. Cash Pay High Yield Constrained Index. Top contributors to absolute performance • Underlying equity and fixed income funds advanced for the period. U.S. and international equity funds recorded double-digit gains and contributed most. Top detractors from absolute performance • Management fees and other expenses incurred by the Fund. |
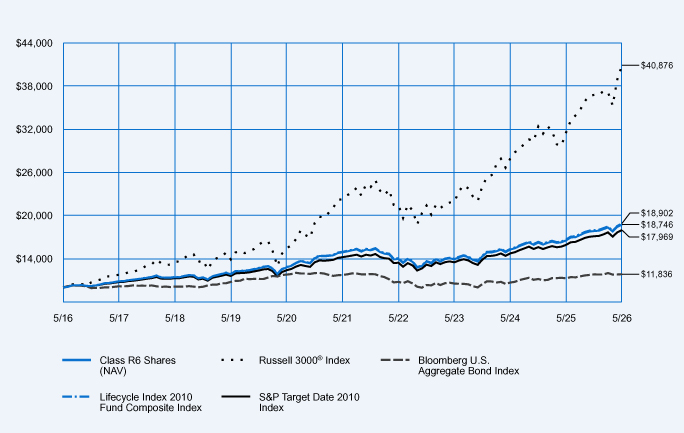
Average Annual Total Returns
| 1-Year | 5-Year | 10-Year | ||||||||||
| Class R6 Shares at NAV |
13.34 | % | 4.74 | % | 6.49 | % | ||||||
| Russell 3000® Index |
29.45 | % | 12.92 | % | 15.12 | % | ||||||
| Bloomberg U.S. Aggregate Bond Index |
5.13 | % | 0.17 | % | 1.70 | % | ||||||
| Lifecycle Index 2010 Fund Composite Index |
13.48 | % | 4.80 | % | 6.57 | % | ||||||
| S&P Target Date 2010 Index |
12.87 | % | 4.81 | % | 6.04 | % | ||||||
Fund Statistics (as of May 31, 2026)
| Fund net assets |
$ | 684,525,256 | ||
| Total number of portfolio holdings |
9 | |||
| Portfolio turnover (%) |
32% | |||
| Total management fees paid for the year |
$ | 1,111,638 | ||
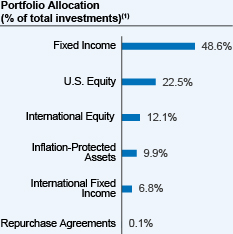 |
| (1) | Affiliated investment companies (Underlying Funds), except for repurchase agreements, where applicable. |
How has the Fund changed?
Portfolio manager update: Effective October 1, 2025, Jeff Sun, CFA was added as a portfolio manager of the Fund.
For more complete information, you may review the Fund’s next prospectus, which is expected to be available by October 1, 2026 at https://www.nuveen.com/en‑us/mutual‑funds/prospectuses or upon request at (800) 257‑8787.
For more complete information, you may review the Fund’s next prospectus, which is expected to be available by October 1, 2026 at https://www.nuveen.com/en‑us/mutual‑funds/prospectuses or upon request at (800) 257‑8787.
This report describes changes to the Fund that occurred during the reporting period.
What were the Fund costs for the last year? (based on a hypothetical $10,000 investment)
| Cost of a $10,000 investment | Costs paid as a percentage of $10,000 investment* | |||
| Retirement Class Shares |
$36 | 0.34% | ||
| * | The Fund’s ratios exclude the expenses of Underlying Funds that are exchange-traded funds, include the expenses of all other Underlying Funds, and exclude the income of all Underlying Funds. Annualized for a period less than one year. |
How did the Fund perform last year? What affected the Fund’s performance?
| Performance Highlights The Nuveen Lifecycle Index 2010 Fund returned 13.10% for Retirement Class Shares at net asset value (NAV) for the 12 months ended May 31, 2026. The Fund underperformed the Lifecycle Index 2010 Fund Composite Index, which returned 13.48%. The Fund’s Composite Index consisted of: 27.6% Bloomberg U.S. Aggregate Bond Index; 22.2% Russell 3000® Index; 15.9% Bloomberg U.S. 1‑3 Year Government/Credit Bond Index; 11.9% MSCI EAFE + Emerging Markets Index; 10.0% Bloomberg U.S. Treasury Inflation Protected Securities (TIPS) 1‑10 Year Index; 6.9% Bloomberg Global Aggregate ex‑USD Index (Hedged); and 5.5% ICE BofA BB‑B U.S. Cash Pay High Yield Constrained Index. Top contributors to absolute performance • Underlying equity and fixed income funds advanced for the period. U.S. and international equity funds recorded double-digit gains and contributed most. Top detractors from absolute performance • Management fees and other expenses incurred by the Fund. |
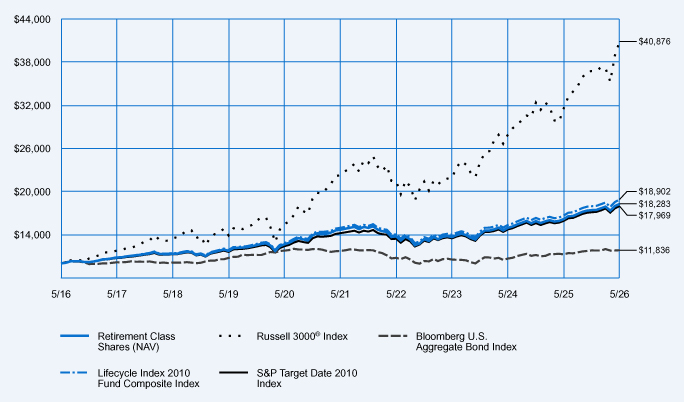
Average Annual Total Returns
| 1-Year | 5-Year | 10-Year | ||||||||||
| Retirement Class Shares at NAV |
13.10 | % | 4.48 | % | 6.22 | % | ||||||
| Russell 3000® Index |
29.45 | % | 12.92 | % | 15.12 | % | ||||||
| Bloomberg U.S. Aggregate Bond Index |
5.13 | % | 0.17 | % | 1.70 | % | ||||||
| Lifecycle Index 2010 Fund Composite Index |
13.48 | % | 4.80 | % | 6.57 | % | ||||||
| S&P Target Date 2010 Index |
12.87 | % | 4.81 | % | 6.04 | % | ||||||
Fund Statistics (as of May 31, 2026)
| Fund net assets |
$ | 684,525,256 | ||
| Total number of portfolio holdings |
9 | |||
| Portfolio turnover (%) |
32% | |||
| Total management fees paid for the year |
$ | 1,111,638 | ||
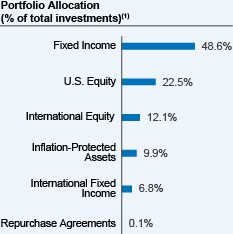 |
| (1) | Affiliated investment companies (Underlying Funds), except for repurchase agreements, where applicable. |
How has the Fund changed?
Portfolio manager update: Effective October 1, 2025, Jeff Sun, CFA was added as a portfolio manager of the Fund.
For more complete information, you may review the Fund’s next prospectus, which is expected to be available by October 1, 2026 at https://www.nuveen.com/en‑us/mutual‑funds/prospectuses or upon request at (800) 257‑8787.
For more complete information, you may review the Fund’s next prospectus, which is expected to be available by October 1, 2026 at https://www.nuveen.com/en‑us/mutual‑funds/prospectuses or upon request at (800) 257‑8787.
This report describes changes to the Fund that occurred during the reporting period.
What were the Fund costs for the last year? (based on a hypothetical $10,000 investment)
| Cost of a $10,000 investment | Costs paid as a percentage of $10,000 investment* | |||
| Retirement Class Shares |
$36 | 0.34% | ||
| * | The Fund’s ratios exclude the expenses of Underlying Funds that are exchange-traded funds, include the expenses of all other Underlying Funds, and exclude the income of all Underlying Funds. Annualized for a period less than one year. |
How did the Fund perform last year? What affected the Fund’s performance?
| Performance Highlights The Nuveen Lifecycle Index Retirement Income Fund returned 14.54% for Retirement Class Shares at net asset value (NAV) for the 12 months ended May 31, 2026. The Fund underperformed the Lifecycle Index Retirement Income Fund Composite Index, which returned 14.92%. The Fund’s Composite Index consisted of: 27.6% Bloomberg U.S. Aggregate Bond Index; 26.0% Russell 3000® Index; 14.0% MSCI EAFE + Emerging Markets Index; 10.0% Bloomberg U.S. 1–3 Year Government/Credit Bond Index; 10.0% Bloomberg U.S. Treasury Inflation Protected Securities (TIPS) 1‑10 Year Index; 6.9% Bloomberg Global Aggregate ex‑USD Index (Hedged); and 5.5% ICE BofA BB‑B U.S. Cash Pay High Yield Constrained Index. Top contributors to absolute performance • Underlying equity and fixed income funds advanced for the period. U.S. and international equity funds recorded double-digit gains and contributed most. Top detractors from absolute performance • Management fees and other expenses incurred by the Fund. |
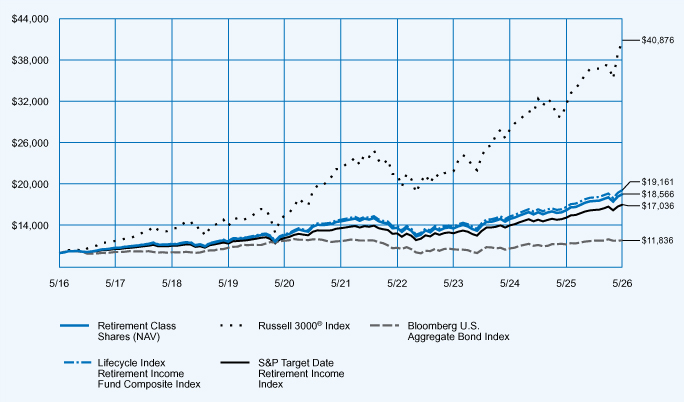
Average Annual Total Returns
| 1-Year | 5-Year | 10-Year | ||||||||||
| Retirement Class Shares at NAV |
14.54 | % | 4.92 | % | 6.38 | % | ||||||
| Russell 3000® Index |
29.45 | % | 12.92 | % | 15.12 | % | ||||||
| Bloomberg U.S. Aggregate Bond Index |
5.13 | % | 0.17 | % | 1.70 | % | ||||||
| Lifecycle Index Retirement Income Fund Composite Index |
14.92 | % | 5.24 | % | 6.72 | % | ||||||
| S&P Target Date Retirement Income Index |
12.59 | % | 4.59 | % | 5.47 | % | ||||||
Fund Statistics (as of May 31, 2026)
| Fund net assets |
$ | 839,069,791 | ||
| Total number of portfolio holdings |
9 | |||
| Portfolio turnover (%) |
36% | |||
| Total management fees paid for the year |
$ | 1,381,176 | ||
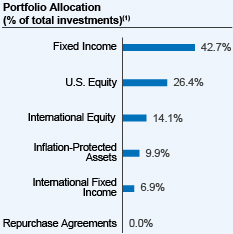 |
| (1) | Affiliated investment companies (Underlying Funds), except for repurchase agreements, where applicable. |
How has the Fund changed?
Portfolio manager update: Effective October 1, 2025, Jeff Sun, CFA was added as a portfolio manager of the Fund.
For more complete information, you may review the Fund’s next prospectus, which is expected to be available by October 1, 2026 at https://www.nuveen.com/en‑us/mutual‑funds/prospectuses or upon request at (800) 257‑8787.
For more complete information, you may review the Fund’s next prospectus, which is expected to be available by October 1, 2026 at https://www.nuveen.com/en‑us/mutual‑funds/prospectuses or upon request at (800) 257‑8787.
This report describes changes to the Fund that occurred during the reporting period.
What were the Fund costs for the last year? (based on a hypothetical $10,000 investment)
| Cost of a $10,000 investment | Costs paid as a percentage of $10,000 investment* | |||
| Class R6 Shares |
$10 | 0.09% | ||
| * | The Fund’s ratios exclude the expenses of Underlying Funds that are exchange-traded funds, include the expenses of all other Underlying Funds, and exclude the income of all Underlying Funds. Annualized for a period less than one year. |
How did the Fund perform last year? What affected the Fund’s performance?
| Performance Highlights The Nuveen Lifecycle Index Retirement Income Fund returned 14.79% for Class R6 Shares at net asset value (NAV) for the 12 months ended May 31, 2026. The Fund performed in line with the Lifecycle Index Retirement Income Fund Composite Index, which returned 14.92%. The Fund’s Composite Index consisted of: 27.6% Bloomberg U.S. Aggregate Bond Index; 26.0% Russell 3000® Index; 14.0% MSCI EAFE + Emerging Markets Index; 10.0% Bloomberg U.S. 1–3 Year Government/Credit Bond Index; 10.0% Bloomberg U.S. Treasury Inflation Protected Securities (TIPS) 1‑10 Year Index; 6.9% Bloomberg Global Aggregate ex‑USD Index (Hedged); and 5.5% ICE BofA BB‑B U.S. Cash Pay High Yield Constrained Index. Top contributors to absolute performance • Underlying equity and fixed income funds advanced for the period. U.S. and international equity funds recorded double-digit gains and contributed most. Top detractors from absolute performance • Management fees and other expenses incurred by the Fund. |
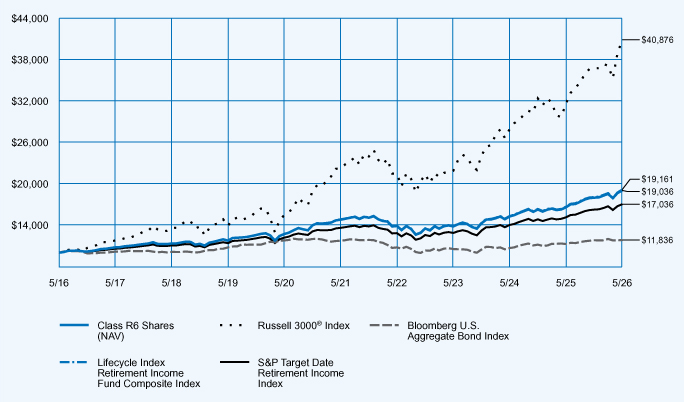
Average Annual Total Returns
| 1-Year | 5-Year | 10-Year | ||||||||||
| Class R6 Shares at NAV |
14.79 | % | 5.18 | % | 6.65 | % | ||||||
| Russell 3000® Index |
29.45 | % | 12.92 | % | 15.12 | % | ||||||
| Bloomberg U.S. Aggregate Bond Index |
5.13 | % | 0.17 | % | 1.70 | % | ||||||
| Lifecycle Index Retirement Income Fund Composite Index |
14.92 | % | 5.24 | % | 6.72 | % | ||||||
| S&P Target Date Retirement Income Index |
12.59 | % | 4.59 | % | 5.47 | % | ||||||
Fund Statistics (as of May 31, 2026)
| Fund net assets |
$ | 839,069,791 | ||
| Total number of portfolio holdings |
9 | |||
| Portfolio turnover (%) |
36% | |||
| Total management fees paid for the year |
$ | 1,381,176 | ||
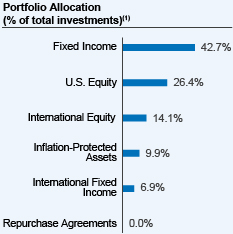 |
| (1) | Affiliated investment companies (Underlying Funds), except for repurchase agreements, where applicable. |
How has the Fund changed?
Portfolio manager update: Effective October 1, 2025, Jeff Sun, CFA was added as a portfolio manager of the Fund.
For more complete information, you may review the Fund’s next prospectus, which is expected to be available by October 1, 2026 at https://www.nuveen.com/en‑us/mutual‑funds/prospectuses or upon request at (800) 257‑8787.
For more complete information, you may review the Fund’s next prospectus, which is expected to be available by October 1, 2026 at https://www.nuveen.com/en‑us/mutual‑funds/prospectuses or upon request at (800) 257‑8787.
This report describes changes to the Fund that occurred during the reporting period.
What were the Fund costs for the last year? (based on a hypothetical $10,000 investment)
| Cost of a $10,000 investment | Costs paid as a percentage of $10,000 investment* | |||
| Premier Class Shares |
$26 | 0.24% | ||
| * | The Fund’s ratios exclude the expenses of Underlying Funds that are exchange-traded funds, include the expenses of all other Underlying Funds, and exclude the income of all Underlying Funds. Annualized for a period less than one year. |
How did the Fund perform last year? What affected the Fund’s performance?
| Performance Highlights The Nuveen Lifecycle Index Retirement Income Fund returned 14.63% for Premier Class Shares at net asset value (NAV) for the 12 months ended May 31, 2026. The Fund underperformed the Lifecycle Index Retirement Income Fund Composite Index, which returned 14.92%. The Fund’s Composite Index consisted of: 27.6% Bloomberg U.S. Aggregate Bond Index; 26.0% Russell 3000® Index; 14.0% MSCI EAFE + Emerging Markets Index; 10.0% Bloomberg U.S. 1–3 Year Government/Credit Bond Index; 10.0% Bloomberg U.S. Treasury Inflation Protected Securities (TIPS) 1‑10 Year Index; 6.9% Bloomberg Global Aggregate ex‑USD Index (Hedged); and 5.5% ICE BofA BB‑B U.S. Cash Pay High Yield Constrained Index. Top contributors to absolute performance • Underlying equity and fixed income funds advanced for the period. U.S. and international equity funds recorded double-digit gains and contributed most. Top detractors from absolute performance • Management fees and other expenses incurred by the Fund. |
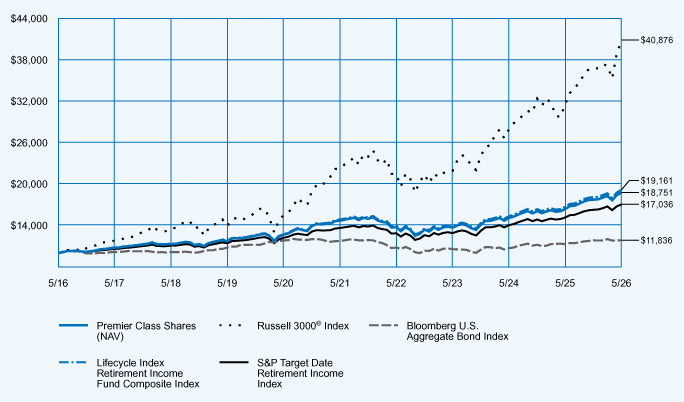
Average Annual Total Returns
| 1-Year | 5-Year | 10-Year | ||||||||||
| Premier Class Shares at NAV |
14.63 | % | 5.02 | % | 6.49 | % | ||||||
| Russell 3000® Index |
29.45 | % | 12.92 | % | 15.12 | % | ||||||
| Bloomberg U.S. Aggregate Bond Index |
5.13 | % | 0.17 | % | 1.70 | % | ||||||
| Lifecycle Index Retirement Income Fund Composite Index |
14.92 | % | 5.24 | % | 6.72 | % | ||||||
| S&P Target Date Retirement Income Index |
12.59 | % | 4.59 | % | 5.47 | % | ||||||
Fund Statistics (as of May 31, 2026)
| Fund net assets |
$ | 839,069,791 | ||
| Total number of portfolio holdings |
9 | |||
| Portfolio turnover (%) |
36% | |||
| Total management fees paid for the year |
$ | 1,381,176 | ||
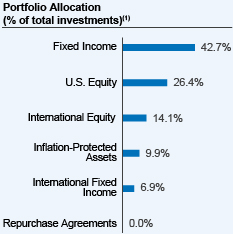 |
| (1) | Affiliated investment companies (Underlying Funds), except for repurchase agreements, where applicable. |
How has the Fund changed?
Portfolio manager update: Effective October 1, 2025, Jeff Sun, CFA was added as a portfolio manager of the Fund.
For more complete information, you may review the Fund’s next prospectus, which is expected to be available by October 1, 2026 at https://www.nuveen.com/en‑us/mutual‑funds/prospectuses or upon request at (800) 257‑8787.
For more complete information, you may review the Fund’s next prospectus, which is expected to be available by October 1, 2026 at https://www.nuveen.com/en‑us/mutual‑funds/prospectuses or upon request at (800) 257‑8787.
This report describes changes to the Fund that occurred during the reporting period.
What were the Fund costs for the last year? (based on a hypothetical $10,000 investment)
| Cost of a $10,000 investment | Costs paid as a percentage of $10,000 investment* | |||
| Class I Shares |
$16 | 0.15% | ||
| * | The Fund’s ratios exclude the expenses of Underlying Funds that are exchange-traded funds, include the expenses of all other Underlying Funds, and exclude the income of all Underlying Funds. Annualized for a period less than one year. |
How did the Fund perform last year? What affected the Fund’s performance?
| Performance Highlights The Nuveen Lifecycle Index Retirement Income Fund returned 14.78% for Class I Shares at net asset value (NAV) for the 12 months ended May 31, 2026. The Fund performed in line with the Lifecycle Index Retirement Income Fund Composite Index, which returned 14.92%. The Fund’s Composite Index consisted of: 27.6% Bloomberg U.S. Aggregate Bond Index; 26.0% Russell 3000® Index; 14.0% MSCI EAFE + Emerging Markets Index; 10.0% Bloomberg U.S. 1–3 Year Government/Credit Bond Index; 10.0% Bloomberg U.S. Treasury Inflation Protected Securities (TIPS) 1‑10 Year Index; 6.9% Bloomberg Global Aggregate ex‑USD Index (Hedged); and 5.5% ICE BofA BB‑B U.S. Cash Pay High Yield Constrained Index. Top contributors to absolute performance • Underlying equity and fixed income funds advanced for the period. U.S. and international equity funds recorded double-digit gains and contributed most. Top detractors from absolute performance • Management fees and other expenses incurred by the Fund. |
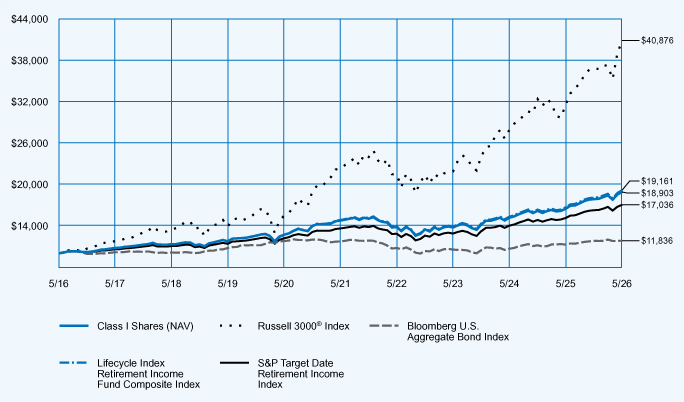
Average Annual Total Returns
| 1-Year | 5-Year | 10-Year | ||||||||||
| Class I Shares at NAV |
14.78 | % | 5.09 | % | 6.57 | % | ||||||
| Russell 3000® Index |
29.45 | % | 12.92 | % | 15.12 | % | ||||||
| Bloomberg U.S. Aggregate Bond Index |
5.13 | % | 0.17 | % | 1.70 | % | ||||||
| Lifecycle Index Retirement Income Fund Composite Index |
14.92 | % | 5.24 | % | 6.72 | % | ||||||
| S&P Target Date Retirement Income Index |
12.59 | % | 4.59 | % | 5.47 | % | ||||||
Fund Statistics (as of May 31, 2026)
| Fund net assets |
$ | 839,069,791 | ||
| Total number of portfolio holdings |
9 | |||
| Portfolio turnover (%) |
36% | |||
| Total management fees paid for the year |
$ | 1,381,176 | ||
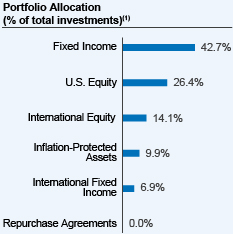 |
| (1) | Affiliated investment companies (Underlying Funds), except for repurchase agreements, where applicable. |
How has the Fund changed?
Portfolio manager update: Effective October 1, 2025, Jeff Sun, CFA was added as a portfolio manager of the Fund.
For more complete information, you may review the Fund’s next prospectus, which is expected to be available by October 1, 2026 at https://www.nuveen.com/en‑us/mutual‑funds/prospectuses or upon request at (800) 257‑8787.
For more complete information, you may review the Fund’s next prospectus, which is expected to be available by October 1, 2026 at https://www.nuveen.com/en‑us/mutual‑funds/prospectuses or upon request at (800) 257‑8787.
This report describes changes to the Fund that occurred during the reporting period.
What were the Fund costs for the last year? (based on a hypothetical $10,000 investment)
| Cost of a $10,000 investment | Costs paid as a percentage of $10,000 investment* | |||
| Class I Shares |
$13 | 0.12% | ||
| * | The Fund’s ratios exclude the expenses of Underlying Funds that are exchange-traded funds, include the expenses of all other Underlying Funds, and exclude the income of all Underlying Funds. Annualized for a period less than one year. |
How did the Fund perform last year? What affected the Fund’s performance?
| Performance Highlights The Nuveen Lifecycle Index 2015 Fund returned 14.64% for Class I Shares at net asset value (NAV) for the 12 months ended May 31, 2026. The Fund performed in line with the Lifecycle Index 2015 Fund Composite Index, which returned 14.81%. The Fund’s Composite Index consisted of: 27.6% Bloomberg U.S. Aggregate Bond Index; 25.4% Russell 3000® Index; 13.7% MSCI EAFE + Emerging Markets Index; 10.9% Bloomberg U.S. 1‑3 Year Government/Credit Bond Index; 10.0% Bloomberg U.S. Treasury Inflation Protected Securities (TIPS) 1‑10 Year Index; 6.9% Bloomberg Global Aggregate ex‑USD Index (Hedged); and 5.5% ICE BofA BB‑B U.S. Cash Pay High Yield Constrained Index. Top contributors to absolute performance • Underlying equity and fixed income funds advanced for the period. U.S. and international equity funds recorded double-digit gains and contributed most. Top detractors from absolute performance • Management fees and other expenses incurred by the Fund. |
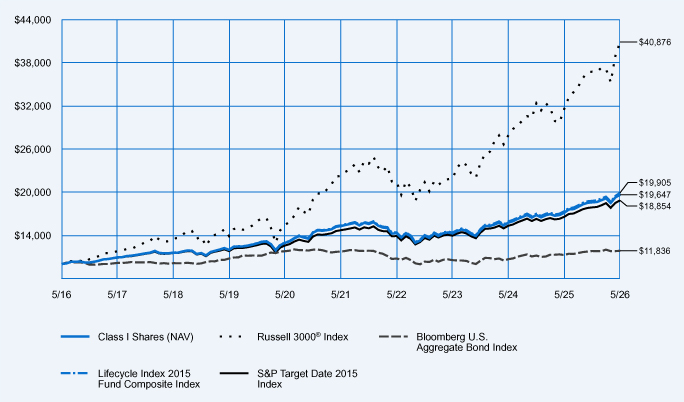
Average Annual Total Returns
| 1-Year | 5-Year | 10-Year | ||||||||||
| Class I Shares at NAV |
14.64 | % | 5.16 | % | 6.99 | % | ||||||
| Russell 3000® Index |
29.45 | % | 12.92 | % | 15.12 | % | ||||||
| Bloomberg U.S. Aggregate Bond Index |
5.13 | % | 0.17 | % | 1.70 | % | ||||||
| Lifecycle Index 2015 Fund Composite Index |
14.81 | % | 5.28 | % | 7.13 | % | ||||||
| S&P Target Date 2015 Index |
13.81 | % | 5.10 | % | 6.55 | % | ||||||
Fund Statistics (as of May 31, 2026)
| Fund net assets |
$ | 963,398,159 | ||
| Total number of portfolio holdings |
9 | |||
| Portfolio turnover (%) |
25% | |||
| Total management fees paid for the year |
$ | 1,647,670 | ||
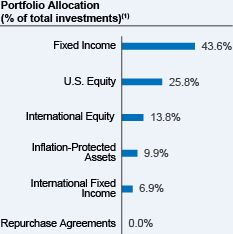 |
| (1) | Affiliated investment companies (Underlying Funds), except for repurchase agreements, where applicable. |
How has the Fund changed?
Portfolio manager update: Effective October 1, 2025, Jeff Sun, CFA was added as a portfolio manager of the Fund.
For more complete information, you may review the Fund’s next prospectus, which is expected to be available by October 1, 2026 at https://www.nuveen.com/en‑us/mutual‑funds/prospectuses or upon request at (800) 257‑8787.
For more complete information, you may review the Fund’s next prospectus, which is expected to be available by October 1, 2026 at https://www.nuveen.com/en‑us/mutual‑funds/prospectuses or upon request at (800) 257‑8787.
This report describes changes to the Fund that occurred during the reporting period.
What were the Fund costs for the last year? (based on a hypothetical $10,000 investment)
| Cost of a $10,000 investment | Costs paid as a percentage of $10,000 investment* | |||
| Premier Class Shares |
$27 | 0.25% | ||
| * | The Fund’s ratios exclude the expenses of Underlying Funds that are exchange-traded funds, include the expenses of all other Underlying Funds, and exclude the income of all Underlying Funds. Annualized for a period less than one year. |
How did the Fund perform last year? What affected the Fund’s performance?
| Performance Highlights The Nuveen Lifecycle Index 2015 Fund returned 14.54% for Premier Class Shares at net asset value (NAV) for the 12 months ended May 31, 2026. The Fund underperformed the Lifecycle Index 2015 Fund Composite Index, which returned 14.81%. The Fund’s Composite Index consisted of: 27.6% Bloomberg U.S. Aggregate Bond Index; 25.4% Russell 3000® Index; 13.7% MSCI EAFE + Emerging Markets Index; 10.9% Bloomberg U.S. 1‑3 Year Government/Credit Bond Index; 10.0% Bloomberg U.S. Treasury Inflation Protected Securities (TIPS) 1‑10 Year Index; 6.9% Bloomberg Global Aggregate ex‑USD Index (Hedged); and 5.5% ICE BofA BB‑B U.S. Cash Pay High Yield Constrained Index. Top contributors to absolute performance • Underlying equity and fixed income funds advanced for the period. U.S. and international equity funds recorded double-digit gains and contributed most. Top detractors from absolute performance • Management fees and other expenses incurred by the Fund. |
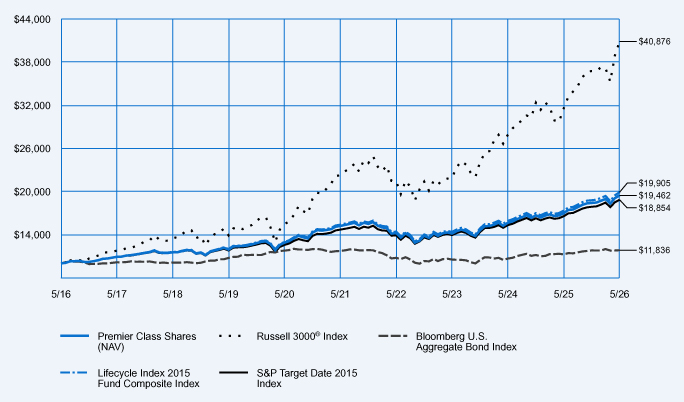
Average Annual Total Returns
| 1-Year | 5-Year | 10-Year | ||||||||||
| Premier Class Shares at NAV |
14.54 | % | 5.06 | % | 6.89 | % | ||||||
| Russell 3000® Index |
29.45 | % | 12.92 | % | 15.12 | % | ||||||
| Bloomberg U.S. Aggregate Bond Index |
5.13 | % | 0.17 | % | 1.70 | % | ||||||
| Lifecycle Index 2015 Fund Composite Index |
14.81 | % | 5.28 | % | 7.13 | % | ||||||
| S&P Target Date 2015 Index |
13.81 | % | 5.10 | % | 6.55 | % | ||||||
Fund Statistics (as of May 31, 2026)
| Fund net assets |
$ | 963,398,159 | ||
| Total number of portfolio holdings |
9 | |||
| Portfolio turnover (%) |
25% | |||
| Total management fees paid for the year |
$ | 1,647,670 | ||
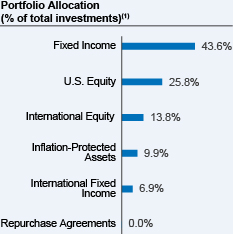 |
| (1) | Affiliated investment companies (Underlying Funds), except for repurchase agreements, where applicable. |
How has the Fund changed?
Portfolio manager update: Effective October 1, 2025, Jeff Sun, CFA was added as a portfolio manager of the Fund.
For more complete information, you may review the Fund’s next prospectus, which is expected to be available by October 1, 2026 at https://www.nuveen.com/en‑us/mutual‑funds/prospectuses or upon request at (800) 257‑8787.
For more complete information, you may review the Fund’s next prospectus, which is expected to be available by October 1, 2026 at https://www.nuveen.com/en‑us/mutual‑funds/prospectuses or upon request at (800) 257‑8787.
This report describes changes to the Fund that occurred during the reporting period.
What were the Fund costs for the last year? (based on a hypothetical $10,000 investment)
| Cost of a $10,000 investment | Costs paid as a percentage of $10,000 investment* | |||
| Class R6 Shares |
$11 | 0.10% | ||
| * | The Fund’s ratios exclude the expenses of Underlying Funds that are exchange-traded funds, include the expenses of all other Underlying Funds, and exclude the income of all Underlying Funds. Annualized for a period less than one year. |
How did the Fund perform last year? What affected the Fund’s performance?
| Performance Highlights The Nuveen Lifecycle Index 2015 Fund returned 14.69% for Class R6 Shares at net asset value (NAV) for the 12 months ended May 31, 2026. The Fund performed in line with the Lifecycle Index 2015 Fund Composite Index, which returned 14.81%. The Fund’s Composite Index consisted of: 27.6% Bloomberg U.S. Aggregate Bond Index; 25.4% Russell 3000® Index; 13.7% MSCI EAFE + Emerging Markets Index; 10.9% Bloomberg U.S. 1‑3 Year Government/Credit Bond Index; 10.0% Bloomberg U.S. Treasury Inflation Protected Securities (TIPS) 1‑10 Year Index; 6.9% Bloomberg Global Aggregate ex‑USD Index (Hedged); and 5.5% ICE BofA BB‑B U.S. Cash Pay High Yield Constrained Index. Top contributors to absolute performance • Underlying equity and fixed income funds advanced for the period. U.S. and international equity funds recorded double-digit gains and contributed most. Top detractors from absolute performance • Management fees and other expenses incurred by the Fund. |
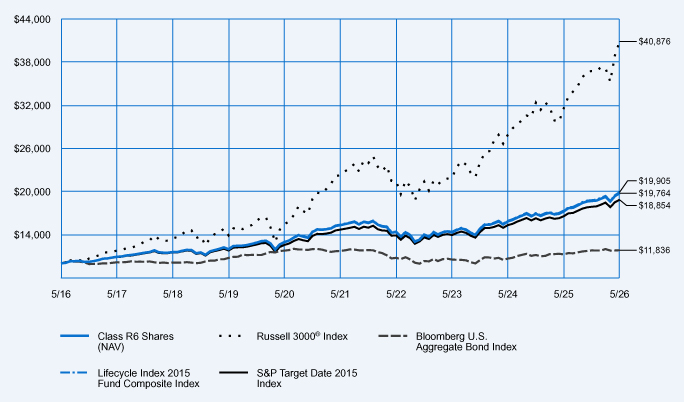
Average Annual Total Returns
| 1-Year | 5-Year | 10-Year | ||||||||||
| Class R6 Shares at NAV |
14.69 | % | 5.23 | % | 7.05 | % | ||||||
| Russell 3000® Index |
29.45 | % | 12.92 | % | 15.12 | % | ||||||
| Bloomberg U.S. Aggregate Bond Index |
5.13 | % | 0.17 | % | 1.70 | % | ||||||
| Lifecycle Index 2015 Fund Composite Index |
14.81 | % | 5.28 | % | 7.13 | % | ||||||
| S&P Target Date 2015 Index |
13.81 | % | 5.10 | % | 6.55 | % | ||||||
Fund Statistics (as of May 31, 2026)
| Fund net assets |
$ | 963,398,159 | ||
| Total number of portfolio holdings |
9 | |||
| Portfolio turnover (%) |
25% | |||
| Total management fees paid for the year |
$ | 1,647,670 | ||
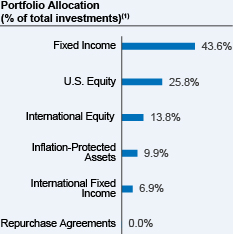 |
| (1) | Affiliated investment companies (Underlying Funds), except for repurchase agreements, where applicable. |
How has the Fund changed?
Portfolio manager update: Effective October 1, 2025, Jeff Sun, CFA was added as a portfolio manager of the Fund.
For more complete information, you may review the Fund’s next prospectus, which is expected to be available by October 1, 2026 at https://www.nuveen.com/en‑us/mutual‑funds/prospectuses or upon request at (800) 257‑8787.
For more complete information, you may review the Fund’s next prospectus, which is expected to be available by October 1, 2026 at https://www.nuveen.com/en‑us/mutual‑funds/prospectuses or upon request at (800) 257‑8787.
This report describes changes to the Fund that occurred during the reporting period.
What were the Fund costs for the last year? (based on a hypothetical $10,000 investment)
| Cost of a $10,000 investment | Costs paid as a percentage of $10,000 investment* | |||
| Retirement Class Shares |
$38 | 0.35% | ||
| * | The Fund’s ratios exclude the expenses of Underlying Funds that are exchange-traded funds, include the expenses of all other Underlying Funds, and exclude the income of all Underlying Funds. Annualized for a period less than one year. |
How did the Fund perform last year? What affected the Fund’s performance?
| Performance Highlights The Nuveen Lifecycle Index 2015 Fund returned 14.41% for Retirement Class Shares at net asset value (NAV) for the 12 months ended May 31, 2026. The Fund underperformed the Lifecycle Index 2015 Fund Composite Index, which returned 14.81%. The Fund’s Composite Index consisted of: 27.6% Bloomberg U.S. Aggregate Bond Index; 25.4% Russell 3000® Index; 13.7% MSCI EAFE + Emerging Markets Index; 10.9% Bloomberg U.S. 1–3 Year Government/Credit Bond Index; 10.0% Bloomberg U.S. Treasury Inflation Protected Securities (TIPS) 1‑10 Year Index; 6.9% Bloomberg Global Aggregate ex‑USD Index (Hedged); and 5.5% ICE BofA BB‑B U.S. Cash Pay High Yield Constrained Index. Top contributors to absolute performance • Underlying equity and fixed income funds advanced for the period. U.S. and international equity funds recorded double-digit gains and contributed most. Top detractors from absolute performance • Management fees and other expenses incurred by the Fund. |
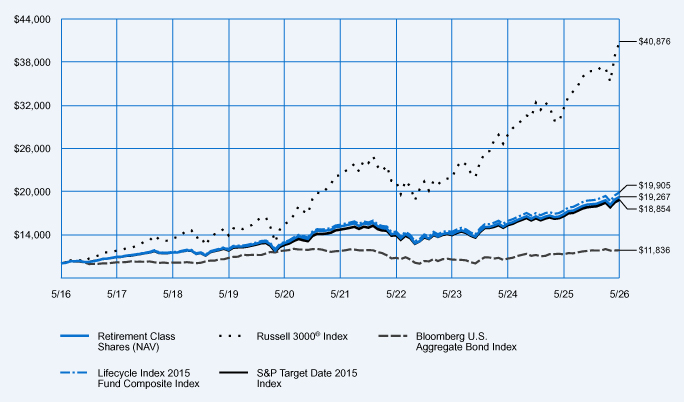
Average Annual Total Returns
| 1-Year | 5-Year | 10-Year | ||||||||||
| Retirement Class Shares at NAV |
14.41 | % | 4.96 | % | 6.78 | % | ||||||
| Russell 3000® Index |
29.45 | % | 12.92 | % | 15.12 | % | ||||||
| Bloomberg U.S. Aggregate Bond Index |
5.13 | % | 0.17 | % | 1.70 | % | ||||||
| Lifecycle Index 2015 Fund Composite Index |
14.81 | % | 5.28 | % | 7.13 | % | ||||||
| S&P Target Date 2015 Index |
13.81 | % | 5.10 | % | 6.55 | % | ||||||
Fund Statistics (as of May 31, 2026)
| Fund net assets |
$ | 963,398,159 | ||
| Total number of portfolio holdings |
9 | |||
| Portfolio turnover (%) |
25% | |||
| Total management fees paid for the year |
$ | 1,647,670 | ||
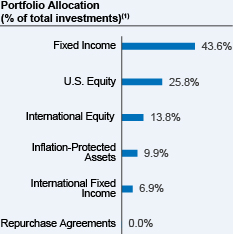 |
| (1) | Affiliated investment companies (Underlying Funds), except for repurchase agreements, where applicable. |
How has the Fund changed?
Portfolio manager update: Effective October 1, 2025, Jeff Sun, CFA was added as a portfolio manager of the Fund.
For more complete information, you may review the Fund’s next prospectus, which is expected to be available by October 1, 2026 at https://www.nuveen.com/en‑us/mutual‑funds/prospectuses or upon request at (800) 257‑8787.
For more complete information, you may review the Fund’s next prospectus, which is expected to be available by October 1, 2026 at https://www.nuveen.com/en‑us/mutual‑funds/prospectuses or upon request at (800) 257‑8787.
This report describes changes to the Fund that occurred during the reporting period.
What were the Fund costs for the last year? (based on a hypothetical $10,000 investment)
| Cost of a $10,000 investment | Costs paid as a percentage of $10,000 investment* | |||
| Retirement Class Shares |
$38 | 0.35% | ||
| * | The Fund’s ratios exclude the expenses of Underlying Funds that are exchange-traded funds, include the expenses of all other Underlying Funds, and exclude the income of all Underlying Funds. Annualized for a period less than one year. |
How did the Fund perform last year? What affected the Fund’s performance?
| Performance Highlights The Nuveen Lifecycle Index 2020 Fund returned 15.68% for Retirement Class Shares at net asset value (NAV) for the 12 months ended May 31, 2026. The Fund underperformed the Lifecycle Index 2020 Fund Composite Index, which returned 16.10%. The Fund’s Composite Index consisted of: 28.6% Russell 3000® Index; 27.5% Bloomberg U.S. Aggregate Bond Index; 15.4% MSCI EAFE + Emerging Markets Index; 8.4% Bloomberg U.S. 1-3 Year Government/Credit Bond Index; 8.4% Bloomberg U.S. Treasury Inflation Protected Securities (TIPS) 1‑10 Year Index; 6.9% Bloomberg Global Aggregate ex‑USD Index (Hedged); and 4.8% ICE BofA BB‑B U.S. Cash Pay High Yield Constrained Index. Top contributors to absolute performance • Underlying equity and fixed income funds advanced for the period. U.S. and international equity funds recorded double-digit gains and contributed most. Top detractors from absolute performance • Management fees and other expenses incurred by the Fund. |
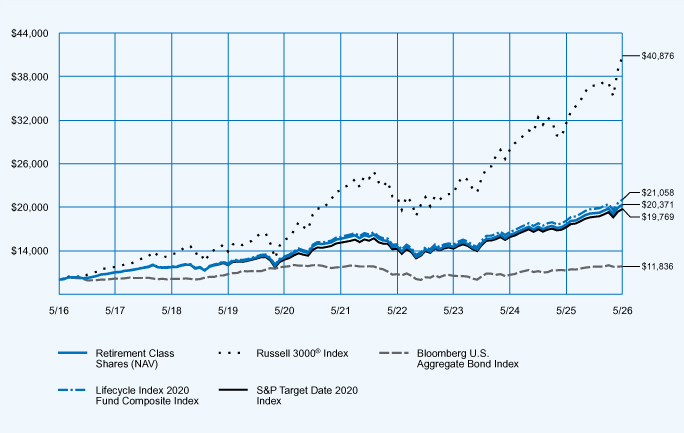
Average Annual Total Returns
| 1-Year | 5-Year | 10-Year | ||||||||||
| Retirement Class Shares at NAV |
15.68 | % | 5.43 | % | 7.37 | % | ||||||
| Russell 3000® Index |
29.45 | % | 12.92 | % | 15.12 | % | ||||||
| Bloomberg U.S. Aggregate Bond Index |
5.13 | % | 0.17 | % | 1.70 | % | ||||||
| Lifecycle Index 2020 Fund Composite Index |
16.10 | % | 5.76 | % | 7.73 | % | ||||||
| S&P Target Date 2020 Index |
14.70 | % | 5.52 | % | 7.05 | % | ||||||
Fund Statistics (as of May 31, 2026)
| Fund net assets |
$ | 2,841,102,933 | ||
| Total number of portfolio holdings |
9 | |||
| Portfolio turnover (%) |
23% | |||
| Total management fees paid for the year |
$ | 4,833,504 | ||
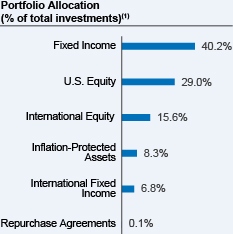 |
| (1) | Affiliated investment companies (Underlying Funds), except for repurchase agreements, where applicable. |
How has the Fund changed?
Portfolio manager update: Effective October 1, 2025, Jeff Sun, CFA was added as a portfolio manager of the Fund.
For more complete information, you may review the Fund’s next prospectus, which is expected to be available by October 1, 2026 at https://www.nuveen.com/en‑us/mutual‑funds/prospectuses or upon request at (800) 257‑8787.
For more complete information, you may review the Fund’s next prospectus, which is expected to be available by October 1, 2026 at https://www.nuveen.com/en‑us/mutual‑funds/prospectuses or upon request at (800) 257‑8787.
This report describes changes to the Fund that occurred during the reporting period.
What were the Fund costs for the last year? (based on a hypothetical $10,000 investment)
| Cost of a $10,000 investment | Costs paid as a percentage of $10,000 investment* | |||
| Class R6 Shares |
$11 | 0.10% | ||
| * | The Fund’s ratios exclude the expenses of Underlying Funds that are exchange-traded funds, include the expenses of all other Underlying Funds, and exclude the income of all Underlying Funds. Annualized for a period less than one year. |
How did the Fund perform last year? What affected the Fund’s performance?
| Performance Highlights The Nuveen Lifecycle Index 2020 Fund returned 15.95% for Class R6 Shares at net asset value (NAV) for the 12 months ended May 31, 2026. The Fund performed in line with the Lifecycle Index 2020 Fund Composite Index, which returned 16.10%. The Fund’s Composite Index consisted of: 28.6% Russell 3000® Index; 27.5% Bloomberg U.S. Aggregate Bond Index; 15.4% MSCI EAFE + Emerging Markets Index; 8.4% Bloomberg U.S. 1–3 Year Government/Credit Bond Index; 8.4% Bloomberg U.S. Treasury Inflation Protected Securities (TIPS) 1‑10 Year Index; 6.9% Bloomberg Global Aggregate ex‑USD Index (Hedged); and 4.8% ICE BofA BB‑B U.S. Cash Pay High Yield Constrained Index. Top contributors to absolute performance • Underlying equity and fixed income funds advanced for the period. U.S. and international equity funds recorded double-digit gains and contributed most. Top detractors from absolute performance • Management fees and other expenses incurred by the Fund. |
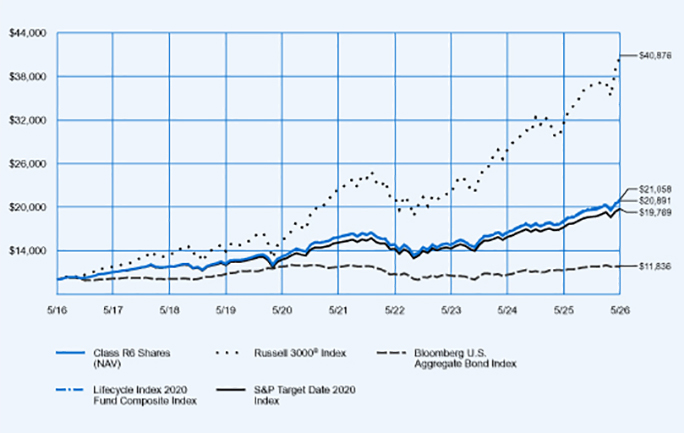
Average Annual Total Returns
| 1-Year | 5-Year | 10-Year | ||||||||||
| Class R6 Shares at NAV |
15.95 | % | 5.69 | % | 7.65 | % | ||||||
| Russell 3000® Index |
29.45 | % | 12.92 | % | 15.12 | % | ||||||
| Bloomberg U.S. Aggregate Bond Index |
5.13 | % | 0.17 | % | 1.70 | % | ||||||
| Lifecycle Index 2020 Fund Composite Index |
16.10 | % | 5.76 | % | 7.73 | % | ||||||
| S&P Target Date 2020 Index |
14.70 | % | 5.52 | % | 7.05 | % | ||||||
Fund Statistics (as of May 31, 2026)
| Fund net assets |
$ | 2,841,102,933 | ||
| Total number of portfolio holdings |
9 | |||
| Portfolio turnover (%) |
23% | |||
| Total management fees paid for the year |
$ | 4,833,504 | ||
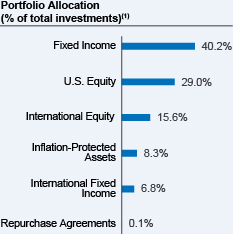 |
| (1) | Affiliated investment companies (Underlying Funds), except for repurchase agreements, where applicable. |
How has the Fund changed?
Portfolio manager update: Effective October 1, 2025, Jeff Sun, CFA was added as a portfolio manager of the Fund.
For more complete information, you may review the Fund’s next prospectus, which is expected to be available by October 1, 2026 at https://www.nuveen.com/en‑us/mutual‑funds/prospectuses or upon request at (800) 257‑8787.
For more complete information, you may review the Fund’s next prospectus, which is expected to be available by October 1, 2026 at https://www.nuveen.com/en‑us/mutual‑funds/prospectuses or upon request at (800) 257‑8787.
This report describes changes to the Fund that occurred during the reporting period.
What were the Fund costs for the last year? (based on a hypothetical $10,000 investment)
| Cost of a $10,000 investment | Costs paid as a percentage of $10,000 investment* | |||
| Premier Class Shares |
$27 | 0.25% | ||
| * | The Fund’s ratios exclude the expenses of Underlying Funds that are exchange-traded funds, include the expenses of all other Underlying Funds, and exclude the income of all Underlying Funds. Annualized for a period less than one year. |
How did the Fund perform last year? What affected the Fund’s performance?
| Performance Highlights The Nuveen Lifecycle Index 2020 Fund returned 15.83% for Premier Class Shares at net asset value (NAV) for the 12 months ended May 31, 2026. The Fund underperformed the Lifecycle Index 2020 Fund Composite Index, which returned 16.10%. The Fund’s Composite Index consisted of: 28.6% Russell 3000® Index; 27.5% Bloomberg U.S. Aggregate Bond Index; 15.4% MSCI EAFE + Emerging Markets Index; 8.4% Bloomberg U.S. 1–3 Year Government/Credit Bond Index; 8.4% Bloomberg U.S. Treasury Inflation Protected Securities (TIPS) 1‑10 Year Index; 6.9% Bloomberg Global Aggregate ex‑USD Index (Hedged); and 4.8% ICE BofA BB‑B U.S. Cash Pay High Yield Constrained Index. Top contributors to absolute performance • Underlying equity and fixed income funds advanced for the period. U.S. and international equity funds recorded double-digit gains and contributed most. Top detractors from absolute performance • Management fees and other expenses incurred by the Fund. |
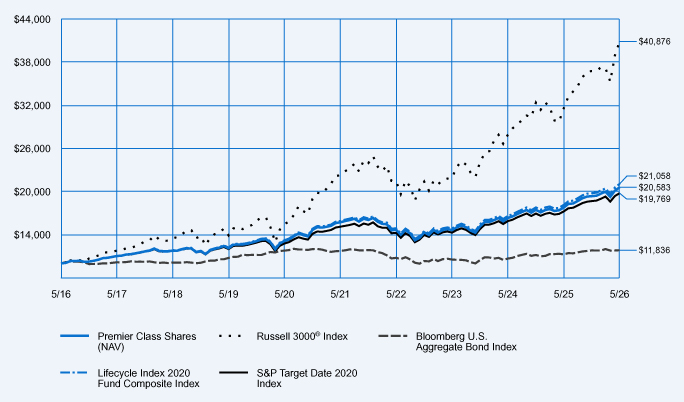
Average Annual Total Returns
| 1-Year | 5-Year | 10-Year | ||||||||||
| Premier Class Shares at NAV |
15.83 | % | 5.54 | % | 7.49 | % | ||||||
| Russell 3000® Index |
29.45 | % | 12.92 | % | 15.12 | % | ||||||
| Bloomberg U.S. Aggregate Bond Index |
5.13 | % | 0.17 | % | 1.70 | % | ||||||
| Lifecycle Index 2020 Fund Composite Index |
16.10 | % | 5.76 | % | 7.73 | % | ||||||
| S&P Target Date 2020 Index |
14.70 | % | 5.52 | % | 7.05 | % | ||||||
Fund Statistics (as of May 31, 2026)
| Fund net assets |
$ | 2,841,102,933 | ||
| Total number of portfolio holdings |
9 | |||
| Portfolio turnover (%) |
23% | |||
| Total management fees paid for the year |
$ | 4,833,504 | ||
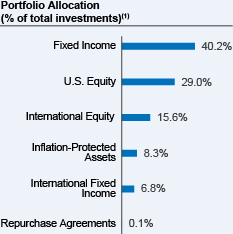 |
| (1) | Affiliated investment companies (Underlying Funds), except for repurchase agreements, where applicable. |
How has the Fund changed?
Portfolio manager update: Effective October 1, 2025, Jeff Sun, CFA was added as a portfolio manager of the Fund.
For more complete information, you may review the Fund’s next prospectus, which is expected to be available by October 1, 2026 at https://www.nuveen.com/en‑us/mutual‑funds/prospectuses or upon request at (800) 257‑8787.
For more complete information, you may review the Fund’s next prospectus, which is expected to be available by October 1, 2026 at https://www.nuveen.com/en‑us/mutual‑funds/prospectuses or upon request at (800) 257‑8787.
This report describes changes to the Fund that occurred during the reporting period.
What were the Fund costs for the last year? (based on a hypothetical $10,000 investment)
| Cost of a $10,000 investment | Costs paid as a percentage of $10,000 investment* | |||
| Class I Shares |
$13 | 0.12% | ||
| * | The Fund’s ratios exclude the expenses of Underlying Funds that are exchange-traded funds, include the expenses of all other Underlying Funds, and exclude the income of all Underlying Funds. Annualized for a period less than one year. |
How did the Fund perform last year? What affected the Fund’s performance?
| Performance Highlights The Nuveen Lifecycle Index 2020 Fund returned 15.94% for Class I Shares at net asset value (NAV) for the 12 months ended May 31, 2026. The Fund performed in line with the Lifecycle Index 2020 Fund Composite Index, which returned 16.10%. The Fund’s Composite Index consisted of: 28.6% Russell 3000® Index; 27.5% Bloomberg U.S. Aggregate Bond Index; 15.4% MSCI EAFE + Emerging Markets Index; 8.4% Bloomberg U.S. 1–3 Year Government/Credit Bond Index; 8.4% Bloomberg U.S. Treasury Inflation Protected Securities (TIPS) 1‑10 Year Index; 6.9% Bloomberg Global Aggregate ex‑USD Index (Hedged); and 4.8% ICE BofA BB‑B U.S. Cash Pay High Yield Constrained Index. Top contributors to absolute performance • Underlying equity and fixed income funds advanced for the period. U.S. and international equity funds recorded double-digit gains and contributed most. Top detractors from absolute performance • Management fees and other expenses incurred by the Fund. |
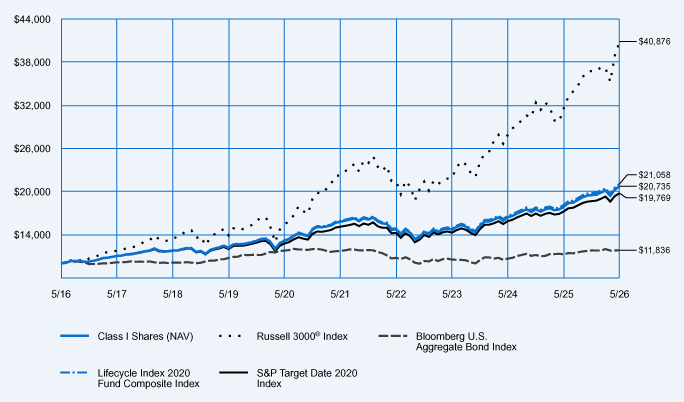
Average Annual Total Returns
| 1-Year | 5-Year | 10-Year | ||||||||||
| Class I Shares at NAV |
15.94 | % | 5.61 | % | 7.56 | % | ||||||
| Russell 3000® Index |
29.45 | % | 12.92 | % | 15.12 | % | ||||||
| Bloomberg U.S. Aggregate Bond Index |
5.13 | % | 0.17 | % | 1.70 | % | ||||||
| Lifecycle Index 2020 Fund Composite Index |
16.10 | % | 5.76 | % | 7.73 | % | ||||||
| S&P Target Date 2020 Index |
14.70 | % | 5.52 | % | 7.05 | % | ||||||
Fund Statistics (as of May 31, 2026)
| Fund net assets |
$ | 2,841,102,933 | ||
| Total number of portfolio holdings |
9 | |||
| Portfolio turnover (%) |
23% | |||
| Total management fees paid for the year |
$ | 4,833,504 | ||
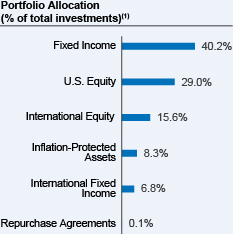 |
| (1) | Affiliated investment companies (Underlying Funds), except for repurchase agreements, where applicable. |
How has the Fund changed?
Portfolio manager update: Effective October 1, 2025, Jeff Sun, CFA was added as a portfolio manager of the Fund.
For more complete information, you may review the Fund’s next prospectus, which is expected to be available by October 1, 2026 at https://www.nuveen.com/en‑us/mutual‑funds/prospectuses or upon request at (800) 257‑8787.
For more complete information, you may review the Fund’s next prospectus, which is expected to be available by October 1, 2026 at https://www.nuveen.com/en‑us/mutual‑funds/prospectuses or upon request at (800) 257‑8787.
This report describes changes to the Fund that occurred during the reporting period.
What were the Fund costs for the last year? (based on a hypothetical $10,000 investment)
| Cost of a $10,000 investment | Costs paid as a percentage of $10,000 investment* | |||
| Class I Shares |
$13 | 0.12% | ||
| * | The Fund’s ratios exclude the expenses of Underlying Funds that are exchange-traded funds, include the expenses of all other Underlying Funds, and exclude the income of all Underlying Funds. Annualized for a period less than one year. |
How did the Fund perform last year? What affected the Fund’s performance?
| Performance Highlights The Nuveen Lifecycle Index 2025 Fund returned 17.24% for Class I Shares at net asset value (NAV) for the 12 months ended May 31, 2026. The Fund performed in line with the Lifecycle Index 2025 Fund Composite Index, which returned 17.39%. The Fund’s Composite Index consisted of: 31.9% Russell 3000® Index; 27.3% Bloomberg U.S. Aggregate Bond Index; 17.2% MSCI EAFE + Emerging Markets Index; 6.8% Bloomberg Global Aggregate ex‑USD Index (Hedged); 6.4% Bloomberg U.S. 1–3 Year Government/Credit Bond Index; 6.4% Bloomberg U.S. Treasury Inflation Protected Securities (TIPS) 1‑10 Year Index; and 4.0% ICE BofA BB‑B U.S. Cash Pay High Yield Constrained Index. Top contributors to absolute performance • Underlying equity and fixed income funds advanced for the period. U.S. and international equity funds recorded double-digit gains and contributed most. Top detractors from absolute performance • Management fees and other expenses incurred by the Fund. |
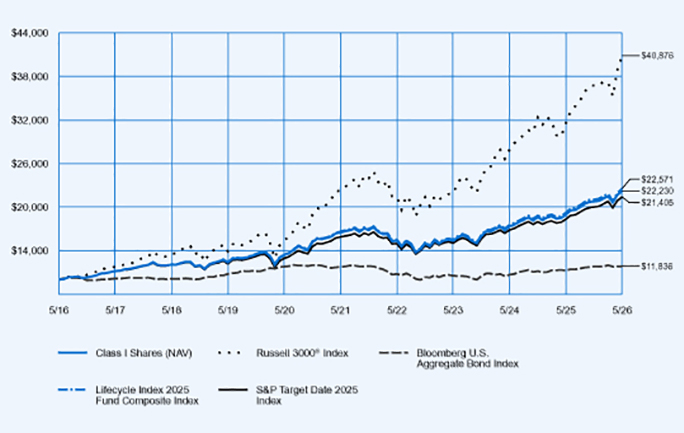
Average Annual Total Returns
| 1-Year | 5-Year | 10-Year | ||||||||||
| Class I Shares at NAV |
17.24 | % | 6.15 | % | 8.32 | % | ||||||
| Russell 3000® Index |
29.45 | % | 12.92 | % | 15.12 | % | ||||||
| Bloomberg U.S. Aggregate Bond Index |
5.13 | % | 0.17 | % | 1.70 | % | ||||||
| Lifecycle Index 2025 Fund Composite Index |
17.39 | % | 6.30 | % | 8.48 | % | ||||||
| S&P Target Date 2025 Index |
16.73 | % | 6.14 | % | 7.91 | % | ||||||
Fund Statistics (as of May 31, 2026)
| Fund net assets |
$ | 5,889,107,451 | ||
| Total number of portfolio holdings |
9 | |||
| Portfolio turnover (%) |
22% | |||
| Total management fees paid for the year |
$ | 9,703,570 | ||
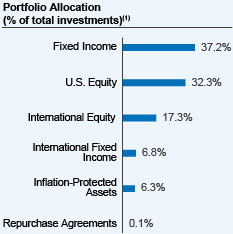 |
| (1) | Affiliated investment companies (Underlying Funds), except for repurchase agreements, where applicable. |
How has the Fund changed?
Portfolio manager update: Effective October 1, 2025, Jeff Sun, CFA was added as a portfolio manager of the Fund.
For more complete information, you may review the Fund’s next prospectus, which is expected to be available by October 1, 2026 at https://www.nuveen.com/en‑us/mutual‑funds/prospectuses or upon request at (800) 257‑8787.
For more complete information, you may review the Fund’s next prospectus, which is expected to be available by October 1, 2026 at https://www.nuveen.com/en‑us/mutual‑funds/prospectuses or upon request at (800) 257‑8787.
This report describes changes to the Fund that occurred during the reporting period.
What were the Fund costs for the last year? (based on a hypothetical $10,000 investment)
| Cost of a $10,000 investment | Costs paid as a percentage of $10,000 investment* | |||
| Premier Class Shares |
$27 | 0.25% | ||
| * | The Fund’s ratios exclude the expenses of Underlying Funds that are exchange-traded funds, include the expenses of all other Underlying Funds, and exclude the income of all Underlying Funds. Annualized for a period less than one year. |
How did the Fund perform last year? What affected the Fund’s performance?
| Performance Highlights The Nuveen Lifecycle Index 2025 Fund returned 17.04% for Premier Class Shares at net asset value (NAV) for the 12 months ended May 31, 2026. The Fund underperformed the Lifecycle Index 2025 Fund Composite Index, which returned 17.39%. The Fund’s Composite Index consisted of: 31.9% Russell 3000® Index; 27.3% Bloomberg U.S. Aggregate Bond Index; 17.2% MSCI EAFE + Emerging Markets Index; 6.8% Bloomberg Global Aggregate ex‑USD Index (Hedged); 6.4% Bloomberg U.S. 1–3 Year Government/Credit Bond Index; 6.4% Bloomberg U.S. Treasury Inflation Protected Securities (TIPS) 1‑10 Year Index; and 4.0% ICE BofA BB‑B U.S. Cash Pay High Yield Constrained Index. Top contributors to absolute performance • Underlying equity and fixed income funds advanced for the period. U.S. and international equity funds recorded double-digit gains and contributed most. Top detractors from absolute performance • Management fees and other expenses incurred by the Fund. |
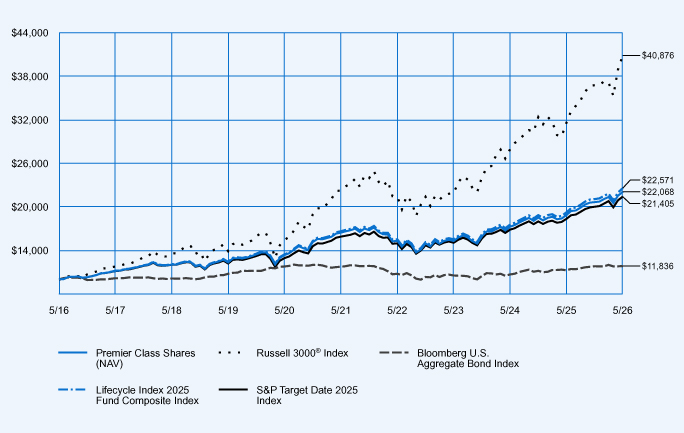
Average Annual Total Returns
| 1-Year | 5-Year | 10-Year | ||||||||||
| Premier Class Shares at NAV |
17.04 | % | 6.07 | % | 8.24 | % | ||||||
| Russell 3000® Index |
29.45 | % | 12.92 | % | 15.12 | % | ||||||
| Bloomberg U.S. Aggregate Bond Index |
5.13 | % | 0.17 | % | 1.70 | % | ||||||
| Lifecycle Index 2025 Fund Composite Index |
17.39 | % | 6.30 | % | 8.48 | % | ||||||
| S&P Target Date 2025 Index |
16.73 | % | 6.14 | % | 7.91 | % | ||||||
Fund Statistics (as of May 31, 2026)
| Fund net assets |
$ | 5,889,107,451 | ||
| Total number of portfolio holdings |
9 | |||
| Portfolio turnover (%) |
22% | |||
| Total management fees paid for the year |
$ | 9,703,570 | ||
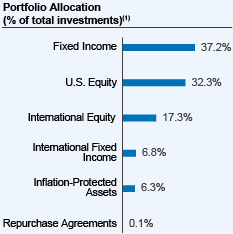 |
| (1) | Affiliated investment companies (Underlying Funds), except for repurchase agreements, where applicable. |
How has the Fund changed?
Portfolio manager update: Effective October 1, 2025, Jeff Sun, CFA was added as a portfolio manager of the Fund.
For more complete information, you may review the Fund’s next prospectus, which is expected to be available by October 1, 2026 at https://www.nuveen.com/en‑us/mutual‑funds/prospectuses or upon request at (800) 257‑8787.
For more complete information, you may review the Fund’s next prospectus, which is expected to be available by October 1, 2026 at https://www.nuveen.com/en‑us/mutual‑funds/prospectuses or upon request at (800) 257‑8787.
This report describes changes to the Fund that occurred during the reporting period.
What were the Fund costs for the last year? (based on a hypothetical $10,000 investment)
| Cost of a $10,000 investment | Costs paid as a percentage of $10,000 investment* | |||
| Class R6 Shares |
$11 | 0.10% | ||
| * | The Fund’s ratios exclude the expenses of Underlying Funds that are exchange-traded funds, include the expenses of all other Underlying Funds, and exclude the income of all Underlying Funds. Annualized for a period less than one year. |
How did the Fund perform last year? What affected the Fund’s performance?
| Performance Highlights The Nuveen Lifecycle Index 2025 Fund returned 17.22% for Class R6 Shares at net asset value (NAV) for the 12 months ended May 31, 2026. The Fund performed in line with the Lifecycle Index 2025 Fund Composite Index, which returned 17.39%. The Fund’s Composite Index consisted of: 31.9% Russell 3000® Index; 27.3% Bloomberg U.S. Aggregate Bond Index; 17.2% MSCI EAFE + Emerging Markets Index; 6.8% Bloomberg Global Aggregate ex‑USD Index (Hedged); 6.4% Bloomberg U.S. 1–3 Year Government/Credit Bond Index; 6.4% Bloomberg U.S. Treasury Inflation Protected Securities (TIPS) 1‑10 Year Index; and 4.0% ICE BofA BB‑B U.S. Cash Pay High Yield Constrained Index. Top contributors to absolute performance • Underlying equity and fixed income funds advanced for the period. U.S. and international equity funds recorded double-digit gains and contributed most. Top detractors from absolute performance • Management fees and other expenses incurred by the Fund. |
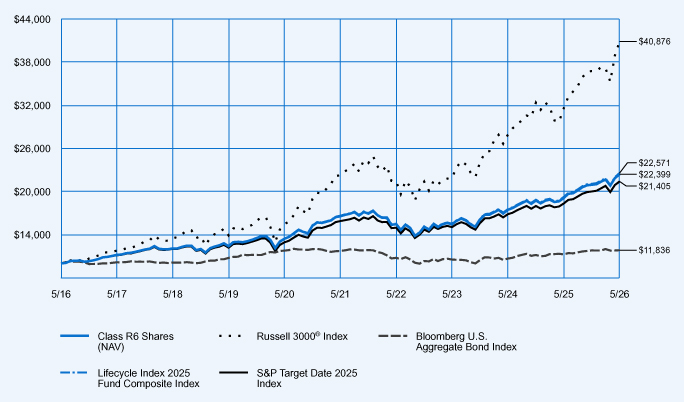
Average Annual Total Returns
| 1-Year | 5-Year | 10-Year | ||||||||||
| Class R6 Shares at NAV |
17.22 | % | 6.23 | % | 8.40 | % | ||||||
| Russell 3000® Index |
29.45 | % | 12.92 | % | 15.12 | % | ||||||
| Bloomberg U.S. Aggregate Bond Index |
5.13 | % | 0.17 | % | 1.70 | % | ||||||
| Lifecycle Index 2025 Fund Composite Index |
17.39 | % | 6.30 | % | 8.48 | % | ||||||
| S&P Target Date 2025 Index |
16.73 | % | 6.14 | % | 7.91 | % | ||||||
Fund Statistics (as of May 31, 2026)
| Fund net assets |
$ | 5,889,107,451 | ||
| Total number of portfolio holdings |
9 | |||
| Portfolio turnover (%) |
22% | |||
| Total management fees paid for the year |
$ | 9,703,570 | ||
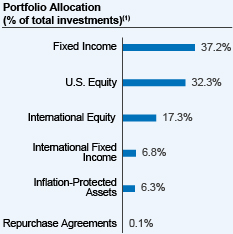 |
| (1) | Affiliated investment companies (Underlying Funds), except for repurchase agreements, where applicable. |
How has the Fund changed?
Portfolio manager update: Effective October 1, 2025, Jeff Sun, CFA was added as a portfolio manager of the Fund.
For more complete information, you may review the Fund’s next prospectus, which is expected to be available by October 1, 2026 at https://www.nuveen.com/en‑us/mutual‑funds/prospectuses or upon request at (800) 257‑8787.
For more complete information, you may review the Fund’s next prospectus, which is expected to be available by October 1, 2026 at https://www.nuveen.com/en‑us/mutual‑funds/prospectuses or upon request at (800) 257‑8787.
This report describes changes to the Fund that occurred during the reporting period.
What were the Fund costs for the last year? (based on a hypothetical $10,000 investment)
| Cost of a $10,000 investment | Costs paid as a percentage of $10,000 investment* | |||
| Retirement Class Shares |
$38 | 0.35% | ||
| * | The Fund’s ratios exclude the expenses of Underlying Funds that are exchange-traded funds, include the expenses of all other Underlying Funds, and exclude the income of all Underlying Funds. Annualized for a period less than one year. |
How did the Fund perform last year? What affected the Fund’s performance?
| Performance Highlights The Nuveen Lifecycle Index 2025 Fund returned 16.96% for Retirement Class Shares at net asset value (NAV) for the 12 months ended May 31, 2026. The Fund underperformed the Lifecycle Index 2025 Fund Composite Index, which returned 17.39%. The Fund’s Composite Index consisted of: 31.9% Russell 3000® Index; 27.3% Bloomberg U.S. Aggregate Bond Index; 17.2% MSCI EAFE + Emerging Markets Index; 6.8% Bloomberg Global Aggregate ex‑USD Index (Hedged); 6.4% Bloomberg U.S. 1–3 Year Government/Credit Bond Index; 6.4% Bloomberg U.S. Treasury Inflation Protected Securities (TIPS) 1‑10 Year Index; and 4.0% ICE BofA BB‑B U.S. Cash Pay High Yield Constrained Index. Top contributors to absolute performance • Underlying equity and fixed income funds advanced for the period. U.S. and international equity funds recorded double-digit gains and contributed most. Top detractors from absolute performance • Management fees and other expenses incurred by the Fund. |
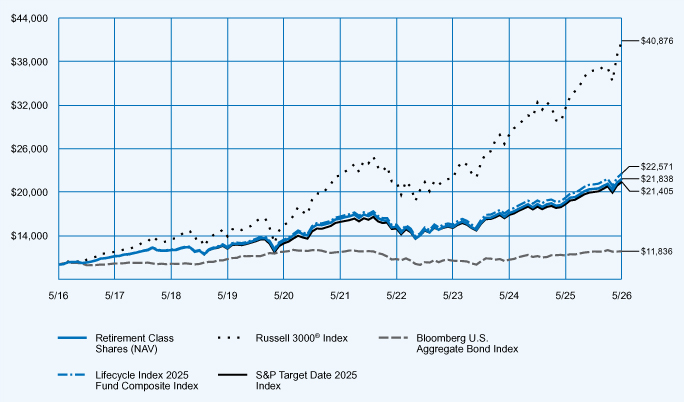
Average Annual Total Returns
| 1-Year | 5-Year | 10-Year | ||||||||||
| Retirement Class Shares at NAV |
16.96 | % | 5.97 | % | 8.12 | % | ||||||
| Russell 3000® Index |
29.45 | % | 12.92 | % | 15.12 | % | ||||||
| Bloomberg U.S. Aggregate Bond Index |
5.13 | % | 0.17 | % | 1.70 | % | ||||||
| Lifecycle Index 2025 Fund Composite Index |
17.39 | % | 6.30 | % | 8.48 | % | ||||||
| S&P Target Date 2025 Index |
16.73 | % | 6.14 | % | 7.91 | % | ||||||
Fund Statistics (as of May 31, 2026)
| Fund net assets |
$ | 5,889,107,451 | ||
| Total number of portfolio holdings |
9 | |||
| Portfolio turnover (%) |
22% | |||
| Total management fees paid for the year |
$ | 9,703,570 | ||
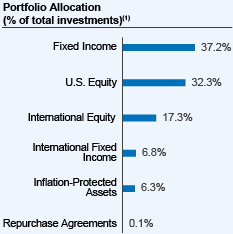 |
| (1) | Affiliated investment companies (Underlying Funds), except for repurchase agreements, where applicable. |
How has the Fund changed?
Portfolio manager update: Effective October 1, 2025, Jeff Sun, CFA was added as a portfolio manager of the Fund.
For more complete information, you may review the Fund’s next prospectus, which is expected to be available by October 1, 2026 at https://www.nuveen.com/en‑us/mutual‑funds/prospectuses or upon request at (800) 257‑8787.
For more complete information, you may review the Fund’s next prospectus, which is expected to be available by October 1, 2026 at https://www.nuveen.com/en‑us/mutual‑funds/prospectuses or upon request at (800) 257‑8787.
This report describes changes to the Fund that occurred during the reporting period.
What were the Fund costs for the last year? (based on a hypothetical $10,000 investment)
| Cost of a $10,000 investment | Costs paid as a percentage of $10,000 investment* | |||
| Retirement Class Shares |
$38 | 0.35% | ||
| * | The Fund’s ratios exclude the expenses of Underlying Funds that are exchange-traded funds, include the expenses of all other Underlying Funds, and exclude the income of all Underlying Funds. Annualized for a period less than one year. |
How did the Fund perform last year? What affected the Fund’s performance?
| Performance Highlights The Nuveen Lifecycle Index 2030 Fund returned 18.95% for Retirement Class Shares at net asset value (NAV) for the 12 months ended May 31, 2026. The Fund underperformed the Lifecycle Index 2030 Fund Composite Index, which returned 19.39%. The Fund’s Composite Index consisted of: 36.7% Russell 3000® Index; 25.1% Bloomberg U.S. Aggregate Bond Index; 19.8% MSCI EAFE + Emerging Markets Index; 6.3% Bloomberg Global Aggregate ex‑USD Index (Hedged); 4.4% Bloomberg U.S. 1–3 Year Government/Credit Bond Index; 4.4% Bloomberg U.S. Treasury Inflation Protected Securities (TIPS) 1‑10 Year Index; and 3.3% ICE BofA BB‑B U.S. Cash Pay High Yield Constrained Index. Top contributors to absolute performance • Underlying equity and fixed income funds advanced for the period. U.S. and international equity funds recorded double-digit gains and contributed most. Top detractors from absolute performance • Management fees and other expenses incurred by the Fund. |
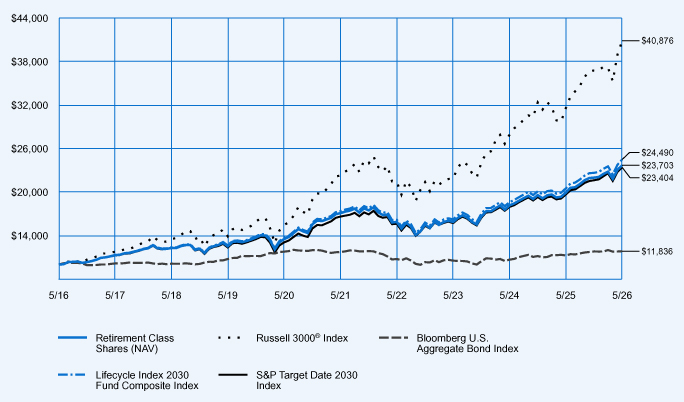
Average Annual Total Returns
| 1-Year | 5-Year | 10-Year | ||||||||||
| Retirement Class Shares at NAV |
18.95 | % | 6.76 | % | 9.01 | % | ||||||
| Russell 3000® Index |
29.45 | % | 12.92 | % | 15.12 | % | ||||||
| Bloomberg U.S. Aggregate Bond Index |
5.13 | % | 0.17 | % | 1.70 | % | ||||||
| Lifecycle Index 2030 Fund Composite Index |
19.39 | % | 7.10 | % | 9.37 | % | ||||||
| S&P Target Date 2030 Index |
19.00 | % | 7.09 | % | 8.88 | % | ||||||
Fund Statistics (as of May 31, 2026)
| Fund net assets |
$ | 9,492,914,581 | ||
| Total number of portfolio holdings |
9 | |||
| Portfolio turnover (%) |
23% | |||
| Total management fees paid for the year |
$ | 14,496,254 | ||
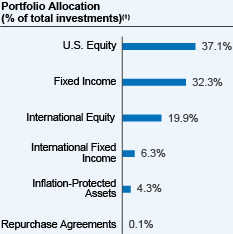 |
| (1) | Affiliated investment companies (Underlying Funds), except for repurchase agreements, where applicable. |
How has the Fund changed?
Portfolio manager update: Effective October 1, 2025, Jeff Sun, CFA was added as a portfolio manager of the Fund.
For more complete information, you may review the Fund’s next prospectus, which is expected to be available by October 1, 2026 at https://www.nuveen.com/en‑us/mutual‑funds/prospectuses or upon request at (800) 257‑8787.
For more complete information, you may review the Fund’s next prospectus, which is expected to be available by October 1, 2026 at https://www.nuveen.com/en‑us/mutual‑funds/prospectuses or upon request at (800) 257‑8787.
This report describes changes to the Fund that occurred during the reporting period.
What were the Fund costs for the last year? (based on a hypothetical $10,000 investment)
| Cost of a $10,000 investment | Costs paid as a percentage of $10,000 investment* | |||
| Class R6 Shares |
$11 | 0.10% | ||
| * | The Fund’s ratios exclude the expenses of Underlying Funds that are exchange-traded funds, include the expenses of all other Underlying Funds, and exclude the income of all Underlying Funds. Annualized for a period less than one year. |
How did the Fund perform last year? What affected the Fund’s performance?
| Performance Highlights The Nuveen Lifecycle Index 2030 Fund returned 19.24% for Class R6 Shares at net asset value (NAV) for the 12 months ended May 31, 2026. The Fund performed in line with the Lifecycle Index 2030 Fund Composite Index, which returned 19.39%. The Fund’s Composite Index consisted of: 36.7% Russell 3000® Index; 25.1% Bloomberg U.S. Aggregate Bond Index; 19.8% MSCI EAFE + Emerging Markets Index; 6.3% Bloomberg Global Aggregate ex‑USD Index (Hedged); 4.4% Bloomberg U.S. 1–3 Year Government/Credit Bond Index; 4.4% Bloomberg U.S. Treasury Inflation Protected Securities (TIPS) 1‑10 Year Index; and 3.3% ICE BofA BB‑B U.S. Cash Pay High Yield Constrained Index. Top contributors to absolute performance • Underlying equity and fixed income funds advanced for the period. U.S. and international equity funds recorded double-digit gains and contributed most. Top detractors from absolute performance • Management fees and other expenses incurred by the Fund. |
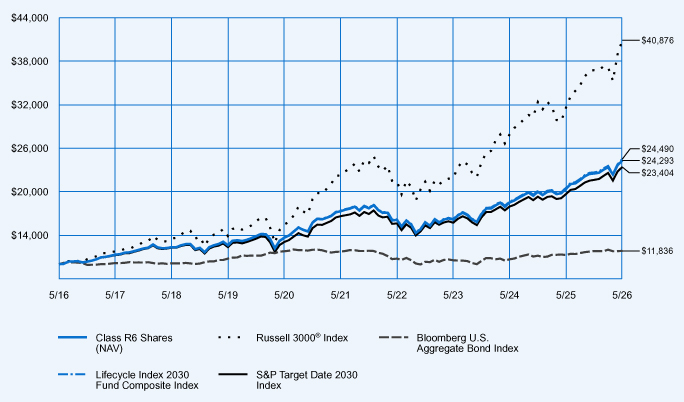
Average Annual Total Returns
| 1-Year | 5-Year | 10-Year | ||||||||||
| Class R6 Shares at NAV |
19.24 | % | 7.03 | % | 9.28 | % | ||||||
| Russell 3000® Index |
29.45 | % | 12.92 | % | 15.12 | % | ||||||
| Bloomberg U.S. Aggregate Bond Index |
5.13 | % | 0.17 | % | 1.70 | % | ||||||
| Lifecycle Index 2030 Fund Composite Index |
19.39 | % | 7.10 | % | 9.37 | % | ||||||
| S&P Target Date 2030 Index |
19.00 | % | 7.09 | % | 8.88 | % | ||||||
Fund Statistics (as of May 31, 2026)
| Fund net assets |
$ | 9,492,914,581 | ||
| Total number of portfolio holdings |
9 | |||
| Portfolio turnover (%) |
23% | |||
| Total management fees paid for the year |
$ | 14,496,254 | ||
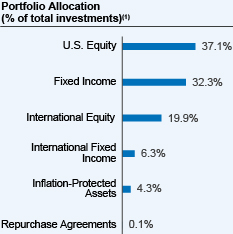 |
| (1) | Affiliated investment companies (Underlying Funds), except for repurchase agreements, where applicable. |
How has the Fund changed?
Portfolio manager update: Effective October 1, 2025, Jeff Sun, CFA was added as a portfolio manager of the Fund.
For more complete information, you may review the Fund’s next prospectus, which is expected to be available by October 1, 2026 at https://www.nuveen.com/en‑us/mutual‑funds/prospectuses or upon request at (800) 257‑8787.
For more complete information, you may review the Fund’s next prospectus, which is expected to be available by October 1, 2026 at https://www.nuveen.com/en‑us/mutual‑funds/prospectuses or upon request at (800) 257‑8787.
This report describes changes to the Fund that occurred during the reporting period.
What were the Fund costs for the last year? (based on a hypothetical $10,000 investment)
| Cost of a $10,000 investment | Costs paid as a percentage of $10,000 investment* | |||
| Premier Class Shares |
$27 | 0.25% | ||
| * | The Fund’s ratios exclude the expenses of Underlying Funds that are exchange-traded funds, include the expenses of all other Underlying Funds, and exclude the income of all Underlying Funds. Annualized for a period less than one year. |
How did the Fund perform last year? What affected the Fund’s performance?
| Performance Highlights The Nuveen Lifecycle Index 2030 Fund returned 19.07% for Premier Class Shares at net asset value (NAV) for the 12 months ended May 31, 2026. The Fund underperformed the Lifecycle Index 2030 Fund Composite Index, which returned 19.39%. The Fund’s Composite Index consisted of: 36.7% Russell 3000® Index; 25.1% Bloomberg U.S. Aggregate Bond Index; 19.8% MSCI EAFE + Emerging Markets Index; 6.3% Bloomberg Global Aggregate ex‑USD Index (Hedged); 4.4% Bloomberg U.S. 1–3 Year Government/Credit Bond Index; 4.4% Bloomberg U.S. Treasury Inflation Protected Securities (TIPS) 1‑10 Year Index; and 3.3% ICE BofA BB‑B U.S. Cash Pay High Yield Constrained Index. Top contributors to absolute performance • Underlying equity and fixed income funds advanced for the period. U.S. and international equity funds recorded double-digit gains and contributed most. Top detractors from absolute performance • Management fees and other expenses incurred by the Fund. |
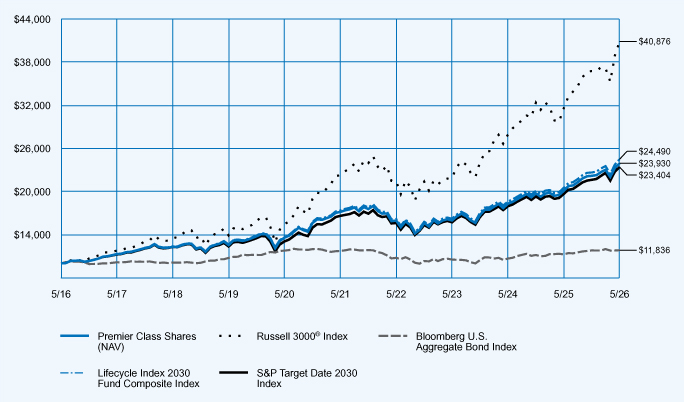
Average Annual Total Returns
| 1-Year | 5-Year | 10-Year | ||||||||||
| Premier Class Shares at NAV |
19.07 | % | 6.87 | % | 9.12 | % | ||||||
| Russell 3000® Index |
29.45 | % | 12.92 | % | 15.12 | % | ||||||
| Bloomberg U.S. Aggregate Bond Index |
5.13 | % | 0.17 | % | 1.70 | % | ||||||
| Lifecycle Index 2030 Fund Composite Index |
19.39 | % | 7.10 | % | 9.37 | % | ||||||
| S&P Target Date 2030 Index |
19.00 | % | 7.09 | % | 8.88 | % | ||||||
Fund Statistics (as of May 31, 2026)
| Fund net assets |
$ | 9,492,914,581 | ||
| Total number of portfolio holdings |
9 | |||
| Portfolio turnover (%) |
23% | |||
| Total management fees paid for the year |
$ | 14,496,254 | ||
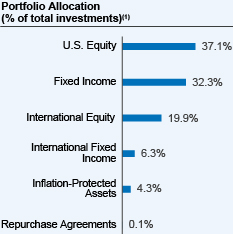 |
| (1) | Affiliated investment companies (Underlying Funds), except for repurchase agreements, where applicable. |
How has the Fund changed?
Portfolio manager update: Effective October 1, 2025, Jeff Sun, CFA was added as a portfolio manager of the Fund.
For more complete information, you may review the Fund’s next prospectus, which is expected to be available by October 1, 2026 at https://www.nuveen.com/en‑us/mutual‑funds/prospectuses or upon request at (800) 257‑8787.
For more complete information, you may review the Fund’s next prospectus, which is expected to be available by October 1, 2026 at https://www.nuveen.com/en‑us/mutual‑funds/prospectuses or upon request at (800) 257‑8787.
This report describes changes to the Fund that occurred during the reporting period.
What were the Fund costs for the last year? (based on a hypothetical $10,000 investment)
| Cost of a $10,000 investment | Costs paid as a percentage of $10,000 investment* | |||
| Class I Shares |
$13 | 0.12% | ||
| * | The Fund’s ratios exclude the expenses of Underlying Funds that are exchange-traded funds, include the expenses of all other Underlying Funds, and exclude the income of all Underlying Funds. Annualized for a period less than one year. |
How did the Fund perform last year? What affected the Fund’s performance?
| Performance Highlights The Nuveen Lifecycle Index 2030 Fund returned 19.21% for Class I Shares at net asset value (NAV) for the 12 months ended May 31, 2026. The Fund performed in line with the Lifecycle Index 2030 Fund Composite Index, which returned 19.39%. The Fund’s Composite Index consisted of: 36.7% Russell 3000® Index; 25.1% Bloomberg U.S. Aggregate Bond Index; 19.8% MSCI EAFE + Emerging Markets Index; 6.3% Bloomberg Global Aggregate ex‑USD Index (Hedged); 4.4% Bloomberg U.S. 1–3 Year Government/Credit Bond Index; 4.4% Bloomberg U.S. Treasury Inflation Protected Securities (TIPS) 1‑10 Year Index; and 3.3% ICE BofA BB‑B U.S. Cash Pay High Yield Constrained Index. Top contributors to absolute performance • Underlying equity and fixed income funds advanced for the period. U.S. and international equity funds recorded double-digit gains and contributed most. Top detractors from absolute performance • Management fees and other expenses incurred by the Fund. |
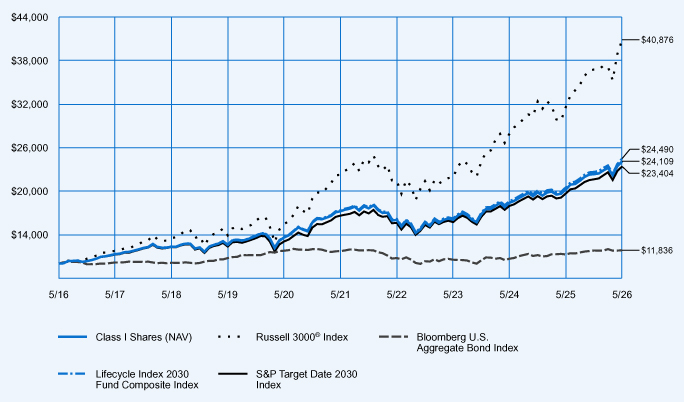
Average Annual Total Returns
| 1-Year | 5-Year | 10-Year | ||||||||||
| Class I Shares at NAV |
19.21 | % | 6.96 | % | 9.20 | % | ||||||
| Russell 3000® Index |
29.45 | % | 12.92 | % | 15.12 | % | ||||||
| Bloomberg U.S. Aggregate Bond Index |
5.13 | % | 0.17 | % | 1.70 | % | ||||||
| Lifecycle Index 2030 Fund Composite Index |
19.39 | % | 7.10 | % | 9.37 | % | ||||||
| S&P Target Date 2030 Index |
19.00 | % | 7.09 | % | 8.88 | % | ||||||
Fund Statistics (as of May 31, 2026)
| Fund net assets |
$ | 9,492,914,581 | ||
| Total number of portfolio holdings |
9 | |||
| Portfolio turnover (%) |
23% | |||
| Total management fees paid for the year |
$ | 14,496,254 | ||
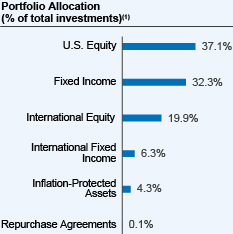 |
| (1) | Affiliated investment companies (Underlying Funds), except for repurchase agreements, where applicable. |
How has the Fund changed?
Portfolio manager update: Effective October 1, 2025, Jeff Sun, CFA was added as a portfolio manager of the Fund.
For more complete information, you may review the Fund’s next prospectus, which is expected to be available by October 1, 2026 at https://www.nuveen.com/en‑us/mutual‑funds/prospectuses or upon request at (800) 257‑8787.
For more complete information, you may review the Fund’s next prospectus, which is expected to be available by October 1, 2026 at https://www.nuveen.com/en‑us/mutual‑funds/prospectuses or upon request at (800) 257‑8787.
This report describes changes to the Fund that occurred during the reporting period.
What were the Fund costs for the last year? (based on a hypothetical $10,000 investment)
| Cost of a $10,000 investment | Costs paid as a percentage of $10,000 investment* | |||
| Class I Shares |
$13 | 0.12% | ||
| * | The Fund’s ratios exclude the expenses of Underlying Funds that are exchange-traded funds, include the expenses of all other Underlying Funds, and exclude the income of all Underlying Funds. Annualized for a period less than one year. |
How did the Fund perform last year? What affected the Fund’s performance?
| Performance Highlights The Nuveen Lifecycle Index 2035 Fund returned 21.35% for Class I Shares at net asset value (NAV) for the 12 months ended May 31, 2026. The Fund performed in line with the Lifecycle Index 2035 Fund Composite Index, which returned 21.49%. The Fund’s Composite Index consisted of: 41.9% Russell 3000® Index; 22.6% MSCI EAFE + Emerging Markets Index; 22.6% Bloomberg U.S. Aggregate Bond Index; 5.6% Bloomberg Global Aggregate ex‑USD Index (Hedged); 2.5% ICE BofA BB‑B U.S. Cash Pay High Yield Constrained Index; 2.4% Bloomberg U.S. 1-3 Year Government/Credit Bond Index; and 2.4% Bloomberg U.S. Treasury Inflation Protected Securities (TIPS) 1‑10 Year Index. Top contributors to absolute performance • Underlying equity and fixed income funds advanced for the period. U.S. and international equity funds recorded double-digit gains and contributed most. Top detractors from absolute performance • Management fees and other expenses incurred by the Fund. |
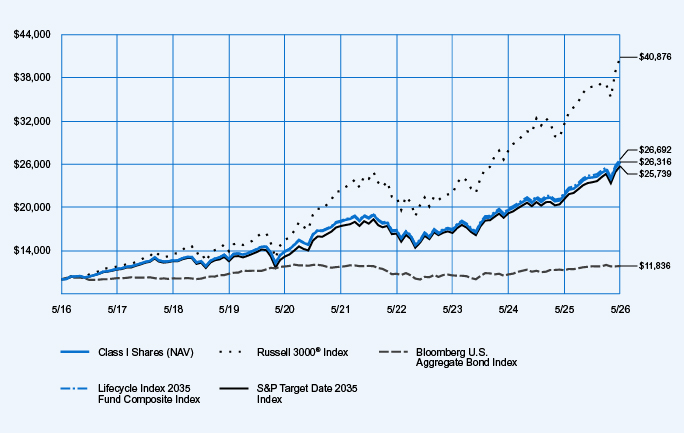
Average Annual Total Returns
| 1-Year | 5-Year | 10-Year | ||||||||||
| Class I Shares at NAV |
21.35 | % | 7.88 | % | 10.16 | % | ||||||
| Russell 3000® Index |
29.45 | % | 12.92 | % | 15.12 | % | ||||||
| Bloomberg U.S. Aggregate Bond Index |
5.13 | % | 0.17 | % | 1.70 | % | ||||||
| Lifecycle Index 2035 Fund Composite Index |
21.49 | % | 8.03 | % | 10.32 | % | ||||||
| S&P Target Date 2035 Index |
21.69 | % | 8.14 | % | 9.92 | % | ||||||
Fund Statistics (as of May 31, 2026)
| Fund net assets |
$ | 10,791,558,776 | ||
| Total number of portfolio holdings |
9 | |||
| Portfolio turnover (%) |
22% | |||
| Total management fees paid for the year |
$ | 15,713,135 | ||
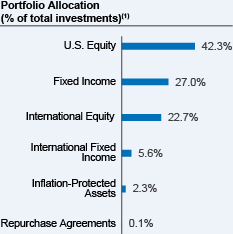 |
| (1) | Affiliated investment companies (Underlying Funds), except for repurchase agreements, where applicable. |
How has the Fund changed?
Portfolio manager update: Effective October 1, 2025, Jeff Sun, CFA was added as a portfolio manager of the Fund.
For more complete information, you may review the Fund’s next prospectus, which is expected to be available by October 1, 2026 at https://www.nuveen.com/en‑us/mutual‑funds/prospectuses or upon request at (800) 257‑8787.
For more complete information, you may review the Fund’s next prospectus, which is expected to be available by October 1, 2026 at https://www.nuveen.com/en‑us/mutual‑funds/prospectuses or upon request at (800) 257‑8787.
This report describes changes to the Fund that occurred during the reporting period.
What were the Fund costs for the last year? (based on a hypothetical $10,000 investment)
| Cost of a $10,000 investment | Costs paid as a percentage of $10,000 investment* | |||
| Premier Class Shares |
$28 | 0.25% | ||
| * | The Fund’s ratios exclude the expenses of Underlying Funds that are exchange-traded funds, include the expenses of all other Underlying Funds, and exclude the income of all Underlying Funds. Annualized for a period less than one year. |
How did the Fund perform last year? What affected the Fund’s performance?
| Performance Highlights The Nuveen Lifecycle Index 2035 Fund returned 21.14% for Premier Class Shares at net asset value (NAV) for the 12 months ended May 31, 2026. The Fund underperformed the Lifecycle Index 2035 Fund Composite Index, which returned 21.49%. The Fund’s Composite Index consisted of: 41.9% Russell 3000® Index; 22.6% MSCI EAFE + Emerging Markets Index; 22.6% Bloomberg U.S. Aggregate Bond Index; 5.6% Bloomberg Global Aggregate ex‑USD Index (Hedged); 2.5% ICE BofA BB‑B U.S. Cash Pay High Yield Constrained Index; 2.4% Bloomberg U.S. 1-3 Year Government/Credit Bond Index; and 2.4% Bloomberg U.S. Treasury Inflation Protected Securities (TIPS) 1‑10 Year Index. Top contributors to absolute performance • Underlying equity and fixed income funds advanced for the period. U.S. and international equity funds recorded double-digit gains and contributed most. Top detractors from absolute performance • Management fees and other expenses incurred by the Fund. |
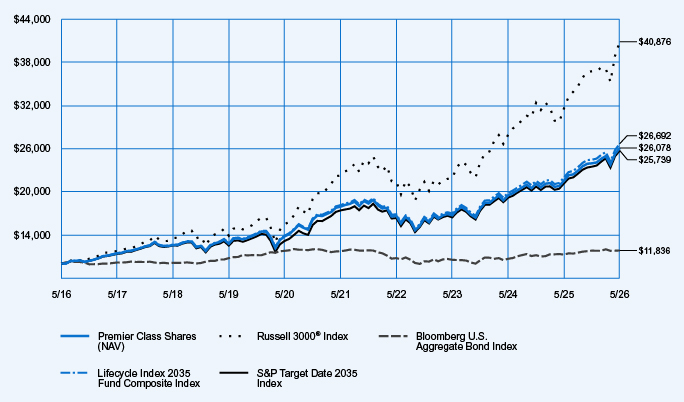
Average Annual Total Returns
| 1-Year | 5-Year | 10-Year | ||||||||||
| Premier Class Shares at NAV |
21.14 | % | 7.78 | % | 10.06 | % | ||||||
| Russell 3000® Index |
29.45 | % | 12.92 | % | 15.12 | % | ||||||
| Bloomberg U.S. Aggregate Bond Index |
5.13 | % | 0.17 | % | 1.70 | % | ||||||
| Lifecycle Index 2035 Fund Composite Index |
21.49 | % | 8.03 | % | 10.32 | % | ||||||
| S&P Target Date 2035 Index |
21.69 | % | 8.14 | % | 9.92 | % | ||||||
Fund Statistics (as of May 31, 2026)
| Fund net assets |
$ | 10,791,558,776 | ||
| Total number of portfolio holdings |
9 | |||
| Portfolio turnover (%) |
22% | |||
| Total management fees paid for the year |
$ | 15,713,135 | ||
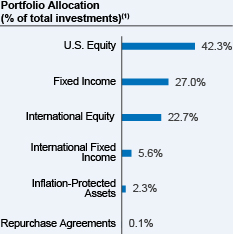 |
| (1) | Affiliated investment companies (Underlying Funds), except for repurchase agreements, where applicable. |
How has the Fund changed?
Portfolio manager update: Effective October 1, 2025, Jeff Sun, CFA was added as a portfolio manager of the Fund.
For more complete information, you may review the Fund’s next prospectus, which is expected to be available by October 1, 2026 at https://www.nuveen.com/en‑us/mutual‑funds/prospectuses or upon request at (800) 257‑8787.
For more complete information, you may review the Fund’s next prospectus, which is expected to be available by October 1, 2026 at https://www.nuveen.com/en‑us/mutual‑funds/prospectuses or upon request at (800) 257‑8787.
This report describes changes to the Fund that occurred during the reporting period.
What were the Fund costs for the last year? (based on a hypothetical $10,000 investment)
| Cost of a $10,000 investment | Costs paid as a percentage of $10,000 investment* | |||
| Class R6 Shares |
$11 | 0.10% | ||
| * | The Fund’s ratios exclude the expenses of Underlying Funds that are exchange-traded funds, include the expenses of all other Underlying Funds, and exclude the income of all Underlying Funds. Annualized for a period less than one year. |
How did the Fund perform last year? What affected the Fund’s performance?
| Performance Highlights The Nuveen Lifecycle Index 2035 Fund returned 21.36% for Class R6 Shares at net asset value (NAV) for the 12 months ended May 31, 2026. The Fund performed in line with the Lifecycle Index 2035 Fund Composite Index, which returned 21.49%. The Fund’s Composite Index consisted of: 41.9% Russell 3000® Index; 22.6% MSCI EAFE + Emerging Markets Index; 22.6% Bloomberg U.S. Aggregate Bond Index; 5.6% Bloomberg Global Aggregate ex‑USD Index (Hedged); 2.5% ICE BofA BB‑B U.S. Cash Pay High Yield Constrained Index; 2.4% Bloomberg U.S. 1-3 Year Government/Credit Bond Index; and 2.4% Bloomberg U.S. Treasury Inflation Protected Securities (TIPS) 1‑10 Year Index. Top contributors to absolute performance • Underlying equity and fixed income funds advanced for the period. U.S. and international equity funds recorded double-digit gains and contributed most. Top detractors from absolute performance • Management fees and other expenses incurred by the Fund. |
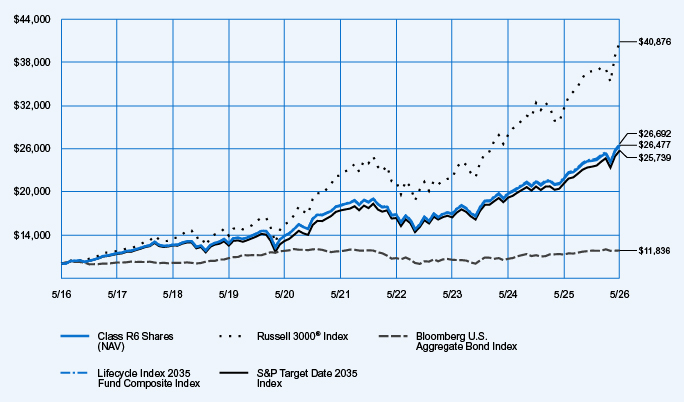
Average Annual Total Returns
| 1-Year | 5-Year | 10-Year | ||||||||||
| Class R6 Shares at NAV |
21.36 | % | 7.96 | % | 10.23 | % | ||||||
| Russell 3000® Index |
29.45 | % | 12.92 | % | 15.12 | % | ||||||
| Bloomberg U.S. Aggregate Bond Index |
5.13 | % | 0.17 | % | 1.70 | % | ||||||
| Lifecycle Index 2035 Fund Composite Index |
21.49 | % | 8.03 | % | 10.32 | % | ||||||
| S&P Target Date 2035 Index |
21.69 | % | 8.14 | % | 9.92 | % | ||||||
Fund Statistics (as of May 31, 2026)
| Fund net assets |
$ | 10,791,558,776 | ||
| Total number of portfolio holdings |
9 | |||
| Portfolio turnover (%) |
22% | |||
| Total management fees paid for the year |
$ | 15,713,135 | ||
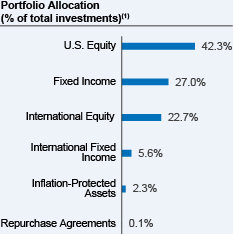 |
| (1) | Affiliated investment companies (Underlying Funds), except for repurchase agreements, where applicable. |
How has the Fund changed?
Portfolio manager update: Effective October 1, 2025, Jeff Sun, CFA was added as a portfolio manager of the Fund.
For more complete information, you may review the Fund’s next prospectus, which is expected to be available by October 1, 2026 at https://www.nuveen.com/en‑us/mutual‑funds/prospectuses or upon request at (800) 257‑8787.
For more complete information, you may review the Fund’s next prospectus, which is expected to be available by October 1, 2026 at https://www.nuveen.com/en‑us/mutual‑funds/prospectuses or upon request at (800) 257‑8787.
This report describes changes to the Fund that occurred during the reporting period.
What were the Fund costs for the last year? (based on a hypothetical $10,000 investment)
| Cost of a $10,000 investment | Costs paid as a percentage of $10,000 investment* | |||
| Retirement Class Shares |
$39 | 0.35% | ||
| * | The Fund’s ratios exclude the expenses of Underlying Funds that are exchange-traded funds, include the expenses of all other Underlying Funds, and exclude the income of all Underlying Funds. Annualized for a period less than one year. |
How did the Fund perform last year? What affected the Fund’s performance?
| Performance Highlights The Nuveen Lifecycle Index 2035 Fund returned 21.04% for Retirement Class Shares at net asset value (NAV) for the 12 months ended May 31, 2026. The Fund underperformed the Lifecycle Index 2035 Fund Composite Index, which returned 21.49%. The Fund’s Composite Index consisted of: 41.9% Russell 3000® Index; 22.6% MSCI EAFE + Emerging Markets Index; 22.6% Bloomberg U.S. Aggregate Bond Index; 5.6% Bloomberg Global Aggregate ex‑USD Index (Hedged); 2.5% ICE BofA BB‑B U.S. Cash Pay High Yield Constrained Index; 2.4% Bloomberg U.S. 1-3 Year Government/Credit Bond Index; and 2.4% Bloomberg U.S. Treasury Inflation Protected Securities (TIPS) 1‑10 Year Index. Top contributors to absolute performance • Underlying equity and fixed income funds advanced for the period. U.S. and international equity funds recorded double-digit gains and contributed most. Top detractors from absolute performance • Management fees and other expenses incurred by the Fund. |
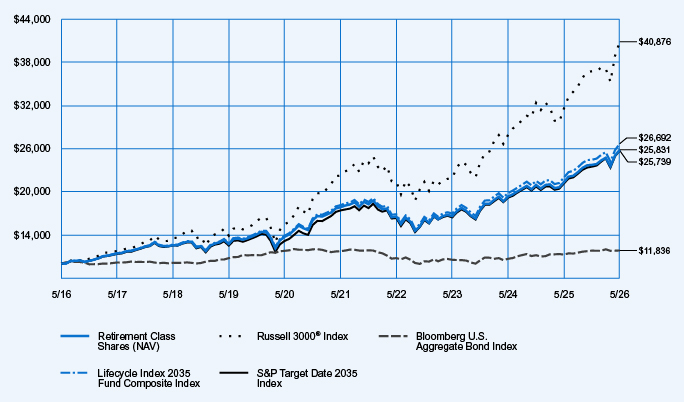
Average Annual Total Returns
| 1-Year | 5-Year | 10-Year | ||||||||||
| Retirement Class Shares at NAV |
21.04 | % | 7.68 | % | 9.95 | % | ||||||
| Russell 3000® Index |
29.45 | % | 12.92 | % | 15.12 | % | ||||||
| Bloomberg U.S. Aggregate Bond Index |
5.13 | % | 0.17 | % | 1.70 | % | ||||||
| Lifecycle Index 2035 Fund Composite Index |
21.49 | % | 8.03 | % | 10.32 | % | ||||||
| S&P Target Date 2035 Index |
21.69 | % | 8.14 | % | 9.92 | % | ||||||
Fund Statistics (as of May 31, 2026)
| Fund net assets |
$ | 10,791,558,776 | ||
| Total number of portfolio holdings |
9 | |||
| Portfolio turnover (%) |
22% | |||
| Total management fees paid for the year |
$ | 15,713,135 | ||
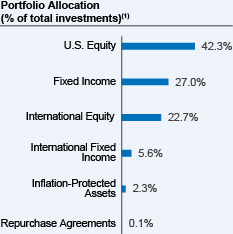 |
| (1) | Affiliated investment companies (Underlying Funds), except for repurchase agreements, where applicable. |
How has the Fund changed?
Portfolio manager update: Effective October 1, 2025, Jeff Sun, CFA was added as a portfolio manager of the Fund.
For more complete information, you may review the Fund’s next prospectus, which is expected to be available by October 1, 2026 at https://www.nuveen.com/en‑us/mutual‑funds/prospectuses or upon request at (800) 257‑8787.
For more complete information, you may review the Fund’s next prospectus, which is expected to be available by October 1, 2026 at https://www.nuveen.com/en‑us/mutual‑funds/prospectuses or upon request at (800) 257‑8787.
This report describes changes to the Fund that occurred during the reporting period.
What were the Fund costs for the last year? (based on a hypothetical $10,000 investment)
| Cost of a $10,000 investment | Costs paid as a percentage of $10,000 investment* | |||
| Retirement Class Shares |
$39 | 0.35% | ||
| * | The Fund’s ratios exclude the expenses of Underlying Funds that are exchange-traded funds, include the expenses of all other Underlying Funds, and exclude the income of all Underlying Funds. Annualized for a period less than one year. |
How did the Fund perform last year? What affected the Fund’s performance?
| Performance Highlights The Nuveen Lifecycle Index 2040 Fund returned 24.09% for Retirement Class Shares at net asset value (NAV) for the 12 months ended May 31, 2026. The Fund underperformed the Lifecycle Index 2040 Fund Composite Index, which returned 24.57%. The Fund’s Composite Index consisted of: 49.3% Russell 3000® Index; 26.5% MSCI EAFE + Emerging Markets Index; 17.4% Bloomberg U.S. Aggregate Bond Index; 4.3% Bloomberg Global Aggregate ex‑USD Index (Hedged); 1.7% ICE BofA BB‑B U.S. Cash Pay High Yield Constrained Index; 0.4% Bloomberg U.S. 1–3 Year Government/Credit Bond Index; and 0.4% Bloomberg U.S. Treasury Inflation Protected Securities (TIPS) 1‑10 Year Index. Top contributors to absolute performance • Underlying equity and fixed income funds advanced for the period. U.S. and international equity funds recorded double-digit gains and contributed most. Top detractors from absolute performance • Management fees and other expenses incurred by the Fund. |
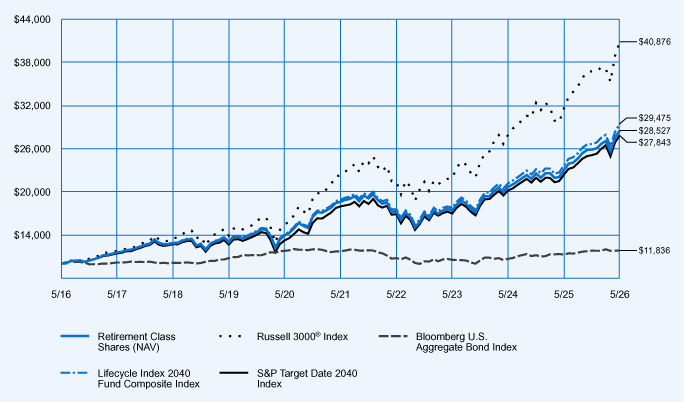
Average Annual Total Returns
| 1-Year | 5-Year | 10-Year | ||||||||||
| Retirement Class Shares at NAV |
24.09 | % | 8.92 | % | 11.05 | % | ||||||
| Russell 3000® Index |
29.45 | % | 12.92 | % | 15.12 | % | ||||||
| Bloomberg U.S. Aggregate Bond Index |
5.13 | % | 0.17 | % | 1.70 | % | ||||||
| Lifecycle Index 2040 Fund Composite Index |
24.57 | % | 9.28 | % | 11.42 | % | ||||||
| S&P Target Date 2040 Index |
24.41 | % | 9.16 | % | 10.78 | % | ||||||
Fund Statistics (as of May 31, 2026)
| Fund net assets |
$ | 11,659,324,952 | ||
| Total number of portfolio holdings |
9 | |||
| Portfolio turnover (%) |
20% | |||
| Total management fees paid for the year |
$ | 16,171,241 | ||
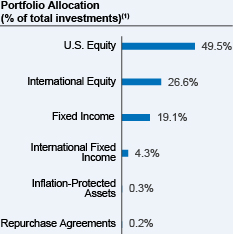 |
| (1) | Affiliated investment companies (Underlying Funds), except for repurchase agreements, where applicable. |
How has the Fund changed?
Portfolio manager update: Effective October 1, 2025, Jeff Sun, CFA was added as a portfolio manager of the Fund.
For more complete information, you may review the Fund’s next prospectus, which is expected to be available by October 1, 2026 at https://www.nuveen.com/en‑us/mutual‑funds/prospectuses or upon request at (800) 257‑8787.
For more complete information, you may review the Fund’s next prospectus, which is expected to be available by October 1, 2026 at https://www.nuveen.com/en‑us/mutual‑funds/prospectuses or upon request at (800) 257‑8787.
This report describes changes to the Fund that occurred during the reporting period.
What were the Fund costs for the last year? (based on a hypothetical $10,000 investment)
| Cost of a $10,000 investment | Costs paid as a percentage of $10,000 investment* | |||
| Class R6 Shares |
$11 | 0.10% | ||
| * | The Fund’s ratios exclude the expenses of Underlying Funds that are exchange-traded funds, include the expenses of all other Underlying Funds, and exclude the income of all Underlying Funds. Annualized for a period less than one year. |
How did the Fund perform last year? What affected the Fund’s performance?
| Performance Highlights The Nuveen Lifecycle Index 2040 Fund returned 24.41% for Class R6 Shares at net asset value (NAV) for the 12 months ended May 31, 2026. The Fund performed in line with the Lifecycle Index 2040 Fund Composite Index, which returned 24.57%. The Fund’s Composite Index consisted of: 49.3% Russell 3000® Index; 26.5% MSCI EAFE + Emerging Markets Index; 17.4% Bloomberg U.S. Aggregate Bond Index; 4.3% Bloomberg Global Aggregate ex‑USD Index (Hedged); 1.7% ICE BofA BB‑B U.S. Cash Pay High Yield Constrained Index; 0.4% Bloomberg U.S. 1–3 Year Government/Credit Bond Index; and 0.4% Bloomberg U.S. Treasury Inflation Protected Securities (TIPS) 1‑10 Year Index. Top contributors to absolute performance • Underlying equity and fixed income funds advanced for the period. U.S. and international equity funds recorded double-digit gains and contributed most. Top detractors from absolute performance • Management fees and other expenses incurred by the Fund. |
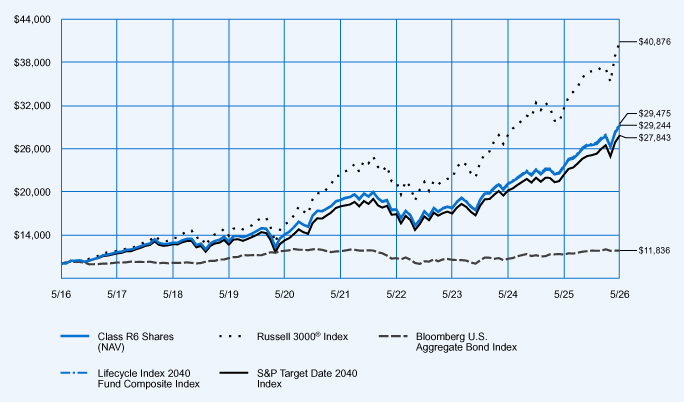
Average Annual Total Returns
| 1-Year | 5-Year | 10-Year | ||||||||||
| Class R6 Shares at NAV |
24.41 | % | 9.19 | % | 11.33 | % | ||||||
| Russell 3000® Index |
29.45 | % | 12.92 | % | 15.12 | % | ||||||
| Bloomberg U.S. Aggregate Bond Index |
5.13 | % | 0.17 | % | 1.70 | % | ||||||
| Lifecycle Index 2040 Fund Composite Index |
24.57 | % | 9.28 | % | 11.42 | % | ||||||
| S&P Target Date 2040 Index |
24.41 | % | 9.16 | % | 10.78 | % | ||||||
Fund Statistics (as of May 31, 2026)
| Fund net assets |
$ | 11,659,324,952 | ||
| Total number of portfolio holdings |
9 | |||
| Portfolio turnover (%) |
20% | |||
| Total management fees paid for the year |
$ | 16,171,241 | ||
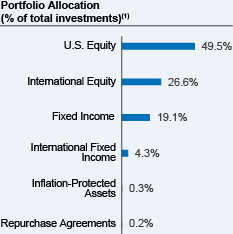 |
| (1) | Affiliated investment companies (Underlying Funds), except for repurchase agreements, where applicable. |
How has the Fund changed?
Portfolio manager update: Effective October 1, 2025, Jeff Sun, CFA was added as a portfolio manager of the Fund.
For more complete information, you may review the Fund’s next prospectus, which is expected to be available by October 1, 2026 at https://www.nuveen.com/en‑us/mutual‑funds/prospectuses or upon request at (800) 257‑8787.
For more complete information, you may review the Fund’s next prospectus, which is expected to be available by October 1, 2026 at https://www.nuveen.com/en‑us/mutual‑funds/prospectuses or upon request at (800) 257‑8787.
This report describes changes to the Fund that occurred during the reporting period.
What were the Fund costs for the last year? (based on a hypothetical $10,000 investment)
| Cost of a $10,000 investment | Costs paid as a percentage of $10,000 investment* | |||
| Premier Class Shares |
$28 | 0.25% | ||
| * | The Fund’s ratios exclude the expenses of Underlying Funds that are exchange-traded funds, include the expenses of all other Underlying Funds, and exclude the income of all Underlying Funds. Annualized for a period less than one year. |
How did the Fund perform last year? What affected the Fund’s performance?
| Performance Highlights The Nuveen Lifecycle Index 2040 Fund returned 24.23% for Premier Class Shares at net asset value (NAV) for the 12 months ended May 31, 2026. The Fund underperformed the Lifecycle Index 2040 Fund Composite Index, which returned 24.57%. The Fund’s Composite Index consisted of: 49.3% Russell 3000® Index; 26.5% MSCI EAFE + Emerging Markets Index; 17.4% Bloomberg U.S. Aggregate Bond Index; 4.3% Bloomberg Global Aggregate ex‑USD Index (Hedged); 1.7% ICE BofA BB‑B U.S. Cash Pay High Yield Constrained Index; 0.4% Bloomberg U.S. 1-3 Year Government/Credit Bond Index; and 0.4% Bloomberg U.S. Treasury Inflation Protected Securities (TIPS) 1‑10 Year Index. Top contributors to absolute performance • Underlying equity and fixed income funds advanced for the period. U.S. and international equity funds recorded double-digit gains and contributed most. Top detractors from absolute performance • Management fees and other expenses incurred by the Fund. |
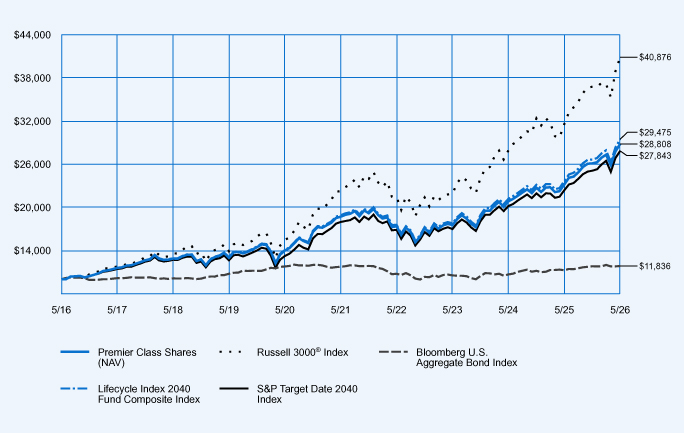
Average Annual Total Returns
| 1-Year | 5-Year | 10-Year | ||||||||||
| Premier Class Shares at NAV |
24.23 | % | 9.02 | % | 11.16 | % | ||||||
| Russell 3000® Index |
29.45 | % | 12.92 | % | 15.12 | % | ||||||
| Bloomberg U.S. Aggregate Bond Index |
5.13 | % | 0.17 | % | 1.70 | % | ||||||
| Lifecycle Index 2040 Fund Composite Index |
24.57 | % | 9.28 | % | 11.42 | % | ||||||
| S&P Target Date 2040 Index |
24.41 | % | 9.16 | % | 10.78 | % | ||||||
Fund Statistics (as of May 31, 2026)
| Fund net assets |
$ | 11,659,324,952 | ||
| Total number of portfolio holdings |
9 | |||
| Portfolio turnover (%) |
20% | |||
| Total management fees paid for the year |
$ | 16,171,241 | ||
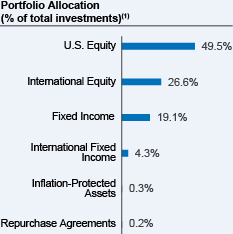 |
| (1) | Affiliated investment companies (Underlying Funds), except for repurchase agreements, where applicable. |
How has the Fund changed?
Portfolio manager update: Effective October 1, 2025, Jeff Sun, CFA was added as a portfolio manager of the Fund.
For more complete information, you may review the Fund’s next prospectus, which is expected to be available by October 1, 2026 at https://www.nuveen.com/en‑us/mutual‑funds/prospectuses or upon request at (800) 257‑8787.
For more complete information, you may review the Fund’s next prospectus, which is expected to be available by October 1, 2026 at https://www.nuveen.com/en‑us/mutual‑funds/prospectuses or upon request at (800) 257‑8787.
This report describes changes to the Fund that occurred during the reporting period.
What were the Fund costs for the last year? (based on a hypothetical $10,000 investment)
| Cost of a $10,000 investment | Costs paid as a percentage of $10,000 investment* | |||
| Class I Shares |
$13 | 0.12% | ||
| * | The Fund’s ratios exclude the expenses of Underlying Funds that are exchange-traded funds, include the expenses of all other Underlying Funds, and exclude the income of all Underlying Funds. Annualized for a period less than one year. |
How did the Fund perform last year? What affected the Fund’s performance?
| Performance Highlights The Nuveen Lifecycle Index 2040 Fund returned 24.35% for Class I Shares at net asset value (NAV) for the 12 months ended May 31, 2026. The Fund performed in line with the Lifecycle Index 2040 Fund Composite Index, which returned 24.57%. The Fund’s Composite Index consisted of: 49.3% Russell 3000® Index; 26.5% MSCI EAFE + Emerging Markets Index; 17.4% Bloomberg U.S. Aggregate Bond Index; 4.3% Bloomberg Global Aggregate ex‑USD Index (Hedged); 1.7% ICE BofA BB‑B U.S. Cash Pay High Yield Constrained Index; 0.4% Bloomberg U.S. 1-3 Year Government/Credit Bond Index; and 0.4% Bloomberg U.S. Treasury Inflation Protected Securities (TIPS) 1‑10 Year Index. Top contributors to absolute performance • Underlying equity and fixed income funds advanced for the period. U.S. and international equity funds recorded double-digit gains and contributed most. Top detractors from absolute performance • Management fees and other expenses incurred by the Fund. |
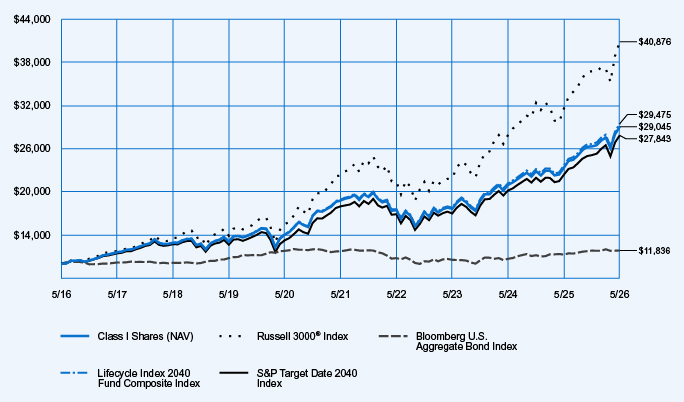
Average Annual Total Returns
| 1-Year | 5-Year | 10-Year | ||||||||||
| Class I Shares at NAV |
24.35 | % | 9.12 | % | 11.25 | % | ||||||
| Russell 3000® Index |
29.45 | % | 12.92 | % | 15.12 | % | ||||||
| Bloomberg U.S. Aggregate Bond Index |
5.13 | % | 0.17 | % | 1.70 | % | ||||||
| Lifecycle Index 2040 Fund Composite Index |
24.57 | % | 9.28 | % | 11.42 | % | ||||||
| S&P Target Date 2040 Index |
24.41 | % | 9.16 | % | 10.78 | % | ||||||
Fund Statistics (as of May 31, 2026)
| Fund net assets |
$ | 11,659,324,952 | ||
| Total number of portfolio holdings |
9 | |||
| Portfolio turnover (%) |
20% | |||
| Total management fees paid for the year |
$ | 16,171,241 | ||
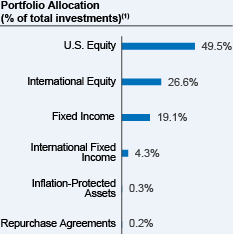 |
| (1) | Affiliated investment companies (Underlying Funds), except for repurchase agreements, where applicable. |
How has the Fund changed?
Portfolio manager update: Effective October 1, 2025, Jeff Sun, CFA was added as a portfolio manager of the Fund.
For more complete information, you may review the Fund’s next prospectus, which is expected to be available by October 1, 2026 at https://www.nuveen.com/en‑us/mutual‑funds/prospectuses or upon request at (800) 257‑8787.
For more complete information, you may review the Fund’s next prospectus, which is expected to be available by October 1, 2026 at https://www.nuveen.com/en‑us/mutual‑funds/prospectuses or upon request at (800) 257‑8787.
This report describes changes to the Fund that occurred during the reporting period.
What were the Fund costs for the last year? (based on a hypothetical $10,000 investment)
| Cost of a $10,000 investment | Costs paid as a percentage of $10,000 investment* | |||
| Class I Shares |
$14 | 0.12% | ||
| * | The Fund’s ratios exclude the expenses of Underlying Funds that are exchange-traded funds, include the expenses of all other Underlying Funds, and exclude the income of all Underlying Funds. Annualized for a period less than one year. |
How did the Fund perform last year? What affected the Fund’s performance?
| Performance Highlights The Nuveen Lifecycle Index 2045 Fund returned 26.57% for Class I Shares at net asset value (NAV) for the 12 months ended May 31, 2026. The Fund performed in line with the Lifecycle Index 2045 Fund Composite Index, which returned 26.78%. The Fund’s Composite Index consisted of: 55.0% Russell 3000® Index; 29.6% MSCI EAFE + Emerging Markets Index; 11.6% Bloomberg U.S. Aggregate Bond Index; 2.9% Bloomberg Global Aggregate ex‑USD Index (Hedged); and 0.9% ICE BofA BB‑B U.S. Cash Pay High Yield Constrained. Top contributors to absolute performance • Underlying equity and fixed income funds advanced for the period. U.S. and international equity funds recorded double-digit gains and contributed most. Top detractors from absolute performance • Management fees and other expenses incurred by the Fund. |
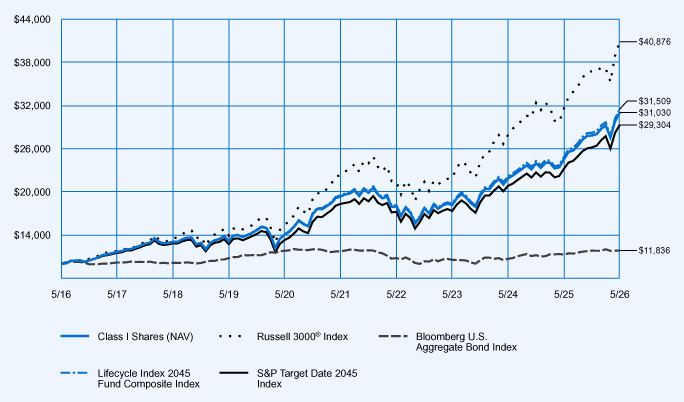
Average Annual Total Returns
| 1-Year | 5-Year | 10-Year | ||||||||||
| Class I Shares at NAV |
26.57 | % | 9.92 | % | 11.99 | % | ||||||
| Russell 3000® Index |
29.45 | % | 12.92 | % | 15.12 | % | ||||||
| Bloomberg U.S. Aggregate Bond Index |
5.13 | % | 0.17 | % | 1.70 | % | ||||||
| Lifecycle Index 2045 Fund Composite Index |
26.78 | % | 10.08 | % | 12.16 | % | ||||||
| S&P Target Date 2045 Index |
26.31 | % | 9.86 | % | 11.35 | % | ||||||
Fund Statistics (as of May 31, 2026)
| Fund net assets |
$ | 10,315,533,037 | ||
| Total number of portfolio holdings |
7 | |||
| Portfolio turnover (%) |
21% | |||
| Total management fees paid for the year |
$ | 14,112,459 | ||
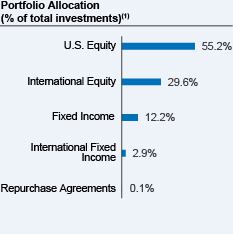 |
| (1) | Affiliated investment companies (Underlying Funds), except for repurchase agreements, where applicable. |
How has the Fund changed?
Portfolio manager update: Effective October 1, 2025, Jeff Sun, CFA was added as a portfolio manager of the Fund.
For more complete information, you may review the Fund’s next prospectus, which is expected to be available by October 1, 2026 at https://www.nuveen.com/en‑us/mutual‑funds/prospectuses or upon request at (800) 257‑8787.
For more complete information, you may review the Fund’s next prospectus, which is expected to be available by October 1, 2026 at https://www.nuveen.com/en‑us/mutual‑funds/prospectuses or upon request at (800) 257‑8787.
This report describes changes to the Fund that occurred during the reporting period.
What were the Fund costs for the last year? (based on a hypothetical $10,000 investment)
| Cost of a $10,000 investment | Costs paid as a percentage of $10,000 investment* | |||
| Premier Class Shares |
$28 | 0.25% | ||
| * | The Fund’s ratios exclude the expenses of Underlying Funds that are exchange-traded funds, include the expenses of all other Underlying Funds, and exclude the income of all Underlying Funds. Annualized for a period less than one year. |
How did the Fund perform last year? What affected the Fund’s performance?
| Performance Highlights The Nuveen Lifecycle Index 2045 Fund returned 26.42% for Premier Class Shares at net asset value (NAV) for the 12 months ended May 31, 2026. The Fund underperformed the Lifecycle Index 2045 Fund Composite Index, which returned 26.78%. The Fund’s Composite Index consisted of: 55.0% Russell 3000® Index; 29.6% MSCI EAFE + Emerging Markets Index; 11.6% Bloomberg U.S. Aggregate Bond Index; 2.9% Bloomberg Global Aggregate ex‑USD Index (Hedged); and 0.9% ICE BofA BB‑B U.S. Cash Pay High Yield Constrained. Top contributors to absolute performance • Underlying equity and fixed income funds advanced for the period. U.S. and international equity funds recorded double-digit gains and contributed most. Top detractors from absolute performance • Management fees and other expenses incurred by the Fund. |
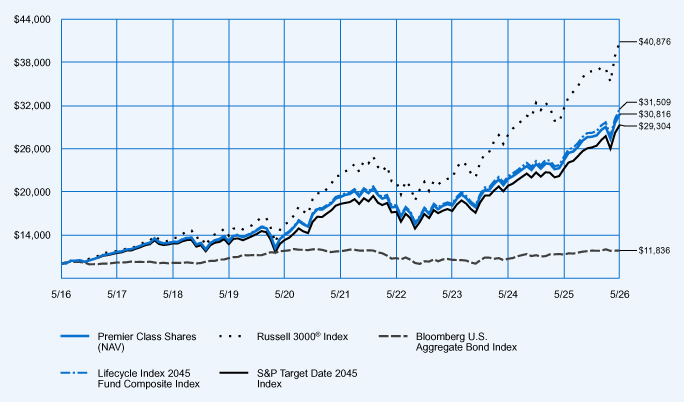
Average Annual Total Returns
| 1-Year | 5-Year | 10-Year | ||||||||||
| Premier Class Shares at NAV |
26.42 | % | 9.84 | % | 11.91 | % | ||||||
| Russell 3000® Index |
29.45 | % | 12.92 | % | 15.12 | % | ||||||
| Bloomberg U.S. Aggregate Bond Index |
5.13 | % | 0.17 | % | 1.70 | % | ||||||
| Lifecycle Index 2045 Fund Composite Index |
26.78 | % | 10.08 | % | 12.16 | % | ||||||
| S&P Target Date 2045 Index |
26.31 | % | 9.86 | % | 11.35 | % | ||||||
Fund Statistics (as of May 31, 2026)
| Fund net assets |
$ | 10,315,533,037 | ||
| Total number of portfolio holdings |
7 | |||
| Portfolio turnover (%) |
21% | |||
| Total management fees paid for the year |
$ | 14,112,459 | ||
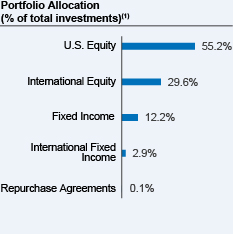 |
| (1) | Affiliated investment companies (Underlying Funds), except for repurchase agreements, where applicable. |
How has the Fund changed?
Portfolio manager update: Effective October 1, 2025, Jeff Sun, CFA was added as a portfolio manager of the Fund.
For more complete information, you may review the Fund’s next prospectus, which is expected to be available by October 1, 2026 at https://www.nuveen.com/en‑us/mutual‑funds/prospectuses or upon request at (800) 257‑8787.
For more complete information, you may review the Fund’s next prospectus, which is expected to be available by October 1, 2026 at https://www.nuveen.com/en‑us/mutual‑funds/prospectuses or upon request at (800) 257‑8787.
This report describes changes to the Fund that occurred during the reporting period.
What were the Fund costs for the last year? (based on a hypothetical $10,000 investment)
| Cost of a $10,000 investment | Costs paid as a percentage of $10,000 investment* | |||
| Class R6 Shares |
$11 | 0.10% | ||
| * | The Fund’s ratios exclude the expenses of Underlying Funds that are exchange-traded funds, include the expenses of all other Underlying Funds, and exclude the income of all Underlying Funds. Annualized for a period less than one year. |
How did the Fund perform last year? What affected the Fund’s performance?
| Performance Highlights The Nuveen Lifecycle Index 2045 Fund returned 26.63% for Class R6 Shares at net asset value (NAV) for the 12 months ended May 31, 2026. The Fund performed in line with the Lifecycle Index 2045 Fund Composite Index, which returned 26.78%. The Fund’s Composite Index consisted of: 55.0% Russell 3000® Index; 29.6% MSCI EAFE + Emerging Markets Index; 11.6% Bloomberg U.S. Aggregate Bond Index; 2.9% Bloomberg Global Aggregate ex‑USD Index (Hedged); and 0.9% ICE BofA BB‑B U.S. Cash Pay High Yield Constrained. Top contributors to absolute performance • Underlying equity and fixed income funds advanced for the period. U.S. and international equity funds recorded double‑digit gains and contributed most. Top detractors from absolute performance • Management fees and other expenses incurred by the Fund. |
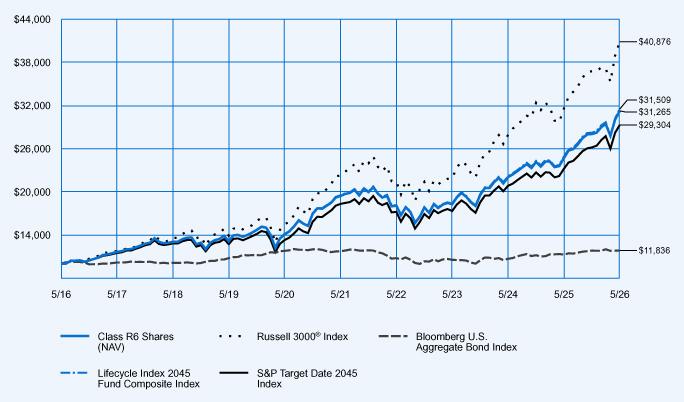
Average Annual Total Returns
| 1-Year | 5-Year | 10-Year | ||||||||||
| Class R6 Shares at NAV |
26.63 | % | 10.00 | % | 12.07 | % | ||||||
| Russell 3000® Index |
29.45 | % | 12.92 | % | 15.12 | % | ||||||
| Bloomberg U.S. Aggregate Bond Index |
5.13 | % | 0.17 | % | 1.70 | % | ||||||
| Lifecycle Index 2045 Fund Composite Index |
26.78 | % | 10.08 | % | 12.16 | % | ||||||
| S&P Target Date 2045 Index |
26.31 | % | 9.86 | % | 11.35 | % | ||||||
Fund Statistics (as of May 31, 2026)
| Fund net assets |
$ | 10,315,533,037 | ||
| Total number of portfolio holdings |
7 | |||
| Portfolio turnover (%) |
21% | |||
| Total management fees paid for the year |
$ | 14,112,459 | ||
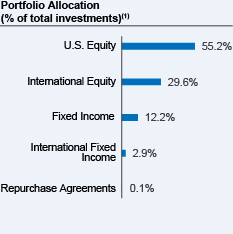 |
| (1) | Affiliated investment companies (Underlying Funds), except for repurchase agreements, where applicable. |
How has the Fund changed?
Portfolio manager update: Effective October 1, 2025, Jeff Sun, CFA was added as a portfolio manager of the Fund.
For more complete information, you may review the Fund’s next prospectus, which is expected to be available by October 1, 2026 at https://www.nuveen.com/en‑us/mutual‑funds/prospectuses or upon request at (800) 257‑8787.
For more complete information, you may review the Fund’s next prospectus, which is expected to be available by October 1, 2026 at https://www.nuveen.com/en‑us/mutual‑funds/prospectuses or upon request at (800) 257‑8787.
This report describes changes to the Fund that occurred during the reporting period.
What were the Fund costs for the last year? (based on a hypothetical $10,000 investment)
| Cost of a $10,000 investment | Costs paid as a percentage of $10,000 investment* | |||
| Retirement Class Shares |
$40 | 0.35% | ||
| * | The Fund’s ratios exclude the expenses of Underlying Funds that are exchange-traded funds, include the expenses of all other Underlying Funds, and exclude the income of all Underlying Funds. Annualized for a period less than one year. |
How did the Fund perform last year? What affected the Fund’s performance?
| Performance Highlights The Nuveen Lifecycle Index 2045 Fund returned 26.30% for Retirement Class Shares at net asset value (NAV) for the 12 months ended May 31, 2026. The Fund underperformed the Lifecycle Index 2045 Fund Composite Index, which returned 26.78%. The Fund’s Composite Index consisted of: 55.0% Russell 3000® Index; 29.6% MSCI EAFE + Emerging Markets Index; 11.6% Bloomberg U.S. Aggregate Bond Index; 2.9% Bloomberg Global Aggregate ex‑USD Index (Hedged); and 0.9% ICE BofA BB‑B U.S. Cash Pay High Yield Constrained. Top contributors to absolute performance • Underlying equity and fixed income funds advanced for the period. U.S. and international equity funds recorded double-digit gains and contributed most. Top detractors from absolute performance • Management fees and other expenses incurred by the Fund. |
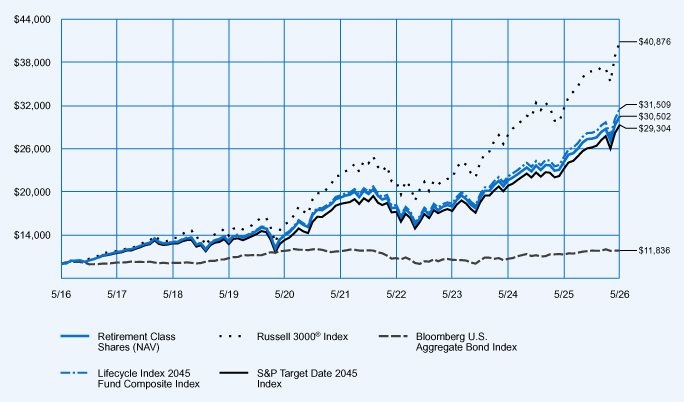
Average Annual Total Returns
| 1-Year | 5-Year | 10-Year | ||||||||||
| Retirement Class Shares at NAV |
26.30 | % | 9.72 | % | 11.80 | % | ||||||
| Russell 3000® Index |
29.45 | % | 12.92 | % | 15.12 | % | ||||||
| Bloomberg U.S. Aggregate Bond Index |
5.13 | % | 0.17 | % | 1.70 | % | ||||||
| Lifecycle Index 2045 Fund Composite Index |
26.78 | % | 10.08 | % | 12.16 | % | ||||||
| S&P Target Date 2045 Index |
26.31 | % | 9.86 | % | 11.35 | % | ||||||
Fund Statistics (as of May 31, 2026)
| Fund net assets |
$ | 10,315,533,037 | ||
| Total number of portfolio holdings |
7 | |||
| Portfolio turnover (%) |
21% | |||
| Total management fees paid for the year |
$ | 14,112,459 | ||
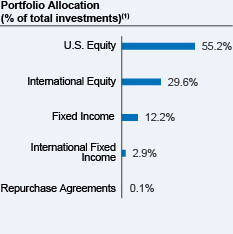 |
| (1) | Affiliated investment companies (Underlying Funds), except for repurchase agreements, where applicable. |
How has the Fund changed?
Portfolio manager update: Effective October 1, 2025, Jeff Sun, CFA was added as a portfolio manager of the Fund.
For more complete information, you may review the Fund’s next prospectus, which is expected to be available by October 1, 2026 at https://www.nuveen.com/en‑us/mutual‑funds/prospectuses or upon request at (800) 257‑8787.
For more complete information, you may review the Fund’s next prospectus, which is expected to be available by October 1, 2026 at https://www.nuveen.com/en‑us/mutual‑funds/prospectuses or upon request at (800) 257‑8787.
This report describes changes to the Fund that occurred during the reporting period.
What were the Fund costs for the last year? (based on a hypothetical $10,000 investment)
| Cost of a $10,000 investment | Costs paid as a percentage of $10,000 investment* | |||
| Retirement Class Shares |
$40 | 0.35% | ||
| * | The Fund’s ratios exclude the expenses of Underlying Funds that are exchange-traded funds, include the expenses of all other Underlying Funds, and exclude the income of all Underlying Funds. Annualized for a period less than one year. |
How did the Fund perform last year? What affected the Fund’s performance?
| Performance Highlights The Nuveen Lifecycle Index 2050 Fund returned 27.46% for Retirement Class Shares at net asset value (NAV) for the 12 months ended May 31, 2026. The Fund underperformed the Lifecycle Index 2050 Fund Composite Index, which returned 27.93%. The Fund’s Composite Index consisted of: 58.0% Russell 3000® Index; 31.3% MSCI EAFE + Emerging Markets Index; 8.5% Bloomberg U.S. Aggregate Bond Index; 2.1% Bloomberg Global Aggregate ex‑USD Index (Hedged); and 0.1% ICE BofA BB‑B U.S. Cash Pay High Yield Constrained. Top contributors to absolute performance • Underlying equity and fixed income funds advanced for the period. U.S. and international equity funds recorded double-digit gains and contributed most. Top detractors from absolute performance • Management fees and other expenses incurred by the Fund. |
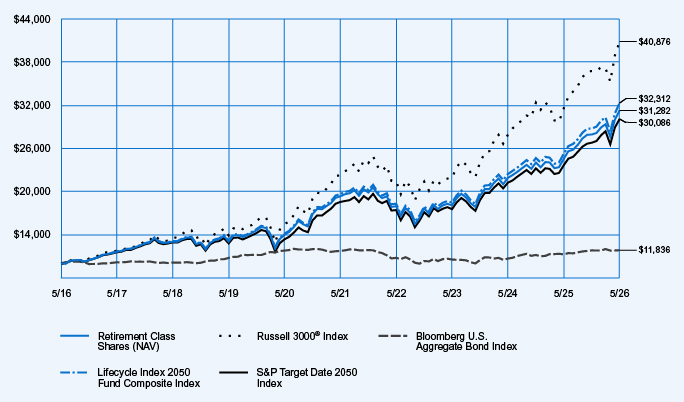
Average Annual Total Returns
| 1-Year | 5-Year | 10-Year | ||||||||||
| Retirement Class Shares at NAV |
27.46 | % | 10.10 | % | 12.08 | % | ||||||
| Russell 3000® Index |
29.45 | % | 12.92 | % | 15.12 | % | ||||||
| Bloomberg U.S. Aggregate Bond Index |
5.13 | % | 0.17 | % | 1.70 | % | ||||||
| Lifecycle Index 2050 Fund Composite Index |
27.93 | % | 10.45 | % | 12.44 | % | ||||||
| S&P Target Date 2050 Index |
27.16 | % | 10.15 | % | 11.64 | % | ||||||
Fund Statistics (as of May 31, 2026)
| Fund net assets |
$ | 8,995,794,286 | ||
| Total number of portfolio holdings |
7 | |||
| Portfolio turnover (%) |
17% | |||
| Total management fees paid for the year |
$ | 12,219,208 | ||
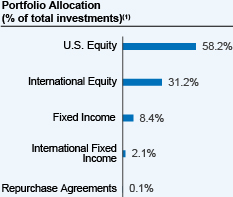 |
| (1) | Affiliated investment companies (Underlying Funds), except for repurchase agreements, where applicable. |
How has the Fund changed?
Portfolio manager update: Effective October 1, 2025, Jeff Sun, CFA was added as a portfolio manager of the Fund.
For more complete information, you may review the Fund’s next prospectus, which is expected to be available by October 1, 2026 at https://www.nuveen.com/en‑us/mutual‑funds/prospectuses or upon request at (800) 257‑8787.
For more complete information, you may review the Fund’s next prospectus, which is expected to be available by October 1, 2026 at https://www.nuveen.com/en‑us/mutual‑funds/prospectuses or upon request at (800) 257‑8787.
This report describes changes to the Fund that occurred during the reporting period.
What were the Fund costs for the last year? (based on a hypothetical $10,000 investment)
| Cost of a $10,000 investment | Costs paid as a percentage of $10,000 investment* | |||
| Class R6 Shares |
$11 | 0.10% | ||
| * | The Fund’s ratios exclude the expenses of Underlying Funds that are exchange-traded funds, include the expenses of all other Underlying Funds, and exclude the income of all Underlying Funds. Annualized for a period less than one year. |
How did the Fund perform last year? What affected the Fund’s performance?
| Performance Highlights The Nuveen Lifecycle Index 2050 Fund returned 27.78% for Class R6 Shares at net asset value (NAV) for the 12 months ended May 31, 2026. The Fund performed in line with the Lifecycle Index 2050 Fund Composite Index, which returned 27.93%. The Fund’s Composite Index consisted of: 58.0% Russell 3000® Index; 31.3% MSCI EAFE + Emerging Markets Index; 8.5% Bloomberg U.S. Aggregate Bond Index; 2.1% Bloomberg Global Aggregate ex‑USD Index (Hedged); and 0.1% ICE BofA BB‑B U.S. Cash Pay High Yield Constrained. Top contributors to absolute performance • Underlying equity and fixed income funds advanced for the period. U.S. and international equity funds recorded double-digit gains and contributed most. Top detractors from absolute performance • Management fees and other expenses incurred by the Fund. |
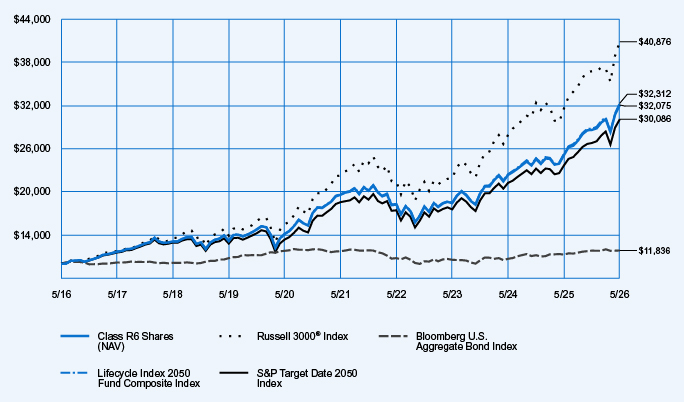
Average Annual Total Returns
| 1-Year | 5-Year | 10-Year | ||||||||||
| Class R6 Shares at NAV |
27.78 | % | 10.38 | % | 12.36 | % | ||||||
| Russell 3000® Index |
29.45 | % | 12.92 | % | 15.12 | % | ||||||
| Bloomberg U.S. Aggregate Bond Index |
5.13 | % | 0.17 | % | 1.70 | % | ||||||
| Lifecycle Index 2050 Fund Composite Index |
27.93 | % | 10.45 | % | 12.44 | % | ||||||
| S&P Target Date 2050 Index |
27.16 | % | 10.15 | % | 11.64 | % | ||||||
Fund Statistics (as of May 31, 2026)
| Fund net assets |
$ | 8,995,794,286 | ||
| Total number of portfolio holdings |
7 | |||
| Portfolio turnover (%) |
17% | |||
| Total management fees paid for the year |
$ | 12,219,208 | ||
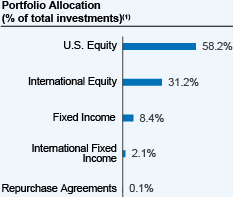 |
| (1) | Affiliated investment companies (Underlying Funds), except for repurchase agreements, where applicable. |
How has the Fund changed?
Portfolio manager update: Effective October 1, 2025, Jeff Sun, CFA was added as a portfolio manager of the Fund.
For more complete information, you may review the Fund’s next prospectus, which is expected to be available by October 1, 2026 at https://www.nuveen.com/en‑us/mutual‑funds/prospectuses or upon request at (800) 257‑8787.
For more complete information, you may review the Fund’s next prospectus, which is expected to be available by October 1, 2026 at https://www.nuveen.com/en‑us/mutual‑funds/prospectuses or upon request at (800) 257‑8787.
This report describes changes to the Fund that occurred during the reporting period.
What were the Fund costs for the last year? (based on a hypothetical $10,000 investment)
| Cost of a $10,000 investment | Costs paid as a percentage of $10,000 investment* | |||
| Premier Class Shares |
$28 | 0.25% | ||
| * | The Fund’s ratios exclude the expenses of Underlying Funds that are exchange-traded funds, include the expenses of all other Underlying Funds, and exclude the income of all Underlying Funds. Annualized for a period less than one year. |
How did the Fund perform last year? What affected the Fund’s performance?
| Performance Highlights The Nuveen Lifecycle Index 2050 Fund returned 27.57% for Premier Class Shares at net asset value (NAV) for the 12 months ended May 31, 2026. The Fund underperformed the Lifecycle Index 2050 Fund Composite Index, which returned 27.93%. The Fund’s Composite Index consisted of: 58.0% Russell 3000® Index; 31.3% MSCI EAFE + Emerging Markets Index; 8.5% Bloomberg U.S. Aggregate Bond Index; 2.1% Bloomberg Global Aggregate ex‑USD Index (Hedged); and 0.1% ICE BofA BB‑B U.S. Cash Pay High Yield Constrained. Top contributors to absolute performance • Underlying equity and fixed income funds advanced for the period. U.S. and international equity funds recorded double-digit gains and contributed most. Top detractors from absolute performance • Management fees and other expenses incurred by the Fund. |
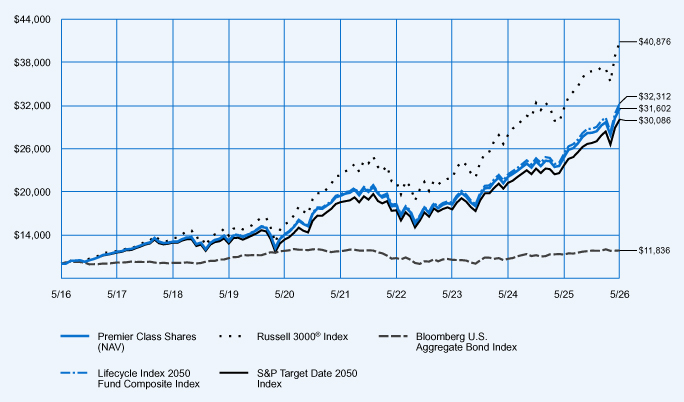
Average Annual Total Returns
| 1-Year | 5-Year | 10-Year | ||||||||||
| Premier Class Shares at NAV |
27.57 | % | 10.21 | % | 12.19 | % | ||||||
| Russell 3000® Index |
29.45 | % | 12.92 | % | 15.12 | % | ||||||
| Bloomberg U.S. Aggregate Bond Index |
5.13 | % | 0.17 | % | 1.70 | % | ||||||
| Lifecycle Index 2050 Fund Composite Index |
27.93 | % | 10.45 | % | 12.44 | % | ||||||
| S&P Target Date 2050 Index |
27.16 | % | 10.15 | % | 11.64 | % | ||||||
Fund Statistics (as of May 31, 2026)
| Fund net assets |
$ | 8,995,794,286 | ||
| Total number of portfolio holdings |
7 | |||
| Portfolio turnover (%) |
17% | |||
| Total management fees paid for the year |
$ | 12,219,208 | ||
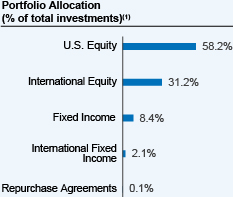 |
| (1) | Affiliated investment companies (Underlying Funds), except for repurchase agreements, where applicable. |
How has the Fund changed?
Portfolio manager update: Effective October 1, 2025, Jeff Sun, CFA was added as a portfolio manager of the Fund.
For more complete information, you may review the Fund’s next prospectus, which is expected to be available by October 1, 2026 at https://www.nuveen.com/en‑us/mutual‑funds/prospectuses or upon request at (800) 257‑8787.
For more complete information, you may review the Fund’s next prospectus, which is expected to be available by October 1, 2026 at https://www.nuveen.com/en‑us/mutual‑funds/prospectuses or upon request at (800) 257‑8787.
This report describes changes to the Fund that occurred during the reporting period.
What were the Fund costs for the last year? (based on a hypothetical $10,000 investment)
| Cost of a $10,000 investment | Costs paid as a percentage of $10,000 investment* | |||
| Class I Shares |
$14 | 0.12% | ||
| * | The Fund’s ratios exclude the expenses of Underlying Funds that are exchange-traded funds, include the expenses of all other Underlying Funds, and exclude the income of all Underlying Funds. Annualized for a period less than one year. |
How did the Fund perform last year? What affected the Fund’s performance?
| Performance Highlights The Nuveen Lifecycle Index 2050 Fund returned 27.72% for Class I Shares at net asset value (NAV) for the 12 months ended May 31, 2026. The Fund performed in line with the Lifecycle Index 2050 Fund Composite Index, which returned 27.93%. The Fund’s Composite Index consisted of: 58.0% Russell 3000® Index; 31.3% MSCI EAFE + Emerging Markets Index; 8.5% Bloomberg U.S. Aggregate Bond Index; 2.1% Bloomberg Global Aggregate ex‑USD Index (Hedged); and 0.1% ICE BofA BB‑B U.S. Cash Pay High Yield Constrained. Top contributors to absolute performance • Underlying equity and fixed income funds advanced for the period. U.S. and international equity funds recorded double‑digit gains and contributed most. Top detractors from absolute performance • Management fees and other expenses incurred by the Fund. |
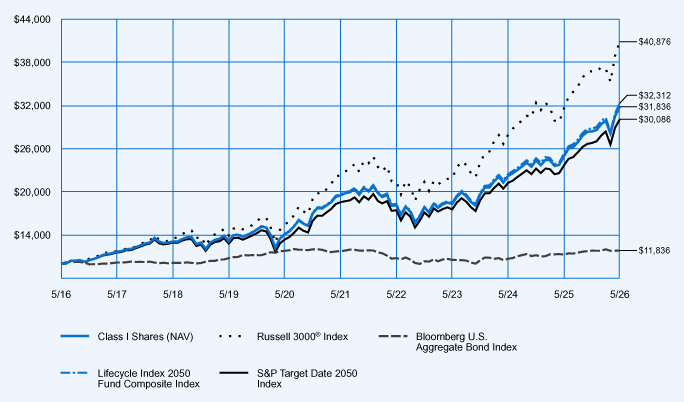
Average Annual Total Returns
| 1-Year | 5-Year | 10-Year | ||||||||||
| Class I Shares at NAV |
27.72 | % | 10.29 | % | 12.28 | % | ||||||
| Russell 3000® Index |
29.45 | % | 12.92 | % | 15.12 | % | ||||||
| Bloomberg U.S. Aggregate Bond Index |
5.13 | % | 0.17 | % | 1.70 | % | ||||||
| Lifecycle Index 2050 Fund Composite Index |
27.93 | % | 10.45 | % | 12.44 | % | ||||||
| S&P Target Date 2050 Index |
27.16 | % | 10.15 | % | 11.64 | % | ||||||
Fund Statistics (as of May 31, 2026)
| Fund net assets |
$ | 8,995,794,286 | ||
| Total number of portfolio holdings |
7 | |||
| Portfolio turnover (%) |
17% | |||
| Total management fees paid for the year |
$ | 12,219,208 | ||
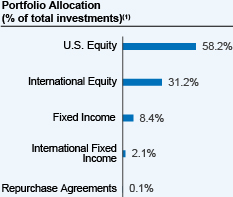 |
| (1) | Affiliated investment companies (Underlying Funds), except for repurchase agreements, where applicable. |
How has the Fund changed?
Portfolio manager update: Effective October 1, 2025, Jeff Sun, CFA was added as a portfolio manager of the Fund.
For more complete information, you may review the Fund’s next prospectus, which is expected to be available by October 1, 2026 at https://www.nuveen.com/en‑us/mutual‑funds/prospectuses or upon request at (800) 257‑8787.
For more complete information, you may review the Fund’s next prospectus, which is expected to be available by October 1, 2026 at https://www.nuveen.com/en‑us/mutual‑funds/prospectuses or upon request at (800) 257‑8787.
This report describes changes to the Fund that occurred during the reporting period.
What were the Fund costs for the last year? (based on a hypothetical $10,000 investment)
| Cost of a $10,000 investment | Costs paid as a percentage of $10,000 investment* | |||
| Class I Shares |
$14 | 0.12% | ||
| * | The Fund’s ratios exclude the expenses of Underlying Funds that are exchange-traded funds, include the expenses of all other Underlying Funds, and exclude the income of all Underlying Funds. Annualized for a period less than one year. |
How did the Fund perform last year? What affected the Fund’s performance?
| Performance Highlights The Nuveen Lifecycle Index 2055 Fund returned 28.12% for Class I Shares at net asset value (NAV) for the 12 months ended May 31, 2026. The Fund performed in line with the Lifecycle Index 2055 Fund Composite Index, which returned 28.33%. The Fund’s Composite Index consisted of: 59.1% Russell 3000® Index; 31.9% MSCI EAFE + Emerging Markets Index; 7.2% Bloomberg U.S. Aggregate Bond Index; and 1.8% Bloomberg Global Aggregate ex‑USD Index (Hedged). Top contributors to absolute performance • Underlying equity and fixed income funds advanced for the period. U.S. and international equity funds recorded double-digit gains and contributed most. Top detractors from absolute performance • Management fees and other expenses incurred by the Fund. |
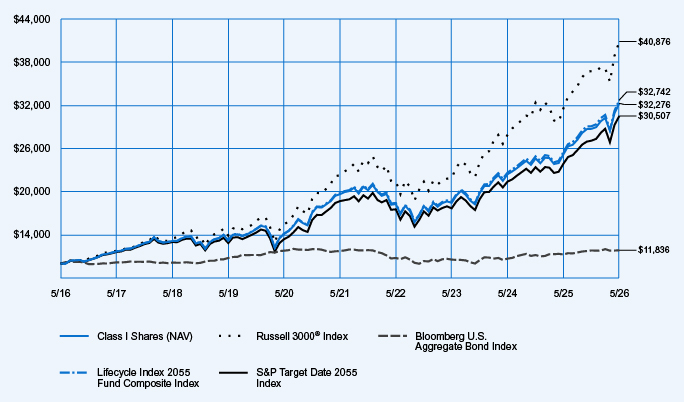
Average Annual Total Returns
| 1-Year | 5-Year | 10-Year | ||||||||||
| Class I Shares at NAV |
28.12 | % | 10.44 | % | 12.43 | % | ||||||
| Russell 3000® Index |
29.45 | % | 12.92 | % | 15.12 | % | ||||||
| Bloomberg U.S. Aggregate Bond Index |
5.13 | % | 0.17 | % | 1.70 | % | ||||||
| Lifecycle Index 2055 Fund Composite Index |
28.33 | % | 10.61 | % | 12.59 | % | ||||||
| S&P Target Date 2055 Index |
27.78 | % | 10.31 | % | 11.80 | % | ||||||
Fund Statistics (as of May 31, 2026)
| Fund net assets |
$ | 5,953,552,576 | ||
| Total number of portfolio holdings |
6 | |||
| Portfolio turnover (%) |
20% | |||
| Total management fees paid for the year |
$ | 7,870,006 | ||
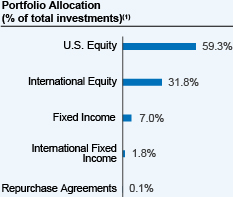 |
| (1) | Affiliated investment companies (Underlying Funds), except for repurchase agreements, where applicable. |
How has the Fund changed?
Portfolio manager update: Effective October 1, 2025, Jeff Sun, CFA was added as a portfolio manager of the Fund.
For more complete information, you may review the Fund’s next prospectus, which is expected to be available by October 1, 2026 at https://www.nuveen.com/en‑us/mutual‑funds/prospectuses or upon request at (800) 257‑8787.
For more complete information, you may review the Fund’s next prospectus, which is expected to be available by October 1, 2026 at https://www.nuveen.com/en‑us/mutual‑funds/prospectuses or upon request at (800) 257‑8787.
This report describes changes to the Fund that occurred during the reporting period.
What were the Fund costs for the last year? (based on a hypothetical $10,000 investment)
| Cost of a $10,000 investment | Costs paid as a percentage of $10,000 investment* | |||
| Premier Class Shares |
$28 | 0.25% | ||
| * | The Fund’s ratios exclude the expenses of Underlying Funds that are exchange-traded funds, include the expenses of all other Underlying Funds, and exclude the income of all Underlying Funds. Annualized for a period less than one year. |
How did the Fund perform last year? What affected the Fund’s performance?
| Performance Highlights The Nuveen Lifecycle Index 2055 Fund returned 27.91% for Premier Class Shares at net asset value (NAV) for the 12 months ended May 31, 2026. The Fund underperformed the Lifecycle Index 2055 Fund Composite Index, which returned 28.33%. The Fund’s Composite Index consisted of: 59.1% Russell 3000® Index; 31.9% MSCI EAFE + Emerging Markets Index; 7.2% Bloomberg U.S. Aggregate Bond Index; and 1.8% Bloomberg Global Aggregate ex‑USD Index (Hedged). Top contributors to absolute performance • Underlying equity and fixed income funds advanced for the period. U.S. and international equity funds recorded double-digit gains and contributed most. Top detractors from absolute performance • Management fees and other expenses incurred by the Fund. |
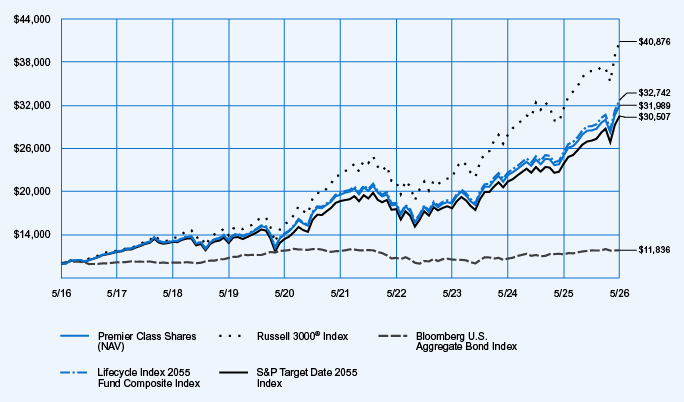
Average Annual Total Returns
| 1-Year | 5-Year | 10-Year | ||||||||||
| Premier Class Shares at NAV |
27.91 | % | 10.36 | % | 12.33 | % | ||||||
| Russell 3000® Index |
29.45 | % | 12.92 | % | 15.12 | % | ||||||
| Bloomberg U.S. Aggregate Bond Index |
5.13 | % | 0.17 | % | 1.70 | % | ||||||
| Lifecycle Index 2055 Fund Composite Index |
28.33 | % | 10.61 | % | 12.59 | % | ||||||
| S&P Target Date 2055 Index |
27.78 | % | 10.31 | % | 11.80 | % | ||||||
Fund Statistics (as of May 31, 2026)
| Fund net assets |
$ | 5,953,552,576 | ||
| Total number of portfolio holdings |
6 | |||
| Portfolio turnover (%) |
20% | |||
| Total management fees paid for the year |
$ | 7,870,006 | ||
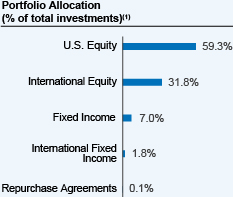 |
| (1) | Affiliated investment companies (Underlying Funds), except for repurchase agreements, where applicable. |
How has the Fund changed?
Portfolio manager update: Effective October 1, 2025, Jeff Sun, CFA was added as a portfolio manager of the Fund.
For more complete information, you may review the Fund’s next prospectus, which is expected to be available by October 1, 2026 at https://www.nuveen.com/en‑us/mutual‑funds/prospectuses or upon request at (800) 257‑8787.
For more complete information, you may review the Fund’s next prospectus, which is expected to be available by October 1, 2026 at https://www.nuveen.com/en‑us/mutual‑funds/prospectuses or upon request at (800) 257‑8787.
This report describes changes to the Fund that occurred during the reporting period.
What were the Fund costs for the last year? (based on a hypothetical $10,000 investment)
| Cost of a $10,000 investment | Costs paid as a percentage of $10,000 investment* | |||
| Class R6 Shares |
$11 | 0.10% | ||
| * | The Fund’s ratios exclude the expenses of Underlying Funds that are exchange-traded funds, include the expenses of all other Underlying Funds, and exclude the income of all Underlying Funds. Annualized for a period less than one year. |
How did the Fund perform last year? What affected the Fund’s performance?
| Performance Highlights The Nuveen Lifecycle Index 2055 Fund returned 28.13% for Class R6 Shares at net asset value (NAV) for the 12 months ended May 31, 2026. The Fund performed in line with the Lifecycle Index 2055 Fund Composite Index, which returned 28.33%. The Fund’s Composite Index consisted of: 59.1% Russell 3000® Index; 31.9% MSCI EAFE + Emerging Markets Index; 7.2% Bloomberg U.S. Aggregate Bond Index; and 1.8% Bloomberg Global Aggregate ex‑USD Index (Hedged). Top contributors to absolute performance • Underlying equity and fixed income funds advanced for the period. U.S. and international equity funds recorded double-digit gains and contributed most. Top detractors from absolute performance • Management fees and other expenses incurred by the Fund. |
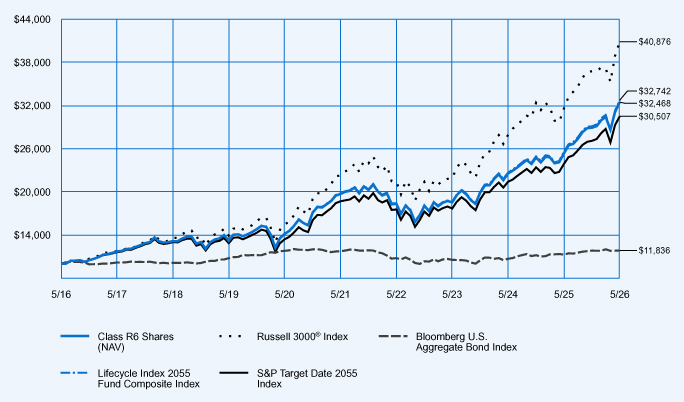
Average Annual Total Returns
| 1-Year | 5-Year | 10-Year | ||||||||||
| Class R6 Shares at NAV |
28.13 | % | 10.51 | % | 12.50 | % | ||||||
| Russell 3000® Index |
29.45 | % | 12.92 | % | 15.12 | % | ||||||
| Bloomberg U.S. Aggregate Bond Index |
5.13 | % | 0.17 | % | 1.70 | % | ||||||
| Lifecycle Index 2055 Fund Composite Index |
28.33 | % | 10.61 | % | 12.59 | % | ||||||
| S&P Target Date 2055 Index |
27.78 | % | 10.31 | % | 11.80 | % | ||||||
Fund Statistics (as of May 31, 2026)
| Fund net assets |
$ | 5,953,552,576 | ||
| Total number of portfolio holdings |
6 | |||
| Portfolio turnover (%) |
20% | |||
| Total management fees paid for the year |
$ | 7,870,006 | ||
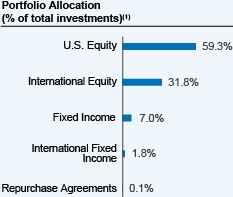 |
| (1) | Affiliated investment companies (Underlying Funds), except for repurchase agreements, where applicable. |
How has the Fund changed?
Portfolio manager update: Effective October 1, 2025, Jeff Sun, CFA was added as a portfolio manager of the Fund.
For more complete information, you may review the Fund’s next prospectus, which is expected to be available by October 1, 2026 at https://www.nuveen.com/en‑us/mutual‑funds/prospectuses or upon request at (800) 257‑8787.
For more complete information, you may review the Fund’s next prospectus, which is expected to be available by October 1, 2026 at https://www.nuveen.com/en‑us/mutual‑funds/prospectuses or upon request at (800) 257‑8787.
This report describes changes to the Fund that occurred during the reporting period.
What were the Fund costs for the last year? (based on a hypothetical $10,000 investment)
| Cost of a $10,000 investment | Costs paid as a percentage of $10,000 investment* | |||
| Retirement Class Shares |
$40 | 0.35% | ||
| * | The Fund’s ratios exclude the expenses of Underlying Funds that are exchange-traded funds, include the expenses of all other Underlying Funds, and exclude the income of all Underlying Funds. Annualized for a period less than one year. |
How did the Fund perform last year? What affected the Fund’s performance?
| Performance Highlights The Nuveen Lifecycle Index 2055 Fund returned 27.83% for Retirement Class Shares at net asset value (NAV) for the 12 months ended May 31, 2026. The Fund underperformed the Lifecycle Index 2055 Fund Composite Index, which returned 28.33%. The Fund’s Composite Index consisted of: 59.1% Russell 3000® Index; 31.9% MSCI EAFE + Emerging Markets Index; 7.2% Bloomberg U.S. Aggregate Bond Index; and 1.8% Bloomberg Global Aggregate ex‑USD Index (Hedged). Top contributors to absolute performance • Underlying equity and fixed income funds advanced for the period. U.S. and international equity funds recorded double-digit gains and contributed most. Top detractors from absolute performance • Management fees and other expenses incurred by the Fund. |
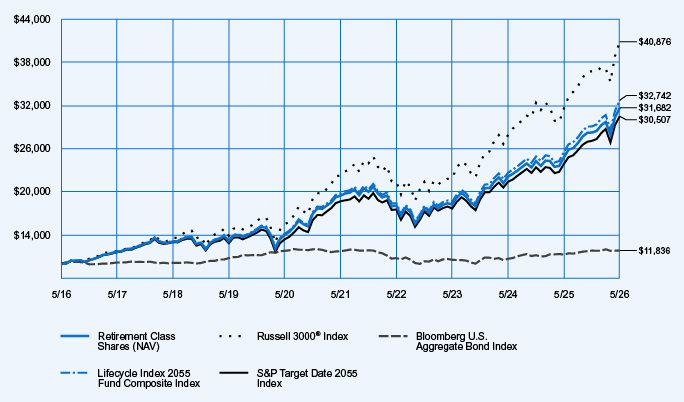
Average Annual Total Returns
| 1-Year | 5-Year | 10-Year | ||||||||||
| Retirement Class Shares at NAV |
27.83 | % | 10.24 | % | 12.22 | % | ||||||
| Russell 3000® Index |
29.45 | % | 12.92 | % | 15.12 | % | ||||||
| Bloomberg U.S. Aggregate Bond Index |
5.13 | % | 0.17 | % | 1.70 | % | ||||||
| Lifecycle Index 2055 Fund Composite Index |
28.33 | % | 10.61 | % | 12.59 | % | ||||||
| S&P Target Date 2055 Index |
27.78 | % | 10.31 | % | 11.80 | % | ||||||
Fund Statistics (as of May 31, 2026)
| Fund net assets |
$ | 5,953,552,576 | ||
| Total number of portfolio holdings |
6 | |||
| Portfolio turnover (%) |
20% | |||
| Total management fees paid for the year |
$ | 7,870,006 | ||
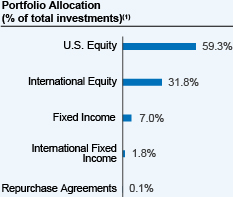 |
| (1) | Affiliated investment companies (Underlying Funds), except for repurchase agreements, where applicable. |
How has the Fund changed?
Portfolio manager update: Effective October 1, 2025, Jeff Sun, CFA was added as a portfolio manager of the Fund.
For more complete information, you may review the Fund’s next prospectus, which is expected to be available by October 1, 2026 at https://www.nuveen.com/en‑us/mutual‑funds/prospectuses or upon request at (800) 257‑8787.
For more complete information, you may review the Fund’s next prospectus, which is expected to be available by October 1, 2026 at https://www.nuveen.com/en‑us/mutual‑funds/prospectuses or upon request at (800) 257‑8787.
This report describes changes to the Fund that occurred during the reporting period.
What were the Fund costs for the last year? (based on a hypothetical $10,000 investment)
| Cost of a $10,000 investment | Costs paid as a percentage of $10,000 investment* | |||
| Retirement Class Shares |
$53 | 0.47% | ||
| * | The Fund’s ratios include the expenses of the Underlying Funds, excluding the expenses of the Dividend Growth, Dividend Value, Growth Opportunities ETF, International Value, Small Cap Select and the Nuveen Real Property Fund LP and exclude the income of the Underlying Funds. Annualized for period less than one year. |
How did the Fund perform last year? What affected the Fund’s performance?
| Performance Highlights The Nuveen Lifecycle 2055 Fund returned 24.32% for Retirement Class Shares at net asset value (NAV) for the 12 months ended May 31, 2026. The Fund underperformed the Lifecycle 2055 Fund Composite Index, which returned 28.26%. The Fund’s Composite Index consisted of: 59.1% Russell 3000® Index; 31.9% MSCI All Country World Index ex USA Investable Market Index; 7.2% Bloomberg U.S. Aggregate Bond Index; and 1.8% Bloomberg Global Aggregate ex-USD Index (Hedged). Top contributors to relative performance • Holding the Nuveen Quant International Small Cap Equity Fund. • An allocation to the Nuveen International Equity Fund. • A position in the Nuveen Growth Opportunities ETF. Top detractors from relative performance • A position in the Nuveen Dividend Growth Fund. • Holding the Nuveen International Opportunities Fund. • An allocation to the Nuveen Dividend Value Fund. |
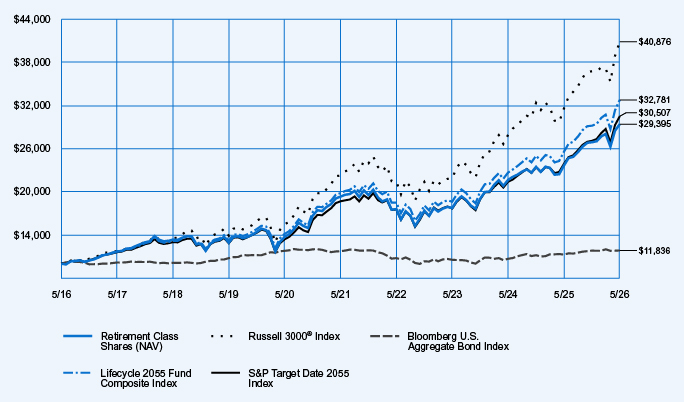
Average Annual Total Returns
| 1-Year | 5-Year | 10-Year | ||||||||||
| Retirement Class Shares at NAV |
24.32 | % | 8.75 | % | 11.39 | % | ||||||
| Russell 3000® Index |
29.45 | % | 12.92 | % | 15.12 | % | ||||||
| Bloomberg U.S. Aggregate Bond Index |
5.13 | % | 0.17 | % | 1.70 | % | ||||||
| Lifecycle 2055 Fund Composite Index |
28.26 | % | 10.59 | % | 12.61 | % | ||||||
| S&P Target Date 2055 Index |
27.78 | % | 10.31 | % | 11.80 | % | ||||||
Fund Statistics (as of May 31, 2026)
| Fund net assets |
$ | 2,249,927,093 | ||
| Total number of portfolio holdings |
21 | |||
| Portfolio turnover (%) |
23% | |||
| Total management fees paid for the year |
$ | 8,429,471 | ||
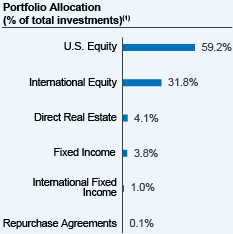 |
| (1) | Affiliated investment companies (Underlying Funds), except for repurchase agreements, where applicable. |
How has the Fund changed?
Portfolio manager update: Effective October 1, 2025, Jeff Sun, CFA was added as a portfolio manager of the Fund.
For more complete information, you may review the Fund’s next prospectus, which is expected to be available by October 1, 2026 at https://www.nuveen.com/en‑us/mutual‑funds/prospectuses or upon request at (800) 257‑8787.
For more complete information, you may review the Fund’s next prospectus, which is expected to be available by October 1, 2026 at https://www.nuveen.com/en‑us/mutual‑funds/prospectuses or upon request at (800) 257‑8787.
This report describes changes to the Fund that occurred during the reporting period.
What were the Fund costs for the last year? (based on a hypothetical $10,000 investment)
| Cost of a $10,000 investment | Costs paid as a percentage of $10,000 investment* | |||
| Class R6 Shares |
$25 | 0.22% | ||
| * | The Fund’s ratios include the expenses of the Underlying Funds, excluding the expenses of the Dividend Growth, Dividend Value, Growth Opportunities ETF, International Value, Small Cap Select and the Nuveen Real Property Fund LP and exclude the income of the Underlying Funds. Annualized for period less than one year. |
How did the Fund perform last year? What affected the Fund’s performance?
| Performance Highlights The Nuveen Lifecycle 2055 Fund returned 24.67% for Class R6 Shares at net asset value (NAV) for the 12 months ended May 31, 2026. The Fund underperformed the Lifecycle 2055 Fund Composite Index, which returned 28.26%. The Fund’s Composite Index consisted of: 59.1% Russell 3000® Index; 31.9% MSCI All Country World Index ex USA Investable Market Index; 7.2% Bloomberg U.S. Aggregate Bond Index; and 1.8% Bloomberg Global Aggregate ex-USD Index (Hedged). Top contributors to relative performance • Holding the Nuveen Quant International Small Cap Equity Fund. • An allocation to the Nuveen International Equity Fund. • A position in the Nuveen Growth Opportunities ETF. Top detractors from relative performance • A position in the Nuveen Dividend Growth Fund. • Holding the Nuveen International Opportunities Fund. • An allocation to the Nuveen Dividend Value Fund. |
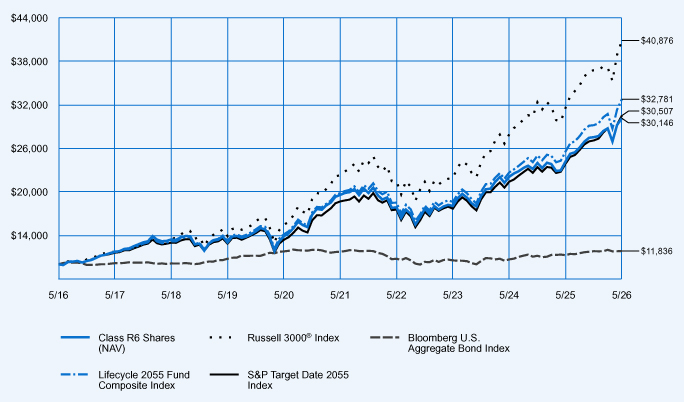
Average Annual Total Returns
| 1-Year | 5-Year | 10-Year | ||||||||||
| Class R6 Shares at NAV |
24.67 | % | 9.02 | % | 11.67 | % | ||||||
| Russell 3000® Index |
29.45 | % | 12.92 | % | 15.12 | % | ||||||
| Bloomberg U.S. Aggregate Bond Index |
5.13 | % | 0.17 | % | 1.70 | % | ||||||
| Lifecycle 2055 Fund Composite Index |
28.26 | % | 10.59 | % | 12.61 | % | ||||||
| S&P Target Date 2055 Index |
27.78 | % | 10.31 | % | 11.80 | % | ||||||
Fund Statistics (as of May 31, 2026)
| Fund net assets |
$ | 2,249,927,093 | ||
| Total number of portfolio holdings |
21 | |||
| Portfolio turnover (%) |
23% | |||
| Total management fees paid for the year |
$ | 8,429,471 | ||
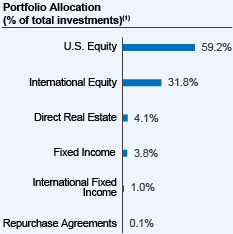 |
| (1) | Affiliated investment companies (Underlying Funds), except for repurchase agreements, where applicable. |
How has the Fund changed?
Portfolio manager update: Effective October 1, 2025, Jeff Sun, CFA was added as a portfolio manager of the Fund.
For more complete information, you may review the Fund’s next prospectus, which is expected to be available by October 1, 2026 at https://www.nuveen.com/en‑us/mutual‑funds/prospectuses or upon request at (800) 257‑8787.
For more complete information, you may review the Fund’s next prospectus, which is expected to be available by October 1, 2026 at https://www.nuveen.com/en‑us/mutual‑funds/prospectuses or upon request at (800) 257‑8787.
This report describes changes to the Fund that occurred during the reporting period.
What were the Fund costs for the last year? (based on a hypothetical $10,000 investment)
| Cost of a $10,000 investment | Costs paid as a percentage of $10,000 investment* | |||
| Premier Class Shares |
$42 | 0.37% | ||
| * | The Fund’s ratios include the expenses of the Underlying Funds, excluding the expenses of the Dividend Growth, Dividend Value, Growth Opportunities ETF, International Value, Small Cap Select and the Nuveen Real Property Fund LP and exclude the income of the Underlying Funds. Annualized for period less than one year. |
How did the Fund perform last year? What affected the Fund’s performance?
| Performance Highlights The Nuveen Lifecycle 2055 Fund returned 24.41% for Premier Class Shares at net asset value (NAV) for the 12 months ended May 31, 2026. The Fund underperformed the Lifecycle 2055 Fund Composite Index, which returned 28.26%. The Fund’s Composite Index consisted of: 59.1% Russell 3000® Index; 31.9% MSCI All Country World Index ex USA Investable Market Index; 7.2% Bloomberg U.S. Aggregate Bond Index; and 1.8% Bloomberg Global Aggregate ex-USD Index (Hedged). Top contributors to relative performance • Holding the Nuveen Quant International Small Cap Equity Fund. • An allocation to the Nuveen International Equity Fund. • A position in the Nuveen Growth Opportunities ETF. Top detractors from relative performance • A position in the Nuveen Dividend Growth Fund. • Holding the Nuveen International Opportunities Fund. • An allocation to the Nuveen Dividend Value Fund. |
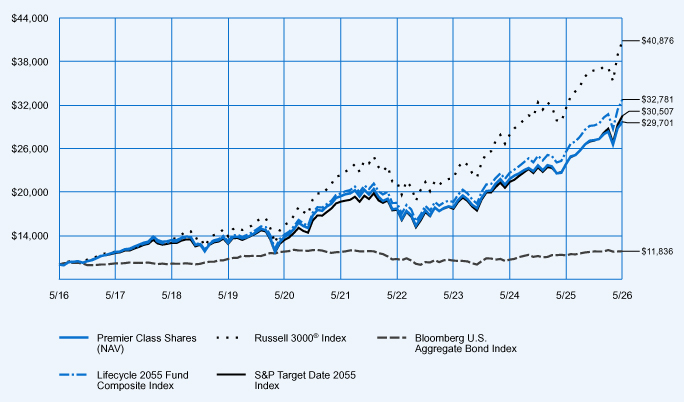
Average Annual Total Returns
| 1-Year | 5-Year | 10-Year | ||||||||||
| Premier Class Shares at NAV |
24.41 | % | 8.86 | % | 11.50 | % | ||||||
| Russell 3000® Index |
29.45 | % | 12.92 | % | 15.12 | % | ||||||
| Bloomberg U.S. Aggregate Bond Index |
5.13 | % | 0.17 | % | 1.70 | % | ||||||
| Lifecycle 2055 Fund Composite Index |
28.26 | % | 10.59 | % | 12.61 | % | ||||||
| S&P Target Date 2055 Index |
27.78 | % | 10.31 | % | 11.80 | % | ||||||
Fund Statistics (as of May 31, 2026)
| Fund net assets |
$ | 2,249,927,093 | ||
| Total number of portfolio holdings |
21 | |||
| Portfolio turnover (%) |
23% | |||
| Total management fees paid for the year |
$ | 8,429,471 | ||
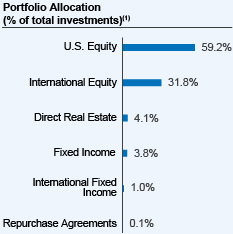 |
| (1) | Affiliated investment companies (Underlying Funds), except for repurchase agreements, where applicable. |
How has the Fund changed?
Portfolio manager update: Effective October 1, 2025, Jeff Sun, CFA was added as a portfolio manager of the Fund.
For more complete information, you may review the Fund’s next prospectus, which is expected to be available by October 1, 2026 at https://www.nuveen.com/en‑us/mutual‑funds/prospectuses or upon request at (800) 257‑8787.
For more complete information, you may review the Fund’s next prospectus, which is expected to be available by October 1, 2026 at https://www.nuveen.com/en‑us/mutual‑funds/prospectuses or upon request at (800) 257‑8787.
This report describes changes to the Fund that occurred during the reporting period.
What were the Fund costs for the last year? (based on a hypothetical $10,000 investment)
| Cost of a $10,000 investment | Costs paid as a percentage of $10,000 investment* | |||
| Class I Shares |
$28 | 0.25% | ||
| * | The Fund’s ratios include the expenses of the Underlying Funds, excluding the expenses of the Dividend Growth, Dividend Value, Growth Opportunities ETF, International Value, Small Cap Select and the Nuveen Real Property Fund LP and exclude the income of the Underlying Funds. Annualized for period less than one year. |
How did the Fund perform last year? What affected the Fund’s performance?
| Performance Highlights The Nuveen Lifecycle 2055 Fund returned 24.62% for Class I Shares at net asset value (NAV) for the 12 months ended May 31, 2026. The Fund underperformed the Lifecycle 2055 Fund Composite Index, which returned 28.26%. The Fund’s Composite Index consisted of: 59.1% Russell 3000® Index; 31.9% MSCI All Country World Index ex USA Investable Market Index; 7.2% Bloomberg U.S. Aggregate Bond Index; and 1.8% Bloomberg Global Aggregate ex-USD Index (Hedged). Top contributors to relative performance • Holding the Nuveen Quant International Small Cap Equity Fund. • An allocation to the Nuveen International Equity Fund. • A position in the Nuveen Growth Opportunities ETF. Top detractors from relative performance • A position in the Nuveen Dividend Growth Fund. • Holding the Nuveen International Opportunities Fund. • An allocation to the Nuveen Dividend Value Fund. |
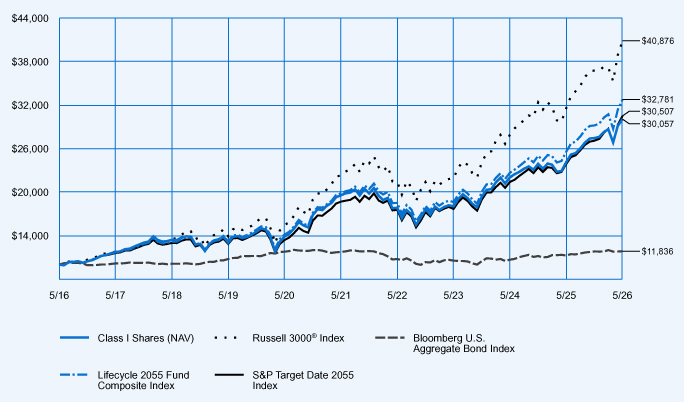
Average Annual Total Returns
| 1-Year | 5-Year | 10-Year | ||||||||||
| Class I Shares at NAV |
24.62 | % | 8.98 | % | 11.63 | % | ||||||
| Russell 3000® Index |
29.45 | % | 12.92 | % | 15.12 | % | ||||||
| Bloomberg U.S. Aggregate Bond Index |
5.13 | % | 0.17 | % | 1.70 | % | ||||||
| Lifecycle 2055 Fund Composite Index |
28.26 | % | 10.59 | % | 12.61 | % | ||||||
| S&P Target Date 2055 Index |
27.78 | % | 10.31 | % | 11.80 | % | ||||||
Fund Statistics (as of May 31, 2026)
| Fund net assets |
$ | 2,249,927,093 | ||
| Total number of portfolio holdings |
21 | |||
| Portfolio turnover (%) |
23% | |||
| Total management fees paid for the year |
$ | 8,429,471 | ||
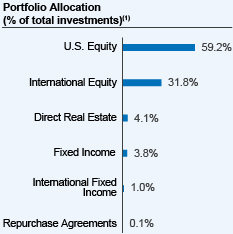 |
| (1) | Affiliated investment companies (Underlying Funds), except for repurchase agreements, where applicable. |
How has the Fund changed?
Portfolio manager update: Effective October 1, 2025, Jeff Sun, CFA was added as a portfolio manager of the Fund.
For more complete information, you may review the Fund’s next prospectus, which is expected to be available by October 1, 2026 at https://www.nuveen.com/en‑us/mutual‑funds/prospectuses or upon request at (800) 257‑8787.
For more complete information, you may review the Fund’s next prospectus, which is expected to be available by October 1, 2026 at https://www.nuveen.com/en‑us/mutual‑funds/prospectuses or upon request at (800) 257‑8787.
This report describes changes to the Fund that occurred during the reporting period.
What were the Fund costs for the last year? (based on a hypothetical $10,000 investment)
| Cost of a $10,000 investment | Costs paid as a percentage of $10,000 investment* | |||
| Class A Shares |
$47 | 0.42% | ||
| * | The Fund’s ratios do not include the expenses or income of the Underlying Funds. Annualized for period less than one year. |
How did the Fund perform last year? What affected the Fund’s performance?
| Performance Highlights The Nuveen Lifestyle Aggressive Growth Fund returned 26.07% for Class A Shares at net asset value (NAV) for the 12 months ended May 31, 2026. The Fund significantly underperformed the Lifestyle Aggressive Growth Fund Composite Index, which returned 30.66%. The Fund’s Composite Index consisted of: 65.0% Russell 3000® Index; and 35.0% MSCI All Country World Index ex USA Investable Market Index. Top contributors to relative performance • Holding the Nuveen Quant International Small Cap Equity Fund. • An allocation to the Nuveen International Equity Fund. • A position in the Nuveen Growth Opportunities ETF. Top detractors from relative performance • A position in the Nuveen Dividend Growth Fund. • Holding the Nuveen International Opportunities Fund. • An allocation to the Nuveen Dividend Value Fund. |
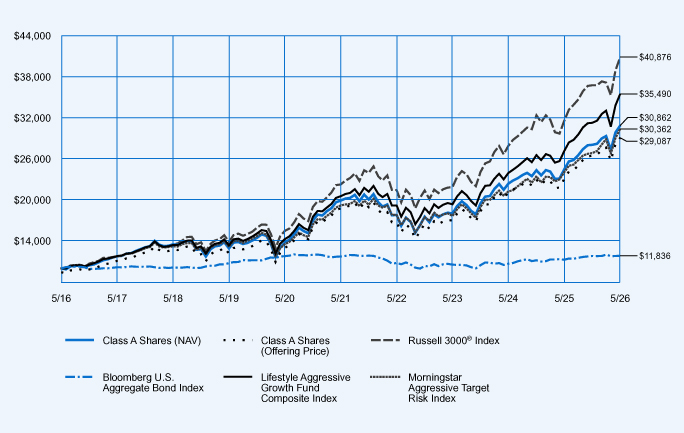
Average Annual Total Returns
| 1‑Year | 5‑Year | 10‑Year | ||||||||||
| Class A Shares at NAV (excluding maximum sales charge) |
26.07 | % | 9.16 | % | 11.93 | % | ||||||
| Class A Shares at maximum sales charge (Offering Price) |
18.82 | % | 7.88 | % | 11.27 | % | ||||||
| Russell 3000® Index |
29.45 | % | 12.92 | % | 15.12 | % | ||||||
| Bloomberg U.S. Aggregate Bond Index |
5.13 | % | 0.17 | % | 1.70 | % | ||||||
| Lifestyle Aggressive Growth Fund Composite Index |
30.66 | % | 11.55 | % | 13.50 | % | ||||||
| Morningstar Aggressive Target Risk Index |
26.15 | % | 9.59 | % | 11.75 | % | ||||||
Fund Statistics (as of May 31, 2026)
| Fund net assets |
$ | 291,807,353 | ||
| Total number of portfolio holdings |
15 | |||
| Portfolio turnover (%) |
23% | |||
| Total management fees paid for the year |
$ | 270,521 | ||
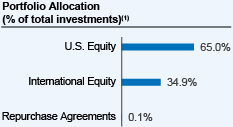 |
| (1) | Affiliated investment companies (Underlying Funds), except for repurchase agreements, where applicable. |
How has the Fund changed?
Portfolio manager update: Effective October 1, 2025, Jeff Sun, CFA was added as a portfolio manager of the Fund.
For more complete information, you may review the Fund’s next prospectus, which is expected to be available by October 1, 2026 at https://www.nuveen.com/en‑us/mutual‑funds/prospectuses or upon request at (800) 257‑8787.
For more complete information, you may review the Fund’s next prospectus, which is expected to be available by October 1, 2026 at https://www.nuveen.com/en‑us/mutual‑funds/prospectuses or upon request at (800) 257‑8787.
This report describes changes to the Fund that occurred during the reporting period.
What were the Fund costs for the last year? (based on a hypothetical $10,000 investment)
| Cost of a $10,000 investment | Costs paid as a percentage of $10,000 investment* | |||
| Class I Shares |
$14 | 0.12% | ||
| * | The Fund’s ratios do not include the expenses or income of the Underlying Funds. Annualized for period less than one year. |
How did the Fund perform last year? What affected the Fund’s performance?
| Performance Highlights The Nuveen Lifestyle Aggressive Growth Fund returned 26.50% for Class I Shares at net asset value (NAV) for the 12 months ended May 31, 2026. The Fund significantly underperformed the Lifestyle Aggressive Growth Fund Composite Index, which returned 30.66%. The Fund’s Composite Index consisted of: 65.0% Russell 3000® Index; and 35.0% MSCI All Country World Index ex USA Investable Market Index. Top contributors to relative performance • Holding the Nuveen Quant International Small Cap Equity Fund. • An allocation to the Nuveen International Equity Fund. • A position in the Nuveen Growth Opportunities ETF. Top detractors from relative performance • A position in the Nuveen Dividend Growth Fund. • Holding the Nuveen International Opportunities Fund. • An allocation to the Nuveen Dividend Value Fund. |
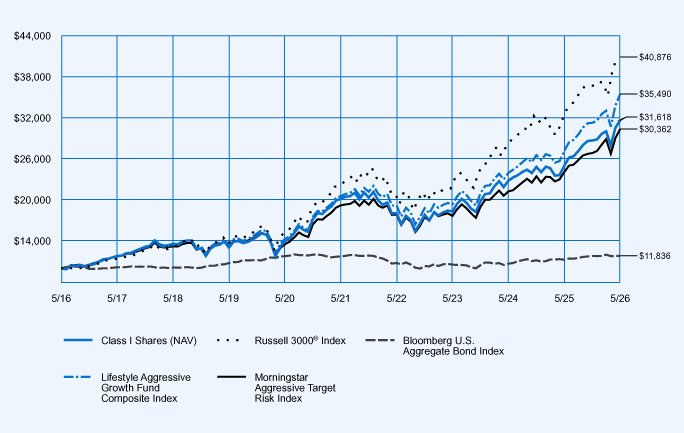
Average Annual Total Returns
| 1‑Year | 5‑Year | 10‑Year | ||||||||||
| Class I Shares at NAV |
26.50 | % | 9.41 | % | 12.20 | % | ||||||
| Russell 3000® Index |
29.45 | % | 12.92 | % | 15.12 | % | ||||||
| Bloomberg U.S. Aggregate Bond Index |
5.13 | % | 0.17 | % | 1.70 | % | ||||||
| Lifestyle Aggressive Growth Fund Composite Index |
30.66 | % | 11.55 | % | 13.50 | % | ||||||
| Morningstar Aggressive Target Risk Index |
26.15 | % | 9.59 | % | 11.75 | % | ||||||
Fund Statistics (as of May 31, 2026)
| Fund net assets |
$ | 291,807,353 | ||
| Total number of portfolio holdings |
15 | |||
| Portfolio turnover (%) |
23% | |||
| Total management fees paid for the year |
$ | 270,521 | ||
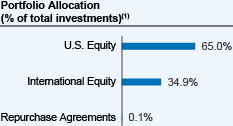 |
| (1) | Affiliated investment companies (Underlying Funds), except for repurchase agreements, where applicable. |
How has the Fund changed?
Portfolio manager update: Effective October 1, 2025, Jeff Sun, CFA was added as a portfolio manager of the Fund.
For more complete information, you may review the Fund’s next prospectus, which is expected to be available by October 1, 2026 at https://www.nuveen.com/en‑us/mutual‑funds/prospectuses or upon request at (800) 257‑8787.
For more complete information, you may review the Fund’s next prospectus, which is expected to be available by October 1, 2026 at https://www.nuveen.com/en‑us/mutual‑funds/prospectuses or upon request at (800) 257‑8787.
This report describes changes to the Fund that occurred during the reporting period.
What were the Fund costs for the last year? (based on a hypothetical $10,000 investment)
| Cost of a $10,000 investment | Costs paid as a percentage of $10,000 investment* | |||
| Premier Class Shares |
$28 | 0.25% | ||
| * | The Fund’s ratios do not include the expenses or income of the Underlying Funds. Annualized for period less than one year. |
How did the Fund perform last year? What affected the Fund’s performance?
| Performance Highlights The Nuveen Lifestyle Aggressive Growth Fund returned 26.30% for Premier Class Shares at net asset value (NAV) for the 12 months ended May 31, 2026. The Fund significantly underperformed the Lifestyle Aggressive Growth Fund Composite Index, which returned 30.66%. The Fund’s Composite Index consisted of: 65.0% Russell 3000® Index; and 35.0% MSCI All Country World Index ex USA Investable Market Index. Top contributors to relative performance • Holding the Nuveen Quant International Small Cap Equity Fund. • An allocation to the Nuveen International Equity Fund. • A position in the Nuveen Growth Opportunities ETF. Top detractors from relative performance • A position in the Nuveen Dividend Growth Fund. • Holding the Nuveen International Opportunities Fund. • An allocation to the Nuveen Dividend Value Fund. |
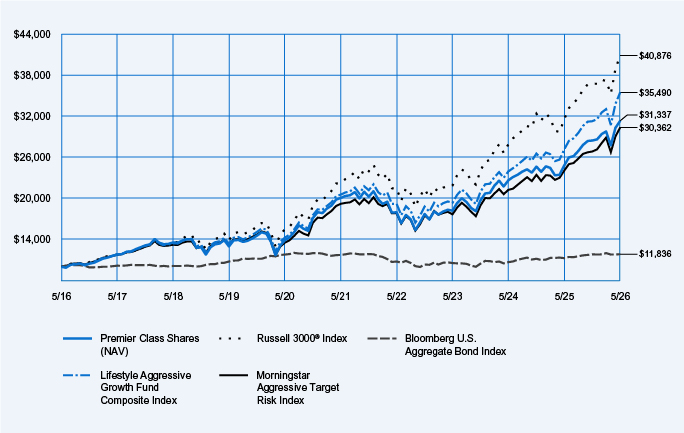
Average Annual Total Returns
| 1‑Year | 5‑Year | 10‑Year | ||||||||||
| Premier Class Shares at NAV |
26.30 | % | 9.33 | % | 12.10 | % | ||||||
| Russell 3000® Index |
29.45 | % | 12.92 | % | 15.12 | % | ||||||
| Bloomberg U.S. Aggregate Bond Index |
5.13 | % | 0.17 | % | 1.70 | % | ||||||
| Lifestyle Aggressive Growth Fund Composite Index |
30.66 | % | 11.55 | % | 13.50 | % | ||||||
| Morningstar Aggressive Target Risk Index |
26.15 | % | 9.59 | % | 11.75 | % | ||||||
Fund Statistics (as of May 31, 2026)
| Fund net assets |
$ | 291,807,353 | ||
| Total number of portfolio holdings |
15 | |||
| Portfolio turnover (%) |
23% | |||
| Total management fees paid for the year |
$ | 270,521 | ||
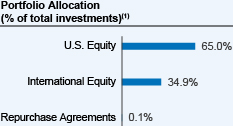 |
| (1) | Affiliated investment companies (Underlying Funds), except for repurchase agreements, where applicable. |
How has the Fund changed?
Portfolio manager update: Effective October 1, 2025, Jeff Sun, CFA was added as a portfolio manager of the Fund.
For more complete information, you may review the Fund’s next prospectus, which is expected to be available by October 1, 2026 at https://www.nuveen.com/en‑us/mutual‑funds/prospectuses or upon request at (800) 257‑8787.
For more complete information, you may review the Fund’s next prospectus, which is expected to be available by October 1, 2026 at https://www.nuveen.com/en‑us/mutual‑funds/prospectuses or upon request at (800) 257‑8787.
This report describes changes to the Fund that occurred during the reporting period.
What were the Fund costs for the last year? (based on a hypothetical $10,000 investment)
| Cost of a $10,000 investment | Costs paid as a percentage of $10,000 investment* | |||
| Class R6 Shares |
$11 | 0.10% | ||
| * | The Fund’s ratios do not include the expenses or income of the Underlying Funds. Annualized for period less than one year. |
How did the Fund perform last year? What affected the Fund’s performance?
| Performance Highlights The Nuveen Lifestyle Aggressive Growth Fund returned 26.47% for Class R6 Shares at net asset value (NAV) for the 12 months ended May 31, 2026. The Fund significantly underperformed the Lifestyle Aggressive Growth Fund Composite Index, which returned 30.66%. The Fund’s Composite Index consisted of: 65.0% Russell 3000® Index; and 35.0% MSCI All Country World Index ex USA Investable Market Index. Top contributors to relative performance • Holding the Nuveen Quant International Small Cap Equity Fund. • An allocation to the Nuveen International Equity Fund. • A position in the Nuveen Growth Opportunities ETF. Top detractors from relative performance • A position in the Nuveen Dividend Growth Fund. • Holding the Nuveen International Opportunities Fund. • An allocation to the Nuveen Dividend Value Fund. |
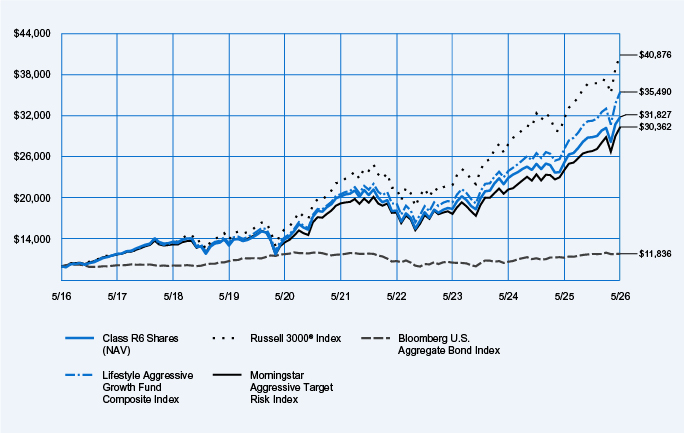
Average Annual Total Returns
| 1‑Year | 5‑Year | 10‑Year | ||||||||||
| Class R6 Shares at NAV |
26.47 | % | 9.49 | % | 12.27 | % | ||||||
| Russell 3000® Index |
29.45 | % | 12.92 | % | 15.12 | % | ||||||
| Bloomberg U.S. Aggregate Bond Index |
5.13 | % | 0.17 | % | 1.70 | % | ||||||
| Lifestyle Aggressive Growth Fund Composite Index |
30.66 | % | 11.55 | % | 13.50 | % | ||||||
| Morningstar Aggressive Target Risk Index |
26.15 | % | 9.59 | % | 11.75 | % | ||||||
Fund Statistics (as of May 31, 2026)
| Fund net assets |
$ | 291,807,353 | ||
| Total number of portfolio holdings |
15 | |||
| Portfolio turnover (%) |
23% | |||
| Total management fees paid for the year |
$ | 270,521 | ||
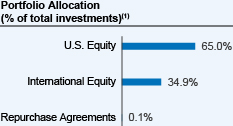 |
| (1) | Affiliated investment companies (Underlying Funds), except for repurchase agreements, where applicable. |
How has the Fund changed?
Portfolio manager update: Effective October 1, 2025, Jeff Sun, CFA was added as a portfolio manager of the Fund.
For more complete information, you may review the Fund’s next prospectus, which is expected to be available by October 1, 2026 at https://www.nuveen.com/en‑us/mutual‑funds/prospectuses or upon request at (800) 257‑8787.
For more complete information, you may review the Fund’s next prospectus, which is expected to be available by October 1, 2026 at https://www.nuveen.com/en‑us/mutual‑funds/prospectuses or upon request at (800) 257‑8787.
This report describes changes to the Fund that occurred during the reporting period.
What were the Fund costs for the last year? (based on a hypothetical $10,000 investment)
| Cost of a $10,000 investment | Costs paid as a percentage of $10,000 investment* | |||
| Retirement Class Shares |
$40 | 0.35% | ||
| * | The Fund’s ratios do not include the expenses or income of the Underlying Funds. Annualized for period less than one year. |
How did the Fund perform last year? What affected the Fund’s performance?
| Performance Highlights The Nuveen Lifestyle Aggressive Growth Fund returned 26.17% for Retirement Class Shares at net asset value (NAV) for the 12 months ended May 31, 2026. The Fund significantly underperformed the Lifestyle Aggressive Growth Fund Composite Index, which returned 30.66%. The Fund’s Composite Index consisted of: 65.0% Russell 3000® Index; and 35.0% MSCI All Country World Index ex USA Investable Market Index. Top contributors to relative performance • Holding the Nuveen Quant International Small Cap Equity Fund. • An allocation to the Nuveen International Equity Fund. • A position in the Nuveen Growth Opportunities ETF. Top detractors from relative performance • A position in the Nuveen Dividend Growth Fund. • Holding the Nuveen International Opportunities Fund. • An allocation to the Nuveen Dividend Value Fund. |
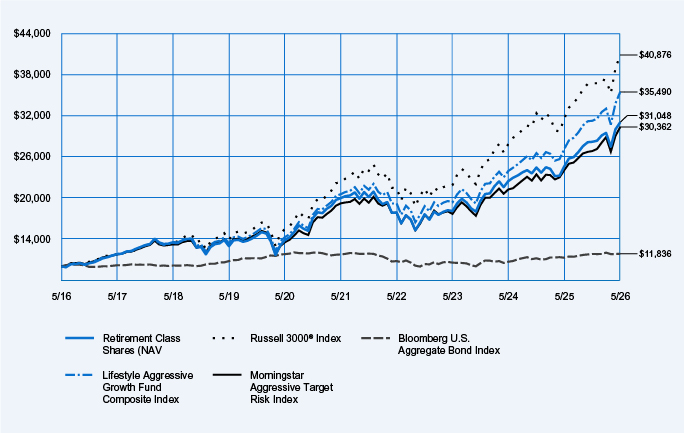
Average Annual Total Returns
| 1‑Year | 5‑Year | 10‑Year | ||||||||||
| Retirement Class Shares at NAV |
26.17 | % | 9.22 | % | 12.00 | % | ||||||
| Russell 3000® Index |
29.45 | % | 12.92 | % | 15.12 | % | ||||||
| Bloomberg U.S. Aggregate Bond Index |
5.13 | % | 0.17 | % | 1.70 | % | ||||||
| Lifestyle Aggressive Growth Fund Composite Index |
30.66 | % | 11.55 | % | 13.50 | % | ||||||
| Morningstar Aggressive Target Risk Index |
26.15 | % | 9.59 | % | 11.75 | % | ||||||
Fund Statistics (as of May 31, 2026)
| Fund net assets |
$ | 291,807,353 | ||
| Total number of portfolio holdings |
15 | |||
| Portfolio turnover (%) |
23% | |||
| Total management fees paid for the year |
$ | 270,521 | ||
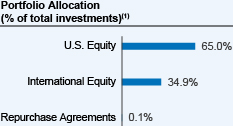 |
| (1) | Affiliated investment companies (Underlying Funds), except for repurchase agreements, where applicable. |
How has the Fund changed?
Portfolio manager update: Effective October 1, 2025, Jeff Sun, CFA was added as a portfolio manager of the Fund.
For more complete information, you may review the Fund’s next prospectus, which is expected to be available by October 1, 2026 at https://www.nuveen.com/en‑us/mutual‑funds/prospectuses or upon request at (800) 257‑8787.
For more complete information, you may review the Fund’s next prospectus, which is expected to be available by October 1, 2026 at https://www.nuveen.com/en‑us/mutual‑funds/prospectuses or upon request at (800) 257‑8787.
This report describes changes to the Fund that occurred during the reporting period.
What were the Fund costs for the last year? (based on a hypothetical $10,000 investment)
| Cost of a $10,000 investment | Costs paid as a percentage of $10,000 investment* | |||
| Retirement Class Shares |
$37 | 0.35% | ||
| * | The Fund’s ratios do not include the expenses or income of the Underlying Funds. Annualized for period less than one year. |
How did the Fund perform last year? What affected the Fund’s performance?
| Performance Highlights The Nuveen Lifestyle Conservative Fund returned 13.23% for Retirement Class Shares at net asset value (NAV) for the 12 months ended May 31, 2026. The Fund underperformed the Lifestyle Conservative Fund Composite Index, which returned 14.62%. The Fund’s Composite Index consisted of: 40.0% Bloomberg U.S. Aggregate Bond Index; 26.0% Russell 3000® Index; 20.0% Bloomberg U.S. 1‑3 Year Government/Credit Bond Index; and 14.0% MSCI All Country World Index ex USA Investable Market Index. Top contributors to relative performance • Strong overall performance of the underlying funds investing in fixed income, led by the Nuveen Core Plus Bond Fund. • An allocation to the Nuveen Short Term Bond Fund. • A position in the Nuveen Quant International Small Cap Equity Fund. Top detractors from relative performance • A position in the Nuveen Dividend Growth Fund. • Holding the Nuveen International Opportunities Fund. • An allocation to the Nuveen Dividend Value Fund. |
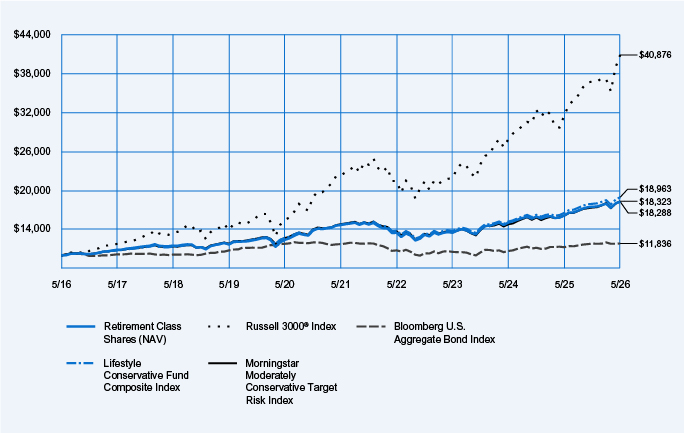
Average Annual Total Returns
| 1‑Year | 5‑Year | 10‑Year | ||||||||||
| Retirement Class Shares at NAV |
13.23 | % | 4.50 | % | 6.22 | % | ||||||
| Russell 3000® Index |
29.45 | % | 12.92 | % | 15.12 | % | ||||||
| Bloomberg U.S. Aggregate Bond Index |
5.13 | % | 0.17 | % | 1.70 | % | ||||||
| Lifestyle Conservative Fund Composite Index |
14.62 | % | 5.19 | % | 6.61 | % | ||||||
| Morningstar Moderately Conservative Target Risk Index |
13.62 | % | 4.35 | % | 6.24 | % | ||||||
Fund Statistics (as of May 31, 2026)
| Fund net assets |
$ | 324,499,063 | ||
| Total number of portfolio holdings |
18 | |||
| Portfolio turnover (%) |
19% | |||
| Total management fees paid for the year |
$ | 321,403 | ||
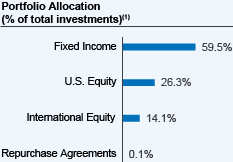 |
| (1) | Affiliated investment companies (Underlying Funds), except for repurchase agreements, where applicable. |
How has the Fund changed?
Portfolio manager update: Effective October 1, 2025, Jeff Sun, CFA was added as a portfolio manager of the Fund.
For more complete information, you may review the Fund’s next prospectus, which is expected to be available by October 1, 2026 at https://www.nuveen.com/en‑us/mutual‑funds/prospectuses or upon request at (800) 257‑8787.
For more complete information, you may review the Fund’s next prospectus, which is expected to be available by October 1, 2026 at https://www.nuveen.com/en‑us/mutual‑funds/prospectuses or upon request at (800) 257‑8787.
This report describes changes to the Fund that occurred during the reporting period.
What were the Fund costs for the last year? (based on a hypothetical $10,000 investment)
| Cost of a $10,000 investment | Costs paid as a percentage of $10,000 investment* | |||
| Class R6 Shares |
$11 | 0.10% | ||
| * | The Fund’s ratios do not include the expenses or income of the Underlying Funds. Annualized for period less than one year. |
How did the Fund perform last year? What affected the Fund’s performance?
| Performance Highlights The Nuveen Lifestyle Conservative Fund returned 13.50% for Class R6 Shares at net asset value (NAV) for the 12 months ended May 31, 2026. The Fund underperformed the Lifestyle Conservative Fund Composite Index, which returned 14.62%. The Fund’s Composite Index consisted of: 40.0% Bloomberg U.S. Aggregate Bond Index; 26.0% Russell 3000® Index; 20.0% Bloomberg U.S. 1‑3 Year Government/Credit Bond Index; and 14.0% MSCI All Country World Index ex USA Investable Market Index. Top contributors to relative performance • Strong overall performance of the underlying funds investing in fixed income, led by the Nuveen Core Plus Bond Fund. • An allocation to the Nuveen Short Term Bond Fund. • A position in the Nuveen Quant International Small Cap Equity Fund. Top detractors from relative performance • A position in the Nuveen Dividend Growth Fund. • Holding the Nuveen International Opportunities Fund. • An allocation to the Nuveen Dividend Value Fund. |
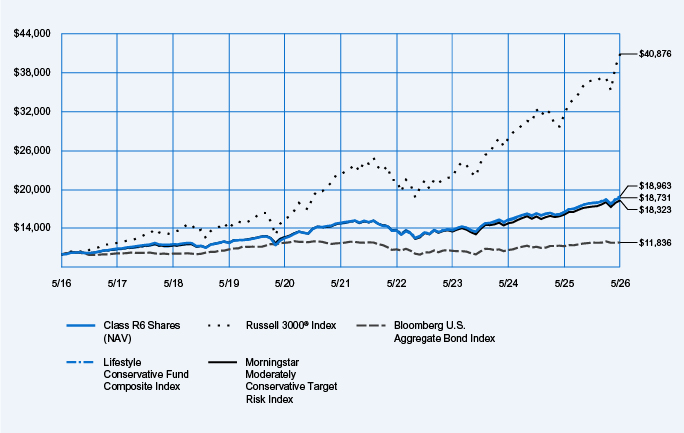
Average Annual Total Returns
| 1‑Year | 5‑Year | 10‑Year | ||||||||||
| Class R6 Shares at NAV |
13.50 | % | 4.74 | % | 6.48 | % | ||||||
| Russell 3000® Index |
29.45 | % | 12.92 | % | 15.12 | % | ||||||
| Bloomberg U.S. Aggregate Bond Index |
5.13 | % | 0.17 | % | 1.70 | % | ||||||
| Lifestyle Conservative Fund Composite Index |
14.62 | % | 5.19 | % | 6.61 | % | ||||||
| Morningstar Moderately Conservative Target Risk Index |
13.62 | % | 4.35 | % | 6.24 | % | ||||||
Fund Statistics (as of May 31, 2026)
| Fund net assets |
$ | 324,499,063 | ||
| Total number of portfolio holdings |
18 | |||
| Portfolio turnover (%) |
19% | |||
| Total management fees paid for the year |
$ | 321,403 | ||
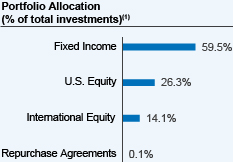 |
| (1) | Affiliated investment companies (Underlying Funds), except for repurchase agreements, where applicable. |
How has the Fund changed?
Portfolio manager update: Effective October 1, 2025, Jeff Sun, CFA was added as a portfolio manager of the Fund.
For more complete information, you may review the Fund’s next prospectus, which is expected to be available by October 1, 2026 at https://www.nuveen.com/en‑us/mutual‑funds/prospectuses or upon request at (800) 257‑8787.
For more complete information, you may review the Fund’s next prospectus, which is expected to be available by October 1, 2026 at https://www.nuveen.com/en‑us/mutual‑funds/prospectuses or upon request at (800) 257‑8787.
This report describes changes to the Fund that occurred during the reporting period.
What were the Fund costs for the last year? (based on a hypothetical $10,000 investment)
| Cost of a $10,000 investment | Costs paid as a percentage of $10,000 investment* | |||
| Premier Class Shares |
$27 | 0.25% | ||
| * | The Fund’s ratios do not include the expenses or income of the Underlying Funds. Annualized for period less than one year. |
How did the Fund perform last year? What affected the Fund’s performance?
| Performance Highlights The Nuveen Lifestyle Conservative Fund returned 13.26% for Premier Class Shares at net asset value (NAV) for the 12 months ended May 31, 2026. The Fund underperformed the Lifestyle Conservative Fund Composite Index, which returned 14.62%. The Fund’s Composite Index consisted of: 40.0% Bloomberg U.S. Aggregate Bond Index; 26.0% Russell 3000® Index; 20.0% Bloomberg U.S. 1‑3 Year Government/Credit Bond Index; and 14.0% MSCI All Country World Index ex USA Investable Market Index. Top contributors to relative performance • Strong overall performance of the underlying funds investing in fixed income, led by the Nuveen Core Plus Bond Fund. • An allocation to the Nuveen Short Term Bond Fund. • A position in the Nuveen Quant International Small Cap Equity Fund. Top detractors from relative performance • A position in the Nuveen Dividend Growth Fund. • Holding the Nuveen International Opportunities Fund. • An allocation to the Nuveen Dividend Value Fund. |
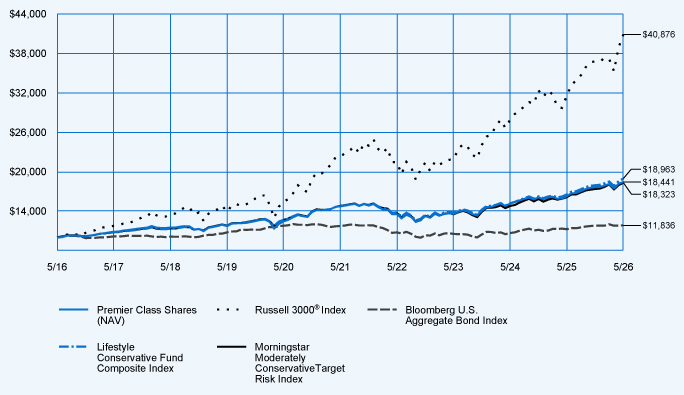
Average Annual Total Returns
| 1‑Year | 5‑Year | 10‑Year | ||||||||||
| Premier Class Shares at NAV |
13.26 | % | 4.58 | % | 6.31 | % | ||||||
| Russell 3000® Index |
29.45 | % | 12.92 | % | 15.12 | % | ||||||
| Bloomberg U.S. Aggregate Bond Index |
5.13 | % | 0.17 | % | 1.70 | % | ||||||
| Lifestyle Conservative Fund Composite Index |
14.62 | % | 5.19 | % | 6.61 | % | ||||||
| Morningstar Moderately Conservative Target Risk Index |
13.62 | % | 4.35 | % | 6.24 | % | ||||||
Fund Statistics (as of May 31, 2026)
| Fund net assets |
$ | 324,499,063 | ||
| Total number of portfolio holdings |
18 | |||
| Portfolio turnover (%) |
19% | |||
| Total management fees paid for the year |
$ | 321,403 | ||
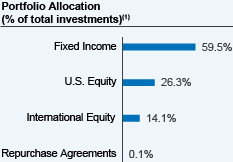 |
| (1) | Affiliated investment companies (Underlying Funds), except for repurchase agreements, where applicable. |
How has the Fund changed?
Portfolio manager update: Effective October 1, 2025, Jeff Sun, CFA was added as a portfolio manager of the Fund.
For more complete information, you may review the Fund’s next prospectus, which is expected to be available by October 1, 2026 at https://www.nuveen.com/en‑us/mutual‑funds/prospectuses or upon request at (800) 257‑8787.
For more complete information, you may review the Fund’s next prospectus, which is expected to be available by October 1, 2026 at https://www.nuveen.com/en‑us/mutual‑funds/prospectuses or upon request at (800) 257‑8787.
This report describes changes to the Fund that occurred during the reporting period.
What were the Fund costs for the last year? (based on a hypothetical $10,000 investment)
| Cost of a $10,000 investment | Costs paid as a percentage of $10,000 investment* | |||
| Class I Shares |
$17 | 0.16% | ||
| * | The Fund’s ratios do not include the expenses or income of the Underlying Funds. Annualized for period less than one year. |
How did the Fund perform last year? What affected the Fund’s performance?
| Performance Highlights The Nuveen Lifestyle Conservative Fund returned 13.50% for Class I Shares at net asset value (NAV) for the 12 months ended May 31, 2026. The Fund underperformed the Lifestyle Conservative Fund Composite Index, which returned 14.62%. The Fund’s Composite Index consisted of: 40.0% Bloomberg U.S. Aggregate Bond Index; 26.0% Russell 3000® Index; 20.0% Bloomberg U.S. 1‑3 Year Government/Credit Bond Index; and 14.0% MSCI All Country World Index ex USA Investable Market Index. Top contributors to relative performance • Strong overall performance of the underlying funds investing in fixed income, led by the Nuveen Core Plus Bond Fund. • An allocation to the Nuveen Short Term Bond Fund. • A position in the Nuveen Quant International Small Cap Equity Fund. Top detractors from relative performance • A position in the Nuveen Dividend Growth Fund. • Holding the Nuveen International Opportunities Fund. • An allocation to the Nuveen Dividend Value Fund. |
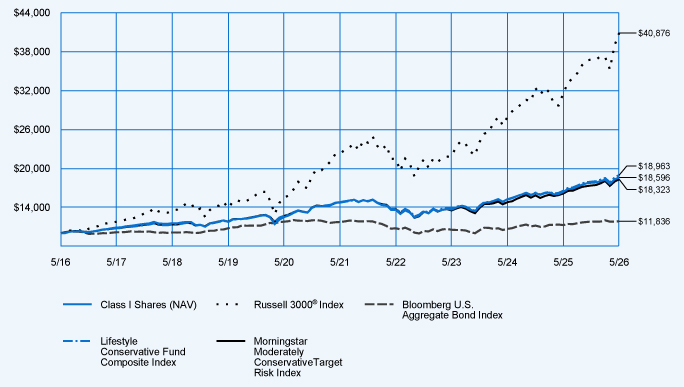
Average Annual Total Returns
| 1‑Year | 5‑Year | 10‑Year | ||||||||||
| Class I Shares at NAV |
13.50 | % | 4.67 | % | 6.40 | % | ||||||
| Russell 3000® Index |
29.45 | % | 12.92 | % | 15.12 | % | ||||||
| Bloomberg U.S. Aggregate Bond Index |
5.13 | % | 0.17 | % | 1.70 | % | ||||||
| Lifestyle Conservative Fund Composite Index |
14.62 | % | 5.19 | % | 6.61 | % | ||||||
| Morningstar Moderately Conservative Target Risk Index |
13.62 | % | 4.35 | % | 6.24 | % | ||||||
Fund Statistics (as of May 31, 2026)
| Fund net assets |
$ | 324,499,063 | ||
| Total number of portfolio holdings |
18 | |||
| Portfolio turnover (%) |
19% | |||
| Total management fees paid for the year |
$ | 321,403 | ||
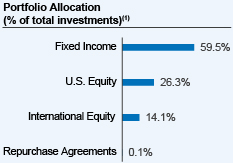 |
| (1) | Affiliated investment companies (Underlying Funds), except for repurchase agreements, where applicable. |
How has the Fund changed?
Portfolio manager update: Effective October 1, 2025, Jeff Sun, CFA was added as a portfolio manager of the Fund.
For more complete information, you may review the Fund’s next prospectus, which is expected to be available by October 1, 2026 at https://www.nuveen.com/en‑us/mutual‑funds/prospectuses or upon request at (800) 257‑8787.
For more complete information, you may review the Fund’s next prospectus, which is expected to be available by October 1, 2026 at https://www.nuveen.com/en‑us/mutual‑funds/prospectuses or upon request at (800) 257‑8787.
This report describes changes to the Fund that occurred during the reporting period.
What were the Fund costs for the last year? (based on a hypothetical $10,000 investment)
| Cost of a $10,000 investment | Costs paid as a percentage of $10,000 investment* | |||
| Class A Shares |
$42 | 0.39% | ||
| * | The Fund’s ratios do not include the expenses or income of the Underlying Funds. Annualized for period less than one year. |
How did the Fund perform last year? What affected the Fund’s performance?
| Performance Highlights The Nuveen Lifestyle Conservative Fund returned 13.19% for Class A Shares at net asset value (NAV) for the 12 months ended May 31, 2026. The Fund underperformed the Lifestyle Conservative Fund Composite Index, which returned 14.62%. The Fund’s Composite Index consisted of: 40.0% Bloomberg U.S. Aggregate Bond Index; 26.0% Russell 3000® Index; 20.0% Bloomberg U.S. 1‑3 Year Government/Credit Bond Index; and 14.0% MSCI All Country World Index ex USA Investable Market Index. Top contributors to relative performance • Strong overall performance of the underlying funds investing in fixed income, led by the Nuveen Core Plus Bond Fund. • An allocation to the Nuveen Short Term Bond Fund. • A position in the Nuveen Quant International Small Cap Equity Fund. Top detractors from relative performance • A position in the Nuveen Dividend Growth Fund. • Holding the Nuveen International Opportunities Fund. • An allocation to the Nuveen Dividend Value Fund. |
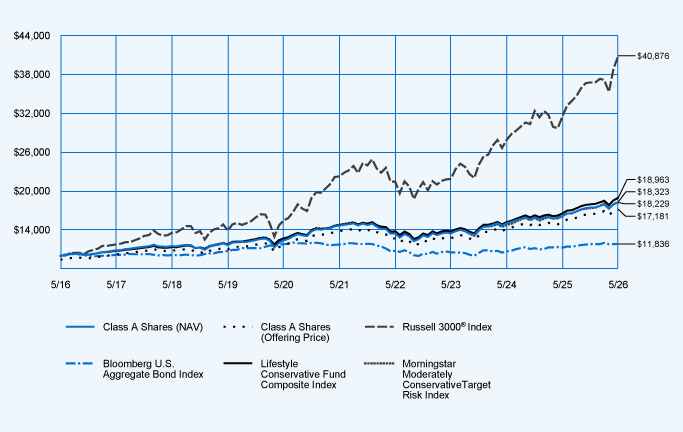
Average Annual Total Returns
| 1‑Year | 5‑Year | 10‑Year | ||||||||||
| Class A Shares at NAV (excluding maximum sales charge) |
13.19 | % | 4.46 | % | 6.19 | % | ||||||
| Class A Shares at maximum sales charge (Offering Price) |
6.68 | % | 3.23 | % | 5.56 | % | ||||||
| Russell 3000® Index |
29.45 | % | 12.92 | % | 15.12 | % | ||||||
| Bloomberg U.S. Aggregate Bond Index |
5.13 | % | 0.17 | % | 1.70 | % | ||||||
| Lifestyle Conservative Fund Composite Index |
14.62 | % | 5.19 | % | 6.61 | % | ||||||
| Morningstar Moderately Conservative Target Risk Index |
13.62 | % | 4.35 | % | 6.24 | % | ||||||
Fund Statistics (as of May 31, 2026)
| Fund net assets |
$ | 324,499,063 | ||
| Total number of portfolio holdings |
18 | |||
| Portfolio turnover (%) |
19% | |||
| Total management fees paid for the year |
$ | 321,403 | ||
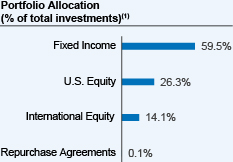 |
| (1) | Affiliated investment companies (Underlying Funds), except for repurchase agreements, where applicable. |
How has the Fund changed?
Portfolio manager update: Effective October 1, 2025, Jeff Sun, CFA was added as a portfolio manager of the Fund.
For more complete information, you may review the Fund’s next prospectus, which is expected to be available by October 1, 2026 at https://www.nuveen.com/en‑us/mutual‑funds/prospectuses or upon request at (800) 257‑8787.
For more complete information, you may review the Fund’s next prospectus, which is expected to be available by October 1, 2026 at https://www.nuveen.com/en‑us/mutual‑funds/prospectuses or upon request at (800) 257‑8787.
This report describes changes to the Fund that occurred during the reporting period.
What were the Fund costs for the last year? (based on a hypothetical $10,000 investment)
| Cost of a $10,000 investment | Costs paid as a percentage of $10,000 investment* | |||
| Class A Shares |
$44 | 0.40% | ||
| * | The Fund’s ratios do not include the expenses or income of the Underlying Funds. Annualized for period less than one year. |
How did the Fund perform last year? What affected the Fund’s performance?
| Performance Highlights The Nuveen Lifestyle Growth Fund returned 21.85% for Class A Shares at net asset value (NAV) for the 12 months ended May 31, 2026. The Fund underperformed the Lifestyle Growth Fund Composite Index, which returned 25.27%. The Fund’s Composite Index consisted of: 52.0% Russell 3000® Index; 28.0% MSCI All Country World Index ex USA Investable Market Index; and 20.0% Bloomberg U.S. Aggregate Bond Index. Top contributors to relative performance • Holding the Nuveen Quant International Small Cap Equity Fund. • An allocation to the Nuveen International Equity Fund. • A position in the Nuveen Core Plus Bond Fund. Top detractors from relative performance • A position in the Nuveen Dividend Growth Fund. • Holding the Nuveen International Opportunities Fund. • An allocation to the Nuveen Dividend Value Fund. |
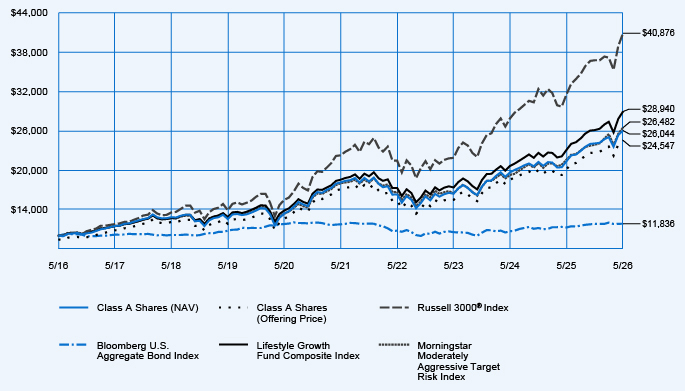
Average Annual Total Returns
| 1‑Year | 5‑Year | 10‑Year | ||||||||||
| Class A Shares at NAV (excluding maximum sales charge) |
21.85 | % | 7.51 | % | 10.05 | % | ||||||
| Class A Shares at maximum sales charge (Offering Price) |
14.85 | % | 6.24 | % | 9.40 | % | ||||||
| Russell 3000® Index |
29.45 | % | 12.92 | % | 15.12 | % | ||||||
| Bloomberg U.S. Aggregate Bond Index |
5.13 | % | 0.17 | % | 1.70 | % | ||||||
| Lifestyle Growth Fund Composite Index |
25.27 | % | 9.30 | % | 11.21 | % | ||||||
| Morningstar Moderately Aggressive Target Risk Index |
22.67 | % | 8.02 | % | 10.23 | % | ||||||
Fund Statistics (as of May 31, 2026)
| Fund net assets |
$ | 354,578,249 | ||
| Total number of portfolio holdings |
16 | |||
| Portfolio turnover (%) |
21% | |||
| Total management fees paid for the year |
$ | 332,312 | ||
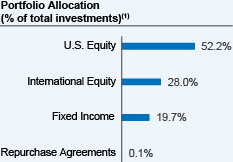 |
| (1) | Affiliated investment companies (Underlying Funds), except for repurchase agreements, where applicable. |
How has the Fund changed?
Portfolio manager update: Effective October 1, 2025, Jeff Sun, CFA was added as a portfolio manager of the Fund.
Fee waiver/reimbursement: Effective May 1, 2026, Teachers Advisors, LLC has agreed to waive fees and/or reimburse expenses of the Fund through July 31, 2028 so that the maximum total annual operating expenses of the Fund (excluding interest expenses, taxes brokerage commissions or other transactional expenses, acquired fund fees and expenses and extraordinary expenses) under the Fund’s contractual expense reimbursement agreements are reduced by 0.03% of the average daily net assets of any class of Fund shares.
For more complete information, you may review the Fund’s next prospectus, which is expected to be available by October 1, 2026 at https://www.nuveen.com/en‑us/mutual‑funds/prospectuses or upon request at (800) 257‑8787.
Fee waiver/reimbursement: Effective May 1, 2026, Teachers Advisors, LLC has agreed to waive fees and/or reimburse expenses of the Fund through July 31, 2028 so that the maximum total annual operating expenses of the Fund (excluding interest expenses, taxes brokerage commissions or other transactional expenses, acquired fund fees and expenses and extraordinary expenses) under the Fund’s contractual expense reimbursement agreements are reduced by 0.03% of the average daily net assets of any class of Fund shares.
For more complete information, you may review the Fund’s next prospectus, which is expected to be available by October 1, 2026 at https://www.nuveen.com/en‑us/mutual‑funds/prospectuses or upon request at (800) 257‑8787.
This report describes changes to the Fund that occurred during the reporting period.
What were the Fund costs for the last year? (based on a hypothetical $10,000 investment)
| Cost of a $10,000 investment | Costs paid as a percentage of $10,000 investment* | |||
| Class I Shares |
$18 | 0.16% | ||
| * | The Fund’s ratios do not include the expenses or income of the Underlying Funds. Annualized for period less than one year. |
How did the Fund perform last year? What affected the Fund’s performance?
| Performance Highlights The Nuveen Lifestyle Growth Fund returned 22.09% for Class I Shares at net asset value (NAV) for the 12 months ended May 31, 2026. The Fund underperformed the Lifestyle Growth Fund Composite Index, which returned 25.27%. The Fund’s Composite Index consisted of: 52.0% Russell 3000® Index; 28.0% MSCI All Country World Index ex USA Investable Market Index; and 20.0% Bloomberg U.S. Aggregate Bond Index. Top contributors to relative performance • Holding the Nuveen Quant International Small Cap Equity Fund. • An allocation to the Nuveen International Equity Fund. • A position in the Nuveen Core Plus Bond Fund. Top detractors from relative performance • A position in the Nuveen Dividend Growth Fund. • Holding the Nuveen International Opportunities Fund. • An allocation to the Nuveen Dividend Value Fund. |
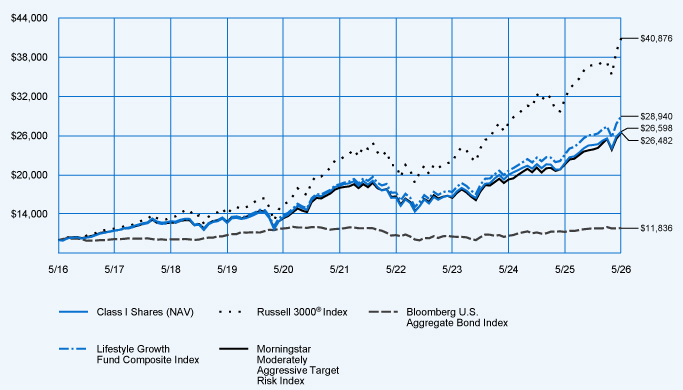
Average Annual Total Returns
| 1‑Year | 5‑Year | 10‑Year | ||||||||||
| Class I Shares at NAV |
22.09 | % | 7.72 | % | 10.28 | % | ||||||
| Russell 3000® Index |
29.45 | % | 12.92 | % | 15.12 | % | ||||||
| Bloomberg U.S. Aggregate Bond Index |
5.13 | % | 0.17 | % | 1.70 | % | ||||||
| Lifestyle Growth Fund Composite Index |
25.27 | % | 9.30 | % | 11.21 | % | ||||||
| Morningstar Moderately Aggressive Target Risk Index |
22.67 | % | 8.02 | % | 10.23 | % | ||||||
Fund Statistics (as of May 31, 2026)
| Fund net assets |
$ | 354,578,249 | ||
| Total number of portfolio holdings |
16 | |||
| Portfolio turnover (%) |
21% | |||
| Total management fees paid for the year |
$ | 332,312 | ||
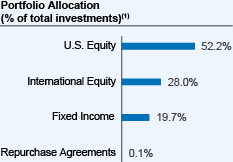 |
| (1) | Affiliated investment companies (Underlying Funds), except for repurchase agreements, where applicable. |
How has the Fund changed?
Portfolio manager update: Effective October 1, 2025, Jeff Sun, CFA was added as a portfolio manager of the Fund.
Fee waiver/reimbursement: Effective May 1, 2026, Teachers Advisors, LLC has agreed to waive fees and/or reimburse expenses of the Fund through July 31, 2028 so that the maximum total annual operating expenses of the Fund (excluding interest expenses, taxes brokerage commissions or other transactional expenses, acquired fund fees and expenses and extraordinary expenses) under the Fund’s contractual expense reimbursement agreements are reduced by 0.03% of the average daily net assets of any class of Fund shares.
For more complete information, you may review the Fund’s next prospectus, which is expected to be available by October 1, 2026 at https://www.nuveen.com/en‑us/mutual‑funds/prospectuses or upon request at (800) 257‑8787.
Fee waiver/reimbursement: Effective May 1, 2026, Teachers Advisors, LLC has agreed to waive fees and/or reimburse expenses of the Fund through July 31, 2028 so that the maximum total annual operating expenses of the Fund (excluding interest expenses, taxes brokerage commissions or other transactional expenses, acquired fund fees and expenses and extraordinary expenses) under the Fund’s contractual expense reimbursement agreements are reduced by 0.03% of the average daily net assets of any class of Fund shares.
For more complete information, you may review the Fund’s next prospectus, which is expected to be available by October 1, 2026 at https://www.nuveen.com/en‑us/mutual‑funds/prospectuses or upon request at (800) 257‑8787.
This report describes changes to the Fund that occurred during the reporting period.
What were the Fund costs for the last year? (based on a hypothetical $10,000 investment)
| Cost of a $10,000 investment | Costs paid as a percentage of $10,000 investment* | |||
| Premier Class Shares |
$28 | 0.25% | ||
| * | The Fund’s ratios do not include the expenses or income of the Underlying Funds. Annualized for period less than one year. |
How did the Fund perform last year? What affected the Fund’s performance?
| Performance Highlights The Nuveen Lifestyle Growth Fund returned 22.03% for Premier Class Shares at net asset value (NAV) for the 12 months ended May 31, 2026. The Fund underperformed the Lifestyle Growth Fund Composite Index, which returned 25.27%. The Fund’s Composite Index consisted of: 52.0% Russell 3000® Index; 28.0% MSCI All Country World Index ex USA Investable Market Index; and 20.0% Bloomberg U.S. Aggregate Bond Index. Top contributors to relative performance • Holding the Nuveen Quant International Small Cap Equity Fund. • An allocation to the Nuveen International Equity Fund. • A position in the Nuveen Core Plus Bond Fund. Top detractors from relative performance • A position in the Nuveen Dividend Growth Fund. • Holding the Nuveen International Opportunities Fund. • An allocation to the Nuveen Dividend Value Fund. |
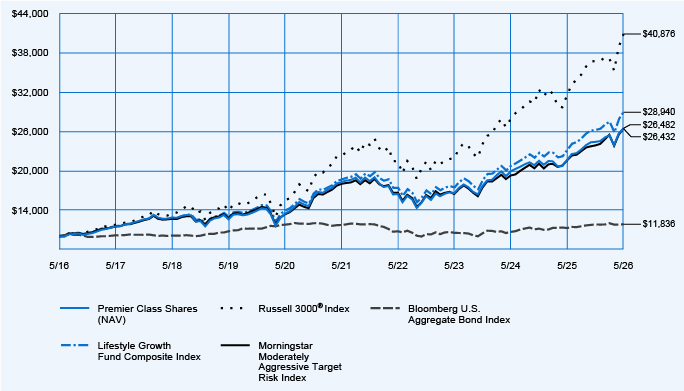
Average Annual Total Returns
| 1‑Year | 5‑Year | 10‑Year | ||||||||||
| Premier Class Shares at NAV |
22.03 | % | 7.67 | % | 10.21 | % | ||||||
| Russell 3000® Index |
29.45 | % | 12.92 | % | 15.12 | % | ||||||
| Bloomberg U.S. Aggregate Bond Index |
5.13 | % | 0.17 | % | 1.70 | % | ||||||
| Lifestyle Growth Fund Composite Index |
25.27 | % | 9.30 | % | 11.21 | % | ||||||
| Morningstar Moderately Aggressive Target Risk Index |
22.67 | % | 8.02 | % | 10.23 | % | ||||||
Fund Statistics (as of May 31, 2026)
| Fund net assets |
$ | 354,578,249 | ||
| Total number of portfolio holdings |
16 | |||
| Portfolio turnover (%) |
21% | |||
| Total management fees paid for the year |
$ | 332,312 | ||
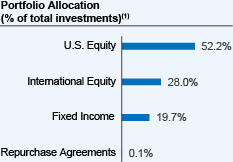 |
| (1) | Affiliated investment companies (Underlying Funds), except for repurchase agreements, where applicable. |
How has the Fund changed?
Portfolio manager update: Effective October 1, 2025, Jeff Sun, CFA was added as a portfolio manager of the Fund.
Fee waiver/reimbursement: Effective May 1, 2026, Teachers Advisors, LLC has agreed to waive fees and/or reimburse expenses of the Fund through July 31, 2028 so that the maximum total annual operating expenses of the Fund (excluding interest expenses, taxes brokerage commissions or other transactional expenses, acquired fund fees and expenses and extraordinary expenses) under the Fund’s contractual expense reimbursement agreements are reduced by 0.03% of the average daily net assets of any class of Fund shares.
For more complete information, you may review the Fund’s next prospectus, which is expected to be available by October 1, 2026 at https://www.nuveen.com/en‑us/mutual‑funds/prospectuses or upon request at (800) 257‑8787.
Fee waiver/reimbursement: Effective May 1, 2026, Teachers Advisors, LLC has agreed to waive fees and/or reimburse expenses of the Fund through July 31, 2028 so that the maximum total annual operating expenses of the Fund (excluding interest expenses, taxes brokerage commissions or other transactional expenses, acquired fund fees and expenses and extraordinary expenses) under the Fund’s contractual expense reimbursement agreements are reduced by 0.03% of the average daily net assets of any class of Fund shares.
For more complete information, you may review the Fund’s next prospectus, which is expected to be available by October 1, 2026 at https://www.nuveen.com/en‑us/mutual‑funds/prospectuses or upon request at (800) 257‑8787.
This report describes changes to the Fund that occurred during the reporting period.
What were the Fund costs for the last year? (based on a hypothetical $10,000 investment)
| Cost of a $10,000 investment | Costs paid as a percentage of $10,000 investment* | |||
| Class R6 Shares |
$11 | 0.10% | ||
| * | The Fund’s ratios do not include the expenses or income of the Underlying Funds. Annualized for period less than one year. |
How did the Fund perform last year? What affected the Fund’s performance?
| Performance Highlights The Nuveen Lifestyle Growth Fund returned 22.18% for Class R6 Shares at net asset value (NAV) for the 12 months ended May 31, 2026. The Fund underperformed the Lifestyle Growth Fund Composite Index, which returned 25.27%. The Fund’s Composite Index consisted of: 52.0% Russell 3000® Index; 28.0% MSCI All Country World Index ex USA Investable Market Index; and 20.0% Bloomberg U.S. Aggregate Bond Index. Top contributors to relative performance • Holding the Nuveen Quant International Small Cap Equity Fund. • An allocation to the Nuveen International Equity Fund. • A position in the Nuveen Core Plus Bond Fund. Top detractors from relative performance • A position in the Nuveen Dividend Growth Fund. • Holding the Nuveen International Opportunities Fund. • An allocation to the Nuveen Dividend Value Fund. |
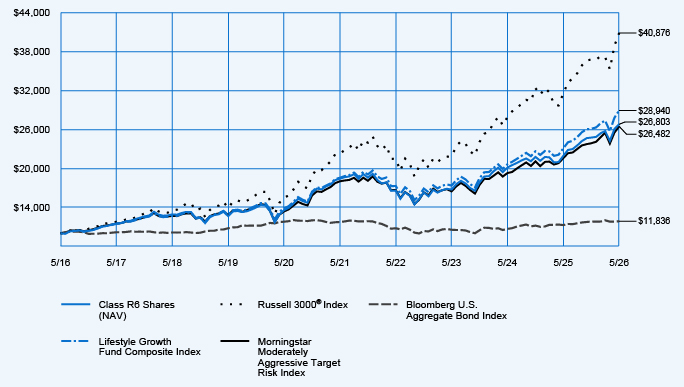
Average Annual Total Returns
| 1‑Year | 5‑Year | 10‑Year | ||||||||||
| Class R6 Shares at NAV |
22.18 | % | 7.80 | % | 10.36 | % | ||||||
| Russell 3000® Index |
29.45 | % | 12.92 | % | 15.12 | % | ||||||
| Bloomberg U.S. Aggregate Bond Index |
5.13 | % | 0.17 | % | 1.70 | % | ||||||
| Lifestyle Growth Fund Composite Index |
25.27 | % | 9.30 | % | 11.21 | % | ||||||
| Morningstar Moderately Aggressive Target Risk Index |
22.67 | % | 8.02 | % | 10.23 | % | ||||||
Fund Statistics (as of May 31, 2026)
| Fund net assets |
$ | 354,578,249 | ||
| Total number of portfolio holdings |
16 | |||
| Portfolio turnover (%) |
21% | |||
| Total management fees paid for the year |
$ | 332,312 | ||
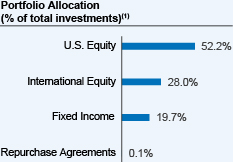 |
| (1) | Affiliated investment companies (Underlying Funds), except for repurchase agreements, where applicable. |
How has the Fund changed?
Portfolio manager update: Effective October 1, 2025, Jeff Sun, CFA was added as a portfolio manager of the Fund.
Fee waiver/reimbursement: Effective May 1, 2026, Teachers Advisors, LLC has agreed to waive fees and/or reimburse expenses of the Fund through July 31, 2028 so that the maximum total annual operating expenses of the Fund (excluding interest expenses, taxes brokerage commissions or other transactional expenses, acquired fund fees and expenses and extraordinary expenses) under the Fund’s contractual expense reimbursement agreements are reduced by 0.03% of the average daily net assets of any class of Fund shares.
For more complete information, you may review the Fund’s next prospectus, which is expected to be available by October 1, 2026 at https://www.nuveen.com/en‑us/mutual‑funds/prospectuses or upon request at (800) 257‑8787.
Fee waiver/reimbursement: Effective May 1, 2026, Teachers Advisors, LLC has agreed to waive fees and/or reimburse expenses of the Fund through July 31, 2028 so that the maximum total annual operating expenses of the Fund (excluding interest expenses, taxes brokerage commissions or other transactional expenses, acquired fund fees and expenses and extraordinary expenses) under the Fund’s contractual expense reimbursement agreements are reduced by 0.03% of the average daily net assets of any class of Fund shares.
For more complete information, you may review the Fund’s next prospectus, which is expected to be available by October 1, 2026 at https://www.nuveen.com/en‑us/mutual‑funds/prospectuses or upon request at (800) 257‑8787.
This report describes changes to the Fund that occurred during the reporting period.
What were the Fund costs for the last year? (based on a hypothetical $10,000 investment)
| Cost of a $10,000 investment | Costs paid as a percentage of $10,000 investment* | |||
| Retirement Class Shares |
$39 | 0.35% | ||
| * | The Fund’s ratios do not include the expenses or income of the Underlying Funds. Annualized for period less than one year. |
How did the Fund perform last year? What affected the Fund’s performance?
| Performance Highlights The Nuveen Lifestyle Growth Fund returned 21.89% for Retirement Class Shares at net asset value (NAV) for the 12 months ended May 31, 2026. The Fund underperformed the Lifestyle Growth Fund Composite Index, which returned 25.27%. The Fund’s Composite Index consisted of: 52.0% Russell 3000® Index; 28.0% MSCI All Country World Index ex USA Investable Market Index; and 20.0% Bloomberg U.S. Aggregate Bond Index. Top contributors to relative performance • Holding the Nuveen Quant International Small Cap Equity Fund. • An allocation to the Nuveen International Equity Fund. • A position in the Nuveen Core Plus Bond Fund. Top detractors from relative performance • A position in the Nuveen Dividend Growth Fund. • Holding the Nuveen International Opportunities Fund. • An allocation to the Nuveen Dividend Value Fund. |
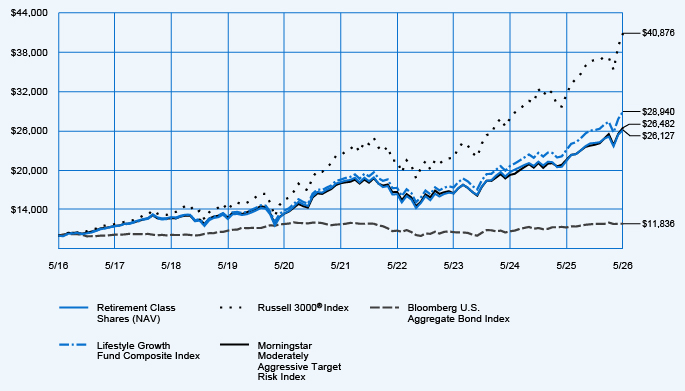
Average Annual Total Returns
| 1-Year | 5-Year | 10-Year | ||||||||||
| Retirement Class Shares at NAV |
21.89 | % | 7.54 | % | 10.08 | % | ||||||
| Russell 3000® Index |
29.45 | % | 12.92 | % | 15.12 | % | ||||||
| Bloomberg U.S. Aggregate Bond Index |
5.13 | % | 0.17 | % | 1.70 | % | ||||||
| Lifestyle Growth Fund Composite Index |
25.27 | % | 9.30 | % | 11.21 | % | ||||||
| Morningstar Moderately Aggressive Target Risk Index |
22.67 | % | 8.02 | % | 10.23 | % | ||||||
Fund Statistics (as of May 31, 2026)
| Fund net assets |
$ | 354,578,249 | ||
| Total number of portfolio holdings |
16 | |||
| Portfolio turnover (%) |
21% | |||
| Total management fees paid for the year |
$ | 332,312 | ||
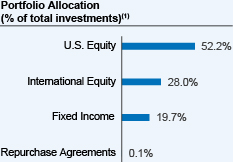 |
| (1) | Affiliated investment companies (Underlying Funds), except for repurchase agreements, where applicable. |
How has the Fund changed?
Portfolio manager update: Effective October 1, 2025, Jeff Sun, CFA was added as a portfolio manager of the Fund.
Fee waiver/reimbursement: Effective May 1, 2026, Teachers Advisors, LLC has agreed to waive fees and/or reimburse expenses of the Fund through July 31, 2028 so that the maximum total annual operating expenses of the Fund (excluding interest expenses, taxes brokerage commissions or other transactional expenses, acquired fund fees and expenses and extraordinary expenses) under the Fund’s contractual expense reimbursement agreements are reduced by 0.03% of the average daily net assets of any class of Fund shares.
For more complete information, you may review the Fund’s next prospectus, which is expected to be available by October 1, 2026 at https://www.nuveen.com/en-us/mutual-funds/prospectuses or upon request at (800) 257-8787.
Fee waiver/reimbursement: Effective May 1, 2026, Teachers Advisors, LLC has agreed to waive fees and/or reimburse expenses of the Fund through July 31, 2028 so that the maximum total annual operating expenses of the Fund (excluding interest expenses, taxes brokerage commissions or other transactional expenses, acquired fund fees and expenses and extraordinary expenses) under the Fund’s contractual expense reimbursement agreements are reduced by 0.03% of the average daily net assets of any class of Fund shares.
For more complete information, you may review the Fund’s next prospectus, which is expected to be available by October 1, 2026 at https://www.nuveen.com/en-us/mutual-funds/prospectuses or upon request at (800) 257-8787.
This report describes changes to the Fund that occurred during the reporting period.
What were the Fund costs for the last year? (based on a hypothetical $10,000 investment)
| Cost of a $10,000 investment | Costs paid as a percentage of $10,000 investment* | |||
| Retirement Class Shares |
$37 | 0.35% | ||
| * | The Fund’s ratios do not include the expenses or income of the Underlying Funds. Annualized for period less than one year. |
How did the Fund perform last year? What affected the Fund’s performance?
| Performance Highlights The Nuveen Lifestyle Income Fund returned 8.86% for Retirement Class Shares at net asset value (NAV) for the 12 months ended May 31, 2026. The Fund underperformed the Lifestyle Income Fund Composite Index, which returned 9.38%. The Fund’s Composite Index consisted of: 40.0% Bloomberg U.S. Aggregate Bond Index; 40.0% Bloomberg U.S. 1–3 Year Government/Credit Bond Index; 13.0% Russell 3000® Index; and 7.0% MSCI All Country World Index ex USA Investable Market Index. Top contributors to relative performance • Strong overall performance of the underlying funds investing in fixed income, led by the Nuveen Short Term Bond Fund. • An allocation to the Nuveen Core Plus Bond Fund. • A position in the Nuveen Core Bond Fund. Top detractors from relative performance • A position in the Nuveen Dividend Growth Fund. • Holding the Nuveen International Opportunities Fund. • An allocation to the Nuveen Dividend Value Fund. |
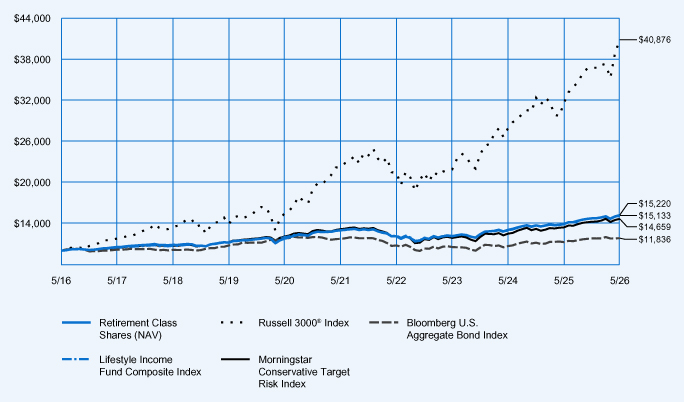
Average Annual Total Returns
| 1-Year | 5-Year | 10-Year | ||||||||||
| Retirement Class Shares at NAV |
8.86 | % | 3.12 | % | 4.23 | % | ||||||
| Russell 3000® Index |
29.45 | % | 12.92 | % | 15.12 | % | ||||||
| Bloomberg U.S. Aggregate Bond Index |
5.13 | % | 0.17 | % | 1.70 | % | ||||||
| Lifestyle Income Fund Composite Index |
9.38 | % | 3.29 | % | 4.29 | % | ||||||
| Morningstar Conservative Target Risk Index |
9.30 | % | 2.20 | % | 3.90 | % | ||||||
Fund Statistics (as of May 31, 2026)
| Fund net assets |
$ | 70,847,760 | ||
| Total number of portfolio holdings |
18 | |||
| Portfolio turnover (%) |
16% | |||
| Total management fees paid for the year |
$ | 75,581 | ||
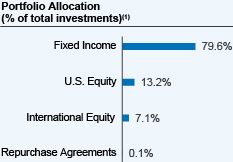 |
| (1) | Affiliated investment companies (Underlying Funds), except for repurchase agreements, where applicable. |
How has the Fund changed?
Portfolio manager update: Effective October 1, 2025, Jeff Sun, CFA was added as a portfolio manager of the Fund.
For more complete information, you may review the Fund’s next prospectus, which is expected to be available by October 1, 2026 at https://www.nuveen.com/en‑us/mutual‑funds/prospectuses or upon request at (800) 257‑8787.
For more complete information, you may review the Fund’s next prospectus, which is expected to be available by October 1, 2026 at https://www.nuveen.com/en‑us/mutual‑funds/prospectuses or upon request at (800) 257‑8787.
This report describes changes to the Fund that occurred during the reporting period.
What were the Fund costs for the last year? (based on a hypothetical $10,000 investment)
| Cost of a $10,000 investment | Costs paid as a percentage of $10,000 investment* | |||
| Class R6 Shares |
$10 | 0.10% | ||
| * | The Fund’s ratios do not include the expenses or income of the Underlying Funds. Annualized for period less than one year. |
How did the Fund perform last year? What affected the Fund’s performance?
| Performance Highlights The Nuveen Lifestyle Income Fund returned 9.13% for Class R6 Shares at net asset value (NAV) for the 12 months ended May 31, 2026. The Fund performed in line with the Lifestyle Income Fund Composite Index, which returned 9.38%. The Fund’s Composite Index consisted of: 40.0% Bloomberg U.S. Aggregate Bond Index; 40.0% Bloomberg U.S. 1–3 Year Government/Credit Bond Index; 13.0% Russell 3000® Index; and 7.0% MSCI All Country World Index ex USA Investable Market Index. Top contributors to relative performance • Strong overall performance of the underlying funds investing in fixed income, led by the Nuveen Short Term Bond Fund. • An allocation to the Nuveen Core Plus Bond Fund. • A position in the Nuveen Core Bond Fund. Top detractors from relative performance • A position in the Nuveen Dividend Growth Fund. • Holding the Nuveen International Opportunities Fund. • An allocation to the Nuveen Dividend Value Fund. |
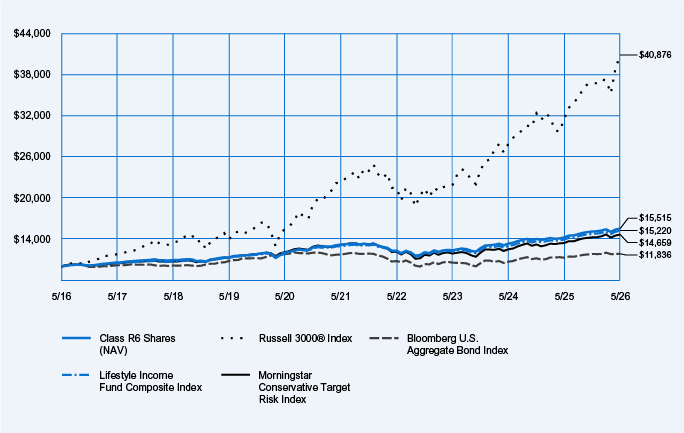
Average Annual Total Returns
| 1-Year | 5-Year | 10-Year | ||||||||||
| Class R6 Shares at NAV |
9.13 | % | 3.36 | % | 4.49 | % | ||||||
| Russell 3000® Index |
29.45 | % | 12.92 | % | 15.12 | % | ||||||
| Bloomberg U.S. Aggregate Bond Index |
5.13 | % | 0.17 | % | 1.70 | % | ||||||
| Lifestyle Income Fund Composite Index |
9.38 | % | 3.29 | % | 4.29 | % | ||||||
| Morningstar Conservative Target Risk Index |
9.30 | % | 2.20 | % | 3.90 | % | ||||||
Fund Statistics (as of May 31, 2026)
| Fund net assets |
$ | 70,847,760 | ||
| Total number of portfolio holdings |
18 | |||
| Portfolio turnover (%) |
16% | |||
| Total management fees paid for the year |
$ | 75,581 | ||
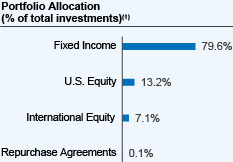 |
| (1) | Affiliated investment companies (Underlying Funds), except for repurchase agreements, where applicable. |
How has the Fund changed?
Portfolio manager update: Effective October 1, 2025, Jeff Sun, CFA was added as a portfolio manager of the Fund.
For more complete information, you may review the Fund’s next prospectus, which is expected to be available by October 1, 2026 at https://www.nuveen.com/en-us/mutual-funds/prospectuses or upon request at (800) 257-8787.
For more complete information, you may review the Fund’s next prospectus, which is expected to be available by October 1, 2026 at https://www.nuveen.com/en-us/mutual-funds/prospectuses or upon request at (800) 257-8787.
This report describes changes to the Fund that occurred during the reporting period.
What were the Fund costs for the last year? (based on a hypothetical $10,000 investment)
| Cost of a $10,000 investment | Costs paid as a percentage of $10,000 investment* | |||
| Premier Class Shares |
$26 | 0.25% | ||
| * | The Fund’s ratios do not include the expenses or income of the Underlying Funds. Annualized for period less than one year. |
How did the Fund perform last year? What affected the Fund’s performance?
| Performance Highlights The Nuveen Lifestyle Income Fund returned 8.93% for Premier Class Shares at net asset value (NAV) for the 12 months ended May 31, 2026. The Fund underperformed the Lifestyle Income Fund Composite Index, which returned 9.38%. The Fund’s Composite Index consisted of: 40.0% Bloomberg U.S. Aggregate Bond Index; 40.0% Bloomberg U.S. 1–3 Year Government/Credit Bond Index; 13.0% Russell 3000® Index; and 7.0% MSCI All Country World Index ex USA Investable Market Index. Top contributors to relative performance • Strong overall performance of the underlying funds investing in fixed income, led by the Nuveen Short Term Bond Fund. • An allocation to the Nuveen Core Plus Bond Fund. • A position in the Nuveen Core Bond Fund. Top detractors from relative performance • A position in the Nuveen Dividend Growth Fund. • Holding the Nuveen International Opportunities Fund. • An allocation to the Nuveen Dividend Value Fund. |
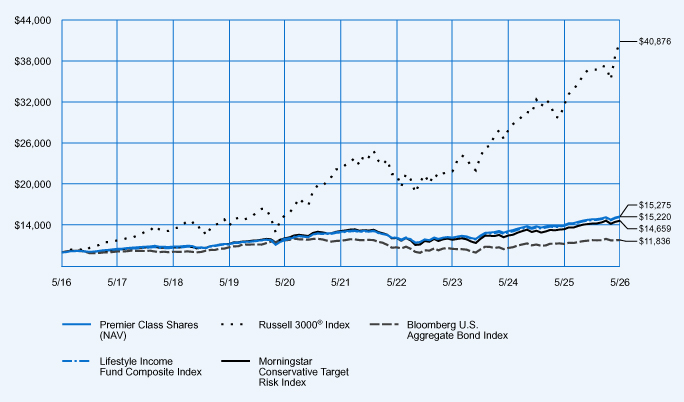
Average Annual Total Returns
| 1-Year | 5-Year | 10-Year | ||||||||||
| Premier Class Shares at NAV |
8.93 | % | 3.23 | % | 4.33 | % | ||||||
| Russell 3000® Index |
29.45 | % | 12.92 | % | 15.12 | % | ||||||
| Bloomberg U.S. Aggregate Bond Index |
5.13 | % | 0.17 | % | 1.70 | % | ||||||
| Lifestyle Income Fund Composite Index |
9.38 | % | 3.29 | % | 4.29 | % | ||||||
| Morningstar Conservative Target Risk Index |
9.30 | % | 2.20 | % | 3.90 | % | ||||||
Fund Statistics (as of May 31, 2026)
| Fund net assets |
$ | 70,847,760 | ||
| Total number of portfolio holdings |
18 | |||
| Portfolio turnover (%) |
16% | |||
| Total management fees paid for the year |
$ | 75,581 | ||
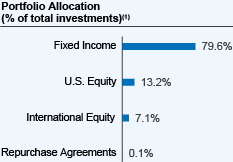 |
| (1) | Affiliated investment companies (Underlying Funds), except for repurchase agreements, where applicable. |
How has the Fund changed?
Portfolio manager update: Effective October 1, 2025, Jeff Sun, CFA was added as a portfolio manager of the Fund.
For more complete information, you may review the Fund’s next prospectus, which is expected to be available by October 1, 2026 at https://www.nuveen.com/en-us/mutual-funds/prospectuses or upon request at (800) 257-8787.
For more complete information, you may review the Fund’s next prospectus, which is expected to be available by October 1, 2026 at https://www.nuveen.com/en-us/mutual-funds/prospectuses or upon request at (800) 257-8787.
This report describes changes to the Fund that occurred during the reporting period.
What were the Fund costs for the last year? (based on a hypothetical $10,000 investment)
| Cost of a $10,000 investment | Costs paid as a percentage of $10,000 investment* | |||
| Class I Shares |
$20 | 0.19% | ||
| * | The Fund’s ratios do not include the expenses or income of the Underlying Funds. Annualized for period less than one year. |
How did the Fund perform last year? What affected the Fund’s performance?
| Performance Highlights The Nuveen Lifestyle Income Fund returned 9.01% for Class I Shares at net asset value (NAV) for the 12 months ended May 31, 2026. The Fund underperformed the Lifestyle Income Fund Composite Index, which returned 9.38%. The Fund’s Composite Index consisted of: 40.0% Bloomberg U.S. Aggregate Bond Index; 40.0% Bloomberg U.S. 1–3 Year Government/Credit Bond Index; 13.0% Russell 3000® Index; and 7.0% MSCI All Country World Index ex USA Investable Market Index. Top contributors to relative performance • Strong overall performance of the underlying funds investing in fixed income, led by the Nuveen Short Term Bond Fund. • An allocation to the Nuveen Core Plus Bond Fund. • A position in the Nuveen Core Bond Fund. Top detractors from relative performance • A position in the Nuveen Dividend Growth Fund. • Holding the Nuveen International Opportunities Fund. • An allocation to the Nuveen Dividend Value Fund. |
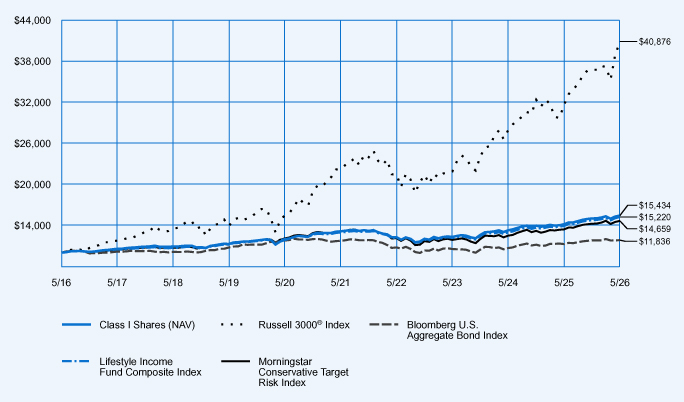
Average Annual Total Returns
| 1-Year | 5-Year | 10-Year | ||||||||||
| Class I Shares at NAV |
9.01 | % | 3.29 | % | 4.44 | % | ||||||
| Russell 3000® Index |
29.45 | % | 12.92 | % | 15.12 | % | ||||||
| Bloomberg U.S. Aggregate Bond Index |
5.13 | % | 0.17 | % | 1.70 | % | ||||||
| Lifestyle Income Fund Composite Index |
9.38 | % | 3.29 | % | 4.29 | % | ||||||
| Morningstar Conservative Target Risk Index |
9.30 | % | 2.20 | % | 3.90 | % | ||||||
Fund Statistics (as of May 31, 2026)
| Fund net assets |
$ | 70,847,760 | ||
| Total number of portfolio holdings |
18 | |||
| Portfolio turnover (%) |
16% | |||
| Total management fees paid for the year |
$ | 75,581 | ||
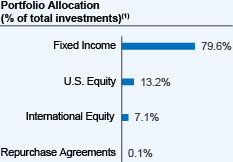 |
| (1) | Affiliated investment companies (Underlying Funds), except for repurchase agreements, where applicable. |
How has the Fund changed?
Portfolio manager update: Effective October 1, 2025, Jeff Sun, CFA was added as a portfolio manager of the Fund.
For more complete information, you may review the Fund’s next prospectus, which is expected to be available by October 1, 2026 at https://www.nuveen.com/en-us/mutual-funds/prospectuses or upon request at (800) 257-8787.
For more complete information, you may review the Fund’s next prospectus, which is expected to be available by October 1, 2026 at https://www.nuveen.com/en-us/mutual-funds/prospectuses or upon request at (800) 257-8787.
This report describes changes to the Fund that occurred during the reporting period.
What were the Fund costs for the last year? (based on a hypothetical $10,000 investment)
| Cost of a $10,000 investment | Costs paid as a percentage of $10,000 investment* | |||
| Class A Shares |
$42 | 0.40% | ||
| * | The Fund’s ratios do not include the expenses or income of the Underlying Funds. Annualized for period less than one year. |
How did the Fund perform last year? What affected the Fund’s performance?
| Performance Highlights The Nuveen Lifestyle Income Fund returned 8.81% for Class A Shares at net asset value (NAV) for the 12 months ended May 31, 2026. The Fund underperformed the Lifestyle Income Fund Composite Index, which returned 9.38%. The Fund’s Composite Index consisted of: 40.0% Bloomberg U.S. Aggregate Bond Index; 40.0% Bloomberg U.S. 1–3 Year Government/Credit Bond Index; 13.0% Russell 3000® Index; and 7.0% MSCI All Country World Index ex USA Investable Market Index. Top contributors to relative performance • Strong overall performance of the underlying funds investing in fixed income, led by the Nuveen Short Term Bond Fund. • An allocation to the Nuveen Core Plus Bond Fund. • A position in the Nuveen Core Bond Fund. Top detractors from relative performance • A position in the Nuveen Dividend Growth Fund. • Holding the Nuveen International Opportunities Fund. • An allocation to the Nuveen Dividend Value Fund. |
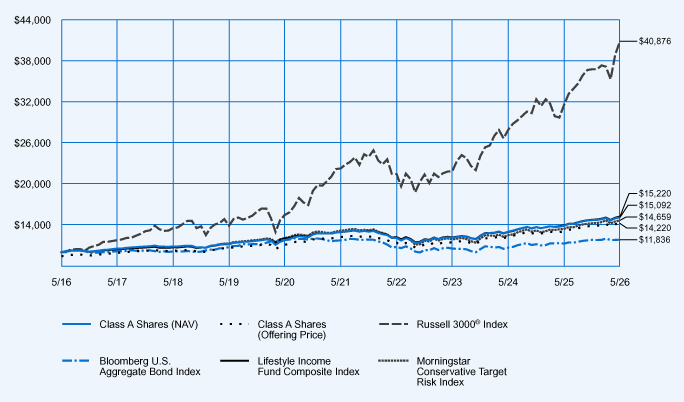
Average Annual Total Returns
| 1-Year | 5-Year | 10-Year | ||||||||||
| Class A Shares at NAV (excluding maximum sales charge) |
8.81 | % | 3.08 | % | 4.20 | % | ||||||
| Class A Shares at maximum sales charge (Offering Price) |
2.53 | % | 1.87 | % | 3.58 | % | ||||||
| Russell 3000® Index |
29.45 | % | 12.92 | % | 15.12 | % | ||||||
| Bloomberg U.S. Aggregate Bond Index |
5.13 | % | 0.17 | % | 1.70 | % | ||||||
| Lifestyle Income Fund Composite Index |
9.38 | % | 3.29 | % | 4.29 | % | ||||||
| Morningstar Conservative Target Risk Index |
9.30 | % | 2.20 | % | 3.90 | % | ||||||
Fund Statistics (as of May 31, 2026)
| Fund net assets |
$ | 70,847,760 | ||
| Total number of portfolio holdings |
18 | |||
| Portfolio turnover (%) |
16% | |||
| Total management fees paid for the year |
$ | 75,581 | ||
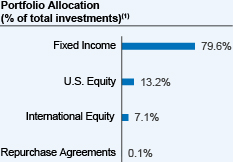 |
| (1) | Affiliated investment companies (Underlying Funds), except for repurchase agreements, where applicable. |
How has the Fund changed?
Portfolio manager update: Effective October 1, 2025, Jeff Sun, CFA was added as a portfolio manager of the Fund.
For more complete information, you may review the Fund’s next prospectus, which is expected to be available by October 1, 2026 at https://www.nuveen.com/en-us/mutual-funds/prospectuses or upon request at (800) 257-8787.
For more complete information, you may review the Fund’s next prospectus, which is expected to be available by October 1, 2026 at https://www.nuveen.com/en-us/mutual-funds/prospectuses or upon request at (800) 257-8787.
This report describes changes to the Fund that occurred during the reporting period.
What were the Fund costs for the last year? (based on a hypothetical $10,000 investment)
| Cost of a $10,000 investment | Costs paid as a percentage of $10,000 investment* | |||
| Class A Shares |
$44 | 0.40% | ||
| * | The Fund’s ratios do not include the expenses or income of the Underlying Funds. Annualized for period less than one year. |
How did the Fund perform last year? What affected the Fund’s performance?
| Performance Highlights The Nuveen Lifestyle Moderate Fund returned 17.62% for Class A Shares at net asset value (NAV) for the 12 months ended May 31, 2026. The Fund underperformed the Lifestyle Moderate Fund Composite Index, which returned 20.02%. The Fund’s Composite Index consisted of: 40.0% Bloomberg U.S. Aggregate Bond Index; 39.0% Russell 3000® Index; and 21.0% MSCI All Country World Index ex USA Investable Market Index. Top contributors to relative performance • Holding the Nuveen Core Plus Bond Fund. • An allocation to the Nuveen Quant International Small Cap Equity Fund. • A position in the Nuveen International Equity Fund. Top detractors from relative performance • A position in the Nuveen Dividend Growth Fund. • Holding the Nuveen International Opportunities Fund. • An allocation to the Nuveen Dividend Value Fund. |
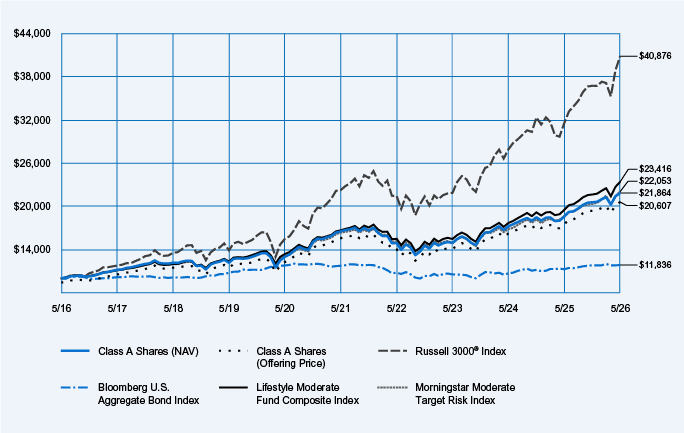
Average Annual Total Returns
| 1-Year | 5-Year | 10-Year | ||||||||||
| Class A Shares at NAV (excluding maximum sales charge) |
17.62 | % | 5.78 | % | 8.14 | % | ||||||
| Class A Shares at maximum sales charge (Offering Price) |
10.86 | % | 4.53 | % | 7.50 | % | ||||||
| Russell 3000® Index |
29.45 | % | 12.92 | % | 15.12 | % | ||||||
| Bloomberg U.S. Aggregate Bond Index |
5.13 | % | 0.17 | % | 1.70 | % | ||||||
| Lifestyle Moderate Fund Composite Index |
20.02 | % | 7.04 | % | 8.88 | % | ||||||
| Morningstar Moderate Target Risk Index |
18.36 | % | 6.16 | % | 8.23 | % | ||||||
Fund Statistics (as of May 31, 2026)
| Fund net assets |
$ | 624,419,374 | ||
| Total number of portfolio holdings |
16 | |||
| Portfolio turnover (%) |
20% | |||
| Total management fees paid for the year |
$ | 597,302 | ||
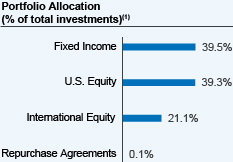 |
| (1) | Affiliated investment companies (Underlying Funds), except for repurchase agreements, where applicable. |
How has the Fund changed?
Portfolio manager update: Effective October 1, 2025, Jeff Sun, CFA was added as a portfolio manager of the Fund.
For more complete information, you may review the Fund’s next prospectus, which is expected to be available by October 1, 2026 at https://www.nuveen.com/en-us/mutual-funds/prospectuses or upon request at (800) 257-8787.
For more complete information, you may review the Fund’s next prospectus, which is expected to be available by October 1, 2026 at https://www.nuveen.com/en-us/mutual-funds/prospectuses or upon request at (800) 257-8787.
This report describes changes to the Fund that occurred during the reporting period.
What were the Fund costs for the last year? (based on a hypothetical $10,000 investment)
| Cost of a $10,000 investment | Costs paid as a percentage of $10,000 investment* | |||
| Class I Shares |
$19 | 0.17% | ||
| * | The Fund’s ratios do not include the expenses or income of the Underlying Funds. Annualized for period less than one year. |
How did the Fund perform last year? What affected the Fund’s performance?
| Performance Highlights The Nuveen Lifestyle Moderate Fund returned 17.92% for Class I Shares at net asset value (NAV) for the 12 months ended May 31, 2026. The Fund underperformed the Lifestyle Moderate Fund Composite Index, which returned 20.02%. The Fund’s Composite Index consisted of: 40.0% Bloomberg U.S. Aggregate Bond Index; 39.0% Russell 3000® Index; and 21.0% MSCI All Country World Index ex USA Investable Market Index. Top contributors to relative performance • Holding the Nuveen Core Plus Bond Fund. • An allocation to the Nuveen Quant International Small Cap Equity Fund. • A position in the Nuveen International Equity Fund. Top detractors from relative performance • A position in the Nuveen Dividend Growth Fund. • Holding the Nuveen International Opportunities Fund. • An allocation to the Nuveen Dividend Value Fund. |
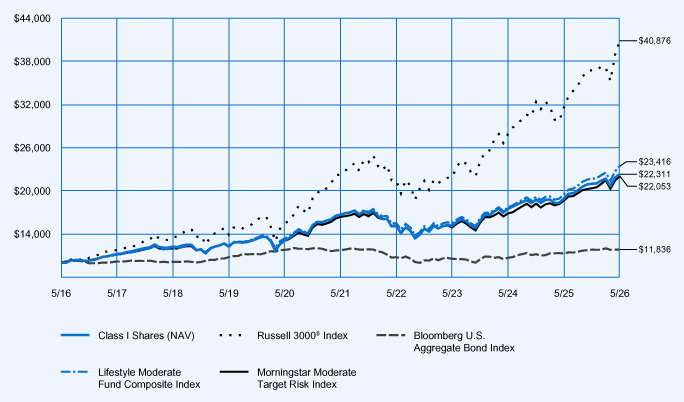
Average Annual Total Returns
| 1-Year | 5-Year | 10-Year | ||||||||||
| Class I Shares at NAV |
17.92 | % | 5.99 | % | 8.36 | % | ||||||
| Russell 3000® Index |
29.45 | % | 12.92 | % | 15.12 | % | ||||||
| Bloomberg U.S. Aggregate Bond Index |
5.13 | % | 0.17 | % | 1.70 | % | ||||||
| Lifestyle Moderate Fund Composite Index |
20.02 | % | 7.04 | % | 8.88 | % | ||||||
| Morningstar Moderate Target Risk Index |
18.36 | % | 6.16 | % | 8.23 | % | ||||||
Fund Statistics (as of May 31, 2026)
| Fund net assets |
$ | 624,419,374 | ||
| Total number of portfolio holdings |
16 | |||
| Portfolio turnover (%) |
20% | |||
| Total management fees paid for the year |
$ | 597,302 | ||
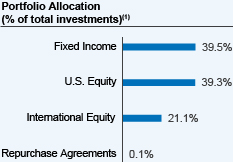 |
| (1) | Affiliated investment companies (Underlying Funds), except for repurchase agreements, where applicable. |
How has the Fund changed?
Portfolio manager update: Effective October 1, 2025, Jeff Sun, CFA was added as a portfolio manager of the Fund.
For more complete information, you may review the Fund’s next prospectus, which is expected to be available by October 1, 2026 at https://www.nuveen.com/en-us/mutual-funds/prospectuses or upon request at (800) 257-8787.
For more complete information, you may review the Fund’s next prospectus, which is expected to be available by October 1, 2026 at https://www.nuveen.com/en-us/mutual-funds/prospectuses or upon request at (800) 257-8787.
This report describes changes to the Fund that occurred during the reporting period.
What were the Fund costs for the last year? (based on a hypothetical $10,000 investment)
| Cost of a $10,000 investment | Costs paid as a percentage of $10,000 investment* | |||
| Premier Class Shares |
$27 | 0.25% | ||
| * | The Fund’s ratios do not include the expenses or income of the Underlying Funds. Annualized for period less than one year. |
How did the Fund perform last year? What affected the Fund’s performance?
| Performance Highlights The Nuveen Lifestyle Moderate Fund returned 17.82% for Premier Class Shares at net asset value (NAV) for the 12 months ended May 31, 2026. The Fund underperformed the Lifestyle Moderate Fund Composite Index, which returned 20.02%. The Fund’s Composite Index consisted of: 40.0% Bloomberg U.S. Aggregate Bond Index; 39.0% Russell 3000® Index; and 21.0% MSCI All Country World Index ex USA Investable Market Index. Top contributors to relative performance • Holding the Nuveen Core Plus Bond Fund. • An allocation to the Nuveen Quant International Small Cap Equity Fund. • A position in the Nuveen International Equity Fund. Top detractors from relative performance • A position in the Nuveen Dividend Growth Fund. • Holding the Nuveen International Opportunities Fund. • An allocation to the Nuveen Dividend Value Fund. |
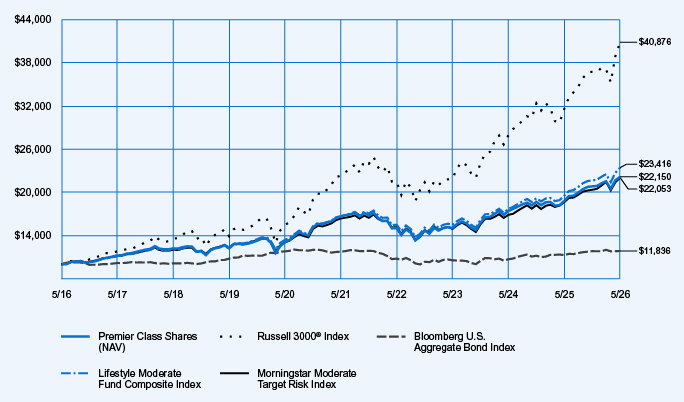
Average Annual Total Returns
| 1-Year | 5-Year | 10-Year | ||||||||||
| Premier Class Shares at NAV |
17.82 | % | 5.93 | % | 8.28 | % | ||||||
| Russell 3000® Index |
29.45 | % | 12.92 | % | 15.12 | % | ||||||
| Bloomberg U.S. Aggregate Bond Index |
5.13 | % | 0.17 | % | 1.70 | % | ||||||
| Lifestyle Moderate Fund Composite Index |
20.02 | % | 7.04 | % | 8.88 | % | ||||||
| Morningstar Moderate Target Risk Index |
18.36 | % | 6.16 | % | 8.23 | % | ||||||
Fund Statistics (as of May 31, 2026)
| Fund net assets |
$ | 624,419,374 | ||
| Total number of portfolio holdings |
16 | |||
| Portfolio turnover (%) |
20% | |||
| Total management fees paid for the year |
$ | 597,302 | ||
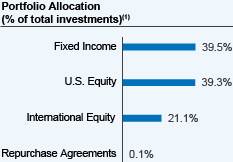 |
| (1) | Affiliated investment companies (Underlying Funds), except for repurchase agreements, where applicable. |
How has the Fund changed?
Portfolio manager update: Effective October 1, 2025, Jeff Sun, CFA was added as a portfolio manager of the Fund.
For more complete information, you may review the Fund’s next prospectus, which is expected to be available by October 1, 2026 at https://www.nuveen.com/en-us/mutual-funds/prospectuses or upon request at (800) 257-8787.
For more complete information, you may review the Fund’s next prospectus, which is expected to be available by October 1, 2026 at https://www.nuveen.com/en-us/mutual-funds/prospectuses or upon request at (800) 257-8787.
This report describes changes to the Fund that occurred during the reporting period.
What were the Fund costs for the last year? (based on a hypothetical $10,000 investment)
| Cost of a $10,000 investment | Costs paid as a percentage of $10,000 investment* | |||
| Class R6 Shares |
$11 | 0.10% | ||
| * | The Fund’s ratios do not include the expenses or income of the Underlying Funds. Annualized for period less than one year. |
How did the Fund perform last year? What affected the Fund’s performance?
| Performance Highlights The Nuveen Lifestyle Moderate Fund returned 18.00% for Class R6 Shares at net asset value (NAV) for the 12 months ended May 31, 2026. The Fund underperformed the Lifestyle Moderate Fund Composite Index, which returned 20.02%. The Fund’s Composite Index consisted of: 40.0% Bloomberg U.S. Aggregate Bond Index; 39.0% Russell 3000® Index; and 21.0% MSCI All Country World Index ex USA Investable Market Index. Top contributors to relative performance • Holding the Nuveen Core Plus Bond Fund. • An allocation to the Nuveen Quant International Small Cap Equity Fund. • A position in the Nuveen International Equity Fund. Top detractors from relative performance • A position in the Nuveen Dividend Growth Fund. • Holding the Nuveen International Opportunities Fund. • An allocation to the Nuveen Dividend Value Fund. |
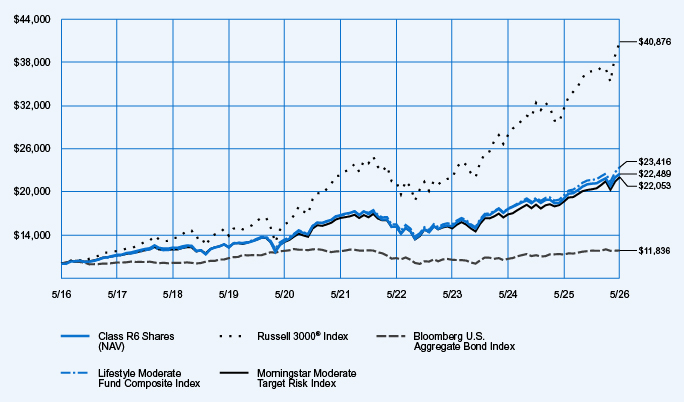
Average Annual Total Returns
| 1-Year | 5-Year | 10-Year | ||||||||||
| Class R6 Shares at NAV |
18.00 | % | 6.08 | % | 8.44 | % | ||||||
| Russell 3000® Index |
29.45 | % | 12.92 | % | 15.12 | % | ||||||
| Bloomberg U.S. Aggregate Bond Index |
5.13 | % | 0.17 | % | 1.70 | % | ||||||
| Lifestyle Moderate Fund Composite Index |
20.02 | % | 7.04 | % | 8.88 | % | ||||||
| Morningstar Moderate Target Risk Index |
18.36 | % | 6.16 | % | 8.23 | % | ||||||
Fund Statistics (as of May 31, 2026)
| Fund net assets |
$ | 624,419,374 | ||
| Total number of portfolio holdings |
16 | |||
| Portfolio turnover (%) |
20% | |||
| Total management fees paid for the year |
$ | 597,302 | ||
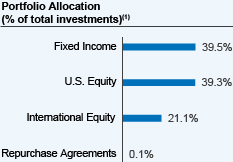 |
| (1) | Affiliated investment companies (Underlying Funds), except for repurchase agreements, where applicable. |
How has the Fund changed?
Portfolio manager update: Effective October 1, 2025, Jeff Sun, CFA was added as a portfolio manager of the Fund.
For more complete information, you may review the Fund’s next prospectus, which is expected to be available by October 1, 2026 at https://www.nuveen.com/en-us/mutual-funds/prospectuses or upon request at (800) 257-8787.
For more complete information, you may review the Fund’s next prospectus, which is expected to be available by October 1, 2026 at https://www.nuveen.com/en-us/mutual-funds/prospectuses or upon request at (800) 257-8787.
This report describes changes to the Fund that occurred during the reporting period.
What were the Fund costs for the last year? (based on a hypothetical $10,000 investment)
| Cost of a $10,000 investment | Costs paid as a percentage of $10,000 investment* | |||
| Retirement Class Shares |
$38 | 0.35% | ||
| * | The Fund’s ratios do not include the expenses or income of the Underlying Funds. Annualized for period less than one year. |
How did the Fund perform last year? What affected the Fund’s performance?
| Performance Highlights The Nuveen Lifestyle Moderate Fund returned 17.67% for Retirement Class Shares at net asset value (NAV) for the 12 months ended May 31, 2026. The Fund underperformed the Lifestyle Moderate Fund Composite Index, which returned 20.02%. The Fund’s Composite Index consisted of: 40.0% Bloomberg U.S. Aggregate Bond Index; 39.0% Russell 3000® Index; and 21.0% MSCI All Country World Index ex USA Investable Market Index. Top contributors to relative performance • Holding the Nuveen Core Plus Bond Fund. • An allocation to the Nuveen Quant International Small Cap Equity Fund. • A position in the Nuveen International Equity Fund. Top detractors from relative performance • A position in the Nuveen Dividend Growth Fund. • Holding the Nuveen International Opportunities Fund. • An allocation to the Nuveen Dividend Value Fund. |
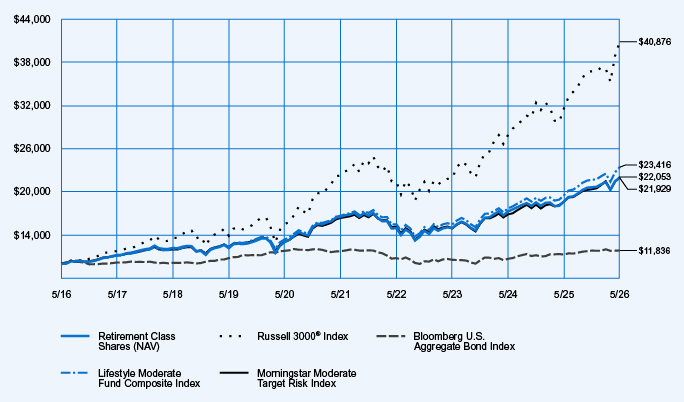
Average Annual Total Returns
| 1-Year | 5-Year | 10-Year | ||||||||||
| Retirement Class Shares at NAV |
17.67 | % | 5.81 | % | 8.17 | % | ||||||
| Russell 3000® Index |
29.45 | % | 12.92 | % | 15.12 | % | ||||||
| Bloomberg U.S. Aggregate Bond Index |
5.13 | % | 0.17 | % | 1.70 | % | ||||||
| Lifestyle Moderate Fund Composite Index |
20.02 | % | 7.04 | % | 8.88 | % | ||||||
| Morningstar Moderate Target Risk Index |
18.36 | % | 6.16 | % | 8.23 | % | ||||||
Fund Statistics (as of May 31, 2026)
| Fund net assets |
$ | 624,419,374 | ||
| Total number of portfolio holdings |
16 | |||
| Portfolio turnover (%) |
20% | |||
| Total management fees paid for the year |
$ | 597,302 | ||
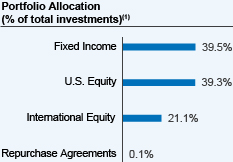 |
| (1) | Affiliated investment companies (Underlying Funds), except for repurchase agreements, where applicable. |
How has the Fund changed?
Portfolio manager update: Effective October 1, 2025, Jeff Sun, CFA was added as a portfolio manager of the Fund.
For more complete information, you may review the Fund’s next prospectus, which is expected to be available by October 1, 2026 at https://www.nuveen.com/en-us/mutual-funds/prospectuses or upon request at (800) 257-8787.
For more complete information, you may review the Fund’s next prospectus, which is expected to be available by October 1, 2026 at https://www.nuveen.com/en-us/mutual-funds/prospectuses or upon request at (800) 257-8787.
This report describes changes to the Fund that occurred during the reporting period.
What were the Fund costs for the last year? (based on a hypothetical $10,000 investment)
| Cost of a $10,000 investment | Costs paid as a percentage of $10,000 investment* | |||
| Retirement Class Shares |
$53 | 0.47% | ||
| * | The Fund’s ratios include the expenses of the Underlying Funds, excluding the expenses of the Dividend Growth, Dividend Value, Growth Opportunities ETF, International Value, Small Cap Select and the Nuveen Real Property Fund LP and exclude the income of the Underlying Funds. Annualized for period less than one year. |
How did the Fund perform last year? What affected the Fund’s performance?
| Performance Highlights The Nuveen Lifecycle 2060 Fund returned 24.61% for Retirement Class Shares at net asset value (NAV) for the 12 months ended May 31, 2026. The Fund underperformed the Lifecycle 2060 Fund Composite Index, which returned 28.59%. The Fund’s Composite Index consisted of: 60.0% Russell 3000® Index; 32.3% MSCI All Country World Index ex USA Investable Market Index; 6.2% Bloomberg U.S. Aggregate Bond Index; and 1.5% Bloomberg Global Aggregate ex-USD Index (Hedged). Top contributors to relative performance • Holding the Nuveen Quant International Small Cap Equity Fund. • An allocation to the Nuveen International Equity Fund. • A position in the Nuveen Growth Opportunities ETF. Top detractors from relative performance • A position in the Nuveen Dividend Growth Fund. • Holding the Nuveen International Opportunities Fund. • An allocation to the Nuveen Dividend Value Fund. |
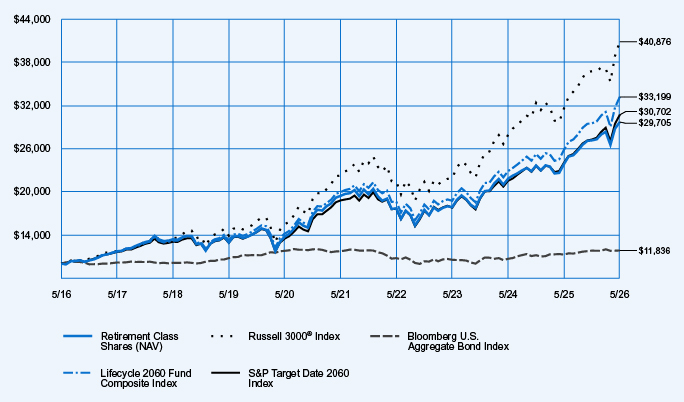
Average Annual Total Returns
| 1-Year | 5-Year | 10-Year | ||||||||||
| Retirement Class Shares at NAV |
24.61 | % | 8.86 | % | 11.50 | % | ||||||
| Russell 3000® Index |
29.45 | % | 12.92 | % | 15.12 | % | ||||||
| Bloomberg U.S. Aggregate Bond Index |
5.13 | % | 0.17 | % | 1.70 | % | ||||||
| Lifecycle 2060 Fund Composite Index |
28.59 | % | 10.73 | % | 12.75 | % | ||||||
| S&P Target Date 2060 Index |
27.80 | % | 10.31 | % | 11.87 | % | ||||||
Fund Statistics (as of May 31, 2026)
| Fund net assets |
$ | 1,118,650,560 | ||
| Total number of portfolio holdings |
21 | |||
| Portfolio turnover (%) |
22% | |||
| Total management fees paid for the year |
$ | 4,054,146 | ||
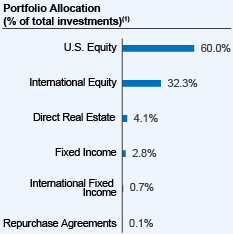 |
| (1) | Affiliated investment companies (Underlying Funds), except for repurchase agreements, where applicable. |
How has the Fund changed?
Portfolio manager update: Effective October 1, 2025, Jeff Sun, CFA was added as a portfolio manager of the Fund.
For more complete information, you may review the Fund’s next prospectus, which is expected to be available by October 1, 2026 at https://www.nuveen.com/en‑us/mutual‑funds/prospectuses or upon request at (800) 257‑8787.
For more complete information, you may review the Fund’s next prospectus, which is expected to be available by October 1, 2026 at https://www.nuveen.com/en‑us/mutual‑funds/prospectuses or upon request at (800) 257‑8787.
This report describes changes to the Fund that occurred during the reporting period.
What were the Fund costs for the last year? (based on a hypothetical $10,000 investment)
| Cost of a $10,000 investment | Costs paid as a percentage of $10,000 investment* | |||
| Class R6 Shares |
$25 | 0.22% | ||
| * | The Fund’s ratios include the expenses of the Underlying Funds, excluding the expenses of the Dividend Growth, Dividend Value, Growth Opportunities ETF, International Value, Small Cap Select and the Nuveen Real Property Fund LP and exclude the income of the Underlying Funds. Annualized for period less than one year. |
How did the Fund perform last year? What affected the Fund’s performance?
| Performance Highlights The Nuveen Lifecycle 2060 Fund returned 24.84% for Class R6 Shares at net asset value (NAV) for the 12 months ended May 31, 2026. The Fund underperformed the Lifecycle 2060 Fund Composite Index, which returned 28.59%. The Fund’s Composite Index consisted of: 60.0% Russell 3000® Index; 32.3% MSCI All Country World Index ex USA Investable Market Index; 6.2% Bloomberg U.S. Aggregate Bond Index; and 1.5% Bloomberg Global Aggregate ex-USD Index (Hedged). Top contributors to relative performance • Holding the Nuveen Quant International Small Cap Equity Fund. • An allocation to the Nuveen International Equity Fund. • A position in the Nuveen Growth Opportunities ETF. Top detractors from relative performance • A position in the Nuveen Dividend Growth Fund. • Holding the Nuveen International Opportunities Fund. • An allocation to the Nuveen Dividend Value Fund. |
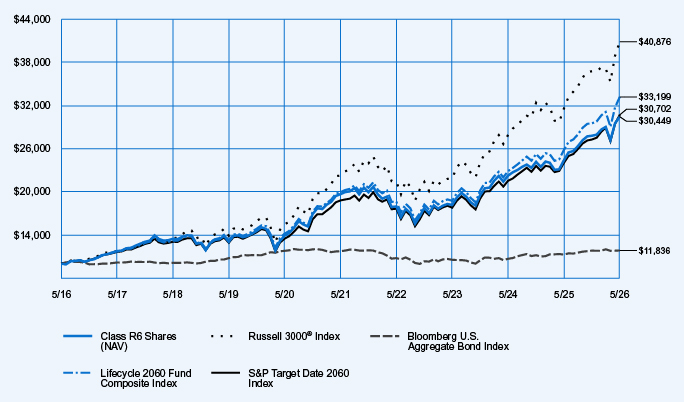
Average Annual Total Returns
| 1-Year | 5-Year | 10-Year | ||||||||||
| Class R6 Shares at NAV |
24.84 | % | 9.13 | % | 11.78 | % | ||||||
| Russell 3000® Index |
29.45 | % | 12.92 | % | 15.12 | % | ||||||
| Bloomberg U.S. Aggregate Bond Index |
5.13 | % | 0.17 | % | 1.70 | % | ||||||
| Lifecycle 2060 Fund Composite Index |
28.59 | % | 10.73 | % | 12.75 | % | ||||||
| S&P Target Date 2060 Index |
27.80 | % | 10.31 | % | 11.87 | % | ||||||
Fund Statistics (as of May 31, 2026)
| Fund net assets |
$ | 1,118,650,560 | ||
| Total number of portfolio holdings |
21 | |||
| Portfolio turnover (%) |
22% | |||
| Total management fees paid for the year |
$ | 4,054,146 | ||
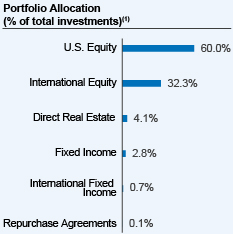 |
| (1) | Affiliated investment companies (Underlying Funds), except for repurchase agreements, where applicable. |
How has the Fund changed?
Portfolio manager update: Effective October 1, 2025, Jeff Sun, CFA was added as a portfolio manager of the Fund.
For more complete information, you may review the Fund’s next prospectus, which is expected to be available by October 1, 2026 at https://www.nuveen.com/en‑us/mutual‑funds/prospectuses or upon request at (800) 257‑8787.
For more complete information, you may review the Fund’s next prospectus, which is expected to be available by October 1, 2026 at https://www.nuveen.com/en‑us/mutual‑funds/prospectuses or upon request at (800) 257‑8787.
This report describes changes to the Fund that occurred during the reporting period.
What were the Fund costs for the last year? (based on a hypothetical $10,000 investment)
| Cost of a $10,000 investment | Costs paid as a percentage of $10,000 investment* | |||
| Premier Class Shares |
$42 | 0.37% | ||
| * | The Fund’s ratios include the expenses of the Underlying Funds, excluding the expenses of the Dividend Growth, Dividend Value, Growth Opportunities ETF, International Value, Small Cap Select and the Nuveen Real Property Fund LP and exclude the income of the Underlying Funds. Annualized for period less than one year. |
How did the Fund perform last year? What affected the Fund’s performance?
| Performance Highlights The Nuveen Lifecycle 2060 Fund returned 24.75% for Premier Class Shares at net asset value (NAV) for the 12 months ended May 31, 2026. The Fund underperformed the Lifecycle 2060 Fund Composite Index, which returned 28.59%. The Fund’s Composite Index consisted of: 60.0% Russell 3000® Index; 32.3% MSCI All Country World Index ex USA Investable Market Index; 6.2% Bloomberg U.S. Aggregate Bond Index; and 1.5% Bloomberg Global Aggregate ex-USD Index (Hedged). Top contributors to relative performance • Holding the Nuveen Quant International Small Cap Equity Fund. • An allocation to the Nuveen International Equity Fund. • A position in the Nuveen Growth Opportunities ETF. Top detractors from relative performance • A position in the Nuveen Dividend Growth Fund. • Holding the Nuveen International Opportunities Fund. • An allocation to the Nuveen Dividend Value Fund. |
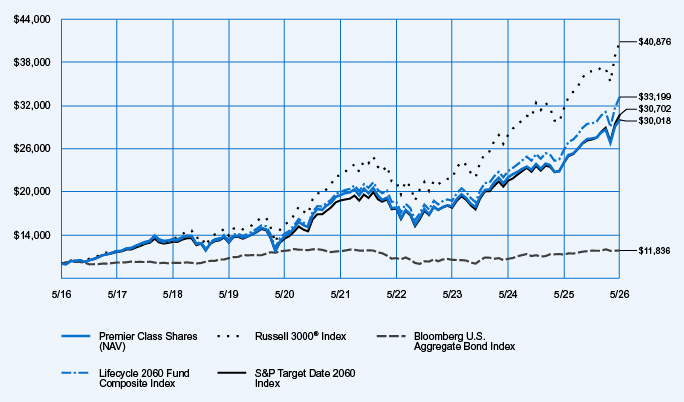
Average Annual Total Returns
| 1-Year | 5-Year | 10-Year | ||||||||||
| Premier Class Shares at NAV |
24.75 | % | 8.96 | % | 11.62 | % | ||||||
| Russell 3000® Index |
29.45 | % | 12.92 | % | 15.12 | % | ||||||
| Bloomberg U.S. Aggregate Bond Index |
5.13 | % | 0.17 | % | 1.70 | % | ||||||
| Lifecycle 2060 Fund Composite Index |
28.59 | % | 10.73 | % | 12.75 | % | ||||||
| S&P Target Date 2060 Index |
27.80 | % | 10.31 | % | 11.87 | % | ||||||
Fund Statistics (as of May 31, 2026)
| Fund net assets |
$ | 1,118,650,560 | ||
| Total number of portfolio holdings |
21 | |||
| Portfolio turnover (%) |
22% | |||
| Total management fees paid for the year |
$ | 4,054,146 | ||
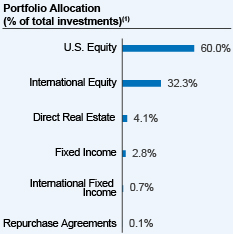 |
| (1) | Affiliated investment companies (Underlying Funds), except for repurchase agreements, where applicable. |
How has the Fund changed?
Portfolio manager update: Effective October 1, 2025, Jeff Sun, CFA was added as a portfolio manager of the Fund.
For more complete information, you may review the Fund’s next prospectus, which is expected to be available by October 1, 2026 at https://www.nuveen.com/en‑us/mutual‑funds/prospectuses or upon request at (800) 257‑8787.
For more complete information, you may review the Fund’s next prospectus, which is expected to be available by October 1, 2026 at https://www.nuveen.com/en‑us/mutual‑funds/prospectuses or upon request at (800) 257‑8787.
This report describes changes to the Fund that occurred during the reporting period.
What were the Fund costs for the last year? (based on a hypothetical $10,000 investment)
| Cost of a $10,000 investment | Costs paid as a percentage of $10,000 investment* | |||
| Class I Shares |
$28 | 0.25% | ||
| * | The Fund’s ratios include the expenses of the Underlying Funds, excluding the expenses of the Dividend Growth, Dividend Value, Growth Opportunities ETF, International Value, Small Cap Select and the Nuveen Real Property Fund LP and exclude the income of the Underlying Funds. Annualized for period less than one year. |
How did the Fund perform last year? What affected the Fund’s performance?
| Performance Highlights The Nuveen Lifecycle 2060 Fund returned 24.87% for Class I Shares at net asset value (NAV) for the 12 months ended May 31, 2026. The Fund underperformed the Lifecycle 2060 Fund Composite Index, which returned 28.59%. The Fund’s Composite Index consisted of: 60.0% Russell 3000® Index; 32.3% MSCI All Country World Index ex USA Investable Market Index; 6.2% Bloomberg U.S. Aggregate Bond Index; and 1.5% Bloomberg Global Aggregate ex-USD Index (Hedged). Top contributors to relative performance • Holding the Nuveen Quant International Small Cap Equity Fund. • An allocation to the Nuveen International Equity Fund. • A position in the Nuveen Growth Opportunities ETF. Top detractors from relative performance • A position in the Nuveen Dividend Growth Fund. • Holding the Nuveen International Opportunities Fund. • An allocation to the Nuveen Dividend Value Fund. |
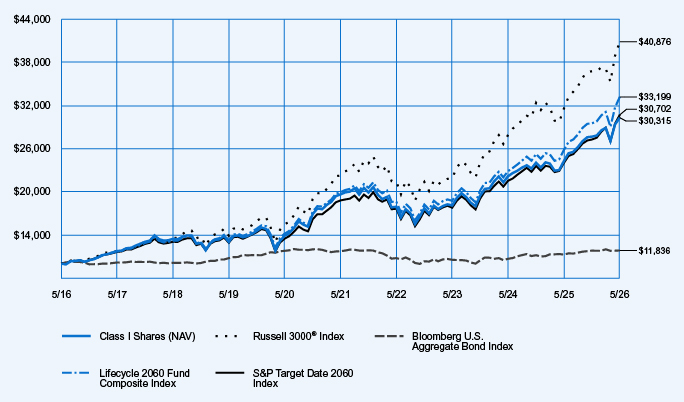
Average Annual Total Returns
| 1-Year | 5-Year | 10-Year | ||||||||||
| Class I Shares at NAV |
24.87 | % | 9.07 | % | 11.73 | % | ||||||
| Russell 3000® Index |
29.45 | % | 12.92 | % | 15.12 | % | ||||||
| Bloomberg U.S. Aggregate Bond Index |
5.13 | % | 0.17 | % | 1.70 | % | ||||||
| Lifecycle 2060 Fund Composite Index |
28.59 | % | 10.73 | % | 12.75 | % | ||||||
| S&P Target Date 2060 Index |
27.80 | % | 10.31 | % | 11.87 | % | ||||||
Fund Statistics (as of May 31, 2026)
| Fund net assets |
$ | 1,118,650,560 | ||
| Total number of portfolio holdings |
21 | |||
| Portfolio turnover (%) |
22% | |||
| Total management fees paid for the year |
$ | 4,054,146 | ||
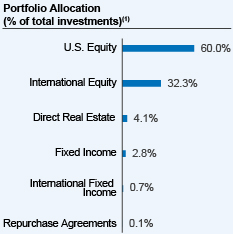 |
| (1) | Affiliated investment companies (Underlying Funds), except for repurchase agreements, where applicable. |
How has the Fund changed?
Portfolio manager update: Effective October 1, 2025, Jeff Sun, CFA was added as a portfolio manager of the Fund.
For more complete information, you may review the Fund’s next prospectus, which is expected to be available by October 1, 2026 at https://www.nuveen.com/en‑us/mutual‑funds/prospectuses or upon request at (800) 257‑8787.
For more complete information, you may review the Fund’s next prospectus, which is expected to be available by October 1, 2026 at https://www.nuveen.com/en‑us/mutual‑funds/prospectuses or upon request at (800) 257‑8787.
This report describes changes to the Fund that occurred during the reporting period.
What were the Fund costs for the last year? (based on a hypothetical $10,000 investment)
| Cost of a $10,000 investment |
Costs paid as a percentage of $10,000 investment* | |||
| Class I Shares | $14 | 0.12% | ||
| * | The Fund’s ratios exclude the expenses of Underlying Funds that are exchange-traded funds, include the expenses of all other Underlying Funds, and exclude the income of all Underlying Funds. Annualized for a period less than one year. |
How did the Fund perform last year? What affected the Fund’s performance?
| Performance Highlights The Nuveen Lifecycle Index 2060 Fund returned 28.45% for Class I Shares at net asset value (NAV) for the 12 months ended May 31, 2026. The Fund performed in line with the Lifecycle Index 2060 Fund Composite Index, which returned 28.67%. The Fund’s Composite Index consisted of: 60.0% Russell 3000® Index; 32.3% MSCI EAFE + Emerging Markets Index; 6.2% Bloomberg U.S. Aggregate Bond Index; and 1.5% Bloomberg Global Aggregate ex‑USD Index (Hedged). Top contributors to absolute performance • Underlying equity and fixed income funds advanced for the period. U.S. and international equity funds recorded double-digit gains and contributed most. Top detractors from absolute performance • Management fees and other expenses incurred by the Fund. |
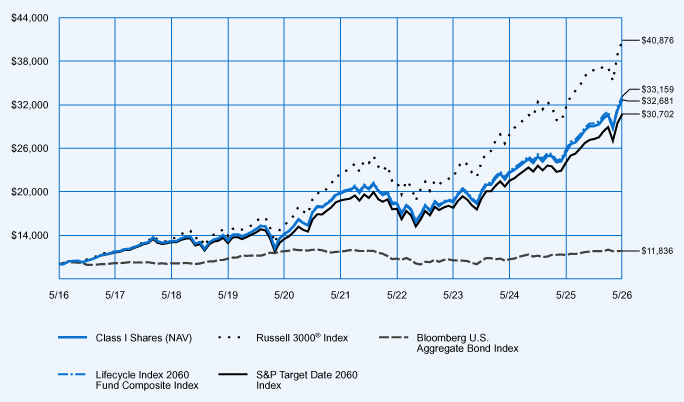
Average Annual Total Returns
| 1-Year | 5-Year | 10-Year | ||||||||||
| Class I Shares at NAV |
28.45 | % | 10.58 | % | 12.57 | % | ||||||
| Russell 3000® Index |
29.45 | % | 12.92 | % | 15.12 | % | ||||||
| Bloomberg U.S. Aggregate Bond Index |
5.13 | % | 0.17 | % | 1.70 | % | ||||||
| Lifecycle Index 2060 Fund Composite Index |
28.67 | % | 10.75 | % | 12.74 | % | ||||||
| S&P Target Date 2060 Index |
27.80 | % | 10.31 | % | 11.87 | % | ||||||
Fund Statistics (as of May 31, 2026)
| Fund net assets |
$ | 3,571,762,355 | ||
| Total number of portfolio holdings |
6 | |||
| Portfolio turnover (%) |
22% | |||
| Total management fees paid for the year |
$ | 4,728,356 | ||
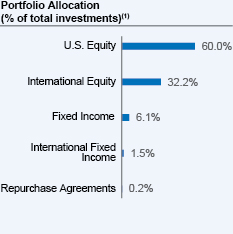
| (1) | Affiliated investment companies (Underlying Funds), except for repurchase agreements, where applicable. |
How has the Fund changed?
Portfolio manager update: Effective October 1, 2025, Jeff Sun, CFA was added as a portfolio manager of the Fund.
For more complete information, you may review the Fund’s next prospectus, which is expected to be available by October 1, 2026 at https://www.nuveen.com/en‑us/mutual‑funds/prospectuses or upon request at (800) 257‑8787.
For more complete information, you may review the Fund’s next prospectus, which is expected to be available by October 1, 2026 at https://www.nuveen.com/en‑us/mutual‑funds/prospectuses or upon request at (800) 257‑8787.
This report describes changes to the Fund that occurred during the reporting period.
What were the Fund costs for the last year? (based on a hypothetical $10,000 investment)
| Cost of a $10,000 investment | Costs paid as a percentage of $10,000 investment* | |||
| Premier Class Shares |
$29 | 0.25% | ||
| * | The Fund’s ratios exclude the expenses of Underlying Funds that are exchange-traded funds, include the expenses of all other Underlying Funds, and exclude the income of all Underlying Funds. Annualized for a period less than one year. |
How did the Fund perform last year? What affected the Fund’s performance?
Performance Highlights
The Nuveen Lifecycle Index 2060 Fund returned 28.28% for Premier Class Shares at net asset value (NAV) for the 12 months ended May 31, 2026. The Fund underperformed the Lifecycle Index 2060 Fund Composite Index, which returned 28.67%.
The Fund’s Composite Index consisted of: 60.0% Russell 3000® Index; 32.3% MSCI EAFE + Emerging Markets Index; 6.2% Bloomberg U.S. Aggregate Bond Index; and 1.5% Bloomberg Global Aggregate ex‑USD Index (Hedged).
Top contributors to absolute performance
| • | Underlying equity and fixed income funds advanced for the period. U.S. and international equity funds recorded double-digit gains and contributed most. |
Top detractors from absolute performance
| • | Management fees and other expenses incurred by the Fund. |
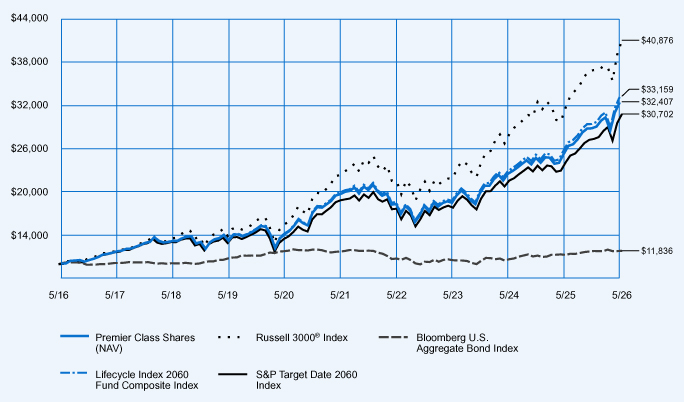
Average Annual Total Returns
| 1-Year | 5-Year | 10-Year | ||||||||||
| Premier Class Shares at NAV |
28.28 | % | 10.50 | % | 12.48 | % | ||||||
| Russell 3000® Index |
29.45 | % | 12.92 | % | 15.12 | % | ||||||
| Bloomberg U.S. Aggregate Bond Index |
5.13 | % | 0.17 | % | 1.70 | % | ||||||
| Lifecycle Index 2060 Fund Composite Index |
28.67 | % | 10.75 | % | 12.74 | % | ||||||
| S&P Target Date 2060 Index |
27.80 | % | 10.31 | % | 11.87 | % | ||||||
Fund Statistics (as of May 31, 2026)
| Fund net assets |
$ | 3,571,762,355 | ||
| Total number of portfolio holdings |
6 | |||
| Portfolio turnover (%) |
22% | |||
| Total management fees paid for the year |
$ | 4,728,356 | ||
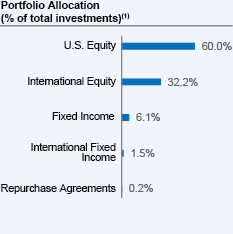
| (1) | Affiliated investment companies (Underlying Funds), except for repurchase agreements, where applicable. |
How has the Fund changed?
Portfolio manager update: Effective October 1, 2025, Jeff Sun, CFA was added as a portfolio manager of the Fund.
For more complete information, you may review the Fund’s next prospectus, which is expected to be available by October 1, 2026 at https://www.nuveen.com/en‑us/mutual‑funds/prospectuses or upon request at (800) 257‑8787.
For more complete information, you may review the Fund’s next prospectus, which is expected to be available by October 1, 2026 at https://www.nuveen.com/en‑us/mutual‑funds/prospectuses or upon request at (800) 257‑8787.
This report describes changes to the Fund that occurred during the reporting period.
What were the Fund costs for the last year? (based on a hypothetical $10,000 investment)
| Cost of a $10,000 investment | Costs paid as a percentage of $10,000 investment* | |||
| Class R6 Shares |
$11 | 0.10% | ||
| * | The Fund’s ratios exclude the expenses of Underlying Funds that are exchange-traded funds, include the expenses of all other Underlying Funds, and exclude the income of all Underlying Funds. Annualized for a period less than one year. |
How did the Fund perform last year? What affected the Fund’s performance?
Performance Highlights
The Nuveen Lifecycle Index 2060 Fund returned 28.51% for Class R6 Shares at net asset value (NAV) for the 12 months ended May 31, 2026. The Fund performed in line with the Lifecycle Index 2060 Fund Composite Index, which returned 28.67%.
The Fund’s Composite Index consisted of: 60.0% Russell 3000® Index; 32.3% MSCI EAFE + Emerging Markets Index; 6.2% Bloomberg U.S. Aggregate Bond Index; and 1.5% Bloomberg Global Aggregate ex‑USD Index (Hedged).
Top contributors to absolute performance
| • | Underlying equity and fixed income funds advanced for the period. U.S. and international equity funds recorded double-digit gains and contributed most. |
Top detractors from absolute performance
| • | Management fees and other expenses incurred by the Fund. |
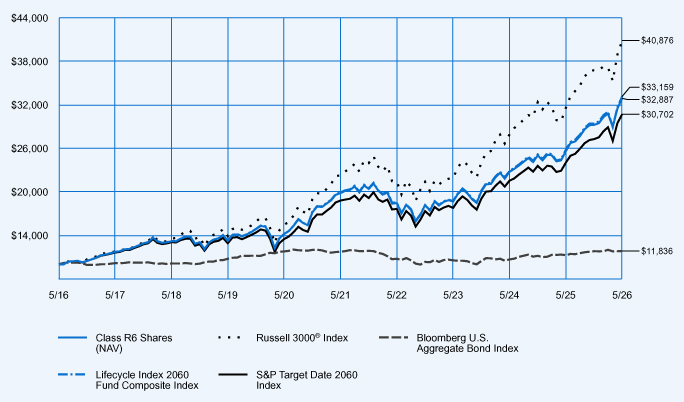
Average Annual Total Returns
| 1-Year | 5-Year | 10-Year | ||||||||||
| Class R6 Shares at NAV |
28.51 | % | 10.66 | % | 12.64 | % | ||||||
| Russell 3000® Index |
29.45 | % | 12.92 | % | 15.12 | % | ||||||
| Bloomberg U.S. Aggregate Bond Index |
5.13 | % | 0.17 | % | 1.70 | % | ||||||
| Lifecycle Index 2060 Fund Composite Index |
28.67 | % | 10.75 | % | 12.74 | % | ||||||
| S&P Target Date 2060 Index |
27.80 | % | 10.31 | % | 11.87 | % | ||||||
Fund Statistics (as of May 31, 2026)
| Fund net assets |
$ | 3,571,762,355 | ||
| Total number of portfolio holdings |
6 | |||
| Portfolio turnover (%) |
22% | |||
| Total management fees paid for the year |
$ | 4,728,356 | ||
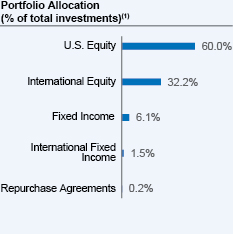
| (1) | Affiliated investment companies (Underlying Funds), except for repurchase agreements, where applicable. |
How has the Fund changed?
Portfolio manager update: Effective October 1, 2025, Jeff Sun, CFA was added as a portfolio manager of the Fund.
For more complete information, you may review the Fund’s next prospectus, which is expected to be available by October 1, 2026 at https://www.nuveen.com/en‑us/mutual‑funds/prospectuses or upon request at (800) 257‑8787.
For more complete information, you may review the Fund’s next prospectus, which is expected to be available by October 1, 2026 at https://www.nuveen.com/en‑us/mutual‑funds/prospectuses or upon request at (800) 257‑8787.
This report describes changes to the Fund that occurred during the reporting period.
What were the Fund costs for the last year? (based on a hypothetical $10,000 investment)
| Cost of a $10,000 investment | Costs paid as a percentage of $10,000 investment* | |||
| Retirement Class Shares |
$40 | 0.35% | ||
| * | The Fund’s ratios exclude the expenses of Underlying Funds that are exchange-traded funds, include the expenses of all other Underlying Funds, and exclude the income of all Underlying Funds. Annualized for a period less than one year. |
How did the Fund perform last year? What affected the Fund’s performance?
Performance Highlights
The Nuveen Lifecycle Index 2060 Fund returned 28.18% for Retirement Class Shares at net asset value (NAV) for the 12 months ended May 31, 2026. The Fund underperformed the Lifecycle Index 2060 Fund Composite Index, which returned 28.67%.
The Fund’s Composite Index consisted of: 60.0% Russell 3000® Index; 32.3% MSCI EAFE + Emerging Markets Index; 6.2% Bloomberg U.S. Aggregate Bond Index; and 1.5% Bloomberg Global Aggregate ex‑USD Index (Hedged).
Top contributors to absolute performance
| • | Underlying equity and fixed income funds advanced for the period. U.S. and international equity funds recorded double-digit gains and contributed most. |
Top detractors from absolute performance
| • | Management fees and other expenses incurred by the Fund. |
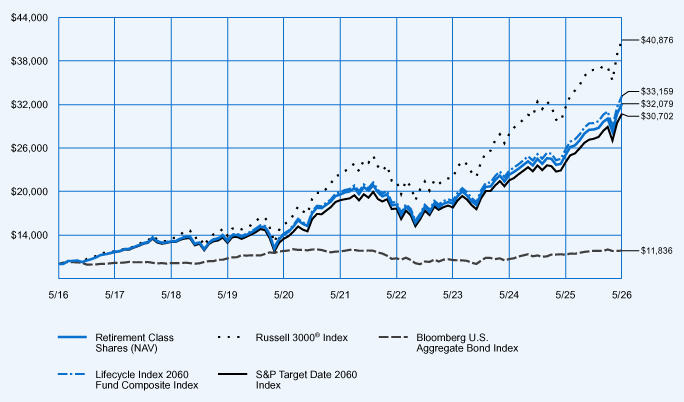
Average Annual Total Returns
| 1-Year | 5-Year | 10-Year | ||||||||||
| Retirement Class Shares at NAV |
28.18 | % | 10.39 | % | 12.36 | % | ||||||
| Russell 3000® Index |
29.45 | % | 12.92 | % | 15.12 | % | ||||||
| Bloomberg U.S. Aggregate Bond Index |
5.13 | % | 0.17 | % | 1.70 | % | ||||||
| Lifecycle Index 2060 Fund Composite Index |
28.67 | % | 10.75 | % | 12.74 | % | ||||||
| S&P Target Date 2060 Index |
27.80 | % | 10.31 | % | 11.87 | % | ||||||
Fund Statistics (as of May 31, 2026)
| Fund net assets |
$ | 3,571,762,355 | ||
| Total number of portfolio holdings |
6 | |||
| Portfolio turnover (%) |
22% | |||
| Total management fees paid for the year |
$ | 4,728,356 | ||
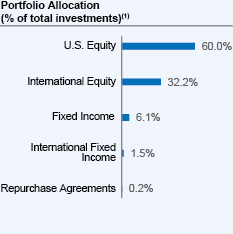
| (1) | Affiliated investment companies (Underlying Funds), except for repurchase agreements, where applicable. |
How has the Fund changed?
Portfolio manager update: Effective October 1, 2025, Jeff Sun, CFA was added as a portfolio manager of the Fund.
For more complete information, you may review the Fund’s next prospectus, which is expected to be available by October 1, 2026 at https://www.nuveen.com/en‑us/mutual‑funds/prospectuses or upon request at (800) 257‑8787.
For more complete information, you may review the Fund’s next prospectus, which is expected to be available by October 1, 2026 at https://www.nuveen.com/en‑us/mutual‑funds/prospectuses or upon request at (800) 257‑8787.
This report describes changes to the Fund that occurred during the reporting period.
What were the Fund costs for the last year? (based on a hypothetical $10,000 investment)
| Cost of a $10,000 investment | Costs paid as a percentage of $10,000 investment* | |||
| Retirement Class Shares |
$52 | 0.46% | ||
| * | The Fund’s ratios include the expenses of the Underlying Funds, excluding the expenses of the Dividend Growth, Dividend Value, Growth Opportunities ETF, International Value, Small Cap Select and the Nuveen Real Property Fund LP and exclude the income of the Underlying Funds. Annualized for period less than one year. |
How did the Fund perform last year? What affected the Fund’s performance?
| Performance Highlights The Nuveen Lifecycle 2065 Fund returned 24.84% for Retirement Class Shares at net asset value (NAV) for the 12 months ended May 31, 2026. The Fund significantly underperformed the Lifecycle 2065 Fund Composite Index, which returned 28.93%. The Fund’s Composite Index consisted of: 60.8% Russell 3000® Index; 32.7% MSCI All Country World Index ex USA Investable Market Index; 5.2% Bloomberg U.S. Aggregate Bond Index; and 1.3% Bloomberg Global Aggregate ex-USD Index (Hedged). Top contributors to relative performance • Holding the Nuveen Quant International Small Cap Equity Fund. • An allocation to the Nuveen International Equity Fund. • A position in the Nuveen Growth Opportunities ETF. Top detractors from relative performance • A position in the Nuveen Dividend Growth Fund. • Holding the Nuveen International Opportunities Fund. • An allocation to the Nuveen Dividend Value Fund. |
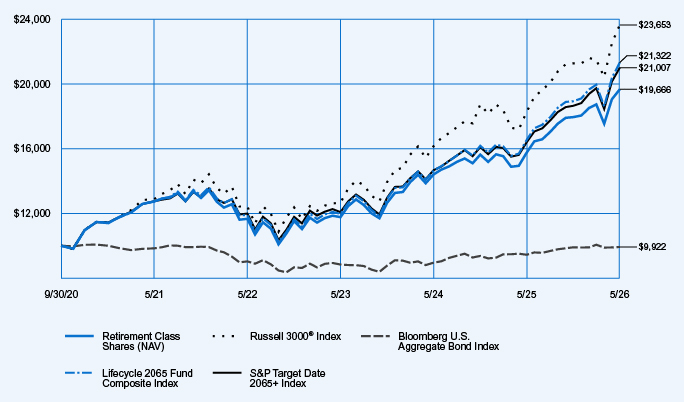
Average Annual Total Returns
| 1-Year | 5-Year | Since Inception (9/30/20) |
||||||||||
| Retirement Class Shares at NAV |
24.84 | % | 9.07 | % | 12.68 | % | ||||||
| Russell 3000® Index |
29.45 | % | 12.92 | % | 16.41 | % | ||||||
| Bloomberg U.S. Aggregate Bond Index |
5.13 | % | 0.17 | % | (0.14 | )% | ||||||
| Lifecycle 2065 Fund Composite Index |
28.93 | % | 10.87 | % | 14.30 | % | ||||||
| |
28.11 | % | 10.50 | % | 14.00 | % | ||||||
Fund Statistics (as of May 31, 2026)
| Fund net assets |
$ | 237,489,018 | ||
| Total number of portfolio holdings |
21 | |||
| Portfolio turnover (%) |
29% | |||
| Total management fees paid for the year |
$ | 759,983 | ||
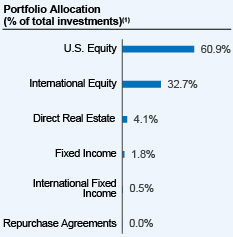 |
| (1) | Affiliated investment companies (Underlying Funds), except for repurchase agreements, where applicable. |
How has the Fund changed?
Portfolio manager update: Effective October 1, 2025, Jeff Sun, CFA was added as a portfolio manager of the Fund.
For more complete information, you may review the Fund’s next prospectus, which is expected to be available by October 1, 2026 at https://www.nuveen.com/en‑us/mutual‑funds/prospectuses or upon request at (800) 257‑8787.
For more complete information, you may review the Fund’s next prospectus, which is expected to be available by October 1, 2026 at https://www.nuveen.com/en‑us/mutual‑funds/prospectuses or upon request at (800) 257‑8787.
This report describes changes to the Fund that occurred during the reporting period.
What were the Fund costs for the last year? (based on a hypothetical $10,000 investment)
| Cost of a $10,000 investment | Costs paid as a percentage of $10,000 investment* | |||
| Class R6 Shares |
$24 | 0.21% | ||
| * | The Fund’s ratios include the expenses of the Underlying Funds, excluding the expenses of the Dividend Growth, Dividend Value, Growth Opportunities ETF, International Value, Small Cap Select and the Nuveen Real Property Fund LP and exclude the income of the Underlying Funds. Annualized for period less than one year. |
How did the Fund perform last year? What affected the Fund’s performance?
| Performance Highlights The Nuveen Lifecycle 2065 Fund returned 25.14% for Class R6 Shares at net asset value (NAV) for the 12 months ended May 31, 2026. The Fund underperformed the Lifecycle 2065 Fund Composite Index, which returned 28.93%. The Fund’s Composite Index consisted of: 60.8% Russell 3000® Index; 32.7% MSCI All Country World Index ex USA Investable Market Index; 5.2% Bloomberg U.S. Aggregate Bond Index; and 1.3% Bloomberg Global Aggregate ex-USD Index (Hedged). Top contributors to relative performance • Holding the Nuveen Quant International Small Cap Equity Fund. • An allocation to the Nuveen International Equity Fund. • A position in the Nuveen Growth Opportunities ETF. Top detractors from relative performance • A position in the Nuveen Dividend Growth Fund. • Holding the Nuveen International Opportunities Fund. • An allocation to the Nuveen Dividend Value Fund. |
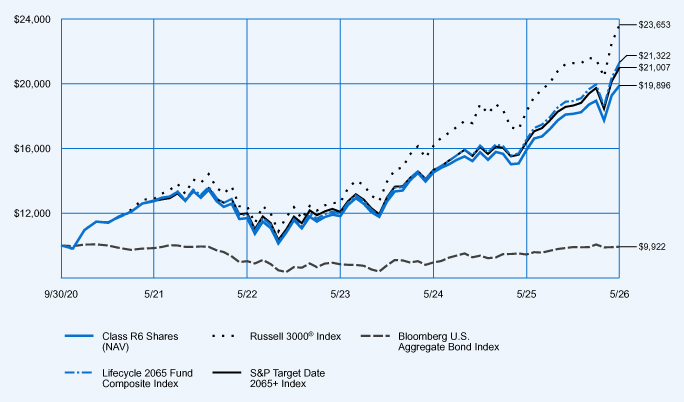
Average Annual Total Returns
| 1-Year | 5-Year | Since Inception (9/30/20) |
||||||||||
| Class R6 Shares at NAV |
25.14 | % | 9.26 | % | 12.91 | % | ||||||
| Russell 3000® Index |
29.45 | % | 12.92 | % | 16.41 | % | ||||||
| Bloomberg U.S. Aggregate Bond Index |
5.13 | % | 0.17 | % | (0.14 | )% | ||||||
| Lifecycle 2065 Fund Composite Index |
28.93 | % | 10.87 | % | 14.30 | % | ||||||
| S&P Target Date 2065+ Index |
28.11 | % | 10.50 | % | 14.00 | % | ||||||
Fund Statistics (as of May 31, 2026)
| Fund net assets |
$ | 237,489,018 | ||
| Total number of portfolio holdings |
21 | |||
| Portfolio turnover (%) |
29% | |||
| Total management fees paid for the year |
$ | 759,983 | ||
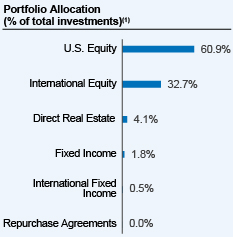 |
| (1) | Affiliated investment companies (Underlying Funds), except for repurchase agreements, where applicable. |
How has the Fund changed?
Portfolio manager update: Effective October 1, 2025, Jeff Sun, CFA was added as a portfolio manager of the Fund.
For more complete information, you may review the Fund’s next prospectus, which is expected to be available by October 1, 2026 at https://www.nuveen.com/en‑us/mutual‑funds/prospectuses or upon request at (800) 257‑8787.
For more complete information, you may review the Fund’s next prospectus, which is expected to be available by October 1, 2026 at https://www.nuveen.com/en‑us/mutual‑funds/prospectuses or upon request at (800) 257‑8787.
This report describes changes to the Fund that occurred during the reporting period.
What were the Fund costs for the last year? (based on a hypothetical $10,000 investment)
| Cost of a $10,000 investment | Costs paid as a percentage of $10,000 investment* | |||
| Premier Class Shares |
$41 | 0.36% | ||
| * | The Fund’s ratios include the expenses of the Underlying Funds, excluding the expenses of the Dividend Growth, Dividend Value, Growth Opportunities ETF, International Value, Small Cap Select and the Nuveen Real Property Fund LP and exclude the income of the Underlying Funds. Annualized for period less than one year. |
How did the Fund perform last year? What affected the Fund’s performance?
| Performance Highlights The Nuveen Lifecycle 2065 Fund returned 25.01% for Premier Class Shares at net asset value (NAV) for the 12 months ended May 31, 2026. The Fund underperformed the Lifecycle 2065 Fund Composite Index, which returned 28.93%. The Fund’s Composite Index consisted of: 60.8% Russell 3000® Index; 32.7% MSCI All Country World Index ex USA Investable Market Index; 5.2% Bloomberg U.S. Aggregate Bond Index; and 1.3% Bloomberg Global Aggregate ex-USD Index (Hedged). Top contributors to relative performance • Holding the Nuveen Quant International Small Cap Equity Fund. • An allocation to the Nuveen International Equity Fund. • A position in the Nuveen Growth Opportunities ETF. Top detractors from relative performance • A position in the Nuveen Dividend Growth Fund. • Holding the Nuveen International Opportunities Fund. • An allocation to the Nuveen Dividend Value Fund. |
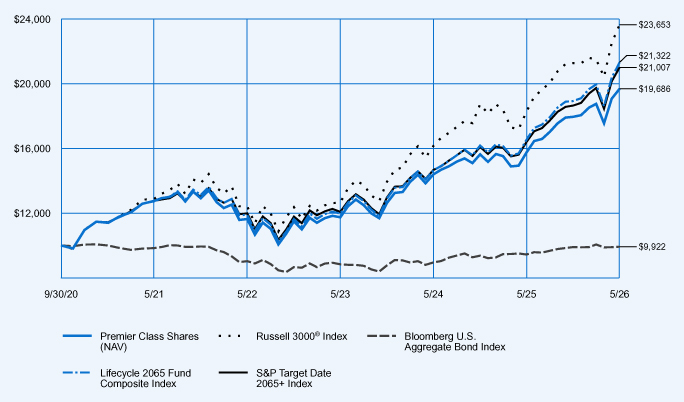
Average Annual Total Returns
| 1-Year | 5-Year |
Since Inception (9/30/20) |
||||||||||
| Premier Class Shares at NAV |
25.01 | % | 9.07 | % | 12.70 | % | ||||||
| Russell 3000® Index |
29.45 | % | 12.92 | % | 16.41 | % | ||||||
| Bloomberg U.S. Aggregate Bond Index |
5.13 | % | 0.17 | % | (0.14 | )% | ||||||
| Lifecycle 2065 Fund Composite Index |
28.93 | % | 10.87 | % | 14.30 | % | ||||||
| S&P Target Date 2065+ Index |
28.11 | % | 10.50 | % | 14.00 | % | ||||||
Fund Statistics (as of May 31, 2026)
| Fund net assets |
$ | 237,489,018 | ||
| Total number of portfolio holdings |
21 | |||
| Portfolio turnover (%) |
29% | |||
| Total management fees paid for the year |
$ | 759,983 | ||
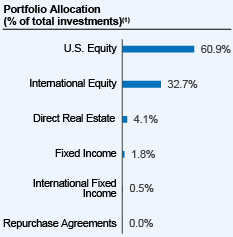 |
| (1) | Affiliated investment companies (Underlying Funds), except for repurchase agreements, where applicable. |
How has the Fund changed?
Portfolio manager update: Effective October 1, 2025, Jeff Sun, CFA was added as a portfolio manager of the Fund.
For more complete information, you may review the Fund’s next prospectus, which is expected to be available by October 1, 2026 at https://www.nuveen.com/en‑us/mutual‑funds/prospectuses or upon request at (800) 257‑8787.
For more complete information, you may review the Fund’s next prospectus, which is expected to be available by October 1, 2026 at https://www.nuveen.com/en‑us/mutual‑funds/prospectuses or upon request at (800) 257‑8787.
This report describes changes to the Fund that occurred during the reporting period.
What were the Fund costs for the last year? (based on a hypothetical $10,000 investment)
| Cost of a $10,000 investment | Costs paid as a percentage of $10,000 investment* | |||
| Class I Shares |
$33 | 0.29% | ||
| * | The Fund’s ratios include the expenses of the Underlying Funds, excluding the expenses of the Dividend Growth, Dividend Value, Growth Opportunities ETF, International Value, Small Cap Select and the Nuveen Real Property Fund LP and exclude the income of the Underlying Funds. Annualized for period less than one year. |
How did the Fund perform last year? What affected the Fund’s performance?
| Performance Highlights The Nuveen Lifecycle 2065 Fund returned 25.04% for Class I Shares at net asset value (NAV) for the 12 months ended May 31, 2026. The Fund underperformed the Lifecycle 2065 Fund Composite Index, which returned 28.93%. The Fund’s Composite Index consisted of: 60.8% Russell 3000® Index; 32.7% MSCI All Country World Index ex USA Investable Market Index; 5.2% Bloomberg U.S. Aggregate Bond Index; and 1.3% Bloomberg Global Aggregate ex-USD Index (Hedged). Top contributors to relative performance • Holding the Nuveen Quant International Small Cap Equity Fund. • An allocation to the Nuveen International Equity Fund. • A position in the Nuveen Growth Opportunities ETF. Top detractors from relative performance • A position in the Nuveen Dividend Growth Fund. • Holding the Nuveen International Opportunities Fund. • An allocation to the Nuveen Dividend Value Fund. |
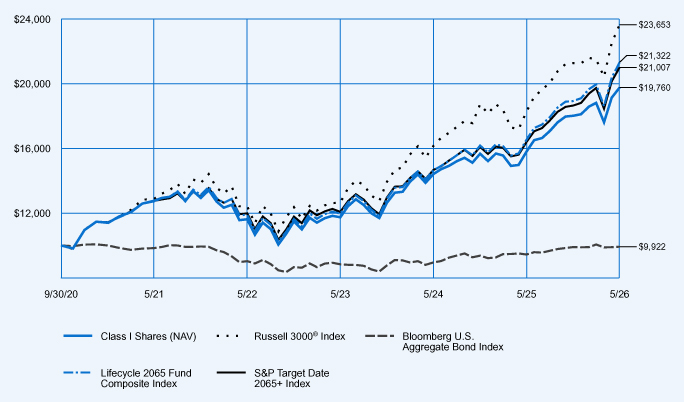
Average Annual Total Returns
| 1-Year | 5-Year |
Since Inception (9/30/20) |
||||||||||
| Class I Shares at NAV |
25.04 | % | 9.14 | % | 12.77 | % | ||||||
| Russell 3000® Index |
29.45 | % | 12.92 | % | 16.41 | % | ||||||
| Bloomberg U.S. Aggregate Bond Index |
5.13 | % | 0.17 | % | (0.14 | )% | ||||||
| Lifecycle 2065 Fund Composite Index |
28.93 | % | 10.87 | % | 14.30 | % | ||||||
| S&P Target Date 2065+ Index |
28.11 | % | 10.50 | % | 14.00 | % | ||||||
Fund Statistics (as of May 31, 2026)
| Fund net assets |
$ | 237,489,018 | ||
| Total number of portfolio holdings |
21 | |||
| Portfolio turnover (%) |
29% | |||
| Total management fees paid for the year |
$ | 759,983 | ||
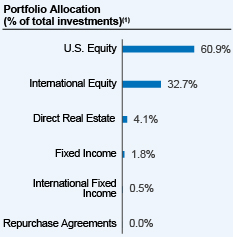 |
| (1) | Affiliated investment companies (Underlying Funds), except for repurchase agreements, where applicable. |
How has the Fund changed?
Portfolio manager update: Effective October 1, 2025, Jeff Sun, CFA was added as a portfolio manager of the Fund.
For more complete information, you may review the Fund’s next prospectus, which is expected to be available by October 1, 2026 at https://www.nuveen.com/en‑us/mutual‑funds/prospectuses or upon request at (800) 257‑8787.
For more complete information, you may review the Fund’s next prospectus, which is expected to be available by October 1, 2026 at https://www.nuveen.com/en‑us/mutual‑funds/prospectuses or upon request at (800) 257‑8787.
This report describes changes to the Fund that occurred during the reporting period.
What were the Fund costs for the last year? (based on a hypothetical $10,000 investment)
| Cost of a $10,000 investment | Costs paid as a percentage of $10,000 investment* | |||
| Class I Shares |
$11 | 0.10% | ||
| * | The Fund’s ratios exclude the expenses of Underlying Funds that are exchange-traded funds, include the expenses of all other Underlying Funds, and exclude the income of all Underlying Funds. Annualized for a period less than one year. |
How did the Fund perform last year? What affected the Fund’s performance?
Performance Highlights
The Nuveen Lifecycle Index 2065 Fund returned 28.72% for Class I Shares at net asset value (NAV) for the 12 months ended May 31, 2026. The Fund underperformed the Lifecycle Index 2065 Fund Composite Index, which returned 29.01%.
The Fund’s Composite Index consisted of: 60.8% Russell 3000® Index; 32.7% MSCI EAFE + Emerging Markets Index; 5.2% Bloomberg U.S. Aggregate Bond Index; and 1.3% Bloomberg Global Aggregate ex‑USD Index (Hedged).
Top contributors to absolute performance
| • | Underlying equity and fixed income funds advanced for the period. U.S. and international equity funds recorded double-digit gains and contributed most. |
Top detractors from absolute performance
| • | Management fees and other expenses incurred by the Fund. |
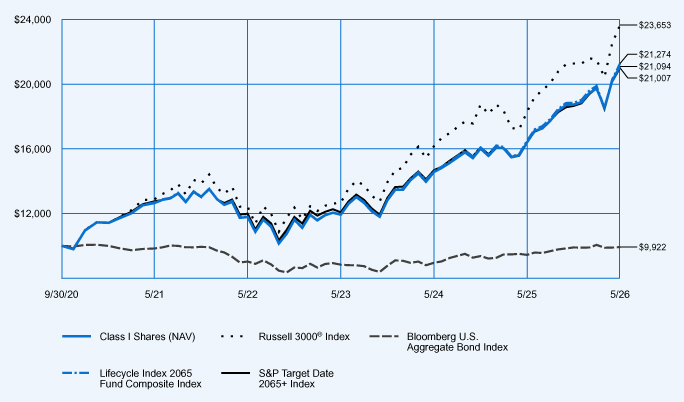
Average Annual Total Returns
| 1-Year | 5-Year | Since Inception (9/30/20) |
||||||||||
| Class I Shares at NAV |
28.72 | % | 10.77 | % | 14.08 | % | ||||||
| Russell 3000® Index |
29.45 | % | 12.92 | % | 16.41 | % | ||||||
| Bloomberg U.S. Aggregate Bond Index |
5.13 | % | 0.17 | % | (0.14 | )% | ||||||
| Lifecycle Index 2065 Fund Composite Index |
29.01 | % | 10.89 | % | 14.25 | % | ||||||
| S&P Target Date 2065+ Index |
28.11 | % | 10.50 | % | 14.00 | % | ||||||
Fund Statistics (as of May 31, 2026)
| Fund net assets |
$ | 1,078,542,583 | ||
| Total number of portfolio holdings |
6 | |||
| Portfolio turnover (%) |
12% | |||
| Total management fees paid for the year |
$ | 1,210,382 | ||
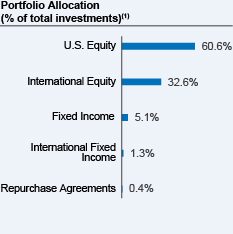
How has the Fund changed?
Portfolio manager update: Effective October 1, 2025, Jeff Sun, CFA was added as a portfolio manager of the Fund.
For more complete information, you may review the Fund’s next prospectus, which is expected to be available by October 1, 2026 at https://www.nuveen.com/en‑us/mutual‑funds/prospectuses or upon request at (800) 257‑8787.
For more complete information, you may review the Fund’s next prospectus, which is expected to be available by October 1, 2026 at https://www.nuveen.com/en‑us/mutual‑funds/prospectuses or upon request at (800) 257‑8787.
This report describes changes to the Fund that occurred during the reporting period.
What were the Fund costs for the last year? (based on a hypothetical $10,000 investment)
| Cost of a $10,000 investment | Costs paid as a percentage of $10,000 investment* | |||
| Premier Class Shares |
$29 | 0.25% | ||
| * | The Fund’s ratios exclude the expenses of Underlying Funds that are exchange-traded funds, include the expenses of all other Underlying Funds, and exclude the income of all Underlying Funds. Annualized for a period less than one year. |
How did the Fund perform last year? What affected the Fund’s performance?
Performance Highlights
The Nuveen Lifecycle Index 2065 Fund returned 28.60% for Premier Class Shares at net asset value (NAV) for the 12 months ended May 31, 2026. The Fund underperformed the Lifecycle Index 2065 Fund Composite Index, which returned 29.01%.
The Fund’s Composite Index consisted of: 60.8% Russell 3000® Index; 32.7% MSCI EAFE + Emerging Markets Index; 5.2% Bloomberg U.S. Aggregate Bond Index; and 1.3% Bloomberg Global Aggregate ex‑USD Index (Hedged).
Top contributors to absolute performance
| • | Underlying equity and fixed income funds advanced for the period. U.S. and international equity funds recorded double-digit gains and contributed most. |
Top detractors from absolute performance
| • | Management fees and other expenses incurred by the Fund. |
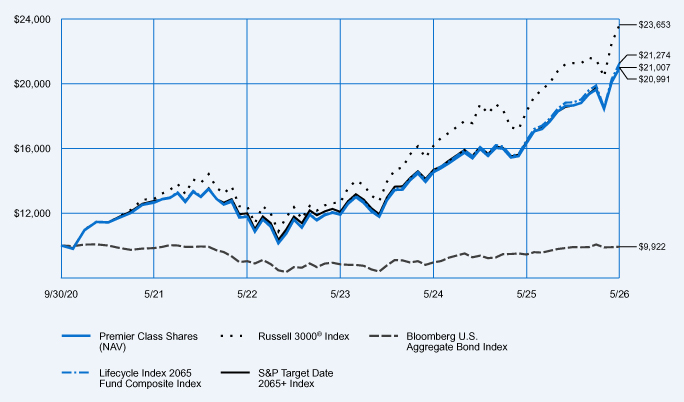
Average Annual Total Returns
| 1-Year | 5-Year | Since Inception (9/30/20) |
||||||||||
| Premier Class Shares at NAV |
28.60 | % | 10.66 | % | 13.98 | % | ||||||
| Russell 3000® Index |
29.45 | % | 12.92 | % | 16.41 | % | ||||||
| Bloomberg U.S. Aggregate Bond Index |
5.13 | % | 0.17 | % | (0.14 | )% | ||||||
| Lifecycle Index 2065 Fund Composite Index |
29.01 | % | 10.89 | % | 14.25 | % | ||||||
| S&P Target Date 2065+ Index |
28.11 | % | 10.50 | % | 14.00 | % | ||||||
Fund Statistics (as of May 31, 2026)
| Fund net assets |
$ | 1,078,542,583 | ||
| Total number of portfolio holdings |
6 | |||
| Portfolio turnover (%) |
12% | |||
| Total management fees paid for the year |
$ | 1,210,382 | ||
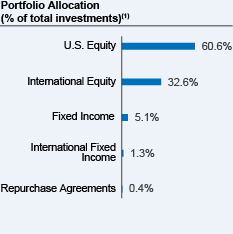
| (1) | Affiliated investment companies (Underlying Funds), except for repurchase agreements, where applicable. |
How has the Fund changed?
Portfolio manager update: Effective October 1, 2025, Jeff Sun, CFA was added as a portfolio manager of the Fund.
For more complete information, you may review the Fund’s next prospectus, which is expected to be available by October 1, 2026 at https://www.nuveen.com/en‑us/mutual‑funds/prospectuses or upon request at (800) 257‑8787.
For more complete information, you may review the Fund’s next prospectus, which is expected to be available by October 1, 2026 at https://www.nuveen.com/en‑us/mutual‑funds/prospectuses or upon request at (800) 257‑8787.
This report describes changes to the Fund that occurred during the reporting period.
What were the Fund costs for the last year? (based on a hypothetical $10,000 investment)
| Cost of a $10,000 investment | Costs paid as a percentage of $10,000 investment* | |||
| Class R6 Shares |
$11 | 0.10% | ||
| * | The Fund’s ratios exclude the expenses of Underlying Funds that are exchange-traded funds, include the expenses of all other Underlying Funds, and exclude the income of all Underlying Funds. Annualized for a period less than one year. |
How did the Fund perform last year? What affected the Fund’s performance?
Performance Highlights
The Nuveen Lifecycle Index 2065 Fund returned 28.82% for Class R6 Shares at net asset value (NAV) for the 12 months ended May 31, 2026. The Fund performed in line with the Lifecycle Index 2065 Fund Composite Index, which returned 29.01%.
The Fund’s Composite Index consisted of: 60.8% Russell 3000® Index; 32.7% MSCI EAFE + Emerging Markets Index; 5.2% Bloomberg U.S. Aggregate Bond Index; and 1.3% Bloomberg Global Aggregate ex‑USD Index (Hedged).
Top contributors to absolute performance
| • | Underlying equity and fixed income funds advanced for the period. U.S. and international equity funds recorded double-digit gains and contributed most. |
Top detractors from absolute performance
| • | Management fees and other expenses incurred by the Fund. |
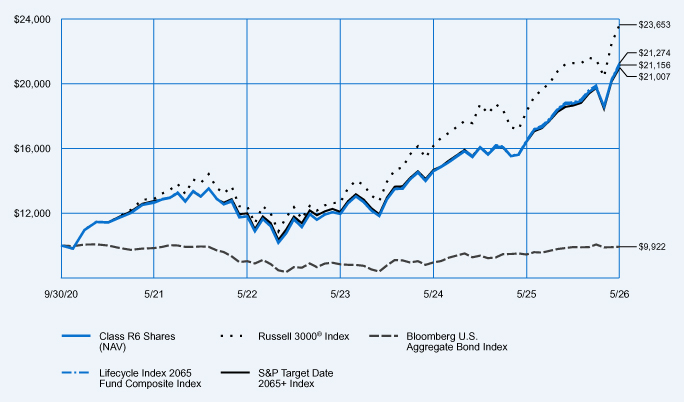
Average Annual Total Returns
| 1-Year | 5-Year | |
Since Inception (9/30/20) |
| ||||||||
| Class R6 Shares at NAV |
28.82 | % | 10.84 | % | 14.14 | % | ||||||
| Russell 3000® Index |
29.45 | % | 12.92 | % | 16.41 | % | ||||||
| Bloomberg U.S. Aggregate Bond Index |
5.13 | % | 0.17 | % | (0.14 | )% | ||||||
| Lifecycle Index 2065 Fund Composite Index |
29.01 | % | 10.89 | % | 14.25 | % | ||||||
| S&P Target Date 2065+ Index |
28.11 | % | 10.50 | % | 14.00 | % | ||||||
Fund Statistics (as of May 31, 2026)
| Fund net assets |
$ | 1,078,542,583 | ||
| Total number of portfolio holdings |
6 | |||
| Portfolio turnover (%) |
12% | |||
| Total management fees paid for the year |
$ | 1,210,382 | ||
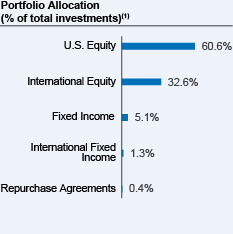 |
| (1) | Affiliated investment companies (Underlying Funds), except for repurchase agreements, where applicable. |
How has the Fund changed?
Portfolio manager update: Effective October 1, 2025, Jeff Sun, CFA was added as a portfolio manager of the Fund.
For more complete information, you may review the Fund’s next prospectus, which is expected to be available by October 1, 2026 at https://www.nuveen.com/en‑us/mutual‑funds/prospectuses or upon request at (800) 257‑8787.
For more complete information, you may review the Fund’s next prospectus, which is expected to be available by October 1, 2026 at https://www.nuveen.com/en‑us/mutual‑funds/prospectuses or upon request at (800) 257‑8787.
This report describes changes to the Fund that occurred during the reporting period.
What were the Fund costs for the last year? (based on a hypothetical $10,000 investment)
| Cost of a $10,000 investment | Costs paid as a percentage of $10,000 investment* | |||
| Retirement Class Shares |
$40 | 0.35% | ||
| * | The Fund’s ratios exclude the expenses of Underlying Funds that are exchange-traded funds, include the expenses of all other Underlying Funds, and exclude the income of all Underlying Funds. Annualized for a period less than one year. |
How did the Fund perform last year? What affected the Fund’s performance?
| Performance Highlights The Nuveen Lifecycle Index 2065 Fund returned 28.46% for Retirement Class Shares at net asset value (NAV) for the 12 months ended May 31, 2026. The Fund underperformed the Lifecycle Index 2065 Fund Composite Index, which returned 29.01%. The Fund’s Composite Index consisted of: 60.8% Russell 3000® Index; 32.7% MSCI EAFE + Emerging Markets Index; 5.2% Bloomberg U.S. Aggregate Bond Index; and 1.3% Bloomberg Global Aggregate ex‑USD Index (Hedged). Top contributors to absolute performance • Underlying equity and fixed income funds advanced for the period. U.S. and international equity funds recorded double-digit gains and contributed most. Top detractors from absolute performance • Management fees and other expenses incurred by the Fund. |
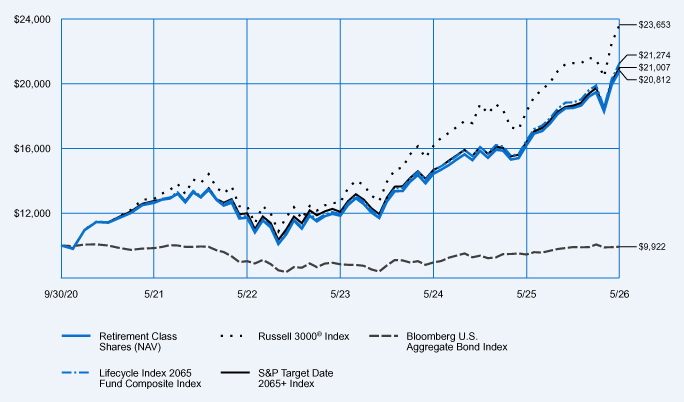
Average Annual Total Returns
| 1-Year | 5-Year | Since Inception (9/30/20) |
||||||||||
| Retirement Class Shares at NAV |
28.46 | % | 10.50 | % | 13.81 | % | ||||||
| Russell 3000® Index |
29.45 | % | 12.92 | % | 16.41 | % | ||||||
| Bloomberg U.S. Aggregate Bond Index |
5.13 | % | 0.17 | % | (0.14 | )% | ||||||
| Lifecycle Index 2065 Fund Composite Index |
29.01 | % | 10.89 | % | 14.25 | % | ||||||
| S&P Target Date 2065+ Index |
28.11 | % | 10.50 | % | 14.00 | % | ||||||
Fund Statistics (as of May 31, 2026)
| Fund net assets |
$ | 1,078,542,583 | ||
| Total number of portfolio holdings |
6 | |||
| Portfolio turnover (%) |
12% | |||
| Total management fees paid for the year |
$ | 1,210,382 | ||
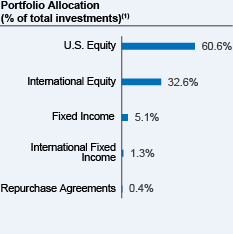 |
| (1) | Affiliated investment companies (Underlying Funds), except for repurchase agreements, where applicable. |
How has the Fund changed?
Portfolio manager update: Effective October 1, 2025, Jeff Sun, CFA was added as a portfolio manager of the Fund.
For more complete information, you may review the Fund’s next prospectus, which is expected to be available by October 1, 2026 at https://www.nuveen.com/en‑us/mutual‑funds/prospectuses or upon request at (800) 257‑8787.
For more complete information, you may review the Fund’s next prospectus, which is expected to be available by October 1, 2026 at https://www.nuveen.com/en‑us/mutual‑funds/prospectuses or upon request at (800) 257‑8787.
This report describes changes to the Fund that occurred during the reporting period.
What were the Fund costs for the period since inception? (based on a hypothetical $10,000 investment)
| Cost of a $10,000 investment | Costs paid as a percentage of $10,000 investment* | |||
| Retirement Class Shares |
$48 | 0.45% | ||
| * | The Fund’s ratios include the expenses of the Underlying Funds, excluding the expenses of the Dividend Growth, Dividend Value, Growth Opportunities ETF, International Value, Small Cap Select and the Nuveen Real Property Fund LP and exclude the income of the Underlying Funds. Annualized for period less than one year. |
How did the Fund perform since inception? What affected the Fund’s performance?
| Performance Highlights The Nuveen Lifecycle 2070 Fund returned 12.20% for Retirement Class Shares at net asset value (NAV) for the abbreviated reporting period from the Fund’s launch on September 30, 2025, through May 31, 2026. The Fund underperformed the Lifecycle 2070 Fund Composite Index, which returned 15.24%. The Fund’s Composite Index consisted of: 61.6% Russell 3000® Index; 33.2% MSCI All Country World Index ex USA Investable Market Index; 4.2% Bloomberg U.S. Aggregate Bond Index; and 1.0% Bloomberg Global Aggregate ex-USD Index (Hedged). Top contributors to relative performance • Holding the Nuveen Quant International Small Cap Equity Fund. • An allocation to the Nuveen Growth Opportunities ETF. • A position in the Nuveen Large Cap Growth Fund. Top detractors from relative performance • A position in the Nuveen Dividend Growth Fund. • Holding the Nuveen International Opportunities Fund. • An allocation to the Nuveen Dividend Value Fund. |
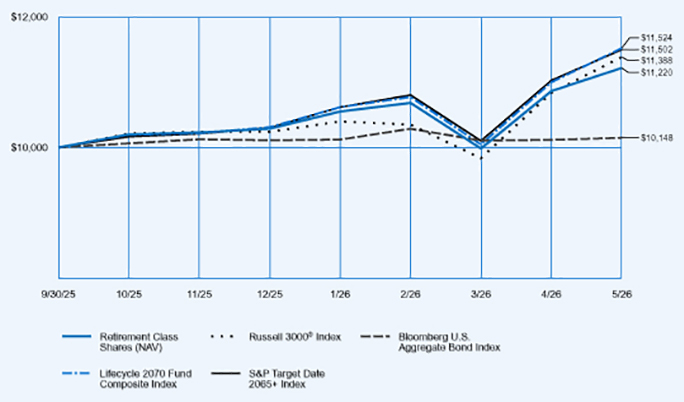
Cumulative Total Returns
| Since Inception (9/30/25) |
||||
| Retirement Class Shares at NAV |
12.20 | % | ||
| Russell 3000® Index |
13.88 | % | ||
| Bloomberg U.S. Aggregate Bond Index |
1.48 | % | ||
| Lifecycle 2070 Fund Composite Index |
15.24 | % | ||
| S&P Target Date 2065+ Index |
15.02 | % | ||
Fund Statistics (as of May 31, 2026)
| Fund net assets |
$ | 5,770,822 | ||
| Total number of portfolio holdings |
19 | |||
| Portfolio turnover (%) |
9% | |||
| Total management fees paid for the year |
$ | 13,701 | ||
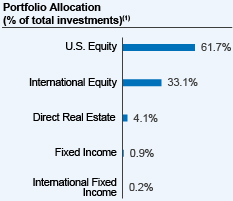 |
| (1) | Affiliated investment companies (Underlying Funds), except for repurchase agreements, where applicable. |
How has the Fund changed?
Portfolio manager update: Effective October 1, 2025, Jeff Sun, CFA was added as a portfolio manager of the Fund.
For more complete information, you may review the Fund’s next prospectus, which is expected to be available by October 1, 2026 at https://www.nuveen.com/en‑us/mutual‑funds/prospectuses or upon request at (800) 257‑8787.
For more complete information, you may review the Fund’s next prospectus, which is expected to be available by October 1, 2026 at https://www.nuveen.com/en‑us/mutual‑funds/prospectuses or upon request at (800) 257‑8787.
This report describes changes to the Fund that occurred during the reporting period.
What were the Fund costs for the period since inception? (based on a hypothetical $10,000 investment)
| Cost of a $10,000 investment | Costs paid as a percentage of $10,000 investment* | |||
| Class R6 Shares |
$21 | 0.20% | ||
| * | The Fund’s ratios include the expenses of the Underlying Funds, excluding the expenses of the Dividend Growth, Dividend Value, Growth Opportunities ETF, International Value, Small Cap Select and the Nuveen Real Property Fund LP and exclude the income of the Underlying Funds. Annualized for period less than one year. |
How did the Fund perform since inception? What affected the Fund’s performance?
| Performance Highlights The Nuveen Lifecycle 2070 Fund returned 12.37% for Class R6 Shares at net asset value (NAV) for the abbreviated reporting period from the Fund’s launch on September 30, 2025, through May 31, 2026. The Fund underperformed the Lifecycle 2070 Fund Composite Index, which returned 15.24%. The Fund’s Composite Index consisted of: 61.6% Russell 3000® Index; 33.2% MSCI All Country World Index ex USA Investable Market Index; 4.2% Bloomberg U.S. Aggregate Bond Index; and 1.0% Bloomberg Global Aggregate ex-USD Index (Hedged). Top contributors to relative performance • Holding the Nuveen Quant International Small Cap Equity Fund. • An allocation to the Nuveen Growth Opportunities ETF. • A position in the Nuveen Large Cap Growth Fund. Top detractors from relative performance • A position in the Nuveen Dividend Growth Fund. • Holding the Nuveen International Opportunities Fund. • An allocation to the Nuveen Dividend Value Fund. |
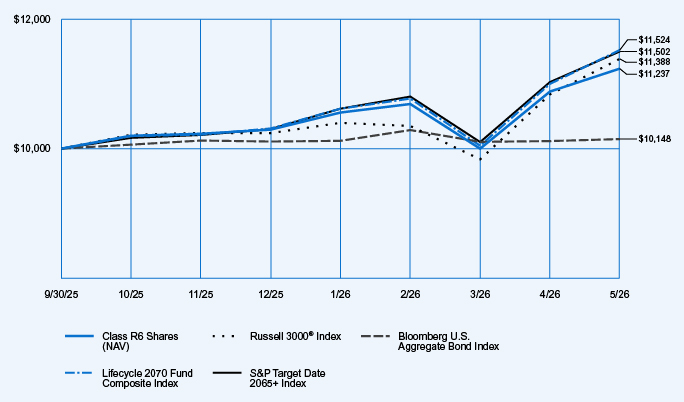
Cumulative Total Returns
| Since Inception (9/30/25) |
||||
| Class R6 Shares at NAV |
12.37 | % | ||
| Russell 3000® Index |
13.88 | % | ||
| Bloomberg U.S. Aggregate Bond Index |
1.48 | % | ||
| Lifecycle 2070 Fund Composite Index |
15.24 | % | ||
| S&P Target Date 2065+ Index |
15.02 | % | ||
Fund Statistics (as of May 31, 2026)
| Fund net assets |
$ | 5,770,822 | ||
| Total number of portfolio holdings |
19 | |||
| Portfolio turnover (%) |
9% | |||
| Total management fees paid for the year |
$ | 13,701 | ||
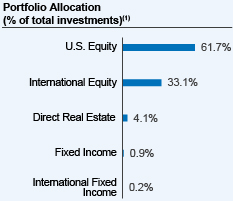 |
| (1) | Affiliated investment companies (Underlying Funds), except for repurchase agreements, where applicable. |
How has the Fund changed?
Portfolio manager update: Effective October 1, 2025, Jeff Sun, CFA was added as a portfolio manager of the Fund.
For more complete information, you may review the Fund’s next prospectus, which is expected to be available by October 1, 2026 at https://www.nuveen.com/en‑us/mutual‑funds/prospectuses or upon request at (800) 257‑8787.
For more complete information, you may review the Fund’s next prospectus, which is expected to be available by October 1, 2026 at https://www.nuveen.com/en‑us/mutual‑funds/prospectuses or upon request at (800) 257‑8787.
This report describes changes to the Fund that occurred during the reporting period.
What were the Fund costs for the period since inception? (based on a hypothetical $10,000 investment)
| Cost of a $10,000 investment | Costs paid as a percentage of $10,000 investment* | |||
| Premier Class Shares |
$37 | 0.35% | ||
| * | The Fund’s ratios include the expenses of the Underlying Funds, excluding the expenses of the Dividend Growth, Dividend Value, Growth Opportunities ETF, International Value, Small Cap Select and the Nuveen Real Property Fund LP and exclude the income of the Underlying Funds. Annualized for period less than one year. |
How did the Fund perform since inception? What affected the Fund’s performance?
| Performance Highlights The Nuveen Lifecycle 2070 Fund returned 12.23% for Premier Class Shares at net asset value (NAV) for the abbreviated reporting period from the Fund’s launch on September 30, 2025, through May 31, 2026. The Fund underperformed the Lifecycle 2070 Fund Composite Index, which returned 15.24%. The Fund’s Composite Index consisted of: 61.6% Russell 3000® Index; 33.2% MSCI All Country World Index ex USA Investable Market Index; 4.2% Bloomberg U.S. Aggregate Bond Index; and 1.0% Bloomberg Global Aggregate ex-USD Index (Hedged). Top contributors to relative performance • Holding the Nuveen Quant International Small Cap Equity Fund. • An allocation to the Nuveen Growth Opportunities ETF. • A position in the Nuveen Large Cap Growth Fund. Top detractors from relative performance • A position in the Nuveen Dividend Growth Fund. • Holding the Nuveen International Opportunities Fund. • An allocation to the Nuveen Dividend Value Fund. |
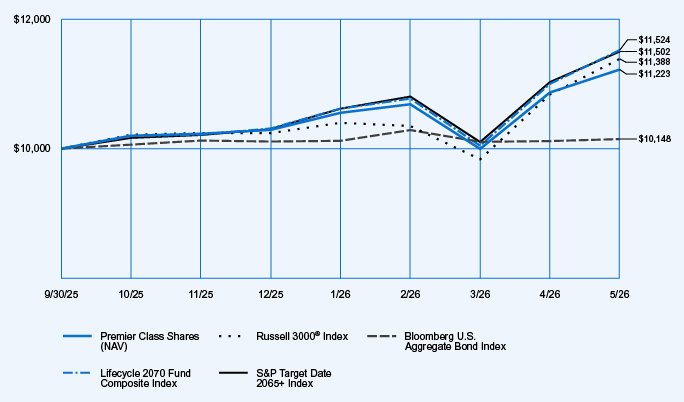
Cumulative Total Returns
| Since Inception (9/30/25) |
||||
| Premier Class Shares at NAV |
12.23 | % | ||
| Russell 3000® Index |
13.88 | % | ||
| Bloomberg U.S. Aggregate Bond Index |
1.48 | % | ||
| Lifecycle 2070 Fund Composite Index |
15.24 | % | ||
| S&P Target Date 2065+ Index |
15.02 | % | ||
Fund Statistics (as of May 31, 2026)
| Fund net assets |
$ | 5,770,822 | ||
| Total number of portfolio holdings |
19 | |||
| Portfolio turnover (%) |
9% | |||
| Total management fees paid for the year |
$ | 13,701 | ||
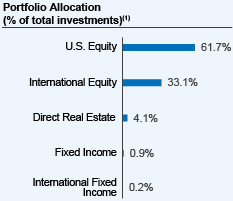 |
| (1) | Affiliated investment companies (Underlying Funds), except for repurchase agreements, where applicable. |
How has the Fund changed?
Portfolio manager update: Effective October 1, 2025, Jeff Sun, CFA was added as a portfolio manager of the Fund.
For more complete information, you may review the Fund’s next prospectus, which is expected to be available by October 1, 2026 at https://www.nuveen.com/en‑us/mutual‑funds/prospectuses or upon request at (800) 257‑8787.
For more complete information, you may review the Fund’s next prospectus, which is expected to be available by October 1, 2026 at https://www.nuveen.com/en‑us/mutual‑funds/prospectuses or upon request at (800) 257‑8787.
This report describes changes to the Fund that occurred during the reporting period.
What were the Fund costs for the period since inception? (based on a hypothetical $10,000 investment)
| Cost of a $10,000 investment | Costs paid as a percentage of $10,000 investment* | |||
| Class I Shares |
$37 | 0.35% | ||
| * | The Fund’s ratios include the expenses of the Underlying Funds, excluding the expenses of the Dividend Growth, Dividend Value, Growth Opportunities ETF, International Value, Small Cap Select and the Nuveen Real Property Fund LP and exclude the income of the Underlying Funds. Annualized for period less than one year. |
How did the Fund perform since inception? What affected the Fund’s performance?
| Performance Highlights The Nuveen Lifecycle 2070 Fund returned 12.23% for Class I Shares at net asset value (NAV) for the abbreviated reporting period from the Fund’s launch on September 30, 2025, through May 31, 2026. The Fund underperformed the Lifecycle 2070 Fund Composite Index, which returned 15.24%. The Fund’s Composite Index consisted of: 61.6% Russell 3000® Index; 33.2% MSCI All Country World Index ex USA Investable Market Index; 4.2% Bloomberg U.S. Aggregate Bond Index; and 1.0% Bloomberg Global Aggregate ex-USD Index (Hedged). Top contributors to relative performance • Holding the Nuveen Quant International Small Cap Equity Fund. • An allocation to the Nuveen Growth Opportunities ETF. • A position in the Nuveen Large Cap Growth Fund. Top detractors from relative performance • A position in the Nuveen Dividend Growth Fund. • Holding the Nuveen International Opportunities Fund. • An allocation to the Nuveen Dividend Value Fund. |
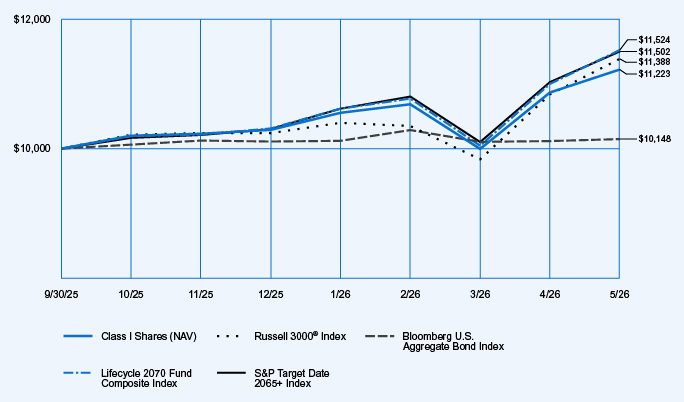
Cumulative Total Returns
| Since Inception (9/30/25) |
||||
| Class I Shares at NAV |
12.23 | % | ||
| Russell 3000® Index |
13.88 | % | ||
| Bloomberg U.S. Aggregate Bond Index |
1.48 | % | ||
| Lifecycle 2070 Fund Composite Index |
15.24 | % | ||
| S&P Target Date 2065+ Index |
15.02 | % | ||
Fund Statistics (as of May 31, 2026)
| Fund net assets |
$ | 5,770,822 | ||
| Total number of portfolio holdings |
19 | |||
| Portfolio turnover (%) |
9% | |||
| Total management fees paid for the year |
$ | 13,701 | ||
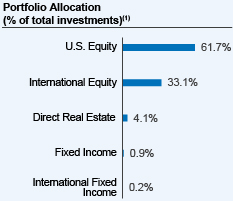 |
| (1) | Affiliated investment companies (Underlying Funds), except for repurchase agreements, where applicable. |
How has the Fund changed?
Portfolio manager update: Effective October 1, 2025, Jeff Sun, CFA was added as a portfolio manager of the Fund.
For more complete information, you may review the Fund’s next prospectus, which is expected to be available by October 1, 2026 at https://www.nuveen.com/en‑us/mutual‑funds/prospectuses or upon request at (800) 257‑8787.
For more complete information, you may review the Fund’s next prospectus, which is expected to be available by October 1, 2026 at https://www.nuveen.com/en‑us/mutual‑funds/prospectuses or upon request at (800) 257‑8787.
This report describes changes to the Fund that occurred during the reporting period.
What were the Fund costs for the period since inception? (based on a hypothetical $10,000 investment)
| Cost of a $10,000 investment | Costs paid as a percentage of $10,000 investment* | |||
| Class I Shares |
$24 | 0.22% | ||
| * | The Fund’s ratios exclude the expenses of Underlying Funds that are exchange-traded funds, include the expenses of all other Underlying Funds, and exclude the income of all Underlying Funds. Annualized for a period less than one year. |
How did the Fund perform since inception? What affected the Fund’s performance?
| Performance Highlights The Nuveen Lifecycle Index 2070 Fund returned 15.11% for Class I Shares at net asset value (NAV) for the abbreviated reporting period from the Fund’s launch on September 30, 2025, through May 31, 2026. The Fund underperformed the Lifecycle Index 2070 Fund Composite Index, which returned 15.47%. The Fund’s Composite Index consisted of: 61.6% Russell 3000® Index; 33.2% MSCI EAFE + Emerging Markets Index; 4.2% Bloomberg U.S. Aggregate Bond Index; and 1.0% Bloomberg Global Aggregate ex‑USD Index (Hedged). Top contributors to absolute performance • Underlying equity and fixed income funds advanced for the period. U.S. and international equity funds recorded double-digit gains and contributed most. Top detractors from absolute performance • Management fees and other expenses incurred by the Fund. |
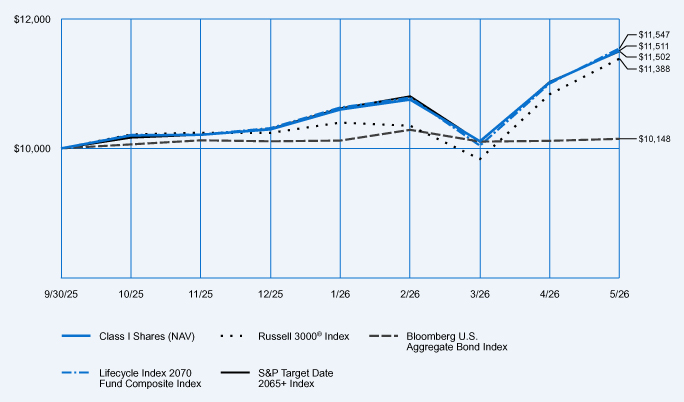
Cumulative Total Returns
| Since Inception (9/30/25) |
||||
| Class I Shares at NAV |
15.11 | % | ||
| Russell 3000® Index |
13.88 | % | ||
| Bloomberg U.S. Aggregate Bond Index |
1.48 | % | ||
| Lifecycle Index 2070 Fund Composite Index |
15.47 | % | ||
| S&P Target Date 2065+ Index |
15.02 | % | ||
Fund Statistics (as of May 31, 2026)
| Fund net assets |
$ | 10,542,381 | ||
| Total number of portfolio holdings |
6 | |||
| Portfolio turnover (%) |
23% | |||
| Total management fees paid for the year |
$ | 5,733 | ||
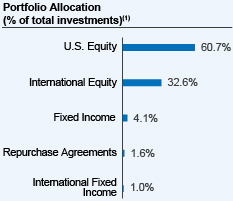 |
| (1) | Affiliated investment companies (Underlying Funds), except for repurchase agreements, where applicable. |
How has the Fund changed?
Portfolio manager update: Effective October 1, 2025, Jeff Sun, CFA was added as a portfolio manager of the Fund.
For more complete information, you may review the Fund’s next prospectus, which is expected to be available by October 1, 2026 at https://www.nuveen.com/en‑us/mutual‑funds/prospectuses or upon request at (800) 257‑8787.
For more complete information, you may review the Fund’s next prospectus, which is expected to be available by October 1, 2026 at https://www.nuveen.com/en‑us/mutual‑funds/prospectuses or upon request at (800) 257‑8787.
This report describes changes to the Fund that occurred during the reporting period.
What were the Fund costs for the period since inception? (based on a hypothetical $10,000 investment)
| Cost of a $10,000 investment | Costs paid as a percentage of $10,000 investment* | |||
| Premier Class Shares |
$24 | 0.22% | ||
| * | The Fund’s ratios exclude the expenses of Underlying Funds that are exchange-traded funds, include the expenses of all other Underlying Funds, and exclude the income of all Underlying Funds. Annualized for a period less than one year. |
How did the Fund perform since inception? What affected the Fund’s performance?
| Performance Highlights The Nuveen Lifecycle Index 2070 Fund returned 15.11% for Premier Class Shares at net asset value (NAV) for the abbreviated reporting period from the Fund’s launch on September 30, 2025, through May 31, 2026. The Fund underperformed the Lifecycle Index 2070 Fund Composite Index, which returned 15.47%. The Fund’s Composite Index consisted of: 61.6% Russell 3000® Index; 33.2% MSCI EAFE + Emerging Markets Index; 4.2% Bloomberg U.S. Aggregate Bond Index; and 1.0% Bloomberg Global Aggregate ex‑USD Index (Hedged). Top contributors to absolute performance • Underlying equity and fixed income funds advanced for the period. U.S. and international equity funds recorded double-digit gains and contributed most. Top detractors from absolute performance • Management fees and other expenses incurred by the Fund. |
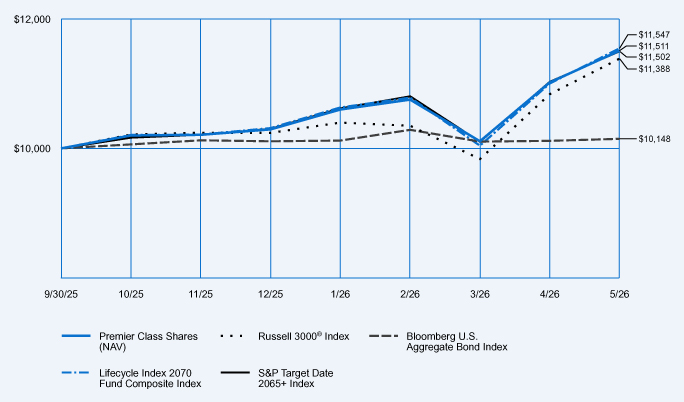
Cumulative Total Returns
| Since Inception (9/30/25) |
||||
| Premier Class Shares at NAV |
15.11 | % | ||
| Russell 3000® Index |
13.88 | % | ||
| Bloomberg U.S. Aggregate Bond Index |
1.48 | % | ||
| Lifecycle Index 2070 Fund Composite Index |
15.47 | % | ||
| S&P Target Date 2065+ Index |
15.02 | % | ||
Fund Statistics (as of May 31, 2026)
| Fund net assets |
$ | 10,542,381 | ||
| Total number of portfolio holdings |
6 | |||
| Portfolio turnover (%) |
23% | |||
| Total management fees paid for the year |
$ | 5,733 | ||
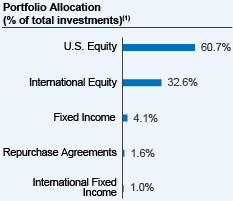 |
| (1) | Affiliated investment companies (Underlying Funds), except for repurchase agreements, where applicable. |
How has the Fund changed?
Portfolio manager update: Effective October 1, 2025, Jeff Sun, CFA was added as a portfolio manager of the Fund.
For more complete information, you may review the Fund’s next prospectus, which is expected to be available by October 1, 2026 at https://www.nuveen.com/en‑us/mutual‑funds/prospectuses or upon request at (800) 257‑8787.
For more complete information, you may review the Fund’s next prospectus, which is expected to be available by October 1, 2026 at https://www.nuveen.com/en‑us/mutual‑funds/prospectuses or upon request at (800) 257‑8787.
This report describes changes to the Fund that occurred during the reporting period.
What were the Fund costs for the period since inception? (based on a hypothetical $10,000 investment)
| Cost of a $10,000 investment | Costs paid as a percentage of $10,000 investment* | |||
| Class R6 Shares |
$12 | 0.11% | ||
| * | The Fund’s ratios exclude the expenses of Underlying Funds that are exchange-traded funds, include the expenses of all other Underlying Funds, and exclude the income of all Underlying Funds. Annualized for a period less than one year. |
How did the Fund perform since inception? What affected the Fund’s performance?
| Performance Highlights The Nuveen Lifecycle Index 2070 Fund returned 15.15% for Class R6 Shares at net asset value (NAV) for the abbreviated reporting period from the Fund’s launch on September 30, 2025, through May 31, 2026. The Fund underperformed the Lifecycle Index 2070 Fund Composite Index, which returned 15.47%. The Fund’s Composite Index consisted of: 61.6% Russell 3000® Index; 33.2% MSCI EAFE + Emerging Markets Index; 4.2% Bloomberg U.S. Aggregate Bond Index; and 1.0% Bloomberg Global Aggregate ex‑USD Index (Hedged). Top contributors to absolute performance • Underlying equity and fixed income funds advanced for the period. U.S. and international equity funds recorded double-digit gains and contributed most. Top detractors from absolute performance • Management fees and other expenses incurred by the Fund. |
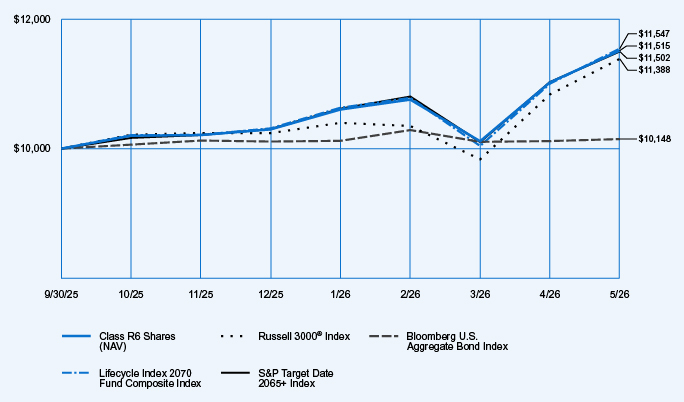
Cumulative Total Returns
| Since Inception (9/30/25) |
||||
| Class R6 Shares at NAV |
15.15 | % | ||
| Russell 3000® Index |
13.88 | % | ||
| Bloomberg U.S. Aggregate Bond Index |
1.48 | % | ||
| Lifecycle Index 2070 Fund Composite Index |
15.47 | % | ||
| S&P Target Date 2065+ Index |
15.02 | % | ||
Fund Statistics (as of May 31, 2026)
| Fund net assets |
$ | 10,542,381 | ||
| Total number of portfolio holdings |
6 | |||
| Portfolio turnover (%) |
23% | |||
| Total management fees paid for the year |
$ | 5,733 | ||
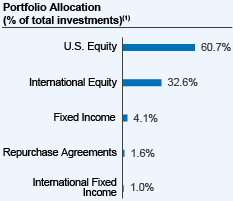 |
| (1) | Affiliated investment companies (Underlying Funds), except for repurchase agreements, where applicable. |
How has the Fund changed?
Portfolio manager update: Effective October 1, 2025, Jeff Sun, CFA was added as a portfolio manager of the Fund.
For more complete information, you may review the Fund’s next prospectus, which is expected to be available by October 1, 2026 at https://www.nuveen.com/en‑us/mutual‑funds/prospectuses or upon request at (800) 257‑8787.
For more complete information, you may review the Fund’s next prospectus, which is expected to be available by October 1, 2026 at https://www.nuveen.com/en‑us/mutual‑funds/prospectuses or upon request at (800) 257‑8787.
This report describes changes to the Fund that occurred during the reporting period.
What were the Fund costs for the period since inception? (based on a hypothetical $10,000 investment)
| Cost of a $10,000 investment | Costs paid as a percentage of $10,000 investment* | |||
| Retirement Class Shares |
$35 | 0.33% | ||
| * | The Fund’s ratios exclude the expenses of Underlying Funds that are exchange-traded funds, include the expenses of all other Underlying Funds, and exclude the income of all Underlying Funds. Annualized for a period less than one year. |
How did the Fund perform since inception? What affected the Fund’s performance?
| Performance Highlights The Nuveen Lifecycle Index 2070 Fund returned 14.98% for Retirement Class Shares at net asset value (NAV) for the abbreviated reporting period from the Fund’s launch on September 30, 2025, through May 31, 2026. The Fund underperformed the Lifecycle Index 2070 Fund Composite Index, which returned 15.47%. The Fund’s Composite Index consisted of: 61.6% Russell 3000® Index; 33.2% MSCI EAFE + Emerging Markets Index; 4.2% Bloomberg U.S. Aggregate Bond Index; and 1.0% Bloomberg Global Aggregate ex‑USD Index (Hedged). Top contributors to absolute performance • Underlying equity and fixed income funds advanced for the period. U.S. and international equity funds recorded double-digit gains and contributed most. Top detractors from absolute performance • Management fees and other expenses incurred by the Fund. |
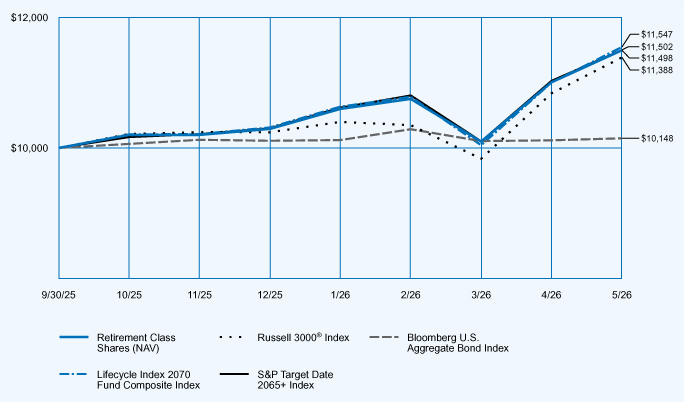
Cumulative Total Returns
| Since Inception (9/30/25) |
||||
| Retirement Class Shares at NAV |
14.98 | % | ||
| Russell 3000® Index |
13.88 | % | ||
| Bloomberg U.S. Aggregate Bond Index |
1.48 | % | ||
| Lifecycle Index 2070 Fund Composite Index |
15.47 | % | ||
| S&P Target Date 2065+ Index |
15.02 | % | ||
Fund Statistics (as of May 31, 2026)
| Fund net assets |
$ | 10,542,381 | ||
| Total number of portfolio holdings |
6 | |||
| Portfolio turnover (%) |
23% | |||
| Total management fees paid for the year |
$ | 5,733 | ||
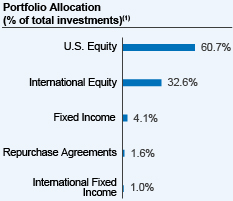 |
| (1) | Affiliated investment companies (Underlying Funds), except for repurchase agreements, where applicable. |
How has the Fund changed?
Portfolio manager update: Effective October 1, 2025, Jeff Sun, CFA was added as a portfolio manager of the Fund.
For more complete information, you may review the Fund’s next prospectus, which is expected to be available by October 1, 2026 at https://www.nuveen.com/en‑us/mutual‑funds/prospectuses or upon request at (800) 257‑8787.
For more complete information, you may review the Fund’s next prospectus, which is expected to be available by October 1, 2026 at https://www.nuveen.com/en‑us/mutual‑funds/prospectuses or upon request at (800) 257‑8787.
| [1] | The Fund’s ratios include the expenses of the Underlying Funds, excluding the expenses of the Dividend Growth, Dividend Value, Floating Rate Income, Growth Opportunities ETF, International Value, Small Cap Select and the Nuveen Real Property Fund LP and exclude the income of the Underlying Funds. Annualized for period less than one year. |
| [2] | The Fund’s ratios include the expenses of the Underlying Funds, excluding the expenses of the Dividend Growth, Dividend Value, Floating Rate Income, Growth Opportunities ETF, International Value, Small Cap Select and the Nuveen Real Property Fund LP and exclude the income of the Underlying Funds. Annualized for period less than one year. |
| [3] | The Fund’s ratios include the expenses of the Underlying Funds, excluding the expenses of the Dividend Growth, Dividend Value, Floating Rate Income, Growth Opportunities ETF, International Value, Small Cap Select and the Nuveen Real Property Fund LP and exclude the income of the Underlying Funds. Annualized for period less than one year. |
| [4] | The Fund’s ratios include the expenses of the Underlying Funds, excluding the expenses of the Dividend Growth, Dividend Value, Floating Rate Income, Growth Opportunities ETF, International Value, Small Cap Select and the Nuveen Real Property Fund LP and exclude the income of the Underlying Funds. Annualized for period less than one year. |
| [5] | The Fund’s ratios include the expenses of the Underlying Funds, excluding the expenses of the Dividend Growth, Dividend Value, Floating Rate Income, Growth Opportunities ETF, International Value, Small Cap Select and the Nuveen Real Property Fund LP and exclude the income of the Underlying Funds. Annualized for period less than one year. |
| [6] | The Fund’s ratios include the expenses of the Underlying Funds, excluding the expenses of the Dividend Growth, Dividend Value, Floating Rate Income, Growth Opportunities ETF, International Value, Small Cap Select and the Nuveen Real Property Fund LP and exclude the income of the Underlying Funds. Annualized for period less than one year. |
| [7] | The Fund’s ratios include the expenses of the Underlying Funds, excluding the expenses of the Dividend Growth, Dividend Value, Floating Rate Income, Growth Opportunities ETF, International Value, Small Cap Select and the Nuveen Real Property Fund LP and exclude the income of the Underlying Funds. Annualized for period less than one year. |
| [8] | The Fund’s ratios include the expenses of the Underlying Funds, excluding the expenses of the Dividend Growth, Dividend Value, Floating Rate Income, Growth Opportunities ETF, International Value, Small Cap Select and the Nuveen Real Property Fund LP and exclude the income of the Underlying Funds. Annualized for period less than one year. |
| [9] | The Fund’s ratios include the expenses of the Underlying Funds, excluding the expenses of the Dividend Growth, Dividend Value, Floating Rate Income, Growth Opportunities ETF, International Value, Small Cap Select and the Nuveen Real Property Fund LP and exclude the income of the Underlying Funds. Annualized for period less than one year. |
| [10] | The Fund’s ratios include the expenses of the Underlying Funds, excluding the expenses of the Dividend Growth, Dividend Value, Floating Rate Income, Growth Opportunities ETF, International Value, Small Cap Select and the Nuveen Real Property Fund LP and exclude the income of the Underlying Funds. Annualized for period less than one year. |
| [11] | The Fund’s ratios include the expenses of the Underlying Funds, excluding the expenses of the Dividend Growth, Dividend Value, Floating Rate Income, Growth Opportunities ETF, International Value, Small Cap Select and the Nuveen Real Property Fund LP and exclude the income of the Underlying Funds. Annualized for period less than one year. |
| [12] | The Fund’s ratios include the expenses of the Underlying Funds, excluding the expenses of the Dividend Growth, Dividend Value, Floating Rate Income, Growth Opportunities ETF, International Value, Small Cap Select and the Nuveen Real Property Fund LP and exclude the income of the Underlying Funds. Annualized for period less than one year. |
| [13] | The Fund’s ratios include the expenses of the Underlying Funds, excluding the expenses of the Dividend Growth, Dividend Value, Floating Rate Income, Growth Opportunities ETF, International Value, Small Cap Select and the Nuveen Real Property Fund LP and exclude the income of the Underlying Funds. Annualized for period less than one year. |
| [14] | The Fund’s ratios include the expenses of the Underlying Funds, excluding the expenses of the Dividend Growth, Dividend Value, Floating Rate Income, Growth Opportunities ETF, International Value, Small Cap Select and the Nuveen Real Property Fund LP and exclude the income of the Underlying Funds. Annualized for period less than one year. |
| [15] | The Fund’s ratios include the expenses of the Underlying Funds, excluding the expenses of the Dividend Growth, Dividend Value, Floating Rate Income, Growth Opportunities ETF, International Value, Small Cap Select and the Nuveen Real Property Fund LP and exclude the income of the Underlying Funds. Annualized for period less than one year. |
| [16] | The Fund’s ratios include the expenses of the Underlying Funds, excluding the expenses of the Dividend Growth, Dividend Value, Floating Rate Income, Growth Opportunities ETF, International Value, Small Cap Select and the Nuveen Real Property Fund LP and exclude the income of the Underlying Funds. Annualized for period less than one year. |
| [17] | The Fund’s ratios include the expenses of the Underlying Funds, excluding the expenses of the Dividend Growth, Dividend Value, Floating Rate Income, Growth Opportunities ETF, International Value, Small Cap Select and the Nuveen Real Property Fund LP and exclude the income of the Underlying Funds. Annualized for period less than one year. |
| [18] | The Fund’s ratios include the expenses of the Underlying Funds, excluding the expenses of the Dividend Growth, Dividend Value, Floating Rate Income, Growth Opportunities ETF, International Value, Small Cap Select and the Nuveen Real Property Fund LP and exclude the income of the Underlying Funds. Annualized for period less than one year. |
| [19] | The Fund’s ratios include the expenses of the Underlying Funds, excluding the expenses of the Dividend Growth, Dividend Value, Floating Rate Income, Growth Opportunities ETF, International Value, Small Cap Select and the Nuveen Real Property Fund LP and exclude the income of the Underlying Funds. Annualized for period less than one year. |
| [20] | The Fund’s ratios include the expenses of the Underlying Funds, excluding the expenses of the Dividend Growth, Dividend Value, Floating Rate Income, Growth Opportunities ETF, International Value, Small Cap Select and the Nuveen Real Property Fund LP and exclude the income of the Underlying Funds. Annualized for period less than one year. |
| [21] | The Fund’s ratios include the expenses of the Underlying Funds, excluding the expenses of the Dividend Growth, Dividend Value, Floating Rate Income, Growth Opportunities ETF, International Value, Small Cap Select and the Nuveen Real Property Fund LP and exclude the income of the Underlying Funds. Annualized for period less than one year. |
| [22] | The Fund’s ratios include the expenses of the Underlying Funds, excluding the expenses of the Dividend Growth, Dividend Value, Floating Rate Income, Growth Opportunities ETF, International Value, Small Cap Select and the Nuveen Real Property Fund LP and exclude the income of the Underlying Funds. Annualized for period less than one year. |
| [23] | The Fund’s ratios include the expenses of the Underlying Funds, excluding the expenses of the Dividend Growth, Dividend Value, Floating Rate Income, Growth Opportunities ETF, International Value, Small Cap Select and the Nuveen Real Property Fund LP and exclude the income of the Underlying Funds. Annualized for period less than one year. |
| [24] | The Fund’s ratios include the expenses of the Underlying Funds, excluding the expenses of the Dividend Growth, Dividend Value, Floating Rate Income, Growth Opportunities ETF, International Value, Small Cap Select and the Nuveen Real Property Fund LP and exclude the income of the Underlying Funds. Annualized for period less than one year. |
| [25] | The Fund’s ratios include the expenses of the Underlying Funds, excluding the expenses of the Dividend Growth, Dividend Value, Floating Rate Income, Growth Opportunities ETF, International Value, Small Cap Select and the Nuveen Real Property Fund LP and exclude the income of the Underlying Funds. Annualized for period less than one year. |
| [26] | The Fund’s ratios include the expenses of the Underlying Funds, excluding the expenses of the Dividend Growth, Dividend Value, Floating Rate Income, Growth Opportunities ETF, International Value, Small Cap Select and the Nuveen Real Property Fund LP and exclude the income of the Underlying Funds. Annualized for period less than one year. |
| [27] | The Fund’s ratios include the expenses of the Underlying Funds, excluding the expenses of the Dividend Growth, Dividend Value, Floating Rate Income, Growth Opportunities ETF, International Value, Small Cap Select and the Nuveen Real Property Fund LP and exclude the income of the Underlying Funds. Annualized for period less than one year. |
| [28] | The Fund’s ratios include the expenses of the Underlying Funds, excluding the expenses of the Dividend Growth, Dividend Value, Floating Rate Income, Growth Opportunities ETF, International Value, Small Cap Select and the Nuveen Real Property Fund LP and exclude the income of the Underlying Funds. Annualized for period less than one year. |
| [29] | The Fund’s ratios do not include the expenses or income of the Underlying Funds. Annualized for period less than one year. |
| [30] | The Fund’s ratios do not include the expenses or income of the Underlying Funds. Annualized for period less than one year. |
| [31] | The Fund’s ratios do not include the expenses or income of the Underlying Funds. Annualized for period less than one year. |
| [32] | The Fund’s ratios include the expenses of the Underlying Funds, excluding the expenses of the Dividend Growth, Dividend Value, Floating Rate Income, Growth Opportunities ETF, International Value, Small Cap Select and the Nuveen Real Property Fund LP and exclude the income of the Underlying Funds. Annualized for period less than one year. |
| [33] | The Fund’s ratios include the expenses of the Underlying Funds, excluding the expenses of the Dividend Growth, Dividend Value, Floating Rate Income, Growth Opportunities ETF, International Value, Small Cap Select and the Nuveen Real Property Fund LP and exclude the income of the Underlying Funds. Annualized for period less than one year. |
| [34] | The Fund’s ratios include the expenses of the Underlying Funds, excluding the expenses of the Dividend Growth, Dividend Value, Floating Rate Income, Growth Opportunities ETF, International Value, Small Cap Select and the Nuveen Real Property Fund LP and exclude the income of the Underlying Funds. Annualized for period less than one year. |
| [35] | The Fund’s ratios include the expenses of the Underlying Funds, excluding the expenses of the Dividend Growth, Dividend Value, Floating Rate Income, Growth Opportunities ETF, International Value, Small Cap Select and the Nuveen Real Property Fund LP and exclude the income of the Underlying Funds. Annualized for period less than one year. |
| [36] | The Fund’s ratios include the expenses of the Underlying Funds, excluding the expenses of the Dividend Growth, Dividend Value, Floating Rate Income, Growth Opportunities ETF, International Value, Small Cap Select and the Nuveen Real Property Fund LP and exclude the income of the Underlying Funds. Annualized for period less than one year. |
| [37] | The Fund’s ratios include the expenses of the Underlying Funds, excluding the expenses of the Dividend Growth, Dividend Value, Floating Rate Income, Growth Opportunities ETF, International Value, Small Cap Select and the Nuveen Real Property Fund LP and exclude the income of the Underlying Funds. Annualized for period less than one year. |
| [38] | The Fund’s ratios include the expenses of the Underlying Funds, excluding the expenses of the Dividend Growth, Dividend Value, Floating Rate Income, Growth Opportunities ETF, International Value, Small Cap Select and the Nuveen Real Property Fund LP and exclude the income of the Underlying Funds. Annualized for period less than one year. |
| [39] | The Fund’s ratios include the expenses of the Underlying Funds, excluding the expenses of the Dividend Growth, Dividend Value, Floating Rate Income, Growth Opportunities ETF, International Value, Small Cap Select and the Nuveen Real Property Fund LP and exclude the income of the Underlying Funds. Annualized for period less than one year. |
| [40] | The Fund’s ratios include the expenses of the Underlying Funds, excluding the expenses of the Dividend Growth, Dividend Value, Floating Rate Income, Growth Opportunities ETF, International Value, Small Cap Select and the Nuveen Real Property Fund LP and exclude the income of the Underlying Funds. Annualized for period less than one year. |
| [41] | The Fund’s ratios include the expenses of the Underlying Funds, excluding the expenses of the Dividend Growth, Dividend Value, Floating Rate Income, Growth Opportunities ETF, International Value, Small Cap Select and the Nuveen Real Property Fund LP and exclude the income of the Underlying Funds. Annualized for period less than one year. |
| [42] | The Fund’s ratios include the expenses of the Underlying Funds, excluding the expenses of the Dividend Growth, Dividend Value, Floating Rate Income, Growth Opportunities ETF, International Value, Small Cap Select and the Nuveen Real Property Fund LP and exclude the income of the Underlying Funds. Annualized for period less than one year. |
| [43] | The Fund’s ratios include the expenses of the Underlying Funds, excluding the expenses of the Dividend Growth, Dividend Value, Floating Rate Income, Growth Opportunities ETF, International Value, Small Cap Select and the Nuveen Real Property Fund LP and exclude the income of the Underlying Funds. Annualized for period less than one year. |
| [44] | The Fund’s ratios include the expenses of the Underlying Funds, excluding the expenses of the Dividend Growth, Dividend Value, Floating Rate Income, Growth Opportunities ETF, International Value, Small Cap Select and the Nuveen Real Property Fund LP and exclude the income of the Underlying Funds. Annualized for period less than one year. |
| [45] | The Fund’s ratios exclude the expenses of Underlying Funds that are exchange-traded funds, include the expenses of all other Underlying Funds, and exclude the income of all Underlying Funds. Annualized for a period less than one year. |
| [46] | The Fund’s ratios exclude the expenses of Underlying Funds that are exchange-traded funds, include the expenses of all other Underlying Funds, and exclude the income of all Underlying Funds. Annualized for a period less than one year. |
| [47] | The Fund’s ratios exclude the expenses of Underlying Funds that are exchange-traded funds, include the expenses of all other Underlying Funds, and exclude the income of all Underlying Funds. Annualized for a period less than one year. |
| [48] | The Fund’s ratios exclude the expenses of Underlying Funds that are exchange-traded funds, include the expenses of all other Underlying Funds, and exclude the income of all Underlying Funds. Annualized for a period less than one year. |
| [49] | The Fund’s ratios exclude the expenses of Underlying Funds that are exchange-traded funds, include the expenses of all other Underlying Funds, and exclude the income of all Underlying Funds. Annualized for a period less than one year. |
| [50] | The Fund’s ratios exclude the expenses of Underlying Funds that are exchange-traded funds, include the expenses of all other Underlying Funds, and exclude the income of all Underlying Funds. Annualized for a period less than one year. |
| [51] | The Fund’s ratios exclude the expenses of Underlying Funds that are exchange-traded funds, include the expenses of all other Underlying Funds, and exclude the income of all Underlying Funds. Annualized for a period less than one year. |
| [52] | The Fund’s ratios exclude the expenses of Underlying Funds that are exchange-traded funds, include the expenses of all other Underlying Funds, and exclude the income of all Underlying Funds. Annualized for a period less than one year. |
| [53] | The Fund’s ratios exclude the expenses of Underlying Funds that are exchange-traded funds, include the expenses of all other Underlying Funds, and exclude the income of all Underlying Funds. Annualized for a period less than one year. |
| [54] | The Fund’s ratios exclude the expenses of Underlying Funds that are exchange-traded funds, include the expenses of all other Underlying Funds, and exclude the income of all Underlying Funds. Annualized for a period less than one year. |
| [55] | The Fund’s ratios exclude the expenses of Underlying Funds that are exchange-traded funds, include the expenses of all other Underlying Funds, and exclude the income of all Underlying Funds. Annualized for a period less than one year. |
| [56] | The Fund’s ratios exclude the expenses of Underlying Funds that are exchange-traded funds, include the expenses of all other Underlying Funds, and exclude the income of all Underlying Funds. Annualized for a period less than one year. |
| [57] | The Fund’s ratios exclude the expenses of Underlying Funds that are exchange-traded funds, include the expenses of all other Underlying Funds, and exclude the income of all Underlying Funds. Annualized for a period less than one year. |
| [58] | The Fund’s ratios exclude the expenses of Underlying Funds that are exchange-traded funds, include the expenses of all other Underlying Funds, and exclude the income of all Underlying Funds. Annualized for a period less than one year. |
| [59] | The Fund’s ratios exclude the expenses of Underlying Funds that are exchange-traded funds, include the expenses of all other Underlying Funds, and exclude the income of all Underlying Funds. Annualized for a period less than one year. |
| [60] | The Fund’s ratios exclude the expenses of Underlying Funds that are exchange-traded funds, include the expenses of all other Underlying Funds, and exclude the income of all Underlying Funds. Annualized for a period less than one year. |
| [61] | The Fund’s ratios exclude the expenses of Underlying Funds that are exchange-traded funds, include the expenses of all other Underlying Funds, and exclude the income of all Underlying Funds. Annualized for a period less than one year. |
| [62] | The Fund’s ratios exclude the expenses of Underlying Funds that are exchange-traded funds, include the expenses of all other Underlying Funds, and exclude the income of all Underlying Funds. Annualized for a period less than one year. |
| [63] | The Fund’s ratios exclude the expenses of Underlying Funds that are exchange-traded funds, include the expenses of all other Underlying Funds, and exclude the income of all Underlying Funds. Annualized for a period less than one year. |
| [64] | The Fund’s ratios exclude the expenses of Underlying Funds that are exchange-traded funds, include the expenses of all other Underlying Funds, and exclude the income of all Underlying Funds. Annualized for a period less than one year. |
| [65] | The Fund’s ratios exclude the expenses of Underlying Funds that are exchange-traded funds, include the expenses of all other Underlying Funds, and exclude the income of all Underlying Funds. Annualized for a period less than one year. |
| [66] | The Fund’s ratios exclude the expenses of Underlying Funds that are exchange-traded funds, include the expenses of all other Underlying Funds, and exclude the income of all Underlying Funds. Annualized for a period less than one year. |
| [67] | The Fund’s ratios exclude the expenses of Underlying Funds that are exchange-traded funds, include the expenses of all other Underlying Funds, and exclude the income of all Underlying Funds. Annualized for a period less than one year. |
| [68] | The Fund’s ratios exclude the expenses of Underlying Funds that are exchange-traded funds, include the expenses of all other Underlying Funds, and exclude the income of all Underlying Funds. Annualized for a period less than one year. |
| [69] | The Fund’s ratios exclude the expenses of Underlying Funds that are exchange-traded funds, include the expenses of all other Underlying Funds, and exclude the income of all Underlying Funds. Annualized for a period less than one year. |
| [70] | The Fund’s ratios exclude the expenses of Underlying Funds that are exchange-traded funds, include the expenses of all other Underlying Funds, and exclude the income of all Underlying Funds. Annualized for a period less than one year. |
| [71] | The Fund’s ratios exclude the expenses of Underlying Funds that are exchange-traded funds, include the expenses of all other Underlying Funds, and exclude the income of all Underlying Funds. Annualized for a period less than one year. |
| [72] | The Fund’s ratios exclude the expenses of Underlying Funds that are exchange-traded funds, include the expenses of all other Underlying Funds, and exclude the income of all Underlying Funds. Annualized for a period less than one year. |
| [73] | The Fund’s ratios exclude the expenses of Underlying Funds that are exchange-traded funds, include the expenses of all other Underlying Funds, and exclude the income of all Underlying Funds. Annualized for a period less than one year. |
| [74] | The Fund’s ratios exclude the expenses of Underlying Funds that are exchange-traded funds, include the expenses of all other Underlying Funds, and exclude the income of all Underlying Funds. Annualized for a period less than one year. |
| [75] | The Fund’s ratios exclude the expenses of Underlying Funds that are exchange-traded funds, include the expenses of all other Underlying Funds, and exclude the income of all Underlying Funds. Annualized for a period less than one year. |
| [76] | The Fund’s ratios exclude the expenses of Underlying Funds that are exchange-traded funds, include the expenses of all other Underlying Funds, and exclude the income of all Underlying Funds. Annualized for a period less than one year. |
| [77] | The Fund’s ratios exclude the expenses of Underlying Funds that are exchange-traded funds, include the expenses of all other Underlying Funds, and exclude the income of all Underlying Funds. Annualized for a period less than one year. |
| [78] | The Fund’s ratios exclude the expenses of Underlying Funds that are exchange-traded funds, include the expenses of all other Underlying Funds, and exclude the income of all Underlying Funds. Annualized for a period less than one year. |
| [79] | The Fund’s ratios exclude the expenses of Underlying Funds that are exchange-traded funds, include the expenses of all other Underlying Funds, and exclude the income of all Underlying Funds. Annualized for a period less than one year. |
| [80] | The Fund’s ratios exclude the expenses of Underlying Funds that are exchange-traded funds, include the expenses of all other Underlying Funds, and exclude the income of all Underlying Funds. Annualized for a period less than one year. |
| [81] | The Fund’s ratios exclude the expenses of Underlying Funds that are exchange-traded funds, include the expenses of all other Underlying Funds, and exclude the income of all Underlying Funds. Annualized for a period less than one year. |
| [82] | The Fund’s ratios exclude the expenses of Underlying Funds that are exchange-traded funds, include the expenses of all other Underlying Funds, and exclude the income of all Underlying Funds. Annualized for a period less than one year. |
| [83] | The Fund’s ratios exclude the expenses of Underlying Funds that are exchange-traded funds, include the expenses of all other Underlying Funds, and exclude the income of all Underlying Funds. Annualized for a period less than one year. |
| [84] | The Fund’s ratios exclude the expenses of Underlying Funds that are exchange-traded funds, include the expenses of all other Underlying Funds, and exclude the income of all Underlying Funds. Annualized for a period less than one year. |
| [85] | The Fund’s ratios exclude the expenses of Underlying Funds that are exchange-traded funds, include the expenses of all other Underlying Funds, and exclude the income of all Underlying Funds. Annualized for a period less than one year. |
| [86] | The Fund’s ratios exclude the expenses of Underlying Funds that are exchange-traded funds, include the expenses of all other Underlying Funds, and exclude the income of all Underlying Funds. Annualized for a period less than one year. |
| [87] | The Fund’s ratios exclude the expenses of Underlying Funds that are exchange-traded funds, include the expenses of all other Underlying Funds, and exclude the income of all Underlying Funds. Annualized for a period less than one year. |
| [88] | The Fund’s ratios exclude the expenses of Underlying Funds that are exchange-traded funds, include the expenses of all other Underlying Funds, and exclude the income of all Underlying Funds. Annualized for a period less than one year. |
| [89] | The Fund’s ratios include the expenses of the Underlying Funds, excluding the expenses of the Dividend Growth, Dividend Value, Growth Opportunities ETF, International Value, Small Cap Select and the Nuveen Real Property Fund LP and exclude the income of the Underlying Funds. Annualized for period less than one year. |
| [90] | The Fund’s ratios include the expenses of the Underlying Funds, excluding the expenses of the Dividend Growth, Dividend Value, Growth Opportunities ETF, International Value, Small Cap Select and the Nuveen Real Property Fund LP and exclude the income of the Underlying Funds. Annualized for period less than one year. |
| [91] | The Fund’s ratios include the expenses of the Underlying Funds, excluding the expenses of the Dividend Growth, Dividend Value, Growth Opportunities ETF, International Value, Small Cap Select and the Nuveen Real Property Fund LP and exclude the income of the Underlying Funds. Annualized for period less than one year. |
| [92] | The Fund’s ratios include the expenses of the Underlying Funds, excluding the expenses of the Dividend Growth, Dividend Value, Growth Opportunities ETF, International Value, Small Cap Select and the Nuveen Real Property Fund LP and exclude the income of the Underlying Funds. Annualized for period less than one year. |
| [93] | The Fund’s ratios do not include the expenses or income of the Underlying Funds. Annualized for period less than one year. |
| [94] | The Fund’s ratios do not include the expenses or income of the Underlying Funds. Annualized for period less than one year. |
| [95] | The Fund’s ratios do not include the expenses or income of the Underlying Funds. Annualized for period less than one year. |
| [96] | The Fund’s ratios do not include the expenses or income of the Underlying Funds. Annualized for period less than one year. |
| [97] | The Fund’s ratios do not include the expenses or income of the Underlying Funds. Annualized for period less than one year. |
| [98] | The Fund’s ratios do not include the expenses or income of the Underlying Funds. Annualized for period less than one year. |
| [99] | The Fund’s ratios do not include the expenses or income of the Underlying Funds. Annualized for period less than one year. |
| [100] | The Fund’s ratios do not include the expenses or income of the Underlying Funds. Annualized for period less than one year. |
| [101] | The Fund’s ratios do not include the expenses or income of the Underlying Funds. Annualized for period less than one year. |
| [102] | The Fund’s ratios do not include the expenses or income of the Underlying Funds. Annualized for period less than one year. |
| [103] | The Fund’s ratios do not include the expenses or income of the Underlying Funds. Annualized for period less than one year. |
| [104] | The Fund’s ratios do not include the expenses or income of the Underlying Funds. Annualized for period less than one year. |
| [105] | The Fund’s ratios do not include the expenses or income of the Underlying Funds. Annualized for period less than one year. |
| [106] | The Fund’s ratios do not include the expenses or income of the Underlying Funds. Annualized for period less than one year. |
| [107] | The Fund’s ratios do not include the expenses or income of the Underlying Funds. Annualized for period less than one year. |
| [108] | The Fund’s ratios do not include the expenses or income of the Underlying Funds. Annualized for period less than one year. |
| [109] | The Fund’s ratios do not include the expenses or income of the Underlying Funds. Annualized for period less than one year. |
| [110] | The Fund’s ratios do not include the expenses or income of the Underlying Funds. Annualized for period less than one year. |
| [111] | The Fund’s ratios do not include the expenses or income of the Underlying Funds. Annualized for period less than one year. |
| [112] | The Fund’s ratios do not include the expenses or income of the Underlying Funds. Annualized for period less than one year. |
| [113] | The Fund’s ratios do not include the expenses or income of the Underlying Funds. Annualized for period less than one year. |
| [114] | The Fund’s ratios do not include the expenses or income of the Underlying Funds. Annualized for period less than one year. |
| [115] | The Fund’s ratios do not include the expenses or income of the Underlying Funds. Annualized for period less than one year. |
| [116] | The Fund’s ratios do not include the expenses or income of the Underlying Funds. Annualized for period less than one year. |
| [117] | The Fund’s ratios do not include the expenses or income of the Underlying Funds. Annualized for period less than one year. |
| [118] | The Fund’s ratios include the expenses of the Underlying Funds, excluding the expenses of the Dividend Growth, Dividend Value, Growth Opportunities ETF, International Value, Small Cap Select and the Nuveen Real Property Fund LP and exclude the income of the Underlying Funds. Annualized for period less than one year. |
| [119] | The Fund’s ratios include the expenses of the Underlying Funds, excluding the expenses of the Dividend Growth, Dividend Value, Growth Opportunities ETF, International Value, Small Cap Select and the Nuveen Real Property Fund LP and exclude the income of the Underlying Funds. Annualized for period less than one year. |
| [120] | The Fund’s ratios include the expenses of the Underlying Funds, excluding the expenses of the Dividend Growth, Dividend Value, Growth Opportunities ETF, International Value, Small Cap Select and the Nuveen Real Property Fund LP and exclude the income of the Underlying Funds. Annualized for period less than one year. |
| [121] | The Fund’s ratios include the expenses of the Underlying Funds, excluding the expenses of the Dividend Growth, Dividend Value, Growth Opportunities ETF, International Value, Small Cap Select and the Nuveen Real Property Fund LP and exclude the income of the Underlying Funds. Annualized for period less than one year. |
| [122] | The Fund’s ratios exclude the expenses of Underlying Funds that are exchange-traded funds, include the expenses of all other Underlying Funds, and exclude the income of all Underlying Funds. Annualized for a period less than one year. |
| [123] | The Fund’s ratios exclude the expenses of Underlying Funds that are exchange-traded funds, include the expenses of all other Underlying Funds, and exclude the income of all Underlying Funds. Annualized for a period less than one year. |
| [124] | The Fund’s ratios exclude the expenses of Underlying Funds that are exchange-traded funds, include the expenses of all other Underlying Funds, and exclude the income of all Underlying Funds. Annualized for a period less than one year. |
| [125] | The Fund’s ratios exclude the expenses of Underlying Funds that are exchange-traded funds, include the expenses of all other Underlying Funds, and exclude the income of all Underlying Funds. Annualized for a period less than one year. |
| [126] | The Fund’s ratios include the expenses of the Underlying Funds, excluding the expenses of the Dividend Growth, Dividend Value, Growth Opportunities ETF, International Value, Small Cap Select and the Nuveen Real Property Fund LP and exclude the income of the Underlying Funds. Annualized for period less than one year. |
| [127] | The Fund’s ratios include the expenses of the Underlying Funds, excluding the expenses of the Dividend Growth, Dividend Value, Growth Opportunities ETF, International Value, Small Cap Select and the Nuveen Real Property Fund LP and exclude the income of the Underlying Funds. Annualized for period less than one year. |
| [128] | The Fund’s ratios include the expenses of the Underlying Funds, excluding the expenses of the Dividend Growth, Dividend Value, Growth Opportunities ETF, International Value, Small Cap Select and the Nuveen Real Property Fund LP and exclude the income of the Underlying Funds. Annualized for period less than one year. |
| [129] | The Fund’s ratios include the expenses of the Underlying Funds, excluding the expenses of the Dividend Growth, Dividend Value, Growth Opportunities ETF, International Value, Small Cap Select and the Nuveen Real Property Fund LP and exclude the income of the Underlying Funds. Annualized for period less than one year. |
| [130] | The Fund’s ratios exclude the expenses of Underlying Funds that are exchange-traded funds, include the expenses of all other Underlying Funds, and exclude the income of all Underlying Funds. Annualized for a period less than one year. |
| [131] | The Fund’s ratios exclude the expenses of Underlying Funds that are exchange-traded funds, include the expenses of all other Underlying Funds, and exclude the income of all Underlying Funds. Annualized for a period less than one year. |
| [132] | The Fund’s ratios exclude the expenses of Underlying Funds that are exchange-traded funds, include the expenses of all other Underlying Funds, and exclude the income of all Underlying Funds. Annualized for a period less than one year. |
| [133] | The Fund’s ratios exclude the expenses of Underlying Funds that are exchange-traded funds, include the expenses of all other Underlying Funds, and exclude the income of all Underlying Funds. Annualized for a period less than one year. |
| [134] | The Fund’s ratios include the expenses of the Underlying Funds, excluding the expenses of the Dividend Growth, Dividend Value, Growth Opportunities ETF, International Value, Small Cap Select and the Nuveen Real Property Fund LP and exclude the income of the Underlying Funds. Annualized for period less than one year. |
| [135] | The Fund’s ratios include the expenses of the Underlying Funds, excluding the expenses of the Dividend Growth, Dividend Value, Growth Opportunities ETF, International Value, Small Cap Select and the Nuveen Real Property Fund LP and exclude the income of the Underlying Funds. Annualized for period less than one year. |
| [136] | The Fund’s ratios include the expenses of the Underlying Funds, excluding the expenses of the Dividend Growth, Dividend Value, Growth Opportunities ETF, International Value, Small Cap Select and the Nuveen Real Property Fund LP and exclude the income of the Underlying Funds. Annualized for period less than one year. |
| [137] | The Fund’s ratios include the expenses of the Underlying Funds, excluding the expenses of the Dividend Growth, Dividend Value, Growth Opportunities ETF, International Value, Small Cap Select and the Nuveen Real Property Fund LP and exclude the income of the Underlying Funds. Annualized for period less than one year. |
| [138] | The Fund’s ratios exclude the expenses of Underlying Funds that are exchange-traded funds, include the expenses of all other Underlying Funds, and exclude the income of all Underlying Funds. Annualized for a period less than one year. |
| [139] | The Fund’s ratios exclude the expenses of Underlying Funds that are exchange-traded funds, include the expenses of all other Underlying Funds, and exclude the income of all Underlying Funds. Annualized for a period less than one year. |
| [140] | The Fund’s ratios exclude the expenses of Underlying Funds that are exchange-traded funds, include the expenses of all other Underlying Funds, and exclude the income of all Underlying Funds. Annualized for a period less than one year. |
| [141] | The Fund’s ratios exclude the expenses of Underlying Funds that are exchange-traded funds, include the expenses of all other Underlying Funds, and exclude the income of all Underlying Funds. Annualized for a period less than one year. |