
R: 0 G: 62 B: 41 R: 1 G: 39 B: 26 R: 254 G: 109 B: 18 R: 255 G: 255 B: 255 R: 231 G: 229 B: 170 R: 166 G: 166 B: 166 R: 117 G: 209 B: 208 R: 131 G: 201 B: 126 R: 37 G: 37 B: 37 Priority Technology Holdings, Inc. (Nasdaq: PRTH) Supplemental Slides: Q2 2026 August 2026
prioritycommerce.com R: 0 G: 62 B: 41 R: 1 G: 39 B: 26 R: 254 G: 109 B: 18 R: 255 G: 255 B: 255 R: 231 G: 229 B: 170 R: 166 G: 166 B: 166 R: 117 G: 209 B: 208 R: 131 G: 201 B: 126 R: 37 G: 37 B: 37 2 Disclaimer Important Notice Regarding Forward-Looking Statements and Non-GAAP Measures This presentation contains “forward-looking statements” within the meaning of the Private Securities Litigation Reform Act of 1995. Such statements include, but are not limited to, statements about future financial and operating results, our plans, objectives, expectations and intentions with respect to future operations, products and services, and other statements identified by words such as “may,” “will,” “should,” “anticipates,” “believes,” “expects,” “plans,” “future,” “intends,” “could,” “estimate,” “predict,” “projects,” “targeting,” “potential” or “contingent,” “guidance,” “anticipates,” “outlook” or words of similar meaning. These forward-looking statements include, but are not limited to, Priority Technology Holdings, Inc.’s (“Priority Commerce”, “we”, “our” or “us”) 2026 outlook and statements regarding our market and growth opportunities. Such forward-looking statements are based upon the current beliefs and expectations of our management and are inherently subject to significant business, economic and competitive risks, trends and uncertainties that could cause actual results to differ materially from those projected, expressed, or implied by such forward-looking statements. Our actual results could differ materially, and potentially adversely, from those discussed or implied herein. We caution that it is very difficult to predict the impact of known factors, and it is impossible for us to anticipate all factors that could affect our actual results. All forward-looking statements are expressly qualified in their entirety by these cautionary statements. You should evaluate all forward-looking statements made in this presentation in the context of the risks and uncertainties disclosed in our Securities and Exchange Commission (“SEC”) filings, including our Annual Report on Form 10-K filed with the SEC on March 10, 2026. These filings are available online at www.sec.gov or www.prioritycommerce.com. We caution you that the important factors referenced above may not contain all of the factors that are important to you. In addition, we cannot assure you that we will realize the results or developments we expect or anticipate or, even if substantially realized, that they will result in the consequences we anticipate or affect us or our operations in the way we expect. You are cautioned not to place undue reliance on forward-looking statements as a predictor of future performance. The forward-looking statements included in this presentation are made only as of the date hereof. We undertake no obligation to publicly update or revise any forward-looking statement as a result of new information, future events or otherwise, except as otherwise required by law. If we do update one or more forward-looking statements, no inference should be made that we will make additional updates with respect to those or other forward-looking statements. We qualify all of our forward-looking statements by these cautionary statements. This presentation includes certain non-GAAP financial measures that are not prepared in accordance with accounting principles generally accepted in the United States (“GAAP”) and that may be different from non- GAAP financial measures used by other companies. Priority Commerce believes that the use of these non-GAAP financial measures provides an additional tool for investors to use in evaluating ongoing operating results and trends of the Company. These non-GAAP measures should not be considered in isolation from, or as an alternative to, financial measures determined in accordance with GAAP. See the footnotes on the slides where these measures are discussed and the slides at the end of this presentation for a reconciliation of such non-GAAP financial measures to the most comparable GAAP numbers. Additionally, we present guidance for Adjusted EBITDA and Adjusted EBITDA as percentage of revenue, non-GAAP measures without reconciliation due to the inherent difficulty in forecasting and quantifying certain amounts that are necessary for such reconciliations. See more information in Priority Commerce’s earnings press release. Adjusted Gross profit referred throughout this presentation is a non-GAAP measure calculated by subtracting Cost of services (excluding depreciation and amortization) from Revenue. Adjusted Gross profit margin referred throughout this presentation is a non-GAAP measure calculated by dividing Adjusted Gross Profit discussed above by Revenue. Adjusted EBITDA referred to throughout this presentation is a non-GAAP measure calculated as net income prior to interest expense, tax expense, depreciation and amortization expense, adjusted to add back certain non-cash charges and / or non-recurring charges deemed to not be part of normal operating expenses. Adjusted EBITDA margin referred throughout this presentation is a non-GAAP measure calculated by dividing Adjusted EBITDA discussed above by Revenue. See Appendix 1 – 2 of this presentation for a reconciliation of Adjusted Gross Profit to Gross Profit as per GAAP, a reconciliation of Adj. EBITDA to GAAP Income (loss) before Taxes and Priority Commerce’s earnings press release for more details.
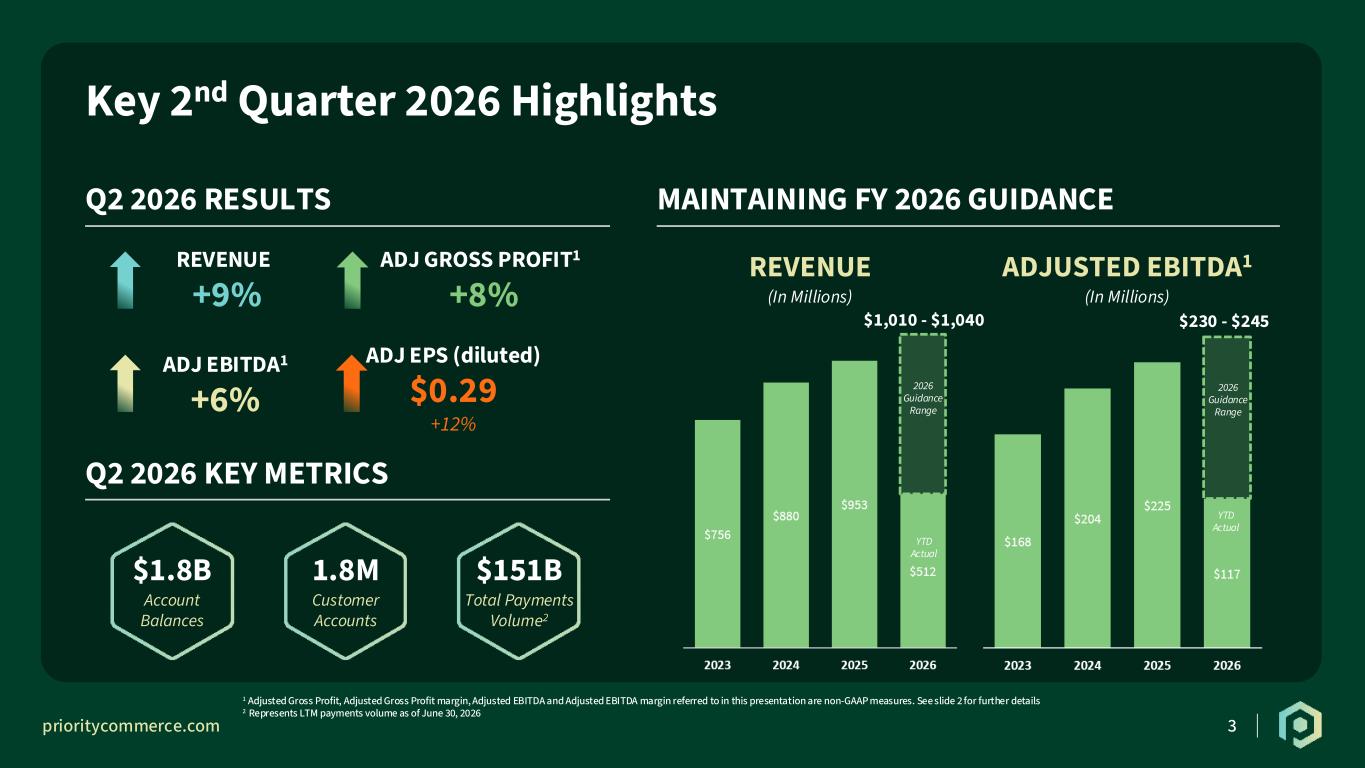
prioritycommerce.com R: 0 G: 62 B: 41 R: 1 G: 39 B: 26 R: 254 G: 109 B: 18 R: 255 G: 255 B: 255 R: 231 G: 229 B: 170 R: 166 G: 166 B: 166 R: 117 G: 209 B: 208 R: 131 G: 201 B: 126 R: 37 G: 37 B: 37 3 Key 2nd Quarter 2026 Highlights Q2 2026 RESULTS MAINTAINING FY 2026 GUIDANCE Q2 2026 KEY METRICS REVENUE +9% ADJ GROSS PROFIT1 +8% ADJ EBITDA1 +6% ADJ EPS (diluted) $0.29 $1.8B Account Balances 1.8M Customer Accounts $151B Total Payments Volume2 1 Adjusted Gross Profit, Adjusted Gross Profit margin, Adjusted EBITDA and Adjusted EBITDA margin referred to in this presentation are non-GAAP measures. See slide 2 for further details 2 Represents LTM payments volume as of June 30, 2026 +12% REVENUE (In Millions) ADJUSTED EBITDA1 (In Millions) $1,010 - $1,040 $230 - $245 2026 Guidance Range 2026 Guidance Range YTD Actual YTD Actual
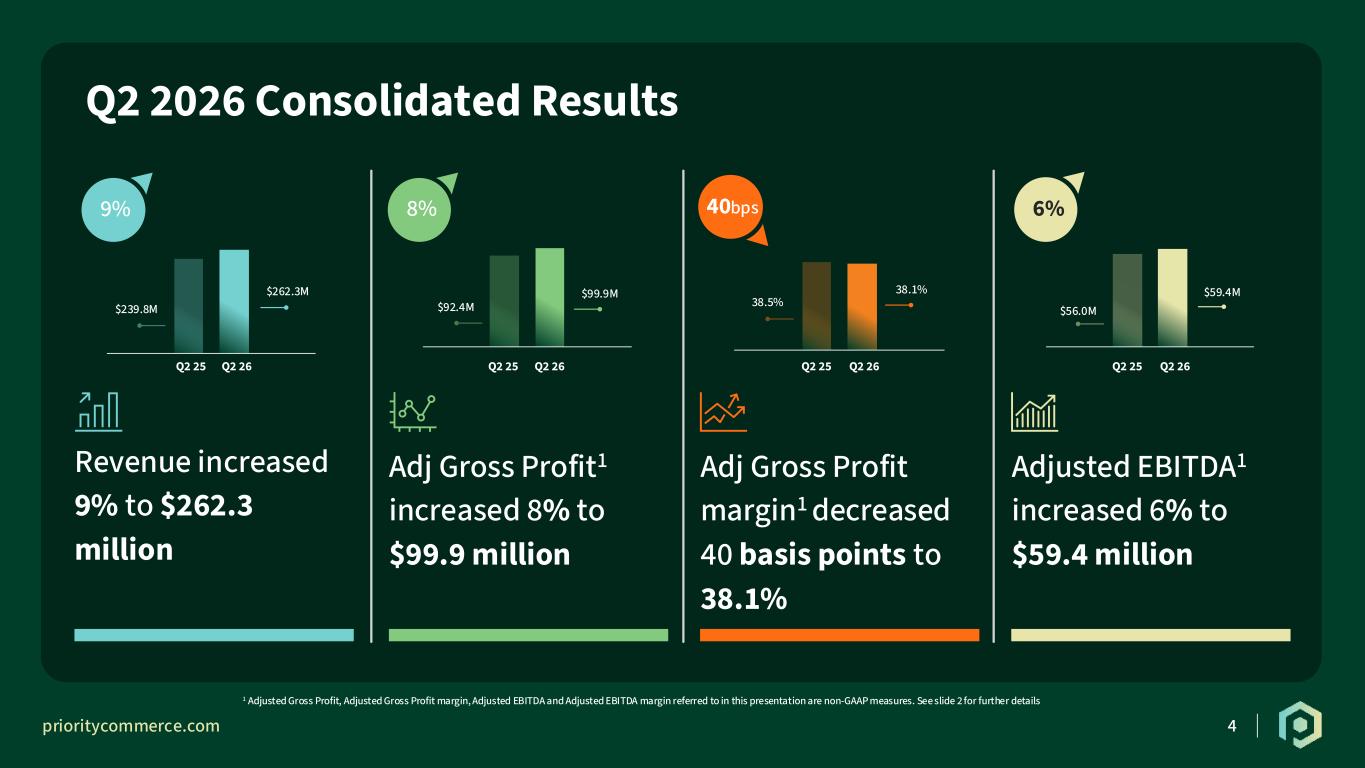
prioritycommerce.com R: 0 G: 62 B: 41 R: 1 G: 39 B: 26 R: 254 G: 109 B: 18 R: 255 G: 255 B: 255 R: 231 G: 229 B: 170 R: 166 G: 166 B: 166 R: 117 G: 209 B: 208 R: 131 G: 201 B: 126 R: 37 G: 37 B: 37 4 Q2 2026 Consolidated Results $92.4M $99.9M $56.0M $59.4M $239.8M $262.3M Q2 25 Q2 26 Q2 25 Q2 26 Q2 25 Q2 26Q2 25 Q2 26 9% 8% 6% Adjusted EBITDA1 increased 6% to $59.4 million Adj Gross Profit margin1 decreased 40 basis points to 38.1% Adj Gross Profit1 increased 8% to $99.9 million Revenue increased 9% to $262.3 million 1 Adjusted Gross Profit, Adjusted Gross Profit margin, Adjusted EBITDA and Adjusted EBITDA margin referred to in this presentation are non-GAAP measures. See slide 2 for further details 40bps 38.5% 38.1%
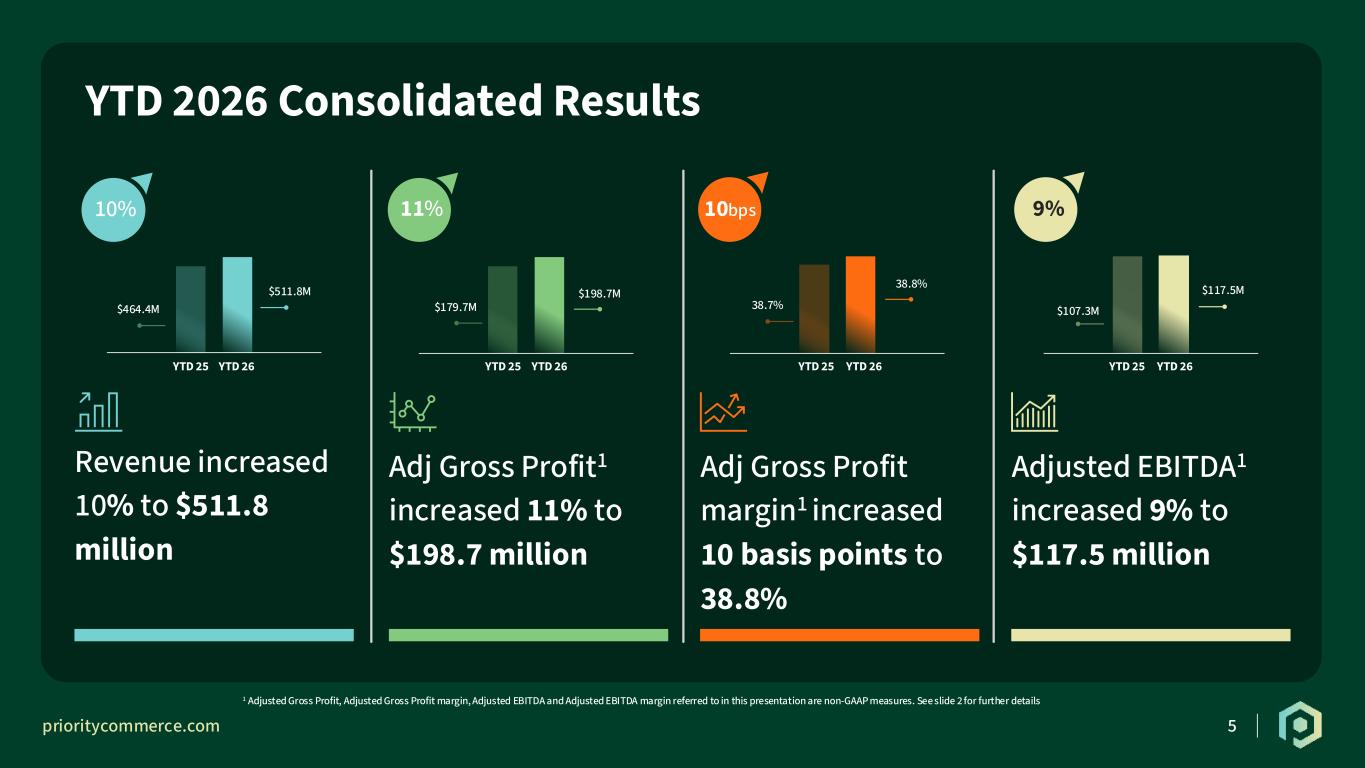
prioritycommerce.com R: 0 G: 62 B: 41 R: 1 G: 39 B: 26 R: 254 G: 109 B: 18 R: 255 G: 255 B: 255 R: 231 G: 229 B: 170 R: 166 G: 166 B: 166 R: 117 G: 209 B: 208 R: 131 G: 201 B: 126 R: 37 G: 37 B: 37 5 YTD 2026 Consolidated Results $179.7M $198.7M $107.3M $117.5M $464.4M $511.8M 10% 11% 9% Adjusted EBITDA1 increased 9% to $117.5 million Adj Gross Profit margin1 increased 10 basis points to 38.8% Adj Gross Profit1 increased 11% to $198.7 million Revenue increased 10% to $511.8 million 1 Adjusted Gross Profit, Adjusted Gross Profit margin, Adjusted EBITDA and Adjusted EBITDA margin referred to in this presentation are non-GAAP measures. See slide 2 for further details 10bps 38.7% 38.8% YTD 25 YTD 26 YTD 25 YTD 26 YTD 25 YTD 26YTD 25 YTD 26
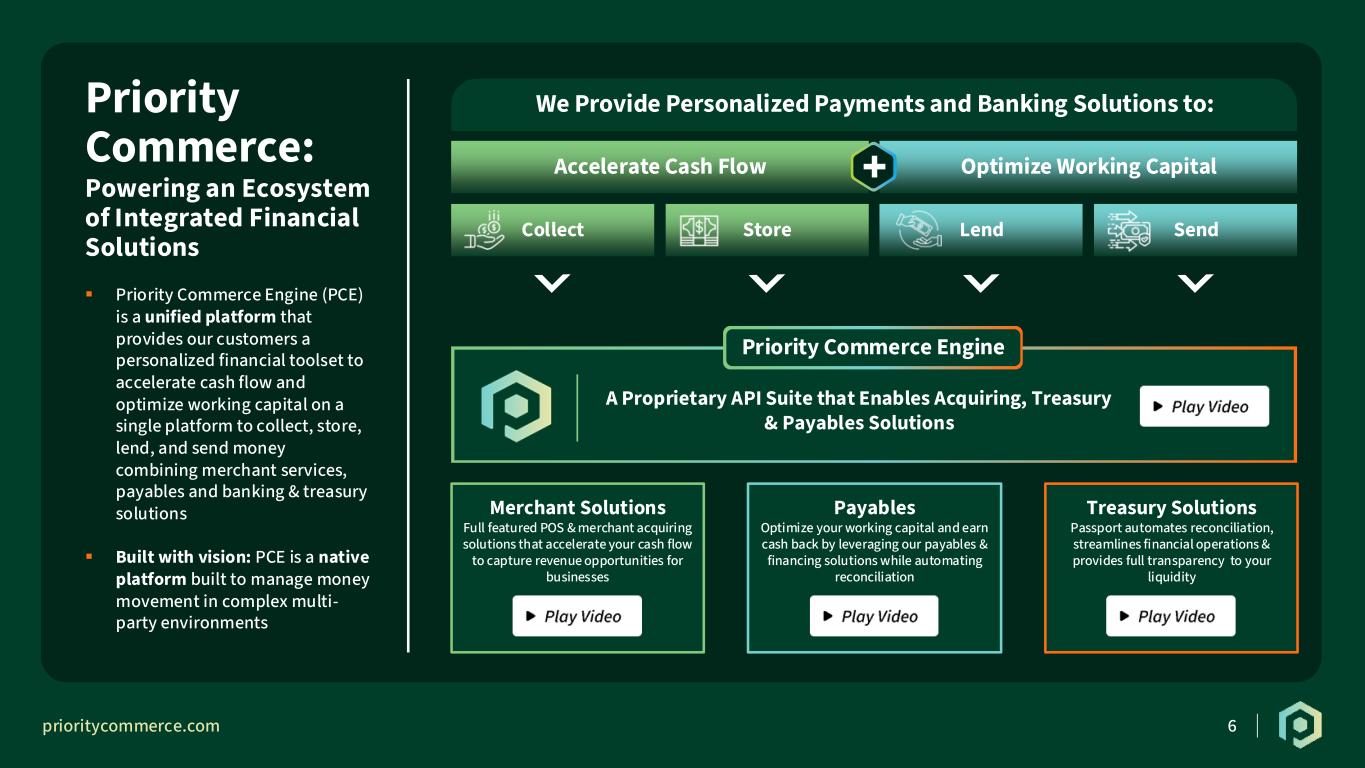
prioritycommerce.com R: 0 G: 62 B: 41 R: 1 G: 39 B: 26 R: 254 G: 109 B: 18 R: 255 G: 255 B: 255 R: 231 G: 229 B: 170 R: 166 G: 166 B: 166 R: 117 G: 209 B: 208 R: 131 G: 201 B: 126 R: 37 G: 37 B: 37 6 Accelerate Cash Flow Optimize Working Capital ▪ Priority Commerce Engine (PCE) is a unified platform that provides our customers a personalized financial toolset to accelerate cash flow and optimize working capital on a single platform to collect, store, lend, and send money combining merchant services, payables and banking & treasury solutions ▪ Built with vision: PCE is a native platform built to manage money movement in complex multi- party environments Priority Commerce: Powering an Ecosystem of Integrated Financial Solutions A Proprietary API Suite that Enables Acquiring, Treasury & Payables Solutions Treasury Solutions Passport automates reconciliation, streamlines financial operations & provides full transparency to your liquidity Merchant Solutions Full featured POS & merchant acquiring solutions that accelerate your cash flow to capture revenue opportunities for businesses Payables Optimize your working capital and earn cash back by leveraging our payables & financing solutions while automating reconciliation LendCollect Store We Provide Personalized Payments and Banking Solutions to: Send + Priority Commerce Engine
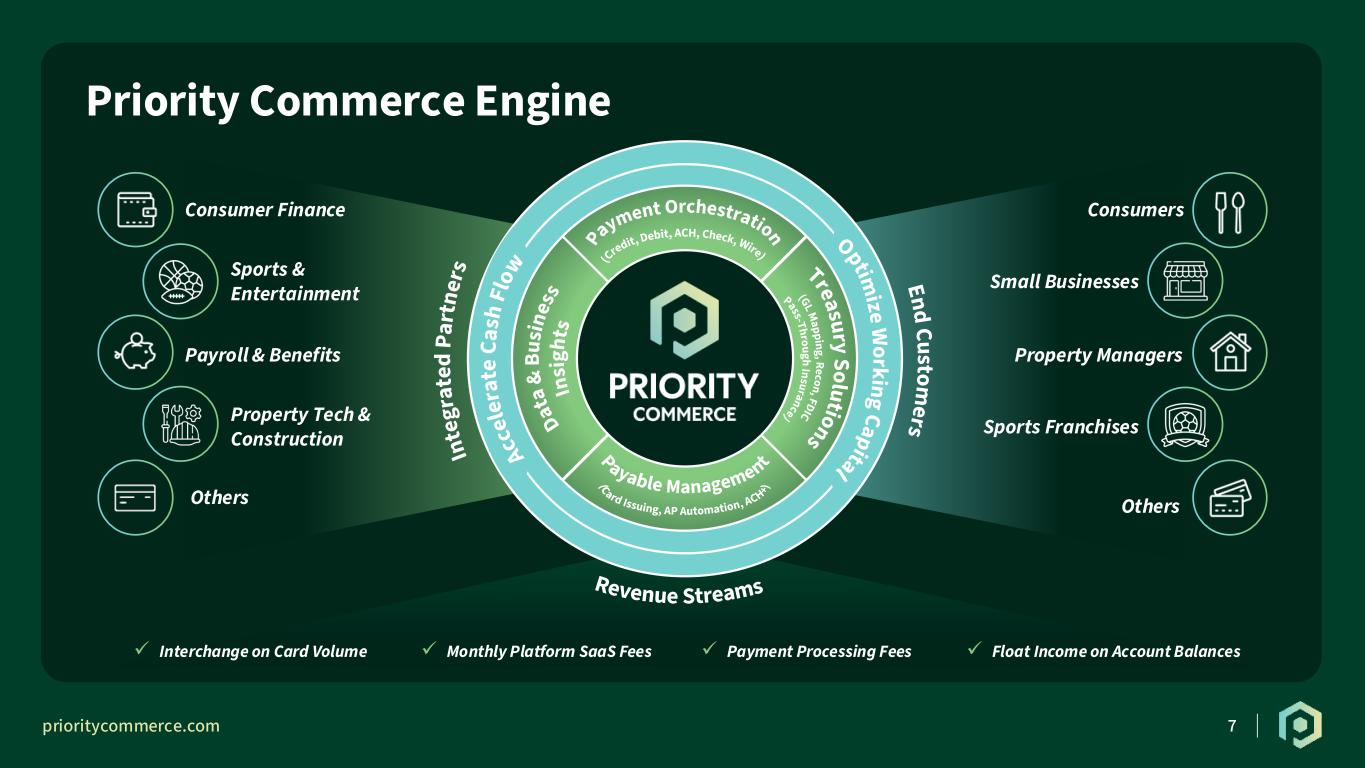
prioritycommerce.com R: 0 G: 62 B: 41 R: 1 G: 39 B: 26 R: 254 G: 109 B: 18 R: 255 G: 255 B: 255 R: 231 G: 229 B: 170 R: 166 G: 166 B: 166 R: 117 G: 209 B: 208 R: 131 G: 201 B: 126 R: 37 G: 37 B: 37 7 Priority Commerce Engine Acc el er at eC as h Fl ow Payment Orchestration Optim ize W orkingCapital TreasurySolutionsDat a& Bu sin es s In sig ht s Payable Management (Credit, Debit, ACH, Check, Wire) (GLMapping,Recon,FDIC Pass-Through Insurance) (Card Issuing, AP Automation, ACH+) In te gr at ed Pa rt ne rs Consumer Finance Sports & Entertainment Payroll & Benefits Property Tech & Construction Others Consumers Small Businesses Property Managers Others Sports Franchises ✓ Monthly Platform SaaS Fees✓ Interchange on Card Volume ✓ Payment Processing Fees ✓ Float Income on Account Balances End Custom ers Revenue Streams

prioritycommerce.com R: 0 G: 62 B: 41 R: 1 G: 39 B: 26 R: 254 G: 109 B: 18 R: 255 G: 255 B: 255 R: 231 G: 229 B: 170 R: 166 G: 166 B: 166 R: 117 G: 209 B: 208 R: 131 G: 201 B: 126 R: 37 G: 37 B: 37 8 Second Quarter 2026 Financial Results
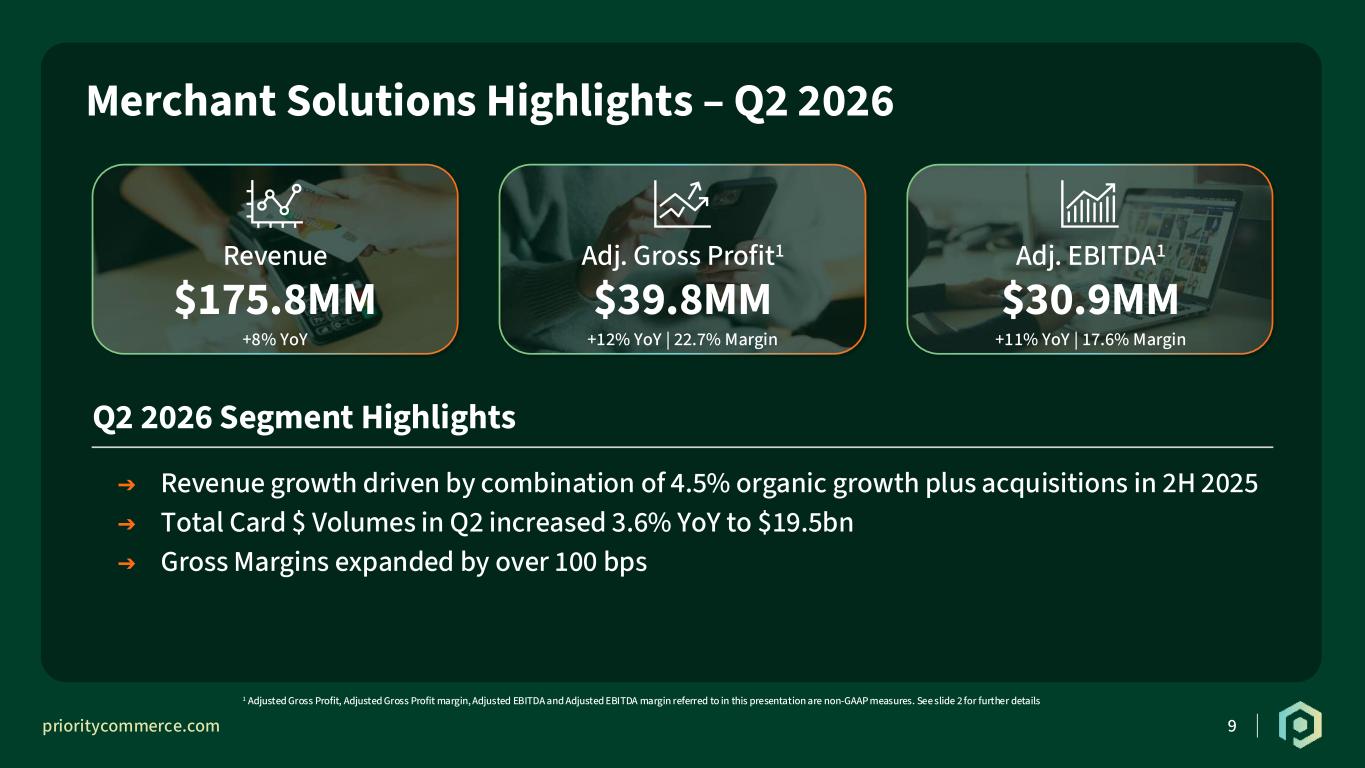
prioritycommerce.com R: 0 G: 62 B: 41 R: 1 G: 39 B: 26 R: 254 G: 109 B: 18 R: 255 G: 255 B: 255 R: 231 G: 229 B: 170 R: 166 G: 166 B: 166 R: 117 G: 209 B: 208 R: 131 G: 201 B: 126 R: 37 G: 37 B: 37 9 Merchant Solutions Highlights – Q2 2026 1 Adjusted Gross Profit, Adjusted Gross Profit margin, Adjusted EBITDA and Adjusted EBITDA margin referred to in this presentation are non-GAAP measures. See slide 2 for further details Revenue $175.8MM +8% YoY Adj. Gross Profit1 $39.8MM +12% YoY | 22.7% Margin Adj. EBITDA1 $30.9MM +11% YoY | 17.6% Margin Q2 2026 Segment Highlights ➔ Revenue growth driven by combination of 4.5% organic growth plus acquisitions in 2H 2025 ➔ Total Card $ Volumes in Q2 increased 3.6% YoY to $19.5bn ➔ Gross Margins expanded by over 100 bps
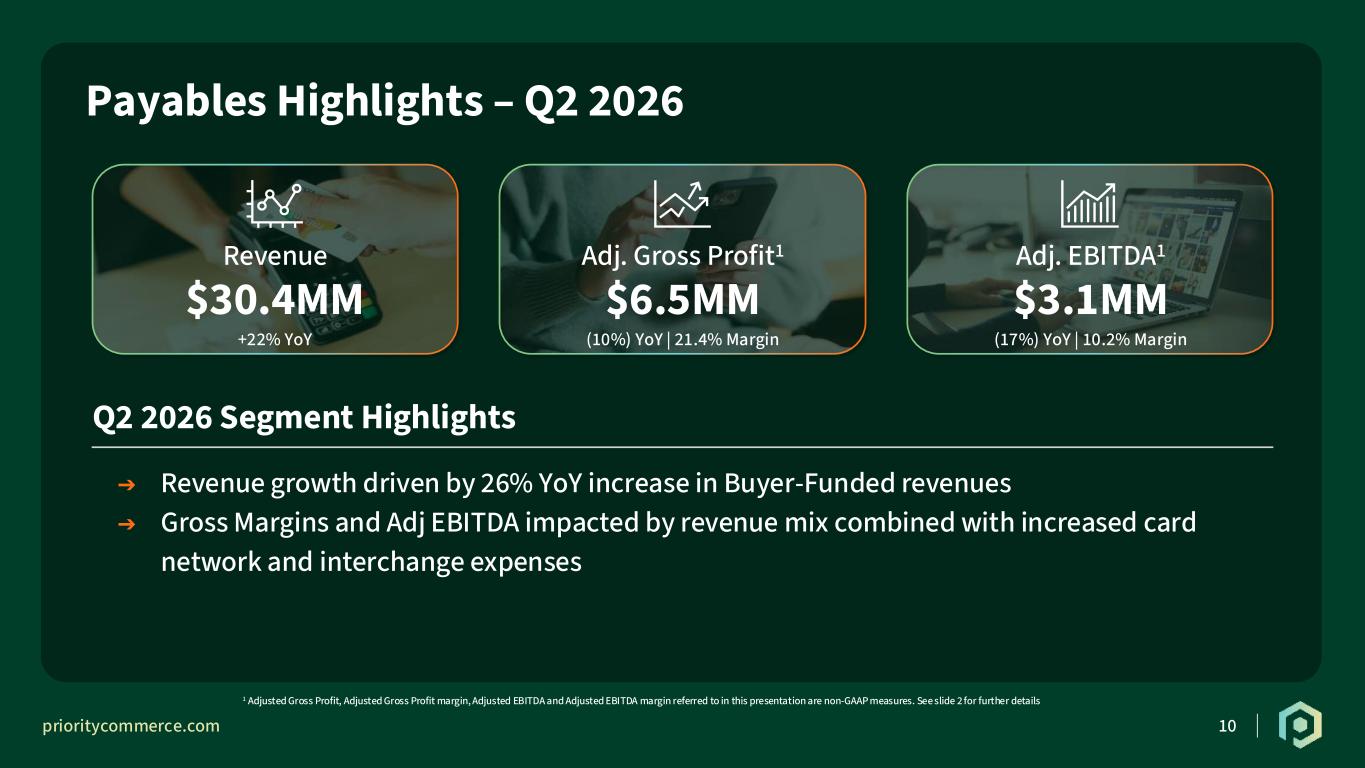
prioritycommerce.com R: 0 G: 62 B: 41 R: 1 G: 39 B: 26 R: 254 G: 109 B: 18 R: 255 G: 255 B: 255 R: 231 G: 229 B: 170 R: 166 G: 166 B: 166 R: 117 G: 209 B: 208 R: 131 G: 201 B: 126 R: 37 G: 37 B: 37 10 Payables Highlights – Q2 2026 1 Adjusted Gross Profit, Adjusted Gross Profit margin, Adjusted EBITDA and Adjusted EBITDA margin referred to in this presentation are non-GAAP measures. See slide 2 for further details Revenue $30.4MM +22% YoY Adj. Gross Profit1 $6.5MM (10%) YoY | 21.4% Margin Adj. EBITDA1 $3.1MM (17%) YoY | 10.2% Margin Q2 2026 Segment Highlights ➔ Revenue growth driven by 26% YoY increase in Buyer-Funded revenues ➔ Gross Margins and Adj EBITDA impacted by revenue mix combined with increased card network and interchange expenses
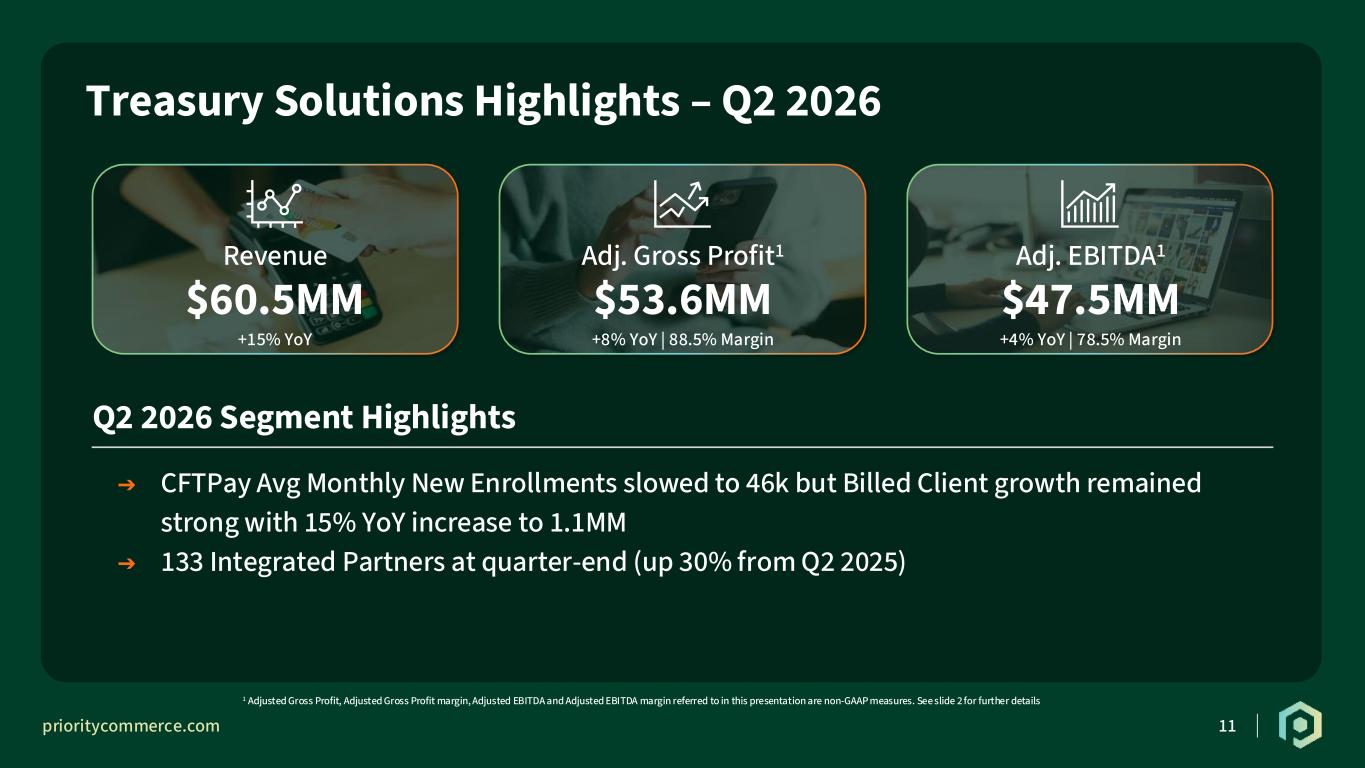
prioritycommerce.com R: 0 G: 62 B: 41 R: 1 G: 39 B: 26 R: 254 G: 109 B: 18 R: 255 G: 255 B: 255 R: 231 G: 229 B: 170 R: 166 G: 166 B: 166 R: 117 G: 209 B: 208 R: 131 G: 201 B: 126 R: 37 G: 37 B: 37 11 Treasury Solutions Highlights – Q2 2026 1 Adjusted Gross Profit, Adjusted Gross Profit margin, Adjusted EBITDA and Adjusted EBITDA margin referred to in this presentation are non-GAAP measures. See slide 2 for further details Revenue $60.5MM +15% YoY Adj. Gross Profit1 $53.6MM +8% YoY | 88.5% Margin Adj. EBITDA1 $47.5MM +4% YoY | 78.5% Margin Q2 2026 Segment Highlights ➔ CFTPay Avg Monthly New Enrollments slowed to 46k but Billed Client growth remained strong with 15% YoY increase to 1.1MM ➔ 133 Integrated Partners at quarter-end (up 30% from Q2 2025)
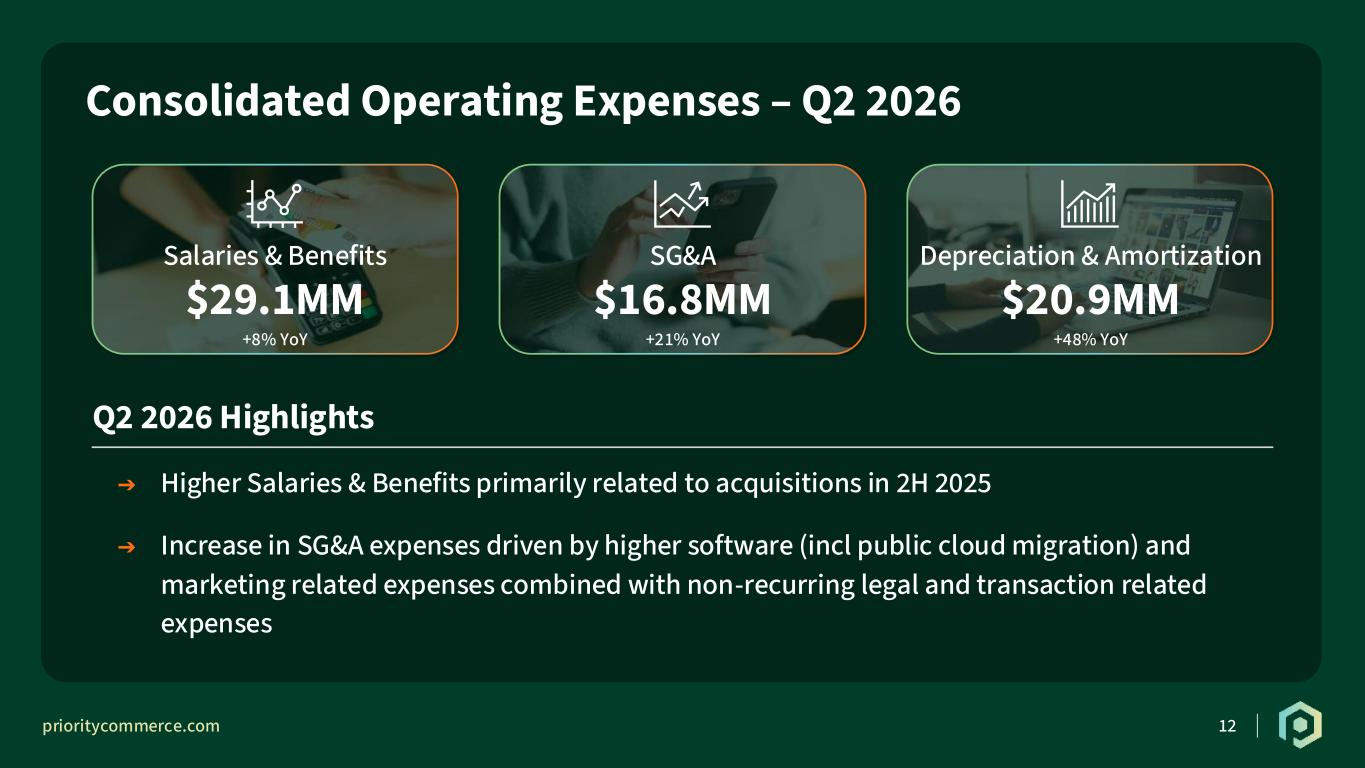
prioritycommerce.com R: 0 G: 62 B: 41 R: 1 G: 39 B: 26 R: 254 G: 109 B: 18 R: 255 G: 255 B: 255 R: 231 G: 229 B: 170 R: 166 G: 166 B: 166 R: 117 G: 209 B: 208 R: 131 G: 201 B: 126 R: 37 G: 37 B: 37 12 Consolidated Operating Expenses – Q2 2026 Salaries & Benefits $29.1MM +8% YoY SG&A $16.8MM +21% YoY Depreciation & Amortization $20.9MM +48% YoY Q2 2026 Highlights ➔ Higher Salaries & Benefits primarily related to acquisitions in 2H 2025 ➔ Increase in SG&A expenses driven by higher software (incl public cloud migration) and marketing related expenses combined with non-recurring legal and transaction related expenses
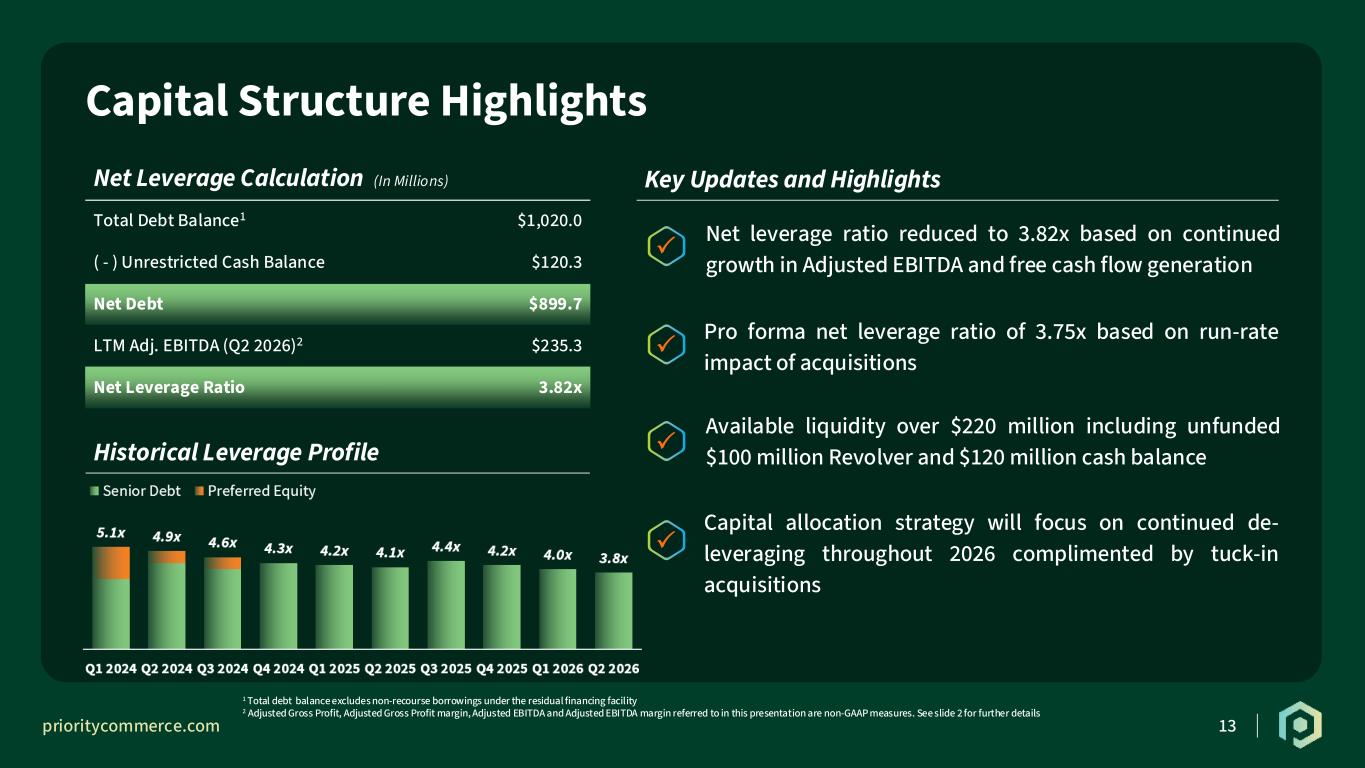
prioritycommerce.com R: 0 G: 62 B: 41 R: 1 G: 39 B: 26 R: 254 G: 109 B: 18 R: 255 G: 255 B: 255 R: 231 G: 229 B: 170 R: 166 G: 166 B: 166 R: 117 G: 209 B: 208 R: 131 G: 201 B: 126 R: 37 G: 37 B: 37 13 Capital Structure Highlights Net Leverage Calculation (In Millions) Total Debt Balance1 $1,020.0 ( - ) Unrestricted Cash Balance $120.3 Net Debt $899.7 LTM Adj. EBITDA (Q2 2026)2 $235.3 Net Leverage Ratio 3.82x 1 Total debt balance excludes non-recourse borrowings under the residual financing facility 2 Adjusted Gross Profit, Adjusted Gross Profit margin, Adjusted EBITDA and Adjusted EBITDA margin referred to in this presentation are non-GAAP measures. See slide 2 for further details Key Updates and Highlights Available liquidity over $220 million including unfunded $100 million Revolver and $120 million cash balance Pro forma net leverage ratio of 3.75x based on run-rate impact of acquisitions Capital allocation strategy will focus on continued de- leveraging throughout 2026 complimented by tuck-in acquisitions Historical Leverage Profile Net leverage ratio reduced to 3.82x based on continued growth in Adjusted EBITDA and free cash flow generation

prioritycommerce.com R: 0 G: 62 B: 41 R: 1 G: 39 B: 26 R: 254 G: 109 B: 18 R: 255 G: 255 B: 255 R: 231 G: 229 B: 170 R: 166 G: 166 B: 166 R: 117 G: 209 B: 208 R: 131 G: 201 B: 126 R: 37 G: 37 B: 37 14 Appendix
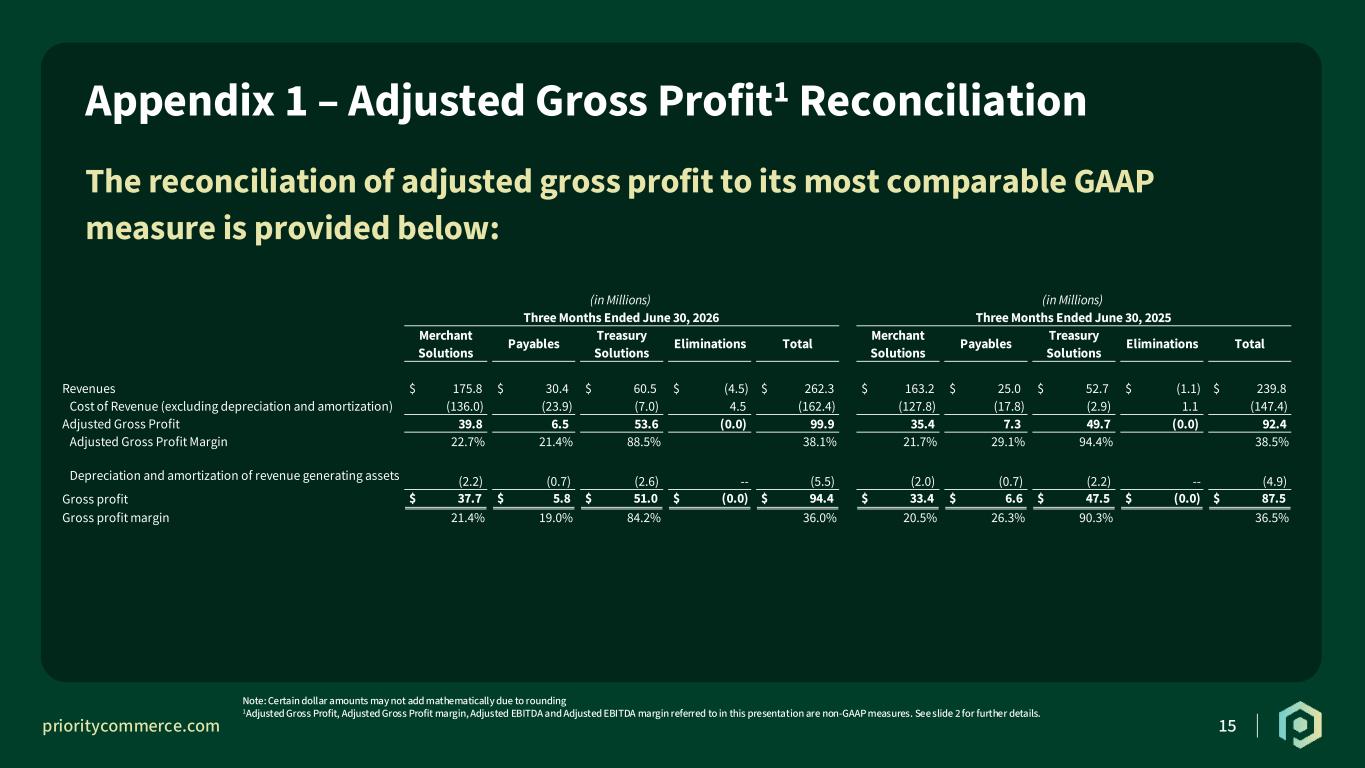
prioritycommerce.com R: 0 G: 62 B: 41 R: 1 G: 39 B: 26 R: 254 G: 109 B: 18 R: 255 G: 255 B: 255 R: 231 G: 229 B: 170 R: 166 G: 166 B: 166 R: 117 G: 209 B: 208 R: 131 G: 201 B: 126 R: 37 G: 37 B: 37 15 The reconciliation of adjusted gross profit to its most comparable GAAP measure is provided below: Appendix 1 – Adjusted Gross Profit1 Reconciliation Note: Certain dollar amounts may not add mathematically due to rounding 1Adjusted Gross Profit, Adjusted Gross Profit margin, Adjusted EBITDA and Adjusted EBITDA margin referred to in this presentation are non-GAAP measures. See slide 2 for further details. Merchant Solutions Payables Treasury Solutions Eliminations Total Merchant Solutions Payables Treasury Solutions Eliminations Total Revenues $ 175.8 $ 30.4 $ 60.5 $ (4.5) $ 262.3 $ 163.2 $ 25.0 $ 52.7 $ (1.1) $ 239.8 Cost of Revenue (excluding depreciation and amortization) (136.0) (23.9) (7.0) 4.5 (162.4) (127.8) (17.8) (2.9) 1.1 (147.4) Adjusted Gross Profit 39.8 6.5 53.6 (0.0) 99.9 35.4 7.3 49.7 (0.0) 92.4 Adjusted Gross Profit Margin 22.7% 21.4% 88.5% 38.1% 21.7% 29.1% 94.4% 38.5% Depreciation and amortization of revenue generating assets (2.2) (0.7) (2.6) -- (5.5) (2.0) (0.7) (2.2) -- (4.9) Gross profit $ 37.7 $ 5.8 $ 51.0 $ (0.0) $ 94.4 $ 33.4 $ 6.6 $ 47.5 $ (0.0) $ 87.5 Gross profit margin 21.4% 19.0% 84.2% 36.0% 20.5% 26.3% 90.3% 36.5% (in Millions) (in Millions) Three Months Ended June 30, 2026 Three Months Ended June 30, 2025
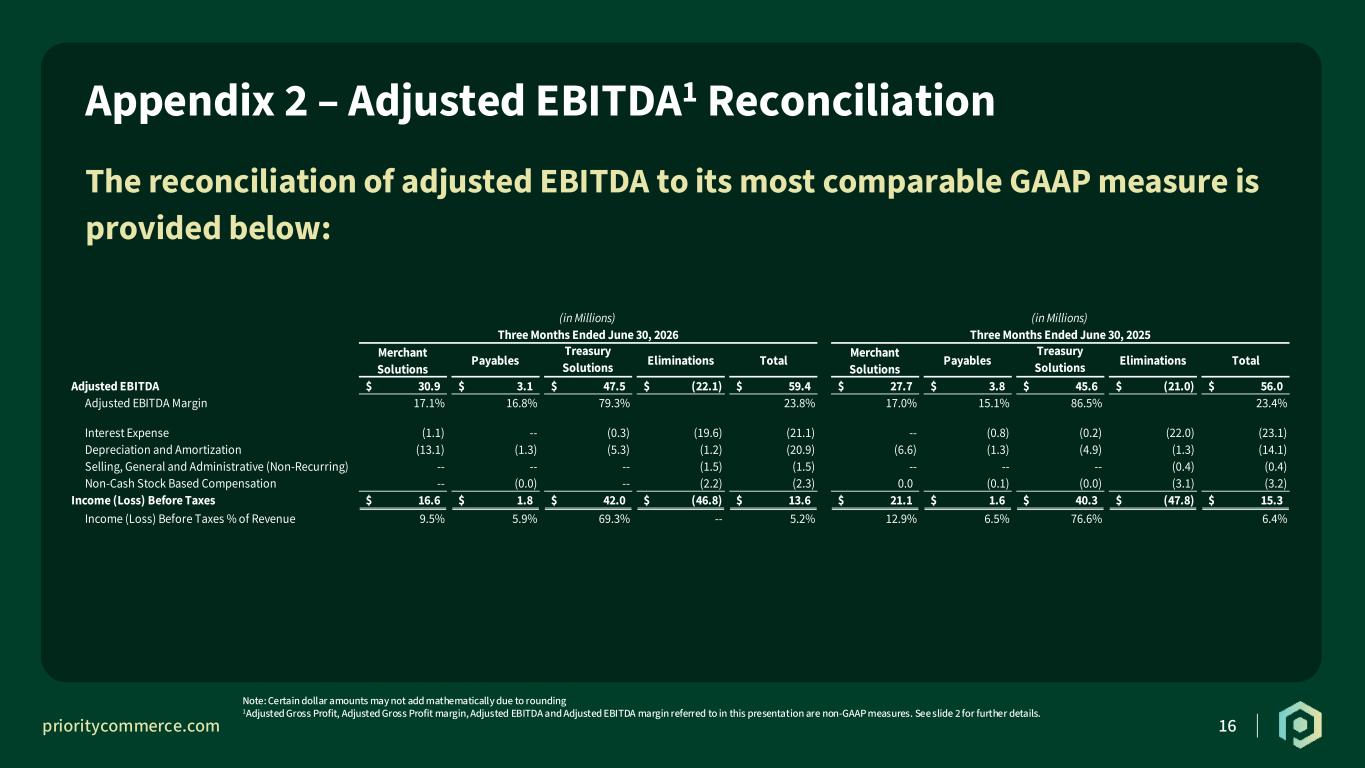
prioritycommerce.com R: 0 G: 62 B: 41 R: 1 G: 39 B: 26 R: 254 G: 109 B: 18 R: 255 G: 255 B: 255 R: 231 G: 229 B: 170 R: 166 G: 166 B: 166 R: 117 G: 209 B: 208 R: 131 G: 201 B: 126 R: 37 G: 37 B: 37 16 The reconciliation of adjusted EBITDA to its most comparable GAAP measure is provided below: Appendix 2 – Adjusted EBITDA1 Reconciliation Note: Certain dollar amounts may not add mathematically due to rounding 1Adjusted Gross Profit, Adjusted Gross Profit margin, Adjusted EBITDA and Adjusted EBITDA margin referred to in this presentation are non-GAAP measures. See slide 2 for further details. (in Millions) (in Millions) Three Months Ended June 30, 2026 Three Months Ended June 30, 2025 Merchant Solutions Payables Treasury Solutions Eliminations Total Merchant Solutions Payables Treasury Solutions Eliminations Total Adjusted EBITDA 30.9$ 3.1$ 47.5$ (22.1)$ 59.4$ 27.7$ 3.8$ 45.6$ (21.0)$ 56.0$ Adjusted EBITDA Margin 17.1% 16.8% 79.3% 23.8% 17.0% 15.1% 86.5% 23.4% Interest Expense (1.1) -- (0.3) (19.6) (21.1) -- (0.8) (0.2) (22.0) (23.1) Depreciation and Amortization (13.1) (1.3) (5.3) (1.2) (20.9) (6.6) (1.3) (4.9) (1.3) (14.1) Selling, General and Administrative (Non-Recurring) -- -- -- (1.5) (1.5) -- -- -- (0.4) (0.4) Non-Cash Stock Based Compensation -- (0.0) -- (2.2) (2.3) 0.0 (0.1) (0.0) (3.1) (3.2) Income (Loss) Before Taxes 16.6$ 1.8$ 42.0$ (46.8)$ 13.6$ 21.1$ 1.6$ 40.3$ (47.8)$ 15.3$ Income (Loss) Before Taxes % of Revenue 9.5% 5.9% 69.3% -- 5.2% 12.9% 6.5% 76.6% 6.4%
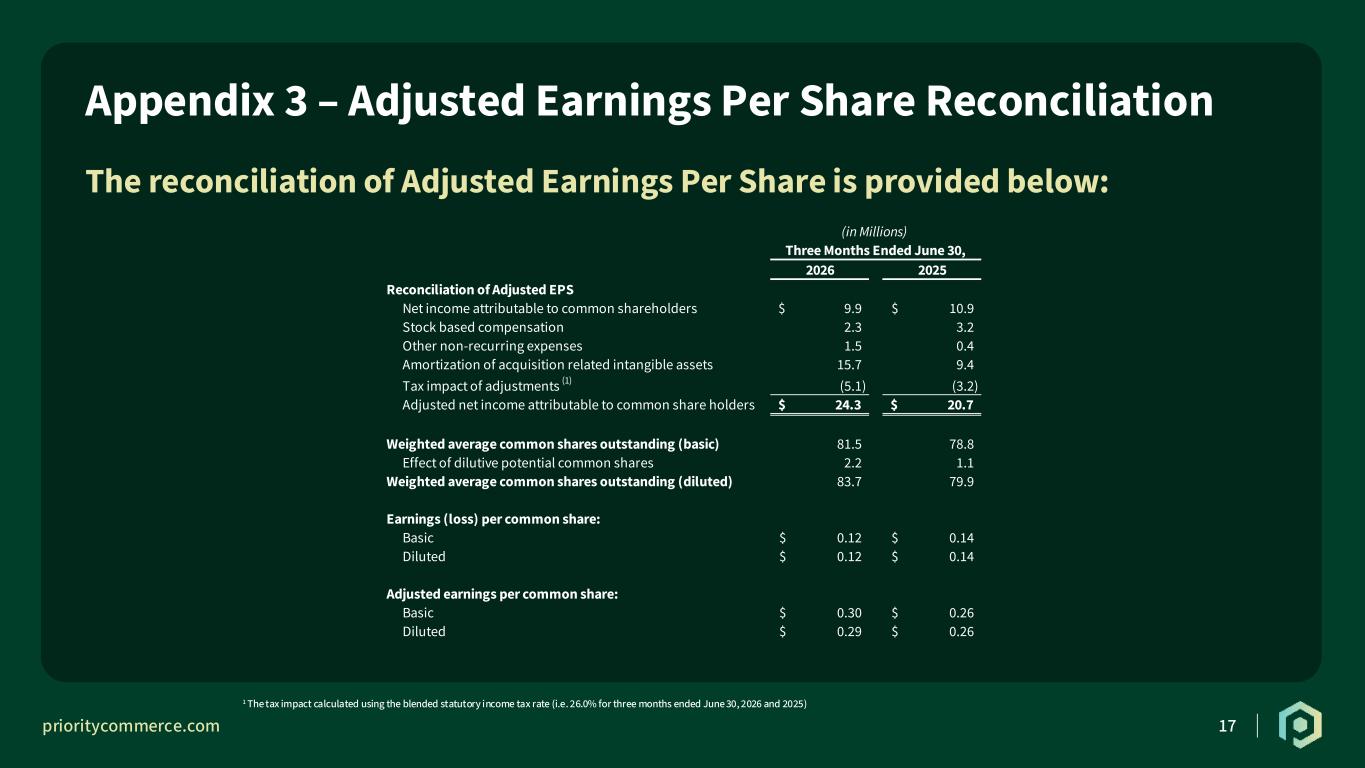
prioritycommerce.com R: 0 G: 62 B: 41 R: 1 G: 39 B: 26 R: 254 G: 109 B: 18 R: 255 G: 255 B: 255 R: 231 G: 229 B: 170 R: 166 G: 166 B: 166 R: 117 G: 209 B: 208 R: 131 G: 201 B: 126 R: 37 G: 37 B: 37 17 The reconciliation of Adjusted Earnings Per Share is provided below: Appendix 3 – Adjusted Earnings Per Share Reconciliation 1 The tax impact calculated using the blended statutory income tax rate (i.e. 26.0% for three months ended June 30, 2026 and 2025) (in Millions) Three Months Ended June 30, 2026 2025 Reconciliation of Adjusted EPS Net income attributable to common shareholders 9.9$ 10.9$ Stock based compensation 2.3 3.2 Other non-recurring expenses 1.5 0.4 Amortization of acquisition related intangible assets 15.7 9.4 Tax impact of adjustments (1) (5.1) (3.2) Adjusted net income attributable to common share holders 24.3$ 20.7$ Weighted average common shares outstanding (basic) 81.5 78.8 Effect of dilutive potential common shares 2.2 1.1 Weighted average common shares outstanding (diluted) 83.7 79.9 Earnings (loss) per common share: Basic 0.12$ 0.14$ Diluted 0.12$ 0.14$ Adjusted earnings per common share: Basic 0.30$ 0.26$ Diluted 0.29$ 0.26$