Shareholder Report
May 31, 2026
USD ($)
$ / shares
This report describes changes to the Fund that occurred during the reporting period.
WHAT WERE THE FUND COSTS FOR THE PAST YEAR? (based on a hypothetical $10,000 investment)
|
Fund Name
|
Costs of a $10,000 investment
|
Costs paid as a percentage of a $10,000 investment
|
|
FIS Bright Portfolios Focused Equity ETF
|
$78
|
0.65%
|
HOW DID THE FUND PERFORM LAST YEAR AND WHAT AFFECTED ITS PERFORMANCE?
From June 1, 2025 through May 31, 2026 (the “Period”), the Fund delivered a strong total return, outperforming the MSCI USA Net Total Return USD Index.
U.S. equities advanced during the period, with the S&P 500 returning approximately +11% as the artificial intelligence (“AI”) infrastructure buildout broadened beyond mega-cap chip designers into the companies supplying the buildout: servers, memory, networking, and power. The Bright Earnings LifeCycle model played a significant role in the Fund’s outperformance of the broader market. The defining market dynamic of the period was that AI data center demand drove consensus earnings estimates sharply higher across the compute supply chain before share prices had fully repriced, and the Bright Earnings LifeCycle model is built to identify such opportunities, concentrating the Fund in companies where earnings expectations are accelerating while valuations still lag. The Fund’s three largest contributors, Dell Technologies, Inc. (“Dell”), Micron Technology, Inc. (“Micron”), and Advanced Micro Devices, Inc. (“AMD”), each fit this profile entering the year: Dell with surging AI server orders, Micron with high-bandwidth memory demand driving an industry upcycle from trough pricing, and AMD with accelerating data center revenue. Detractors were modest, with Moody’s Corp., S&P Global, Inc., and NRG Energy, Inc., each detracting slightly from performance. All holdings were first screened through Bright Portfolios, LLC’s Common Good Process, which excludes businesses inconsistent with the Fund’s values criteria and evaluates stakeholder treatment, business quality, valuation, and the direction of earnings expectations before any position is established.
|
Top Contributors
|
|
|
↑
|
Dell Technologies, Inc.
|
|
↑
|
Micron Technology, Inc.
|
|
↑
|
Advanced Micro Devices, Inc.
|
|
Top Detractors
|
|
|
↓
|
Moody’s Corp.
|
|
↓
|
S&P Global, Inc.
|
|
↓
|
NRG Energy, Inc.
|
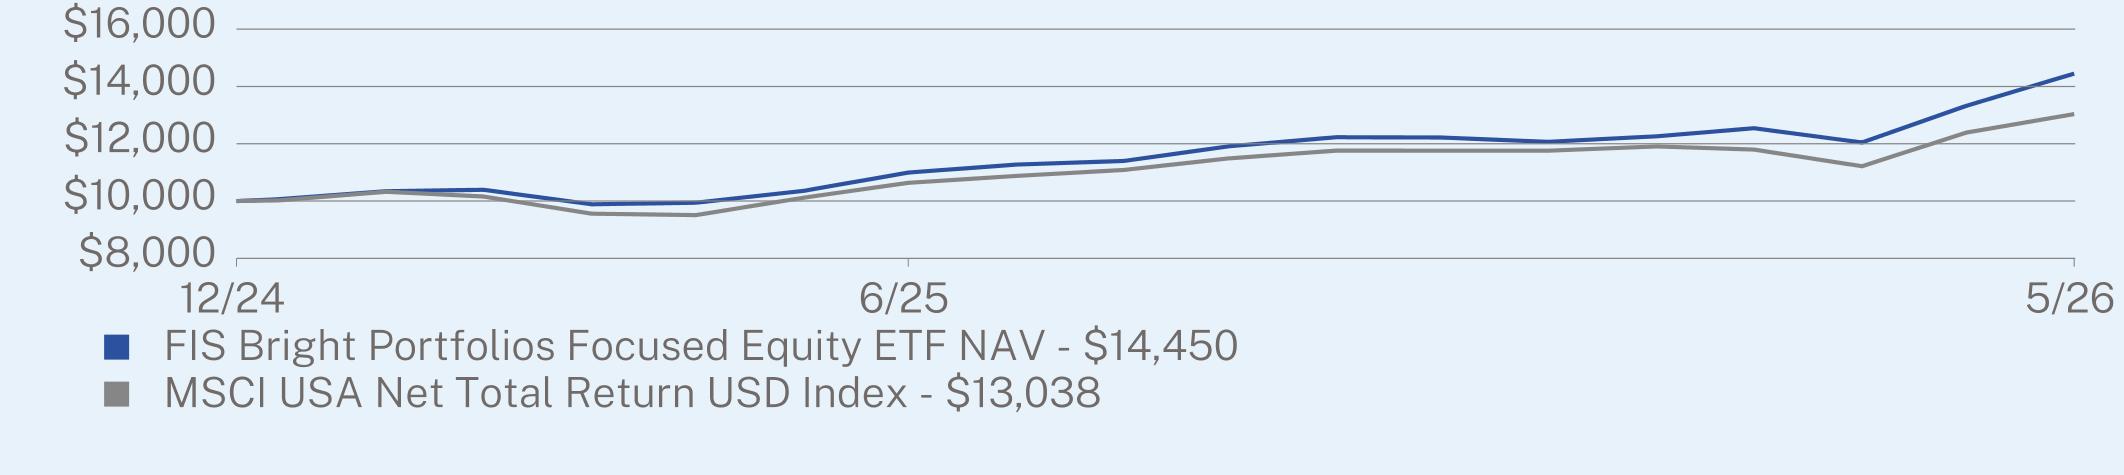
ANNUAL AVERAGE TOTAL RETURN (%)
|
|
1 Year
|
Since Inception
(12/20/2024) |
|
FIS Bright Portfolios Focused Equity ETF NAV
|
39.53
|
28.98
|
|
MSCI USA Net Total Return USD Index
|
28.86
|
20.13
|
Visit https://faithinvestorservices.com/etfs/brif/ for more recent performance information.
Visit https://faithinvestorservices.com/etfs/brif/ for more recent performance information.
KEY FUND STATISTICS (as of May 31, 2026)
|
Net Assets
|
$147,445,755
|
|
Number of Holdings
|
48
|
|
Net Advisory Fee
|
$684,059
|
|
Portfolio Turnover
|
45%
|
|
30-Day SEC Yield
|
0.36%
|
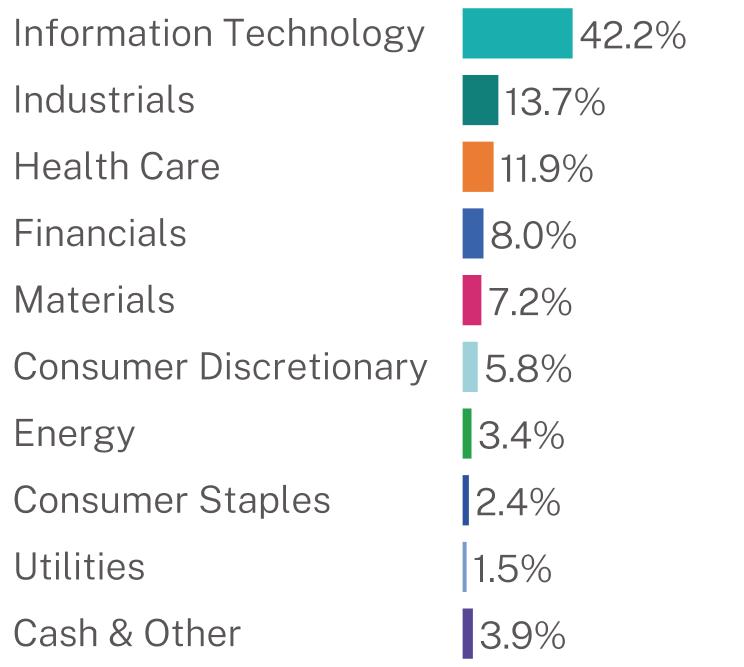
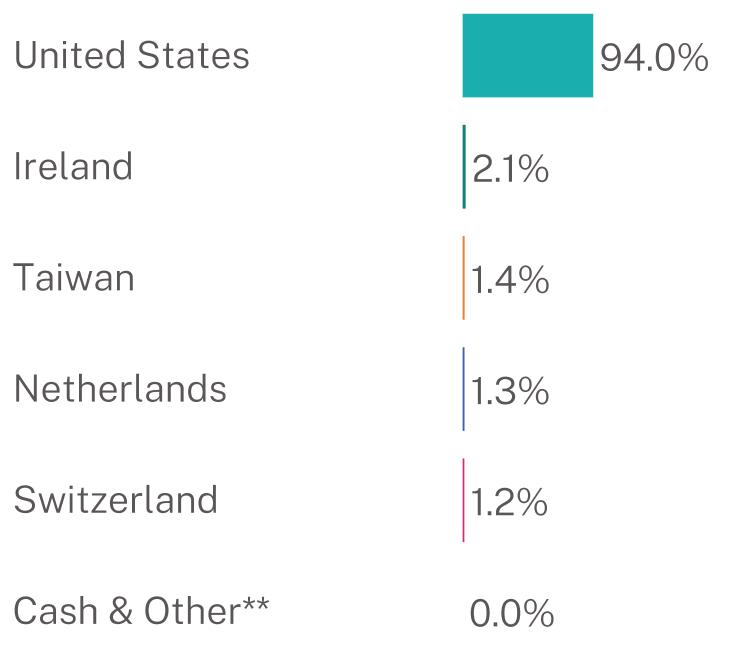
WHAT DID THE FUND INVEST IN? (% of net assets as of May 31, 2026)
Sector Breakdown*
|
Top 10 Issuers
|
|
|
NVIDIA Corp.
|
7.9%
|
|
Broadcom, Inc.
|
6.2%
|
|
Dell Technologies, Inc.
|
4.9%
|
|
Eli Lilly & Co.
|
4.7%
|
|
Palo Alto Networks, Inc.
|
4.2%
|
|
First American Treasury Obligations Fund
|
3.9%
|
|
Arista Networks, Inc.
|
3.8%
|
|
Cummins, Inc.
|
3.2%
|
|
Cisco Systems, Inc.
|
3.1%
|
|
Linde PLC
|
2.9%
|
Geographic Breakdown
MATERIAL FUND CHANGES
Changes to Fund’s Organization:
Mark Riefer served as a portfolio manager of the Fund at its launch. Effective November 1, 2025, Mr. Riefer transitioned to a consulting role with the Sub-Adviser while he completes the wind-down of his prior book of business, during which time he is not permitted to serve in an employed portfolio manager capacity. His day-to-day responsibilities with respect to research for the Fund have not changed as a result of this transition. Mr. Riefer is expected to resume a full-time portfolio manager role with Bright Portfolios, LLC in 2027.
Changes to the Fund’s Fiscal Year:
At a meeting held on February 18, 2026, the Board approved a change in the Fund’s fiscal year end from May 31 to June 30. As of June 1, 2026, the Fund changed its financial reporting and tax reporting fiscal year end to a June 30 fiscal year end from a May 31 fiscal year end.
Other Material Fund Changes:
During the period, shareholders approved the Fund moving from NEOS ETF Trust to the FIS Trust. The Fund, Adviser, Sub-Adviser and Trading Sub-Adviser are now overseen by a faith-based Board of Trustees.
This report describes changes to the Fund that occurred during the reporting period.
WHAT WERE THE FUND COSTS FOR THE PAST YEAR? (based on a hypothetical $10,000 investment)
|
Fund Name
|
Costs of a $10,000 investment
|
Costs paid as a percentage of a $10,000 investment
|
|
FIS Christian Stock Fund
|
$75
|
0.68%
|
HOW DID THE FUND PERFORM LAST YEAR AND WHAT AFFECTED ITS PERFORMANCE?
For the fiscal year ended May 31, 2026, the Fund generated strong absolute performance returning 20.71% over the 12 month period. However, this performance was below the MSCI World Index Net (USD) return of 27.49% and the MSCI ACWI Net Total Return Index (USD) of 30.27%.
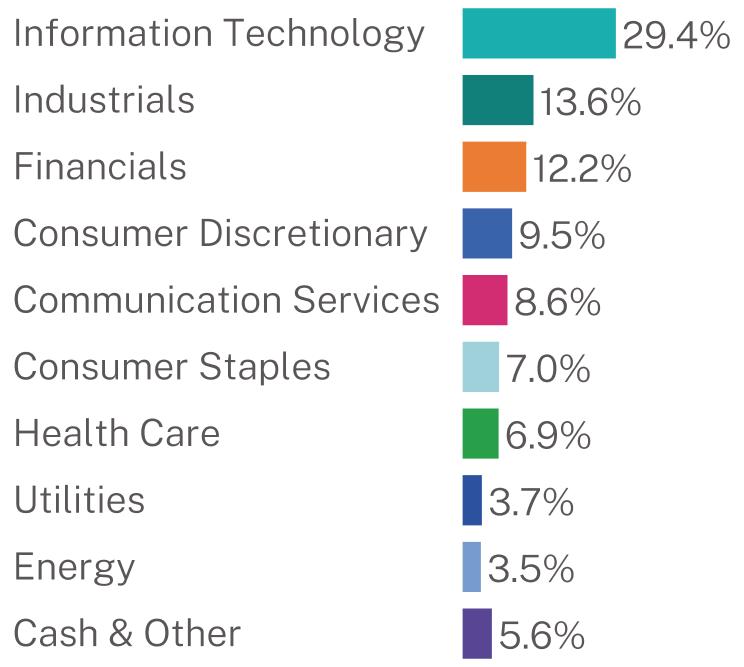
Against both benchmarks, security selection played a larger role than sector allocation. Relative to MSCI ACWI Net Total Return Index (USD), the sectors with the largest positive contribution were consumer staples, industrials and energy. The three sectors with the largest negative contribution were information technology, health care, and consumer discretionary.
Samsung Electronics Co. Ltd. (“Samsung”) was the largest contributor to returns over the past year. Samsung is one of the largest semiconductor companies in the world and has been driving shareholder value as the only global semiconductor company that has industry leadership positions in both memory chips and foundry services as compared to other semiconductor design companies. Comfort Systems USA, Inc. was the second largest contributor to returns with growth in business of supplying HVAC systems to a range of commercial customers including data centers. NVIDIA Corp. performed strongly on the back of demand for a type of semiconductor GPUs, (graphics processing units), used in applications like artificial intelligence, scientific computing, and gaming. Rounding out our top performers, Taiwan Semiconductor Manufacturing Co. Ltd. drove strong profitability as the world’s largest semiconductor foundry and Casey’s General Stores, Inc., a leading chain store operator providing food, gas, and everyday goods to customers in rural markets across the South and Midwestern U.S. also drove profitability.
ServiceNow, Inc. led underperformance; while some of this was related to concerns about potential threats from artificial intelligence software, a larger investor concern stemmed from growing actual competition with other large enterprise application vendors. Check Point Software Technologies Ltd. performed poorly in competition with other network-oriented security companies which led to lowered earnings expectations. Trade Desk, Inc. experienced a slowdown year over year revenue growth amid intensifying dynamics in digital ad spending. Intuitive Surgical, Inc. saw a slight slowdown in growth from high teens to low teens given some margin compression. Animal health leader Zoetis, Inc., was impacted by lowered earnings expectations driven by a decline in core U.S. animal product sales.
|
Top Contributors
|
|
|
↑
|
Samsung Electronics Co. Ltd.
|
|
↑
|
Comfort Systems USA, Inc.
|
|
↑
|
NVIDIA Corp.
|
|
↑
|
Taiwan Semiconductor Manufacturing Co. Ltd.
|
|
↑
|
Casey’s General Stores, Inc.
|
|
Top Detractors
|
|
|
↓
|
ServiceNow, Inc.
|
|
↓
|
Check Point Software Technologies Ltd.
|
|
↓
|
Trade Desk, Inc.
|
|
↓
|
Intuitive Surgical, Inc.
|
|
↓
|
Zoetis, Inc.
|
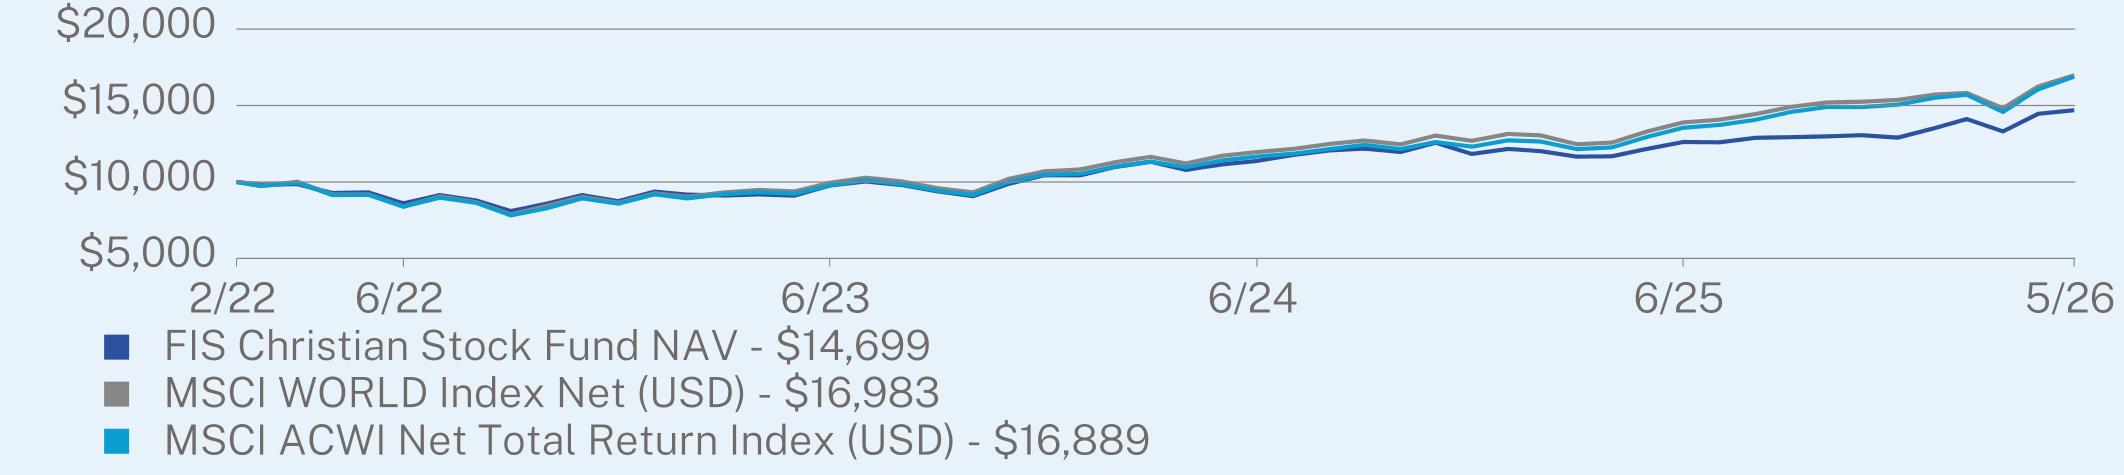
ANNUAL AVERAGE TOTAL RETURN (%)
|
|
1 Year
|
Since Inception
(02/08/2022) |
|
FIS Christian Stock Fund NAV
|
20.71
|
9.35
|
|
MSCI WORLD Index Net (USD)
|
27.49
|
13.08
|
|
MSCI ACWI Net Total Return Index (USD)
|
30.27
|
12.93
|
Visit https://faithinvestorservices.com/pray/ for more recent performance information.
Visit https://faithinvestorservices.com/pray/ for more recent performance information.
KEY FUND STATISTICS (as of May 31, 2026)
|
Net Assets
|
$80,966,300
|
|
Number of Holdings
|
68
|
|
Net Advisory Fee
|
$504,432
|
|
Portfolio Turnover
|
24%
|
|
30-Day SEC Yield
|
0.48%
|
WHAT DID THE FUND INVEST IN? (% of net assets as of May 31, 2026)
Sector Breakdown*
|
Top 10 Issuers
|
|
|
Samsung Electronics Co. Ltd.
|
7.2%
|
|
NVIDIA Corp.
|
6.4%
|
|
Casey’s General Stores, Inc.
|
4.3%
|
|
Taiwan Semiconductor Manufacturing Co. Ltd.
|
3.7%
|
|
Alphabet, Inc.
|
3.5%
|
|
Broadcom, Inc.
|
3.4%
|
|
Comfort Systems USA, Inc.
|
3.3%
|
|
Interactive Brokers Group, Inc.
|
3.2%
|
|
Prosus NV
|
2.4%
|
|
Microsoft Corp.
|
2.2%
|
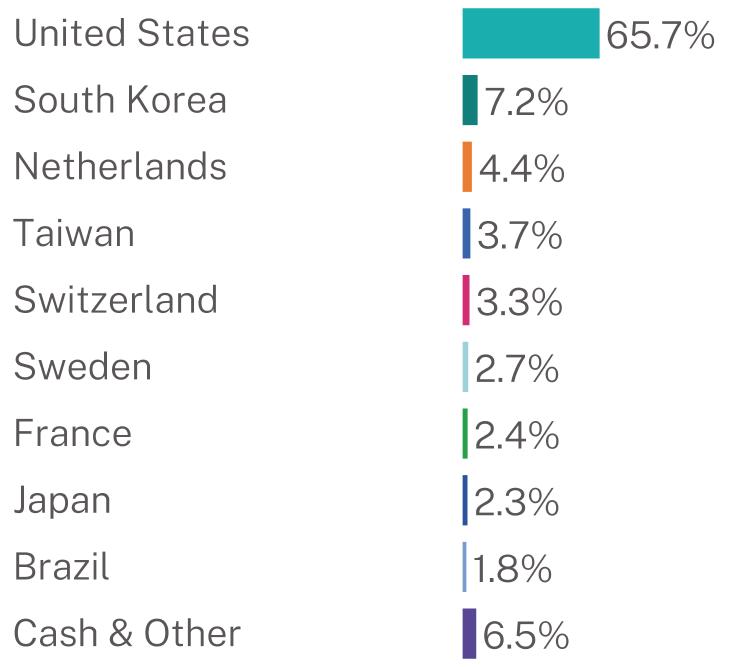
Geographic Breakdown
MATERIAL FUND CHANGES
Changes to Fund’s Investment Adviser:
Effective January 1, 2026 Capital Insight Partners discontinued serving as the Fund’s Sub-Adviser. The Adviser, Faith Investor Services, LLC, assumed portfolio management responsibility for the Fund.
Changes to Fund’s Organization:
John Rowley, CFA joined Steve T. Nelson, CFA as a portfolio manager of the Fund on January 1, 2026. Sara LaClair, CFA and Craig McCrory, CFA ended their portfolio management effective the same day.
Changes to the Fund’s Fiscal Year:
At a meeting held on February 18, 2026, the Board approved a change in the Fund’s fiscal year end from May 31 to June 30. As of June 1, 2026, the Fund changed its financial reporting and tax reporting fiscal year end to a June 30 fiscal year end from a May 31 fiscal year end.
Other Material Fund Changes:
During the period, shareholders approved the Fund moving from NEOS ETF Trust to the FIS Trust. The Fund, Adviser, Sub-Adviser, and Trading Sub-Adviser are now overseen by a faith-based Board of Trustees.
| [1] |
|
||
| [2] |
|
||
| [3] |
|