
Second Quarter 2026 Earnings Conference Call 8/6/2026 Teleflex Incorporated Exhibit 99.2

The release, accompanying slides, and replay webcast are available online at www.teleflex.com (click on Investors) An audio replay of the call will be available beginning at 11:00 am Eastern Time on August 6, 2026 either on the Teleflex website or by telephone. The call can be accessed by dialing 1 800 770 2030 (U.S.) or 1 609 800 9909 (all other locations). The confirmation code is 69028. Conference Call Logistics

Today’s Speakers TELEFLEX EARNINGS CONFERENCE CALL 8/6/2026 Lawrence Keusch VP, Investor Relations and Strategy Development Jason Weidman President and CEO John Deren Executive VP and CFO
TELEFLEX EARNINGS CONFERENCE CALL 8/6/20264 Additional Notes This document contains certain highlights with respect to our second quarter 2026 results and developments and does not purport to be a complete summary thereof. Accordingly, we encourage you to read our Earnings Release for the quarter ended June 30, 2026 located in the investor section of our website at www.teleflex.com and our Quarterly Report on Form 10-Q for the quarter ended June 30, 2026 to be filed with the Securities and Exchange Commission. Unless otherwise noted, the following slides reflect continuing operations. This presentation contains forward-looking statements, including, but not limited to, our forecasted 2026: GAAP, pro forma adjusted revenue and pro forma adjusted constant currency revenue growth, GAAP and adjusted operating margin and GAAP and adjusted earnings per share and, in each case, our estimates with respect to the items expected to impact those forecasted results; statements regarding our planned uses of the net proceeds from the closing of the sale of our OEM business (the “OEM Strategic Divestiture”), including, without limitation, with respect to the paydown of debt and the repurchase of shares our outstanding common stock; our plans to commence an accelerated share repurchase; statements regarding our expectations with respect to the timing for closing of the sales of our Acute Care and Interventional Urology businesses (which, together with the OEM Strategic Divestiture, we refer to as the “Strategic Divestitures”); statements regarding projected costs, savings and timing with respect to restructuring activities related to the Strategic Divestitures; our expectation that the transition services and manufacturing services agreements to be entered into in connection with the Strategic Divestitures will offset stranded costs on an annualized basis; our expectation that our financial portfolio will be meaningfully stronger starting in 2027; statements regarding our BIOMAG-II and BIOMAG-III pivotal trials; and other matters which inherently involve risks and uncertainties which could cause actual results to differ from those projected or implied in the forward–looking statements. Any forward-looking statements contained herein are based on our management’s current beliefs and expectations, but are subject to a number of risks, uncertainties and changes in circumstances, which may cause actual results or company actions to differ materially from what is expressed or implied by these statements. These risks and uncertainties are identified and described in more detail in our filings with the Securities and Exchange Commission, including our Annual Report on Form 10-K. We expressly disclaim any obligation to update these forward-looking statements, except as otherwise explicitly stated by us or as required by law or regulation. You should not place undue reliance on these statements or the scientific data presented. Note on Forward-Looking Statements Note on Non-GAAP Financial Measures This presentation refers to certain non-GAAP financial measures, including, but not limited to, pro forma adjusted revenue, pro forma adjusted constant currency revenue growth, adjusted diluted earnings per share, adjusted gross and operating margins, adjusted selling, general and administrative expenses, adjusted research and development expenses, adjusted income before taxes, adjusted income tax expense and adjusted tax rate. These non-GAAP financial measures should not be considered replacements for, and should be read together with, the most comparable GAAP financial measures. Tables reconciling these non-GAAP financial measures to the most comparable GAAP financial measures are contained within this presentation and the appendices at the end of this presentation.

Jason Weidman President and CEO Executive Overview
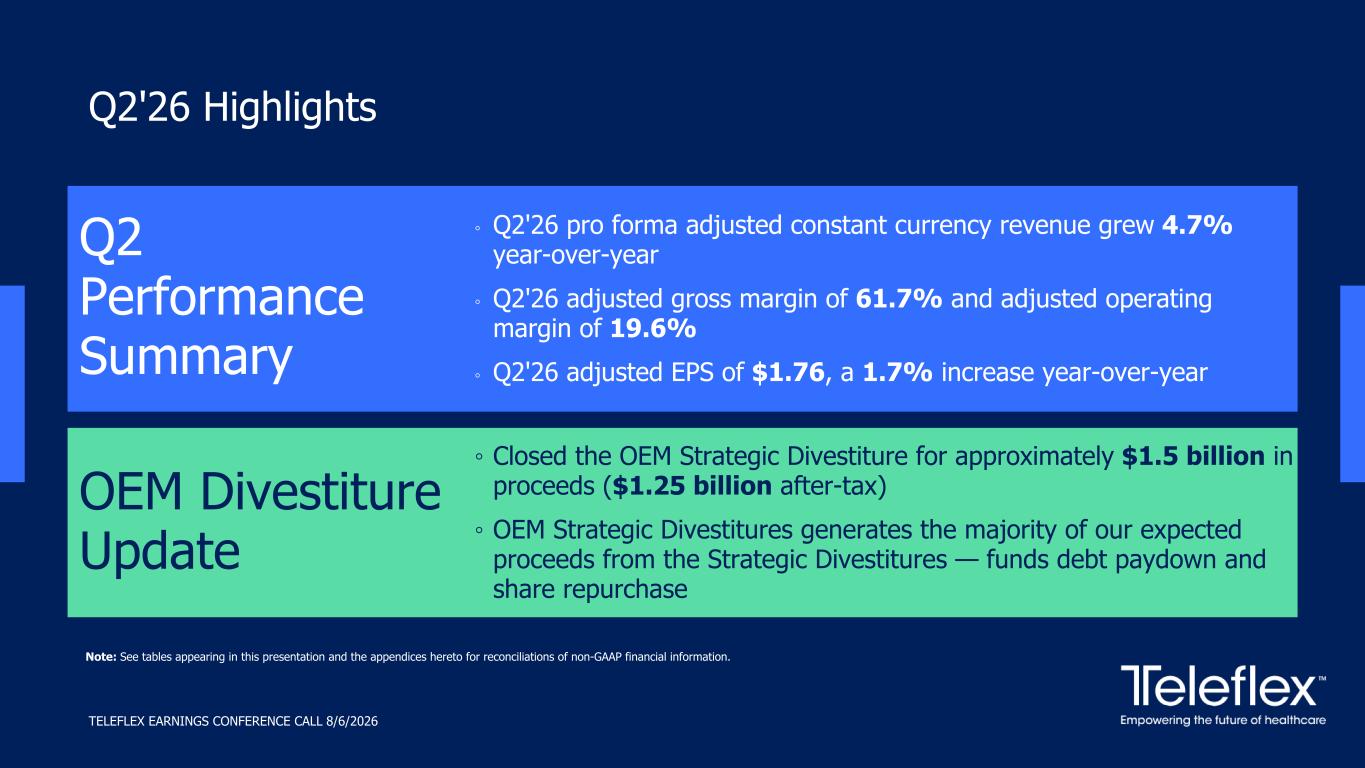
Q2 Performance Summary ◦ Closed the OEM Strategic Divestiture for approximately $1.5 billion in proceeds ($1.25 billion after-tax) ◦ OEM Strategic Divestitures generates the majority of our expected proceeds from the Strategic Divestitures — funds debt paydown and share repurchase ◦ Q2'26 pro forma adjusted constant currency revenue grew 4.7% year-over-year ◦ Q2'26 adjusted gross margin of 61.7% and adjusted operating margin of 19.6% ◦ Q2'26 adjusted EPS of $1.76, a 1.7% increase year-over-year Q2'26 Highlights OEM Divestiture Update Note: See tables appearing in this presentation and the appendices hereto for reconciliations of non-GAAP financial information. TELEFLEX EARNINGS CONFERENCE CALL 8/6/2026
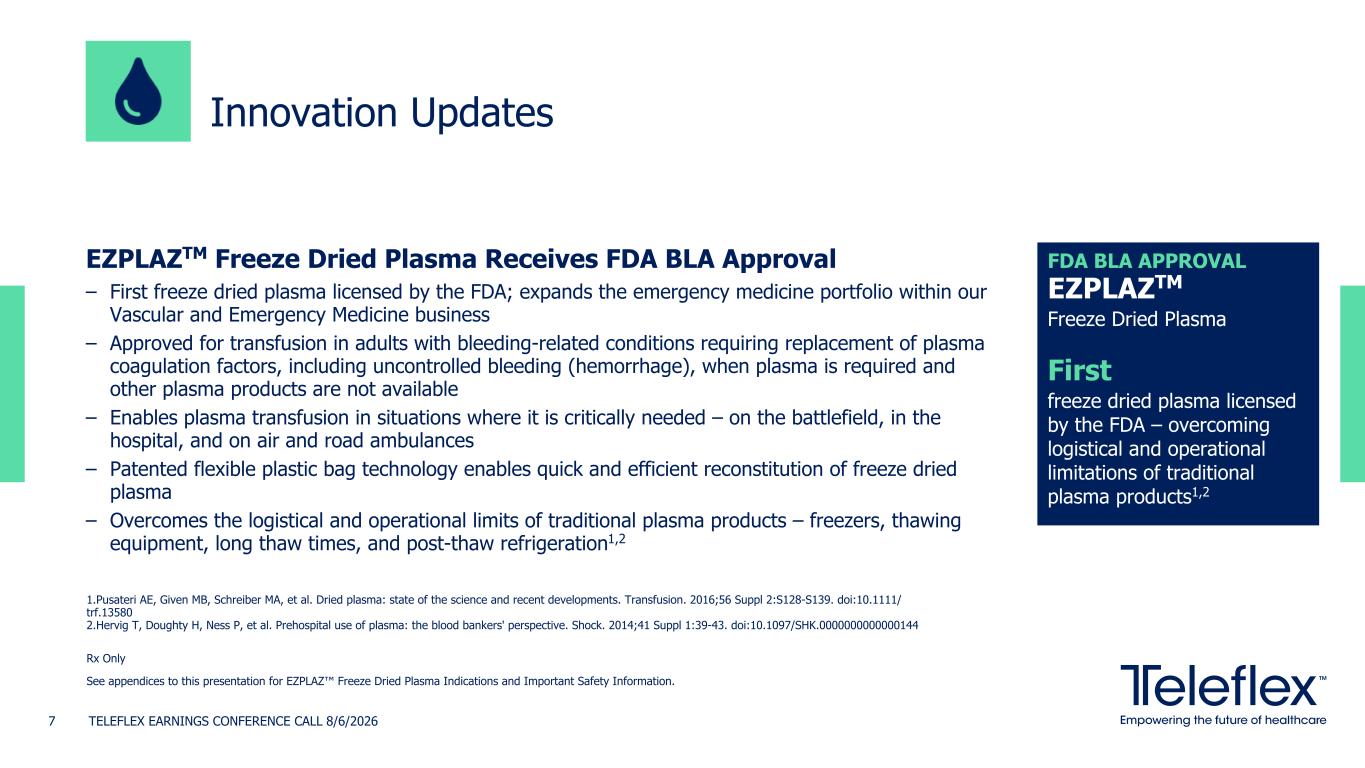
Rx Only See appendices to this presentation for EZPLAZ™ Freeze Dried Plasma Indications and Important Safety Information. EZPLAZTM Freeze Dried Plasma Receives FDA BLA Approval – First freeze dried plasma licensed by the FDA; expands the emergency medicine portfolio within our Vascular and Emergency Medicine business – Approved for transfusion in adults with bleeding-related conditions requiring replacement of plasma coagulation factors, including uncontrolled bleeding (hemorrhage), when plasma is required and other plasma products are not available – Enables plasma transfusion in situations where it is critically needed – on the battlefield, in the hospital, and on air and road ambulances – Patented flexible plastic bag technology enables quick and efficient reconstitution of freeze dried plasma – Overcomes the logistical and operational limits of traditional plasma products – freezers, thawing equipment, long thaw times, and post-thaw refrigeration1,2 Innovation Updates TELEFLEX EARNINGS CONFERENCE CALL 8/6/20267 FDA BLA APPROVAL EZPLAZTM Freeze Dried Plasma First freeze dried plasma licensed by the FDA – overcoming logistical and operational limitations of traditional plasma products1,2 1.Pusateri AE, Given MB, Schreiber MA, et al. Dried plasma: state of the science and recent developments. Transfusion. 2016;56 Suppl 2:S128-S139. doi:10.1111/ trf.13580 2.Hervig T, Doughty H, Ness P, et al. Prehospital use of plasma: the blood bankers' perspective. Shock. 2014;41 Suppl 1:39-43. doi:10.1097/SHK.0000000000000144
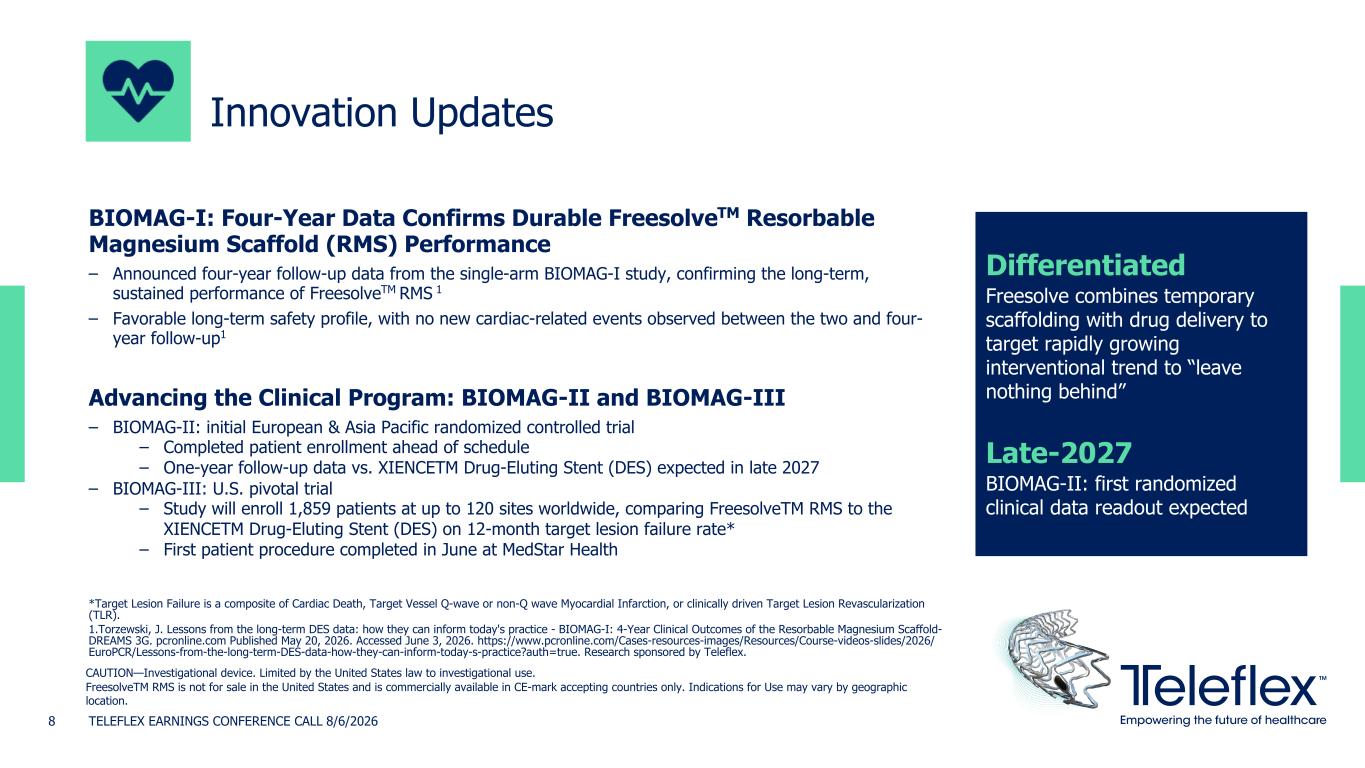
CAUTION—Investigational device. Limited by the United States law to investigational use. FreesolveTM RMS is not for sale in the United States and is commercially available in CE-mark accepting countries only. Indications for Use may vary by geographic location. BIOMAG-I: Four-Year Data Confirms Durable FreesolveTM Resorbable Magnesium Scaffold (RMS) Performance – Announced four-year follow-up data from the single-arm BIOMAG-I study, confirming the long-term, sustained performance of FreesolveTM RMS 1 – Favorable long-term safety profile, with no new cardiac-related events observed between the two and four- year follow-up1 Advancing the Clinical Program: BIOMAG-II and BIOMAG-III – BIOMAG-II: initial European & Asia Pacific randomized controlled trial – BIOMAG-III: U.S. pivotal trial Innovation Updates TELEFLEX EARNINGS CONFERENCE CALL 8/6/20268 Differentiated Freesolve combines temporary scaffolding with drug delivery to target rapidly growing interventional trend to “leave nothing behind” Late-2027 BIOMAG-II: first randomized clinical data readout expected *Target Lesion Failure is a composite of Cardiac Death, Target Vessel Q-wave or non-Q wave Myocardial Infarction, or clinically driven Target Lesion Revascularization (TLR). 1.Torzewski, J. Lessons from the long-term DES data: how they can inform today's practice - BIOMAG-I: 4-Year Clinical Outcomes of the Resorbable Magnesium Scaffold- DREAMS 3G. pcronline.com Published May 20, 2026. Accessed June 3, 2026. https://www.pcronline.com/Cases-resources-images/Resources/Course-videos-slides/2026/ EuroPCR/Lessons-from-the-long-term-DES-data-how-they-can-inform-today-s-practice?auth=true. Research sponsored by Teleflex. – Completed patient enrollment ahead of schedule – One-year follow-up data vs. XIENCETM Drug-Eluting Stent (DES) expected in late 2027 – Study will enroll 1,859 patients at up to 120 sites worldwide, comparing FreesolveTM RMS to the XIENCETM Drug-Eluting Stent (DES) on 12-month target lesion failure rate* – First patient procedure completed in June at MedStar Health
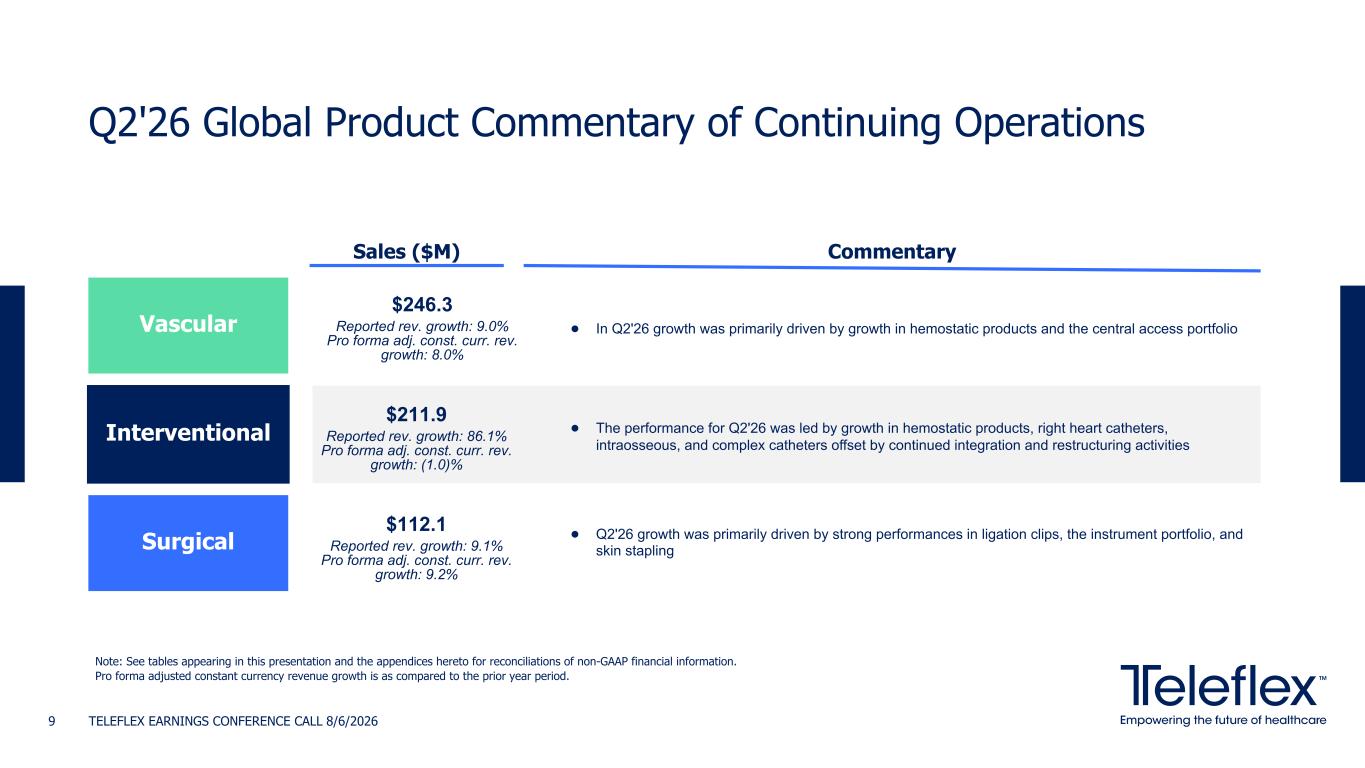
Q2'26 Global Product Commentary of Continuing Operations TELEFLEX EARNINGS CONFERENCE CALL 8/6/20269 Vascular Interventional Sales ($M) Commentary • In Q2'26 growth was primarily driven by growth in hemostatic products and the central access portfolio Surgical • The performance for Q2'26 was led by growth in hemostatic products, right heart catheters, intraosseous, and complex catheters offset by continued integration and restructuring activities $246.3 Reported rev. growth: 9.0% Pro forma adj. const. curr. rev. growth: 8.0% Note: See tables appearing in this presentation and the appendices hereto for reconciliations of non-GAAP financial information. Pro forma adjusted constant currency revenue growth is as compared to the prior year period. $211.9 Reported rev. growth: 86.1% Pro forma adj. const. curr. rev. growth: (1.0)% $112.1 Reported rev. growth: 9.1% Pro forma adj. const. curr. rev. growth: 9.2% • Q2'26 growth was primarily driven by strong performances in ligation clips, the instrument portfolio, and skin stapling
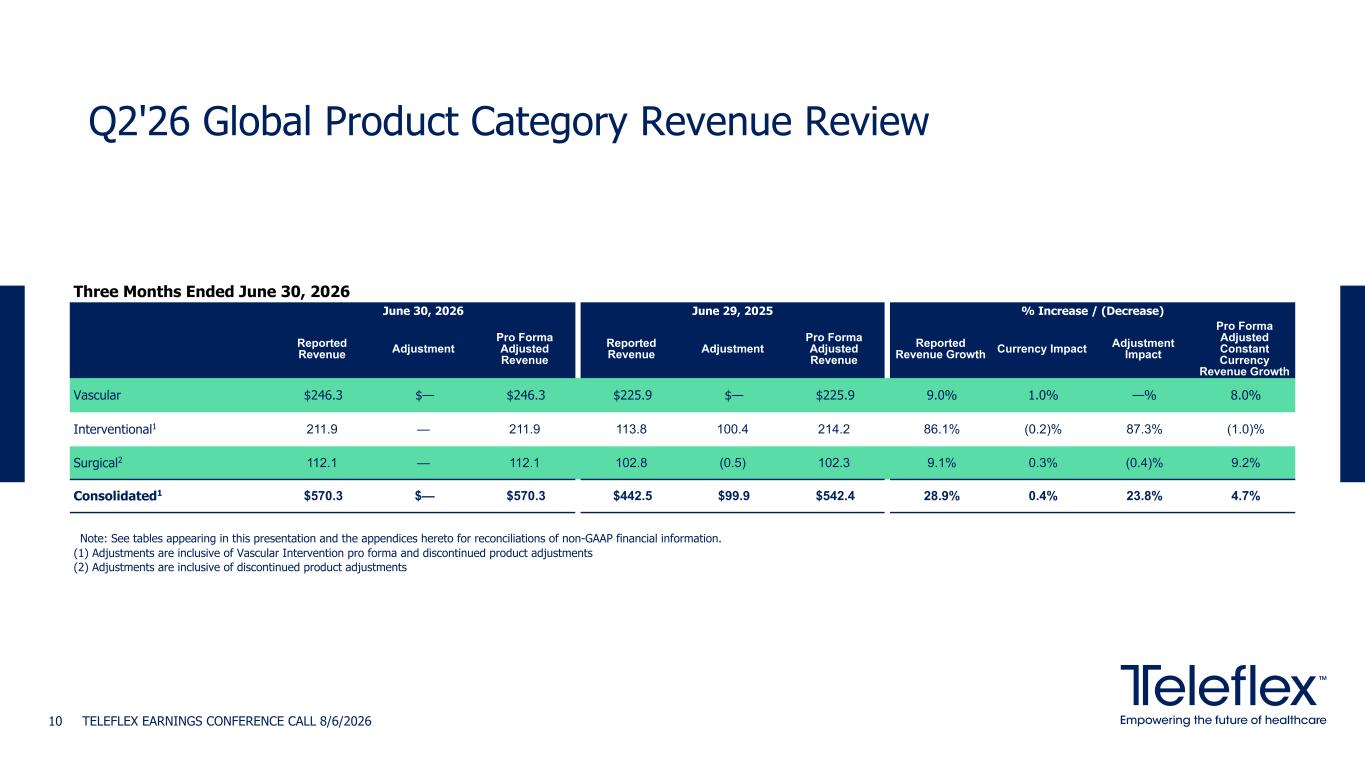
Three Months Ended June 30, 2026 June 30, 2026 June 29, 2025 % Increase / (Decrease) Reported Revenue Adjustment Pro Forma Adjusted Revenue Reported Revenue Adjustment Pro Forma Adjusted Revenue Reported Revenue Growth Currency Impact Adjustment Impact Pro Forma Adjusted Constant Currency Revenue Growth Vascular $246.3 $— $246.3 $225.9 $— $225.9 9.0% 1.0% —% 8.0% Interventional1 211.9 — 211.9 113.8 100.4 214.2 86.1% (0.2)% 87.3% (1.0)% Surgical2 112.1 — 112.1 102.8 (0.5) 102.3 9.1% 0.3% (0.4)% 9.2% Consolidated1 $570.3 $— $570.3 $442.5 $99.9 $542.4 28.9% 0.4% 23.8% 4.7% TELEFLEX EARNINGS CONFERENCE CALL 8/6/202610 Q2'26 Global Product Category Revenue Review Note: See tables appearing in this presentation and the appendices hereto for reconciliations of non-GAAP financial information. (1) Adjustments are inclusive of Vascular Intervention pro forma and discontinued product adjustments (2) Adjustments are inclusive of discontinued product adjustments

John Deren Executive VP and CFO Financial Overview
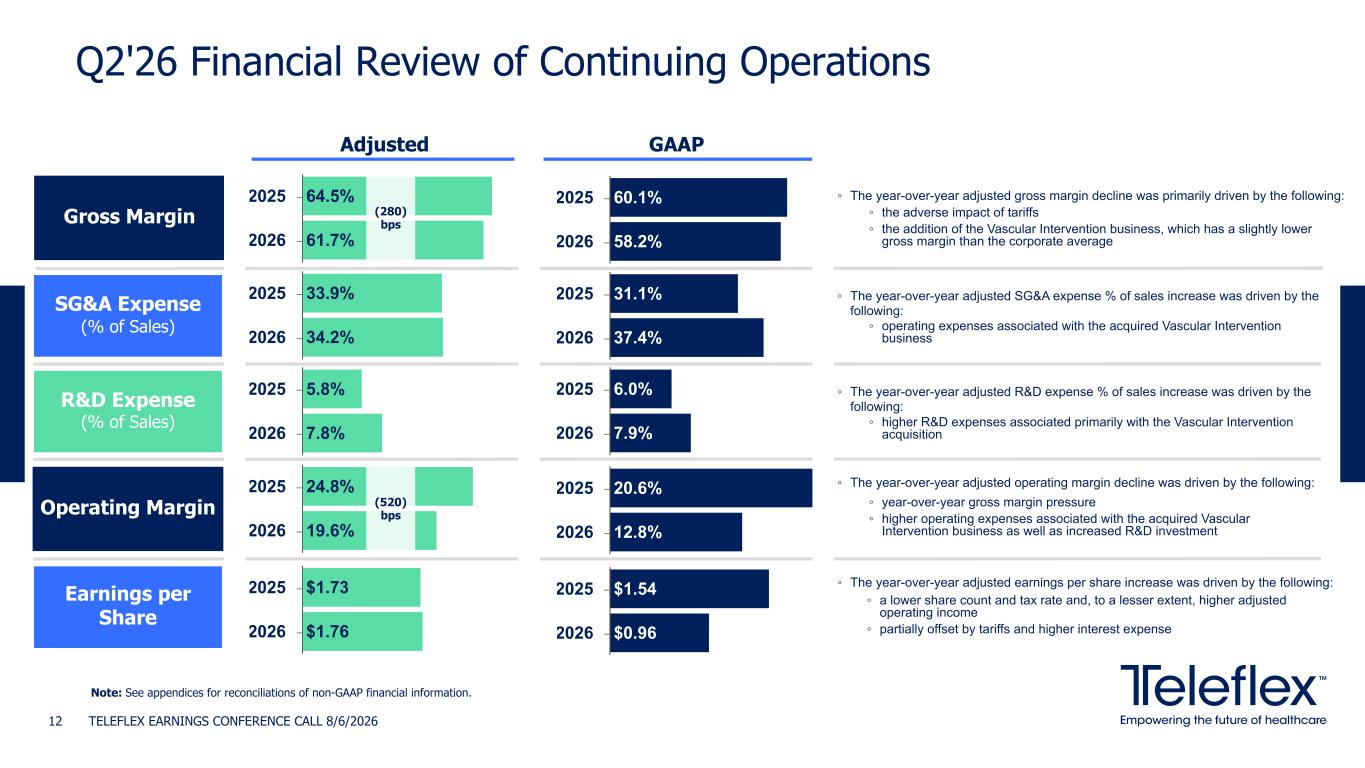
$1.73 $1.76 2025 2026 Q2'26 Financial Review of Continuing Operations TELEFLEX EARNINGS CONFERENCE CALL 8/6/202612 Note: See appendices for reconciliations of non-GAAP financial information. 64.5% 61.7% 2025 2026 SG&A Expense (% of Sales) Gross Margin R&D Expense (% of Sales) Operating Margin Earnings per Share ◦ the adverse impact of tariffs ◦ the addition of the Vascular Intervention business, which has a slightly lower gross margin than the corporate average ◦ year-over-year gross margin pressure ◦ higher operating expenses associated with the acquired Vascular Intervention business as well as increased R&D investment ◦ a lower share count and tax rate and, to a lesser extent, higher adjusted operating income ◦ partially offset by tariffs and higher interest expense ◦ The year-over-year adjusted operating margin decline was driven by the following: ◦ The year-over-year adjusted gross margin decline was primarily driven by the following: ◦ The year-over-year adjusted earnings per share increase was driven by the following: 24.8% 19.6% 2025 2026 ◦ operating expenses associated with the acquired Vascular Intervention business ◦ The year-over-year adjusted SG&A expense % of sales increase was driven by the following: ◦ higher R&D expenses associated primarily with the Vascular Intervention acquisition ◦ The year-over-year adjusted R&D expense % of sales increase was driven by the following: (280) bps (520) bps 33.9% 34.2% 2025 2026 5.8% 7.8% 2025 2026 Adjusted GAAP $1.54 $0.96 2025 2026 60.1% 58.2% 2025 2026 20.6% 12.8% 2025 2026 31.1% 37.4% 2025 2026 6.0% 7.9% 2025 2026
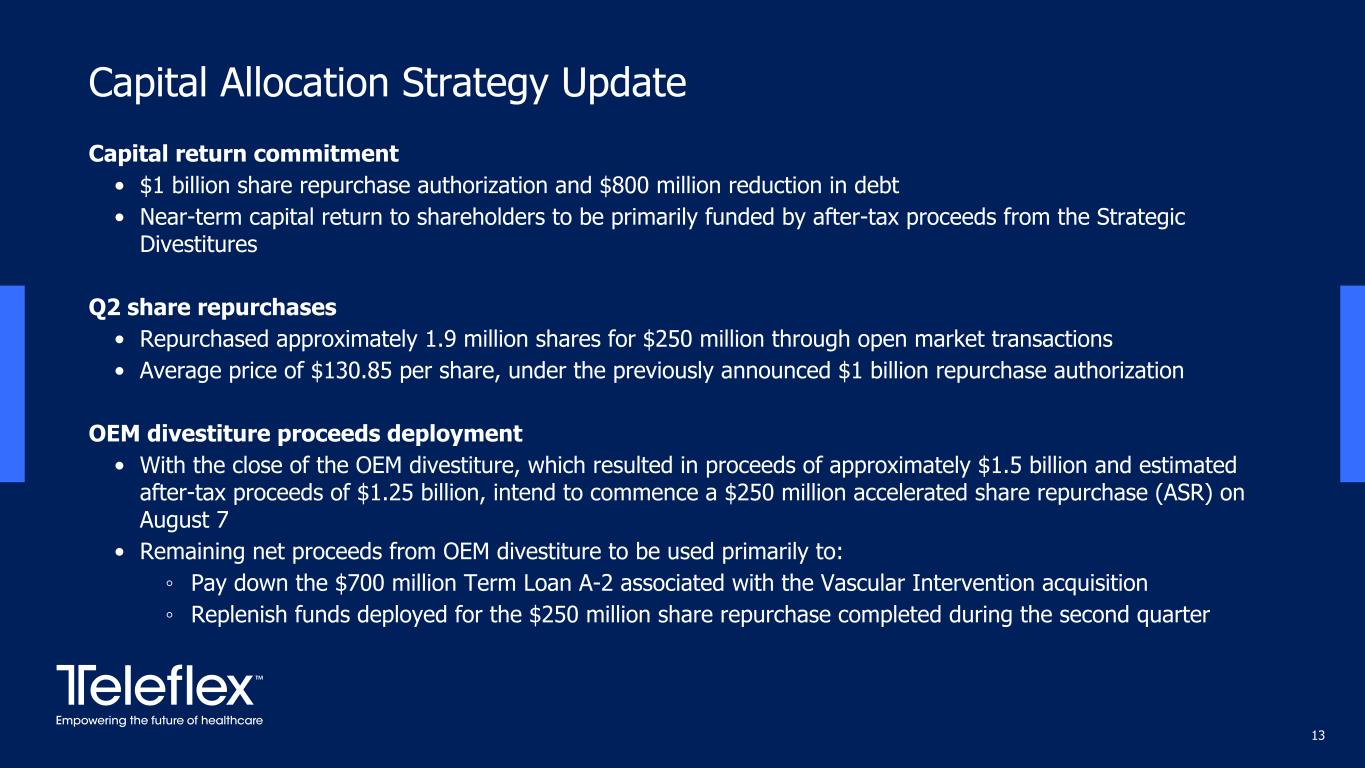
Capital return commitment • $1 billion share repurchase authorization and $800 million reduction in debt • Near-term capital return to shareholders to be primarily funded by after-tax proceeds from the Strategic Divestitures Q2 share repurchases • Repurchased approximately 1.9 million shares for $250 million through open market transactions • Average price of $130.85 per share, under the previously announced $1 billion repurchase authorization OEM divestiture proceeds deployment • With the close of the OEM divestiture, which resulted in proceeds of approximately $1.5 billion and estimated after-tax proceeds of $1.25 billion, intend to commence a $250 million accelerated share repurchase (ASR) on August 7 • Remaining net proceeds from OEM divestiture to be used primarily to: ◦ Pay down the $700 million Term Loan A-2 associated with the Vascular Intervention acquisition ◦ Replenish funds deployed for the $250 million share repurchase completed during the second quarter 13 Capital Allocation Strategy Update
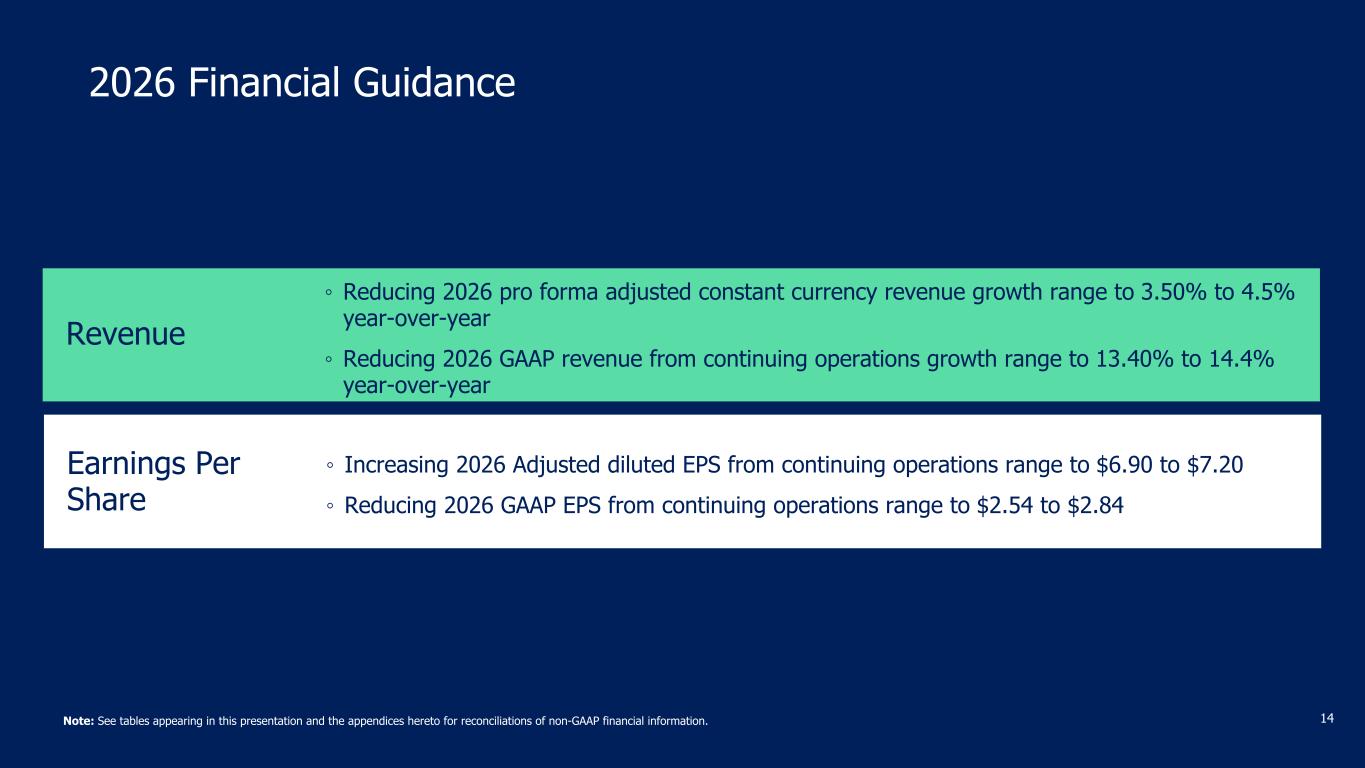
14 Revenue ◦ Reducing 2026 pro forma adjusted constant currency revenue growth range to 3.50% to 4.5% year-over-year ◦ Reducing 2026 GAAP revenue from continuing operations growth range to 13.40% to 14.4% year-over-year Earnings Per Share ◦ Increasing 2026 Adjusted diluted EPS from continuing operations range to $6.90 to $7.20 ◦ Reducing 2026 GAAP EPS from continuing operations range to $2.54 to $2.84 2026 Financial Guidance Note: See tables appearing in this presentation and the appendices hereto for reconciliations of non-GAAP financial information.
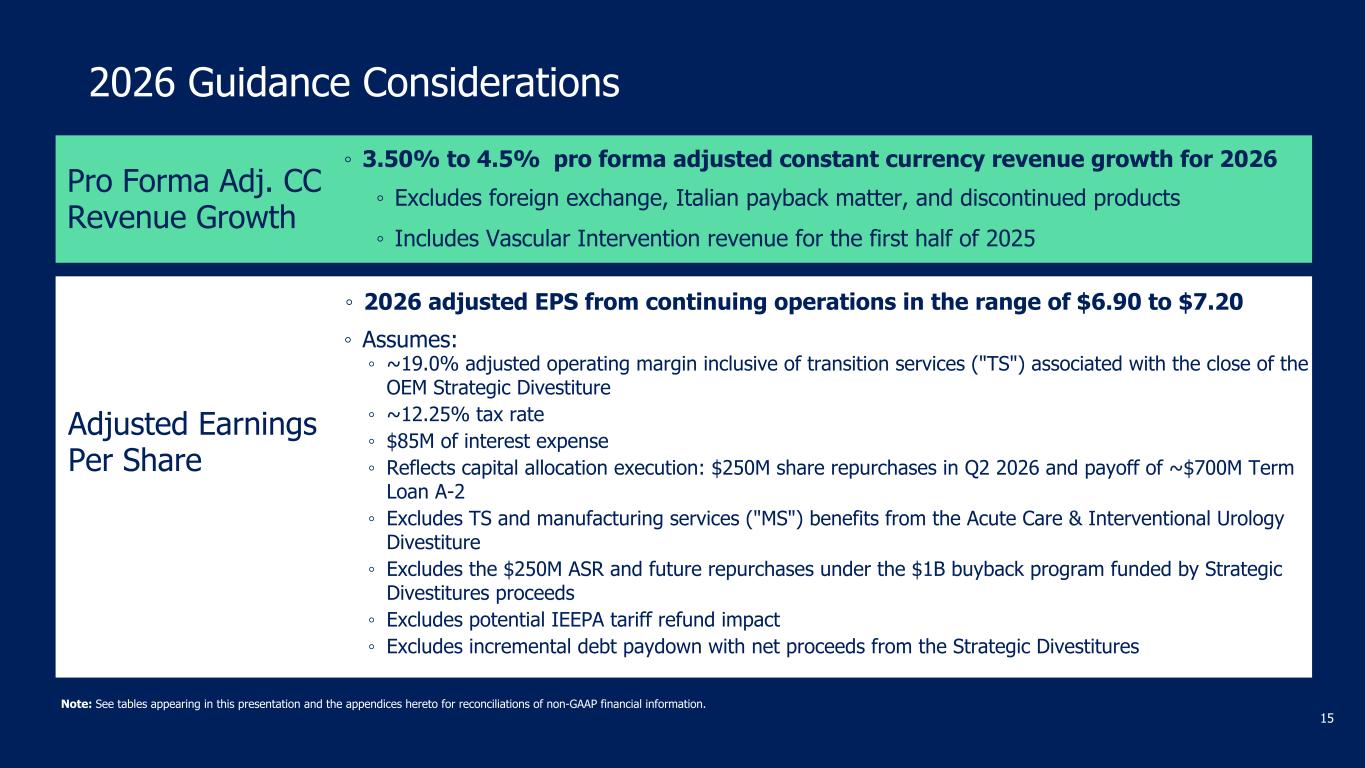
2026 Guidance Considerations 15 Pro Forma Adj. CC Revenue Growth ◦ 3.50% to 4.5% pro forma adjusted constant currency revenue growth for 2026 Adjusted Earnings Per Share ◦ 2026 adjusted EPS from continuing operations in the range of $6.90 to $7.20 ◦ Excludes foreign exchange, Italian payback matter, and discontinued products ◦ Includes Vascular Intervention revenue for the first half of 2025 ◦ ~19.0% adjusted operating margin inclusive of transition services ("TS") associated with the close of the OEM Strategic Divestiture ◦ ~12.25% tax rate ◦ $85M of interest expense ◦ Reflects capital allocation execution: $250M share repurchases in Q2 2026 and payoff of ~$700M Term Loan A-2 ◦ Excludes TS and manufacturing services ("MS") benefits from the Acute Care & Interventional Urology Divestiture ◦ Excludes the $250M ASR and future repurchases under the $1B buyback program funded by Strategic Divestitures proceeds ◦ Excludes potential IEEPA tariff refund impact ◦ Excludes incremental debt paydown with net proceeds from the Strategic Divestitures ◦ Assumes: Note: See tables appearing in this presentation and the appendices hereto for reconciliations of non-GAAP financial information.
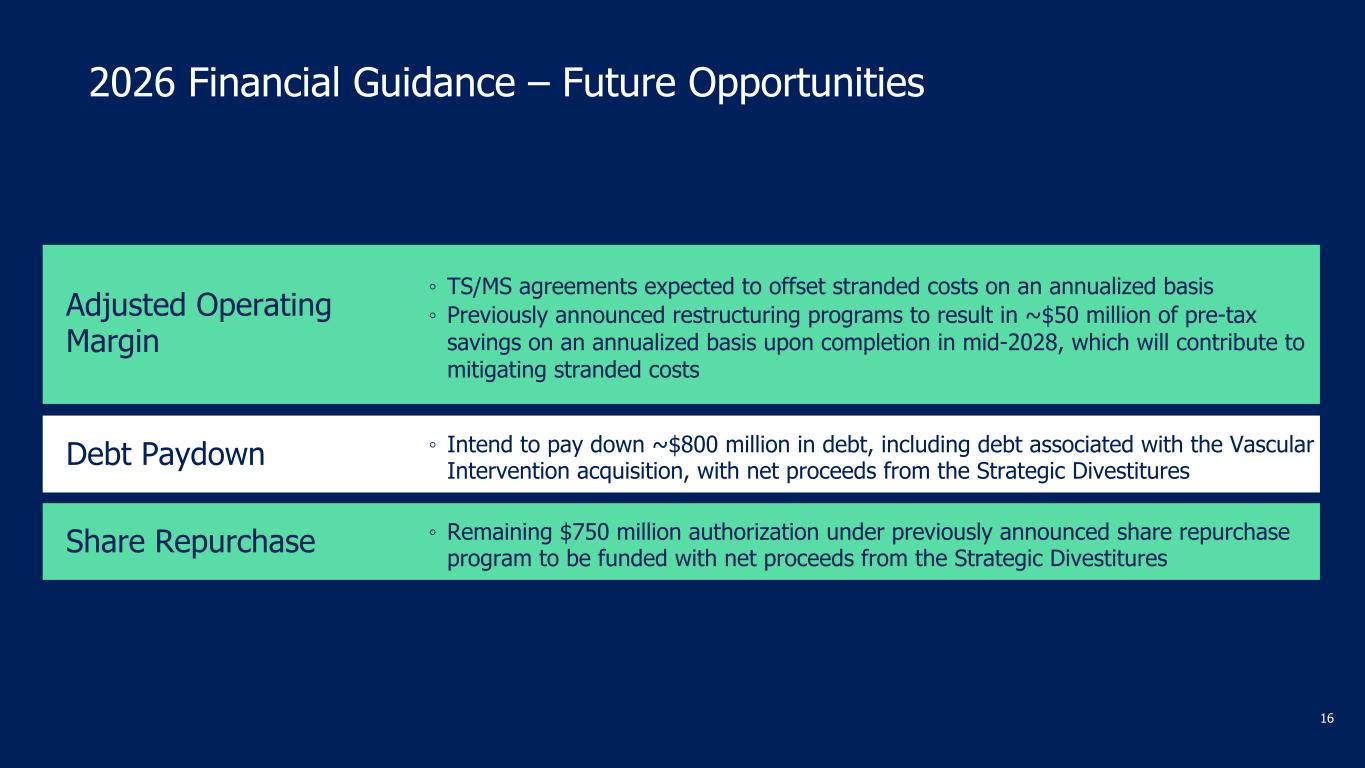
16 Adjusted Operating Margin Debt Paydown ◦ Intend to pay down ~$800 million in debt, including debt associated with the Vascular Intervention acquisition, with net proceeds from the Strategic Divestitures Share Repurchase ◦ Remaining $750 million authorization under previously announced share repurchase program to be funded with net proceeds from the Strategic Divestitures 2026 Financial Guidance – Future Opportunities ◦ TS/MS agreements expected to offset stranded costs on an annualized basis ◦ Previously announced restructuring programs to result in ~$50 million of pre-tax savings on an annualized basis upon completion in mid-2028, which will contribute to mitigating stranded costs
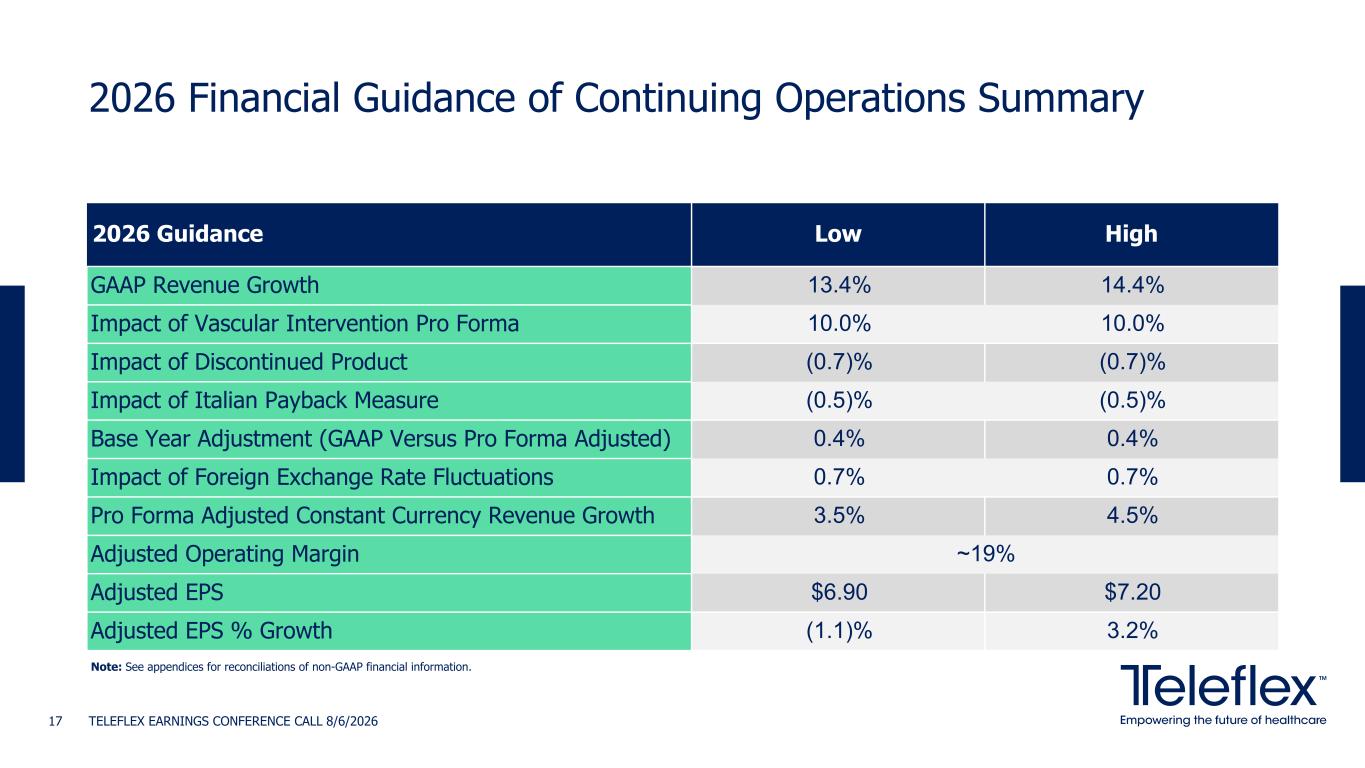
2026 Financial Guidance of Continuing Operations Summary TELEFLEX EARNINGS CONFERENCE CALL 8/6/202617 2026 Guidance Low High GAAP Revenue Growth 13.4% 14.4% Impact of Vascular Intervention Pro Forma 10.0% 10.0% Impact of Discontinued Product (0.7)% (0.7)% Impact of Italian Payback Measure (0.5)% (0.5)% Base Year Adjustment (GAAP Versus Pro Forma Adjusted) 0.4% 0.4% Impact of Foreign Exchange Rate Fluctuations 0.7% 0.7% Pro Forma Adjusted Constant Currency Revenue Growth 3.5% 4.5% Adjusted Operating Margin ~19% Adjusted EPS $6.90 $7.20 Adjusted EPS % Growth (1.1)% 3.2% Note: See appendices for reconciliations of non-GAAP financial information.
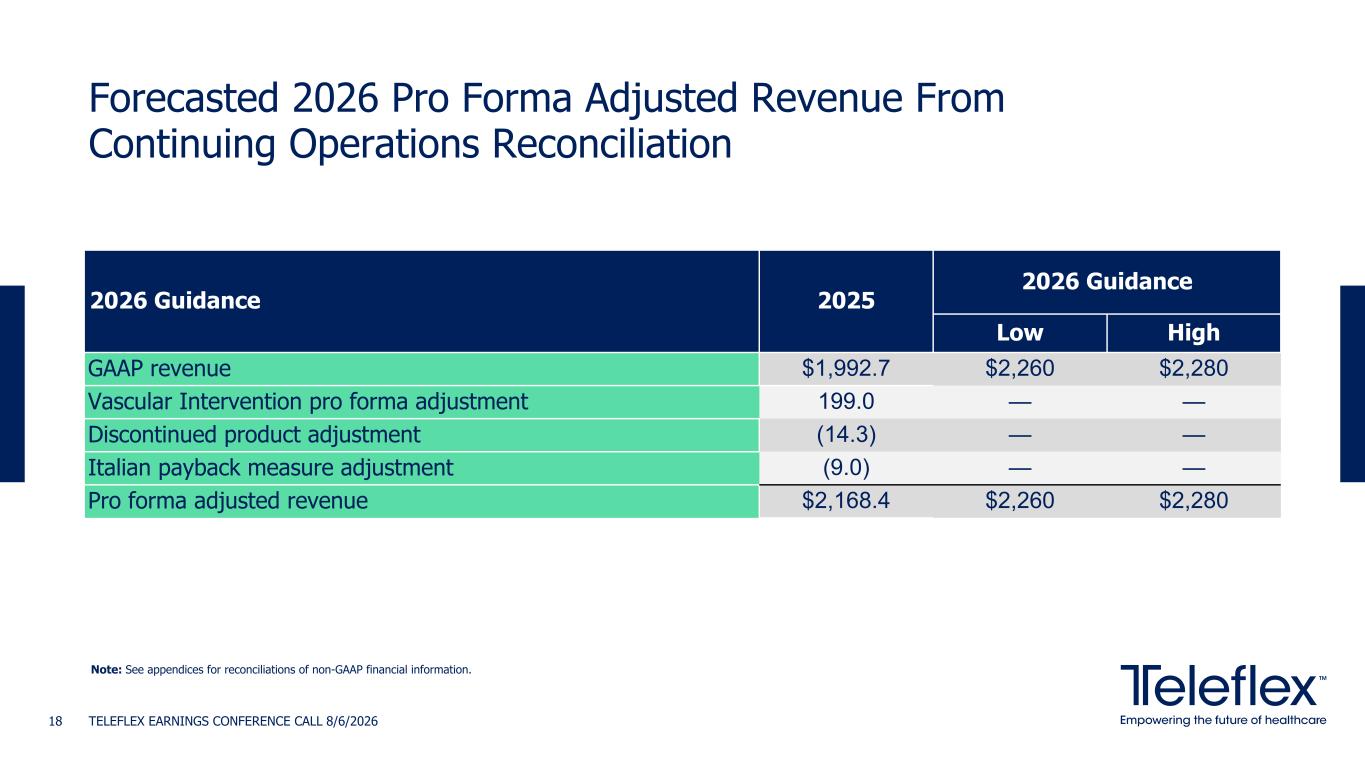
Forecasted 2026 Pro Forma Adjusted Revenue From Continuing Operations Reconciliation TELEFLEX EARNINGS CONFERENCE CALL 8/6/202618 2026 Guidance 2025 2026 Guidance Low High GAAP revenue $1,992.7 $2,260 $2,280 Vascular Intervention pro forma adjustment 199.0 — — Discontinued product adjustment (14.3) — — Italian payback measure adjustment (9.0) — — Pro forma adjusted revenue $2,168.4 $2,260 $2,280 Note: See appendices for reconciliations of non-GAAP financial information.
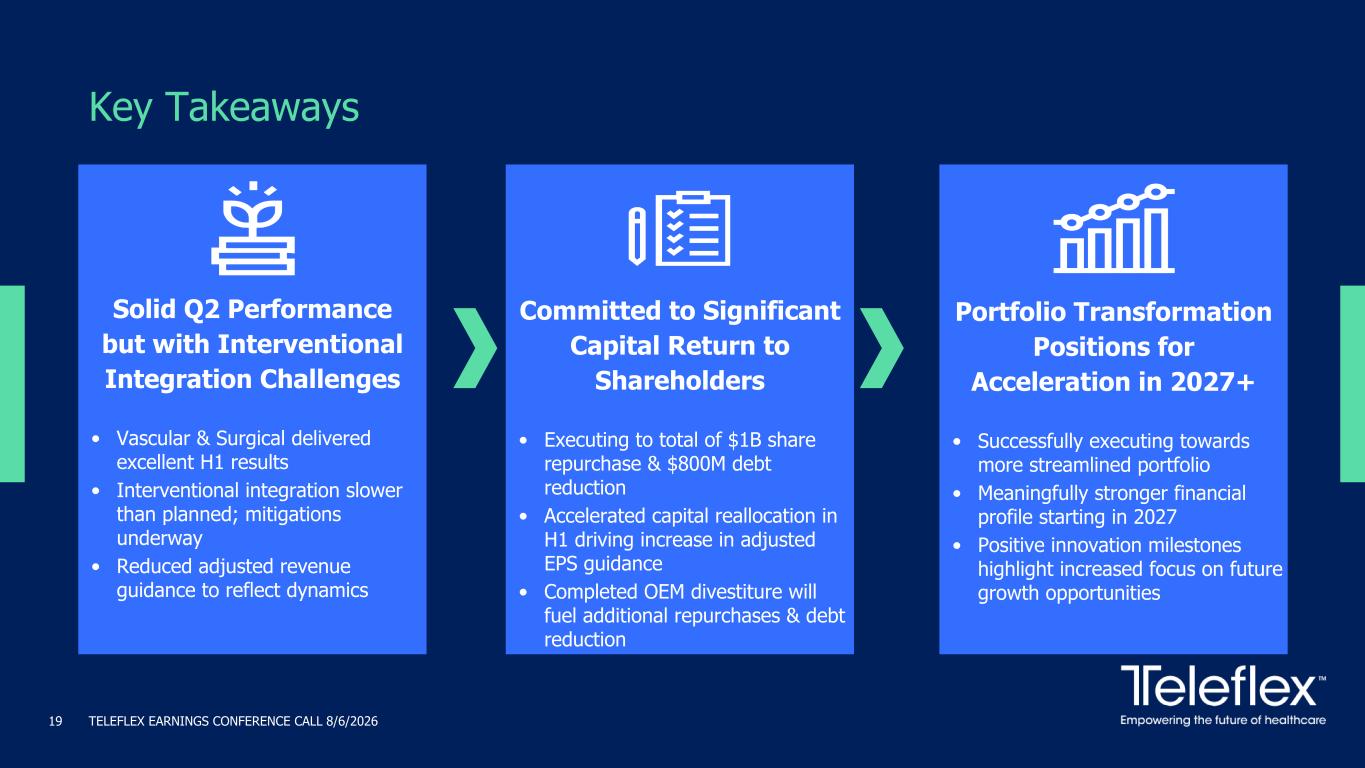
TELEFLEX EARNINGS CONFERENCE CALL 8/6/202619 Key Takeaways Solid Q2 Performance but with Interventional Integration Challenges • Vascular & Surgical delivered excellent H1 results • Interventional integration slower than planned; mitigations underway • Reduced adjusted revenue guidance to reflect dynamics Committed to Significant Capital Return to Shareholders • Executing to total of $1B share repurchase & $800M debt reduction • Accelerated capital reallocation in H1 driving increase in adjusted EPS guidance • Completed OEM divestiture will fuel additional repurchases & debt reduction Portfolio Transformation Positions for Acceleration in 2027+ • Successfully executing towards more streamlined portfolio • Meaningfully stronger financial profile starting in 2027 • Positive innovation milestones highlight increased focus on future growth opportunities

TELEFLEX EARNINGS CONFERENCE CALL 8/6/202620 Thank You!

Appendices
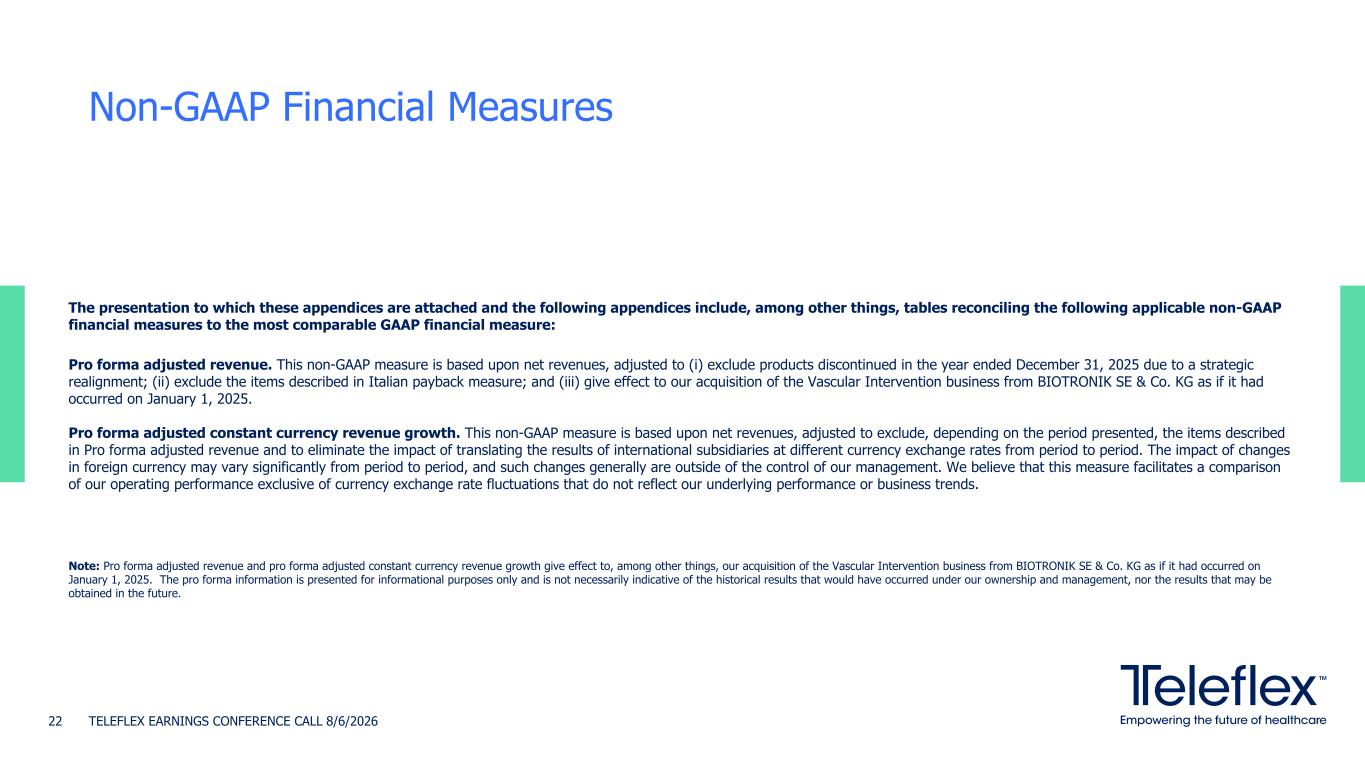
The presentation to which these appendices are attached and the following appendices include, among other things, tables reconciling the following applicable non-GAAP financial measures to the most comparable GAAP financial measure: Pro forma adjusted revenue. This non-GAAP measure is based upon net revenues, adjusted to (i) exclude products discontinued in the year ended December 31, 2025 due to a strategic realignment; (ii) exclude the items described in Italian payback measure; and (iii) give effect to our acquisition of the Vascular Intervention business from BIOTRONIK SE & Co. KG as if it had occurred on January 1, 2025. Pro forma adjusted constant currency revenue growth. This non-GAAP measure is based upon net revenues, adjusted to exclude, depending on the period presented, the items described in Pro forma adjusted revenue and to eliminate the impact of translating the results of international subsidiaries at different currency exchange rates from period to period. The impact of changes in foreign currency may vary significantly from period to period, and such changes generally are outside of the control of our management. We believe that this measure facilitates a comparison of our operating performance exclusive of currency exchange rate fluctuations that do not reflect our underlying performance or business trends. Note: Pro forma adjusted revenue and pro forma adjusted constant currency revenue growth give effect to, among other things, our acquisition of the Vascular Intervention business from BIOTRONIK SE & Co. KG as if it had occurred on January 1, 2025. The pro forma information is presented for informational purposes only and is not necessarily indicative of the historical results that would have occurred under our ownership and management, nor the results that may be obtained in the future. Non-GAAP Financial Measures TELEFLEX EARNINGS CONFERENCE CALL 8/6/202622
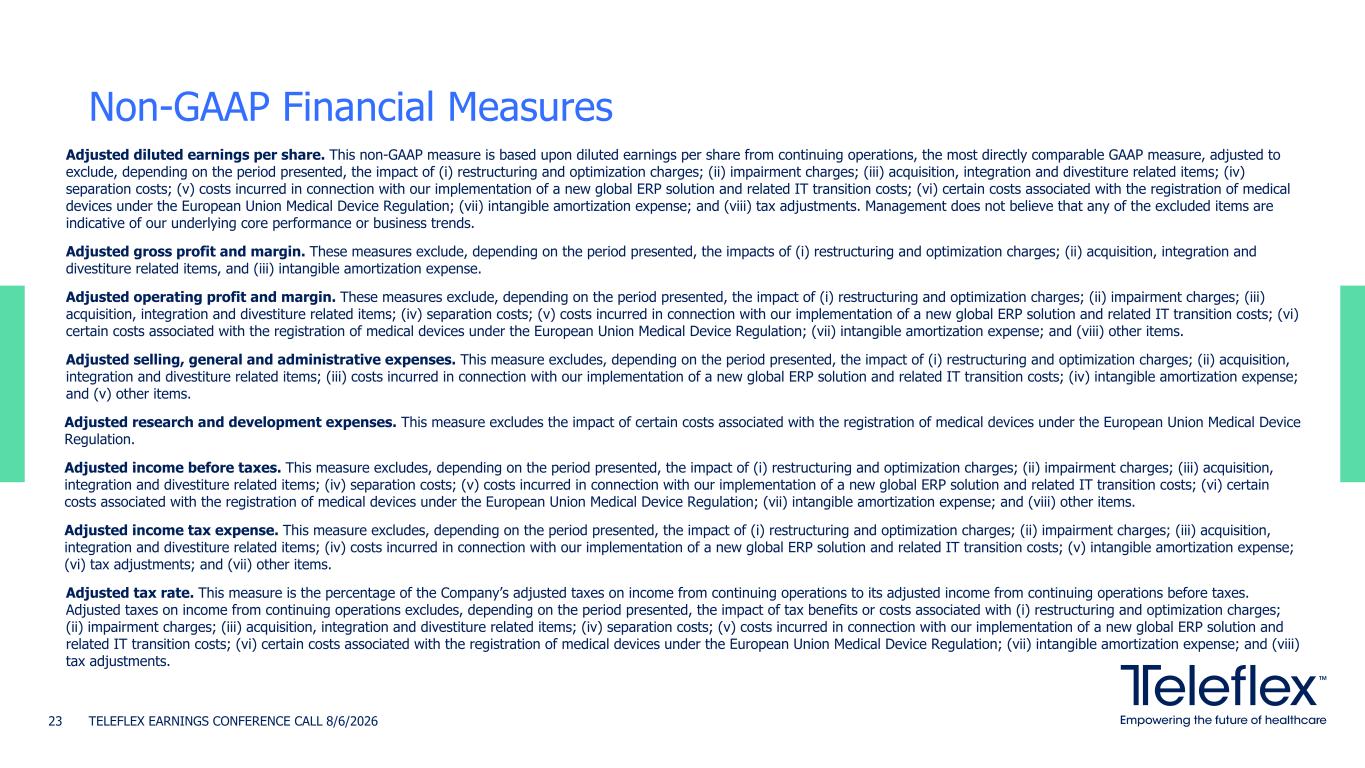
Adjusted diluted earnings per share. This non-GAAP measure is based upon diluted earnings per share from continuing operations, the most directly comparable GAAP measure, adjusted to exclude, depending on the period presented, the impact of (i) restructuring and optimization charges; (ii) impairment charges; (iii) acquisition, integration and divestiture related items; (iv) separation costs; (v) costs incurred in connection with our implementation of a new global ERP solution and related IT transition costs; (vi) certain costs associated with the registration of medical devices under the European Union Medical Device Regulation; (vii) intangible amortization expense; and (viii) tax adjustments. Management does not believe that any of the excluded items are indicative of our underlying core performance or business trends. Adjusted gross profit and margin. These measures exclude, depending on the period presented, the impacts of (i) restructuring and optimization charges; (ii) acquisition, integration and divestiture related items, and (iii) intangible amortization expense. Adjusted operating profit and margin. These measures exclude, depending on the period presented, the impact of (i) restructuring and optimization charges; (ii) impairment charges; (iii) acquisition, integration and divestiture related items; (iv) separation costs; (v) costs incurred in connection with our implementation of a new global ERP solution and related IT transition costs; (vi) certain costs associated with the registration of medical devices under the European Union Medical Device Regulation; (vii) intangible amortization expense; and (viii) other items. Adjusted selling, general and administrative expenses. This measure excludes, depending on the period presented, the impact of (i) restructuring and optimization charges; (ii) acquisition, integration and divestiture related items; (iii) costs incurred in connection with our implementation of a new global ERP solution and related IT transition costs; (iv) intangible amortization expense; and (v) other items. Adjusted research and development expenses. This measure excludes the impact of certain costs associated with the registration of medical devices under the European Union Medical Device Regulation. Adjusted income before taxes. This measure excludes, depending on the period presented, the impact of (i) restructuring and optimization charges; (ii) impairment charges; (iii) acquisition, integration and divestiture related items; (iv) separation costs; (v) costs incurred in connection with our implementation of a new global ERP solution and related IT transition costs; (vi) certain costs associated with the registration of medical devices under the European Union Medical Device Regulation; (vii) intangible amortization expense; and (viii) other items. Adjusted income tax expense. This measure excludes, depending on the period presented, the impact of (i) restructuring and optimization charges; (ii) impairment charges; (iii) acquisition, integration and divestiture related items; (iv) costs incurred in connection with our implementation of a new global ERP solution and related IT transition costs; (v) intangible amortization expense; (vi) tax adjustments; and (vii) other items. Adjusted tax rate. This measure is the percentage of the Company’s adjusted taxes on income from continuing operations to its adjusted income from continuing operations before taxes. Adjusted taxes on income from continuing operations excludes, depending on the period presented, the impact of tax benefits or costs associated with (i) restructuring and optimization charges; (ii) impairment charges; (iii) acquisition, integration and divestiture related items; (iv) separation costs; (v) costs incurred in connection with our implementation of a new global ERP solution and related IT transition costs; (vi) certain costs associated with the registration of medical devices under the European Union Medical Device Regulation; (vii) intangible amortization expense; and (viii) tax adjustments. Non-GAAP Financial Measures TELEFLEX EARNINGS CONFERENCE CALL 8/6/202623
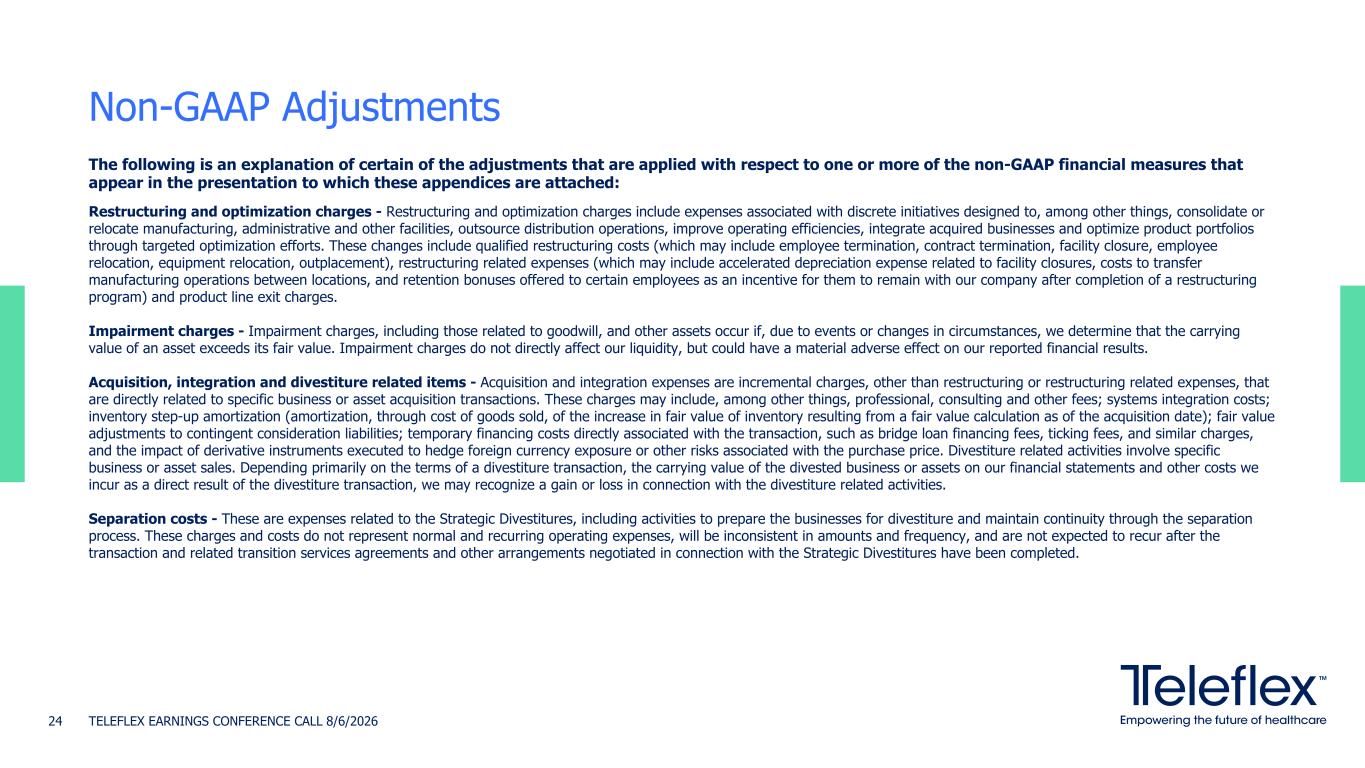
The following is an explanation of certain of the adjustments that are applied with respect to one or more of the non-GAAP financial measures that appear in the presentation to which these appendices are attached: Restructuring and optimization charges - Restructuring and optimization charges include expenses associated with discrete initiatives designed to, among other things, consolidate or relocate manufacturing, administrative and other facilities, outsource distribution operations, improve operating efficiencies, integrate acquired businesses and optimize product portfolios through targeted optimization efforts. These changes include qualified restructuring costs (which may include employee termination, contract termination, facility closure, employee relocation, equipment relocation, outplacement), restructuring related expenses (which may include accelerated depreciation expense related to facility closures, costs to transfer manufacturing operations between locations, and retention bonuses offered to certain employees as an incentive for them to remain with our company after completion of a restructuring program) and product line exit charges. Impairment charges - Impairment charges, including those related to goodwill, and other assets occur if, due to events or changes in circumstances, we determine that the carrying value of an asset exceeds its fair value. Impairment charges do not directly affect our liquidity, but could have a material adverse effect on our reported financial results. Acquisition, integration and divestiture related items - Acquisition and integration expenses are incremental charges, other than restructuring or restructuring related expenses, that are directly related to specific business or asset acquisition transactions. These charges may include, among other things, professional, consulting and other fees; systems integration costs; inventory step-up amortization (amortization, through cost of goods sold, of the increase in fair value of inventory resulting from a fair value calculation as of the acquisition date); fair value adjustments to contingent consideration liabilities; temporary financing costs directly associated with the transaction, such as bridge loan financing fees, ticking fees, and similar charges, and the impact of derivative instruments executed to hedge foreign currency exposure or other risks associated with the purchase price. Divestiture related activities involve specific business or asset sales. Depending primarily on the terms of a divestiture transaction, the carrying value of the divested business or assets on our financial statements and other costs we incur as a direct result of the divestiture transaction, we may recognize a gain or loss in connection with the divestiture related activities. Separation costs - These are expenses related to the Strategic Divestitures, including activities to prepare the businesses for divestiture and maintain continuity through the separation process. These charges and costs do not represent normal and recurring operating expenses, will be inconsistent in amounts and frequency, and are not expected to recur after the transaction and related transition services agreements and other arrangements negotiated in connection with the Strategic Divestitures have been completed. Non-GAAP Adjustments TELEFLEX EARNINGS CONFERENCE CALL 8/6/202624
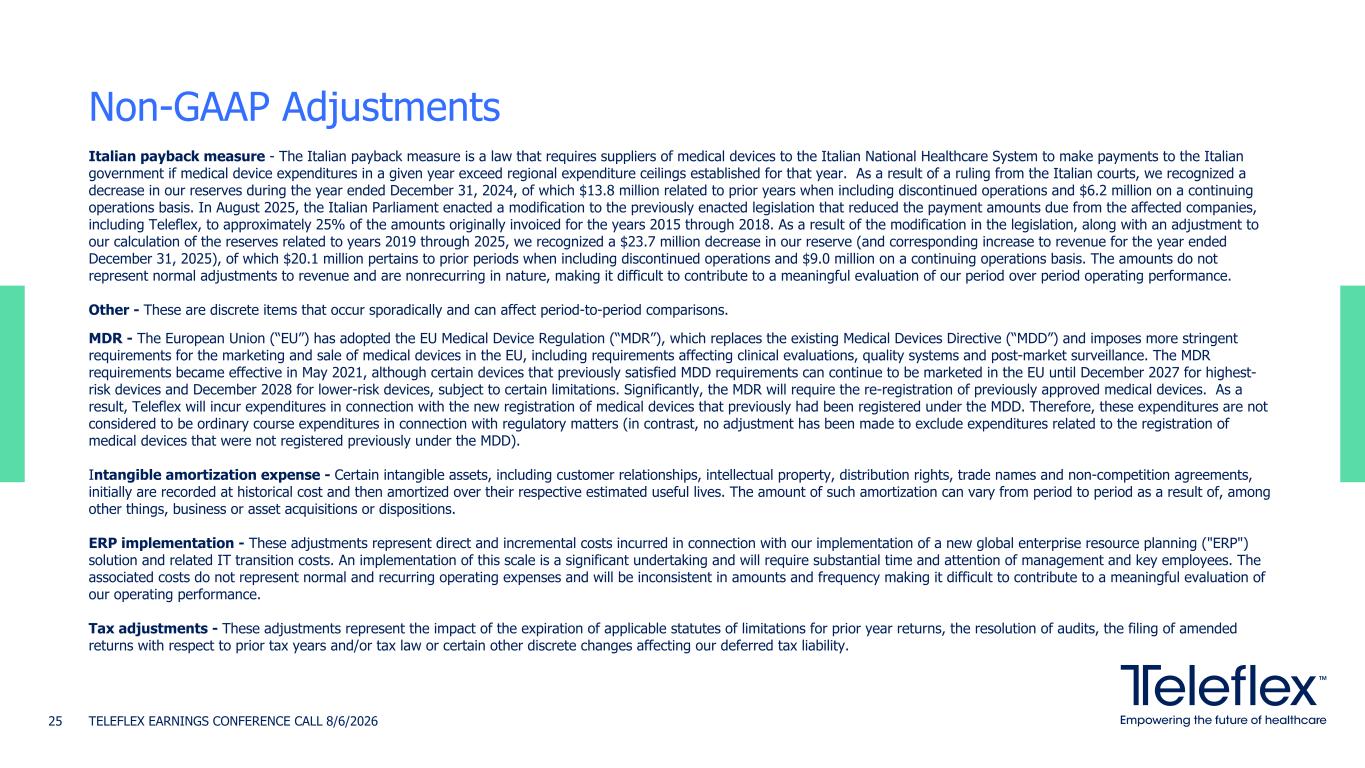
Italian payback measure - The Italian payback measure is a law that requires suppliers of medical devices to the Italian National Healthcare System to make payments to the Italian government if medical device expenditures in a given year exceed regional expenditure ceilings established for that year. As a result of a ruling from the Italian courts, we recognized a decrease in our reserves during the year ended December 31, 2024, of which $13.8 million related to prior years when including discontinued operations and $6.2 million on a continuing operations basis. In August 2025, the Italian Parliament enacted a modification to the previously enacted legislation that reduced the payment amounts due from the affected companies, including Teleflex, to approximately 25% of the amounts originally invoiced for the years 2015 through 2018. As a result of the modification in the legislation, along with an adjustment to our calculation of the reserves related to years 2019 through 2025, we recognized a $23.7 million decrease in our reserve (and corresponding increase to revenue for the year ended December 31, 2025), of which $20.1 million pertains to prior periods when including discontinued operations and $9.0 million on a continuing operations basis. The amounts do not represent normal adjustments to revenue and are nonrecurring in nature, making it difficult to contribute to a meaningful evaluation of our period over period operating performance. Other - These are discrete items that occur sporadically and can affect period-to-period comparisons. MDR - The European Union (“EU”) has adopted the EU Medical Device Regulation (“MDR”), which replaces the existing Medical Devices Directive (“MDD”) and imposes more stringent requirements for the marketing and sale of medical devices in the EU, including requirements affecting clinical evaluations, quality systems and post-market surveillance. The MDR requirements became effective in May 2021, although certain devices that previously satisfied MDD requirements can continue to be marketed in the EU until December 2027 for highest- risk devices and December 2028 for lower-risk devices, subject to certain limitations. Significantly, the MDR will require the re-registration of previously approved medical devices. As a result, Teleflex will incur expenditures in connection with the new registration of medical devices that previously had been registered under the MDD. Therefore, these expenditures are not considered to be ordinary course expenditures in connection with regulatory matters (in contrast, no adjustment has been made to exclude expenditures related to the registration of medical devices that were not registered previously under the MDD). Intangible amortization expense - Certain intangible assets, including customer relationships, intellectual property, distribution rights, trade names and non-competition agreements, initially are recorded at historical cost and then amortized over their respective estimated useful lives. The amount of such amortization can vary from period to period as a result of, among other things, business or asset acquisitions or dispositions. ERP implementation - These adjustments represent direct and incremental costs incurred in connection with our implementation of a new global enterprise resource planning ("ERP") solution and related IT transition costs. An implementation of this scale is a significant undertaking and will require substantial time and attention of management and key employees. The associated costs do not represent normal and recurring operating expenses and will be inconsistent in amounts and frequency making it difficult to contribute to a meaningful evaluation of our operating performance. Tax adjustments - These adjustments represent the impact of the expiration of applicable statutes of limitations for prior year returns, the resolution of audits, the filing of amended returns with respect to prior tax years and/or tax law or certain other discrete changes affecting our deferred tax liability. Non-GAAP Adjustments TELEFLEX EARNINGS CONFERENCE CALL 8/6/202625
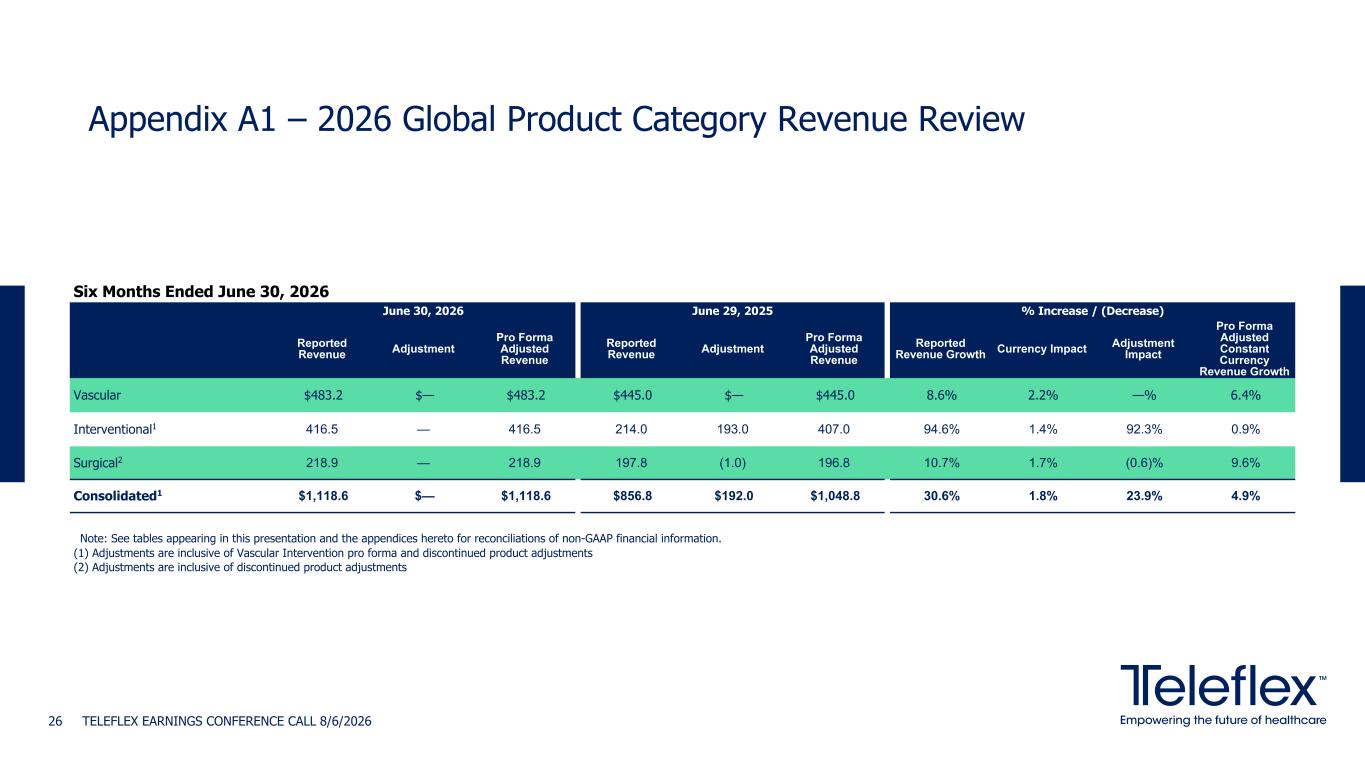
Six Months Ended June 30, 2026 June 30, 2026 June 29, 2025 % Increase / (Decrease) Reported Revenue Adjustment Pro Forma Adjusted Revenue Reported Revenue Adjustment Pro Forma Adjusted Revenue Reported Revenue Growth Currency Impact Adjustment Impact Pro Forma Adjusted Constant Currency Revenue Growth Vascular $483.2 $— $483.2 $445.0 $— $445.0 8.6% 2.2% —% 6.4% Interventional1 416.5 — 416.5 214.0 193.0 407.0 94.6% 1.4% 92.3% 0.9% Surgical2 218.9 — 218.9 197.8 (1.0) 196.8 10.7% 1.7% (0.6)% 9.6% Consolidated1 $1,118.6 $— $1,118.6 $856.8 $192.0 $1,048.8 30.6% 1.8% 23.9% 4.9% TELEFLEX EARNINGS CONFERENCE CALL 8/6/202626 Appendix A1 – 2026 Global Product Category Revenue Review Note: See tables appearing in this presentation and the appendices hereto for reconciliations of non-GAAP financial information. (1) Adjustments are inclusive of Vascular Intervention pro forma and discontinued product adjustments (2) Adjustments are inclusive of discontinued product adjustments
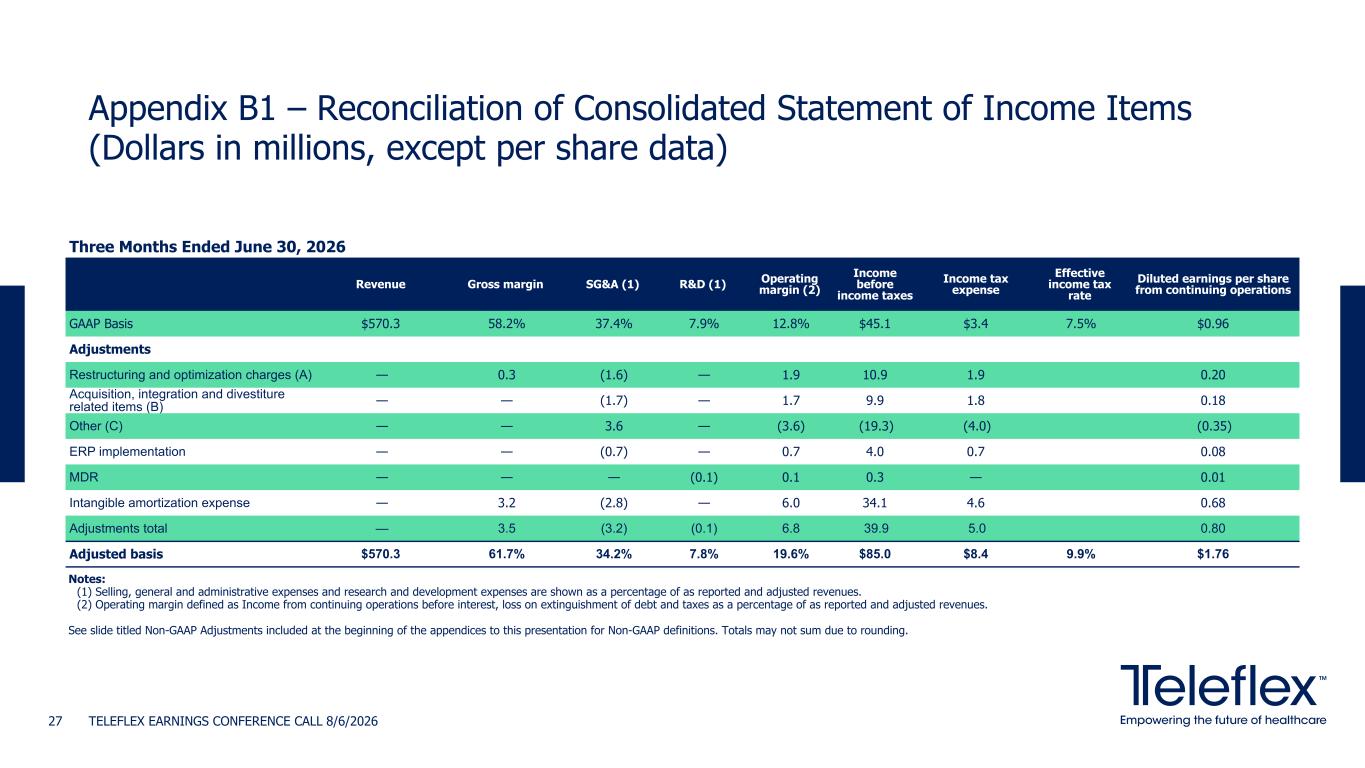
Appendix B1 – Reconciliation of Consolidated Statement of Income Items (Dollars in millions, except per share data) TELEFLEX EARNINGS CONFERENCE CALL 8/6/202627 Three Months Ended June 30, 2026 Revenue Gross margin SG&A (1) R&D (1) Operating margin (2) Income before income taxes Income tax expense Effective income tax rate Diluted earnings per share from continuing operations GAAP Basis $570.3 58.2% 37.4% 7.9% 12.8% $45.1 $3.4 7.5% $0.96 Adjustments Restructuring and optimization charges (A) — 0.3 (1.6) — 1.9 10.9 1.9 0.20 Acquisition, integration and divestiture related items (B) — — (1.7) — 1.7 9.9 1.8 0.18 Other (C) — — 3.6 — (3.6) (19.3) (4.0) (0.35) ERP implementation — — (0.7) — 0.7 4.0 0.7 0.08 MDR — — — (0.1) 0.1 0.3 — 0.01 Intangible amortization expense — 3.2 (2.8) — 6.0 34.1 4.6 0.68 Adjustments total — 3.5 (3.2) (0.1) 6.8 39.9 5.0 0.80 Adjusted basis $570.3 61.7% 34.2% 7.8% 19.6% $85.0 $8.4 9.9% $1.76 Notes: (1) Selling, general and administrative expenses and research and development expenses are shown as a percentage of as reported and adjusted revenues. (2) Operating margin defined as Income from continuing operations before interest, loss on extinguishment of debt and taxes as a percentage of as reported and adjusted revenues. See slide titled Non-GAAP Adjustments included at the beginning of the appendices to this presentation for Non-GAAP definitions. Totals may not sum due to rounding.
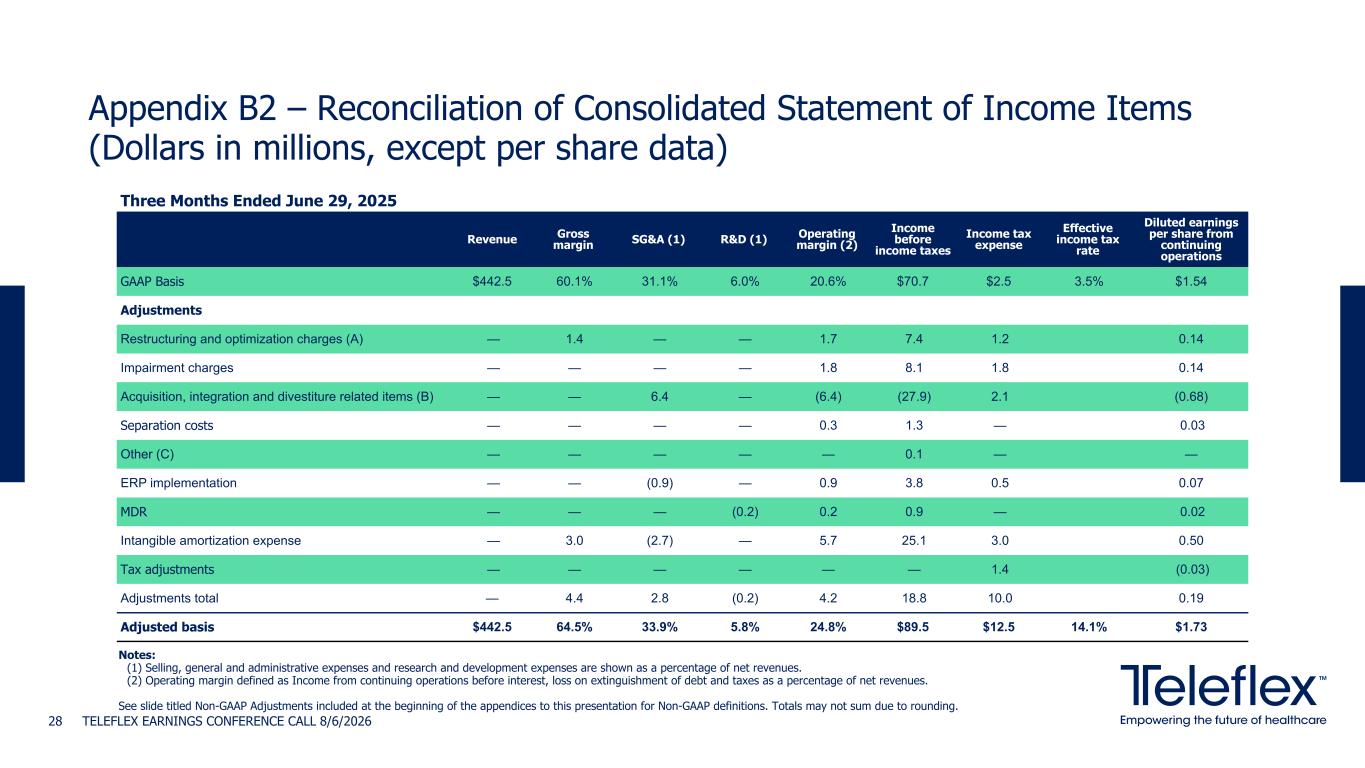
Three Months Ended June 29, 2025 Revenue Gross margin SG&A (1) R&D (1) Operating margin (2) Income before income taxes Income tax expense Effective income tax rate Diluted earnings per share from continuing operations GAAP Basis $442.5 60.1% 31.1% 6.0% 20.6% $70.7 $2.5 3.5% $1.54 Adjustments Restructuring and optimization charges (A) — 1.4 — — 1.7 7.4 1.2 0.14 Impairment charges — — — — 1.8 8.1 1.8 0.14 Acquisition, integration and divestiture related items (B) — — 6.4 — (6.4) (27.9) 2.1 (0.68) Separation costs — — — — 0.3 1.3 — 0.03 Other (C) — — — — — 0.1 — — ERP implementation — — (0.9) — 0.9 3.8 0.5 0.07 MDR — — — (0.2) 0.2 0.9 — 0.02 Intangible amortization expense — 3.0 (2.7) — 5.7 25.1 3.0 0.50 Tax adjustments — — — — — — 1.4 (0.03) Adjustments total — 4.4 2.8 (0.2) 4.2 18.8 10.0 0.19 Adjusted basis $442.5 64.5% 33.9% 5.8% 24.8% $89.5 $12.5 14.1% $1.73 TELEFLEX EARNINGS CONFERENCE CALL 8/6/202628 Notes: (1) Selling, general and administrative expenses and research and development expenses are shown as a percentage of net revenues. (2) Operating margin defined as Income from continuing operations before interest, loss on extinguishment of debt and taxes as a percentage of net revenues. See slide titled Non-GAAP Adjustments included at the beginning of the appendices to this presentation for Non-GAAP definitions. Totals may not sum due to rounding. Appendix B2 – Reconciliation of Consolidated Statement of Income Items (Dollars in millions, except per share data)
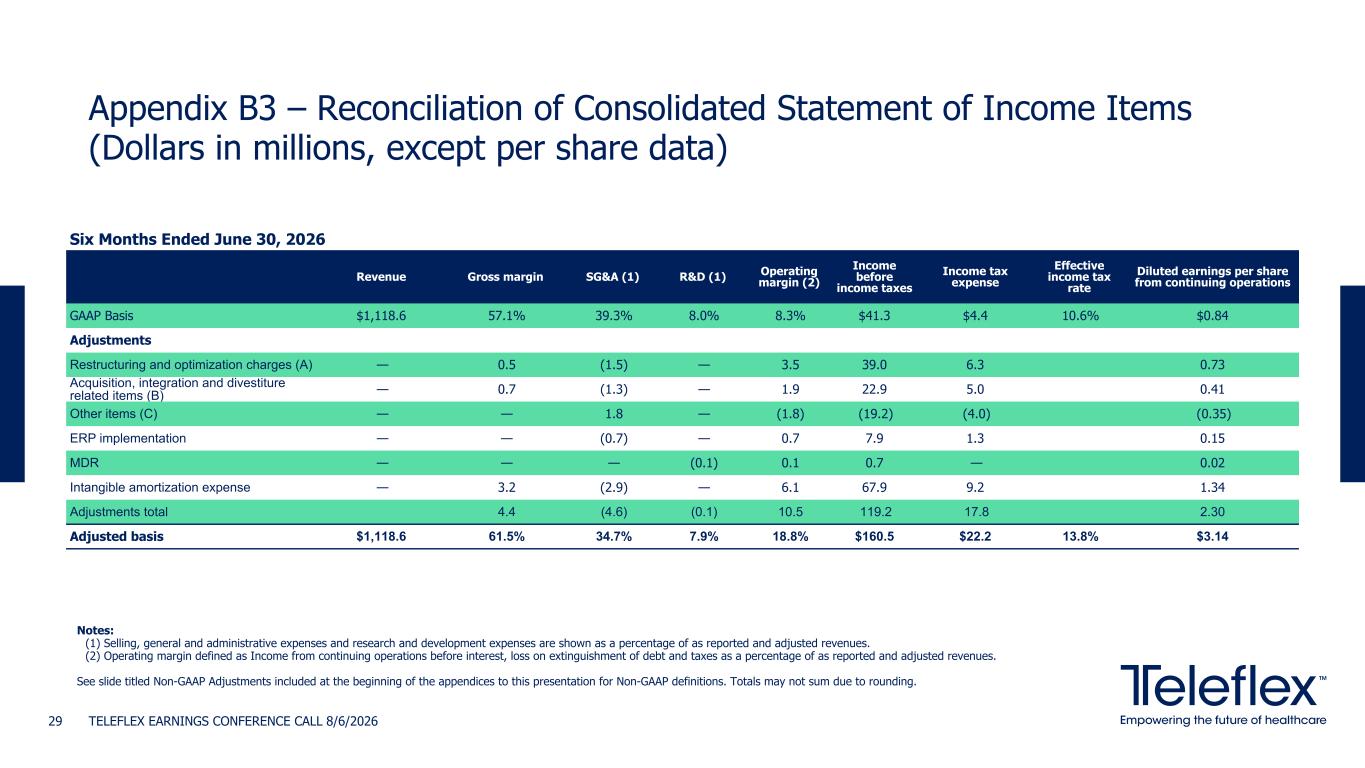
Appendix B3 – Reconciliation of Consolidated Statement of Income Items (Dollars in millions, except per share data) TELEFLEX EARNINGS CONFERENCE CALL 8/6/202629 Six Months Ended June 30, 2026 Revenue Gross margin SG&A (1) R&D (1) Operating margin (2) Income before income taxes Income tax expense Effective income tax rate Diluted earnings per share from continuing operations GAAP Basis $1,118.6 57.1% 39.3% 8.0% 8.3% $41.3 $4.4 10.6% $0.84 Adjustments Restructuring and optimization charges (A) — 0.5 (1.5) — 3.5 39.0 6.3 0.73 Acquisition, integration and divestiture related items (B) — 0.7 (1.3) — 1.9 22.9 5.0 0.41 Other items (C) — — 1.8 — (1.8) (19.2) (4.0) (0.35) ERP implementation — — (0.7) — 0.7 7.9 1.3 0.15 MDR — — — (0.1) 0.1 0.7 — 0.02 Intangible amortization expense — 3.2 (2.9) — 6.1 67.9 9.2 1.34 Adjustments total 4.4 (4.6) (0.1) 10.5 119.2 17.8 2.30 Adjusted basis $1,118.6 61.5% 34.7% 7.9% 18.8% $160.5 $22.2 13.8% $3.14 Notes: (1) Selling, general and administrative expenses and research and development expenses are shown as a percentage of as reported and adjusted revenues. (2) Operating margin defined as Income from continuing operations before interest, loss on extinguishment of debt and taxes as a percentage of as reported and adjusted revenues. See slide titled Non-GAAP Adjustments included at the beginning of the appendices to this presentation for Non-GAAP definitions. Totals may not sum due to rounding.
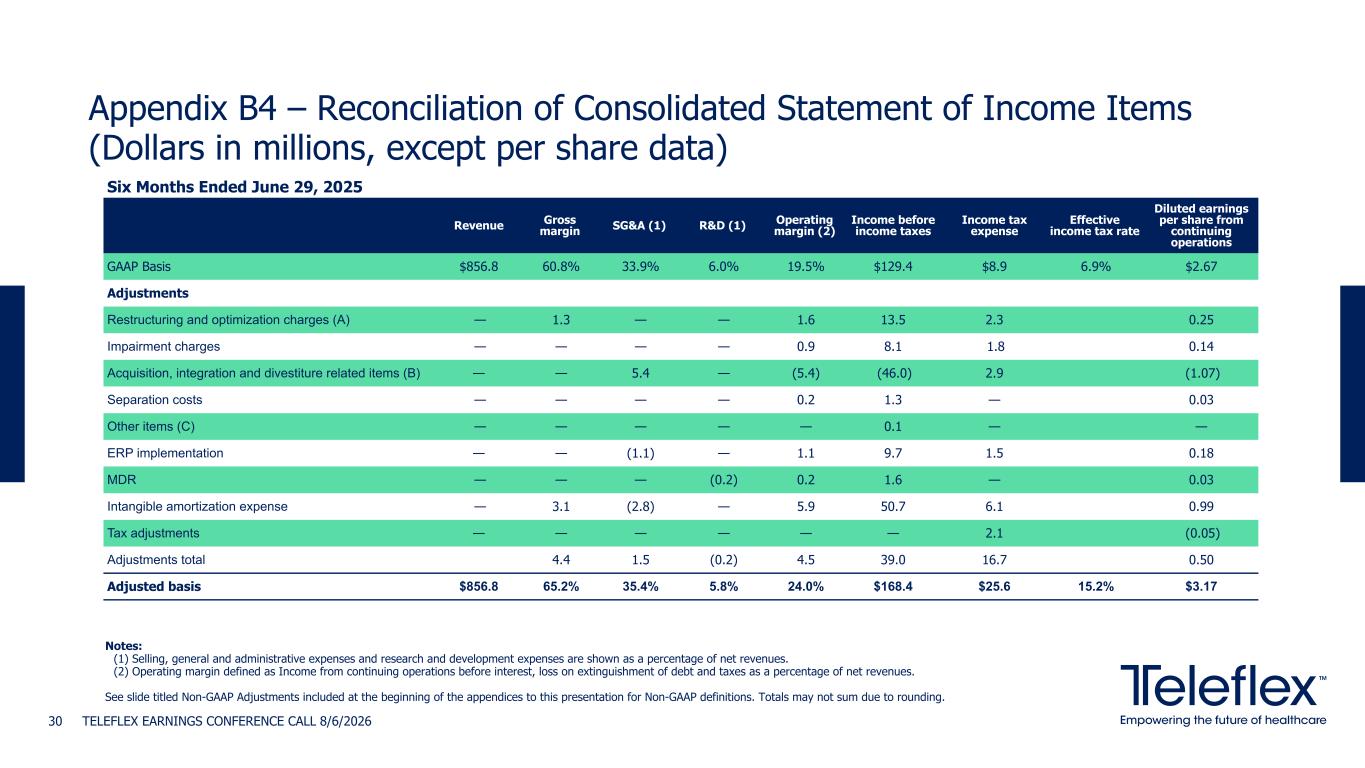
Six Months Ended June 29, 2025 Revenue Gross margin SG&A (1) R&D (1) Operating margin (2) Income before income taxes Income tax expense Effective income tax rate Diluted earnings per share from continuing operations GAAP Basis $856.8 60.8% 33.9% 6.0% 19.5% $129.4 $8.9 6.9% $2.67 Adjustments Restructuring and optimization charges (A) — 1.3 — — 1.6 13.5 2.3 0.25 Impairment charges — — — — 0.9 8.1 1.8 0.14 Acquisition, integration and divestiture related items (B) — — 5.4 — (5.4) (46.0) 2.9 (1.07) Separation costs — — — — 0.2 1.3 — 0.03 Other items (C) — — — — — 0.1 — — ERP implementation — — (1.1) — 1.1 9.7 1.5 0.18 MDR — — — (0.2) 0.2 1.6 — 0.03 Intangible amortization expense — 3.1 (2.8) — 5.9 50.7 6.1 0.99 Tax adjustments — — — — — — 2.1 (0.05) Adjustments total 4.4 1.5 (0.2) 4.5 39.0 16.7 0.50 Adjusted basis $856.8 65.2% 35.4% 5.8% 24.0% $168.4 $25.6 15.2% $3.17 TELEFLEX EARNINGS CONFERENCE CALL 8/6/202630 Notes: (1) Selling, general and administrative expenses and research and development expenses are shown as a percentage of net revenues. (2) Operating margin defined as Income from continuing operations before interest, loss on extinguishment of debt and taxes as a percentage of net revenues. See slide titled Non-GAAP Adjustments included at the beginning of the appendices to this presentation for Non-GAAP definitions. Totals may not sum due to rounding. Appendix B4 – Reconciliation of Consolidated Statement of Income Items (Dollars in millions, except per share data)
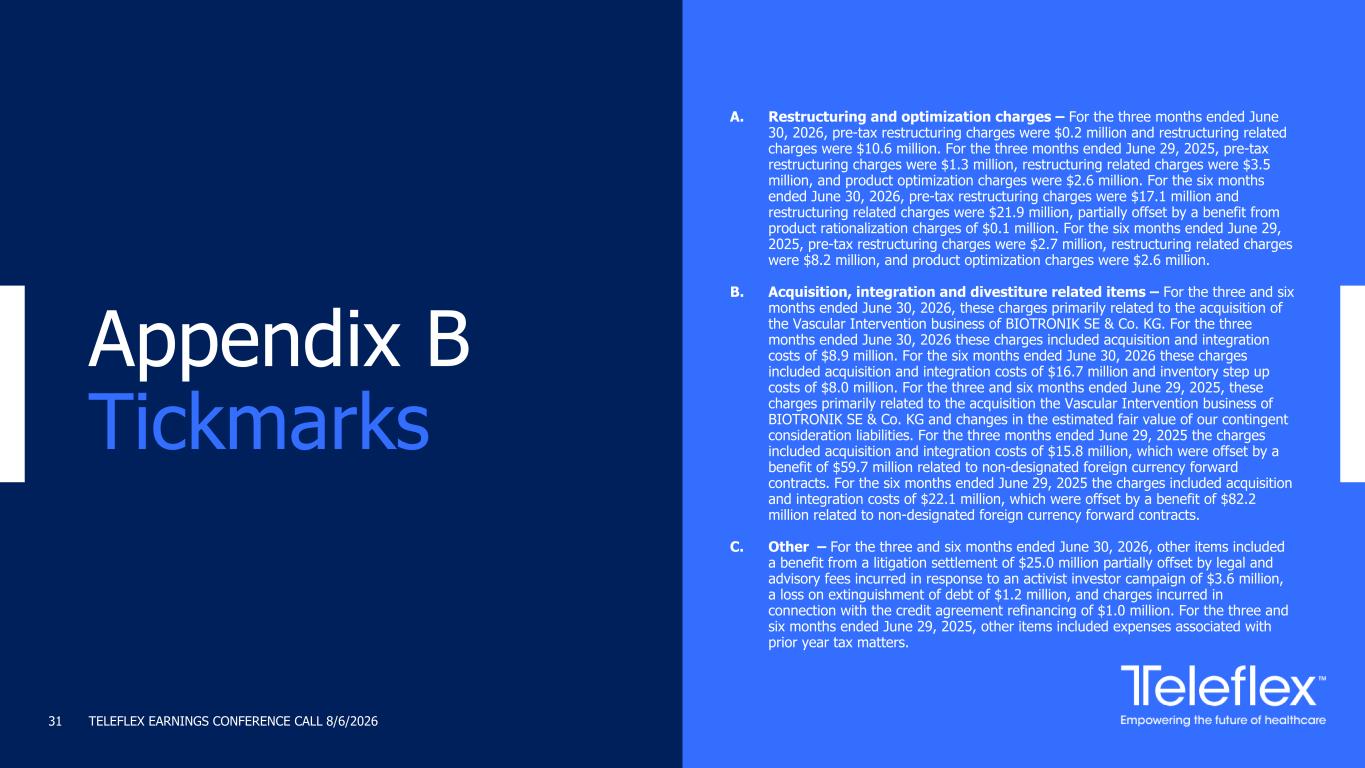
TELEFLEX EARNINGS CONFERENCE CALL 8/6/202631 A. Restructuring and optimization charges – For the three months ended June 30, 2026, pre-tax restructuring charges were $0.2 million and restructuring related charges were $10.6 million. For the three months ended June 29, 2025, pre-tax restructuring charges were $1.3 million, restructuring related charges were $3.5 million, and product optimization charges were $2.6 million. For the six months ended June 30, 2026, pre-tax restructuring charges were $17.1 million and restructuring related charges were $21.9 million, partially offset by a benefit from product rationalization charges of $0.1 million. For the six months ended June 29, 2025, pre-tax restructuring charges were $2.7 million, restructuring related charges were $8.2 million, and product optimization charges were $2.6 million. B. Acquisition, integration and divestiture related items – For the three and six months ended June 30, 2026, these charges primarily related to the acquisition of the Vascular Intervention business of BIOTRONIK SE & Co. KG. For the three months ended June 30, 2026 these charges included acquisition and integration costs of $8.9 million. For the six months ended June 30, 2026 these charges included acquisition and integration costs of $16.7 million and inventory step up costs of $8.0 million. For the three and six months ended June 29, 2025, these charges primarily related to the acquisition the Vascular Intervention business of BIOTRONIK SE & Co. KG and changes in the estimated fair value of our contingent consideration liabilities. For the three months ended June 29, 2025 the charges included acquisition and integration costs of $15.8 million, which were offset by a benefit of $59.7 million related to non-designated foreign currency forward contracts. For the six months ended June 29, 2025 the charges included acquisition and integration costs of $22.1 million, which were offset by a benefit of $82.2 million related to non-designated foreign currency forward contracts. C. Other – For the three and six months ended June 30, 2026, other items included a benefit from a litigation settlement of $25.0 million partially offset by legal and advisory fees incurred in response to an activist investor campaign of $3.6 million, a loss on extinguishment of debt of $1.2 million, and charges incurred in connection with the credit agreement refinancing of $1.0 million. For the three and six months ended June 29, 2025, other items included expenses associated with prior year tax matters. Appendix B Tickmarks
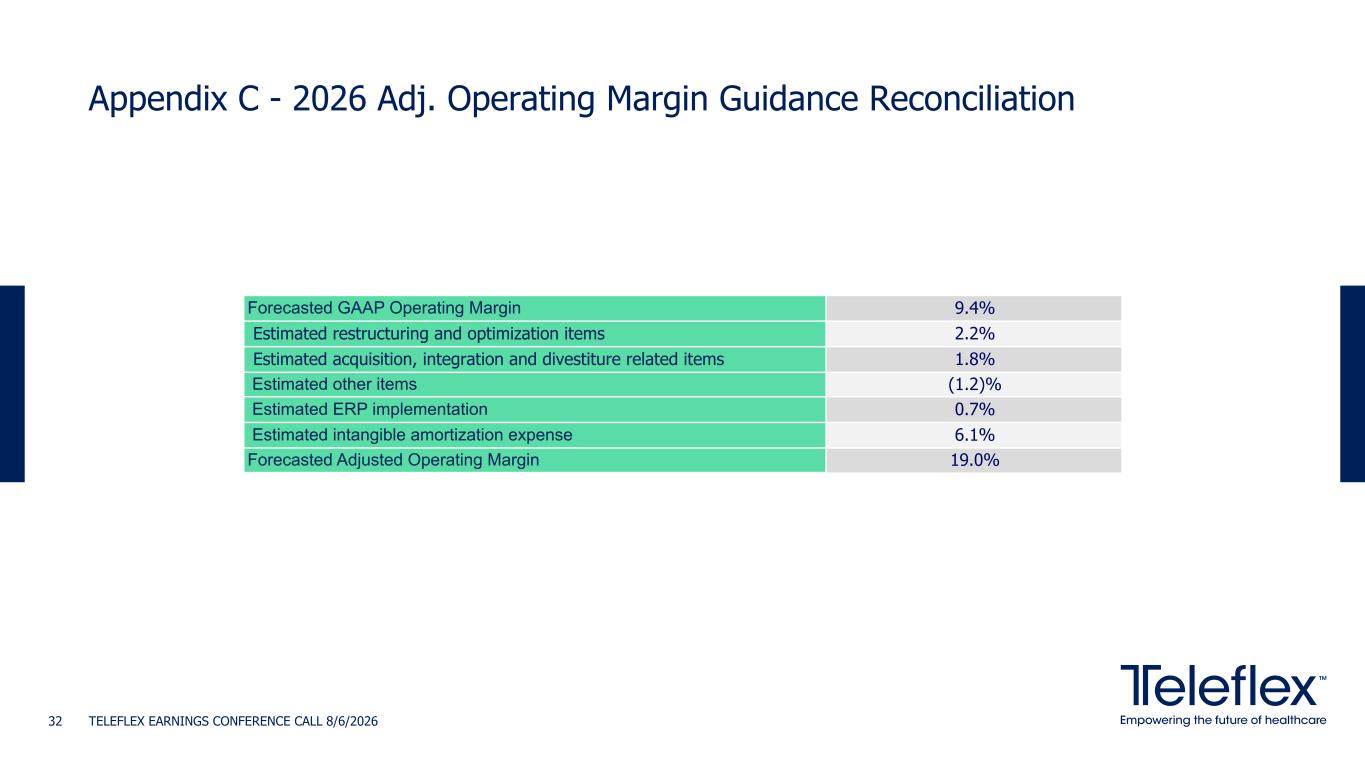
Appendix C - 2026 Adj. Operating Margin Guidance Reconciliation TELEFLEX EARNINGS CONFERENCE CALL 8/6/202632 Forecasted GAAP Operating Margin 9.4% Estimated restructuring and optimization items 2.2% Estimated acquisition, integration and divestiture related items 1.8% Estimated other items (1.2)% Estimated ERP implementation 0.7% Estimated intangible amortization expense 6.1% Forecasted Adjusted Operating Margin 19.0%
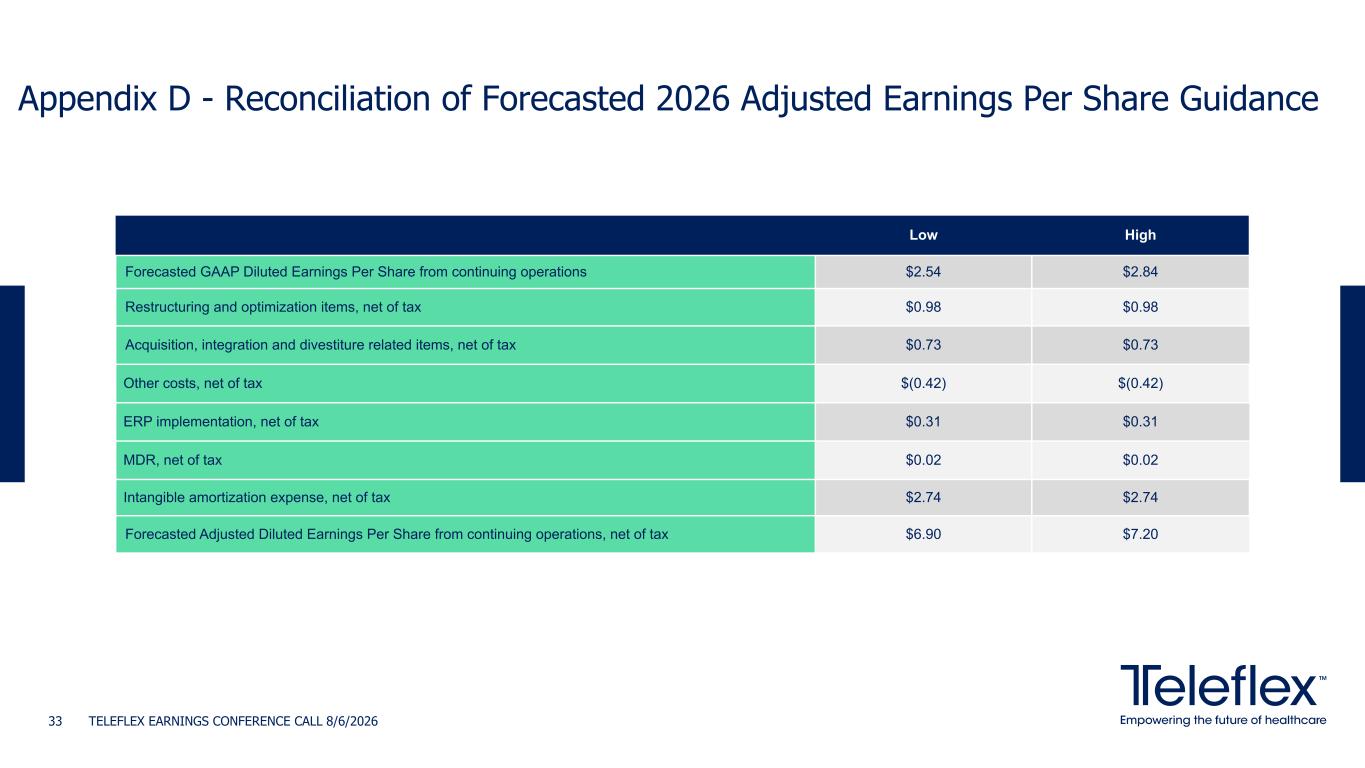
Appendix D - Reconciliation of Forecasted 2026 Adjusted Earnings Per Share Guidance TELEFLEX EARNINGS CONFERENCE CALL 8/6/202633 Low High Forecasted GAAP Diluted Earnings Per Share from continuing operations $2.54 $2.84 Restructuring and optimization items, net of tax $0.98 $0.98 Acquisition, integration and divestiture related items, net of tax $0.73 $0.73 Other costs, net of tax $(0.42) $(0.42) ERP implementation, net of tax $0.31 $0.31 MDR, net of tax $0.02 $0.02 Intangible amortization expense, net of tax $2.74 $2.74 Forecasted Adjusted Diluted Earnings Per Share from continuing operations, net of tax $6.90 $7.20
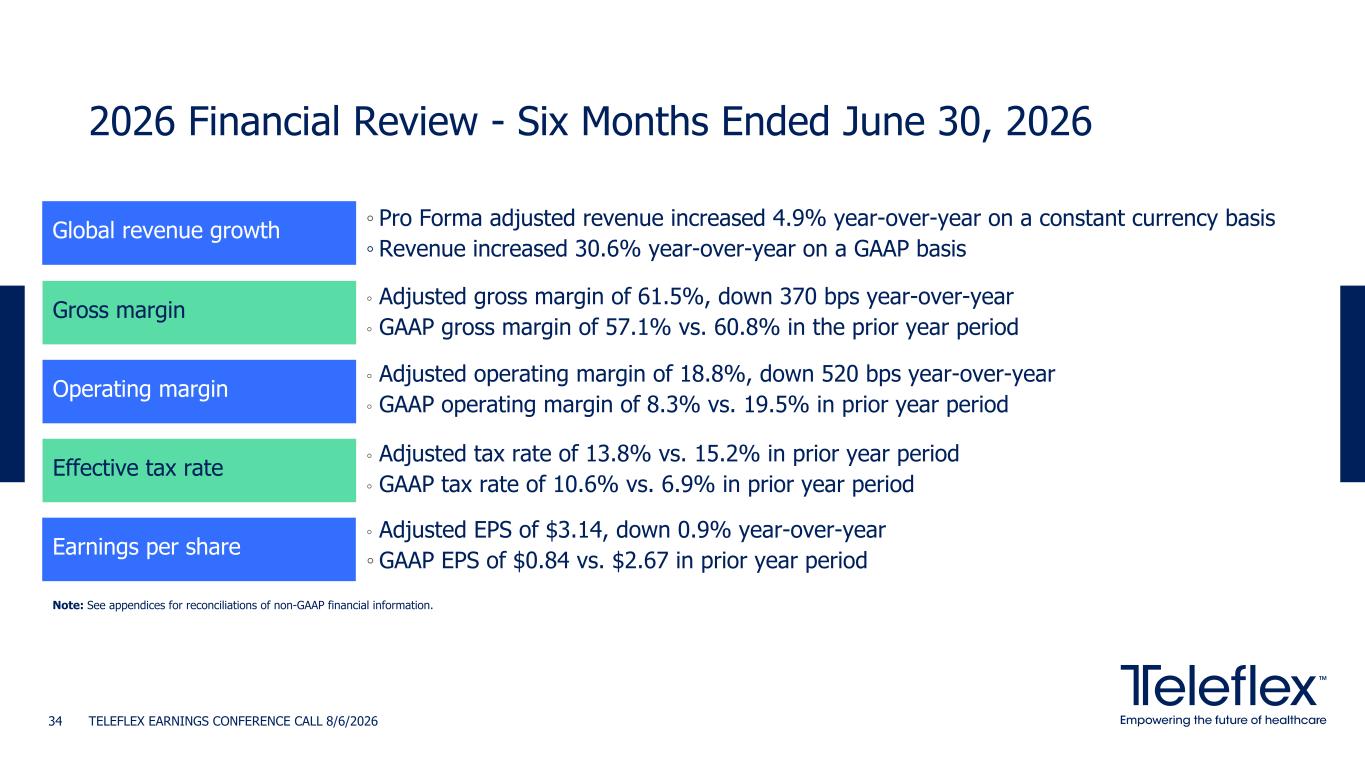
2026 Financial Review - Six Months Ended June 30, 2026 TELEFLEX EARNINGS CONFERENCE CALL 8/6/202634 Gross margin Operating margin Effective tax rate Earnings per share ◦ Adjusted gross margin of 61.5%, down 370 bps year-over-year ◦ GAAP gross margin of 57.1% vs. 60.8% in the prior year period ◦ Adjusted operating margin of 18.8%, down 520 bps year-over-year ◦ GAAP operating margin of 8.3% vs. 19.5% in prior year period ◦ Adjusted tax rate of 13.8% vs. 15.2% in prior year period ◦ GAAP tax rate of 10.6% vs. 6.9% in prior year period ◦ Adjusted EPS of $3.14, down 0.9% year-over-year ◦ GAAP EPS of $0.84 vs. $2.67 in prior year period Global revenue growth ◦ Pro Forma adjusted revenue increased 4.9% year-over-year on a constant currency basis ◦ Revenue increased 30.6% year-over-year on a GAAP basis Note: See appendices for reconciliations of non-GAAP financial information.
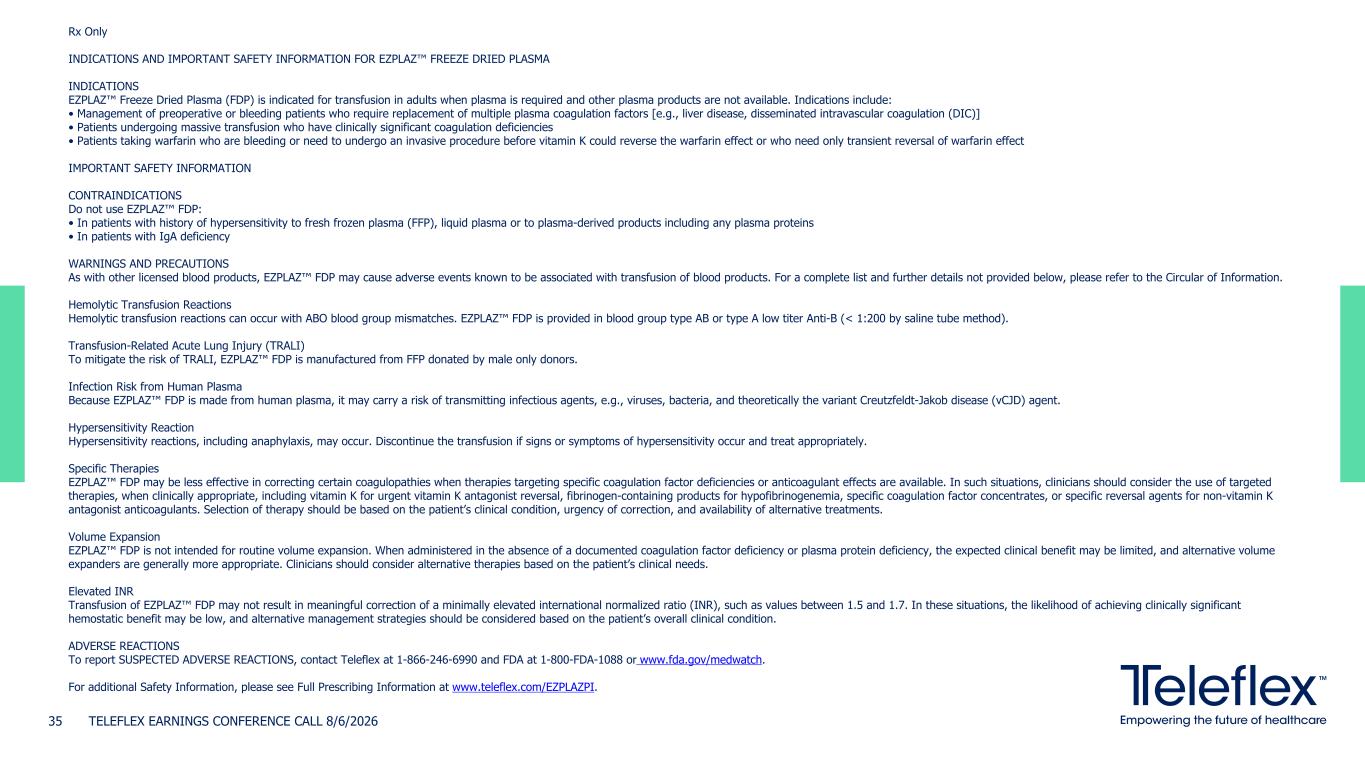
Rx Only INDICATIONS AND IMPORTANT SAFETY INFORMATION FOR EZPLAZ™ FREEZE DRIED PLASMA INDICATIONS EZPLAZ™ Freeze Dried Plasma (FDP) is indicated for transfusion in adults when plasma is required and other plasma products are not available. Indications include: • Management of preoperative or bleeding patients who require replacement of multiple plasma coagulation factors [e.g., liver disease, disseminated intravascular coagulation (DIC)] • Patients undergoing massive transfusion who have clinically significant coagulation deficiencies • Patients taking warfarin who are bleeding or need to undergo an invasive procedure before vitamin K could reverse the warfarin effect or who need only transient reversal of warfarin effect IMPORTANT SAFETY INFORMATION CONTRAINDICATIONS Do not use EZPLAZ™ FDP: • In patients with history of hypersensitivity to fresh frozen plasma (FFP), liquid plasma or to plasma-derived products including any plasma proteins • In patients with IgA deficiency WARNINGS AND PRECAUTIONS As with other licensed blood products, EZPLAZ™ FDP may cause adverse events known to be associated with transfusion of blood products. For a complete list and further details not provided below, please refer to the Circular of Information. Hemolytic Transfusion Reactions Hemolytic transfusion reactions can occur with ABO blood group mismatches. EZPLAZ™ FDP is provided in blood group type AB or type A low titer Anti-B (< 1:200 by saline tube method). Transfusion-Related Acute Lung Injury (TRALI) To mitigate the risk of TRALI, EZPLAZ™ FDP is manufactured from FFP donated by male only donors. Infection Risk from Human Plasma Because EZPLAZ™ FDP is made from human plasma, it may carry a risk of transmitting infectious agents, e.g., viruses, bacteria, and theoretically the variant Creutzfeldt-Jakob disease (vCJD) agent. Hypersensitivity Reaction Hypersensitivity reactions, including anaphylaxis, may occur. Discontinue the transfusion if signs or symptoms of hypersensitivity occur and treat appropriately. Specific Therapies EZPLAZ™ FDP may be less effective in correcting certain coagulopathies when therapies targeting specific coagulation factor deficiencies or anticoagulant effects are available. In such situations, clinicians should consider the use of targeted therapies, when clinically appropriate, including vitamin K for urgent vitamin K antagonist reversal, fibrinogen-containing products for hypofibrinogenemia, specific coagulation factor concentrates, or specific reversal agents for non-vitamin K antagonist anticoagulants. Selection of therapy should be based on the patient’s clinical condition, urgency of correction, and availability of alternative treatments. Volume Expansion EZPLAZ™ FDP is not intended for routine volume expansion. When administered in the absence of a documented coagulation factor deficiency or plasma protein deficiency, the expected clinical benefit may be limited, and alternative volume expanders are generally more appropriate. Clinicians should consider alternative therapies based on the patient’s clinical needs. Elevated INR Transfusion of EZPLAZ™ FDP may not result in meaningful correction of a minimally elevated international normalized ratio (INR), such as values between 1.5 and 1.7. In these situations, the likelihood of achieving clinically significant hemostatic benefit may be low, and alternative management strategies should be considered based on the patient’s overall clinical condition. ADVERSE REACTIONS To report SUSPECTED ADVERSE REACTIONS, contact Teleflex at 1-866-246-6990 and FDA at 1-800-FDA-1088 or www.fda.gov/medwatch. For additional Safety Information, please see Full Prescribing Information at www.teleflex.com/EZPLAZPI. TELEFLEX EARNINGS CONFERENCE CALL 8/6/202635