
P L E A S E R E F E R T O S L I D E 2 F O R T H E S A F E H A R B O R L A N G U A G E R E G A R D I N G T H I S P R E S E N T A T I O N1 2nd Quarter 2026 Earnings Supplement August 2026
P L E A S E R E F E R T O S L I D E 2 F O R T H E S A F E H A R B O R L A N G U A G E R E G A R D I N G T H I S P R E S E N T A T I O N2 Safe Harbor Statement This presentation contains forward-looking statements within the meaning of the Private Securities Litigation Reform Act of 1995. We intend such forward-looking statements to be covered by the safe harbor provisions for forward-looking statements contained in Section 27A of the Securities Act of 1933, as amended, and Section 21E of the Securities Exchange Act of 1934, as amended. All statements contained in this presentation other than statements of historical fact, including, without limitation, statements regarding our financial outlook for the third quarter and full year 2026, including the impact of our sales season and client launches; our anticipated number of clients and covered lives for 2026; our expected utilization rates and mix; the demand for our solutions; our expectations for our selling season for 2027 launches; our positioning to successfully manage economic uncertainty on our business; the timing of client decisions; our ability to retain existing clients and acquire new clients; and our business strategy, plans, goals and expectations concerning our market position, future operations, and other financial and operating information. The words “anticipates,” “assumes,” “believe,” “contemplate,” “continues, ” “could,” “estimates,” “expects,” “future,” “intends,” “may,” “plans,” “predict,” “potential,” “project,” “seeks,” “should,” “target,” “will,” and the negative of these or similar expressions and phrases are intended to identify forward-looking statements, though not all forward-looking statements use these words or expressions. Forward-looking statements are neither promises nor guarantees, but involve known and unknown risks, uncertainties and other important factors that may cause our actual results, performance or achievements to be materially different from any future results, performance or achievements expressed or implied by the forward-looking statements. These risks include, without limitation, failure to meet our publicly announced guidance or other expectations about our business; competition in the market in which we operate; our history of operating losses and ability to sustain profitability; unfavorable conditions in our industry or the United States economy; our limited operating history and the difficulty in predicting our future results of operations; our ability to attract and retain clients and increase the adoption of services within our client base; the loss of any of our largest client accounts; changes in the technology industry; changes or developments in the health insurance market; negative publicity in the health benefits industry; lags, failures or security breaches in our computer systems or those of our vendors; a significant change in the utilization of our solutions; our ability to offer high-quality support; positive references from our existing clients; our ability to develop and expand our marketing and sales capabilities; the rate of growth of our future revenue; the accuracy of the estimates and assumptions we use to determine the size of target markets; our ability to successfully manage our growth; reductions in employee benefits spending; seasonal fluctuations in our sales; the adoption of new solutions and services by our clients or members; our ability to innovate and develop new offerings; our ability to adapt and respond to the changing medical landscape, regulations, and client needs, requirements or preferences; our ability to maintain and enhance our brand; our ability to attract and retain members of our management team, key employees, or other qualified personnel; risks related to any litigation against us; our ability to maintain our Center of Excellence network of healthcare providers; our strategic relationships with and monitoring of third parties; our ability to maintain our pharmacy distribution network if there is a disruption to our network or its associated supply chains; our relationship with key pharmacy program partners or any decline in rebates provided by them; our ability to maintain our relationships with benefits consultants; exposure to credit risk from our members; risks related to government regulation; risks related to our business with government entities; our ability to protect our intellectual property rights; risks related to acquisitions, strategic investments, or partnerships; federal tax reform and changes to our effective tax rate; the imposition of state and local state taxes; our ability to utilize a portion of our net operating loss or research tax credit carryforwards; our ability to develop or maintain effective internal control over financial reporting; and our ability to adapt and respond to the changing SEC or stakeholder expectations regarding environmental, social and governance practices. For a detailed discussion of these and other risk factors, please refer to our filings with the Securities and Exchange Commission (the “SEC”), including in the section entitled “Risk Factors” in our Annual Report on Form 10-K for the fiscal year ended December 31, 2025, and subsequent reports that we file with the SEC, which are available at http://investors.progyny.com and on the SEC’s website at https://www.sec.gov. Forward-looking statements represent our management’s beliefs and assumptions only as of the date of this presentation. Our actual future results could differ materially from what we expect. Except as required by law, we assume no obligation to update these forward-looking statements publicly, or to update the reasons. Non-GAAP Financial Measures: In addition to disclosing financial measures prepared in accordance with U.S. generally accepted accounting principles (“GAAP”), this presentation and the accompanying tables include the non-GAAP financial measures Adjusted EBITDA, Adjusted EBITDA margin, and Adjusted earnings per diluted share. Adjusted EBITDA, Adjusted EBITDA margin, and Adjusted earnings per diluted share are supplemental financial measures that are not required by, or presented in accordance with, GAAP. We believe that these non-GAAP measures, when taken together with our GAAP financial results, provide meaningful supplemental information regarding our operating performance and facilitates internal comparisons of our historical operating performance on a more consistent basis by excluding certain items that may not be indicative of our business, results of operations or outlook. In particular, we believe that the use of Adjusted EBITDA, Adjusted EBITDA margin, and Adjusted earnings per diluted share are helpful to our investors as they are measures used by management in assessing the health of our business, determining incentive compensation, evaluating our operating performance, and for internal planning and forecasting purposes. Adjusted EBITDA, Adjusted EBITDA margin, and Adjusted earnings per diluted share are presented for supplemental informational purposes only, have limitations as analytical tools and should not be considered in isolation or as a substitute for financial information presented in accordance with GAAP. Some of the limitations of Adjusted EBITDA, Adjusted EBITDA margin, and Adjusted earnings per diluted share include: (1) it does not properly reflect capital commitments to be paid in the future; (2) although depreciation and amortization are non-cash charges, the underlying assets may need to be replaced and Adjusted EBITDA does not reflect these capital expenditures; (3) it does not consider the impact of stock-based compensation expense; (4) it does not reflect other non-operating income and expenses, including interest and other income, net; and (5) it does not reflect tax payments that may represent a reduction in cash available to us. In addition, our non-GAAP measures may not be comparable to similarly titled measures of other companies because they may not calculate such measures in the same manner as we calculate these measures, limiting their usefulness as comparative measures. Because of these limitations, when evaluating our performance, you should consider Adjusted EBITDA, Adjusted EBITDA margin, and Adjusted earnings per diluted share alongside other financial performance measures, including our net income, gross margin, and our other GAAP results. We calculate Adjusted EBITDA as net income, adjusted to exclude depreciation and amortization; stock-based compensation expense; interest and other income, net; and provision for income taxes. We calculate Adjusted EBITDA margin as Adjusted EBITDA divided by revenue. We calculate Adjusted earnings per diluted share as net income per diluted share excluding the impact of stock-based compensation, adjusted for the associated impact of taxes. Please see the Appendix “Reconciliation of GAAP to Non-GAAP Financial Measures” and “Reconciliation of Non-GAAP Financial Guidance” in this presentation.
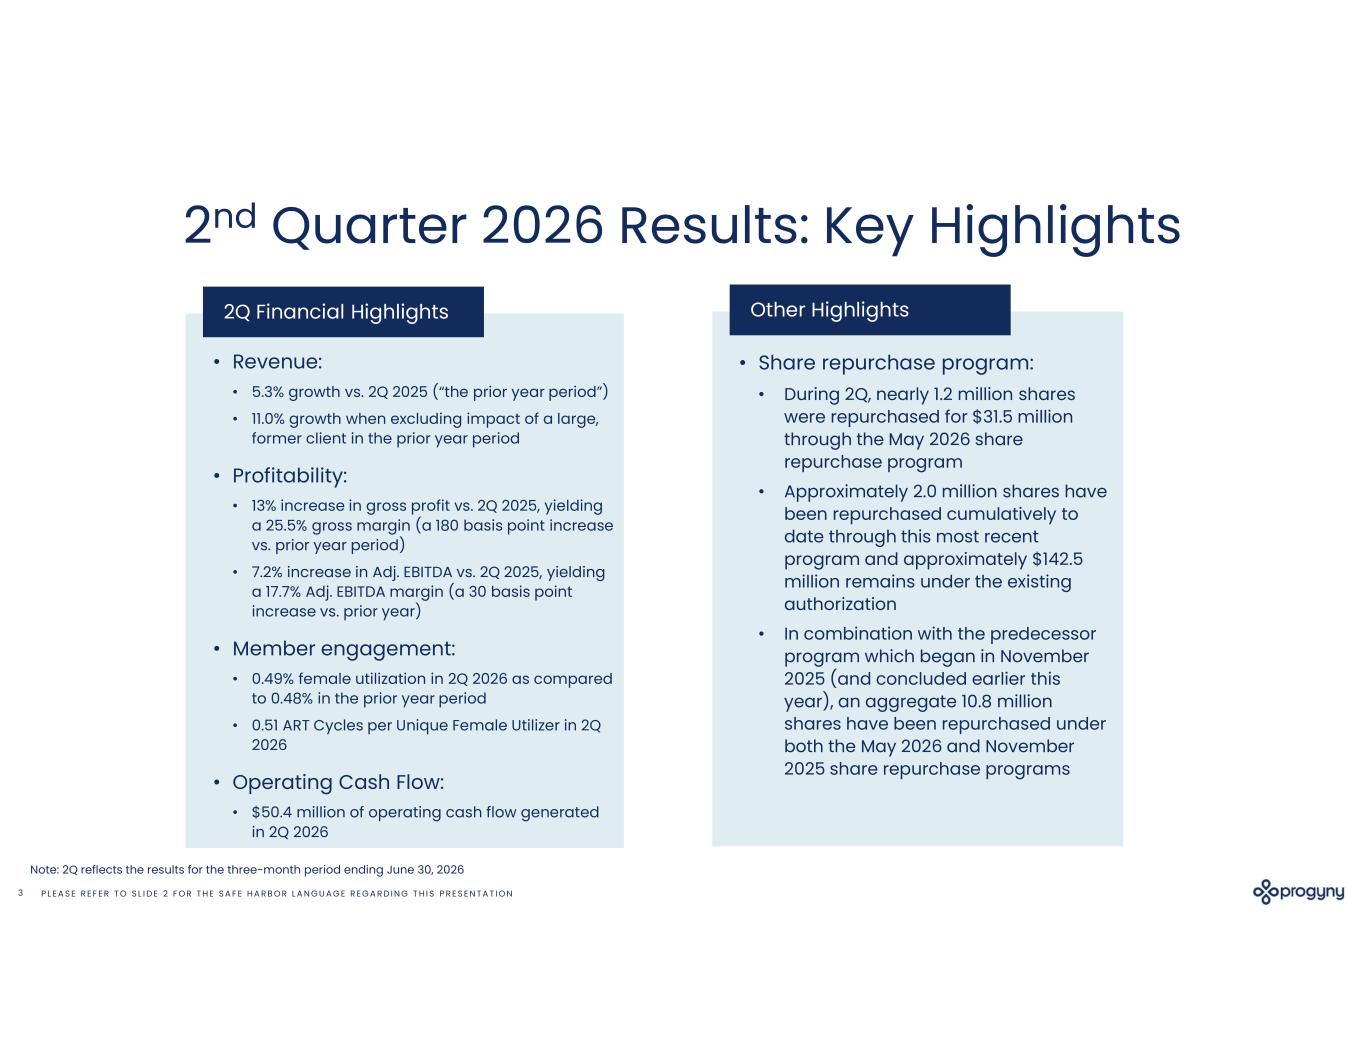
P L E A S E R E F E R T O S L I D E 2 F O R T H E S A F E H A R B O R L A N G U A G E R E G A R D I N G T H I S P R E S E N T A T I O N3 2nd Quarter 2026 Results: Key Highlights 2Q Financial Highlights • Revenue: • 5.3% growth vs. 2Q 2025 (“the prior year period”) • 11.0% growth when excluding impact of a large, former client in the prior year period • Profitability: • 13% increase in gross profit vs. 2Q 2025, yielding a 25.5% gross margin (a 180 basis point increase vs. prior year period) • 7.2% increase in Adj. EBITDA vs. 2Q 2025, yielding a 17.7% Adj. EBITDA margin (a 30 basis point increase vs. prior year) • Member engagement: • 0.49% female utilization in 2Q 2026 as compared to 0.48% in the prior year period • 0.51 ART Cycles per Unique Female Utilizer in 2Q 2026 • Operating Cash Flow: • $50.4 million of operating cash flow generated in 2Q 2026 Other Highlights • Share repurchase program: • During 2Q, nearly 1.2 million shares were repurchased for $31.5 million through the May 2026 share repurchase program • Approximately 2.0 million shares have been repurchased cumulatively to date through this most recent program and approximately $142.5 million remains under the existing authorization • In combination with the predecessor program which began in November 2025 (and concluded earlier this year), an aggregate 10.8 million shares have been repurchased under both the May 2026 and November 2025 share repurchase programs Note: 2Q reflects the results for the three-month period ending June 30, 2026
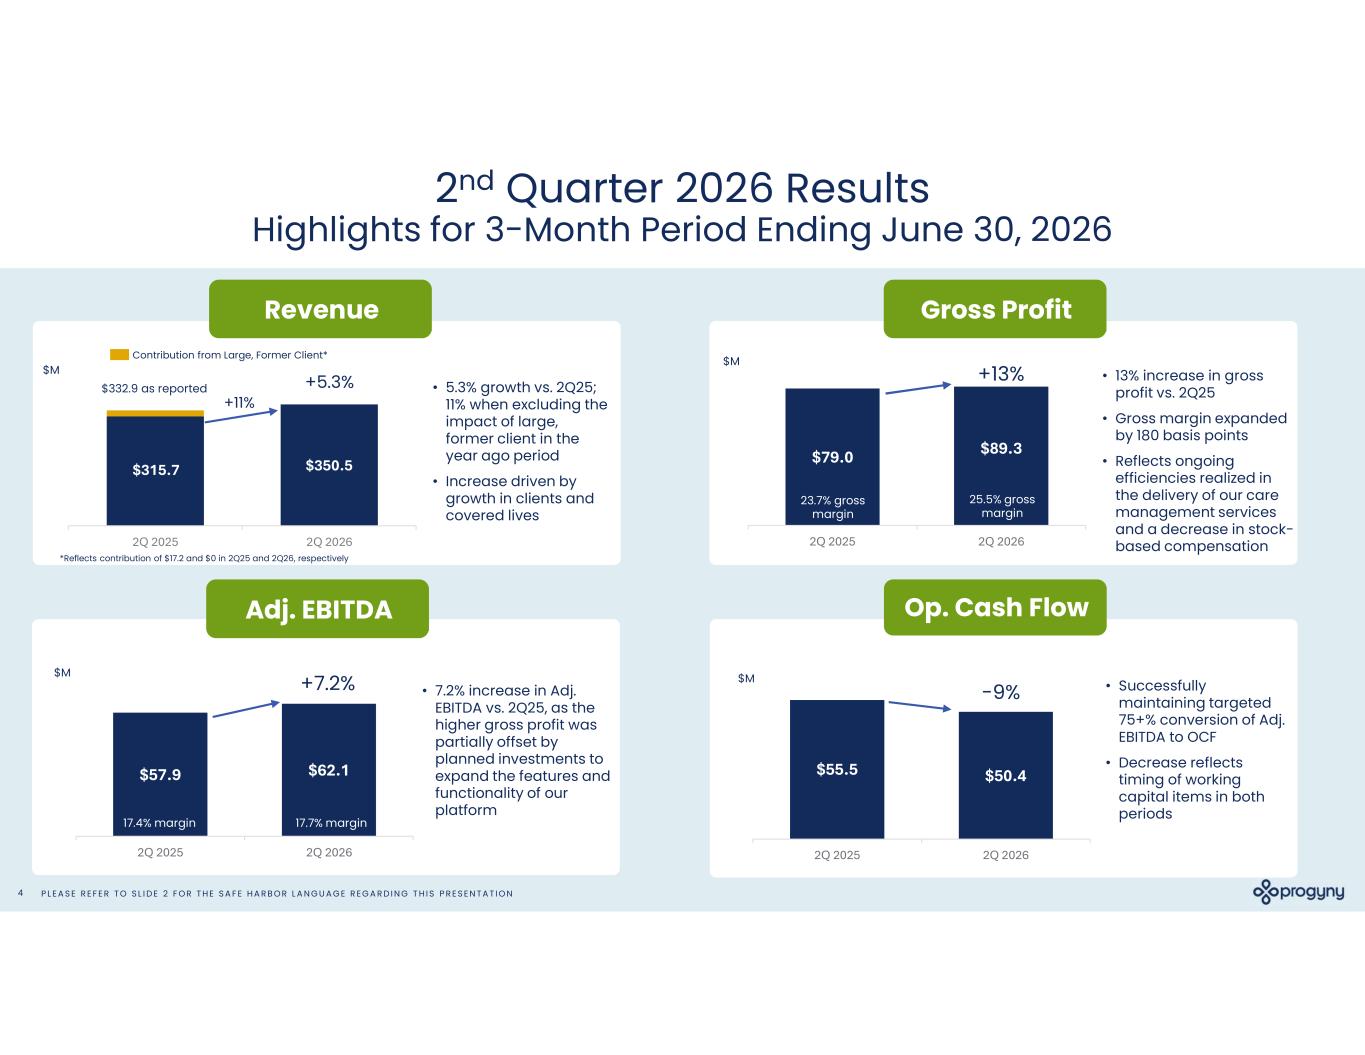
P L E A S E R E F E R T O S L I D E 2 F O R T H E S A F E H A R B O R L A N G U A G E R E G A R D I N G T H I S P R E S E N T A T I O N4 2nd Quarter 2026 Results Highlights for 3-Month Period Ending June 30, 2026 Revenue Op. Cash Flow $350.5 2Q 2025 2Q 2026 • 5.3% growth vs. 2Q25; 11% when excluding the impact of large, former client in the year ago period • Increase driven by growth in clients and covered lives Contribution from Large, Former Client* $M Adj. EBITDA • 7.2% increase in Adj. EBITDA vs. 2Q25, as the higher gross profit was partially offset by planned investments to expand the features and functionality of our platform $57.9 $62.1 2Q 2025 2Q 2026 $M 17.4% margin 17.7% margin $315.7 $55.5 $50.4 2Q 2025 2Q 2026 $M • Successfully maintaining targeted 75+% conversion of Adj. EBITDA to OCF • Decrease reflects timing of working capital items in both periods Gross Profit • 13% increase in gross profit vs. 2Q25 • Gross margin expanded by 180 basis points • Reflects ongoing efficiencies realized in the delivery of our care management services and a decrease in stock- based compensation $79.0 $89.3 2Q 2025 2Q 2026 $M 23.7% gross margin 25.5% gross margin $332.9 as reported +11% *Reflects contribution of $17.2 and $0 in 2Q25 and 2Q26, respectively +7.2% +5.3% +13% -9%
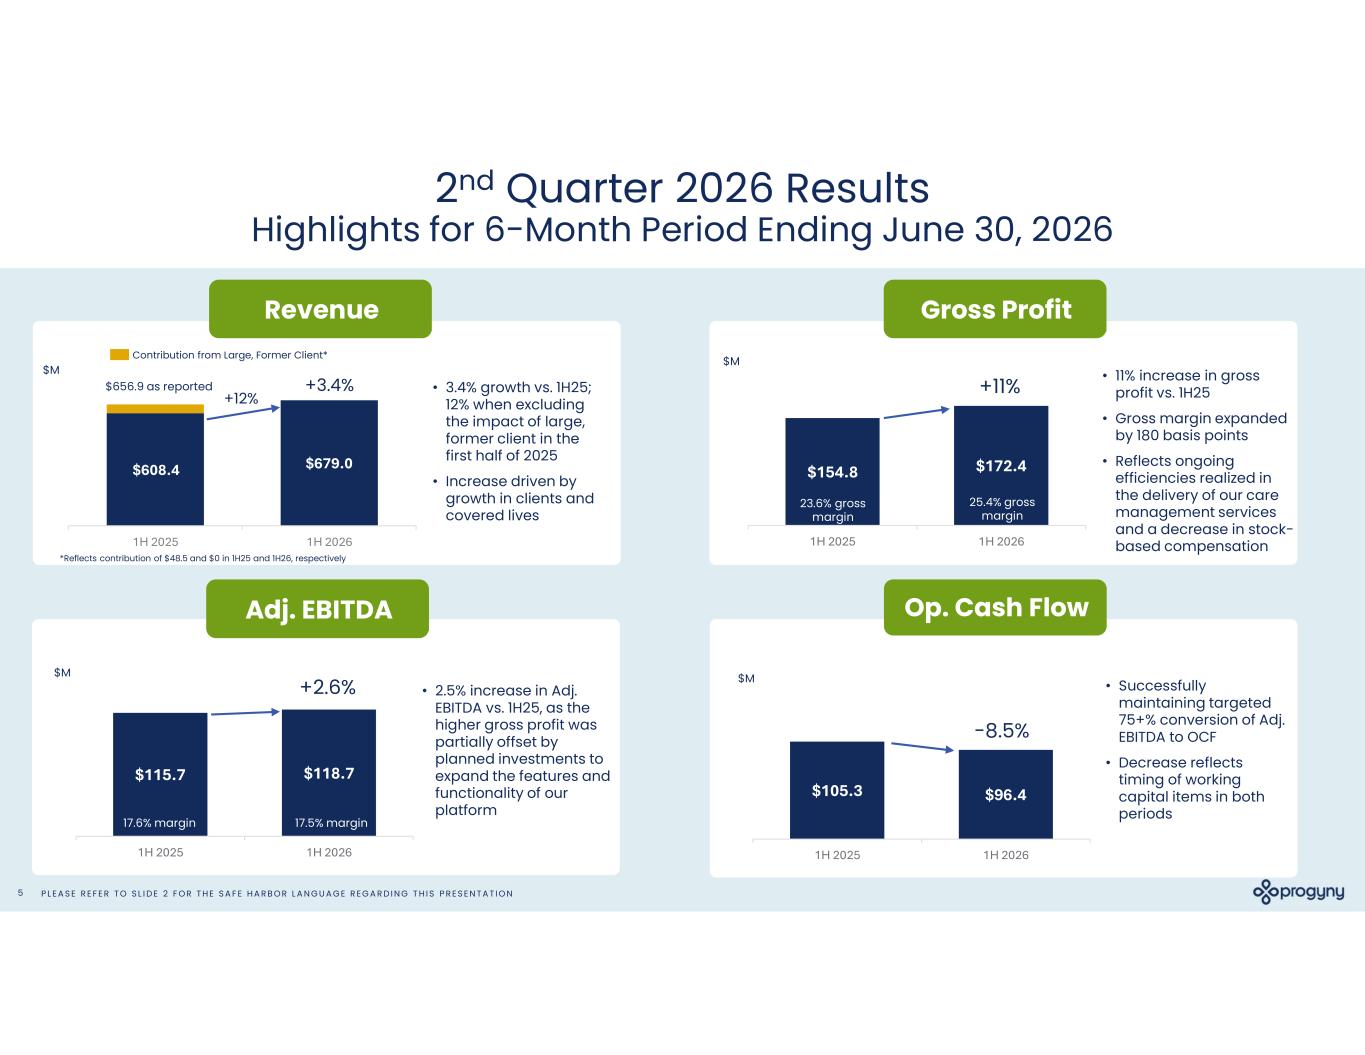
P L E A S E R E F E R T O S L I D E 2 F O R T H E S A F E H A R B O R L A N G U A G E R E G A R D I N G T H I S P R E S E N T A T I O N5 2nd Quarter 2026 Results Highlights for 6-Month Period Ending June 30, 2026 Revenue Op. Cash Flow $679.0 1H 2025 1H 2026 • 3.4% growth vs. 1H25; 12% when excluding the impact of large, former client in the first half of 2025 • Increase driven by growth in clients and covered lives Contribution from Large, Former Client* $M Adj. EBITDA • 2.5% increase in Adj. EBITDA vs. 1H25, as the higher gross profit was partially offset by planned investments to expand the features and functionality of our platform $115.7 $118.7 1H 2025 1H 2026 $M 17.6% margin 17.5% margin $608.4 $105.3 $96.4 1H 2025 1H 2026 $M • Successfully maintaining targeted 75+% conversion of Adj. EBITDA to OCF • Decrease reflects timing of working capital items in both periods Gross Profit • 11% increase in gross profit vs. 1H25 • Gross margin expanded by 180 basis points • Reflects ongoing efficiencies realized in the delivery of our care management services and a decrease in stock- based compensation $154.8 $172.4 1H 2025 1H 2026 $M 23.6% gross margin 25.4% gross margin $656.9 as reported +12% *Reflects contribution of $48.5 and $0 in 1H25 and 1H26, respectively +2.6% +3.4% +11% -8.5%
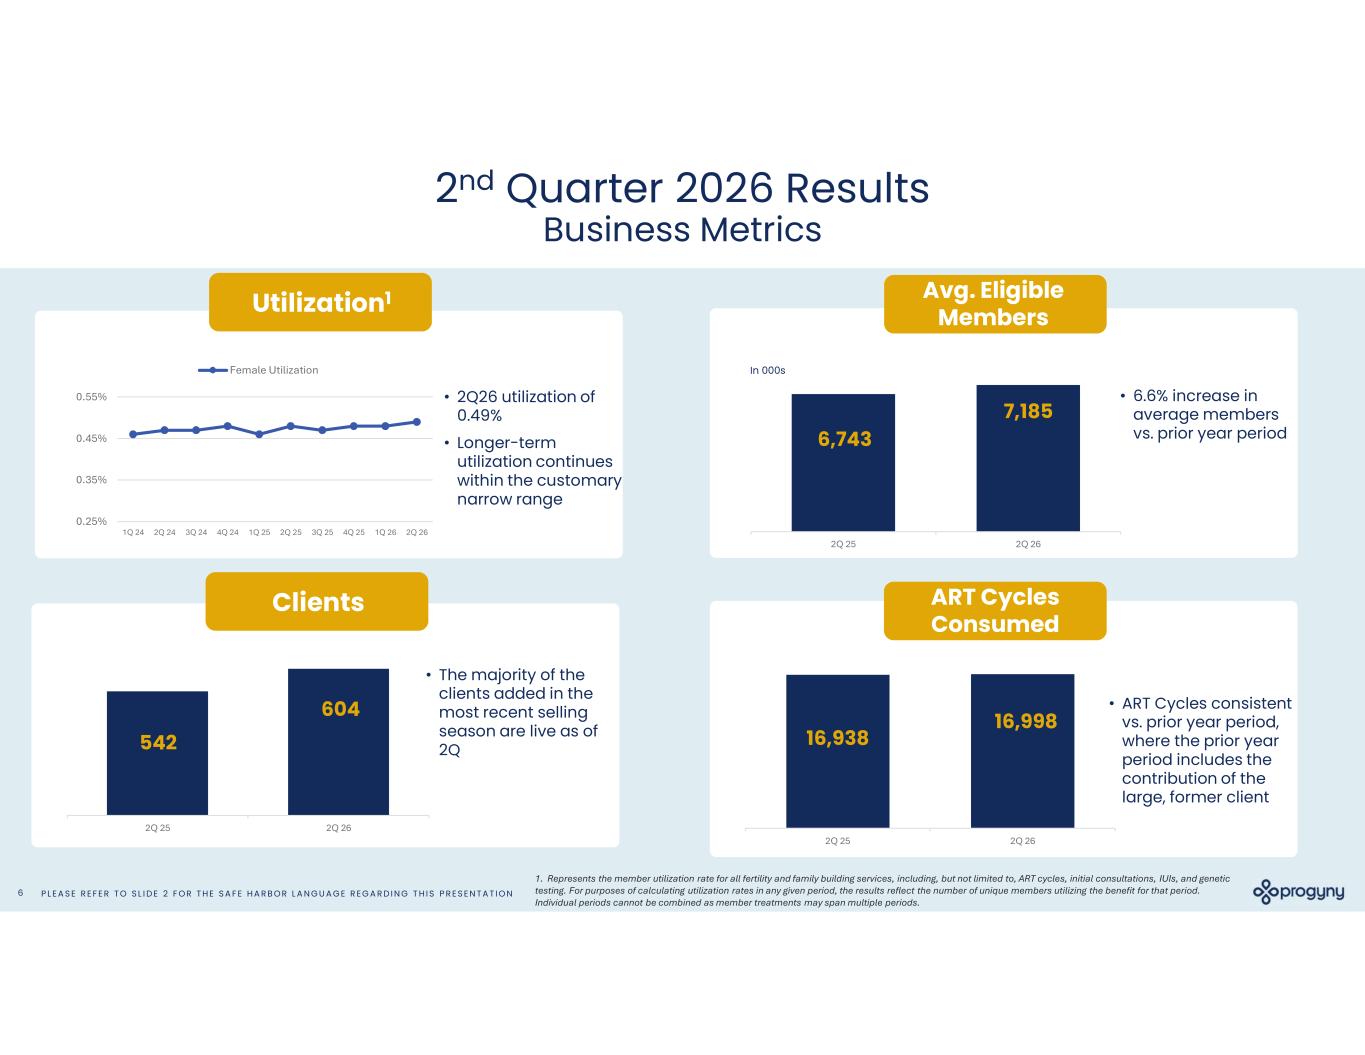
P L E A S E R E F E R T O S L I D E 2 F O R T H E S A F E H A R B O R L A N G U A G E R E G A R D I N G T H I S P R E S E N T A T I O N6 2nd Quarter 2026 Results Business Metrics ART Cycles Consumed Clients 2Q 25 2Q 26 2Q 25 2Q 26 Utilization1 • 2Q26 utilization of 0.49% • Longer-term utilization continues within the customary narrow range 0.25% 0.35% 0.45% 0.55% 1Q 24 2Q 24 3Q 24 4Q 24 1Q 25 2Q 25 3Q 25 4Q 25 1Q 26 2Q 26 Female Utilization 16,998604 542 16,938 • The majority of the clients added in the most recent selling season are live as of 2Q • ART Cycles consistent vs. prior year period, where the prior year period includes the contribution of the large, former client In 000s 2Q 25 2Q 26 7,185 6,743 • 6.6% increase in average members vs. prior year period 1. Represents the member utilization rate for all fertility and family building services, including, but not limited to, ART cycles, initial consultations, IUIs, and genetic testing. For purposes of calculating utilization rates in any given period, the results reflect the number of unique members utilizing the benefit for that period. Individual periods cannot be combined as member treatments may span multiple periods. Avg. Eligible Members
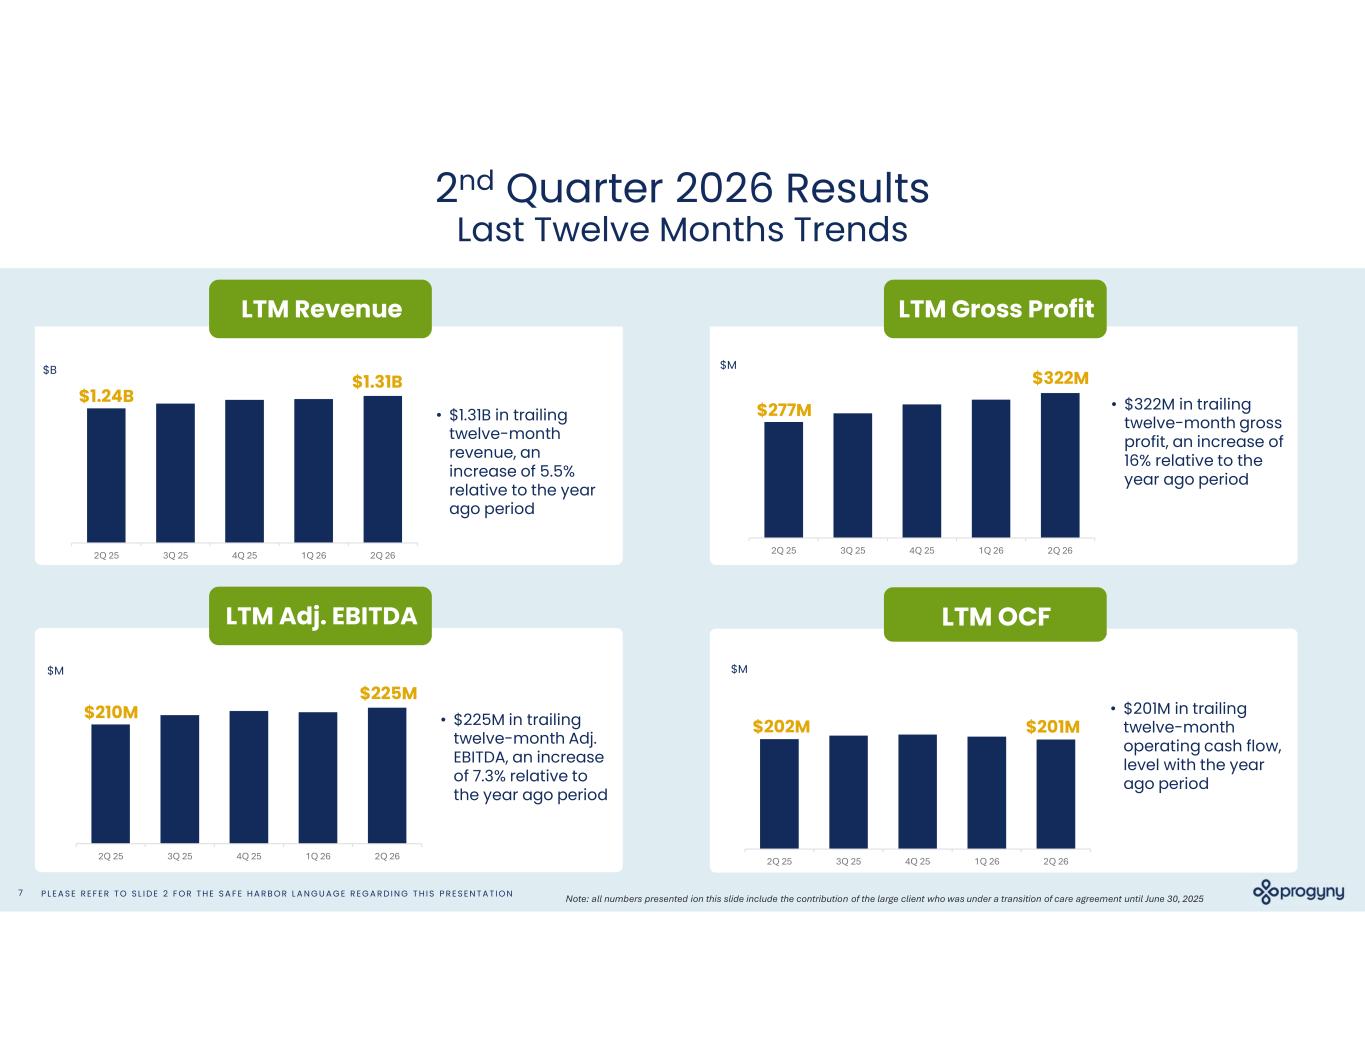
P L E A S E R E F E R T O S L I D E 2 F O R T H E S A F E H A R B O R L A N G U A G E R E G A R D I N G T H I S P R E S E N T A T I O N7 2nd Quarter 2026 Results Last Twelve Months Trends LTM Gross Profit LTM Adj. EBITDA LTM OCF • $1.31B in trailing twelve-month revenue, an increase of 5.5% relative to the year ago period LTM Revenue 2Q 25 3Q 25 4Q 25 1Q 26 2Q 26 $B 2Q 25 3Q 25 4Q 25 1Q 26 2Q 26 • $201M in trailing twelve-month operating cash flow, level with the year ago period $M • $322M in trailing twelve-month gross profit, an increase of 16% relative to the year ago period 2Q 25 3Q 25 4Q 25 1Q 26 2Q 26 $M • $225M in trailing twelve-month Adj. EBITDA, an increase of 7.3% relative to the year ago period 2Q 25 3Q 25 4Q 25 1Q 26 2Q 26 $M $1.31B $225M $322M $201M $1.24B $210M $277M $202M Note: all numbers presented ion this slide include the contribution of the large client who was under a transition of care agreement until June 30, 2025
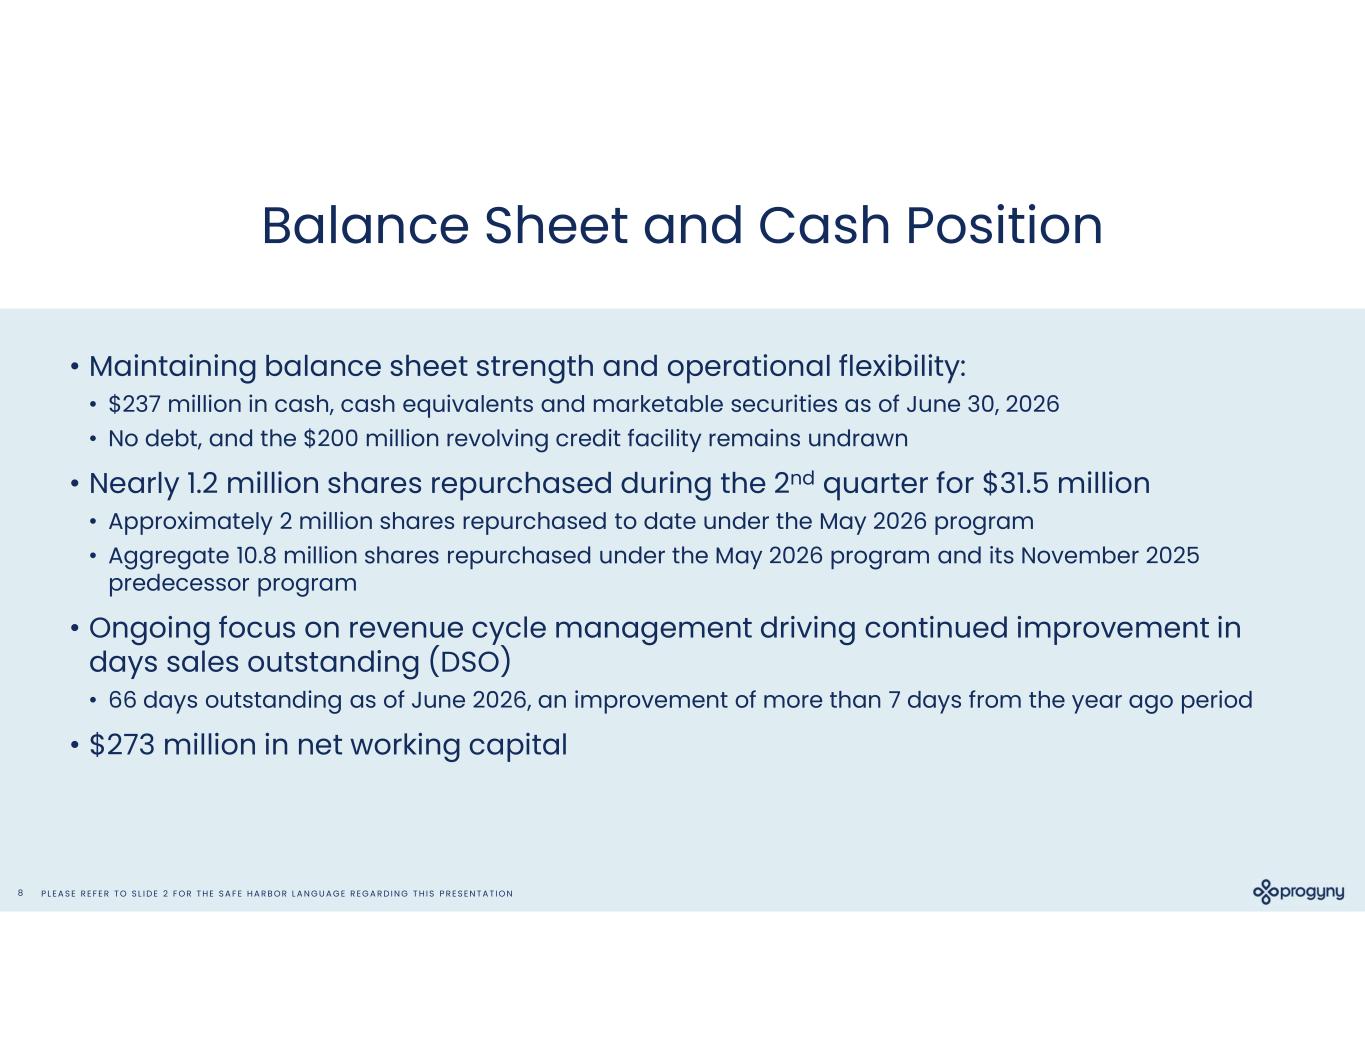
P L E A S E R E F E R T O S L I D E 2 F O R T H E S A F E H A R B O R L A N G U A G E R E G A R D I N G T H I S P R E S E N T A T I O N8 Balance Sheet and Cash Position • Maintaining balance sheet strength and operational flexibility: • $237 million in cash, cash equivalents and marketable securities as of June 30, 2026 • No debt, and the $200 million revolving credit facility remains undrawn • Nearly 1.2 million shares repurchased during the 2nd quarter for $31.5 million • Approximately 2 million shares repurchased to date under the May 2026 program • Aggregate 10.8 million shares repurchased under the May 2026 program and its November 2025 predecessor program • Ongoing focus on revenue cycle management driving continued improvement in days sales outstanding (DSO) • 66 days outstanding as of June 2026, an improvement of more than 7 days from the year ago period • $273 million in net working capital
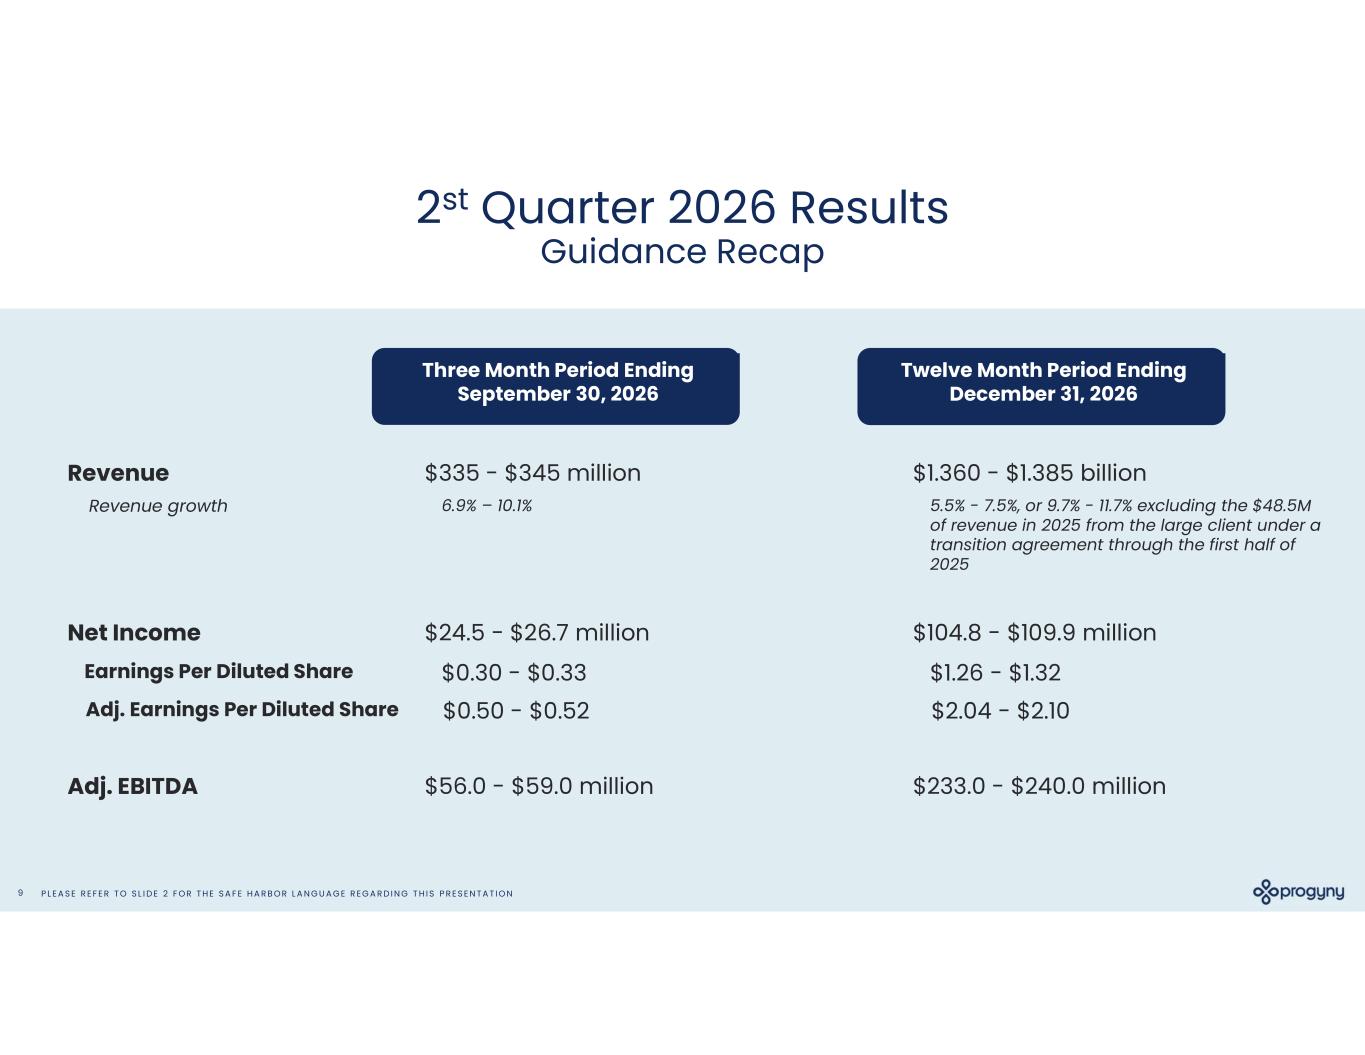
P L E A S E R E F E R T O S L I D E 2 F O R T H E S A F E H A R B O R L A N G U A G E R E G A R D I N G T H I S P R E S E N T A T I O N9 2st Quarter 2026 Results Guidance Recap Three Month Period Ending September 30, 2026 Twelve Month Period Ending December 31, 2026 Revenue Net Income Adj. EBITDA $335 - $345 million $24.5 - $26.7 million $56.0 - $59.0 million $1.360 - $1.385 billion $104.8 - $109.9 million $233.0 - $240.0 million Revenue growth 6.9% – 10.1% 5.5% - 7.5%, or 9.7% - 11.7% excluding the $48.5M of revenue in 2025 from the large client under a transition agreement through the first half of 2025 Earnings Per Diluted Share $0.30 - $0.33 $1.26 - $1.32 Adj. Earnings Per Diluted Share $0.50 - $0.52 $2.04 - $2.10

P L E A S E R E F E R T O S L I D E 2 F O R T H E S A F E H A R B O R L A N G U A G E R E G A R D I N G T H I S P R E S E N T A T I O N10 Appendix
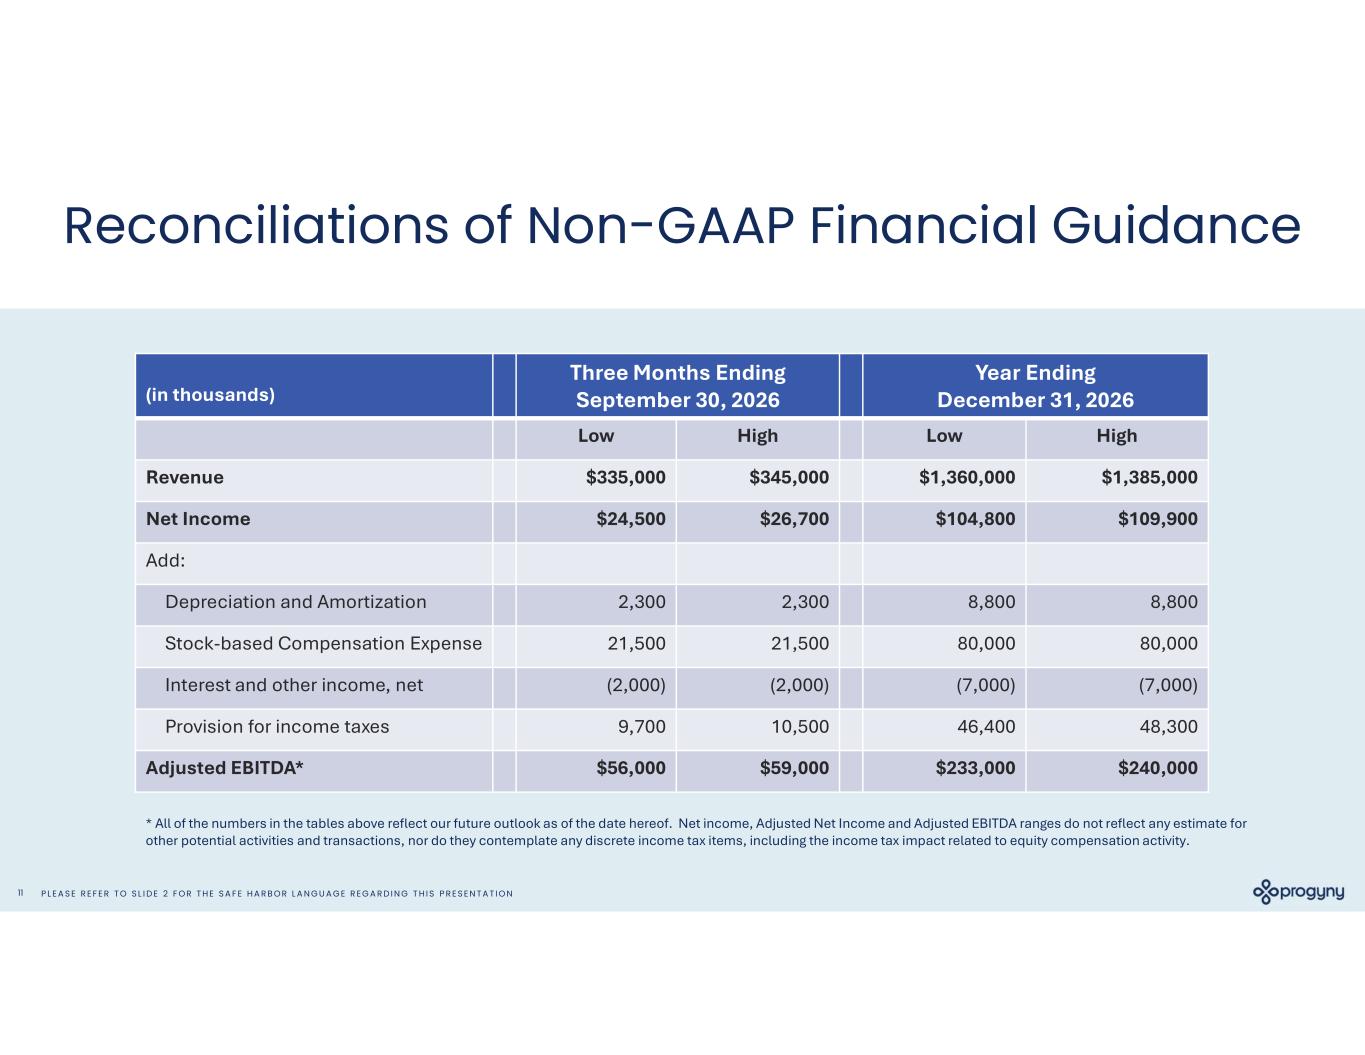
P L E A S E R E F E R T O S L I D E 2 F O R T H E S A F E H A R B O R L A N G U A G E R E G A R D I N G T H I S P R E S E N T A T I O N11 Reconciliations of Non-GAAP Financial Guidance Year Ending December 31, 2026 Three Months Ending September 30, 2026(in thousands) HighLowHighLow $1,385,000$1,360,000$345,000$335,000Revenue $109,900$104,800$26,700$24,500Net Income Add: 8,8008,8002,3002,300Depreciation and Amortization 80,00080,00021,50021,500Stock-based Compensation Expense (7,000)(7,000)(2,000)(2,000)Interest and other income, net 48,30046,40010,5009,700Provision for income taxes $240,000$233,000$59,000$56,000Adjusted EBITDA* * All of the numbers in the tables above reflect our future outlook as of the date hereof. Net income, Adjusted Net Income and Adjusted EBITDA ranges do not reflect any estimate for other potential activities and transactions, nor do they contemplate any discrete income tax items, including the income tax impact related to equity compensation activity.
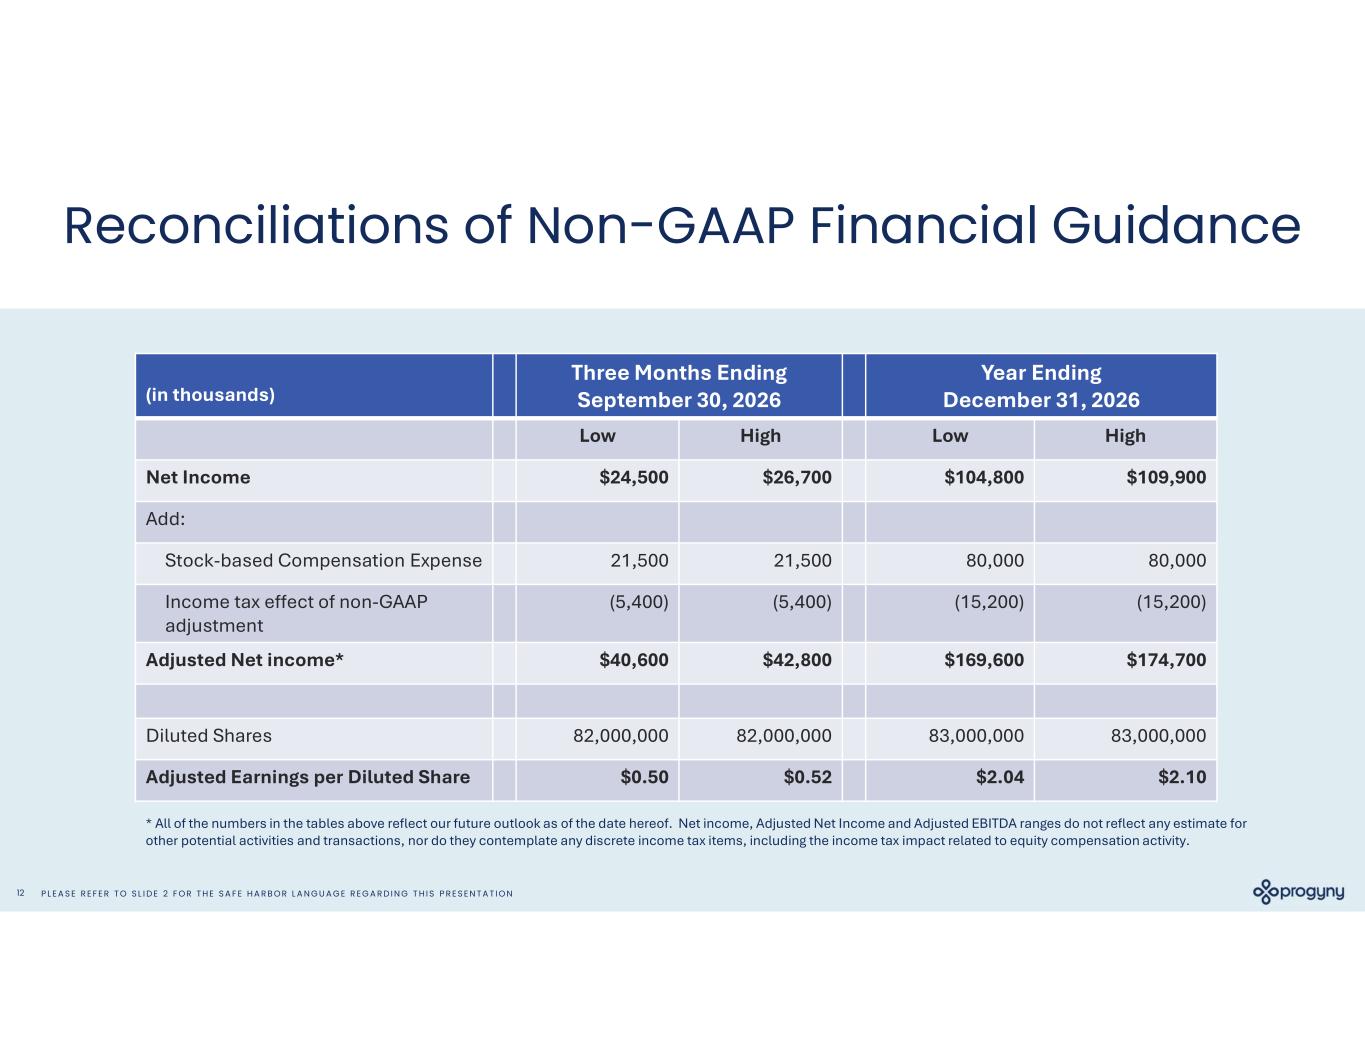
P L E A S E R E F E R T O S L I D E 2 F O R T H E S A F E H A R B O R L A N G U A G E R E G A R D I N G T H I S P R E S E N T A T I O N12 Reconciliations of Non-GAAP Financial Guidance Year Ending December 31, 2026 Three Months Ending September 30, 2026(in thousands) HighLowHighLow $109,900$104,800$26,700$24,500Net Income Add: 80,00080,00021,50021,500Stock-based Compensation Expense (15,200)(15,200)(5,400)(5,400)Income tax effect of non-GAAP adjustment $174,700$169,600$42,800$40,600Adjusted Net income* 83,000,00083,000,00082,000,00082,000,000Diluted Shares $2.10$2.04$0.52$0.50Adjusted Earnings per Diluted Share * All of the numbers in the tables above reflect our future outlook as of the date hereof. Net income, Adjusted Net Income and Adjusted EBITDA ranges do not reflect any estimate for other potential activities and transactions, nor do they contemplate any discrete income tax items, including the income tax impact related to equity compensation activity.
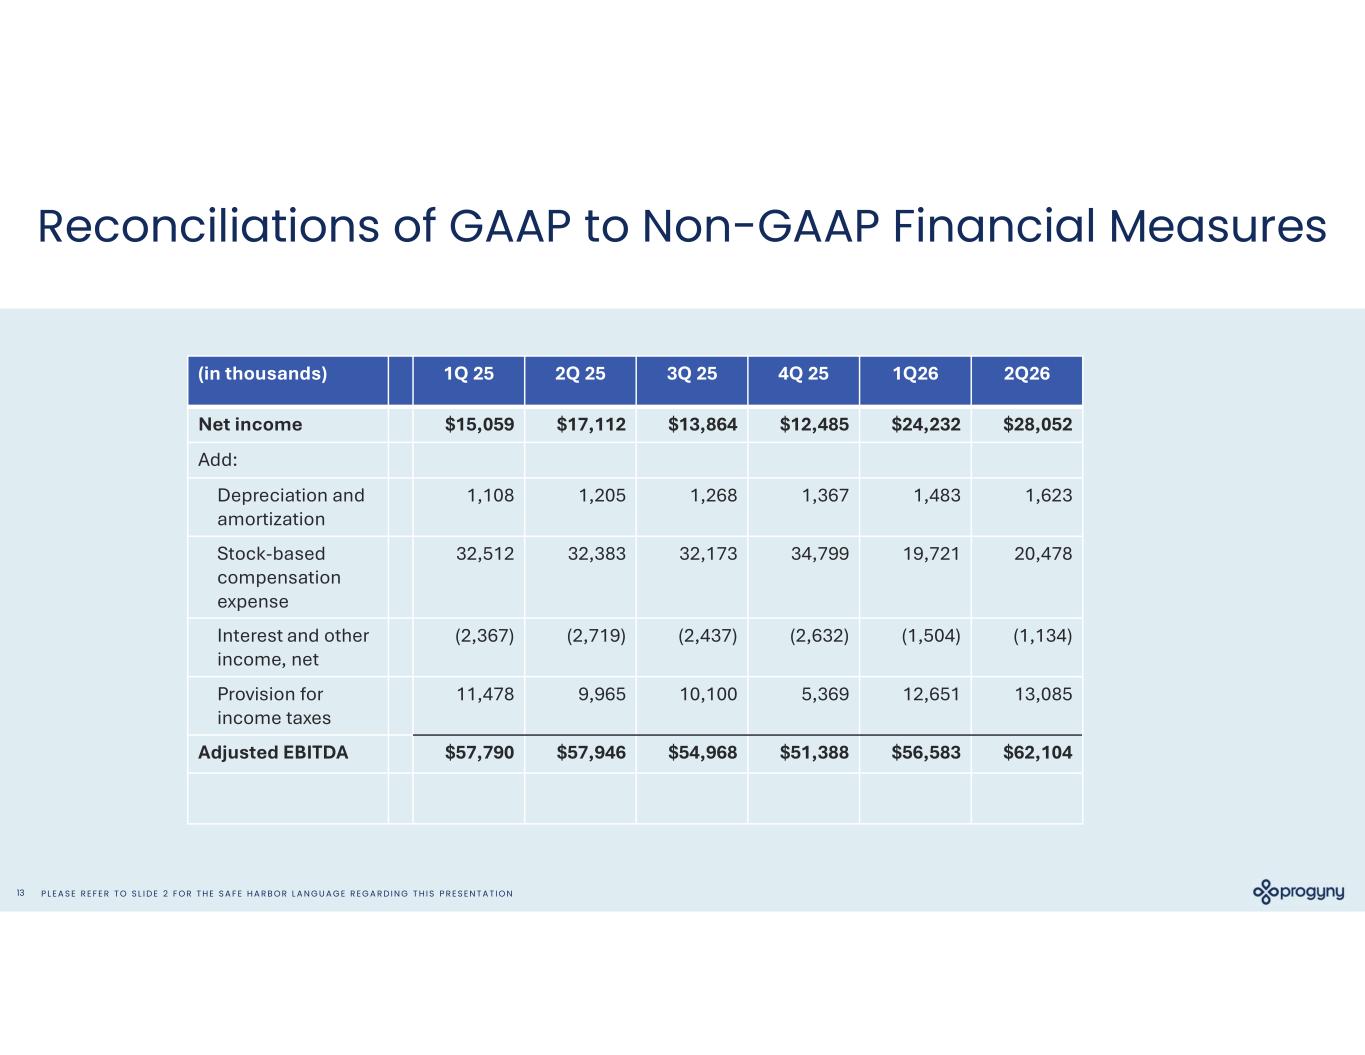
P L E A S E R E F E R T O S L I D E 2 F O R T H E S A F E H A R B O R L A N G U A G E R E G A R D I N G T H I S P R E S E N T A T I O N13 Reconciliations of GAAP to Non-GAAP Financial Measures 2Q261Q264Q 253Q 252Q 251Q 25(in thousands) $28,052$24,232$12,485$13,864$17,112$15,059Net income Add: 1,6231,4831,3671,2681,2051,108Depreciation and amortization 20,47819,72134,79932,17332,38332,512Stock-based compensation expense (1,134)(1,504)(2,632)(2,437)(2,719)(2,367)Interest and other income, net 13,08512,6515,36910,1009,96511,478Provision for income taxes $62,104$56,583$51,388$54,968$57,946$57,790Adjusted EBITDA