Thomson Reuters Second Quarter Report 2026

img21084890_0.jpg


Management’s Discussion and Analysis EXHIBIT 99.1

This management’s discussion and analysis is designed to provide you with a narrative explanation through the eyes of our management of how we performed, as well as information about our financial condition and future prospects. As this management’s discussion and analysis is intended to supplement and complement our financial statements, we recommend that you read this in conjunction with our consolidated interim financial statements for the three and six months ended June 30, 2026, our 2025 annual consolidated financial statements and our 2025 annual management’s discussion and analysis. This management's discussion and analysis contains forward-looking statements, which are subject to risks and uncertainties that could cause our actual results to differ materially from the forward-looking statements. Forward-looking statements include, but are not limited to, our 2026 outlook, statements regarding the sale of 51% of the Global Print business to capital accounts advised by KKR and our expectations related to general economic conditions and market trends and their anticipated effects on our business segments. For additional information related to forward-looking statements, material assumptions and material risks associated with them, please see the “Outlook,” and “Additional Information - Cautionary Note Concerning Factors That May Affect Future Results” sections of this management’s discussion and analysis. This management’s discussion and analysis is dated as of August 4, 2026, unless otherwise indicated.

We have organized our management’s discussion and analysis in the following key sections:


·

Executive Summary - an overview of our business and key financial highlights

 2

·

Results of Operations - a comparison of our current and prior-year period results

 4

·

Liquidity and Capital Resources - a discussion of our cash flow and debt

 11

·

Outlook – our 2026 financial outlook including material assumptions and material risks

 17

·


Related Party Transactions - a discussion of transactions with our principal and controlling shareholder, Woodbridge (together with its affiliates), and other related parties

 19

·


Subsequent Events - a discussion of material events occurring after June 30, 2026 and through the date of this management's discussion and analysis

 19

·

Changes in Accounting Policies - a discussion of changes in our accounting policies

 20

·


Critical Accounting Estimates and Judgments - a discussion of critical estimates and judgments made by our management in applying accounting policies

 20

·

Additional Information - other required disclosures

 20

·

Appendix - supplemental information

 22

Unless otherwise indicated or the context otherwise requires, references in this discussion to “we,” “our,” “us”, the “Company” and “Thomson Reuters” are to Thomson Reuters Corporation and our subsidiaries.

Basis of presentation

We prepare our consolidated financial statements in U.S. dollars and in accordance with International Financial Reporting Standards (IFRS), as issued by the International Accounting Standards Board.

In the first quarter of 2026, we changed our segment reporting to reflect how we currently manage our segments. Prior period amounts have been revised to reflect the current presentation. Refer to the “Additional information” section of this management’s discussion and analysis for further information.

Other than earnings per share, we report our results in millions of U.S. dollars, but we compute percentage changes and margins using whole dollars to be more precise. As a result, percentages and margins calculated from reported amounts may differ from those presented, and growth components may not total due to rounding.

Use of non-IFRS financial measures

In this management’s discussion and analysis, we discuss our results on an IFRS and non-IFRS basis. We use non-IFRS financial measures, which include ratios that incorporate one or more non-IFRS financial measures, as supplemental indicators of our operating performance and financial position as well as for internal planning purposes, our management incentive programs and our business outlook. We believe non-IFRS financial measures provide additional insight into our performance. Non-IFRS measures do not have standardized meanings prescribed by IFRS and therefore are unlikely to be comparable to the calculation of similar measures used by other companies, and should not be viewed as alternatives to measures of financial performance calculated in accordance with IFRS.

See Appendix A of this management’s discussion and analysis for a description of our non-IFRS financial measures, including an explanation of why we believe they are useful measures of our performance. Refer to Appendix B for reconciliations of our non-IFRS financial measures to the most directly comparable IFRS measures.


Page 1


Thomson Reuters Second Quarter Report 2026

img21084890_0.jpg


Glossary of key terms

The following terms in this management’s discussion and analysis have the following meanings, unless otherwise indicated:


term

Definition

AI

Artificial intelligence

“Big 3” segments

Our combined Legal Professionals, Corporates and Tax, Audit & Accounting Professionals segments

bp

Basis points - one basis point is equal to 1/100th of 1%; “100bp” is equivalent to 1%

C$

Canadian dollars

constant currency

A non-IFRS measure derived by applying the same foreign currency exchange rates to the financial results of the current and equivalent prior-year period

EBITDA

Earnings before interest, tax, depreciation and amortization

EPS

Earnings per share

Fiduciary-Grade AITM


At Thomson Reuters, Fiduciary‑Grade AI is our standard for how AI should work in high‑stakes professions. It’s AI designed for professionals with duties of care and regulatory oversight-drawing on our authoritative, domain‑specific content; protected by rigorous privacy and security safeguards; shaped by subject‑matter experts; and designed to produce transparent outputs that can be verified. Fiduciary-Grade AI sets the bar when accuracy, accountability, and trust are paramount.

IASB

International Accounting Standards Board

IFRS

International Financial Reporting Standards

LSEG

London Stock Exchange Group plc

n/a

Not applicable

n/m

Not meaningful

Nasdaq

The Nasdaq Stock Market LLC

organic or organically

A non-IFRS measure that represents changes in revenues of our existing businesses at constant currency. The metric excludes the distortive impacts of acquisitions and dispositions from not owning the business in both comparable periods

ROIC

Return on invested capital. A non-IFRS measure that is computed as adjusted operating profit (operating profit excluding amortization of acquired intangible assets attributable to other identifiable intangible assets and acquired software, other operating gains and losses, and fair value adjustments) less net taxes paid expressed as a percentage of the average adjusted invested capital during the period

SEC

U.S. Securities and Exchange Commission

TSX

Toronto Stock Exchange

Woodbridge

The Woodbridge Company Limited, our principal and controlling shareholder

$ and US$

U.S. dollars


Executive Summary

Our company

Thomson Reuters (TSX/Nasdaq: TRI) powers business-critical professions with Fiduciary-Grade AITM they can trust in the moments that matter. We unite unparalleled expertise, proprietary content, and seamless workflows to help our customers move with speed, think with clarity, and lead with confidence. Across our products, we combine highly specialized software and insights to empower professionals with the data, intelligence, and solutions needed to make informed decisions, and to help institutions in their pursuit of justice, truth and transparency. Reuters, part of Thomson Reuters, is a world leading provider of trusted journalism and news. For more information, visit thomsonreuters.com.

We derive a significant portion of our revenues from selling information and software solutions, mostly on a recurring subscription basis. Our professional-grade solutions are built on comprehensive proprietary content and deep domain expertise with software, embedded AI capabilities and automation tools. We believe our workflow solutions make our customers more productive by streamlining how they operate, enabling them to focus on higher value activities. Many of our customers use our solutions that are deeply integrated into their workflows, which has led to strong customer retention. We believe that our customers trust us because of our decades serving high-stakes workflows, where accuracy and reliability are non-negotiable, our enterprise-grade security and governance built for regulated environments, and our deep understanding of their businesses and industries. They rely on our services for navigating a rapidly changing and increasingly complex digital and global landscape. Over the years, our business model has proven to be capital efficient and cash flow generative, and it has enabled us to maintain leading and scalable positions in our chosen market segments.

Page 2


Thomson Reuters Second Quarter Report 2026

img21084890_0.jpg


For the first six months of 2026, we were organized as five reportable segments, reflecting how our products and services are managed and offered to target customers as described below.


\

img21084890_1.jpg


img21084890_2.jpg


img21084890_3.jpg


img21084890_4.jpg


img21084890_5.jpg

Legal Professionals

Serves law firms and governments with research and workflow products powered by AI-enabled technology, focusing on intuitive legal research and integrated legal workflow solutions that combine content, tools and analytics.

Corporates

Serves corporations, ranging from small businesses to multinational organizations, including the seven largest global accounting firms, with our full suite of content-driven products, powered by AI-enabled technology and integrated compliance workflow solutions to help them achieve their business outcomes.

Tax, Audit & Accounting Professionals

Serves tax, audit and accounting firms (other than the seven largest, which are served by our Corporates segment) with research and workflow products powered by AI-enabled technology.

Reuters

Supplies business, financial and global news and data to the world’s media organizations, professionals and news consumers through Reuters News Agency, Reuters.com, Reuters Events, Thomson Reuters products and to financial firms exclusively via LSEG products.

Global Print

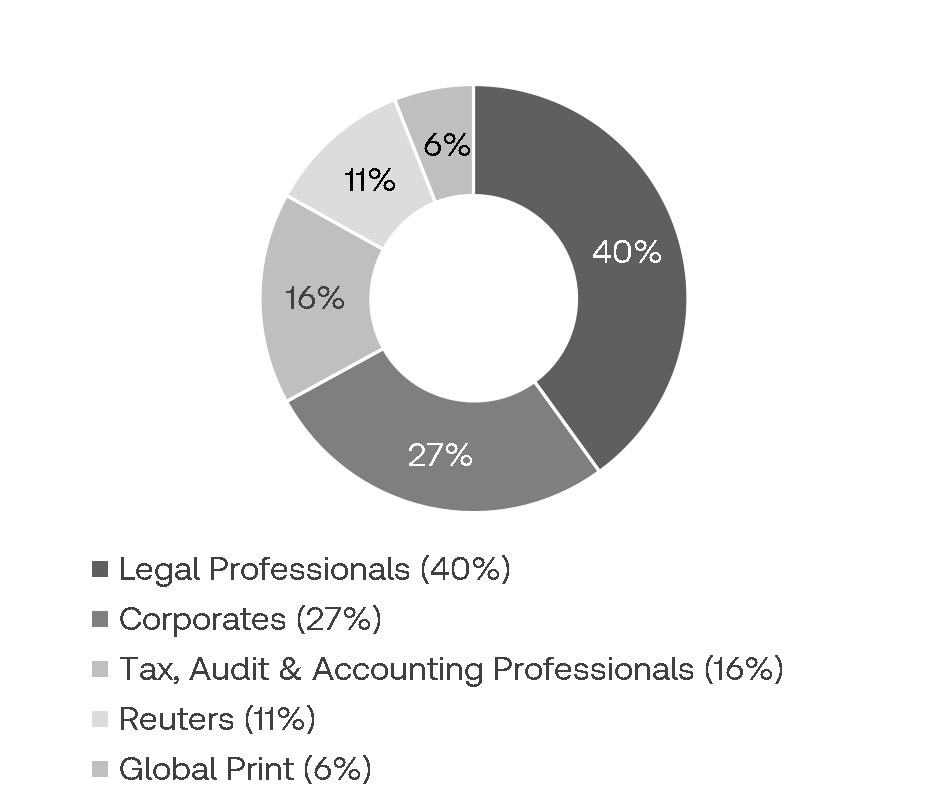
Provides legal and tax information primarily in print format to customers around the world and provides commercial printing services to a wide range of book publishers. We recently signed a definitive agreement to enter into a joint venture with KKR that includes the sale of a 51% interest in this business. See "Global Print Transaction" section below.


Second Quarter 2026 Revenues

img21084890_6.jpg


img21084890_7.jpg


We refer to our Legal Professionals, Corporates and Tax, Audit & Accounting Professionals segments, on a combined basis, as our “Big 3” segments.

Our businesses are supported by a corporate center that manages our commercial and technology operations, including those around our sales capabilities, digital customer experience, and product and content development, as well as our global facilities. Costs relating to these activities are allocated to our business segments. We also report “Corporate costs”, which includes expenses for centrally managed functions such as finance, legal, human resources and the executive office. These costs are not allocated to the segments and are included in consolidated adjusted EBITDA.

Page 3


Thomson Reuters Second Quarter Report 2026

img21084890_0.jpg


Financial Highlights


Strong revenue growth continued in the second quarter as our revenues increased 9% in total and in constant currency. On an organic basis, revenues grew 8%, which reflected 9% growth in recurring revenues, 11% growth in transactions revenues and a 3% decline in Global Print. Our "Big 3" segments, which comprised 83% of total revenues, increased 10% on an organic basis driven by 9% growth in recurring revenues and 13% growth in transactions revenues.

Our operating profit increased 28% and adjusted EBITDA increased 10%. Adjusted EBITDA margin increased to 38.1% from 37.8% in the prior-year period. Foreign currency contributed 10bp to the year-over-year change in adjusted EBITDA margin.

In August 2026, we raised our 2026 full-year outlook for total and organic revenue growth to approximately 8.0% for our total company, and to a range of 9.5% to 10.0% for our "Big 3" segments. All other metrics in our 2026 full-year outlook are unchanged from our previous 2026 full-year outlook communicated on May 5, 2026.

Our full-year 2026 outlook includes the forecasted results of the Global Print segment, consistent with the way we have presented our 2026 full-year outlook in the past our prior 2026 full-year outlooks. We will report our Global Print business as a discontinued operation when we release our third quarter results and plan to provide an updated full-year 2026 outlook at that time. See "Global Print Business Transaction" below and the “Outlook” section of this management’s discussion and analysis for further information.

Our capital capacity and liquidity remain a key asset to support acquisitions and returns to shareholders. In the second quarter of 2026, we generated net cash flows from operating activities of $920 million and free cash flow of $727 million. In aggregate, we returned $980 million to our common shareholders from our $605 million return of capital and share consolidation transactions, $100 million under our February 2026 share repurchase plan, and $275 million in dividends. We also repaid our $500 million 3.35% notes upon maturity with cash on hand and commercial paper borrowings. In July 2026, we completed our February 2026 $600 million share repurchase program. See the “Liquidity and Capital Resources” and "Subsequent Events" sections of this management’s discussion and analysis for additional information.

Global Print Transaction

On July 14, 2026, we announced that we signed a definitive agreement to enter into a joint venture with KKR, a leading global investment firm. As part of the transaction, we will sell a 51% stake in our Global Print business to capital accounts advised by KKR and retain a 49% equity interest in the joint venture. We will receive approximately $500 million in gross proceeds at closing and expect the transaction to close in the fourth quarter of 2026, subject to specified regulatory approvals and customary closing conditions. We expect to record a pre-tax gain on the transaction at the time of closing.

We will maintain intellectual property rights and full editorial control over our content portfolio. This new joint venture will hold an exclusive license to distribute the content in print and on ProView, Global Print’s eBook platform, under which it will pay us a royalty in return. We will also provide certain operational services to the joint venture under a multi-year transition services agreement. The royalty plus the transition services agreement will largely offset stranded costs from the separation.

The Global Print business will be classified as a discontinued operation in the third quarter of 2026 and will no longer be presented as a reportable segment. Once the transaction closes, we expect our total company organic revenue growth rate will increase 60bp to 70bp on an annual basis and we expect a minimal impact on total company adjusted EBITDA margin.

As part of the transaction, we have agreed to provide certain financial support designed to give KKR a minimum return on its equity investment in the joint venture under certain circumstances.

Results of Operations

Our revenues and operating profit on a consolidated basis do not tend to be significantly impacted by seasonality as we record a large portion of our revenues ratably over the contract term and our costs are generally incurred evenly throughout the year. However, at the segment level, revenues on a consecutive quarter basis can be impacted by seasonality, most notably in our Tax, Audit & Accounting Professionals business, where revenues tend to be concentrated in the first and fourth quarters.

The section below contains non-IFRS measures where indicated. Refer to Appendices A and B of this management’s discussion and analysis for additional information and reconciliations of our non-IFRS financial measures to the most directly comparable IFRS financial measures.

Page 4


Thomson Reuters Second Quarter Report 2026

img21084890_0.jpg


Consolidated results


Three months ended
June 30,


Six months ended
June 30,


Change


Change

(millions of U.S. dollars, except per share amounts)


2026


2025


Total


Constant Currency


2026


2025


Total


Constant Currency

IFRS Financial Measures


   Revenues


1,954


1,785


9%


4,041


3,685


10%


   Operating profit


558


436


28%


1,197


999


20%


   Diluted EPS


$1.02


$0.69


48%


$2.05


$1.65


24%


Non-IFRS Financial Measures


   Revenue growth in constant currency


9%


9%

   Organic revenue growth


8%


8%

   Adjusted EBITDA


745


678


10%


9%


1,626


1,487


9%


9%

   Adjusted EBITDA margin


38.1%


37.8%


30bp


20bp


40.2%


40.1%


10bp


30bp

   Adjusted EBITDA less accrued capital
       expenditures


566


521


9%


1,286


1,192


8%


   Adjusted EBITDA less accrued capital
       expenditures margin


29.0%


29.0%


-


31.8%


32.2%


(40)bp


   Adjusted EPS


$0.99


$0.87


14%


13%


$2.22


$2.00


11%


11%

“Big 3” Segments


   Revenues


1,620


1,458


11%


10%


3,394


3,052


11%


10%

   Organic revenue growth


10%


9%

   Adjusted EBITDA


691


621


12%


10%


1,520


1,380


10%


9%

   Adjusted EBITDA margin


42.7%


42.3%


40bp


30bp


44.8%


44.9%


(10)bp


-


Revenues


Three months ended
June 30,


Six months ended
June 30,


Change


Change

(millions of U.S. dollars)


2026


2025

Total

Constant
Currency

Organic


2026


2025

Total

Constant
Currency

Organic

Recurring revenues

1,601


1,463

9%

9%

9%


3,196


2,914

10%

9%

8%

Transactions revenues

242


208

16%

16%

11%


622


541

15%

15%

10%

Global Print revenues

111


114

(3%)

(3%)

(3%)


223


230

(3%)

(4%)

(4%)

Revenues


1,954


1,785

9%

9%

8%


4,041


3,685

10%

9%

8%


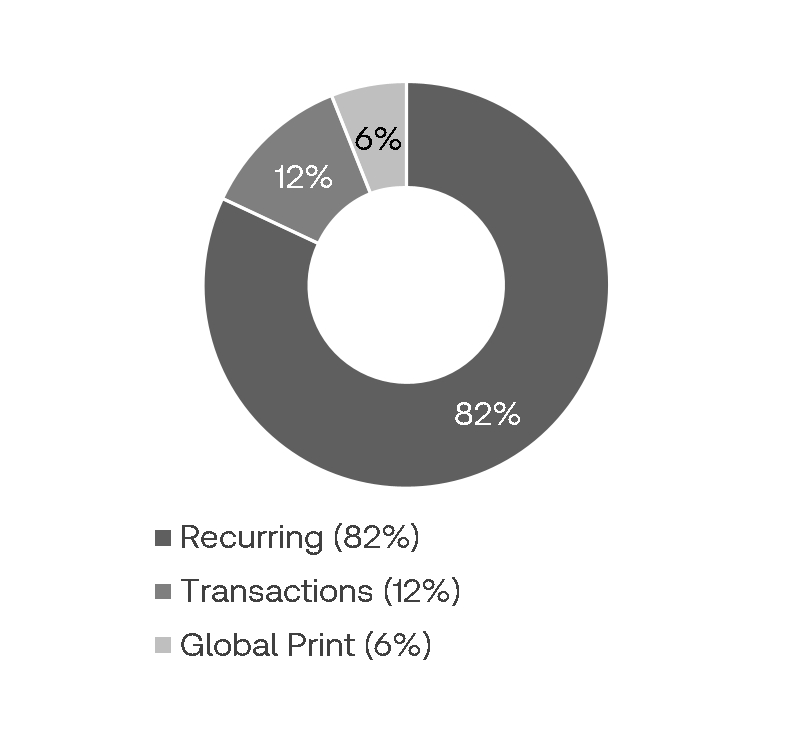
Revenues in the second quarter increased 9% in total and in constant currency. Total revenue growth reflected 9% growth in recurring revenues (82% of total revenues), 16% growth in transactions revenues and a 3% decline in Global Print. Total revenue growth benefited approximately 1% from foreign currency and 1% from net acquisitions and disposals. On an organic basis, revenues increased 8% which reflected 9% growth in recurring revenues, 11% growth in transactions revenues and a 3% decline in Global Print revenues. Revenues from the “Big 3” segments (83% of total revenues) increased 11% in total and 10% on a constant currency basis. On an organic basis, revenues increased 10%, driven by 9% growth in recurring revenues and 13% growth in transactions revenues.


Revenues in the six-month period increased 10% in total and 9% in constant currency. Total revenue growth reflected 10% growth in recurring revenues (79% of total revenues), 15% growth in transactions revenues and a 3% decline in Global Print. Total revenue growth benefited approximately 1% from foreign currency and 1% from net acquisitions and disposals. On an organic basis, revenues increased 8% which reflected 8% growth in recurring revenues, 10% growth in transactions revenues, and a 4% decline in Global Print revenues. Revenues from the “Big 3” segments (84% of total revenues) increased 11% in total and 10% on a constant currency basis. On an organic basis, revenues increased 9%, driven by 9% growth in recurring revenues and 12% growth in transactions revenues.


In both periods, the U.S. dollar weakened against many of the currencies we transact in compared to the prior-year periods, including the British pound sterling and Brazilian real. Overall, changes in foreign exchange rates increased revenue growth by approximately 1% in the second quarter and six-month period.

Operating profit, adjusted EBITDA and adjusted EBITDA less accrued capital expenditures

Operating profit increased 28% and 20% in the second quarter and six-month period, respectively, as the net impact of higher revenues and operating expenses as well as higher other operating gains, were partly offset by higher amortization of software.

Page 5


Thomson Reuters Second Quarter Report 2026

img21084890_0.jpg


Adjusted EBITDA, which excludes other operating gains, amortization of software, as well as other adjustments, increased 10% and 9% in the second quarter and six-month period, respectively. The second quarter increase in adjusted EBITDA reflected increases of 12% in the “Big 3” segments, 5% in Reuters, and 2% in Global Print. The six-month increase in adjusted EBITDA reflected a 10% increase in the “Big 3” segments, a 3% decline in Reuters, and no change in Global Print.

In the second quarter, adjusted EBITDA margin increased to 38.1% from 37.8% in the prior-year period. Foreign currency contributed 10bp to the year-over-year change in adjusted EBITDA margin. In the six month period, adjusted EBITDA margin increased to 40.2% from 40.1% in the prior-year period. Foreign currency negatively impacted the year-over-year change in adjusted EBITDA margin by 20bp.


Adjusted EBITDA less accrued capital expenditures increased in both periods as higher adjusted EBITDA was partly offset by higher accrued capital expenditures. The related margin was unchanged in the second quarter, and decreased 40bp in the six-month period due to higher accrued capital expenditures.

Operating expenses


Three months ended
June 30,

Six months ended
June 30,


Change


Change

(millions of U.S. dollars)


2026

2025

Total

Constant
Currency

2026


2025


Total


Constant
Currency

Operating expenses


1,211

1,124

8%

8%

2,414


2,232


8%


8%

Remove fair value adjustments(1)


(2)

(7)


1


(14)


Operating expenses, excluding fair value
   adjustments


1,209

1,117

8%

8%

2,415


2,218


9%


8%


(1)
Fair value adjustments primarily represent gains or losses due to changes in foreign currency exchange rates on intercompany balances that arise in the ordinary course of business.

Operating expenses, excluding fair value adjustments, increased in total and on a constant currency basis in both periods primarily due to higher compensation-related and technology costs.

Depreciation and amortization


Three months ended
June 30,

Six months ended
June 30,

(millions of U.S. dollars)


2026


2025


Change

2026


2025


Change

Depreciation


27


28


(3%)

55


55


1%

Amortization of software


   Internally developed


141


126


12%

278


251


10%

   Acquisition-related


60


52


15%

116


101


15%

Total amortization of software


201


178


13%

394


352


12%

Amortization of other identifiable intangible assets

25


24


2%

49


49


-


Depreciation decreased slightly in the second quarter and was unchanged in the six-month period. Both periods reflected lower expense due to assets acquired in previous years becoming fully depreciated, which offset higher expense associated with newly acquired assets.
Total amortization of software increased in both periods due to acquisitions and product development.
Amortization of other identifiable intangible assets increased slightly in the second quarter and was unchanged in the six-month period. Both periods reflected higher expense associated with recent acquisitions, which offset lower expense due to assets acquired in previous years becoming fully amortized.

Other operating gains, net


Three months ended
June 30,


Six months ended
June 30,

(millions of U.S. dollars)


2026


2025


2026


2025

Other operating gains, net


68


5


68


2


Other operating gains, net of $68 million in both periods of 2026 were primarily related to acquisitions and investments. Other operating gains, net were $5 million and $2 million in the second quarter and six-month period of 2025, respectively.

Net interest expense


Three months ended
June 30,


Six months ended
June 30,

(millions of U.S. dollars)


2026


2025


Change


2026


2025


Change

Net interest expense


47


35


36%


86


65


32%


Page 6


Thomson Reuters Second Quarter Report 2026

img21084890_0.jpg


Net interest expense increased primarily due to higher interest expense from an increase in our commercial paper borrowings and lower interest income resulting from lower cash balances due to our equity transactions and maturity of debt. The increase was partly offset by lower interest expense from the repayment of our $500 million 3.35% notes in May 2026 and our C$1.4 billion (U.S. $999 million) 2.239% notes in May 2025. See the "Liquidity and Capital Resources" section of the management's discussion and analysis for further information.

Other finance income (costs)


Three months ended
June 30,


Six months ended
June 30,


(millions of U.S. dollars)


2026


2025


2026


2025


Other finance income (costs)


8


(48

)


17


(58

)

Other finance income (costs) compared to prior-year periods reflected lower foreign exchange impacts primarily due to a reduction of intercompany funding arrangements.

Share of post-tax losses in equity method investments


Three months ended
June 30,

Six months ended
June 30,

(millions of U.S. dollars)


2026

2025

2026


2025

Share of post-tax losses in equity method investments


(4)

(4)

(11)


(10)


Share of post-tax losses in equity method investments were not significant in all periods.

Tax expense


Three months ended
June 30,


Six months ended
June 30,


(millions of U.S. dollars)


2026


2025


2026


2025


Tax expense


71


52


196


144


Tax expense was $71 million and $196 million in the second quarter and six-month period of 2026, and $52 million and $144 million in the second quarter and six-month period of 2025, respectively. Tax expense in each period reflected the mix of taxing jurisdictions in which pre-tax profits and losses were recognized. Tax expense or benefit in interim periods is not necessarily indicative of the tax benefit or expense for the full year because the geographical mix of pre-tax profits and losses in interim periods may be different from that for the full year.


The comparability of our tax expense was impacted by various transactions and accounting adjustments during each period. The following table sets forth certain components within income tax expense that impact comparability from period to period:


Three months ended
June 30,


Six months ended
June 30,


(millions of U.S. dollars)


2026


2025


2026


2025


(Benefit) expense


Tax items impacting comparability:


   Corporate tax laws and rates(1)


-


-


(10

)


-


   Adjustments related to prior years(2)


(8

)


-


(8

)


-


   Deferred tax adjustments(3)


5


(21

)


14


(20

)

    Subtotal


(3

)


(21

)


(4

)


(20

)

Tax related to:


   Amortization of acquired software


(10

)


(13

)


(19

)


(24

)

   Amortization of other identifiable intangible assets


(6

)


(5

)


(11

)


(11

)

   Other finance income (costs)


(2

)


(1

)


(1

)


(4

)

   Share of post-tax losses in equity method investments


-


(1

)


(2

)


(2

)

   Other items


(2

)


(2

)


(1

)


(5

)

    Subtotal


(20

)


(22

)


(34

)


(46

)

Total


(23

)


(43

)


(38

)


(66

)


(1)
Relates primarily to adjustments to deferred tax balances due to changes in the applicable statutory tax rate in a jurisdiction outside of the U.S.
(2)
Change in estimate pertaining to the effective tax rate applicable to certain foreign-source income earned by U.S. affiliates.
(3)
Relates primarily to adjustments resulting from foreign exchange movements where functional currencies differ from those used for local tax filings.

Page 7


Thomson Reuters Second Quarter Report 2026

img21084890_0.jpg


The items described above impact the comparability of our tax expense or benefit for each period, therefore, we remove them from our calculation of adjusted earnings, along with the pre-tax items to which they relate. The computation of our adjusted tax expense is set forth below:


Three months ended
June 30,


Six months ended
June 30,


(millions of U.S. dollars)


2026


2025


2026


2025


Tax expense


71


52


196


144


   Remove: Items from above impacting comparability


23


43


38


66


   Other adjustment:


     Interim period effective tax rate normalization(1)


-


(1

)


(11

)


4


Total tax expense on adjusted earnings


94


94


223


214


(1) Adjustment to reflect income taxes based on estimated full-year effective tax rates. Earnings or losses for interim periods under IFRS generally reflect income taxes based on the estimated effective tax rates of each of the jurisdictions in which we operate. The non-IFRS adjustment reallocates estimated full-year income taxes between interim periods, but has no effect on full-year income taxes.

Results of discontinued operations


Three months ended
June 30,


Six months ended
June 30,


(millions of U.S. dollars)


2026


2025


2026


2025


Earnings (loss) from discontinued operations, net of tax


4


16


(14

)


25


All periods included earnings or losses relating to a tax indemnity due to changes in foreign exchange and interest rates associated with the indemnifying party’s credit profile. The six month period of 2026 also included losses recognized from the resolution of a tax dispute on a portion of the receivable balance from LSEG relating to the tax indemnity.

Net earnings, diluted EPS, adjusted earnings and adjusted EPS


Three months ended
June 30,


Six months ended
June 30,


Change


Change

(millions of U.S. dollars, except per share amounts)


2026


2025


Total


Constant
Currency


2026


2025


Total


Constant
Currency

IFRS Financial Measures


Net earnings


448


313


43%


907


747


21%


Diluted EPS


$1.02


$0.69


48%


$2.05


$1.65


24%


Non-IFRS Financial Measures(1)


Adjusted earnings


435


394


10%


982


900


9%


Adjusted EPS


$0.99


$0.87


14%


13%


$2.22


$2.00


11%


11%


(1)
Refer to Appendices A and B of this management’s discussion and analysis for additional information and reconciliations of our non-IFRS financial measures to the most directly comparable IFRS financial measures.

Net earnings and diluted EPS increased in both periods primarily due to higher operating profit.

Adjusted earnings and adjusted EPS increased in both periods primarily due to higher adjusted EBITDA, partly offset by higher amortization of internally developed software.

Diluted and adjusted EPS in both periods benefited from a reduction in weighted-average common shares outstanding due to our return of capital transaction and share repurchases under our share repurchase program.

Page 8


Thomson Reuters Second Quarter Report 2026

img21084890_0.jpg


Segment results

The following is a discussion of our five reportable segments and our Corporate costs for the three and six months ended June 30, 2026. We assess revenue growth for each segment, as well as the businesses within each segment, on a total, constant currency and an organic basis. See Appendix A of this management’s discussion and analysis for additional information on our non-IFRS financial measures.

Legal Professionals


Three months ended
June 30,


Six months ended
June 30,


Change


Change

(millions of U.S. dollars)

2026

2025

Total

Constant
Currency

Organic


2026


2025

Total

Constant
Currency

Organic

   Recurring revenues

748

684

10%

9%

9%


1,487


1,354

10%

9%

9%

   Transactions revenues

24

20

16%

16%

18%


41


38

8%

8%

9%

Revenues

772

704

10%

9%

10%


1,528


1,392

10%

9%

9%

Segment adjusted EBITDA

371

339

10%

9%


736


675

9%

9%


Segment adjusted EBITDA margin

48.1%

48.1%

-

(10)bp


48.2%


48.4%

(20)bp

(20)bp


Revenues increased in total, in constant currency, and on an organic basis in both periods. In the second quarter, revenues increased 10% on an organic basis due to 9% growth in recurring revenues (97% of the Legal Professionals segment revenues in the quarter) primarily driven by Westlaw and CoCounsel and 18% growth in transactions revenues primarily driven by CLEAR. In the six-month period, organic revenue growth of 9% was due to 9% growth in both recurring and transactions revenues driven substantially by the same products as in the second quarter.

Segment adjusted EBITDA increased 10% in the second quarter and 9% in the six-month period. The related margin was unchanged at 48.1% in the second quarter and decreased 20bp to 48.2% in the six-month period. Both periods reflected the impact of higher revenues offset by higher technology and other costs. Foreign currency benefited the year-over-year change in segment adjusted EBITDA margin by 10bp in the second quarter and had no impact in the six-month period.

Corporates


Three months ended
June 30,


Six months ended
June 30,


Change


Change

(millions of U.S. dollars)

2026


2025

Total

Constant
Currency

Organic


2026


2025

Total

Constant
Currency

Organic

   Recurring revenues

462


421

10%


9%


9%


911


828

10%


8%


8%

   Transactions revenues

75


59

27%


27%


24%


234


200

17%


17%


16%

Revenues

537


480

12%


11%


10%


1,145


1,028

11%


10%


10%

Segment adjusted EBITDA

200


172

17%


15%


443


387

15%


14%


Segment adjusted EBITDA margin

37.2%


35.7%

150bp


130bp


38.7%


37.6%

110bp


130bp


Revenues increased in total, in constant currency, and on an organic basis in both periods. Revenues increased 10% on an organic basis in both periods due to growth in recurring (86% of the Corporates segment revenues in the quarter) and transactions revenues. Organic recurring revenue growth of 9% in the second quarter and 8% in the six-month period were both led by Westlaw, CoCounsel, Indirect Tax, Pagero, CLEAR and the segment’s international businesses. Organic transactions revenue growth of 24% in the second quarter and 16% in the six-month period were led by Confirmation, Pagero, Trust, Checkpoint, Indirect Tax and the segment’s international businesses.

Segment adjusted EBITDA increased 17% in the second quarter and 15% in the six-month period. The related margin increased 150bp to 37.2% in the second quarter and 110bp to 38.7% in the six-month period driven by higher operating leverage in both periods. Foreign currency benefited the year-over-year change in segment adjusted EBITDA margin by 20bp in the second quarter and negatively impacted segment adjusted EBITDA margin by 20bp in the six-month period.

Page 9


Thomson Reuters Second Quarter Report 2026

img21084890_0.jpg


Tax, Audit & Accounting Professionals


Three months ended
June 30,


Six months ended
June 30,


Change


Change

(millions of U.S. dollars)

2026


2025

Total

Constant
Currency

Organic


2026


2025

Total

Constant
Currency

Organic

   Recurring revenues

209


187

12%


9%


9%


438


392

12%


10%


10%

   Transactions revenues

102


87

17%


17%


6%


283


240

18%


18%


9%

Revenues

311


274

14%


12%


8%


721


632

14%


13%


9%

Segment adjusted EBITDA

120


110

9%


7%


341


318

7%


6%


Segment adjusted EBITDA margin

38.7%


38.9%

(20)bp


(40)bp


47.3%


48.9%

(160)bp


(140)bp


Revenues increased on a total and constant currency basis in both periods, which included the impact of the SafeSend acquisition in 2025 within transactions revenues. In the second quarter, revenues increased 8% on an organic basis due to 9% growth in recurring revenues (67% of the Tax, Audit & Accounting Professionals segment revenues in the quarter) and 6% growth in transactions revenues. Organic recurring revenue growth was primarily driven by tax and audit products, which include GoSystem and CoCounsel, as well as Cloud Audit Suite and the segment’s Latin America business. Organic transactions revenue growth was primarily driven by SafeSend. In the six-month period, organic revenue growth of 9% reflected 10% growth in recurring revenues and 9% growth in transactions revenues. Organic recurring revenue growth was driven substantially by the same products as in the second quarter. Organic transactions revenue growth was driven by SafeSend, SurePrep and UltraTax.

Segment adjusted EBITDA increased 9% in the second quarter and 7% in the six-month period. The related margin decreased 20bp to 38.7% in the second quarter and decreased 160bp to 47.3% in the six-month period. Both periods reflected the impact of higher revenues offset by higher technology and other costs. Foreign currency benefited the year-over-year change in segment adjusted EBITDA margin by 20bp in the second quarter and negatively impacted segment adjusted EBITDA margin by 20bp in the six-month period.

The Tax, Audit & Accounting Professionals segment is the company’s most seasonal business with approximately 60% of full-year revenues typically generated in the first and fourth quarters. As a result, the margin performance of this segment has been generally higher in the first and fourth quarters as costs are typically incurred in a more linear fashion throughout the year.

Reuters


Three months ended
June 30,


Six months ended
June 30,


Change


Change

(millions of U.S. dollars)

2026


2025

Total

Constant
Currency

Organic


2026


2025

Total

Constant
Currency

Organic

   Recurring revenues

188


176

7%


6%


6%


374


351

7%


6%


5%

   Transactions revenues

41


42

(2%)


1%


(1%)


67


63

6%


8%


6%

Revenues

229


218

5%


5%


4%


441


414

6%


6%


5%

Segment adjusted EBITDA

48


45

5%


10%


82


84

(3%)


4%


Segment adjusted EBITDA margin

20.8%


20.8%

-


80bp


18.6%


20.4%

(180)bp


(50)bp


Revenues increased in total, in constant currency, and on an organic basis in both periods primarily due to higher Agency revenues and a contractual price increase from our news agreement with the Data & Analytics business of LSEG.

Reuters and the Data & Analytics business of LSEG have an agreement pursuant to which Reuters supplies news and information services to LSEG through October 1, 2048. In the first six months of 2026, Reuters recorded revenues of $207 million under this agreement, compared to $199 million in the prior-year period.

Segment adjusted EBITDA increased 5% and the related margin was unchanged in the second quarter. In the six-month period, segment adjusted EBITDA decreased 3% and the related margin decreased 180bp to 18.6% due to higher editorial costs. Foreign currency negatively impacted the year-over-year change in segment adjusted EBITDA margin by 80bp and 130bp in the second quarter and six-month period, respectively.

Global Print


Three months ended
June 30,


Six months ended
June 30,


Change


Change

(millions of U.S. dollars)

2026

2025

Total

Constant
Currency

Organic


2026

2025

Total

Constant
Currency

Organic

Revenues

111

114

(3%)


(3%)


(3%)


223

230

(3%)


(4%)


(4%)

Segment adjusted EBITDA

42

41

2%


1%


85

85

-


(1%)


Segment adjusted EBITDA margin

37.7%

36.0%

170bp


150bp


38.2%

36.9%

130bp


120bp


Page 10


Thomson Reuters Second Quarter Report 2026

img21084890_0.jpg


Revenues decreased in total, in constant currency, and on an organic basis in both periods primarily due to lower shipment volumes.

Segment adjusted EBITDA increased 2% in the second quarter and was unchanged in the six-month period. The related margin increased 170bp to 37.7% in the second quarter and 130bp to 38.2% in the six-month period due to lower costs. Foreign currency benefited the year-over-year change in segment adjusted EBITDA margin by 20bp in the second quarter and 10bp in the six-month period.

See the "Global Print Transaction" section within the "Executive Summary" of this management’s discussion and analysis for additional information.

Corporate costs


Three months ended
June 30,


Six months ended
June 30,


(millions of U.S. dollars)


2026


2025


2026


2025


Corporate costs


36


29


61


62


Liquidity and Capital Resources

We have historically maintained a disciplined capital strategy that balances growth, long-term financial leverage, credit ratings and returns to shareholders. We are focused on having the investment capacity to drive revenue growth, both organically and through acquisitions, while also maintaining our long-term financial leverage and credit ratings and continuing to provide returns to shareholders. We have diverse sources of liquidity to support our ongoing operations and the achievement of our disciplined capital strategy including cash and cash equivalents, cash provided by operating activities, and the ability to issue commercial paper, issue debt securities and borrow under our credit facility. Our principal uses of cash are for debt repayments, debt servicing costs, dividend payments, capital expenditures, share repurchases and acquisitions.

In the first six months of 2026, we spent $248 million on acquisitions, which substantially related to Noetica, Inc., a New York-based AI-native start-up that transforms transaction-deal data into structured market intelligence for deal professionals, repaid our $500 million 3.35% notes upon maturity with cash on hand and commercial paper borrowings, and returned $1,522 million to our common shareholders. Returns to common shareholders consisted of: (i) the repurchase of 3.6 million of our common shares for $362 million under our February 2026 plan to repurchase up to $600 million of our common shares under an amended Normal Course Issuer Bid (NCIB) approved by the TSX (which program was completed in July 2026); (ii) $555 million in dividends to our common shareholders and; (iii) $605 million of return of capital and share consolidation transactions, which consisted of a special cash distribution of $1.435518 per participating common share and a share consolidation, or "reverse stock split", that reduced the number of outstanding common shares by approximately 6.5 million. Refer to the "Share repurchases – NCIB" and "Return of capital and share consolidation transactions" subsections below and "Subsequent Events" sections of this management’s discussion and analysis for additional information.

Our capital strategy approach has provided us with a strong capital structure and liquidity position, which enables us to pursue organic and inorganic opportunities in key growth segments and drive shareholder returns. Our disciplined approach and highly recurring cash generative business model have allowed us to weather economic volatility in recent years caused by macroeconomic and geopolitical factors, while continuing to invest in our business.

We expect that the operating leverage of our business will increase our free cash flow if we increase revenues as contemplated by our outlook. We continue to target: (i) a leverage ratio of 2.5x net debt to adjusted EBITDA; (ii) a payout of 50% to 60% of our expected free cash flow as dividends to our shareholders; (iii) a return of at least 75% of our annual free cash flow to our shareholders in the form of dividends and share repurchases; and (iv) a return on invested capital (ROIC) that is double or more of our weighted-average cost of capital over time.

As of June 30, 2026, we had $577 million of cash and cash equivalents, and a net debt to adjusted EBITDA leverage ratio of 0.9:1, below our target leverage ratio of 2.5:1. As calculated under our credit facility covenant, our net debt to EBITDA leverage ratio as of June 30, 2026 was 0.8:1, which is also below the maximum leverage ratio allowed under the credit facility of 4.5:1.


We believe that our existing sources of liquidity will be sufficient to fund our expected cash requirements in the normal course of business for the next 12 months.

Certain information above in this section is forward-looking and should be read in conjunction with the section entitled “Additional Information - Cautionary Note Concerning Factors That May Affect Future Results”.

Page 11


Thomson Reuters Second Quarter Report 2026

img21084890_0.jpg


Cash flow

Summary of consolidated statement of cash flow


Three months ended
June 30,


Six months ended
June 30,

(millions of U.S. dollars)


2026


2025


$ Change


2026


2025


$ Change

Net cash provided by operating activities


920


746


174


1,425


1,191


234

Net cash used in investing activities


(206)


(182)


(24)


(573)


(938)


365

Net cash used in financing activities


(537)


(1,275)


738


(785)


(1,563)


778

Translation adjustments


-


4


(4)


(1)


6


(7)

Increase (decrease) in cash and cash equivalents


177


(707)


884


66


(1,304)


1,370

Cash and cash equivalents at beginning of period


400


1,371


(971)


511


1,968


(1,457)

Cash and cash equivalents at end of period


577


664


(87)


577


664


(87)

Non-IFRS Financial Measure(1)


Free cash flow


727


566


161


1,059


843


216


(1)
Refer to Appendices A and B of this management’s discussion and analysis for additional information and reconciliations of our non-IFRS financial measures to the most directly comparable IFRS financial measures.

Operating activities. Net cash provided by operating activities increased by $174 million and $234 million in the second quarter and six-month period, respectively, primarily due to higher cash benefits from the net impact of higher revenues and operating expenses, as well as certain favorable changes in working capital.

Investing activities. Net cash used in investing activities of $206 million and $573 million in the second quarter and six-month period of 2026, respectively, included $36 million and $248 million of acquisition spend and $177 million and $333 million of capital expenditures, respectively. In the six-month period, acquisition spend primarily included our acquisition of Noetica in the first quarter.

Net cash used in investing activities of $182 million and $938 million in the second quarter and six-month period of 2025, respectively, included $163 million and $314 million of capital expenditures, respectively. The six-month period also included $630 million of acquisition spend, which was predominantly our SafeSend acquisition.

Financing activities. Net cash used in financing activities was $537 million and $785 million in the second quarter and six-month period of 2026, respectively. Both periods reflected the repayment of our $500 million 3.35% notes and $605 million return of capital and share consolidation transactions. Additionally, the second quarter and six-month period included $100 million and $362 million of share repurchases and $275 million and $555 million of dividend payments to our common shareholders, respectively. These outflows were partly offset by $983 million and $1,305 million of net borrowings under our commercial paper program in the second quarter and six-month period, respectively.

Net cash used in financing activities of $1,275 million and $1,563 million in the second quarter and six-month period of 2025 reflected the repayment of our C$1.4 billion (U.S. $999 million) 2.239% notes upon maturity. Additionally, the second quarter and six-month period included $260 million and $519 million of dividend payments to our common shareholders, respectively.

Refer to the “Commercial paper program”, “Dividends”, “Share repurchases– NCIB” and "Return of capital and share consolidation transactions" subsections below for additional information.

Cash and cash equivalents. Cash and cash equivalents were $577 million as of June 30, 2026 and $511 million as of December 31, 2025.

Of total cash and cash equivalents, $126 million and $140 million as of June 30, 2026 and December 31, 2025, respectively, were held in subsidiaries which have regulatory restrictions, contractual restrictions or operate in countries where exchange controls and other legal restrictions apply and were therefore not available for general use by our company.

Free cash flow. Free cash flow increased by $161 million in the second quarter and $216 million in the six-month period primarily due to higher net cash provided by operating activities, partly offset by higher capital expenditures.

Additional information about our debt and credit arrangements, dividends and share repurchases is as follows:

Commercial paper program. Our $2.0 billion commercial paper program provides cost-effective and flexible short-term funding. The carrying amount of outstanding commercial paper of $1,618 million is included in “Current indebtedness” within the consolidated statement of financial position as of June 30, 2026 (December 31, 2025 - $295 million). Issuances of outstanding commercial paper reached a peak of $1,780 million during the first six months of 2026.


Page 12


Thomson Reuters Second Quarter Report 2026

img21084890_0.jpg


Credit facility. We have a $2.0 billion syndicated credit facility agreement which matures in November 2030 and may be used to provide liquidity for general corporate purposes (including acquisitions or support for our commercial paper program). There were no outstanding borrowings under the credit facility as of June 30, 2026 and December 31, 2025. Based on our current credit ratings, the cost of borrowing under the facility is priced at the Term Secured Overnight Financing Rate (SOFR)/Euro Interbank Offered Rate (EURiBOR)/Simple Sterling Overnight Index Average (SONIA) plus 92 basis points. We have the option to request an increase, subject to approval by applicable lenders, in the lenders’ commitments in an aggregate amount of $600 million for a maximum credit facility commitment of $2.6 billion. If our debt rating is downgraded by any two of Moody’s, S&P or Fitch, our facility fees and borrowing costs would increase, although availability would be unaffected. Conversely, an upgrade in our ratings may reduce our facility fees and borrowing costs. We also monitor the lenders that are party to our facility and believe they continue to be able to lend to us.

We guarantee borrowings by our subsidiaries under the credit facility. We must also maintain a ratio of net debt as defined in the credit agreement (total debt plus hedging agreements, less cash and cash equivalents) as of the last day of each fiscal quarter to EBITDA as defined in the credit agreement (earnings before interest, income taxes, depreciation and amortization and other modifications described in the credit agreement) for the last four quarters ended of not more than 4.5:1. If we complete an acquisition with a purchase price of over $500 million, we may elect, subject to notification, to temporarily increase the ratio of net debt to EBITDA to 5.0:1 at the end of the quarter within which the transaction closed and for each of the three immediately following fiscal quarters. At the end of that period, the ratio would revert to 4.5:1. As of June 30, 2026, we complied with this covenant as our ratio of net debt to EBITDA, as calculated under the terms of our syndicated credit facility, was 0.8:1.

Long-term debt. In May 2026, we repaid our $500 million 3.35% notes upon maturity with cash on hand and commercial paper borrowings.

We did not issue notes of term debt in the six months ended June 30, 2026. Thomson Reuters Corporation (TRC) and one of its U.S. subsidiaries, TR Finance LLC (TR Finance), may collectively issue up to $3.0 billion of unsecured debt securities from time to time through April 2027 under a base shelf prospectus. Any debt securities issued by TR Finance will be fully and unconditionally guaranteed on an unsecured basis by TRC and West Publishing Corporation, Thomson Reuters Applications Inc. and Thomson Reuters (Tax & Accounting) Inc., each of which is an indirect 100% owned U.S. and consolidated subsidiary of TRC. Any debt securities issued by TRC will also be guaranteed by the three U.S. subsidiary guarantors on the same basis as the TR Finance debt securities. Except for TR Finance and the subsidiary guarantors, none of TRC’s other subsidiaries have guaranteed or would otherwise become obligated with respect to any issued TR Finance or TRC debt securities. Neither TRC nor TR Finance has issued any debt securities under the prospectus. Please refer to Appendix D of this management’s discussion and analysis for condensed consolidating financial information of the Company, including TR Finance and the subsidiary guarantors.

Fixed-to-floating interest rate swaps. As of June 30, 2026, we entered into fixed-to-floating interest rate swaps totaling $635 million in notional amount, $225 million of which were entered into during the six months ended June 30, 2026 and $410 million in September 2025. Under these arrangements, we receive a fixed rate of interest and pay a floating rate based on SOFR plus a spread. These swaps are designated as fair value hedges for a portion of each of our $500 million principal amount of 5.85% notes due April 2040 ($225 million hedged), $119 million principal amount of 4.50% notes due May 2043 ($80 million hedged) and $350 million principal amount of 5.65% notes due November 2043 ($330 million hedged), covering the remaining term to debt maturity. The swaps were entered into as part of our strategy to manage interest rate risk.

In addition, we have credit support agreements with our counterparties under which one party may call on the other party to post cash collateral when the market value of the swaps exceeds specific thresholds, thus limiting credit exposure. As of June 30, 2026, we had a cash collateral receivable of $25 million (December 31, 2025 - $7 million) related to our fixed-to-floating interest rate swaps. Cash flows associated with collateral movements were classified as financing activities in the consolidated statement of cash flow.

Credit ratings. Our access to financing depends on, among other things, suitable market conditions and the maintenance of suitable long-term credit ratings. Our credit ratings may be adversely affected by various factors, including increased debt levels, decreased earnings, declines in customer demand, increased competition, a deterioration in general economic and business conditions and adverse publicity. Downgrades in our credit ratings may impede our access to the debt markets or result in higher borrowing rates.

The following table sets forth the credit ratings from rating agencies in respect of TRC and TR Finance's outstanding securities as of the date of this management's discussion and analysis:


Moody’s

S&P Global Ratings

Fitch


Long-term debt

Baa1

A-

A-


Commercial paper

P-2

A-2

F1


Trend/Outlook

Positive

Stable

Stable


Page 13


Thomson Reuters Second Quarter Report 2026

img21084890_0.jpg


These credit ratings are not recommendations to purchase, hold, or sell securities and do not address the market price or suitability of a specific security for a particular investor. Credit ratings may not reflect the potential impact of all risks on the value of securities. We cannot ensure that our credit ratings will not be lowered in the future or that rating agencies will not issue adverse commentaries regarding our securities.

Dividends. Dividends on our common shares are declared in U.S. dollars. In February 2026, we announced a 10% or $0.24 per share increase in the annualized dividend rate to $2.62 per common share (beginning with the common share dividend that we paid in March 2026). In our consolidated statement of cash flow, dividends paid on common shares are shown net of amounts reinvested in our company under our dividend reinvestment plan (DRIP). Registered holders of common shares may participate in our DRIP, under which cash dividends are automatically reinvested in new common shares. Common shares are valued at the weighted-average price at which the shares traded on the TSX during the five trading days immediately preceding the record date for the dividend.

Details of dividends declared per common share and dividends paid on common shares are as follows:


Three months ended
June 30,


Six months ended
June 30,

(millions of U.S. dollars, except per share amounts)

2026

2025


2026

2025

Dividends declared per common share


$0.655

$0.595


$1.31

$1.19

Dividends declared


284

269


576

536

Dividends reinvested


(9)

(9)


(21)

(17)

Dividends paid


275

260


555

519


Share repurchases – NCIB. We buy back shares (and subsequently cancel them) from time to time as part of our capital strategy. Share repurchases are typically executed under a NCIB program, which is approved by the TSX. The current NCIB program, as amended in February 2026, allows us to repurchase up to 16 million common shares between August 19, 2025 and August 18, 2026, of which 6.0 million common shares were repurchased from August through October of 2025. In February 2026, we announced our plan to repurchase up to $600 million of our common shares.


We may repurchase common shares in open market transactions on the TSX, Nasdaq and/or other exchanges and alternative trading systems, if eligible, or by such other means as may be permitted by the TSX and/or Nasdaq or under applicable law, including private agreement purchases or share purchase program agreement purchases if we receive, if applicable, an issuer bid exemption order in the future from applicable securities regulatory authorities in Canada for such purchases. The price that we will pay for common shares in open market transactions will be the market price at the time of purchase or such other price as may be permitted by the TSX.

Details of share repurchases are as follows:


Three months ended
June 30,


Six months ended
June 30,


2026


2026

Share repurchases (millions of U.S. dollars)


100


362

Shares repurchased (number in millions)


1.1


3.6

Share repurchases - average price per share


$91.35


$100.97


There were no share repurchases in the three and six months ended June 30, 2025.

Decisions regarding any future repurchases will depend on certain factors, such as market conditions, share price and other opportunities to invest capital for growth. We may elect to suspend or discontinue share repurchases at any time, in accordance with applicable laws. From time to time when we do not possess material nonpublic information about ourselves or our securities, we may enter into a pre-defined plan with our broker to allow for the repurchase of shares at times when we ordinarily would not be active in the market due to our own internal trading blackout periods, insider trading rules or otherwise. Any such plans entered into with our broker will be adopted in accordance with applicable Canadian securities laws and the requirements of Rule 10b5-1 under the U.S. Securities Exchange Act of 1934, as amended. We entered into such a plan with our broker on March 2, 2026. In July 2026, we completed our $600 million share repurchase program by repurchasing an additional 2.6 million common shares totaling $238 million (see the "Subsequent Events" section of this management’s discussion and analysis for additional information).

Page 14


Thomson Reuters Second Quarter Report 2026

img21084890_0.jpg


Return of capital and share consolidation transactions. On May 4, 2026, we returned $605 million to our shareholders and reduced our common shares outstanding by approximately 6.5 million shares through return of capital and share consolidation transactions, which was derived from the May 2024 sales of LSEG shares. The transactions consisted of a special cash distribution of $1.435518 per participating common share and a share consolidation, or “reverse stock split”, which reduced the number of outstanding common shares at a ratio of 1 pre-consolidated share for 0.984560 post-consolidated shares. Shareholders who were subject to income tax in a jurisdiction other than Canada were given the opportunity to opt-out of the return of capital. The share consolidation was proportional to the special cash distribution, and the share consolidation ratio was based on the volume weighted-average trading price of our company's common shares on the Nasdaq for the five-trading day period immediately preceding the May 4, 2026 effective date. Woodbridge, the Company's principal shareholder, participated in this transaction.

Financial position


Our net assets, defined as total assets less total liabilities, were $11.1 billion as of June 30, 2026 compared to $11.9 billion as of December 31, 2025. The change during the six-month period was due to an increase in our current indebtedness.

As of June 30, 2026, our current liabilities exceeded our current assets by $2.2 billion primarily because our current liabilities included $1.3 billion of deferred revenue. We also had $1.6 billion of current indebtedness, which represent our commercial paper borrowings outstanding.

Deferred revenue arises from the sale of subscription-based products and services that many customers pay for in advance. The cash received from these advance payments is used to currently fund the operating, investing and financing activities of our business. However, for accounting purposes, these advance payments must be deferred and recognized over the term of the subscription. As such, we may reflect a negative working capital position in our consolidated statement of financial position. In the ordinary course of business, deferred revenue does not represent a cash obligation, but rather an obligation to perform services or deliver products, and therefore when we are in that situation, we do not believe it is indicative of a liquidity issue, but rather an outcome of the required accounting for our business model.

With respect to current indebtedness, we believe we can refinance these amounts at any time, given our credit facility and access to long-term debt markets, both of which are supported by our strong investment grade credit ratings. Additionally, the cash generated from our operating activities is a significant source of liquidity, which could be used to repay a portion of the amounts outstanding.

Net debt and leverage ratio of net debt to adjusted EBITDA


June 30,


December 31,


(millions of U.S. dollars)


2026


2025


Net debt(1)


2,628


1,896


Leverage ratio of net debt to adjusted EBITDA


Adjusted EBITDA(1)


3,075


2,936


Net debt / adjusted EBITDA(1)


0.9:1


0.6:1


(1)
Represent non-IFRS financial measures. Refer to Appendices A and B of this management’s discussion and analysis for additional information and reconciliations of our non-IFRS financial measures to the most directly comparable IFRS financial measures.

For additional information about our liquidity, we provide our leverage ratio of net debt to adjusted EBITDA for the previous twelve-month period ending with the current fiscal quarter. Our leverage ratio of net debt to adjusted EBITDA was below our target leverage ratio of 2.5:1. Net debt increased during the first six months of 2026 primarily due to higher commercial paper borrowings outstanding (refer to the “Cash Flow” section of this management’s discussion and analysis for additional information).

As of June 30, 2026, our total debt position (excluding the associated unamortized transaction costs and premiums or discounts) was $3.0 billion. The maturity dates for our term debt are well balanced with no significant concentration in any one year and are scheduled to mature in 2035, 2040 and 2043. As of June 30, 2026, the average maturity of our term debt was approximately 14 years at a weighted-average interest rate of slightly less than 6%, including the impact of interest rate swaps based on the June 30, 2026 SOFR.

Off-balance sheet arrangements, commitments and contractual obligations

See the “Guarantees” section of this management’s discussion and analysis below for information on guarantees and other credit support provided by our company to 3 Times Square Associates LLC (3XSQ Associates) in connection with an amended and restated loan facility 3XSQ Associates obtained in May 2025. For a summary of our other off-balance sheet arrangements, commitments and contractual obligations please see our 2025 annual management’s discussion and analysis. There were no material changes to these arrangements, commitments and contractual obligations during the six months ended June 30, 2026.

Page 15


Thomson Reuters Second Quarter Report 2026

img21084890_0.jpg


Contingencies

Lawsuits and legal claims

We are engaged in various legal proceedings, claims, audits and investigations that have arisen in the ordinary course of business. These matters include, but are not limited to, employment matters, commercial matters, privacy and data protection matters, defamation matters and intellectual property infringement matters. The outcome of all the matters against us is subject to future resolution, including uncertainties of litigation. Litigation outcomes are difficult to predict with certainty due to various factors, including but not limited to: the preliminary nature of some claims; uncertain damage theories and demands; an incomplete factual record; uncertainty concerning legal theories and procedures and their resolution by the courts, at both trial and appellate levels; and the unpredictable nature of opposing parties. Based on information currently known to us and after consultation with outside legal counsel, management believes that the ultimate resolution of any such matters, individually or in the aggregate, will not have a material adverse impact on our financial condition taken as a whole.

Uncertain tax positions

We are subject to taxation in numerous jurisdictions and we are routinely under audit by many different taxing authorities in the ordinary course of business. There are many transactions and calculations during the course of business for which the ultimate tax determination is uncertain, as taxing authorities may challenge some of our positions and propose adjustments or changes to our tax filings.

As a result, we maintain provisions for uncertain tax positions that we believe appropriately reflect our risk. These provisions are made using our best estimates of the amount expected to be paid based on a qualitative assessment of all relevant factors. When appropriate, we perform an expected value calculation to determine our provisions. We review the adequacy of these provisions at the end of each reporting period and adjust them based on changing facts and circumstances.

Prior to December 31, 2023, we paid $430 million of tax as required under notices of assessment issued by the U.K. tax authority, HM Revenue & Customs (HMRC), under the Diverted Profits Tax (DPT) regime that collectively related to the 2015, 2016, 2017 and 2018 taxation years of certain of our current and former U.K. affiliates. We do not believe these current and former U.K. affiliates fall within the scope of the DPT regime. Because we believe our position is supported by the weight of law, we intend to vigorously defend our position and will continue contesting these assessments through all available administrative and judicial remedies. As the assessments largely relate to businesses that we have sold, the majority are subject to indemnity arrangements under which we have been required to pay additional taxes to HMRC or the indemnity counterparty. Payments made by us are not a reflection of our view on the merits of the case. As we expect to receive refunds of substantially all of the amounts paid pursuant to these notices of assessment, we have recorded substantially all of these payments as non-current receivables from HMRC or the indemnity counterparty, in our financial statements.

Due to the uncertainty associated with tax audits, it is possible that at some future date, liabilities resulting from such audits or related litigation could vary significantly from our provisions. However, based on currently enacted legislation, information currently known to us and after consultation with outside tax advisors, management believes that the ultimate resolution of any such matters, individually or in the aggregate, will not have a material adverse impact on our financial condition taken as a whole.

Guarantees

We have an investment in 3XSQ Associates, an entity jointly owned by a subsidiary of our company and Rudin Times Square Associates LLC (Rudin), that owns and operates the 3 Times Square office building (the building) in New York, New York. In May 2025, 3XSQ Associates extended the maturity of its 3-year term loan facility from June 2025 for an additional 2 years to June 2027 and reduced the facility to $385 million from $415 million. The facility was obtained in 2022 to refinance existing debt, fund the building’s redevelopment, and cover interest and operating costs during the redevelopment period. The building is pledged as loan collateral. We and Rudin each guarantee 50% of (i) certain principal loan amounts and (ii) interest and operating costs. We and Rudin also jointly and severally guarantee (i) completion of commenced works and (ii) lender losses arising from disallowed acts, environmental or otherwise. To minimize economic exposure to 50% for the joint and several obligations, we and a parent entity of Rudin entered into a cross-indemnification arrangement. We believe the value of the building is expected to be sufficient to cover obligations that could arise from the guarantees. The guarantees do not impact our ability to borrow funds under our $2.0 billion syndicated credit facility or the related covenant calculation.

For additional information, please see the “Risk Factors” section of our 2025 annual report, which contains further information on risks related to legal and tax matters.


Page 16


Thomson Reuters Second Quarter Report 2026

img21084890_0.jpg


Outlook


The information in this section is forward-looking and should be read in conjunction with the section entitled “Additional Information - Cautionary Note Concerning Factors That May Affect Future Results”.


In August 2026, we raised our 2026 full-year outlook for total and organic revenue growth to reflect the performance of our businesses during the first six months of the year. Our total and organic revenue growth outlooks for our total company were raised to approximately 8.0%, compared to a revenue growth range of 7.5% to 8.0% previously communicated on May 5, 2026. We also raised the total and organic revenue growth outlooks for our "Big 3" segments to a range of 9.5% to 10.0%, compared to our previous guidance of approximately 9.5%. All other metrics in our August 5, 2026 full-year outlook are unchanged from the previous guidance.

The following table sets forth our full-year 2026 outlook and our full-year 2025 actual results, which include non-IFRS financial measures. Our outlook assumes constant currency rates relative to 2025 and incorporates the February 2026 Noetica acquisition, but does not factor in the impact of any future acquisitions or dispositions that may occur during the remainder of the year. We believe this type of guidance provides useful insight into the anticipated performance of our businesses.

Our company signed a definitive agreement to enter into a joint venture with KKR. As part of the transaction, we will sell a 51% stake in our Global Print business to capital accounts advised by KKR. Our company will receive approximately $500 million in gross proceeds at closing. The transaction is expected to close in the fourth quarter of 2026, subject to specified regulatory approvals and customary closing conditions. Our full-year 2026 outlook includes the forecasted results of the Global Print segment, consistent with our prior 2026 full-year outlooks. We will report our Global Print business as a discontinued operation when we release our third quarter results and plan to provide an updated full-year 2026 outlook at that time. See the "Global Print Transaction" section within the "Executive Summary" of this management’s discussion and analysis for further information.


We continue to operate in an uncertain macroeconomic environment, reflecting ongoing geopolitical risk, uneven economic growth and an evolving interest rate and inflationary backdrop. Any worsening of the global economic or business environment, among other factors, could impact our ability to achieve our outlook.


Total Thomson Reuters

2025 Actual


2026 Outlook
2/5/2026


2026 Outlook
5/5/2026


2026 Outlook
8/5/2026

Revenue growth

3%(2)


7.5% - 8.0%


Unchanged


~8.0%

Organic revenue growth(1)

7%


7.5% - 8.0%


Unchanged


~8.0%

Adjusted EBITDA margin(1)

39.2%


+100bp vs 2025


Unchanged


Unchanged

Corporate costs

$118 million


$115 - $125 million


Unchanged


Unchanged

Free cash flow(1)

$1.95 billion


~$2.1 billion


Unchanged


Unchanged

Accrued capital expenditures as a
   percentage of revenues
(1)

8.2%


~8.0%


Unchanged


Unchanged

Depreciation and amortization of
   software

$832 million


$890 - $910 million


Unchanged


Unchanged

  Depreciation and amortization of
     internally developed software

$626 million


$680 - $690 million


Unchanged


Unchanged

  Amortization of acquired software

$206 million


$210 - $220 million


Unchanged


Unchanged

Net interest expense

$143 million


$150 - $160 million


$180 - $190 million


Unchanged

Effective tax rate on adjusted earnings(1)

18.5%


~19%


Unchanged


Unchanged


“Big 3” Segments(1)

2025 Actual


2026 Outlook
2/5/2026


2026 Outlook
5/5/2026


2026 Outlook
8/5/2026

Revenue growth

4%(2)


~9.5%


Unchanged


9.5% - 10.0%

Organic revenue growth

9%


~9.5%


Unchanged


9.5% - 10.0%

Adjusted EBITDA margin

43.6%


+100bp vs 2025


Unchanged


Unchanged


(1)
Non-IFRS financial measures. Refer to Appendices A and B of this management’s discussion and analysis for additional information and reconciliations of our non-IFRS financial measures to the most directly comparable IFRS financial measures.
(2)
Total revenue growth reflects the impact of the disposals of FindLaw and other non-core businesses in December 2024.

Our third quarter 2026 outlook includes the forecasted results of the Global Print segment, consistent with our prior 2026 quarterly outlooks. We expect our third-quarter 2026 organic revenue growth to be approximately 8% and our adjusted EBITDA margin to be approximately 36%.

Page 17


Thomson Reuters Second Quarter Report 2026

img21084890_0.jpg


The following table summarizes our material assumptions and risks that may cause actual performance to differ from our expectations underlying our 2026 financial outlook.


Revenues

Material assumptions


Material risks

Uncertain macroeconomic and geopolitical conditions will continue to disrupt the economy and cause periods of volatility
Continued need for trusted products and services that help customers navigate evolving and complex legal, tax, audit, accounting, regulatory, geopolitical and commercial changes, developments and environments, and for cloud-based digital tools that drive productivity
Continued ability to deliver innovative products that meet evolving customer demands
Acquisition of new customers through expanded and improved digital platforms, simplification of the product portfolio and through other sales initiatives
Improvement in customer retention through commercial simplification efforts and customer service improvements


Ongoing geopolitical and macroeconomic uncertainty continue to impact the global economy. The severity and duration of this uncertainty could lead to lower demand for our products and services (beyond our assumption that these disruptions will cause periods of volatility)
Uncertainty in the legal regulatory regime relating to AI. Enacted or potential future legislation may make it harder for us to conduct business using AI, lead to regulatory fines or penalties, require us to change product offerings or business practices, or prevent or limit our use of AI
Demand for our products and services could be reduced by changes in customer buying patterns, or our inability to execute on key product design or customer support initiatives
Competitive pricing actions and product innovation could impact our revenues
Our sales, commercial simplification and product design initiatives may be insufficient to retain customers or generate new sales

Adjusted EBITDA margin

Material assumptions


Material risks

Our ability to achieve revenue growth targets
Business mix continues to shift to higher-growth product offerings
Integration expenses associated with recent acquisitions will reduce margins


Same as the risks above related to the revenue outlook
Higher than expected technology costs to deliver innovative solutions to our customers
Higher than expected inflation may lead to greater than anticipated increase in labor costs, third-party supplier costs and costs of print materials
Acquisition and disposal activity may dilute adjusted EBITDA margin

Free Cash Flow

Material assumptions


Material risks

Our ability to achieve our revenue and adjusted EBITDA margin targets
Accrued capital expenditures expected to approximate 8.0% of revenues in 2026


Same as the risks above related to the revenue and adjusted EBITDA margin outlook
A weaker macroeconomic environment could negatively impact working capital performance, including the ability of our customers to pay us
Capital expenditures may be higher than currently expected
The timing and amount of tax payments to governments may differ from our expectations


Page 18


Thomson Reuters Second Quarter Report 2026

img21084890_0.jpg


Effective tax rate on adjusted earnings

Material assumptions


Material risks

Our ability to achieve our adjusted EBITDA target
The mix of taxing jurisdictions where we recognized pre-tax profit or losses in 2025 does not significantly change in 2026
Minimal changes in currently enacted tax laws and treaties within the jurisdictions where we operate
No significant charges or benefits from the finalization of prior tax years
Depreciation and amortization of internally developed software of $680 - $690 million in 2026
Net interest expense of $180 - $190 million in 2026


Same as the risks above related to adjusted EBITDA
A material change in the geographical mix of our pre-tax profits and losses
A material change in current tax laws or treaties to which we are subject, and did not expect
Resolution of tax audits may cause material changes to assessments of uncertain tax positions compared to current estimates
Depreciation and amortization of internally developed software as well as net interest expense may be significantly higher or lower than expected


Our outlook contains various non-IFRS financial measures. We believe that providing reconciliations of forward-looking non-IFRS financial measures in our outlook would be potentially misleading and not practical due to the difficulty of projecting items that are not reflective of ongoing operations in any future period. The magnitude of these items may be significant. Consequently, for purposes of our outlook only, we are unable to reconcile these measures to the most comparable IFRS measures because we cannot predict, with reasonable certainty, the impact of changes in foreign exchange rates which impact (i) the translation of our results reported at average foreign currency rates for the year and (ii) other finance income or expense related to intercompany financing arrangements. Additionally, we cannot reasonably predict the occurrence or amount of other operating gains and losses, which generally arise from business transactions we do not currently anticipate.

Related Party Transactions

As of August 4, 2026, our principal shareholder, Woodbridge (together with its affiliates), beneficially owned approximately 71% of our common shares.

In the six months ended June 30, 2026, we contributed $7 million in cash to 3XSQ Associates pursuant to a capital call.

Except for the above transaction, there were no new significant related party transactions during the first six months of 2026. Refer to the “Related Party Transactions” section of our 2025 annual management’s discussion and analysis, which is contained in our 2025 annual report, as well as note 32 of our 2025 annual consolidated financial statements for information regarding related party transactions.

Subsequent Events

Global Print Transaction

On July 14, 2026, we announced a definitive agreement to enter into a joint venture with KKR, a leading global investment firm. As part of the transaction, we will sell a 51% stake in our Global Print business to capital accounts advised by KKR and retain a 49% equity interest in the joint venture. We expect to receive approximately $500 million in gross proceeds at closing and expect the transaction to close in the fourth quarter of 2026, subject to specified regulatory approvals and customary closing conditions. We expect to record a pre-tax gain on the transaction at the time of closing.

We will maintain intellectual property rights and full editorial control over our content portfolio. This new joint venture will hold an exclusive license to distribute the content in print and on ProView, Global Print’s eBook platform, under which it will pay us a royalty in return. We will also provide certain operational services to the joint venture under a multi-year transition services agreement.

As part of the transaction, we have agreed to provide certain financial support designed to give KKR a minimum return on its equity investment in the joint venture under certain circumstances.

The Global Print business will be classified as a discontinued operation in the third quarter of 2026 and will no longer be a reportable segment.

Share Repurchases

In July 2026, we completed our $600 million share repurchase program announced in February 2026 by repurchasing an additional 2.6 million common shares totaling $238 million. The average price per share was $92.61.

Page 19


Thomson Reuters Second Quarter Report 2026

img21084890_0.jpg


Changes in Accounting Policies

Please refer to the “Changes in Accounting Policies” section of our 2025 annual management’s discussion and analysis, which is contained in our 2025 annual report, as well as note 1 of our consolidated interim financial statements for the three and six months ended June 30, 2026, for information regarding changes in accounting policies and recent accounting pronouncements.

Critical Accounting Estimates and Judgments

The preparation of financial statements requires management to make estimates and judgments about the future. Estimates and judgments are continually evaluated and are based on historical experience and other factors, including expectations of future events that are believed to be reasonable under the circumstances. Please refer to the “Critical Accounting Estimates and Judgments” section of our 2025 annual management’s discussion and analysis, which is contained in our 2025 annual report, for additional information. Since the date of our 2025 annual management’s discussion and analysis, there have not been any significant changes to our critical accounting estimates and judgments.

We continue to operate in an uncertain macroeconomic environment, reflecting ongoing geopolitical risk, uneven economic growth and an evolving interest rate and inflationary backdrop, among other factors. While we are closely monitoring these conditions to assess potential impacts on our businesses, some of management’s estimates and judgments may be more variable and may change materially in the future due to the significant uncertainty created by these circumstances.

Additional Information

Basis of presentation


Revisions to segment results


In the first quarter of 2026, we changed our segment reporting to reflect how we currently manage our segments. The change reflects the transfer of certain customers and their related revenues and expenses among our Legal Professionals, Corporates and Tax, Audit & Accounting Professionals segments. These changes impact the financial results of our segments, but do not change our consolidated financial results. The following summarizes the changes to the applicable segment's reported amounts.


Three months ended June 30, 2025

Legal Professionals revenues decreased $5 million to $704 million, adjusted EBITDA was unchanged at $339 million and adjusted EBITDA margin increased 30 basis points to 48.1%;
Corporates revenues increased $8 million to $480 million, adjusted EBITDA increased $3 million to $172 million and adjusted EBITDA margin was unchanged at 35.7%; and
Tax, Audit & Accounting Professionals revenues decreased $3 million to $274 million, adjusted EBITDA decreased $3 million to $110 million and adjusted EBITDA margin decreased 40 basis points to 38.9%.


Six months ended June 30, 2025

Legal Professionals revenues decreased $10 million to $1,392 million, adjusted EBITDA was unchanged at $675 million and adjusted EBITDA margin increased 30 basis points to 48.4%;
Corporates revenues increased $15 million to $1,028 million, adjusted EBITDA increased $5 million to $387 million and adjusted EBITDA margin decreased 10 basis points to 37.6%; and
Tax, Audit & Accounting Professionals revenues decreased $5 million to $632 million, adjusted EBITDA decreased $5 million to $318 million and adjusted EBITDA margin decreased 20 basis points to 48.9%.

Disclosure controls and procedures

Our Chief Executive Officer and Chief Financial Officer, after evaluating the effectiveness of our disclosure controls and procedures (as defined in applicable U.S. and Canadian securities law) as of the end of the period covered by this management’s discussion and analysis, have concluded that our disclosure controls and procedures were effective to ensure that all information that we are required to disclose in reports that we file or furnish under the U.S. Securities Exchange Act and applicable Canadian securities law is (i) recorded, processed, summarized and reported within the time periods specified in the rules and forms of the SEC and Canadian securities regulatory authorities; and (ii) accumulated and communicated to our management, including our Chief Executive Officer and Chief Financial Officer, to allow timely decisions regarding required disclosure.

Internal control over financial reporting

Our management is responsible for establishing and maintaining adequate internal control over financial reporting to provide reasonable assurance regarding the reliability of financial reporting and the preparation of financial statements for external purposes in accordance with IFRS.

There was no change in our internal control over financial reporting during the second quarter of 2026 that materially affected, or is reasonably likely to materially affect, our internal control over financial reporting.

Page 20


Thomson Reuters Second Quarter Report 2026

img21084890_0.jpg


Share capital

As of August 4, 2026, we had outstanding 433,224,578 common shares, 6,000,000 Series II preference shares, 2,052,272 stock options and a total of 2,206,514 time-based restricted share units and performance restricted share units. We have also issued a Thomson Reuters Founders Share which enables Thomson Reuters Founders Share Company to exercise extraordinary voting power to safeguard the Thomson Reuters Trust Principles.

Public securities filings and regulatory announcements

You may access other information about our company, including our 2025 annual report (which contains information required in an annual information form) and our other disclosure documents, reports, statements or other information that we file with the Canadian securities regulatory authorities through SEDAR+ at sedarplus.ca and in the United States with the SEC at sec.gov.

Cautionary note concerning factors that may affect future results

Certain statements in this management’s discussion and analysis are forward-looking, including, but not limited to, the 2026 business outlook section, the Company's expectations with respect to the Global Print transaction including its current expectation that the transaction will close in the fourth quarter of 2026, and statements related to the Company’s intentions to target a leverage ratio of 2.5x net debt to adjusted EBITDA, a dividend payout ratio of between 50% to 60% of its free cash flow, to return at least 75% of free cash flow annually in the form of dividends and share repurchases, as well as its target to earn a ROIC that is double or more of its weighted-average cost of capital over time, the Company’s expectations regarding refunds on amounts paid to HMRC, and other expectations regarding its liquidity and capital resources including its ability to refinance its current debt obligations. The words “will”, “expect”, “believe”, “target”, “estimate”, “could”, “should”, “intend”, “predict”, “project” and similar expressions identify forward-looking statements. While we believe that we have a reasonable basis for making forward-looking statements in this management’s discussion and analysis, they are not a guarantee of future performance or outcomes or that any other events described in any forward-looking statement will materialize. Forward-looking statements are subject to a number of risks, uncertainties and assumptions that could cause actual results or events to differ materially from current expectations. Many of these risks, uncertainties and assumptions are beyond the Company’s control and the effects of them can be difficult to predict. In particular, the full extent of the impact of macroeconomic and geopolitical environment on the Company’s business, operations and financial results will depend on numerous evolving factors that we may not be able to accurately predict.


Certain factors that could cause actual results or events to differ materially from current expectations are discussed in the “Outlook” section above. Additional factors are discussed in the “Risk Factors” section of our 2025 annual report and in materials that we from time to time file with, or furnish to, the Canadian securities regulatory authorities and the U.S. SEC. Many of those risks are, and could be, exacerbated by a worsening of the global geopolitical, business and economic environments. There is no assurance that any forward-looking statement will materialize.


The Company's business outlook is based on information currently available to the Company and is based on various external and internal assumptions made by the Company in light of its experience and perception of historical trends, current conditions and expected future developments, as well as other factors that the Company believes are appropriate under the circumstances.


The Company has provided a business outlook for the purpose of presenting information about current expectations for the periods presented. This information may not be appropriate for other purposes. You are cautioned not to place undue reliance on forward-looking statements which reflect expectations only as of the date of this management’s discussion and analysis. Except as may be required by applicable law, Thomson Reuters disclaims any obligation to update or revise any forward-looking statements.

Page 21


Thomson Reuters Second Quarter Report 2026

img21084890_0.jpg


Appendix A

Non-IFRS Financial Measures

We use non-IFRS financial measures, which include ratios that incorporate one or more non-IFRS financial measures, as supplemental indicators of our operating performance and financial position as well as for internal planning purposes, our management incentive programs and our business outlook. These measures do not have any standardized meaning prescribed by IFRS and therefore are unlikely to be comparable to the calculation of similar measures used by other companies.

The following table sets forth our non-IFRS financial measures including an explanation of why we believe they are useful measures of our performance. Reconciliations to the most directly comparable IFRS measure are reflected in Appendix B of this management’s discussion and analysis.


How We Define It


Why We Use It and Why It Is Useful to Investors


Most Directly Comparable IFRS Measure

Adjusted EBITDA and the related margin

Represents earnings or losses from continuing operations before tax expense or benefit, net interest expense, other finance costs or income, depreciation, amortization of software and other identifiable intangible assets, our share of post-tax earnings or losses in equity method investments, other operating gains and losses, certain asset impairment charges and fair value adjustments, including those related to acquired deferred revenue.

The related margin is adjusted EBITDA expressed as a percentage of revenues. For purposes of this calculation, revenues are before fair value adjustments to acquired deferred revenue.


Provides a consistent basis to evaluate operating profitability and performance trends by excluding items that we do not consider to be controllable activities for this purpose.

Also represents a measure commonly reported and widely used by investors as a valuation metric, as well as to assess our ability to incur and service debt.


Earnings from continuing operations

Adjusted EBITDA less accrued capital expenditures and the related margin

Represents adjusted EBITDA less accrued capital expenditures, where accrued capital expenditures include amounts that remain unpaid at the reporting date.

The related margin is adjusted EBITDA less accrued capital expenditures expressed as a percentage of revenues. For purposes of this calculation, revenues are before fair value adjustments to acquired deferred revenue.


Provides a basis for evaluating the operating profitability and capital intensity of a business in a single measure. This measure captures investments regardless of whether they are expensed or capitalized, and reflects the basis on which management measures capital spending.


Earnings from continuing operations

Accrued capital expenditures as a percentage of revenues

Accrued capital expenditures expressed as a percentage of revenues. For purposes of this calculation, revenues are before fair value adjustments to acquired deferred revenue.


Reflects the basis on how we manage capital expenditures for internal planning purposes.


Capital expenditures


Page 22


Thomson Reuters Second Quarter Report 2026

img21084890_0.jpg


How We Define It


Why We Use It and Why It Is Useful to Investors


Most Directly Comparable IFRS Measure


Adjusted earnings and adjusted EPS

Net earnings or loss including dividends declared on preference shares but excluding the post-tax impacts of fair value adjustments, including those related to acquired deferred revenue, amortization of acquired intangible assets (attributable to other identifiable intangible assets and acquired software), other operating gains and losses, certain asset impairment charges, other finance costs or income, our share of post-tax earnings or losses in equity method investments, discontinued operations and other items affecting comparability. Acquired intangible assets contribute to the generation of revenues from acquired companies, which are included in our computation of adjusted earnings.

The post-tax amount of each item is excluded from adjusted earnings based on the specific tax rules and tax rates associated with the nature and jurisdiction of each item.


Provides a more comparable basis to analyze earnings.

These measures are commonly used by shareholders to measure performance.


Net earnings and diluted EPS

Adjusted EPS is calculated from adjusted earnings using diluted weighted-average shares and does not represent actual earnings or loss per share attributable to shareholders.


Effective tax rate on adjusted earnings

Adjusted tax expense divided by pre-tax adjusted earnings. Adjusted tax expense is computed as income tax expense or benefit plus or minus the income tax impacts of all items impacting adjusted earnings (as described above), and other tax items impacting comparability.

In interim periods, we also make an adjustment to reflect income taxes based on the estimated full-year effective tax rate. Earnings or losses for interim periods under IFRS reflect income taxes based on the estimated effective tax rates of each of the jurisdictions in which we operate. The non-IFRS adjustment reallocates estimated full-year income taxes between interim periods but has no effect on full-year income taxes.


Provides a basis to analyze the effective tax rate associated with adjusted earnings.


Our effective tax rate computed in accordance with IFRS may be more volatile by quarter because the geographical mix of pre-tax profits and losses in interim periods may be different from that for the full year. Therefore, we believe that using the expected full-year effective tax rate provides more comparability among interim periods.


Tax expense


Page 23


Thomson Reuters Second Quarter Report 2026

img21084890_0.jpg


How We Define It


Why We Use It and Why It Is Useful to Investors


Most Directly Comparable IFRS Measure


Net debt and leverage ratio of net debt to adjusted EBITDA

Net debt:

Total debt, plus related hedging instruments and collateral balances, along with lease liabilities, excluding unamortized transaction costs and any premiums or discounts on debt, minus cash and cash equivalents. We exclude specific hedging components to reflect the net cash outflow upon debt maturity.


Provides a commonly used measure of a company’s leverage.


Given that we hedge some of our debt to manage risk, we include hedging instruments as we believe it provides a better measure of the total obligation associated with our outstanding debt. Since we plan to hold our debt and related hedges until maturity, the net debt calculation is adjusted to reflect the net cash outflow at maturity, after deducting cash and cash equivalents.


Total debt (current indebtedness plus long-term indebtedness)


Net debt to adjusted EBITDA:

Net debt is divided by adjusted EBITDA for the previous twelve-month period ending with the current fiscal quarter.


Provides a commonly used measure of a company’s ability to pay its debt. Our non-IFRS measure is aligned with the calculation of our internal target leverage ratio and is more conservative than the maximum ratio allowed under the contractual covenants in our credit facility.


For adjusted EBITDA, refer to the definition above for the most directly comparable IFRS measure

Free cash flow

Net cash provided by operating activities and other investing activities, less capital expenditures, payments of lease principal and dividends paid on our preference shares.


Helps assess our ability, over the long term, to create value for our shareholders as it represents cash available to repay debt, pay common dividends and fund share repurchases and acquisitions.


Net cash provided by operating activities

Changes before the impact of foreign currency or at constant currency

Applicable measures where changes are reported before the impact of foreign currency or at constant currency

IFRS Measures:

Revenues
Operating expenses

 Non-IFRS Measures and ratios:

Adjusted EBITDA and adjusted EBITDA margin
Adjusted EPS

Our reporting currency is the U.S. dollar. However, we conduct activities in currencies other than the U.S. dollar. We measure our performance before the impact of foreign currency (or at constant currency or excluding the effects of currency), which is determined by converting the current and equivalent prior period’s local currency results using the same foreign currency exchange rate.


Provides better comparability of business trends from period to period.


For each non-IFRS measure and ratio, refer to the definitions above for the most directly comparable IFRS measure.


Page 24


Thomson Reuters Second Quarter Report 2026

img21084890_0.jpg


How We Define It


Why We Use It and Why It Is Useful to Investors


Most Directly Comparable IFRS Measure


Changes in revenues computed on an organic basis

Represent changes in revenues of our existing businesses at constant currency. The metric excludes the distortive impacts of acquisitions and dispositions from not owning the business in both comparable periods.

For acquisitions, we calculate organic growth as though we had owned the acquired business in both periods. We compare revenues for the acquired business for the period we owned the business to the same prior-year period revenues for that business, when we did not own it.
For dispositions, we calculate organic growth only for the time we owned the business in the current period, compared to the same period in the prior year.


Provides further insight into the performance of our existing businesses by excluding distortive impacts and serves as a better measure of our ability to grow our business over the long term.


Revenues

“Big 3” segments

Our combined Legal Professionals, Corporates and Tax, Audit & Accounting Professionals segments. All measures reported for the “Big 3” segments are non-IFRS financial measures.


The “Big 3” segments comprise approximately 80% of revenues and represent the core of our business information service product offerings.


Revenues

Earnings from continuing operations


Page 25


Thomson Reuters Second Quarter Report 2026

img21084890_0.jpg


Appendix B

This appendix provides reconciliations of our non-IFRS financial measures to the most directly comparable IFRS measure for the three and six months ended June 30, 2026 and 2025, and year ended December 31, 2025.

Rounding

Other than EPS, we report our results in millions of U.S. dollars, but we compute percentage changes and margins using whole dollars to be more precise. As a result, percentages and margins calculated from reported amounts may differ from those presented, and growth components may not total due to rounding.

Reconciliation of earnings from continuing operations to adjusted EBITDA and adjusted EBITDA less accrued capital expenditures


Three months ended
June 30,

Six months ended
June 30,

Year ended
December 31,

(millions of U.S. dollars)

2026

2025

2026

2025

2025

Earnings from continuing operations

444

297

921

722

1,483

Adjustments to remove:


Tax expense

71

52

196

144

423

Other finance (income) costs

(8)

48

(17)

58

55

Net interest expense

47

35

86

65

143

Amortization of other identifiable intangible assets

25

24

49

49

98

Amortization of software

201

178

394

352

721

Depreciation

27

28

55

55

111

EBITDA

807

662

1,684

1,445

3,034

Adjustments to remove:


Share of post-tax losses in equity method
   investments

4

4

11

10

28

Other operating gains, net

(68)

(5)

(68)

(2)

(164)

Fair value adjustments(1)

2

17

(1)

34

38

Adjusted EBITDA

745

678

1,626

1,487

2,936

Deduct: Accrued capital expenditures

(179)

(157)

(340)

(295)

(616)

Adjusted EBITDA less accrued capital
   expenditures

566

521

1,286

1,192

2,320

Adjusted EBITDA margin

38.1%

37.8%

40.2%

40.1%

39.2%

Adjusted EBITDA less accrued capital
   expenditures margin

29.0%

29.0%

31.8%

32.2%

31.0%


(1)
Fair value adjustments primarily represent gains or losses due to changes in foreign currency exchange rates on intercompany balances that arise in the ordinary course of business, a component of operating expenses, as well as adjustments related to acquired deferred revenue.

Reconciliation of capital expenditures to accrued capital expenditures


Three months ended
June 30,

Six months ended
June 30,

Year ended
December 31,

(millions of U.S. dollars)

2026

2025

2026

2025

2025

Capital expenditures

177

163

333

314

634

Remove: IFRS adjustment to cash basis

2

(6)

7

(19)

(18)

Accrued capital expenditures

179

157

340

295

616

Accrued capital expenditures as a percentage of
   revenues

n/a

n/a

n/a

n/a

8.2%


Page 26


Thomson Reuters Second Quarter Report 2026

img21084890_0.jpg


Reconciliation of net earnings to adjusted earnings and adjusted EPS


Three months ended
June 30,

Six months ended
June 30,

Year ended
December 31,

(millions of U.S. dollars, except per share amounts and
   share data)

2026

2025

2026

2025

2025

Net earnings

448

313

907

747

1,502

Adjustments to remove:


Fair value adjustments(1)

2

17

(1)

34

38

Amortization of acquired software

60

52

116

101

206

Amortization of other identifiable intangible assets

25

24

49

49

98

Other operating gains, net

(68)

(5)

(68)

(2)

(164)

Other finance (income) costs

(8)

48

(17)

58

55

Share of post-tax losses in equity method
   investments

4

4

11

10

28

Tax on above items(2)

(20)

(22)

(34)

(46)

(35)

Tax items impacting comparability(2)

(3)

(21)

(4)

(20)

57

(Earnings) loss from discontinued operations, net
   of tax

(4)

(16)

14

(25)

(19)

Interim period effective tax rate normalization(2)

-

1

11

(4)

-

Dividends declared on preference shares

(1)

(1)

(2)

(2)

(4)

Adjusted earnings

435

394

982

900

1,762

Adjusted EPS

$0.99

$0.87

$2.22

$2.00

$3.92

Diluted weighted-average common shares
   (millions)

438.6

451.2

441.7

451.0

449.5


(1)
Fair value adjustments primarily represent gains or losses due to changes in foreign currency exchange rates on intercompany balances that arise in the ordinary course of business, a component of operating expenses, as well as adjustments related to acquired deferred revenue.
(2)
For three and six months ended June 30, 2026 and 2025, see the “Results of Operations - Tax expense” section of this management’s discussion and analysis for additional information.

Reconciliation of full-year effective tax rate on adjusted earnings


Year ended December 31,

(millions of U.S. dollars)


2025

Adjusted earnings


1,762

Plus: Dividends declared on preference shares


4

Plus: Tax expense on adjusted earnings


401

Pre-tax adjusted earnings


2,167


IFRS tax expense


423

Remove tax related to:


Amortization of acquired software


46

Amortization of other identifiable intangible assets


23

Share of post-tax losses in equity method investments


2

Other finance costs


2

Other operating gains, net


(43)

Other items


5

Subtotal - Remove tax benefit on pre-tax items removed from adjusted earnings

35

Remove: Tax items impacting comparability


(57)

Total - Remove all items impacting comparability


(22)

Tax expense on adjusted earnings


401

Effective tax rate on adjusted earnings


18.5%


Reconciliation of net cash provided by operating activities to free cash flow


Three months ended
June 30,

Six months ended
June 30,

Year ended
December 31,

(millions of U.S. dollars)

2026

2025

2026

2025

2025

Net cash provided by operating activities

920

746

1,425

1,191

2,651

Capital expenditures

(177)

(163)

(333)

(314)

(634)

Other investing activities

-

-

-

1

1

Payments of lease principal

(15)

(16)

(31)

(33)

(64)

Dividends paid on preference shares

(1)

(1)

(2)

(2)

(4)

Free cash flow

727

566

1,059

843

1,950


Page 27


Thomson Reuters Second Quarter Report 2026

img21084890_0.jpg


Reconciliation of net debt and leverage ratio of net debt to adjusted EBITDA


June 30,

December 31,

(millions of U.S. dollars)


2026

2025

Current indebtedness


1,618

795

Long-term indebtedness


1,323

1,328

Total debt


2,941

2,123

Swaps


23

16

Total debt after swaps


2,964

2,139

Remove fair value adjustments for hedges


(3)

(2)

Total debt after hedging arrangements


2,961

2,137

Collateral assets


(25)

(7)

Remove transaction costs, premiums or discounts, included in the carrying value of debt

28

28

Add: Lease liabilities (current and non-current)


241

249

Less: Cash and cash equivalents


(577)

(511)

Net debt


2,628

1,896

Leverage ratio of net debt to adjusted EBITDA


Adjusted EBITDA


3,075

2,936

Net debt/adjusted EBITDA


0.9:1

0.6:1

Reconciliation of changes in revenues to changes in revenues excluding the effects of foreign currency (constant currency) as well as acquisitions/disposals (organic basis)


Three months ended June 30,


Change

(millions of U.S. dollars)

2026


2025


Total

Foreign
Currency


Subtotal
Constant
Currency

Net
Acquisitions/
(Disposals)


Organic

Revenues


Legal Professionals

772


704


10%


-


9%


-


10%

Corporates

537


480


12%


1%


11%


-


10%

Tax, Audit & Accounting Professionals

311


274


14%


2%


12%


4%


8%

"Big 3" Segments Combined

1,620


1,458


11%


1%


10%


1%


10%

Reuters

229


218


5%


-


5%


1%


4%

Global Print

111


114


(3%)


-


(3%)


-


(3%)

Eliminations/Rounding

(6)


(5)


Total Revenues

1,954


1,785


9%


1%


9%


1%


8%

Recurring Revenues


Legal Professionals

748


684


10%


-


9%


-


9%

Corporates

462


421


10%


1%


9%


-


9%

Tax, Audit & Accounting Professionals

209


187


12%


2%


9%


-


9%

"Big 3" Segments Combined

1,419


1,292


10%


1%


9%


-


9%

Reuters

188


176


7%


-


6%


1%


6%

Eliminations/Rounding

(6)


(5)


Total Recurring Revenues

1,601


1,463


9%


1%


9%


-


9%

Transactions Revenues


Legal Professionals

24


20


16%


-


16%


(2%)


18%

Corporates

75


59


27%


-


27%


3%


24%

Tax, Audit & Accounting Professionals

102


87


17%


-


17%


11%


6%

"Big 3" Segments Combined

201


166


21%


-


20%


7%


13%

Reuters

41


42


(2%)


(3%)


1%


1%


(1%)

Eliminations/Rounding

-


-


Total Transactions Revenues

242


208


16%


-


16%


6%


11%


Page 28


Thomson Reuters Second Quarter Report 2026

img21084890_0.jpg


Six months ended June 30,


Change

(millions of U.S. dollars)

2026


2025


Total


Foreign
Currency


Subtotal
Constant
Currency


Net
Acquisitions/
(Disposals)


Organic

Revenues


Legal Professionals

1,528


1,392


10%


1%


9%


-


9%

Corporates

1,145


1,028


11%


1%


10%


-


10%

Tax, Audit & Accounting Professionals

721


632


14%


1%


13%


3%


9%

"Big 3" Segments Combined

3,394


3,052


11%


1%


10%


1%


9%

Reuters

441


414


6%


-


6%


1%


5%

Global Print

223


230


(3%)


1%


(4%)


-


(4%)

Eliminations/Rounding

(17)


(11)


Total Revenues

4,041


3,685


10%


1%


9%


1%


8%

Recurring Revenues


Legal Professionals

1,487


1,354


10%


1%


9%


-


9%

Corporates

911


828


10%


1%


8%


-


8%

Tax, Audit & Accounting Professionals

438


392


12%


2%


10%


-


10%

"Big 3" Segments Combined

2,836


2,574


10%


1%


9%


-


9%

Reuters

374


351


7%


1%


6%


1%


5%

Eliminations/Rounding

(14)


(11)


Total Recurring Revenues

3,196


2,914


10%


1%


9%


-


8%

Transactions Revenues


Legal Professionals

41


38


8%


1%


8%


(1%)


9%

Corporates

234


200


17%


1%


17%


1%


16%

Tax, Audit & Accounting Professionals

283


240


18%


-


18%


9%


9%

"Big 3" Segments Combined

558


478


17%


-


17%


5%


12%

Reuters

67


63


6%


(2%)


8%


2%


6%

Eliminations/Rounding

(3)


-


Total Transactions Revenues

622


541


15%


-


15%


4%


10%


Year ended December 31,


Change

(millions of U.S. dollars)

2025


2024


Total

Foreign
Currency


Subtotal
Constant
Currency

Net
Acquisitions/
(Disposals)


Organic

Revenues


Legal Professionals

2,843


2,902


(2%)


-


(2%)


(10%)


8%

Corporates

2,023


1,875


8%


-


7%


(1%)


9%

Tax, Audit & Accounting Professionals

1,291


1,154


12%


(1%)


13%


3%


11%

"Big 3" Segments Combined

6,157


5,931


4%


-


4%


(5%)


9%

Reuters

853


832


3%


1%


2%


1%


1%

Global Print

490


519


(6%)


-


(5%)


-


(5%)

Eliminations/Rounding

(24)


(24)


Total Revenues

7,476


7,258


3%


-


3%


(4%)


7%


Page 29


Thomson Reuters Second Quarter Report 2026

img21084890_0.jpg


Reconciliation of changes in adjusted EBITDA and the related margin, consolidated operating expenses and adjusted EPS, excluding the effects of foreign currency


Three months ended June 30,


Change

(millions of U.S. dollars, except per share amounts)


2026


2025


Total


Foreign
Currency


Constant
Currency

Adjusted EBITDA


Legal Professionals


371


339


10%


-


9%

Corporates


200


172


17%


2%


15%

Tax, Audit & Accounting Professionals


120


110


9%


2%


7%

"Big 3" Segments Combined


691


621


12%


1%


10%

Reuters


48


45


5%


(5%)


10%

Global Print


42


41


2%


1%


1%

Corporate costs


(36)


(29)


n/a


n/a


n/a

Total Adjusted EBITDA


745


678


10%


1%


9%

Adjusted EBITDA Margin


Legal Professionals


48.1%


48.1%


-


10bp


(10)bp

Corporates


37.2%


35.7%


150bp


20bp


130bp

Tax, Audit & Accounting Professionals


38.7%


38.9%


(20)bp


20bp


(40)bp

"Big 3" Segments Combined


42.7%


42.3%


40bp


10bp


30bp

Reuters


20.8%


20.8%


-


(80)bp


80bp

Global Print


37.7%


36.0%


170bp


20bp


150bp

Total Adjusted EBITDA Margin


38.1%


37.8%


30bp


10bp


20bp

Operating expenses


1,211


1,124


8%


-


8%

Adjusted EPS


$0.99


$0.87


14%


1%


13%


Six months ended June 30,


Change

(millions of U.S. dollars, except per share amounts)


2026


2025


Total


Foreign
Currency


Constant
Currency

Adjusted EBITDA


Legal Professionals


736


675


9%


1%


9%

Corporates


443


387


15%


1%


14%

Tax, Audit & Accounting Professionals


341


318


7%


1%


6%

"Big 3" Segments Combined


1,520


1,380


10%


1%


9%

Reuters


82


84


(3%)


(7%)


4%

Global Print


85


85


-


1%


(1%)

Corporate costs


(61)


(62)


n/a


n/a


n/a

Total Adjusted EBITDA


1,626


1,487


9%


-


9%

Adjusted EBITDA Margin


Legal Professionals


48.2%


48.4%


(20)bp


-


(20)bp

Corporates


38.7%


37.6%


110bp


(20)bp


130bp

Tax, Audit & Accounting Professionals


47.3%


48.9%


(160)bp


(20)bp


(140)bp

"Big 3" Segments Combined


44.8%


44.9%


(10)bp


(10)bp


-

Reuters


18.6%


20.4%


(180)bp


(130)bp


(50)bp

Global Print


38.2%


36.9%


130bp


10bp


120bp

Total Adjusted EBITDA Margin


40.2%


40.1%


10bp


(20)bp


30bp

Operating expenses


2,414


2,232


8%


1%


8%

Adjusted EPS


$2.22


$2.00


11%


1%


11%


Page 30


Thomson Reuters Second Quarter Report 2026

img21084890_0.jpg


“Big 3” segments and consolidated adjusted EBITDA and the related margins


Year ended December 31,

(millions of U.S. dollars)


2025

Adjusted EBITDA


Legal Professionals


1,354

Corporates


727

Tax, Audit & Accounting Professionals


614

"Big 3" Segments Combined


2,695

Reuters


174

Global Print


185

Corporate costs


(118)

Total Adjusted EBITDA


2,936

"Big 3" Segments Combined


Adjusted EBITDA


2,695

Revenues, excluding $20 million of fair value adjustments to acquired deferred revenue


6,177

Adjusted EBITDA margin


43.6%

Consolidated


Adjusted EBITDA


2,936

Revenues, excluding $20 million of fair value adjustments to acquired deferred revenue


7,496

Adjusted EBITDA margin


39.2%


Page 31


Thomson Reuters Second Quarter Report 2026

img21084890_0.jpg


Reconciliation of adjusted EBITDA margin

To compute segment and consolidated adjusted EBITDA margin, we exclude fair value adjustments related to acquired deferred revenue from our IFRS revenues. The chart below reconciles IFRS revenues to revenues used in the calculation of adjusted EBITDA margin, which excludes fair value adjustments related to acquired deferred revenue.


(millions of U.S. dollars)


IFRS
revenues


Remove fair
value
adjustments
to acquired
deferred
revenue


Revenues
excluding
fair value
adjustments
to acquired
deferred
revenue


Adjusted
EBITDA


Adjusted
EBITDA
margin

Three months ended June 30, 2026


Legal Professionals


772


-


772


371


48.1%

Corporates


537


-


537


200


37.2%

Tax, Audit & Accounting Professionals


311


-


311


120


38.7%

"Big 3" Segments Combined


1,620


-


1,620


691


42.7%

Reuters


229


-


229


48


20.8%

Global Print


111


-


111


42


37.7%

Eliminations/Rounding


(6)


-


(6)


-


n/a

Corporate costs


-


-


-


(36)


n/a

Consolidated totals


1,954


-


1,954


745


38.1%


Six months ended June 30, 2026


Legal Professionals


1,528


-


1,528


736


48.2%

Corporates


1,145


-


1,145


443


38.7%

Tax, Audit & Accounting Professionals


721


721


341


47.3%

"Big 3" Segments Combined


3,394


-


3,394


1,520


44.8%

Reuters


441


-


441


82


18.6%

Global Print


223


-


223


85


38.2%

Eliminations/Rounding


(17)


-


(17)


-


n/a

Corporate costs


-


-


-


(61)


n/a

Consolidated totals


4,041


-


4,041


1,626


40.2%


Three months ended June 30, 2025


Legal Professionals


704


-


704


339


48.1%

Corporates


480


-


480


172


35.7%

Tax, Audit & Accounting Professionals


274


10


284


110


38.9%

"Big 3" Segments Combined


1,458


10


1,468


621


42.3%

Reuters


218


-


218


45


20.8%

Global Print


114


-


114


41


36.0%

Eliminations/Rounding


(5)


-


(5)


-


n/a

Corporate costs


-


-


-


(29)


n/a

Consolidated totals


1,785


10


1,795


678


37.8%


Six months ended June 30, 2025


Legal Professionals


1,392


-


1,392


675


48.4%

Corporates


1,028


-


1,028


387


37.6%

Tax, Audit & Accounting Professionals


632


20


652


318


48.9%

"Big 3" Segments Combined


3,052


20


3,072


1,380


44.9%

Reuters


414


-


414


84


20.4%

Global Print


230


-


230


85


36.9%

Eliminations/Rounding


(11)


-


(11)


-


n/a

Corporate costs


-


-


-


(62)


n/a

Consolidated totals


3,685


20


3,705


1,487


40.1%


Page 32


Thomson Reuters Second Quarter Report 2026

img21084890_0.jpg


Appendix C

Quarterly information (unaudited)

The following table presents a summary of our consolidated operating results for the eight most recent quarters.


Quarters ended

(millions of U.S. dollars,
   except per share
   amounts)

June
 30,
2026

March
 31,
2026

December
 31,
 2025

September
 30,
2025

June
 30,
2025

March
 31,
2025

December
 31,
 2024

September
 30,
2024

Revenues

1,954

2,087

2,009

1,782

1,785

1,900

1,909

1,724

Operating profit

558

639

540

593

436

563

722

415

Earnings from continuing
   operations

444

477

333

428

297

425

607

277

Earnings (loss) from
   discontinued operations,
   net of tax

4

(18)

(1)

(5)

16

9

(20)

24

Net earnings

448

459

332

423

313

434

587

301

Earnings attributable to
   common shareholders

448

459

332

423

313

434

587

301


Basic earnings (loss) per
   share


From continuing operations

$1.01

$1.07

$0.75

$0.95

$0.66

$0.94

$1.35

$0.61

From discontinued
   operations

0.01

(0.04)

(0.01)

(0.01)

0.03

0.02

(0.05)

0.06

$1.02

$1.03

$0.74

$0.94

$0.69

$0.96

$1.30

$0.67

Diluted earnings (loss) per
   share


From continuing operations

$1.01

$1.07

$0.75

$0.95

$0.66

$0.94

$1.34

$0.61

From discontinued
   operations

0.01

(0.04)

(0.01)

(0.01)

0.03

0.02

(0.04)

0.06

$1.02

$1.03

$0.74

$0.94

$0.69

$0.96

$1.30

$0.67


Revenues - Our company revenues on a consolidated basis do not tend to be significantly impacted by seasonality as we record a large portion of our revenues ratably over a contract term. However, at the segment level, revenues on a consecutive quarter basis can be impacted by seasonality, most notably in our Tax, Audit & Accounting Professionals business, where revenues tend to be concentrated in the first and fourth quarters. As most of our business is conducted in U.S. dollars, foreign currency had a minimal impact on our revenues. Our first-quarter 2025 and fourth quarter 2024 revenues reflected growth in recurring revenues and the remaining comparable quarters reflected growth in both recurring and transactions revenues, including acquisitions. In the 2025 and 2024 periods, revenue increases were partly offset by disposals, primarily FindLaw in December 2024.

Operating profit - Our operating profit does not tend to be significantly impacted by seasonality. As most of our operating expenses are fixed over the short-to-medium term, we generally become more profitable when our revenues increase. When our revenues decline, we generally become less profitable. The increase in operating profit in the third quarter of 2025 reflected an other operating gain on the sale of our remaining minority equity interest in the Elite business and the fourth quarter of 2024 reflected the gains on sales of FindLaw and other non-core businesses.

Net earnings – Net earnings in the third quarter of 2025 reflected a gain on sale of our remaining equity interest in Elite, and the fourth quarter of 2024 included a gain on sale of FindLaw.

Page 33


Thomson Reuters Second Quarter Report 2026

img21084890_0.jpg


Appendix D

Subsidiary Issuer and Guarantor Supplemental Financial Information

The following tables set forth consolidating summary financial information in connection with the full and unconditional guarantee by Thomson Reuters Corporation and three U.S. subsidiary guarantors, which are also indirect 100%-owned and consolidated subsidiaries of Thomson Reuters Corporation (referred to as the Subsidiary Guarantors), of any debt securities issued by TR Finance LLC (referred to as the Subsidiary Issuer) under a trust indenture dated as of March 20, 2025, entered into between Thomson Reuters Corporation, TR Finance LLC, the Subsidiary Guarantors, Computershare Trust Company of Canada and Deutsche Bank Trust Company Americas, and the full and unconditional guarantee by the Subsidiary Guarantors of certain outstanding debt securities issued by Thomson Reuters Corporation under a second amended and restated trust indenture dated as of March 20, 2025, entered into between Thomson Reuters Corporation, the Subsidiary Guarantors, Computershare Trust Company of Canada and Deutsche Bank Trust Company Americas, and any debt securities issued by Thomson Reuters Corporation under a trust indenture to be entered into between Thomson Reuters Corporation, the Subsidiary Guarantors, Computershare Trust Company of Canada and Deutsche Bank Trust Company Americas in connection with any future offering of debt securities issued by Thomson Reuters Corporation and guaranteed by the Subsidiary Guarantors. Guarantees by the Subsidiary Guarantors may be subject to customary release provisions in connection with a merger, consolidation or sale of assets.

TR Finance LLC is an indirect 100%-owned subsidiary of Thomson Reuters Corporation. TR Finance LLC is a financing vehicle for Thomson Reuters Corporation and its consolidated subsidiaries. TR Finance LLC has no independent operations, other than raising debt for use by Thomson Reuters, hedging such debt when appropriate and on-lending funds to companies in the Thomson Reuters group. In connection with each issuance of debt securities by TR Finance LLC to date, TR Finance LLC has loaned the proceeds thereof to, and in connection with each future issuance of debt securities by TR Finance LLC, TR Finance LLC expects that the proceeds thereof will be loaned to the Subsidiary Guarantors, and/or U.S. affiliates that are direct or indirect shareholders of the Subsidiary Guarantors. TR Finance LLC expects to be able to pay interest, premiums, operating expenses and to meet its debt obligations using interest income from the affiliate loans and will be further supported by guarantees provided by the Subsidiary Guarantors and Thomson Reuters Corporation. The ability of TR Finance LLC to pay interest, premiums, operating expenses and to meet its debt obligations depends upon the ability of the Subsidiary Guarantors and/or such other U.S. affiliates to pay interest and meet debt obligations under the affiliate loans and upon the credit support of the Subsidiary Guarantors and Thomson Reuters Corporation.

The tables below contain condensed consolidating financial information for the following:

Parent – Thomson Reuters Corporation, the direct or indirect owner of all of its subsidiaries
Subsidiary Issuer – TR Finance LLC
Subsidiary Guarantors on a combined basis
Non-Guarantor Subsidiaries – Other subsidiaries of Thomson Reuters Corporation on a combined basis that will not guarantee TR Finance LLC or Thomson Reuters Corporation debt securities
Eliminations – Consolidating adjustments
Thomson Reuters on a consolidated basis

The Subsidiary Guarantors referred to above are comprised of the following indirect 100%-owned and consolidated subsidiaries of Thomson Reuters Corporation:

Thomson Reuters Applications Inc., which operates part of the Company’s Legal Professionals, Tax, Audit & Accounting Professionals and Corporates businesses;
Thomson Reuters (Tax & Accounting) Inc., which operates part of the Company’s Tax, Audit & Accounting Professionals and Corporates businesses; and
West Publishing Corporation, which operates part of the Company’s Legal Professionals, Corporates and Global Print businesses.

Thomson Reuters Corporation accounts for its investments in subsidiaries using the equity method for purposes of the condensed consolidating financial information. Where subsidiaries are members of a consolidated tax filing group, Thomson Reuters Corporation allocates income tax expense pursuant to the tax sharing agreement among the members of the group, including application of the percentage method whereby members of the consolidated group are reimbursed for losses when they occur, regardless of the ability to use such losses on a standalone basis. We believe that this allocation is a systematic, rational approach for allocation of income tax balances. Adjustments necessary to consolidate the Parent, Subsidiary Guarantors and Non-Guarantor Subsidiaries are reflected in the “Eliminations” column.

Page 34


Thomson Reuters Second Quarter Report 2026

img21084890_0.jpg


This basis of presentation is not intended to present the financial position of Thomson Reuters Corporation and the results of its operations for any purpose other than to comply with the specific requirements for subsidiary issuer and guarantor reporting and should be read in conjunction with our consolidated interim financial statements for the three and six months ended June 30, 2026, our 2025 annual consolidated financial statements, as well as our 2025 annual management’s discussion and analysis, which are included in our 2025 annual report.

The following condensed consolidating financial information is provided in compliance with the requirements of Section 13.4 of National Instrument 51-102 - Continuous Disclosure Obligations providing for an exemption for certain credit support issuers.

The following condensed consolidating financial information has been prepared in accordance with IFRS, as issued by the IASB and is unaudited.

CONDENSED CONSOLIDATING INCOME STATEMENT


Three months ended June 30, 2026

(millions of U.S. dollars)


Parent


Subsidiary
Issuer


Subsidiary
Guarantors


Non-Guarantor
Subsidiaries


Eliminations


Consolidated

CONTINUING OPERATIONS


Revenues


-


-


301


1,690


(37)


1,954

Operating expenses


(4)


-


(189)


(1,055)


37


(1,211)

Depreciation


-


-


(7)


(20)


-


(27)

Amortization of software


-


-


-


(216)


15


(201)

Amortization of other identifiable
   intangible assets


-


-


(11)


(14)


-


(25)

Other operating (losses) gains, net


(1)


-


(3)


72


-


68

Operating (loss) profit


(5)


-


91


457


15


558

Finance (costs) income, net:


Net interest expense


(13)


(24)


(1)


(9)


-


(47)

Other finance income (costs)


22


-


-


(14)


-


8

Intercompany net interest income
   (expense)


80


23


(11)


(92)


-


-

Income (loss) before tax and equity
   method investments


84


(1)


79


342


15


519

Share of post-tax losses in equity
   method investments


-


-


-


(4)


-


(4)

Share of post-tax earnings in
   subsidiaries


384


-


2


74


(460)


-

Tax expense


(20)


-


(5)


(44)


(2)


(71)

Earnings (loss) from continuing
   operations


448


(1)


76


368


(447)


444

Earnings from discontinued
   operations, net of tax


-


-


-


4


-


4

Net earnings (loss)


448


(1)


76


372


(447)


448

Earnings (loss) attributable to
   common shareholders


448


(1)


76


372


(447)


448


Page 35


Thomson Reuters Second Quarter Report 2026

img21084890_0.jpg


CONDENSED CONSOLIDATING INCOME STATEMENT


Three months ended June 30, 2025

(millions of U.S. dollars)


Parent


Subsidiary
Issuer


Subsidiary
Guarantors


Non-Guarantor
Subsidiaries


Eliminations


Consolidated

CONTINUING OPERATIONS


Revenues


-


-


335


1,523


(73)


1,785

Operating expenses


(3)


-


(233)


(961)


73


(1,124)

Depreciation


-


-


(7)


(21)


-


(28)

Amortization of software


-


-


(10)


(168)


-


(178)

Amortization of other identifiable
   intangible assets


-


-


(11)


(13)


-


(24)

Other operating gains, net


-


-


9


7


(11)


5

Operating (loss) profit


(3)


-


83


367


(11)


436

Finance (costs) income, net:


Net interest (expense) income


(5)


(22)


1


(9)


-


(35)

Other finance costs


(43)


-


-


(5)


-


(48)

Intercompany net interest income
   (expense)


111


22


(10)


(123)


-


-

Income before tax and equity
   method investments


60


-


74


230


(11)


353

Share of post-tax losses in equity
   method investments


-


-


-


(4)


-


(4)

Share of post-tax earnings in
   subsidiaries


259


-


6


57


(322)


-

Tax (expense) benefit


(6)


8


(17)


(29)


(8)


(52)

Earnings from continuing
   operations

313


8


63


254


(341)


297

Earnings from discontinued
   operations, net of tax


-


-


-


16


-


16

Net earnings


313


8


63


270


(341)


313

Earnings attributable to common
   shareholders


313


8


63


270


(341)


313


Page 36


Thomson Reuters Second Quarter Report 2026

img21084890_0.jpg


CONDENSED CONSOLIDATING INCOME STATEMENT


Six months ended June 30, 2026

(millions of U.S. dollars)


Parent


Subsidiary Issuer


Subsidiary
Guarantors


Non-Guarantor Subsidiaries


Eliminations


Consolidated

CONTINUING OPERATIONS


Revenues


-


-


656


3,508


(123)


4,041

Operating expenses


(8)


-


(396)


(2,133)


123


(2,414)

Depreciation


-


-


(14)


(41)


-


(55)

Amortization of software


-


-


-


(424)


30


(394)

Amortization of other identifiable
   intangible assets


-


-


(22)


(27)


-


(49)

Other operating (losses) gains, net


(1)


-


(3)


72


-


68

Operating (loss) profit


(9)


-


221


955


30


1,197

Finance (costs) income, net:


Net interest expense


(18)


(46)


(1)


(21)


-


(86)

Other finance income (costs)


21


(1)


-


(3)


-


17

Intercompany net interest income
   (expense)


121


46


(21)


(146)


-


-

Income (loss) before tax and equity
   method investments


115


(1)


199


785


30


1,128

Share of post-tax losses in equity
   method investments


-


-


-


(11)


-


(11)

Share of post-tax earnings in
   subsidiaries


826


-


16


163


(1,005)


-

Tax expense


(34)


-


(36)


(122)


(4)


(196)

Earnings (loss) from continuing
   operations


907


(1)


179


815


(979)


921

Loss from discontinued
   operations, net of tax


-


-


-


(14)


-


(14)

Net earnings (loss)


907


(1)


179


801


(979)


907

Earnings (loss) attributable to
   common shareholders


907


(1)


179


801


(979)


907


Page 37


Thomson Reuters Second Quarter Report 2026

img21084890_0.jpg


CONDENSED CONSOLIDATING INCOME STATEMENT


Six months ended June 30, 2025

(millions of U.S. dollars)


Parent


Subsidiary Issuer


Subsidiary
Guarantors


Non-Guarantor Subsidiaries


Eliminations


Consolidated

CONTINUING OPERATIONS


Revenues


-


-


689


3,149


(153)


3,685

Operating expenses


(10)


-


(456)


(1,919)


153


(2,232)

Depreciation


-


-


(14)


(41)


-


(55)

Amortization of software


-


-


(14)


(338)


-


(352)

Amortization of other identifiable
   intangible assets


-


-


(21)


(28)


-


(49)

Other operating gains, net


-


-


9


4


(11)


2

Operating (loss) profit


(10)


-


193


827


(11)


999

Finance (costs) income, net:


Net interest (expense) income


(32)


(25)


2


(10)


-


(65)

Other finance costs


(84)


-


-


(6)


32


(58)

Intercompany net interest income
   (expense)


55


25


(24)


(56)


-


-

(Loss) income before tax and equity
   method investments


(71)


-


171


755


21


876

Share of post-tax losses in equity
   method investments


-


-


-


(10)


-


(10)

Share of post-tax earnings in
   subsidiaries


804


-


15


130


(949)


-

Tax benefit (expense)


14


-


(41)


(109)


(8)


(144)

Earnings from continuing operations


747


-


145


766


(936)


722

Earnings from discontinued
   operations, net of tax


-


-


-


25


-


25

Net earnings


747


-


145


791


(936)


747

Earnings attributable to common
   shareholders


747


-


145


791


(936)


747


Page 38


Thomson Reuters Second Quarter Report 2026

img21084890_0.jpg


CONDENSED CONSOLIDATING STATEMENT OF FINANCIAL POSITION


June 30, 2026

(millions of U.S. dollars)


Parent


Subsidiary
Issuer


Subsidiary
Guarantors


Non-Guarantor Subsidiaries


Eliminations


Consolidated

ASSETS


Cash and cash equivalents


6


-


80


491


-


577

Trade and other receivables


1


-


174


952


-


1,127

Intercompany receivables


5,507


576


521


6,216


(12,820)


-

Other financial assets


-


25


61


30


-


116

Prepaid expenses and other current
   assets


-


-


183


266


-


449

Current assets


5,514


601


1,019


7,955


(12,820)


2,269

Property and equipment, net


-


-


124


218


-


342

Software, net


-


-


1


1,859


(149)


1,711

Other identifiable intangible assets,
   net


-


-


930


2,128


-


3,058

Goodwill


-


-


4,421


3,673


-


8,094

Equity method investments


-


-


-


168


-


168

Other financial assets


179


-


1


289


-


469

Other non-current assets


-


-


100


605


-


705

Intercompany receivables


-


1,267


65


-


(1,332)


-

Investments in subsidiaries


12,546


-


538


4,774


(17,858)


-

Deferred tax


204


3


-


1,036


20


1,263

Total assets


18,443


1,871


7,199


22,705


(32,139)


18,079


LIABILITIES AND EQUITY


Liabilities


Current indebtedness


1,049


569


-


-


-


1,618

Payables, accruals and provisions


21


16


264


713


-


1,014

Current tax liabilities


-


-


-


240


-


240

Deferred revenue


-


-


199


1,057


-


1,256

Intercompany payables


5,887


29


309


6,595


(12,820)


-

Other financial liabilities


238


-


12


68


-


318

Current liabilities


7,195


614


784


8,673


(12,820)


4,446

Long-term indebtedness


118


1,239


-


-


(34)


1,323

Provisions and other non-current
   liabilities


5


-


5


587


-


597

Other financial liabilities


-


23


61


122


-


206

Intercompany payables


-


-


778


554


(1,332)


-

Deferred tax


-


-


259


118


5


382

Total liabilities


7,318


1,876


1,887


10,054


(14,181)


6,954

Equity


Total equity


11,125


(5)


5,312


12,651


(17,958)


11,125

Total liabilities and equity


18,443


1,871


7,199


22,705


(32,139)


18,079


Page 39


Thomson Reuters Second Quarter Report 2026

img21084890_0.jpg


CONDENSED CONSOLIDATING STATEMENT OF FINANCIAL POSITION


December 31, 2025

(millions of U.S. dollars)


Parent


Subsidiary Issuer


Subsidiary
Guarantors


Non-Guarantor Subsidiaries


Eliminations


Consolidated

ASSETS


Cash and cash equivalents


8


-


65


438


-


511

Trade and other receivables


-


-


260


883


-


1,143

Intercompany receivables


1,145


454


493


1,540


(3,632)


-

Other financial assets


-


7


60


27


-


94

Prepaid expenses and other current
   assets


-


-


199


281


-


480

Current assets


1,153


461


1,077


3,169


(3,632)


2,228

Property and equipment, net


-


-


138


223


-


361

Software, net


-


-


1


1,823


(179)


1,645

Other identifiable intangible assets,
   net


-


-


952


2,150


-


3,102

Goodwill


-


-


4,422


3,491


-


7,913

Equity method investments


-


-


-


202


-


202

Other financial assets


163


-


2


301


-


466

Other non-current assets


-


-


96


584


-


680

Intercompany receivables


-


1,267


57


-


(1,324)


-

Investments in subsidiaries


12,044


-


545


4,708


(17,297)


-

Deferred tax


238


3


-


1,081


21


1,343

Total assets


13,598


1,731


7,290


17,732


(22,411)


17,940


LIABILITIES AND EQUITY


Liabilities


Current indebtedness


354


439


-


-


2


795

Payables, accruals and provisions


35


18


262


775


-


1,090

Current tax liabilities


-


-


-


224


-


224

Deferred revenue


-


-


284


967


-


1,251

Intercompany payables


1,172


17


362


2,081


(3,632)


-

Other financial liabilities


-


-


14


94


-


108

Current liabilities


1,561


474


922


4,141


(3,630)


3,468

Long-term indebtedness


118


1,245


-


-


(35)


1,328

Provisions and other non-current
   liabilities


5


-


4


647


-


656

Other financial liabilities


-


16


70


124


-


210

Intercompany payables


-


-


778


546


(1,324)


-

Deferred tax


-


-


263


96


5


364

Total liabilities


1,684


1,735


2,037


5,554


(4,984)


6,026

Equity


Total equity


11,914


(4)


5,253


12,178


(17,427)


11,914

Total liabilities and equity


13,598


1,731


7,290


17,732


(22,411)


17,940


Page 40


Thomson Reuters Second Quarter Report 2026

img21084890_0.jpg


The following supplemental financial information is also being provided in accordance with Article 13 of Regulation S-X in respect of debt securities issued by the Subsidiary Issuer, which are fully and unconditionally guaranteed by the Parent and the Subsidiary Guarantors, and debt securities issued by the Parent, which are fully and unconditionally guaranteed by the Subsidiary Guarantors (in each case, as described above).

Set forth below is summarized financial information of the Parent, Subsidiary Issuer and Subsidiary Guarantors (collectively, the Obligor Group) and Parent and Subsidiary Guarantors (collectively, the Obligor Group excluding Subsidiary Issuer) as presented on a combined basis with intercompany balances and transactions between entities in the Obligor Group and Obligor Group excluding Subsidiary Issuer eliminated. Investments in and equity in earnings of the non-obligor group, which are not members of these groups and financial information of the non-obligor group have been excluded from the summarized financial information. In addition, the Obligor Group and the Obligor Group excluding Subsidiary Issuer’s amounts due to, amounts due from and transactions with each respective non-obligor group are presented below:


SUMMARIZED INCOME STATEMENT


Six months ended June 30, 2026

(millions of U.S. dollars)

Obligor Group

Obligor Group excluding Subsidiary Issuer

Revenues

656

656

Operating profit(1)

586

586

Earnings from continuing operations(1)(2)

617

618

Net earnings

617

618

Earnings attributable to common shareholders

617

618


Year ended December 31, 2025

(millions of U.S. dollars)

Obligor Group

Obligor Group excluding Subsidiary Issuer

Revenues

1,365

1,365

Operating profit(1)

5,134

5,134

Earnings from continuing operations(1)(2)

4,989

4,993

Net earnings

4,989

4,993

Earnings attributable to common shareholders

4,989

4,993


(1)
Includes $706 million (2025 - $5,302 million) of income, of which $374 million (2025 - $4,596 million) represents dividends received, from operating transactions with each non-obligor group.
(2)
Obligor Group and Obligor Group excluding Subsidiary Issuer includes $166 million and $121 million of net finance income, (2025 - $86 million and $20 million of net finance income), respectively, from transactions with each non-obligor group.


SUMMARIZED STATEMENT OF FINANCIAL POSITION


June 30, 2026

(millions of U.S. dollars)

Obligor Group

Obligor Group excluding Subsidiary Issuer

Intercompany receivables from non-obligor group

6,595

6,028

Current assets excluding intercompany receivables

530

505

Total current assets

7,125

6,533

Goodwill

4,421

4,421

Intercompany receivables from non-obligor group

554

65

Non-current assets excluding goodwill and intercompany
   receivables

1,542

1,539

Total non-current assets

6,517

6,025


Intercompany payables to non-obligor group

6,216

6,196

Current liabilities excluding intercompany payables

2,368

1,783

Total current liabilities

8,584

7,979

Intercompany payables to non-obligor group

-

778

Non-current liabilities excluding intercompany payables

1,710

448

Total non-current liabilities

1,710

1,226


Page 41


Thomson Reuters Second Quarter Report 2026

img21084890_0.jpg


SUMMARIZED STATEMENT OF FINANCIAL POSITION


December 31, 2025

(millions of U.S. dollars)

Obligor Group

Obligor Group excluding Subsidiary Issuer

Intercompany receivables from non-obligor group

2,083

1,638

Current assets excluding intercompany receivables

599

592

Total current assets

2,682

2,230

Goodwill

4,422

4,422

Intercompany receivables from non-obligor group

546

57

Non-current assets excluding goodwill and intercompany
   receivables

1,593

1,590

Total non-current assets

6,561

6,069


Intercompany payables to non-obligor group

1,542

1,534

Current liabilities excluding intercompany payables

1,406

949

Total current liabilities

2,948

2,483

Intercompany payables to non-obligor group

-

778

Non-current liabilities excluding intercompany payables

1,721

460

Total non-current liabilities

1,721

1,238


Page 42