
Reimagining Mental Health Q2 2026 Earnings Presentation • August 6, 2026 Exhibit 99.2
Forward-Looking Statements DISCLAIMERS Cautionary Note Regarding Forward-Looking Statements This presentation and related oral statements, including during any question and answer portion of the presentation, contain forward-looking statements about LifeStance Health Group, Inc. and its subsidiaries (“LifeStance”) and the industry in which LifeStance operates, including statements regarding: full-year and third quarter guidance and management’s related assumptions; the Company's financial position; business plans and objectives; our share repurchase authorization and repurchases thereunder; including planned capital allocation; and potential for disciplined acquisitions; operating results; working capital and liquidity; and other statements contained in this presentation that are not historical facts. These statements are subject to known and unknown uncertainties and contingencies outside of LifeStance's control and which are largely based on our current expectations and projections about future events and financial trends that we believe may affect LifeStance's financial condition, results of operations, business strategy, and prospects. LifeStance's actual results, events, or circumstances may differ materially from these statements. Forward-looking statements include all statements that are not historical facts. Words such as “anticipate,” “believe,” “envision,” “estimate,” “expect,” “intend,” “may,” “plan,” “predict,” “project,” “target,” “potential,” “will,” “would,” “could,” “should,” “continue,” “contemplate” and other similar expressions are intended to identify forward-looking statements, although not all forward-looking statements contain these identifying words. These forward-looking statements are subject to a number of risks, uncertainties, factors and assumptions, including, among other things: if reimbursement rates paid by third-party payors are reduced or if third-party payors otherwise restrain our ability to obtain or deliver care to patients, our business could be materially harmed; we may not grow at the rates we historically have achieved or at all, even if our key metrics may imply future growth, including if we are unable to successfully execute on our growth initiatives and business strategies; if we fail to manage our growth effectively, our expenses could increase more than expected, our revenue may not increase proportionally or at all, and we may be unable to execute on our business strategy; our ability to recruit new clinicians and retain existing clinicians; we conduct business in a heavily regulated industry and if we fail to comply with these laws and government regulations, we could incur penalties or be required to make significant changes to our operations or experience adverse publicity, which could have a material adverse effect on our business, results of operations and financial condition; we are dependent on our relationships with supported practices, which we do not own, to provide health care services, and our business would be harmed if those relationships were disrupted or if our arrangements with these entities became subject to legal challenges; we operate in a competitive industry, and if we are not able to compete effectively, our business and financial performance would be harmed; the impact on us of healthcare reform legislation and other changes in the healthcare industry and in healthcare spending is currently unknown, but may harm our business; if our or our vendors' security measures fail or are breached and unauthorized access to our employees', patients' or partners' data is obtained, our systems may be perceived as insecure, we may incur significant liabilities, including through private litigation or regulatory action, our reputation may be harmed, and we could lose patients and partners; our business depends on our ability to effectively invest in, implement improvements to and properly maintain the uninterrupted operation and data integrity of our information technology and other business systems; our existing indebtedness could adversely affect our business and growth prospects; and the other factors set forth in our filings with the Securities and Exchange Commission. The forward-looking statements, together with statements relating to our past performance, should not be regarded as a reliable indicator of our future performance. We undertake no obligation to update any forward-looking statements made in this presentation to reflect events or circumstances after the date of this presentation or to reflect new information or the occurrence of unanticipated events, except as may be required by law. We may not actually achieve the plans, intentions, or expectations disclosed in our forward-looking statements, and you should not place undue reliance on our forward-looking statements. Our forward-looking statements do not reflect the potential impact of any future mergers, dispositions, joint ventures, or investments. Use of Non-GAAP Financial Measures In addition to financial measures presented in accordance with U.S. generally accepted accounting principles (“GAAP”), this presentation includes certain non-GAAP financial measures, including Center Margin, Adjusted EBITDA, and Adjusted EBITDA Margin. These non-GAAP measures are in addition to, and not a substitute for, or superior to, measures of financial performance prepared in accordance with U.S. GAAP. The non-GAAP financial measures used by LifeStance may differ from the non-GAAP financial measures used by other companies. A reconciliation of these measures to the most directly comparable U.S. GAAP measure is included in the Appendix to these slides or as otherwise described in these slides. Market and Industry Data This presentation also contains information regarding our market and industry that is derived from third-party research and publications. This information involves a number of assumptions and limitations. Forecasts, assumptions, expectations, beliefs, estimates and projections involve risk and uncertainties and are subject to change based on various factors.
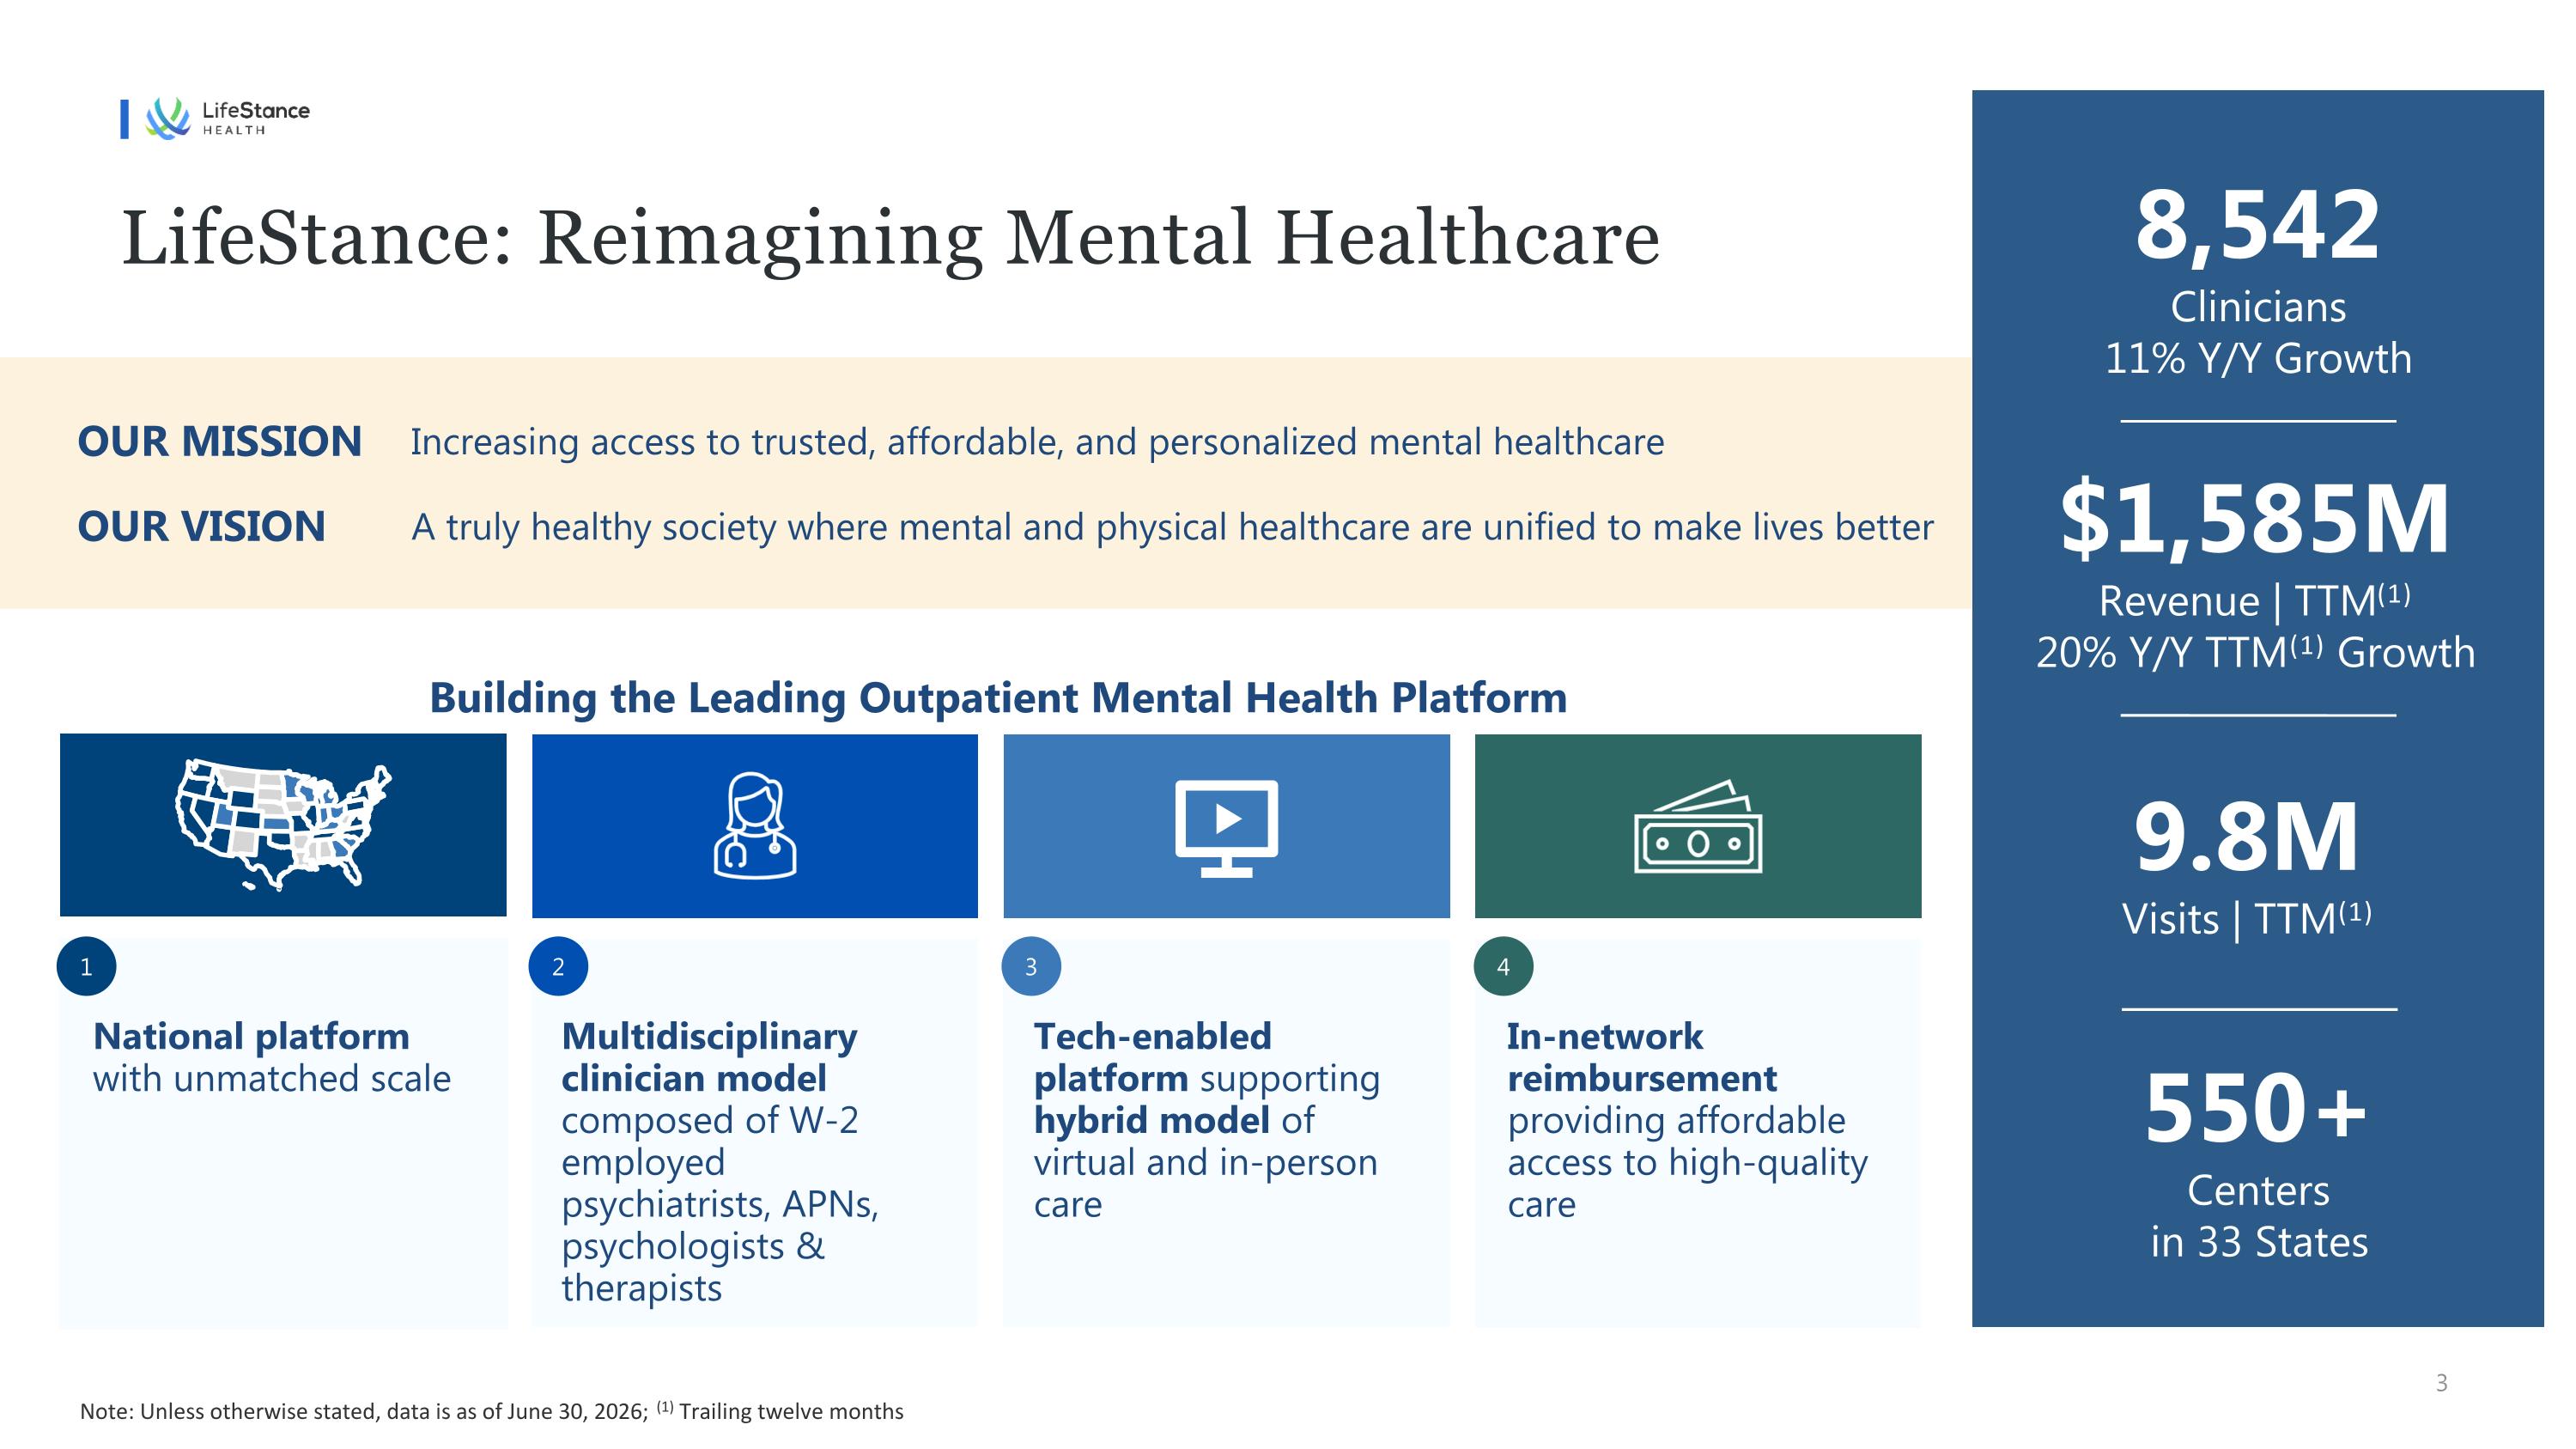
Building the Leading Outpatient Mental Health Platform Increasing access to trusted, affordable, and personalized mental healthcare A truly healthy society where mental and physical healthcare are unified to make lives better OUR VISION OUR MISSION Tech-enabled platform supporting hybrid model of virtual and in-person care In-network reimbursement providing affordable access to high-quality care National platform with unmatched scale Multidisciplinary clinician model composed of W-2 employed psychiatrists, APNs, psychologists & therapists 8,542 Clinicians 11% Y/Y Growth $1,585M Revenue | TTM(1) 20% Y/Y TTM(1) Growth 9.8M Visits | TTM(1) 550+ Centers in 33 States 1 2 3 4 Note: Unless otherwise stated, data is as of June 30, 2026; (1) Trailing twelve months LifeStance: Reimagining Mental Healthcare
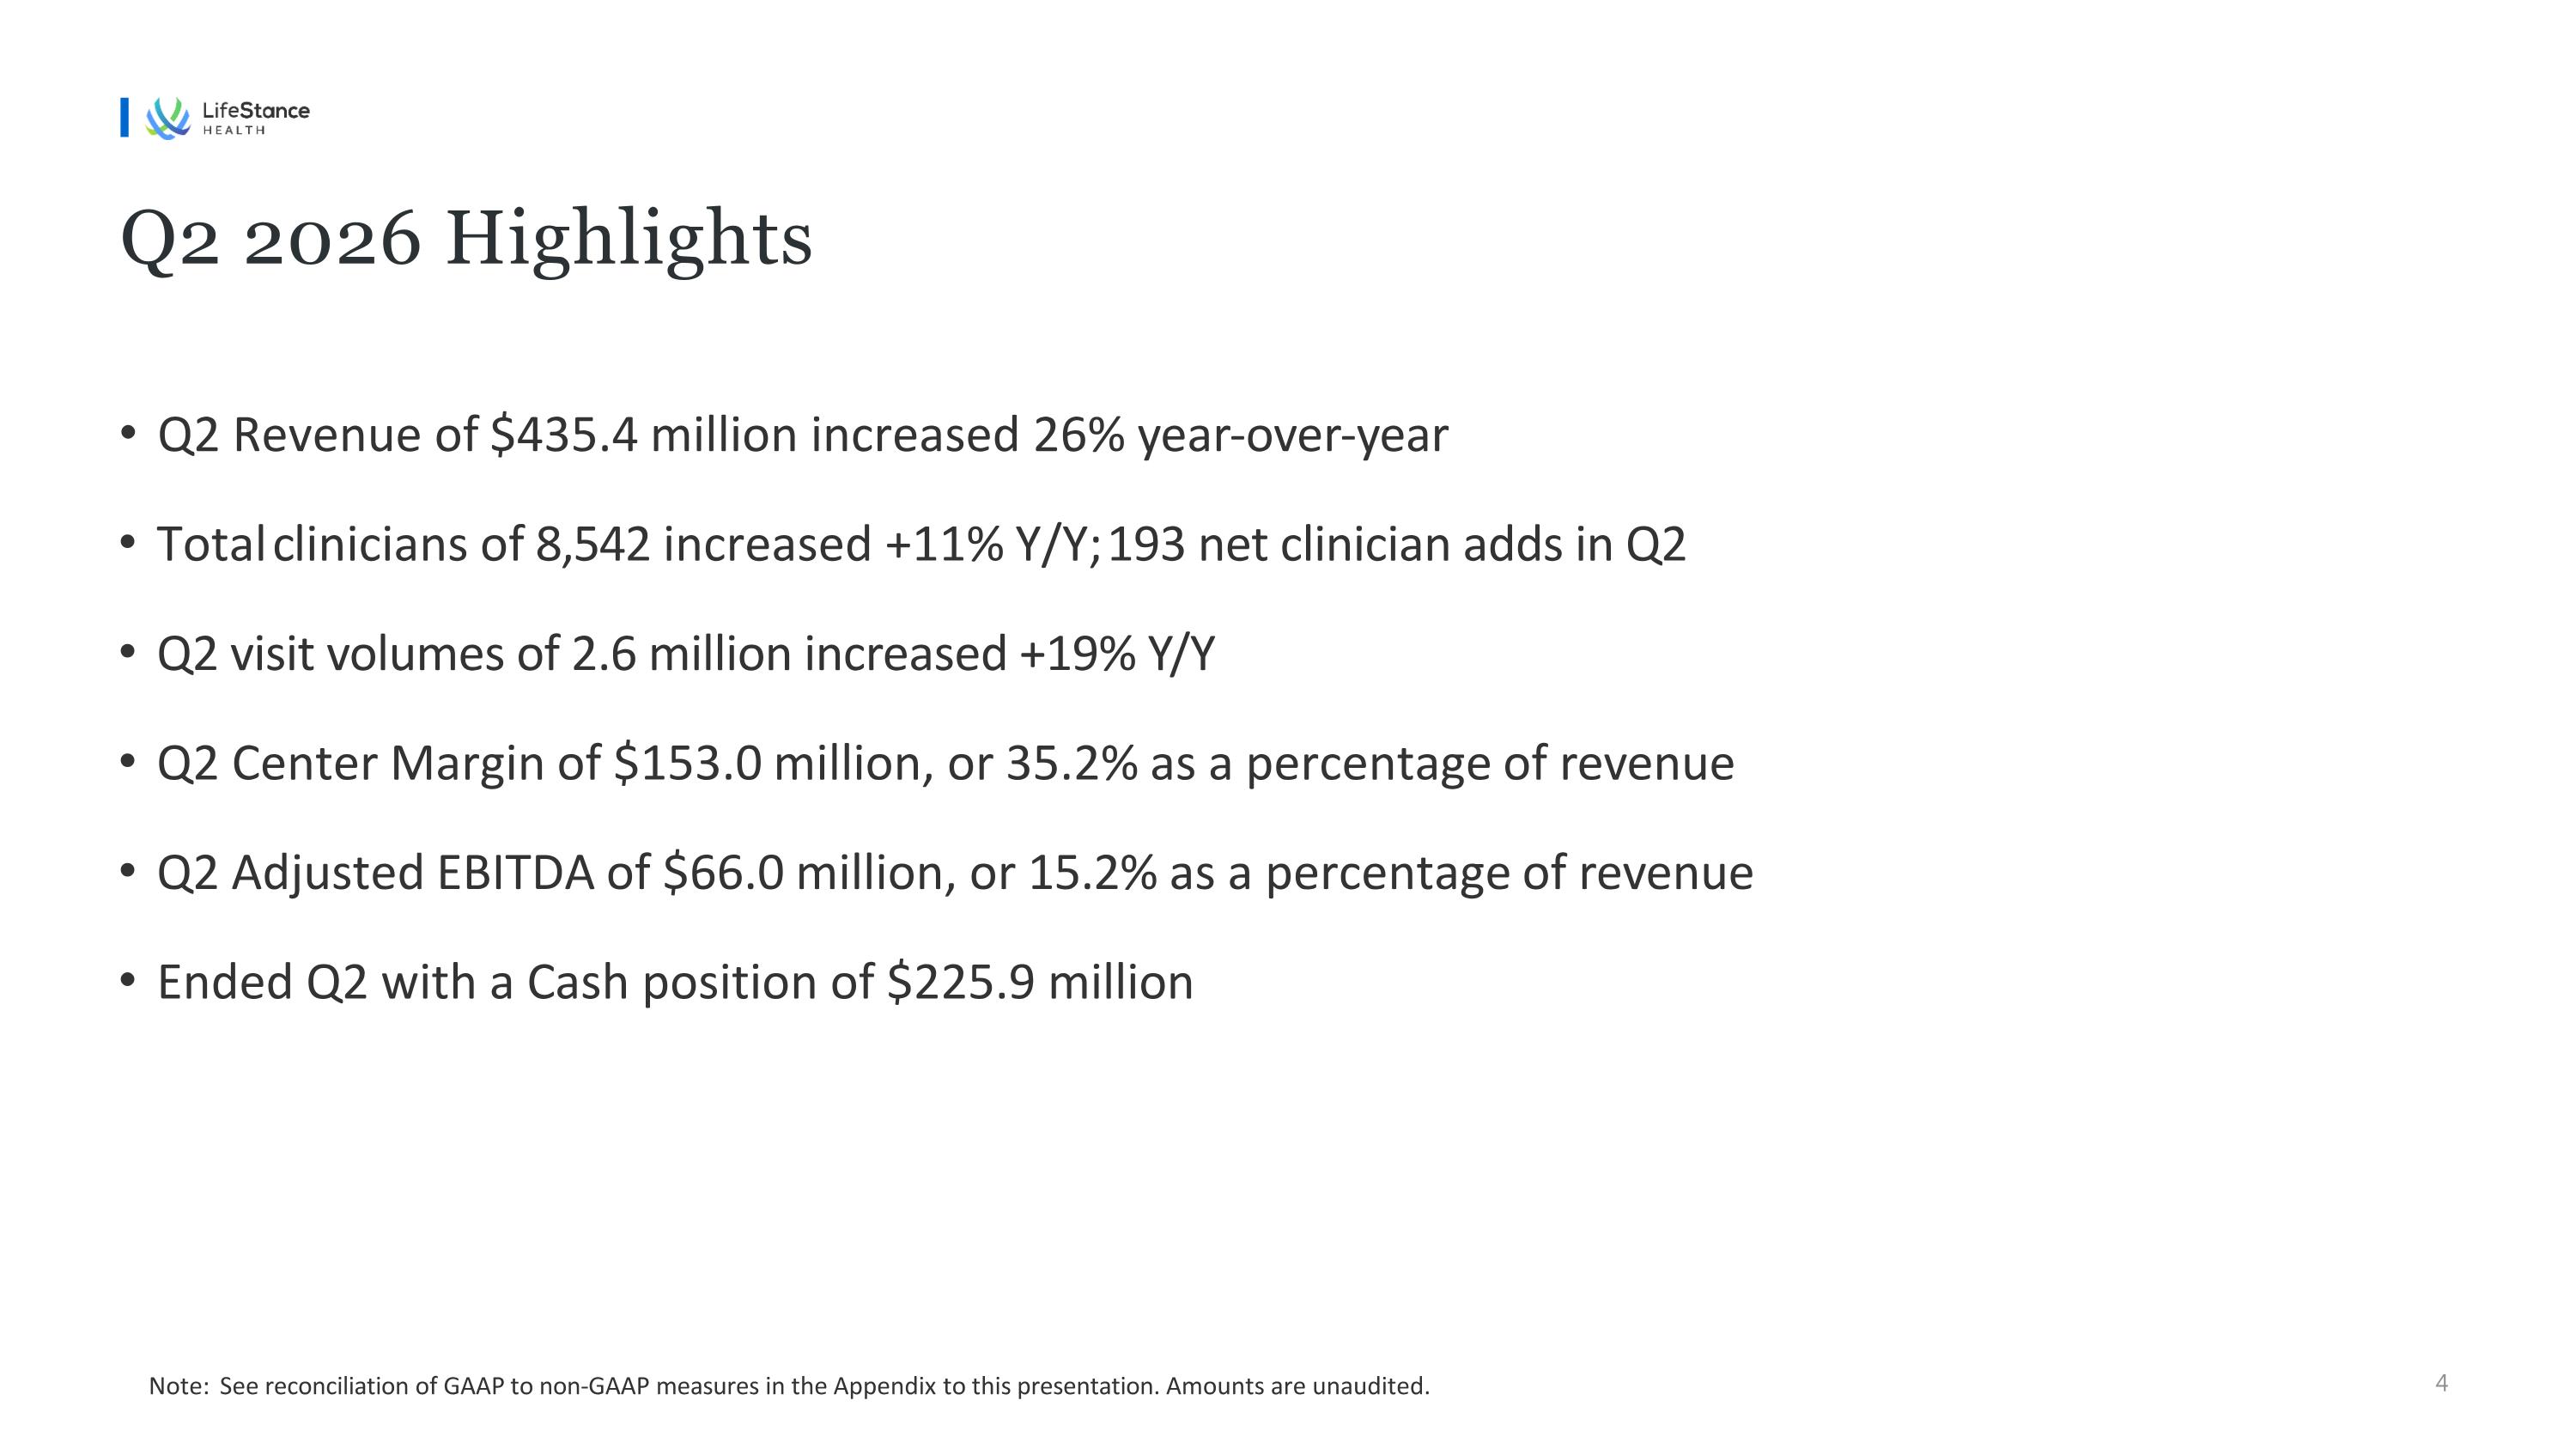
Q2 2026 Highlights Q2 Revenue of $435.4 million increased 26% year-over-year Total clinicians of 8,542 increased +11% Y/Y; 193 net clinician adds in Q2 Q2 visit volumes of 2.6 million increased +19% Y/Y Q2 Center Margin of $153.0 million, or 35.2% as a percentage of revenue Q2 Adjusted EBITDA of $66.0 million, or 15.2% as a percentage of revenue Ended Q2 with a Cash position of $225.9 million Note: See reconciliation of GAAP to non-GAAP measures in the Appendix to this presentation. Amounts are unaudited.
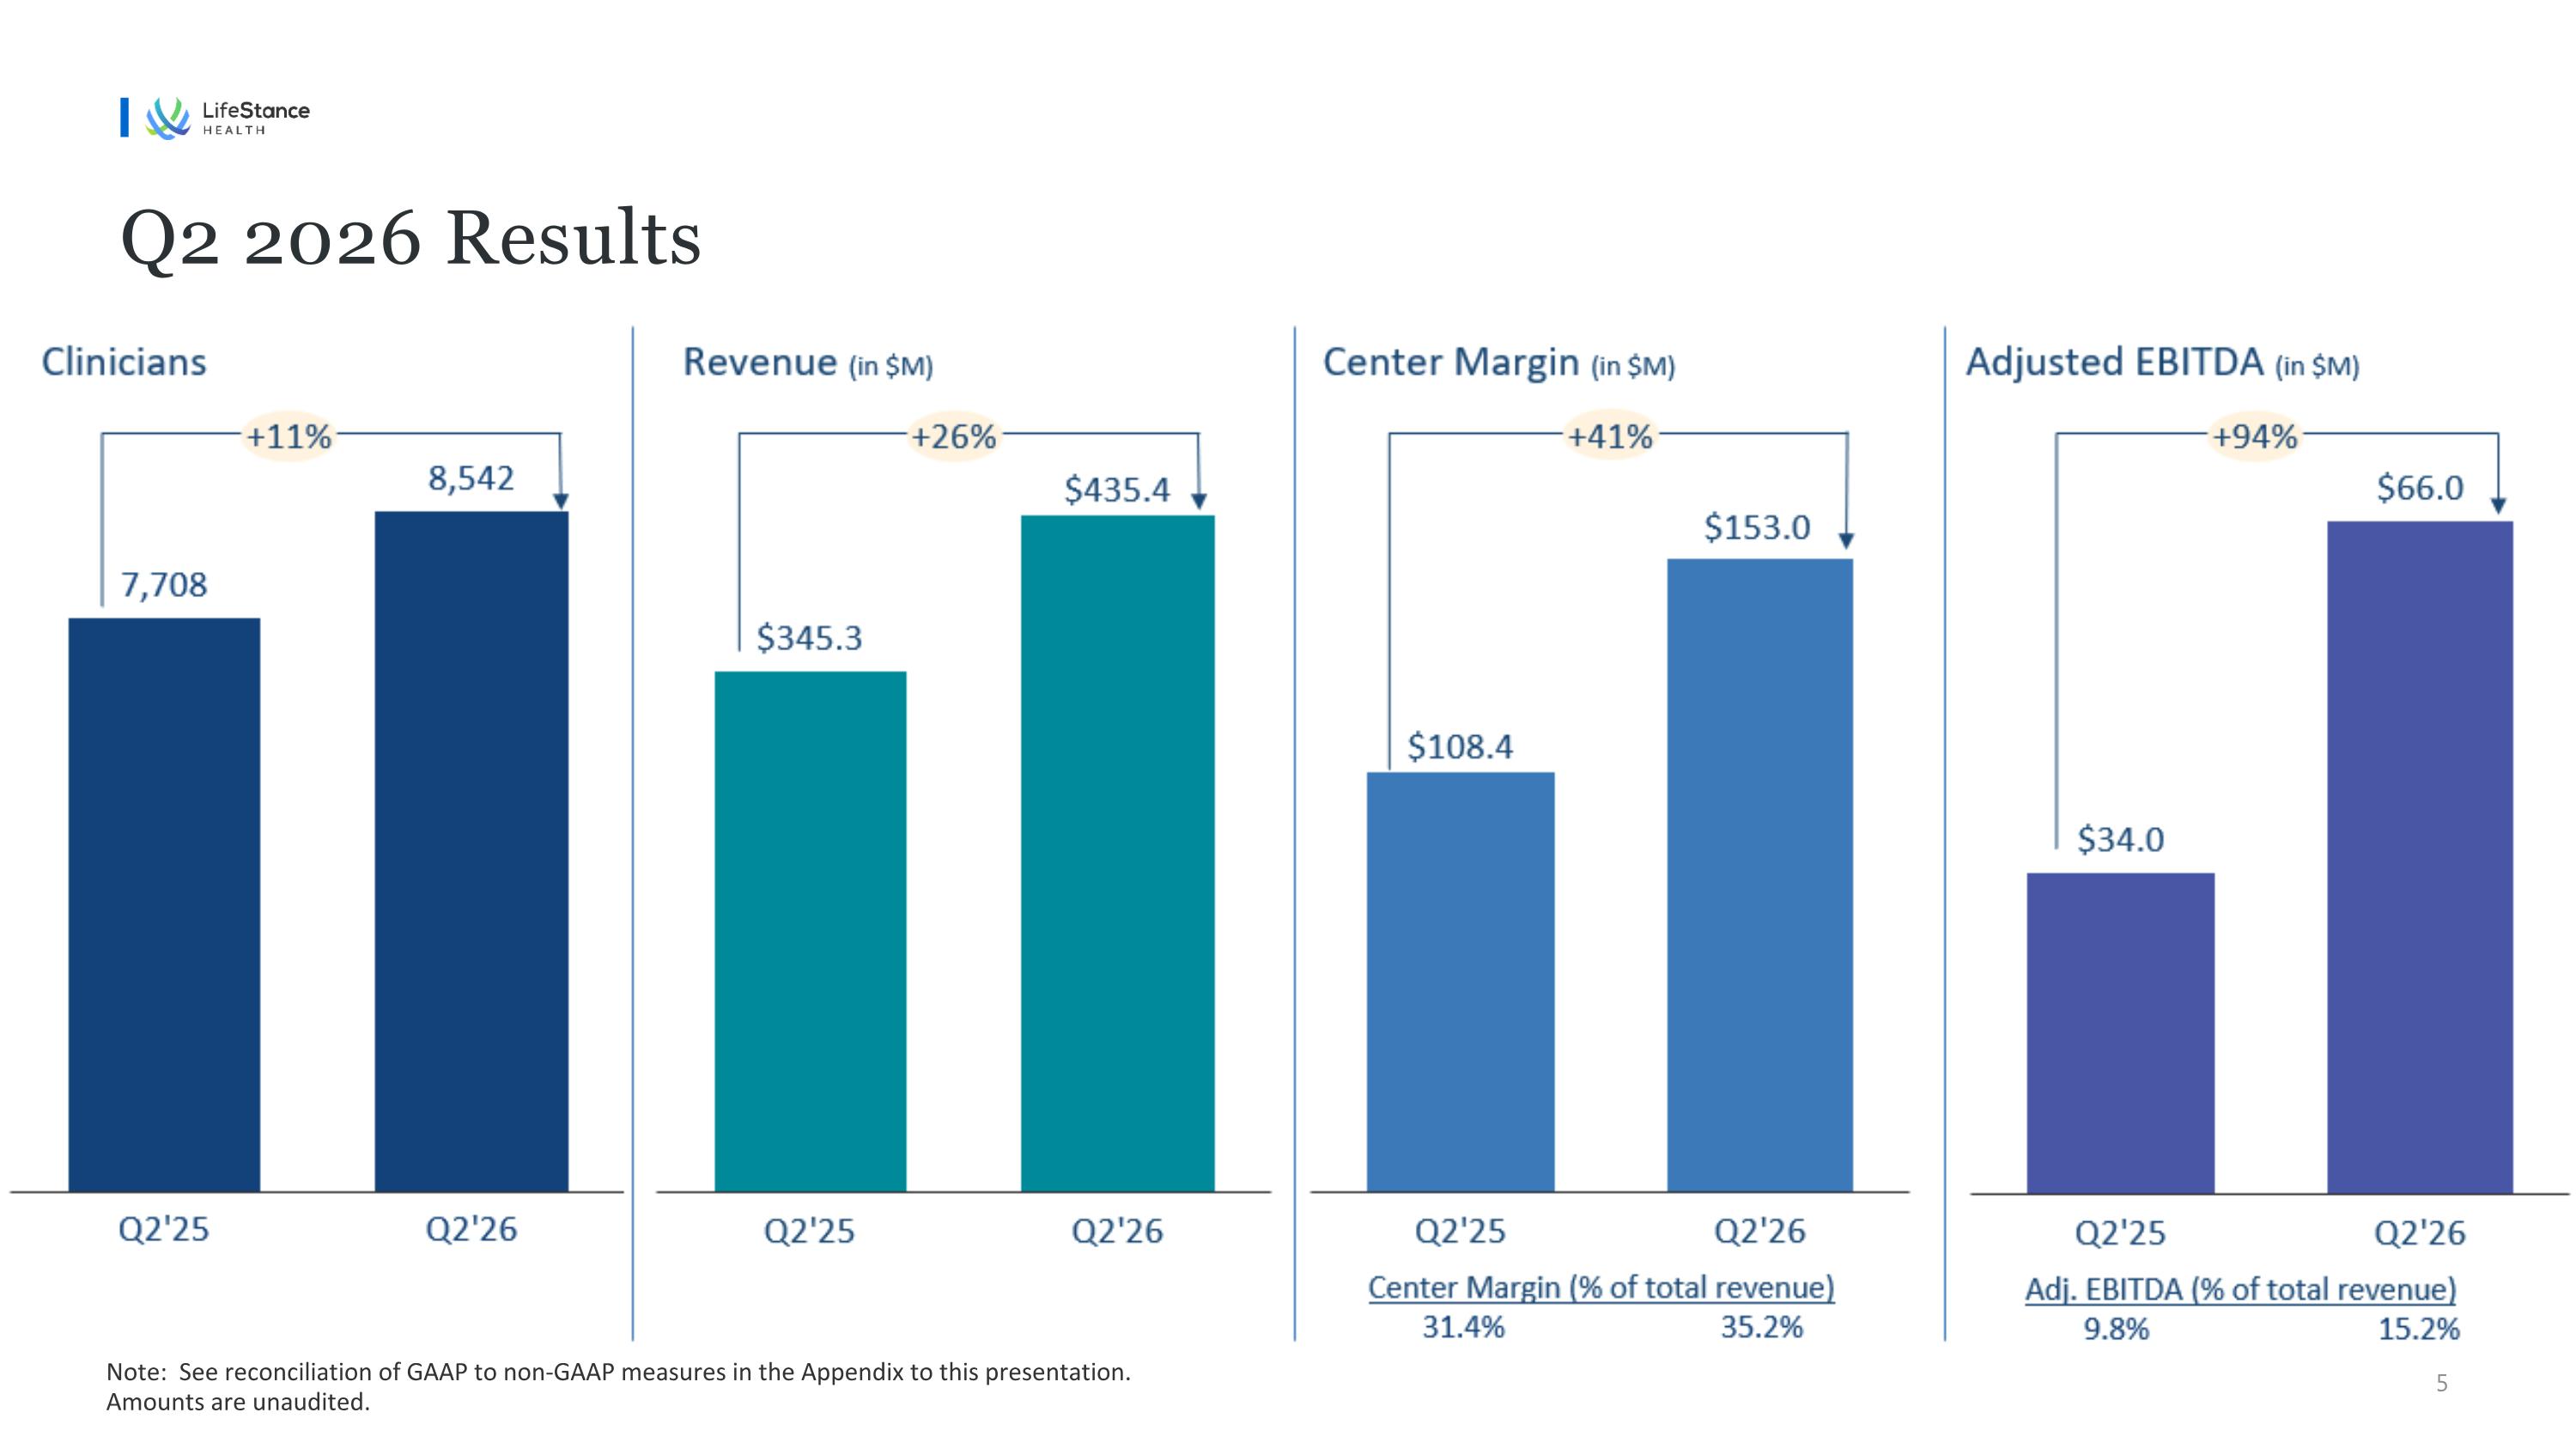
Clinicians Q2 2026 Results Adjusted EBITDA (in $M) Center Margin (in $M) Revenue (in $M) 9.8% 15.2% 31.4% 35.2% Center Margin (% of total revenue) +41% +26% +11% +94% Adj. EBITDA (% of total revenue) Note: See reconciliation of GAAP to non-GAAP measures in the Appendix to this presentation. Amounts are unaudited.
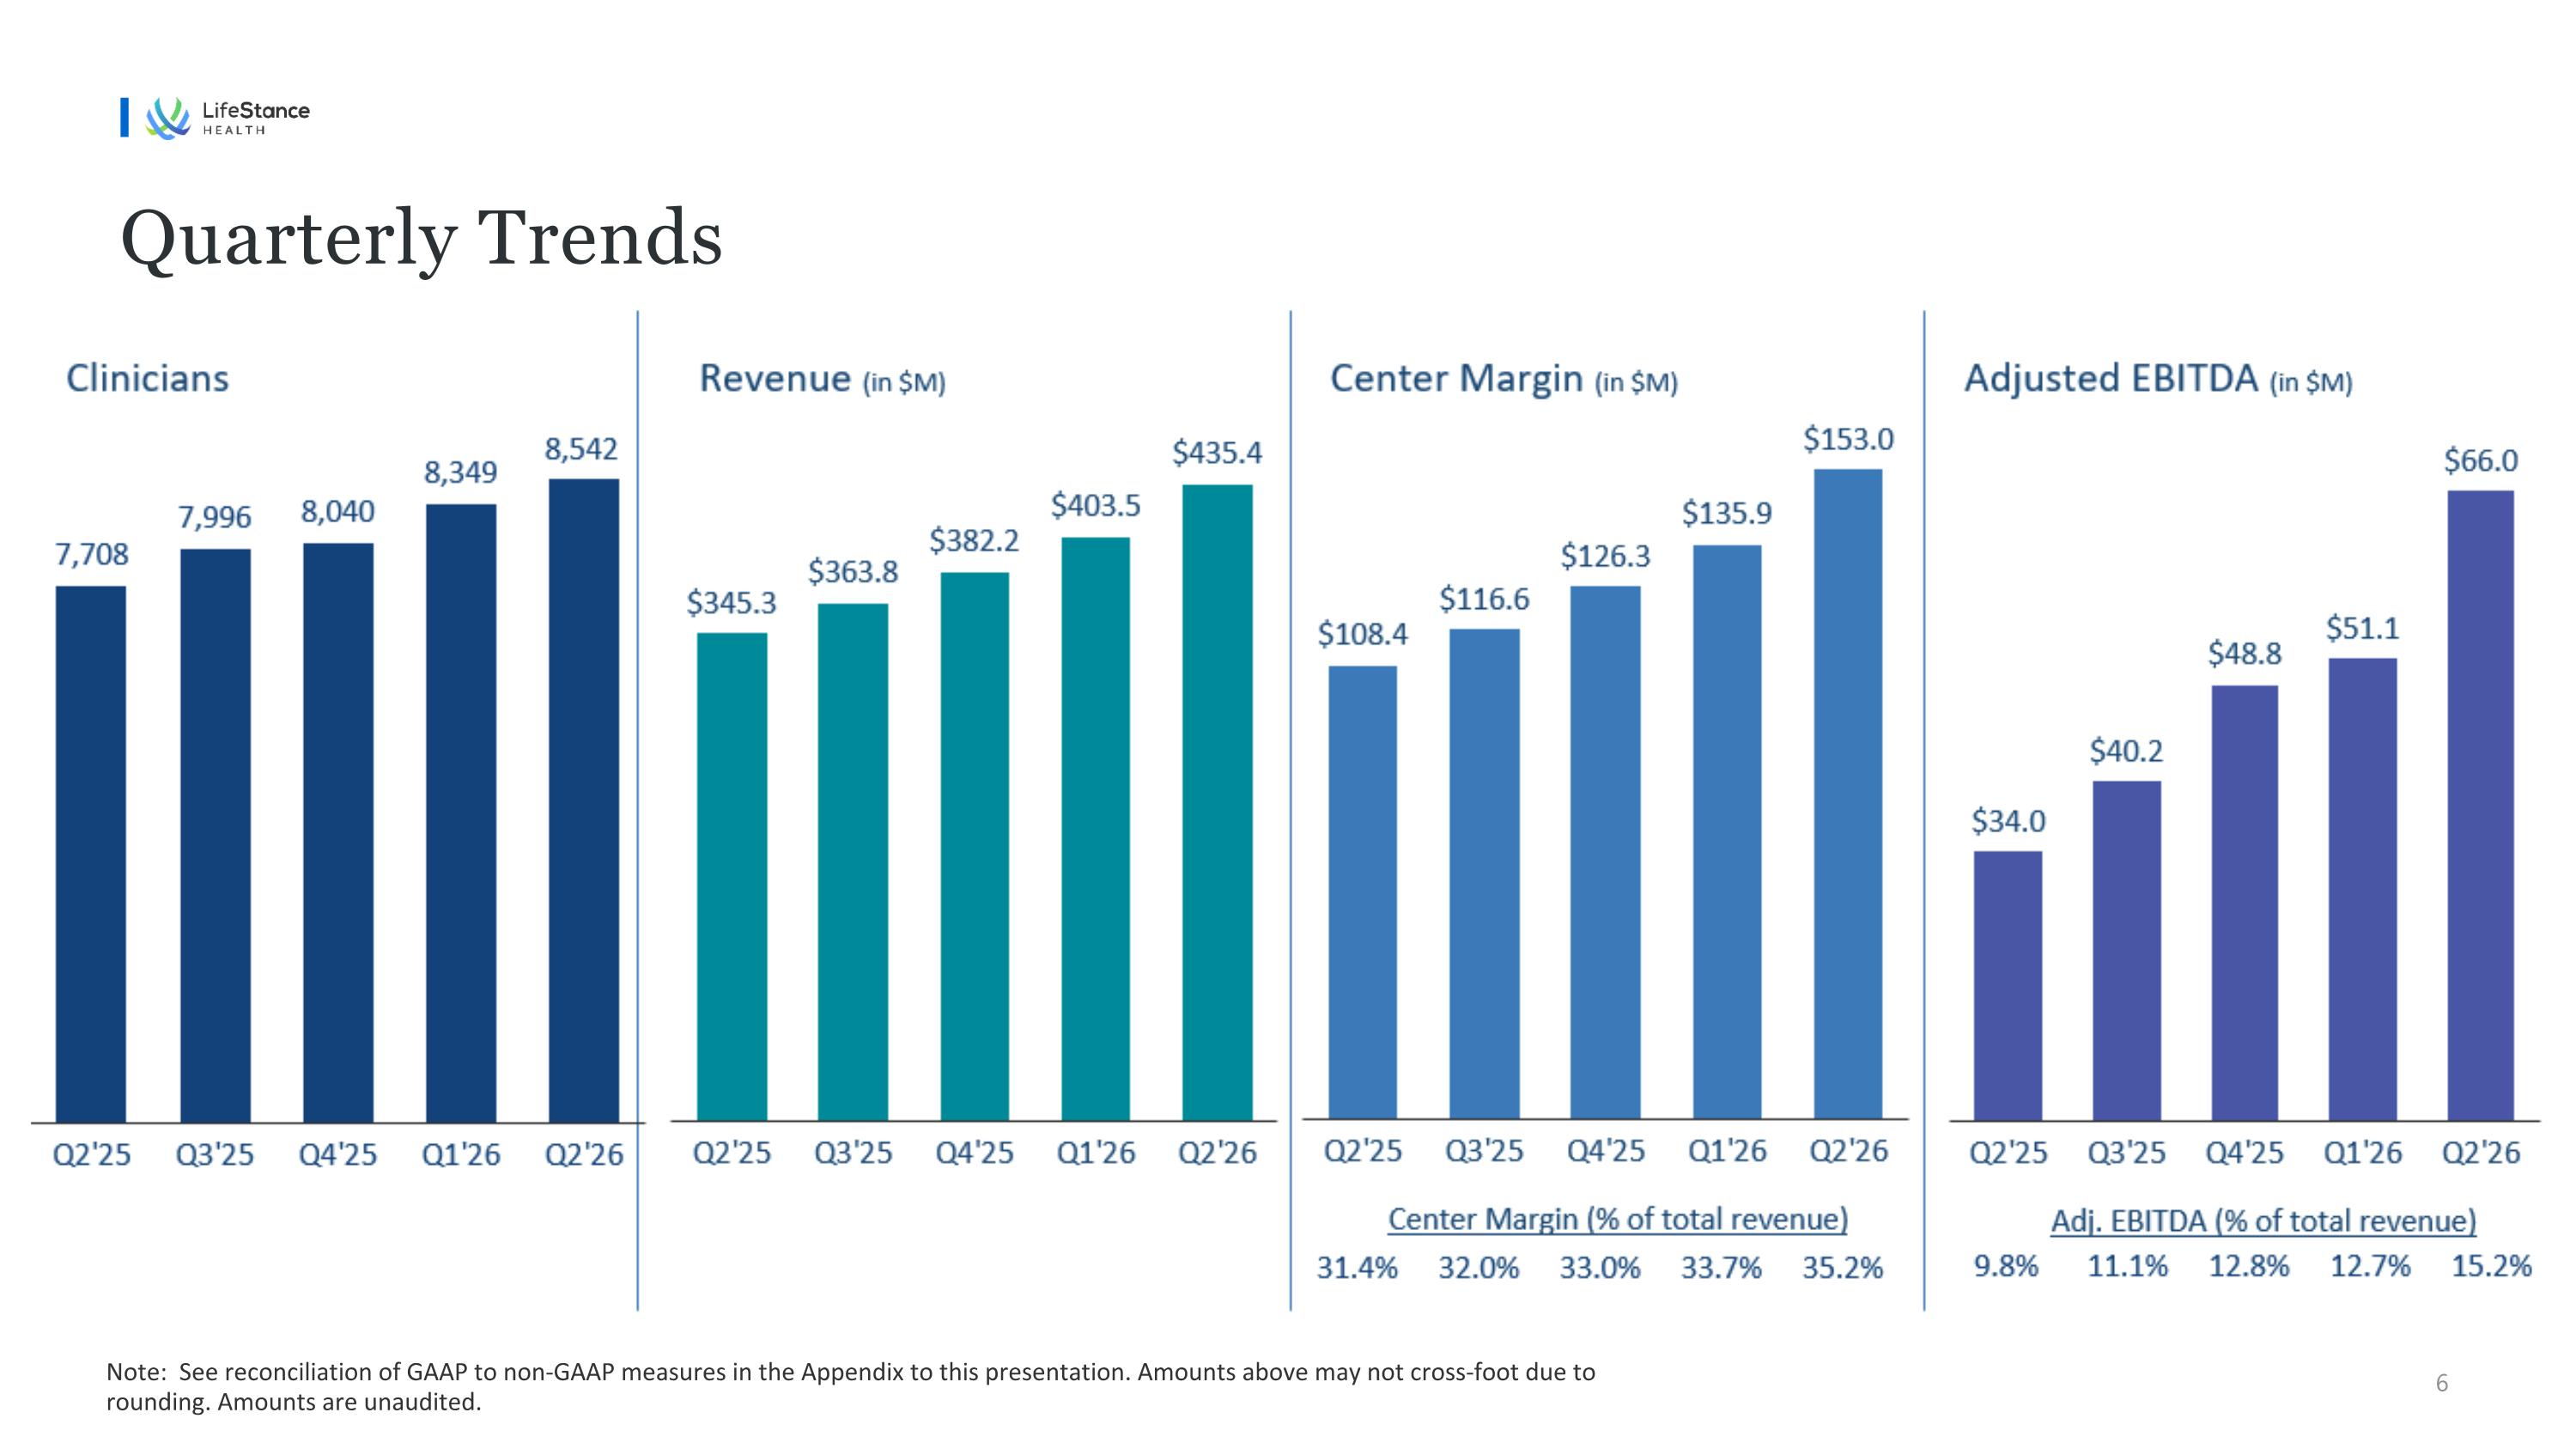
Quarterly Trends Clinicians Adjusted EBITDA (in $M) Adj. EBITDA (% of total revenue) Center Margin (in $M) Revenue (in $M) Center Margin (% of total revenue) 31.4% 32.0% 33.0% 33.7% 35.2% 9.8% 11.1% 12.8% 12.7% 15.2% Note: See reconciliation of GAAP to non-GAAP measures in the Appendix to this presentation. Amounts above may not cross-foot due to rounding. Amounts are unaudited.
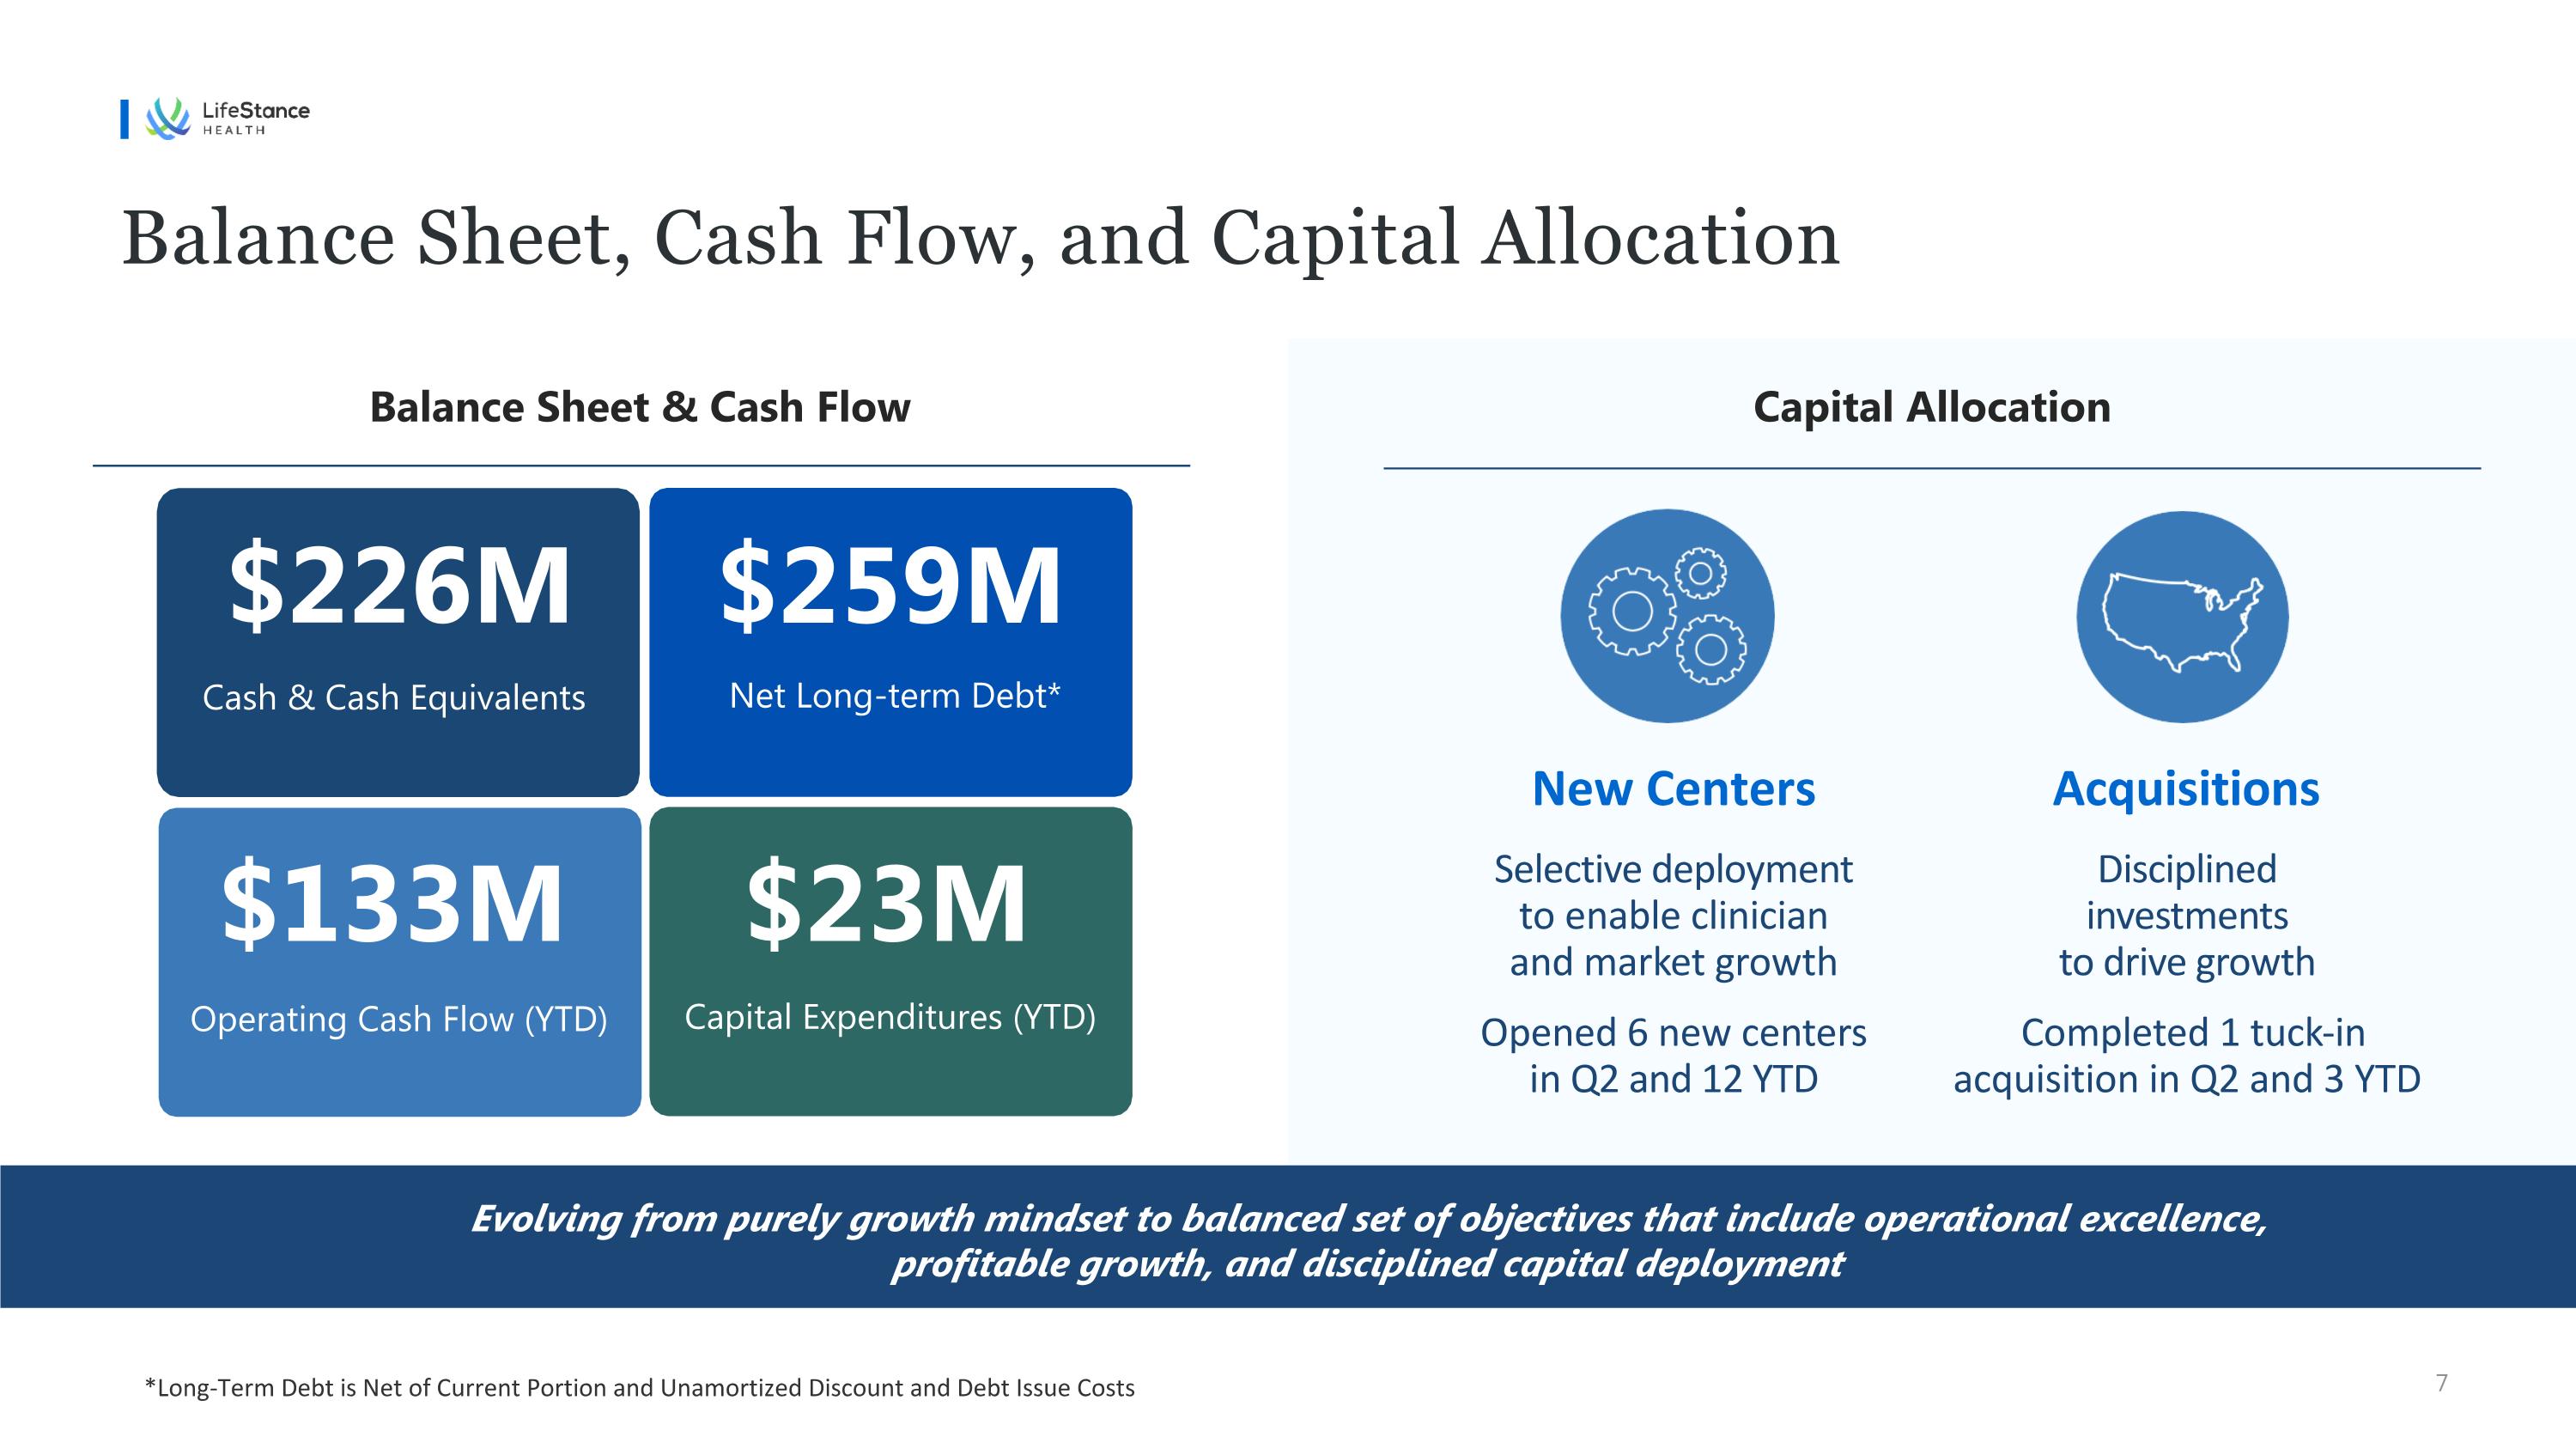
Balance Sheet, Cash Flow, and Capital Allocation *Long-Term Debt is Net of Current Portion and Unamortized Discount and Debt Issue Costs Balance Sheet & Cash Flow Capital Allocation Evolving from purely growth mindset to balanced set of objectives that include operational excellence, profitable growth, and disciplined capital deployment $259M Net Long-term Debt* Cash & Cash Equivalents $226M $133M Operating Cash Flow (YTD) $23M Capital Expenditures (YTD) New Centers Selective deployment to enable clinician and market growth Opened 6 new centers in Q2 and 12 YTD Acquisitions Disciplined investments to drive growth Completed 1 tuck-in acquisition in Q2 and 3 YTD
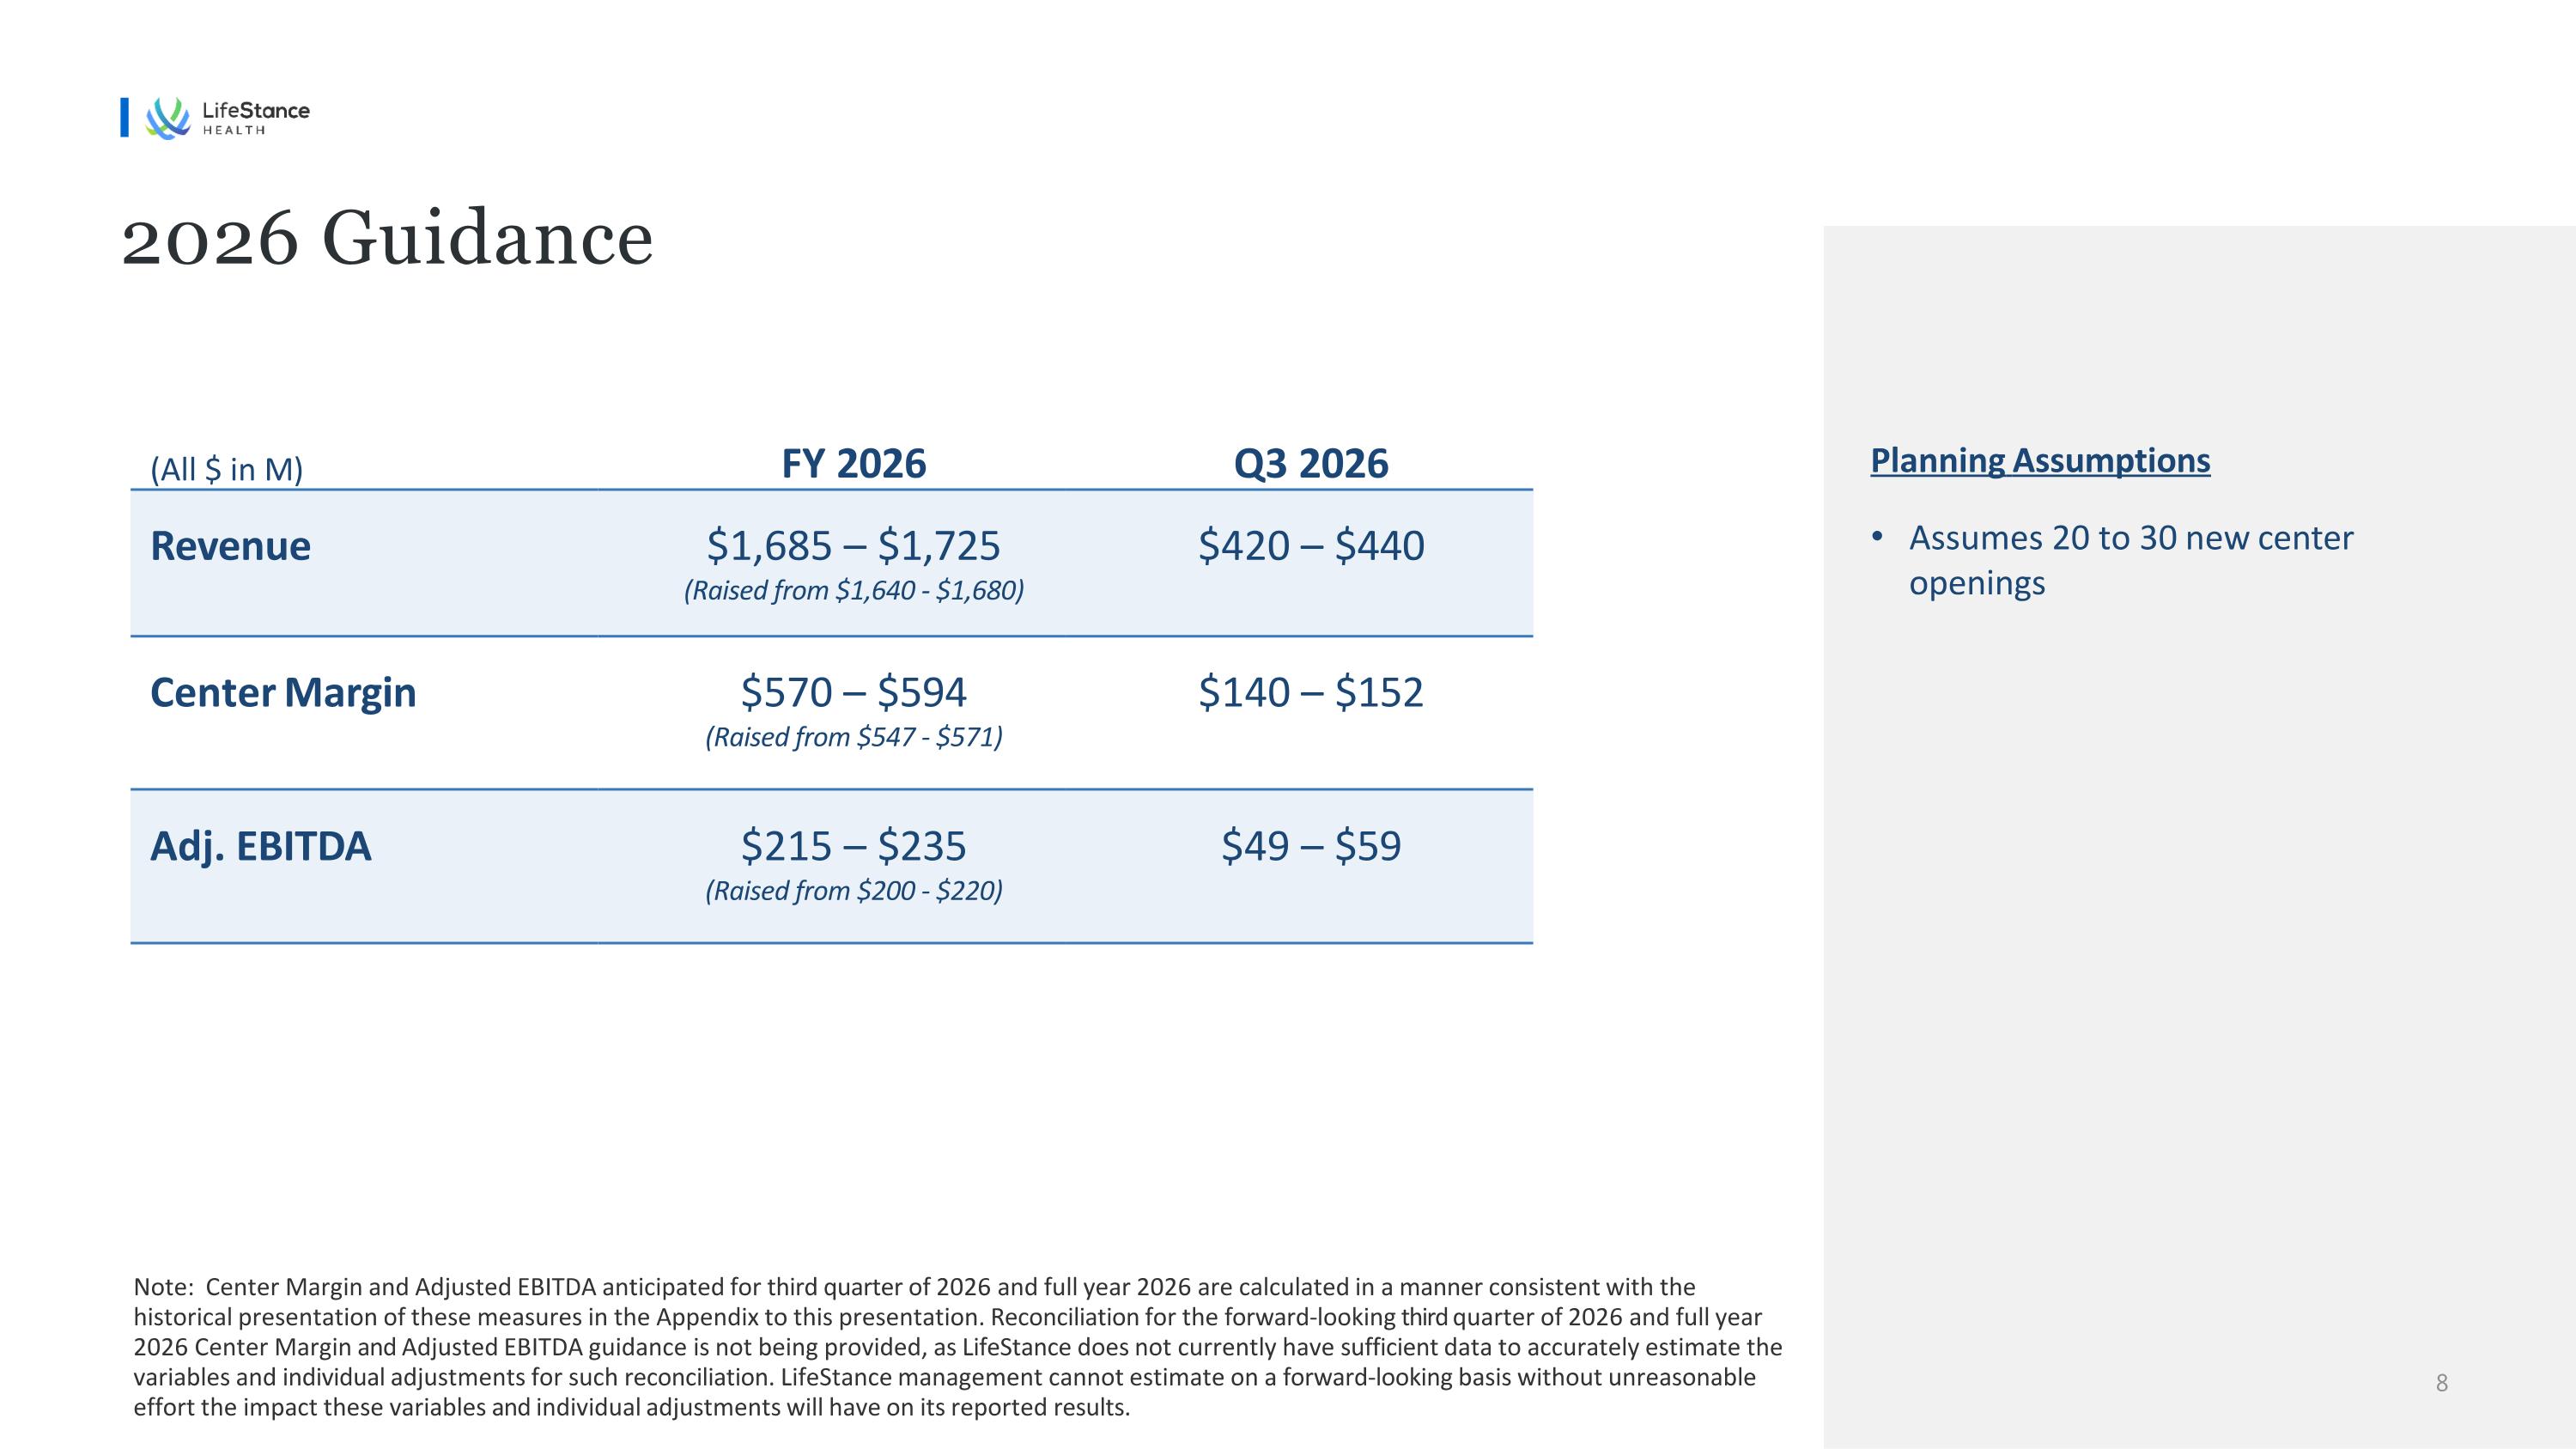
2026 Guidance (All $ in M) FY 2026 Q3 2026 Revenue $1,685 – $1,725 (Raised from $1,640 - $1,680) $420 – $440 Center Margin $570 – $594 (Raised from $547 - $571) $140 – $152 Adj. EBITDA $215 – $235 (Raised from $200 - $220) $49 – $59 Note: Center Margin and Adjusted EBITDA anticipated for third quarter of 2026 and full year 2026 are calculated in a manner consistent with the historical presentation of these measures in the Appendix to this presentation. Reconciliation for the forward-looking third quarter of 2026 and full year 2026 Center Margin and Adjusted EBITDA guidance is not being provided, as LifeStance does not currently have sufficient data to accurately estimate the variables and individual adjustments for such reconciliation. LifeStance management cannot estimate on a forward-looking basis without unreasonable effort the impact these variables and individual adjustments will have on its reported results. Planning Assumptions Assumes 20 to 30 new center openings

Appendix
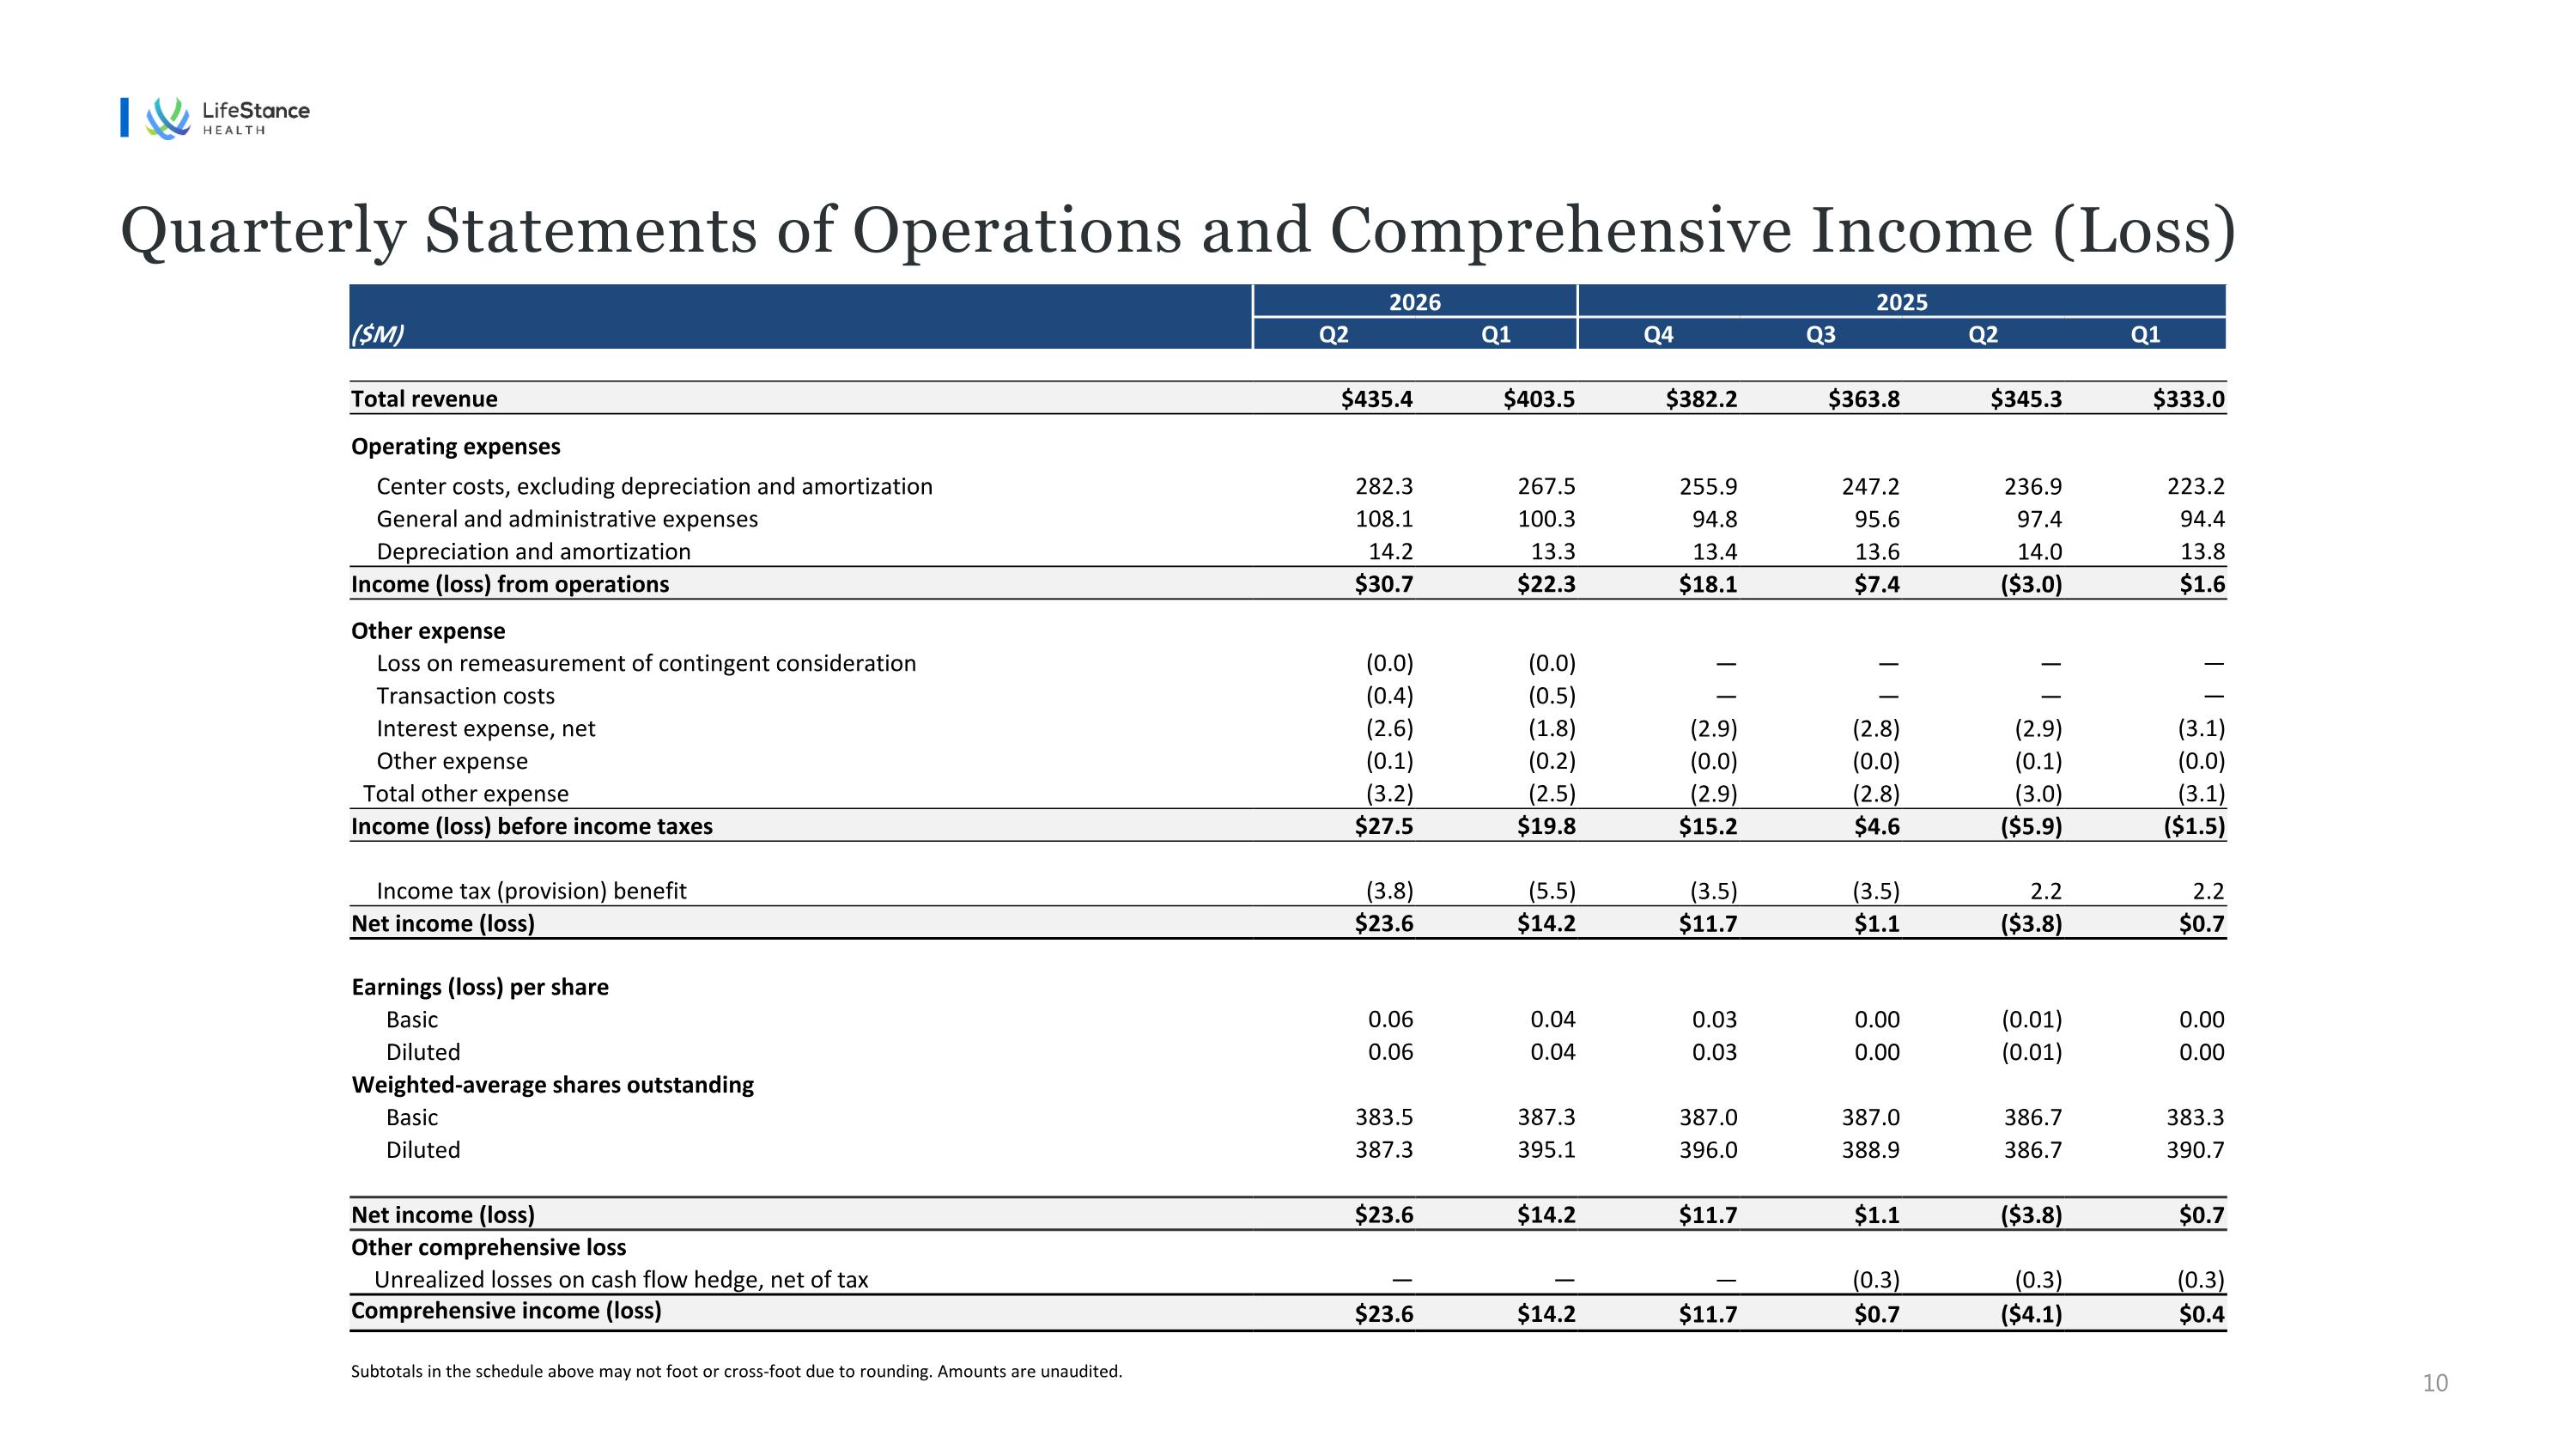
2026 2025 ($M) Q2 Q1 Q4 Q3 Q2 Q1 Total revenue $435.4 $403.5 $382.2 $363.8 $345.3 $333.0 Operating expenses Center costs, excluding depreciation and amortization 282.3 267.5 255.9 247.2 236.9 223.2 General and administrative expenses 108.1 100.3 94.8 95.6 97.4 94.4 Depreciation and amortization 14.2 13.3 13.4 13.6 14.0 13.8 Income (loss) from operations $30.7 $22.3 $18.1 $7.4 ($3.0) $1.6 Other expense Loss on remeasurement of contingent consideration (0.0) (0.0) — — — — Transaction costs (0.4) (0.5) — — — — Interest expense, net (2.6) (1.8) (2.9) (2.8) (2.9) (3.1) Other expense (0.1) (0.2) (0.0) (0.0) (0.1) (0.0) Total other expense (3.2) (2.5) (2.9) (2.8) (3.0) (3.1) Income (loss) before income taxes $27.5 $19.8 $15.2 $4.6 ($5.9) ($1.5) Income tax (provision) benefit (3.8) (5.5) (3.5) (3.5) 2.2 2.2 Net income (loss) $23.6 $14.2 $11.7 $1.1 ($3.8) $0.7 Earnings (loss) per share Basic 0.06 0.04 0.03 0.00 (0.01) 0.00 Diluted 0.06 0.04 0.03 0.00 (0.01) 0.00 Weighted-average shares outstanding Basic 383.5 387.3 387.0 387.0 386.7 383.3 Diluted 387.3 395.1 396.0 388.9 386.7 390.7 Net income (loss) $23.6 $14.2 $11.7 $1.1 ($3.8) $0.7 Other comprehensive loss Unrealized losses on cash flow hedge, net of tax — — — (0.3) (0.3) (0.3) Comprehensive income (loss) $23.6 $14.2 $11.7 $0.7 ($4.1) $0.4 Subtotals in the schedule above may not foot or cross-foot due to rounding. Amounts are unaudited. Quarterly Statements of Operations and Comprehensive Income (Loss)
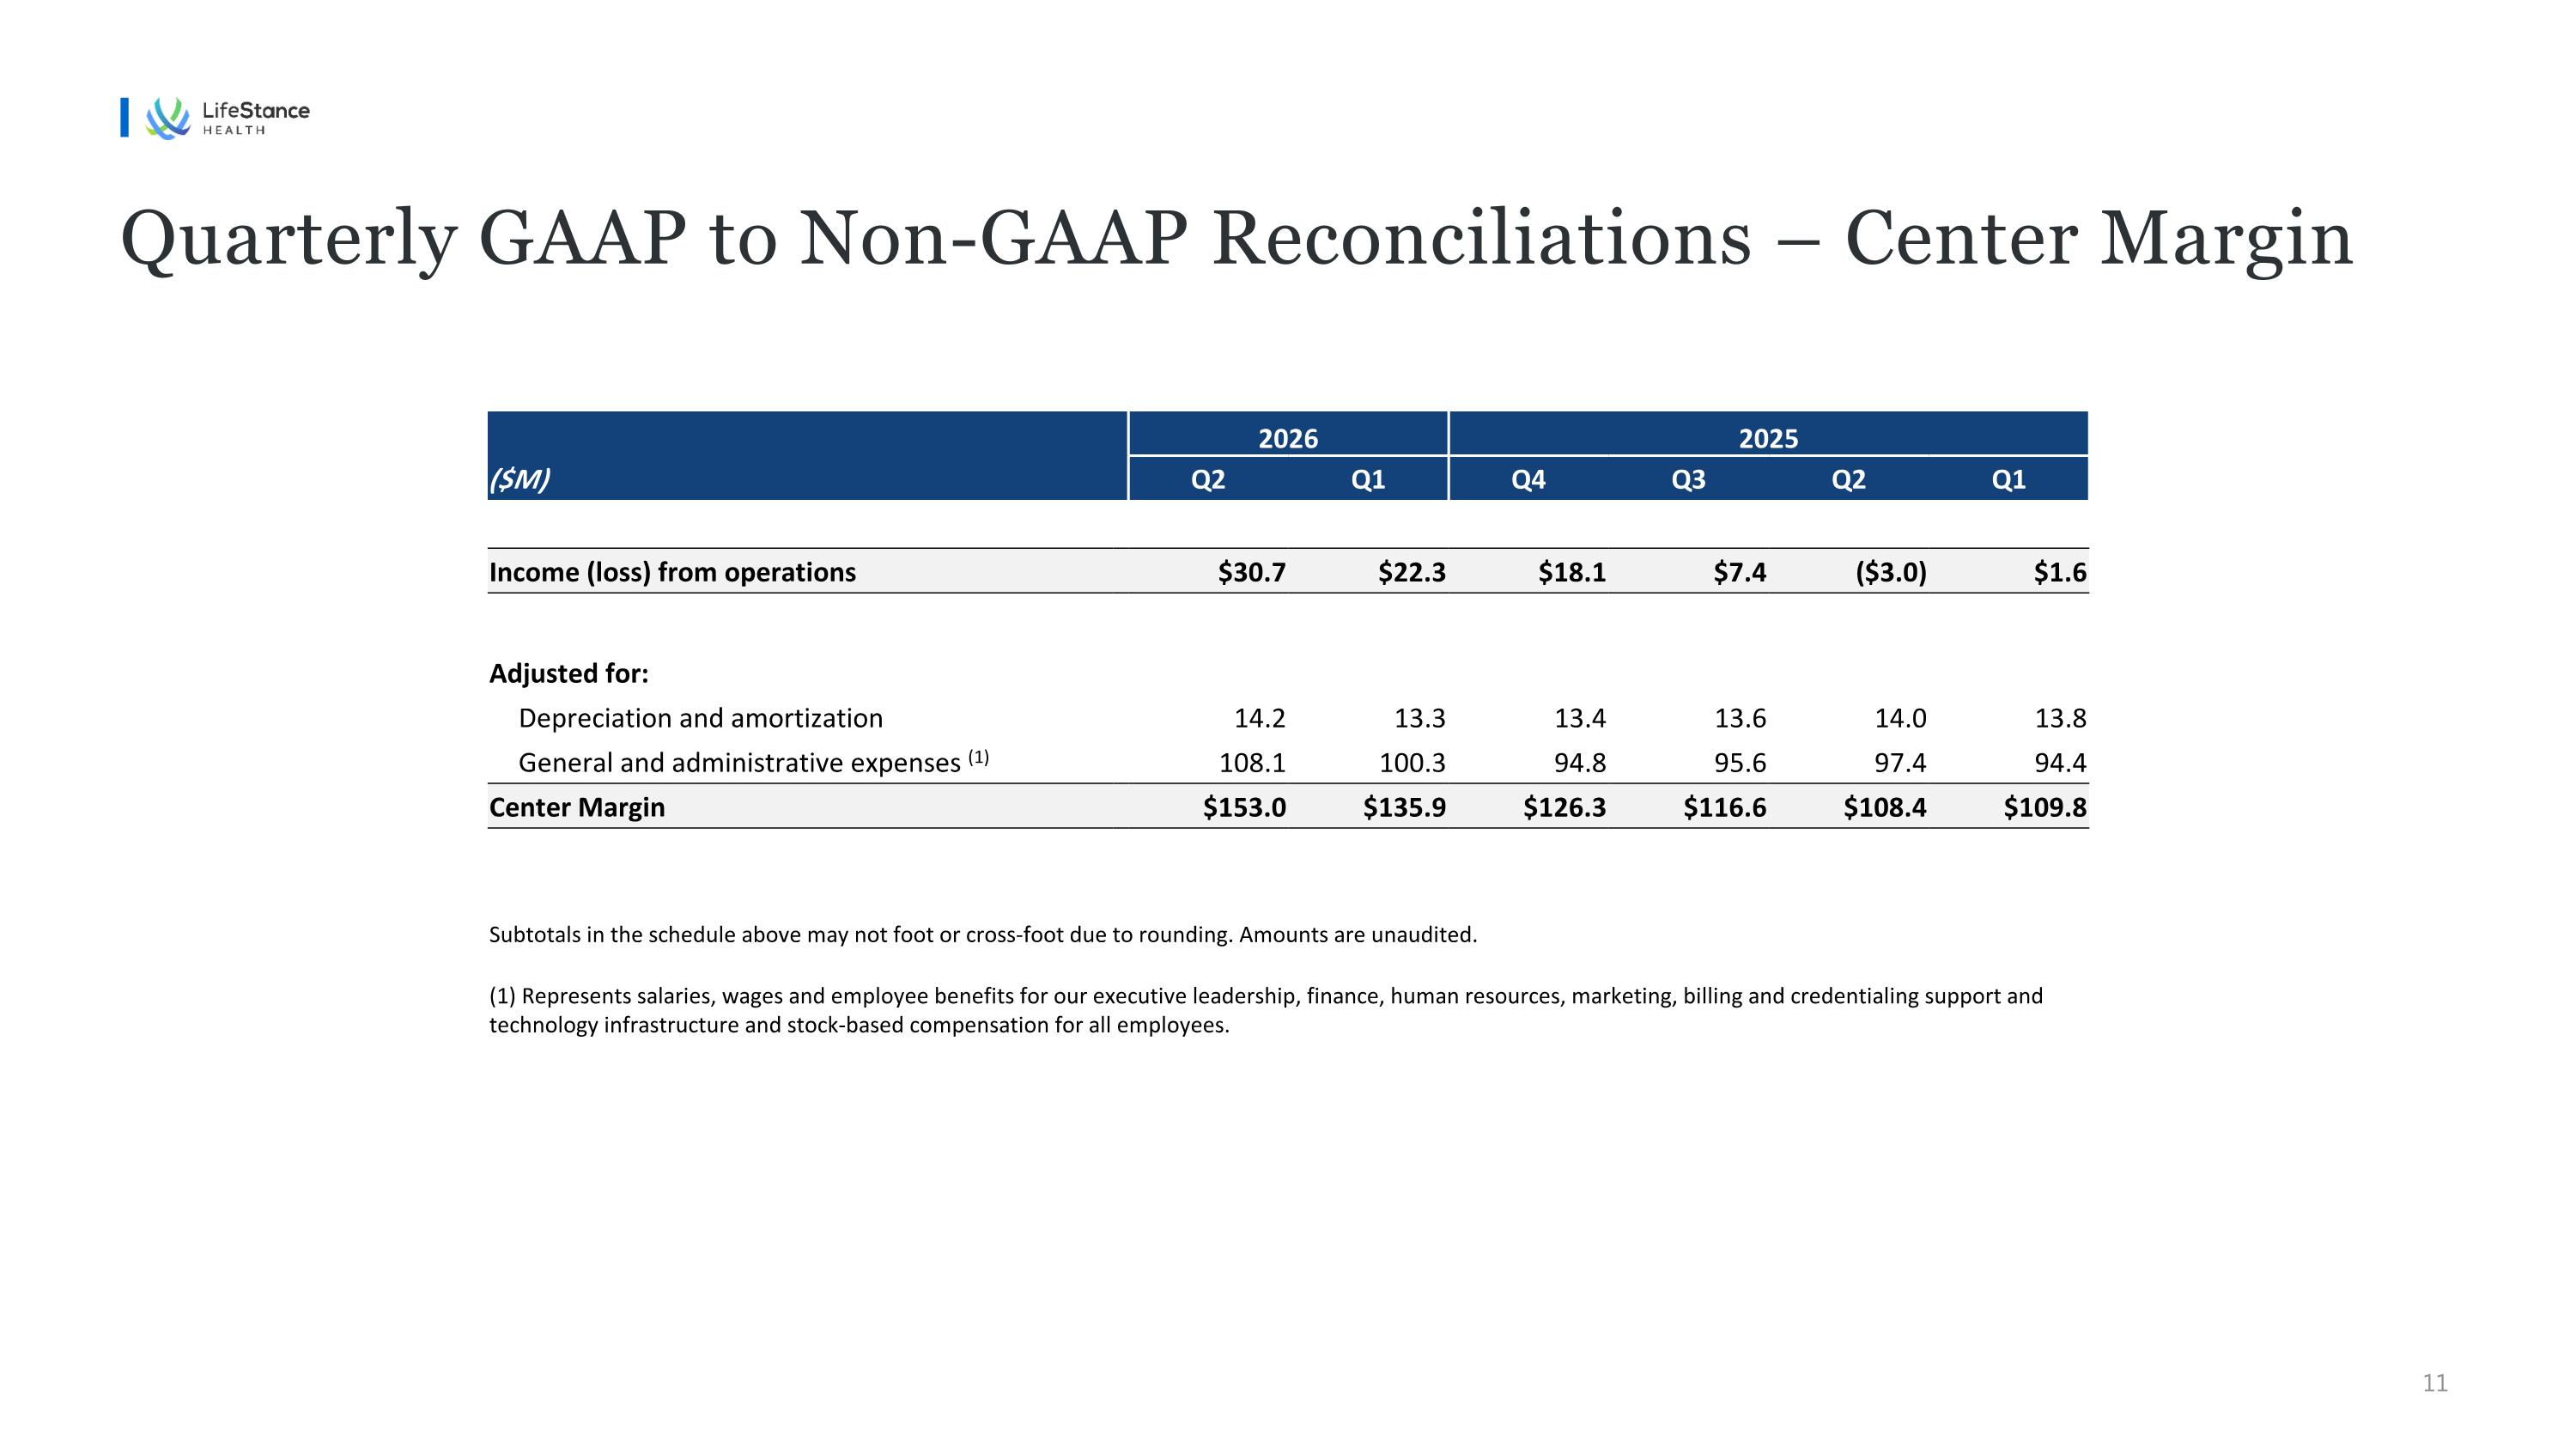
2026 2025 ($M) Q2 Q1 Q4 Q3 Q2 Q1 Income (loss) from operations $30.7 $22.3 $18.1 $7.4 ($3.0) $1.6 Adjusted for: Depreciation and amortization 14.2 13.3 13.4 13.6 14.0 13.8 General and administrative expenses (1) 108.1 100.3 94.8 95.6 97.4 94.4 Center Margin $153.0 $135.9 $126.3 $116.6 $108.4 $109.8 Subtotals in the schedule above may not foot or cross-foot due to rounding. Amounts are unaudited. (1) Represents salaries, wages and employee benefits for our executive leadership, finance, human resources, marketing, billing and credentialing support and technology infrastructure and stock-based compensation for all employees. Quarterly GAAP to Non-GAAP Reconciliations – Center Margin
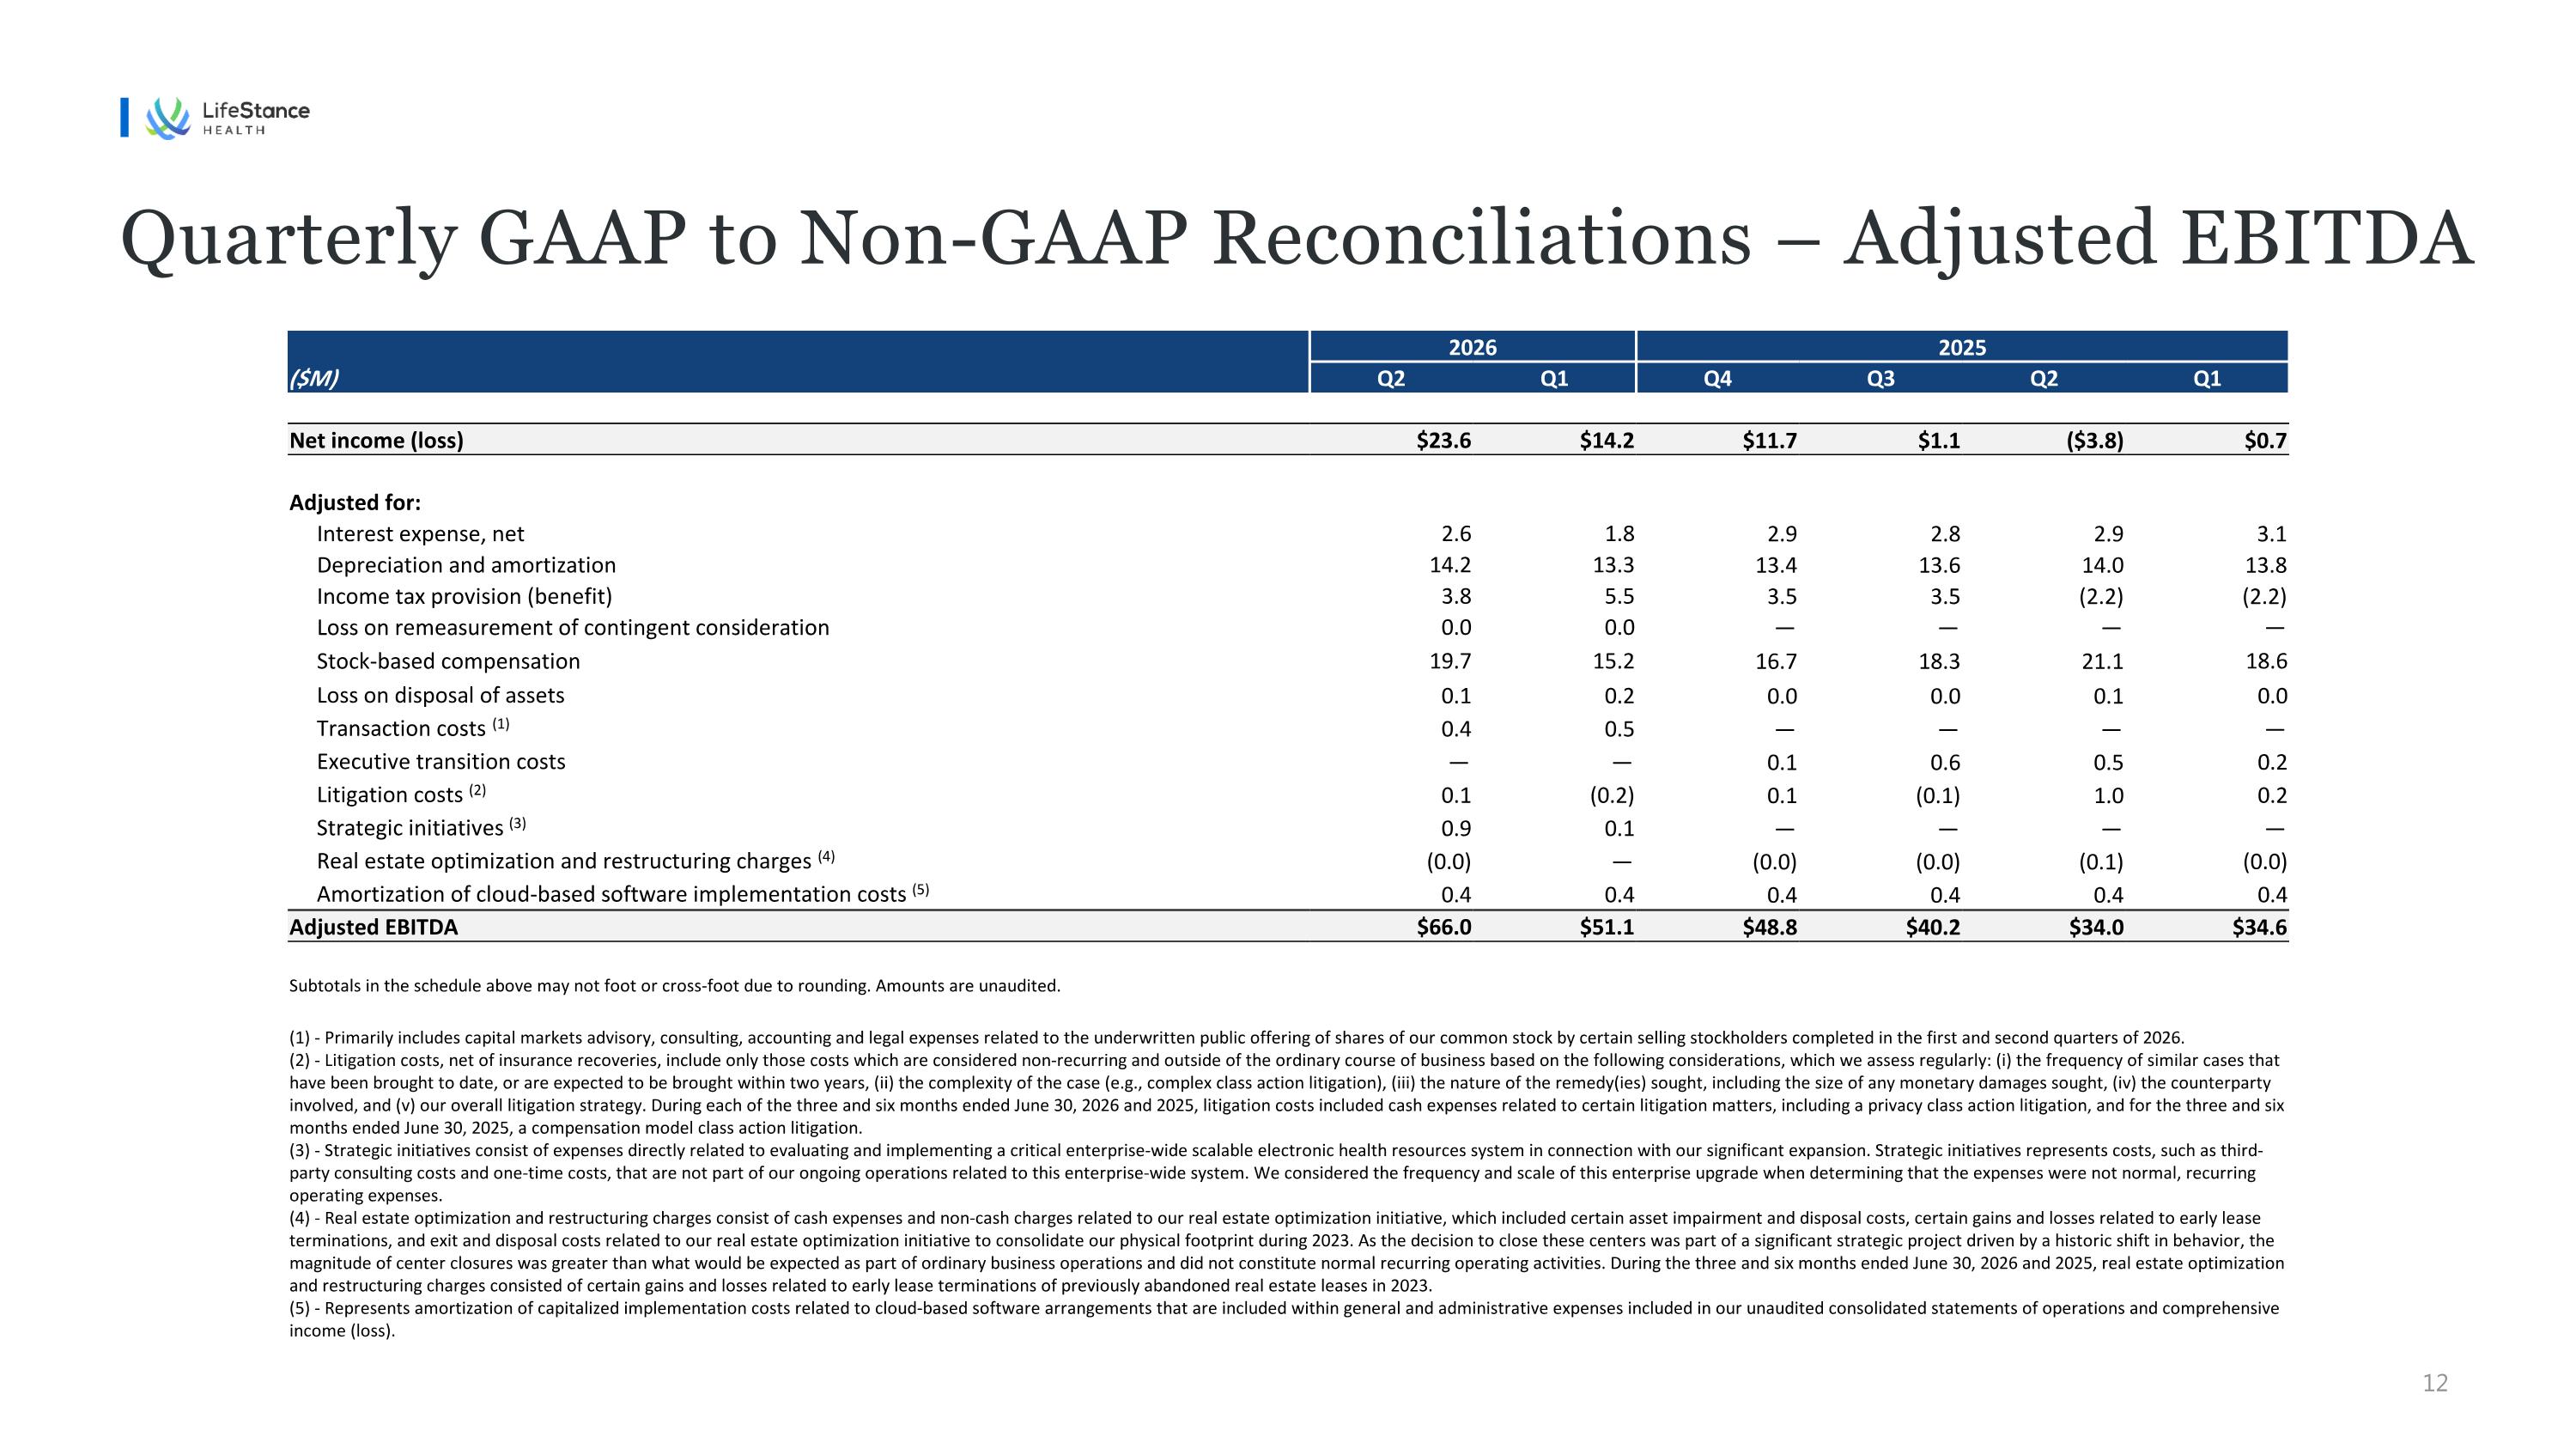
2026 2025 ($M) Q2 Q1 Q4 Q3 Q2 Q1 Net income (loss) $23.6 $14.2 $11.7 $1.1 ($3.8) $0.7 Adjusted for: Interest expense, net 2.6 1.8 2.9 2.8 2.9 3.1 Depreciation and amortization 14.2 13.3 13.4 13.6 14.0 13.8 Income tax provision (benefit) 3.8 5.5 3.5 3.5 (2.2) (2.2) Loss on remeasurement of contingent consideration 0.0 0.0 — — — — Stock-based compensation 19.7 15.2 16.7 18.3 21.1 18.6 Loss on disposal of assets 0.1 0.2 0.0 0.0 0.1 0.0 Transaction costs (1) 0.4 0.5 — — — — Executive transition costs — — 0.1 0.6 0.5 0.2 Litigation costs (2) 0.1 (0.2) 0.1 (0.1) 1.0 0.2 Strategic initiatives (3) 0.9 0.1 — — — — Real estate optimization and restructuring charges (4) (0.0) — (0.0) (0.0) (0.1) (0.0) Amortization of cloud-based software implementation costs (5) 0.4 0.4 0.4 0.4 0.4 0.4 Adjusted EBITDA $66.0 $51.1 $48.8 $40.2 $34.0 $34.6 Subtotals in the schedule above may not foot or cross-foot due to rounding. Amounts are unaudited. (1) - Primarily includes capital markets advisory, consulting, accounting and legal expenses related to the underwritten public offering of shares of our common stock by certain selling stockholders completed in the first and second quarters of 2026. (2) - Litigation costs, net of insurance recoveries, include only those costs which are considered non-recurring and outside of the ordinary course of business based on the following considerations, which we assess regularly: (i) the frequency of similar cases that have been brought to date, or are expected to be brought within two years, (ii) the complexity of the case (e.g., complex class action litigation), (iii) the nature of the remedy(ies) sought, including the size of any monetary damages sought, (iv) the counterparty involved, and (v) our overall litigation strategy. During each of the three and six months ended June 30, 2026 and 2025, litigation costs included cash expenses related to certain litigation matters, including a privacy class action litigation, and for the three and six months ended June 30, 2025, a compensation model class action litigation. (3) - Strategic initiatives consist of expenses directly related to evaluating and implementing a critical enterprise-wide scalable electronic health resources system in connection with our significant expansion. Strategic initiatives represents costs, such as third-party consulting costs and one-time costs, that are not part of our ongoing operations related to this enterprise-wide system. We considered the frequency and scale of this enterprise upgrade when determining that the expenses were not normal, recurring operating expenses. (4) - Real estate optimization and restructuring charges consist of cash expenses and non-cash charges related to our real estate optimization initiative, which included certain asset impairment and disposal costs, certain gains and losses related to early lease terminations, and exit and disposal costs related to our real estate optimization initiative to consolidate our physical footprint during 2023. As the decision to close these centers was part of a significant strategic project driven by a historic shift in behavior, the magnitude of center closures was greater than what would be expected as part of ordinary business operations and did not constitute normal recurring operating activities. During the three and six months ended June 30, 2026 and 2025, real estate optimization and restructuring charges consisted of certain gains and losses related to early lease terminations of previously abandoned real estate leases in 2023. (5) - Represents amortization of capitalized implementation costs related to cloud-based software arrangements that are included within general and administrative expenses included in our unaudited consolidated statements of operations and comprehensive income (loss). Quarterly GAAP to Non-GAAP Reconciliations – Adjusted EBITDA
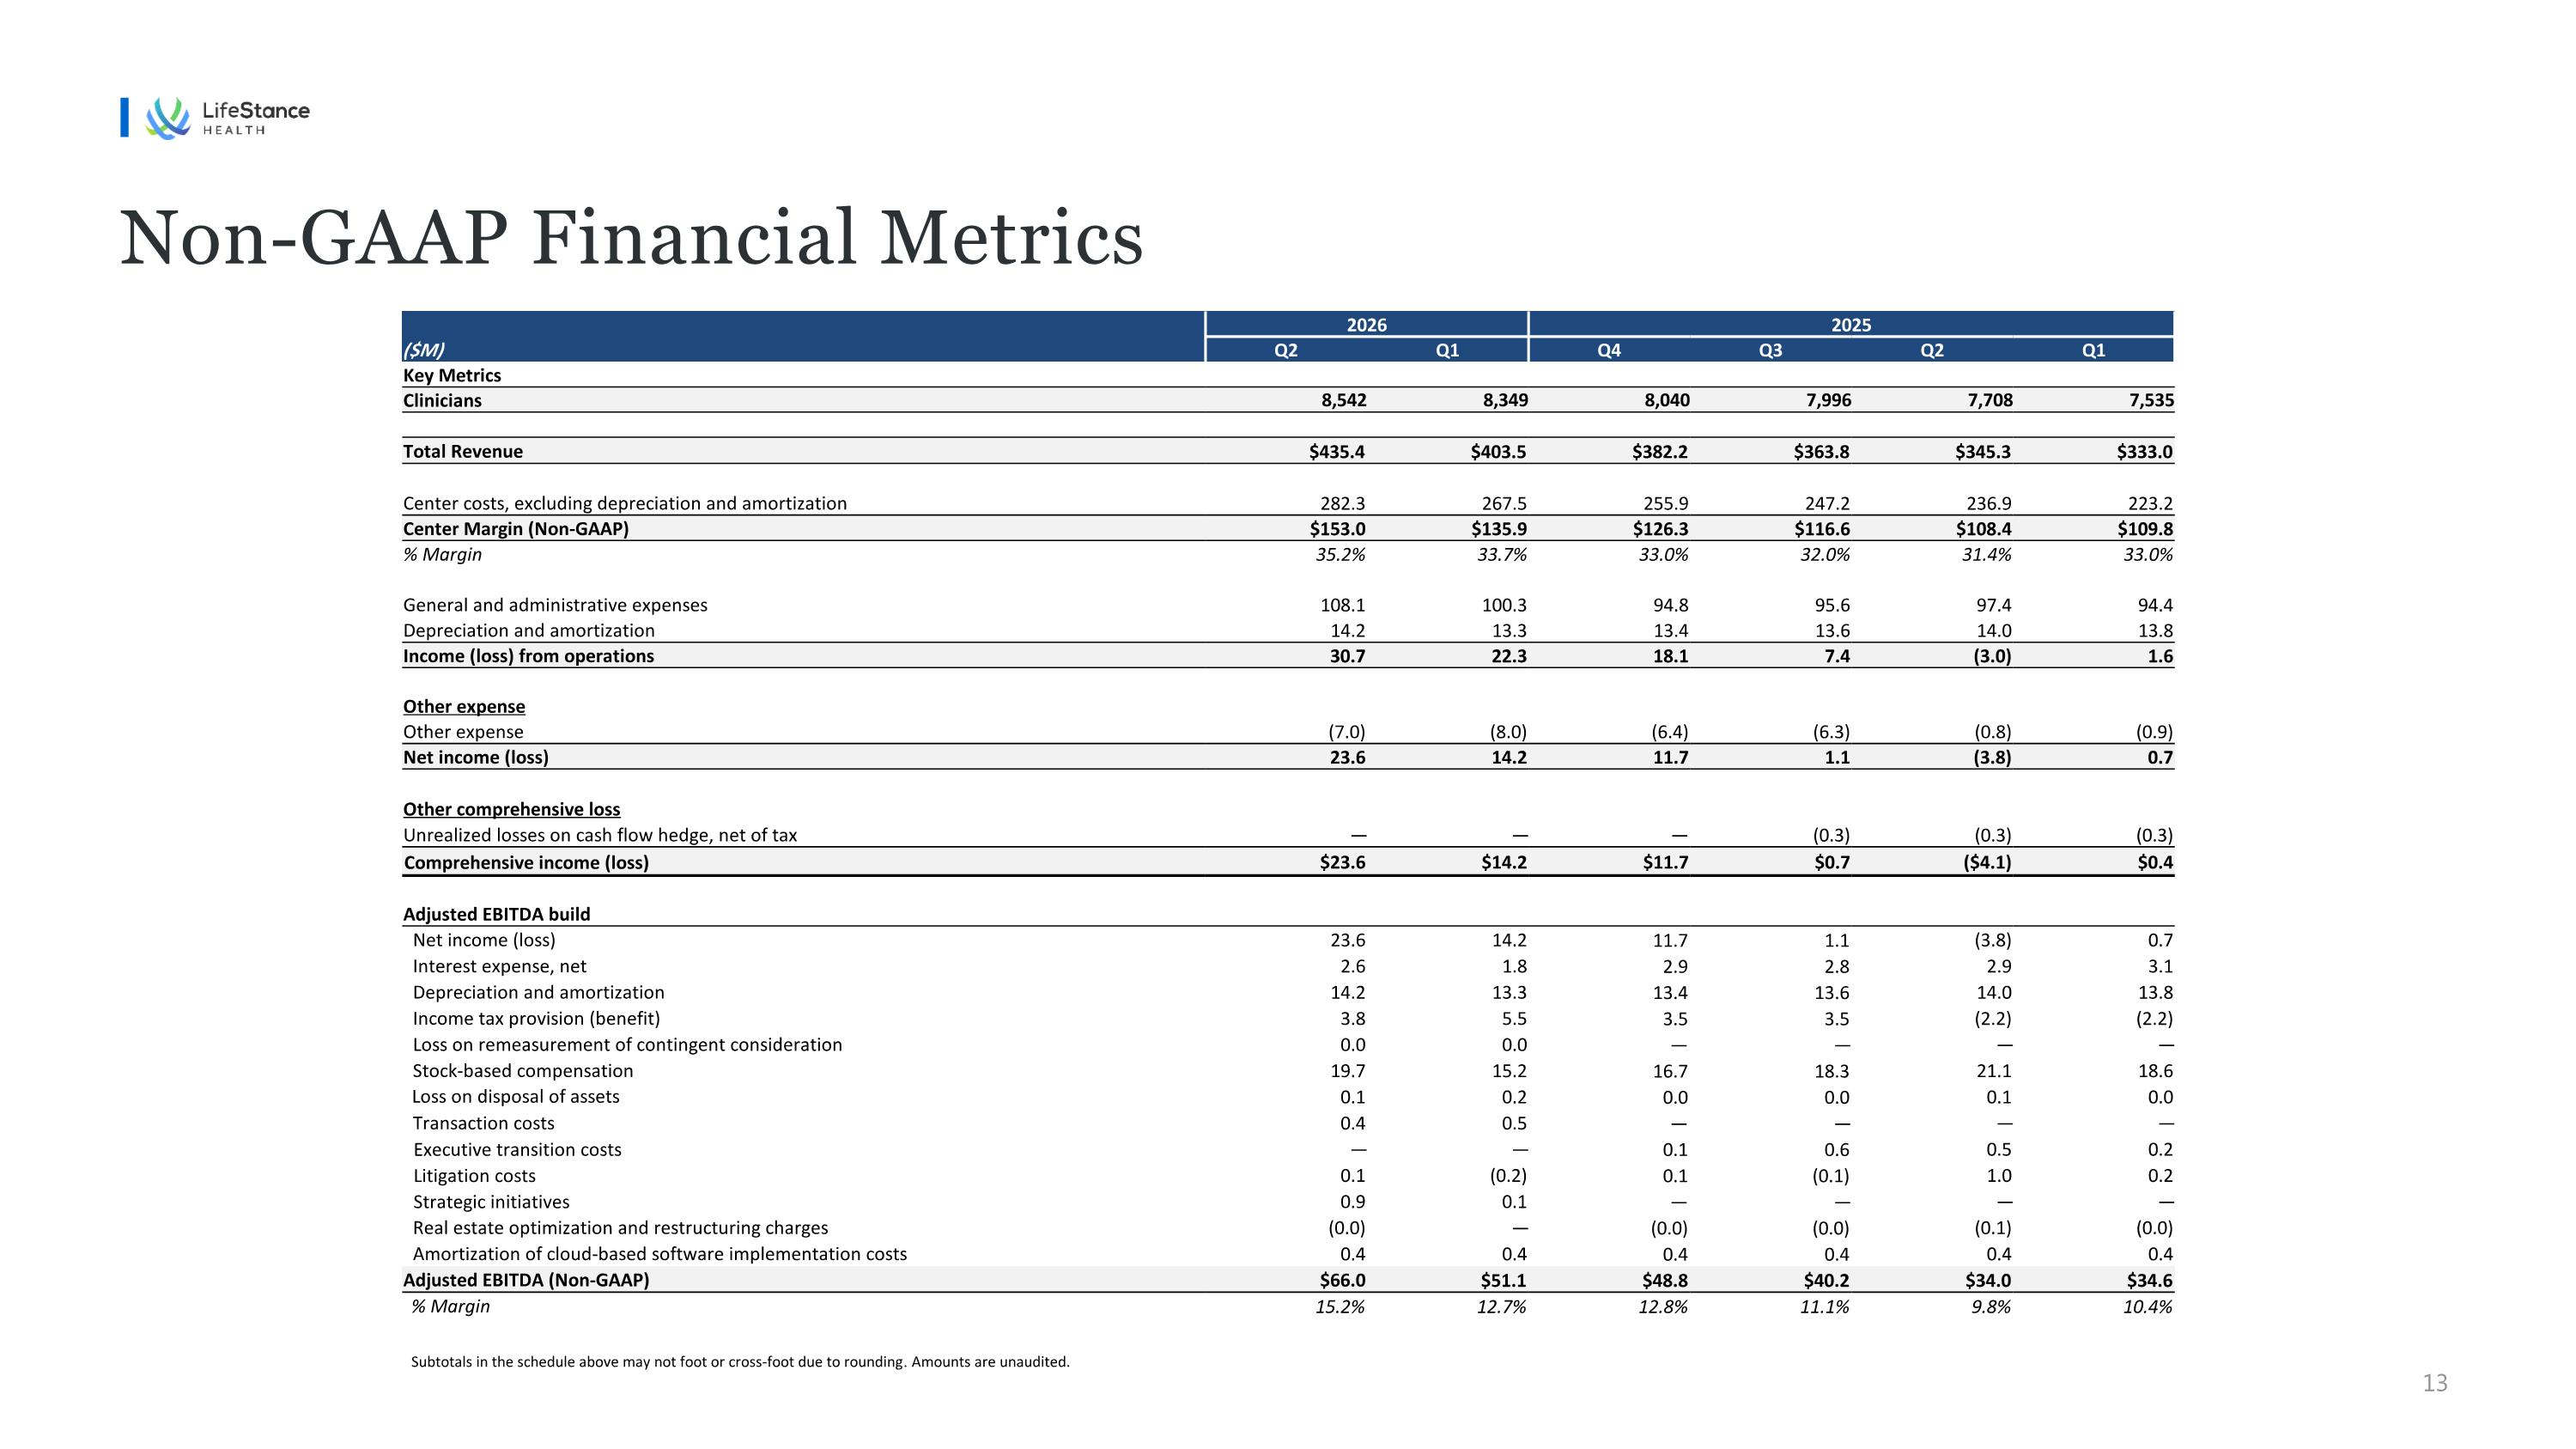
2026 2025 ($M) Q2 Q1 Q4 Q3 Q2 Q1 Key Metrics Clinicians 8,542 8,349 8,040 7,996 7,708 7,535 Total Revenue $435.4 $403.5 $382.2 $363.8 $345.3 $333.0 Center costs, excluding depreciation and amortization 282.3 267.5 255.9 247.2 236.9 223.2 Center Margin (Non-GAAP) $153.0 $135.9 $126.3 $116.6 $108.4 $109.8 % Margin 35.2% 33.7% 33.0% 32.0% 31.4% 33.0% General and administrative expenses 108.1 100.3 94.8 95.6 97.4 94.4 Depreciation and amortization 14.2 13.3 13.4 13.6 14.0 13.8 Income (loss) from operations 30.7 22.3 18.1 7.4 (3.0) 1.6 Other expense Other expense (7.0) (8.0) (6.4) (6.3) (0.8) (0.9) Net income (loss) 23.6 14.2 11.7 1.1 (3.8) 0.7 Other comprehensive loss Unrealized losses on cash flow hedge, net of tax — — — (0.3) (0.3) (0.3) Comprehensive income (loss) $23.6 $14.2 $11.7 $0.7 ($4.1) $0.4 Adjusted EBITDA build Net income (loss) 23.6 14.2 11.7 1.1 (3.8) 0.7 Interest expense, net 2.6 1.8 2.9 2.8 2.9 3.1 Depreciation and amortization 14.2 13.3 13.4 13.6 14.0 13.8 Income tax provision (benefit) 3.8 5.5 3.5 3.5 (2.2) (2.2) Loss on remeasurement of contingent consideration 0.0 0.0 — — — — Stock-based compensation 19.7 15.2 16.7 18.3 21.1 18.6 Loss on disposal of assets 0.1 0.2 0.0 0.0 0.1 0.0 Transaction costs 0.4 0.5 — — — — Executive transition costs — — 0.1 0.6 0.5 0.2 Litigation costs 0.1 (0.2) 0.1 (0.1) 1.0 0.2 Strategic initiatives 0.9 0.1 — — — — Real estate optimization and restructuring charges (0.0) — (0.0) (0.0) (0.1) (0.0) Amortization of cloud-based software implementation costs 0.4 0.4 0.4 0.4 0.4 0.4 Adjusted EBITDA (Non-GAAP) $66.0 $51.1 $48.8 $40.2 $34.0 $34.6 % Margin 15.2% 12.7% 12.8% 11.1% 9.8% 10.4% Subtotals in the schedule above may not foot or cross-foot due to rounding. Amounts are unaudited. Non-GAAP Financial Metrics
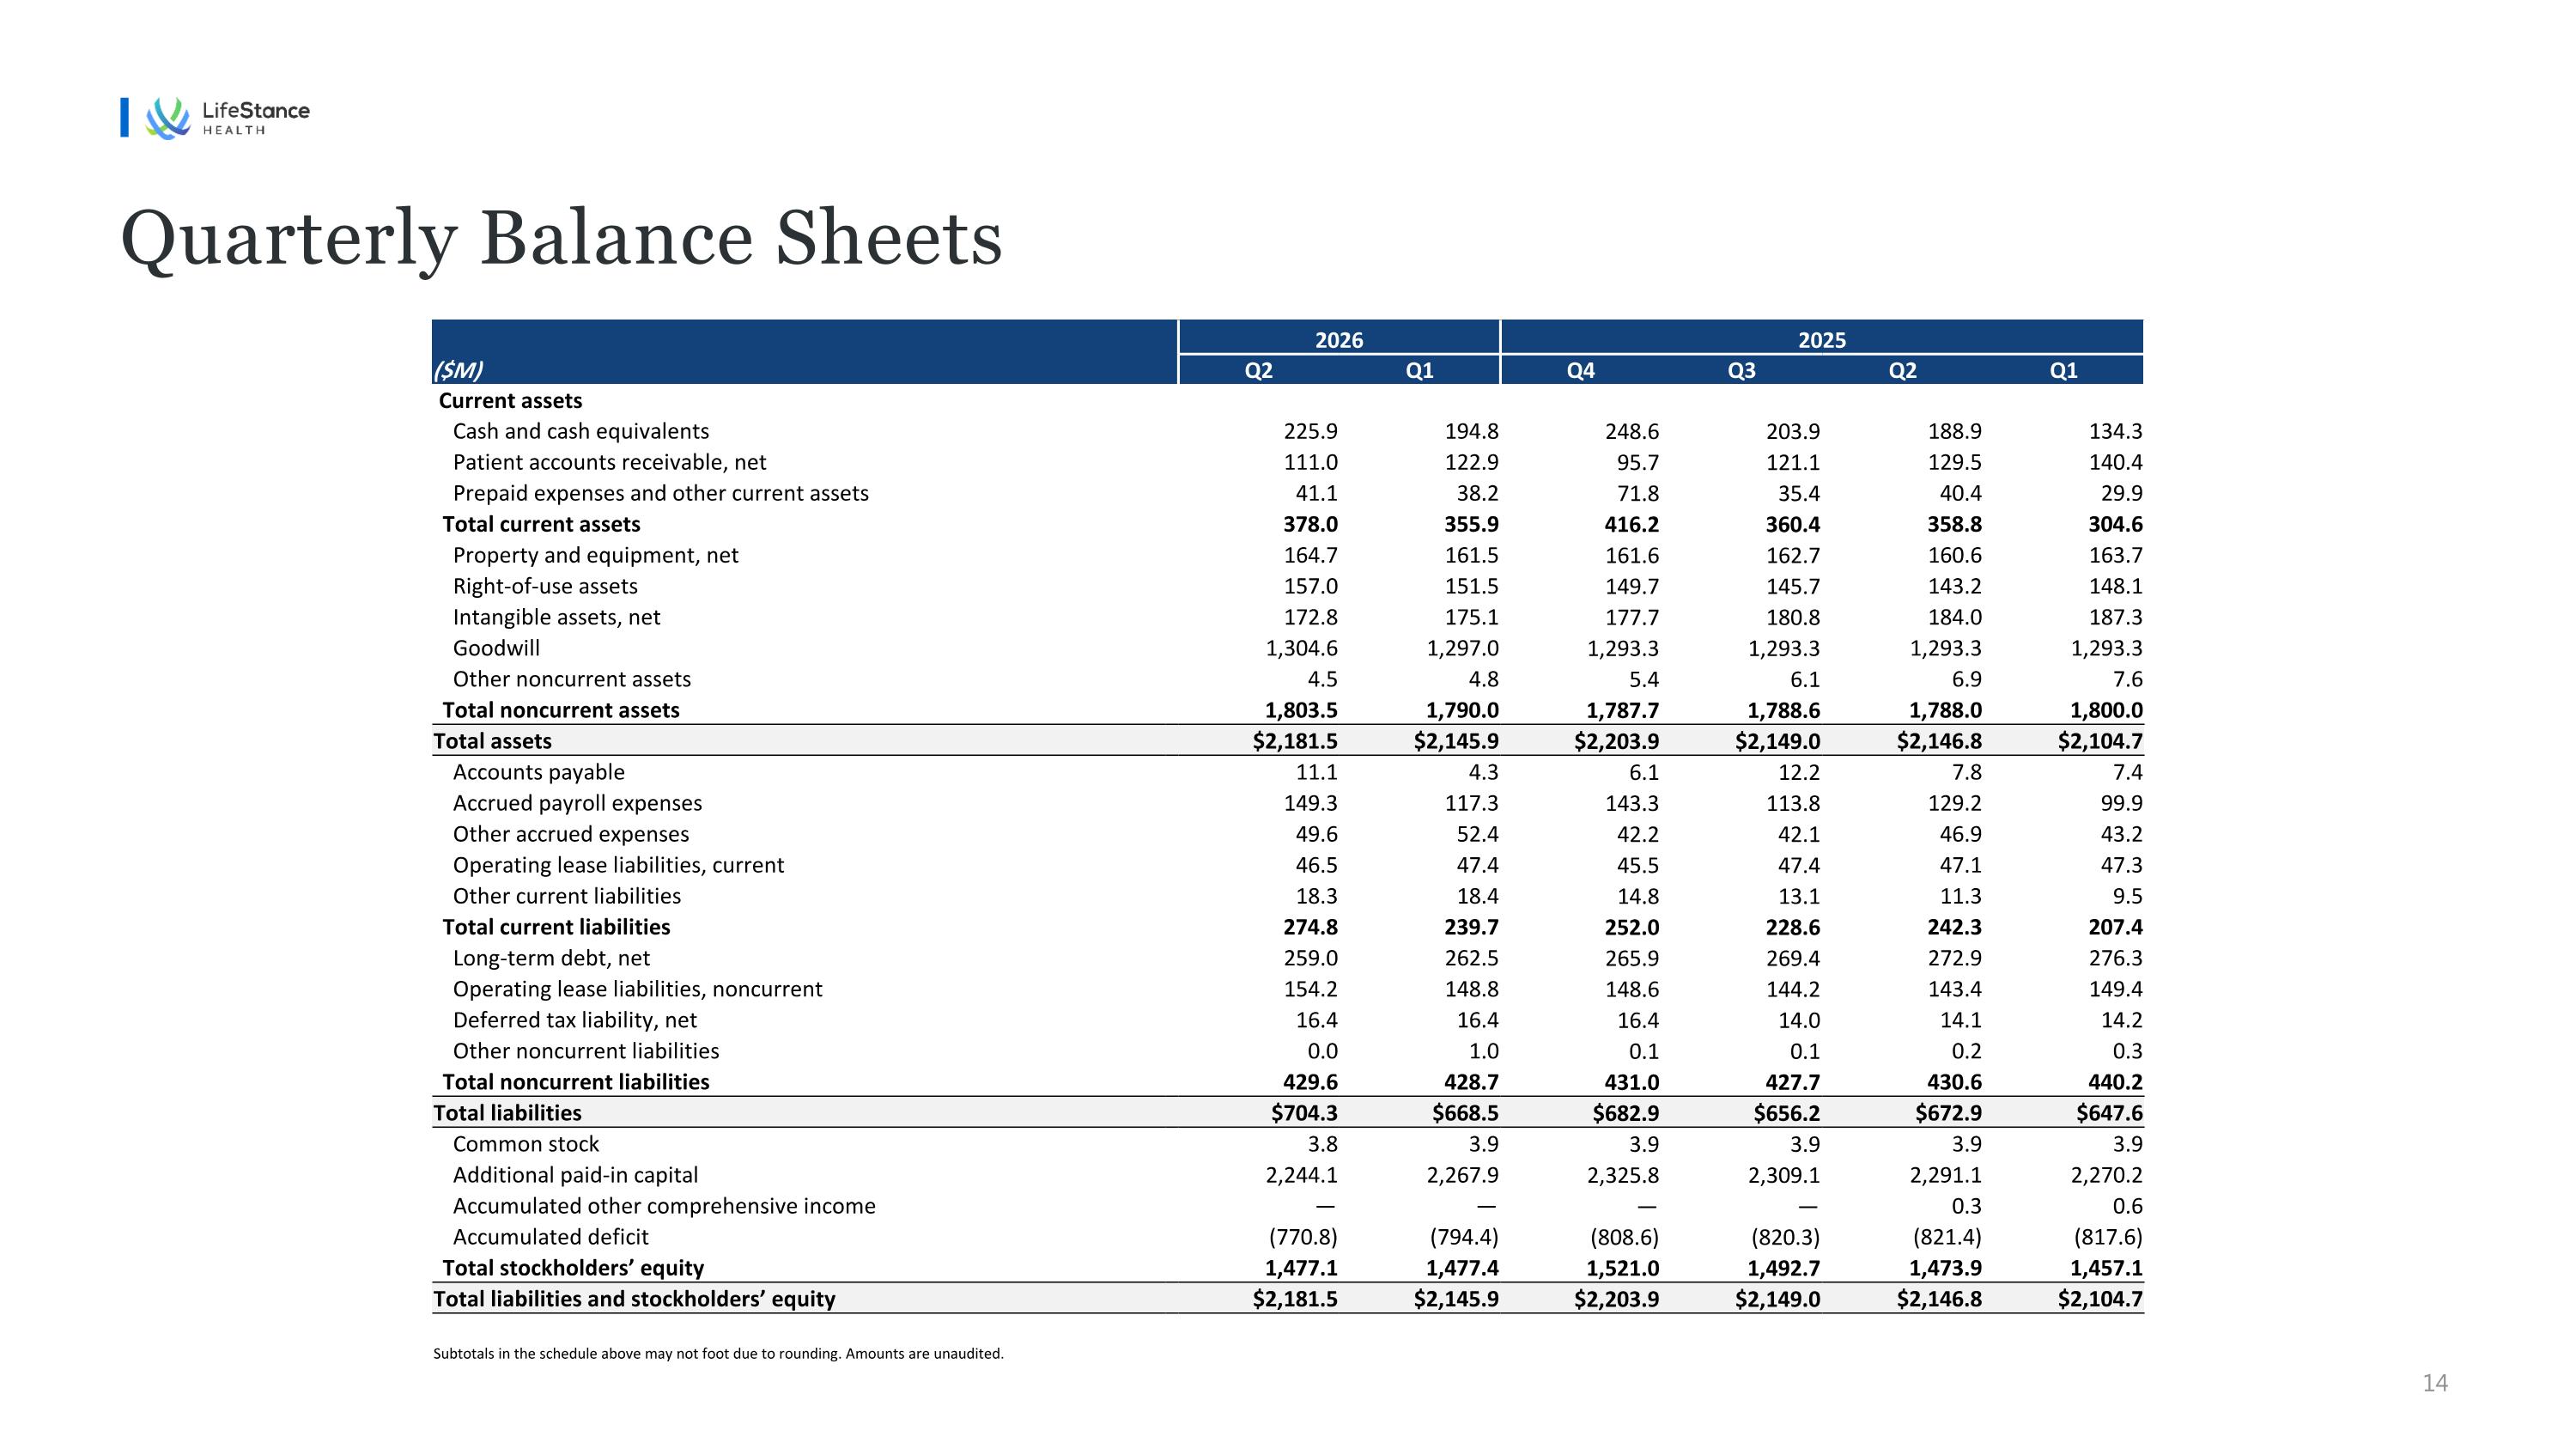
2026 2025 ($M) Q2 Q1 Q4 Q3 Q2 Q1 Current assets Cash and cash equivalents 225.9 194.8 248.6 203.9 188.9 134.3 Patient accounts receivable, net 111.0 122.9 95.7 121.1 129.5 140.4 Prepaid expenses and other current assets 41.1 38.2 71.8 35.4 40.4 29.9 Total current assets 378.0 355.9 416.2 360.4 358.8 304.6 Property and equipment, net 164.7 161.5 161.6 162.7 160.6 163.7 Right-of-use assets 157.0 151.5 149.7 145.7 143.2 148.1 Intangible assets, net 172.8 175.1 177.7 180.8 184.0 187.3 Goodwill 1,304.6 1,297.0 1,293.3 1,293.3 1,293.3 1,293.3 Other noncurrent assets 4.5 4.8 5.4 6.1 6.9 7.6 Total noncurrent assets 1,803.5 1,790.0 1,787.7 1,788.6 1,788.0 1,800.0 Total assets $2,181.5 $2,145.9 $2,203.9 $2,149.0 $2,146.8 $2,104.7 Accounts payable 11.1 4.3 6.1 12.2 7.8 7.4 Accrued payroll expenses 149.3 117.3 143.3 113.8 129.2 99.9 Other accrued expenses 49.6 52.4 42.2 42.1 46.9 43.2 Operating lease liabilities, current 46.5 47.4 45.5 47.4 47.1 47.3 Other current liabilities 18.3 18.4 14.8 13.1 11.3 9.5 Total current liabilities 274.8 239.7 252.0 228.6 242.3 207.4 Long-term debt, net 259.0 262.5 265.9 269.4 272.9 276.3 Operating lease liabilities, noncurrent 154.2 148.8 148.6 144.2 143.4 149.4 Deferred tax liability, net 16.4 16.4 16.4 14.0 14.1 14.2 Other noncurrent liabilities 0.0 1.0 0.1 0.1 0.2 0.3 Total noncurrent liabilities 429.6 428.7 431.0 427.7 430.6 440.2 Total liabilities $704.3 $668.5 $682.9 $656.2 $672.9 $647.6 Common stock 3.8 3.9 3.9 3.9 3.9 3.9 Additional paid-in capital 2,244.1 2,267.9 2,325.8 2,309.1 2,291.1 2,270.2 Accumulated other comprehensive income — — — — 0.3 0.6 Accumulated deficit (770.8) (794.4) (808.6) (820.3) (821.4) (817.6) Total stockholders’ equity 1,477.1 1,477.4 1,521.0 1,492.7 1,473.9 1,457.1 Total liabilities and stockholders’ equity $2,181.5 $2,145.9 $2,203.9 $2,149.0 $2,146.8 $2,104.7 Subtotals in the schedule above may not foot due to rounding. Amounts are unaudited. Quarterly Balance Sheets
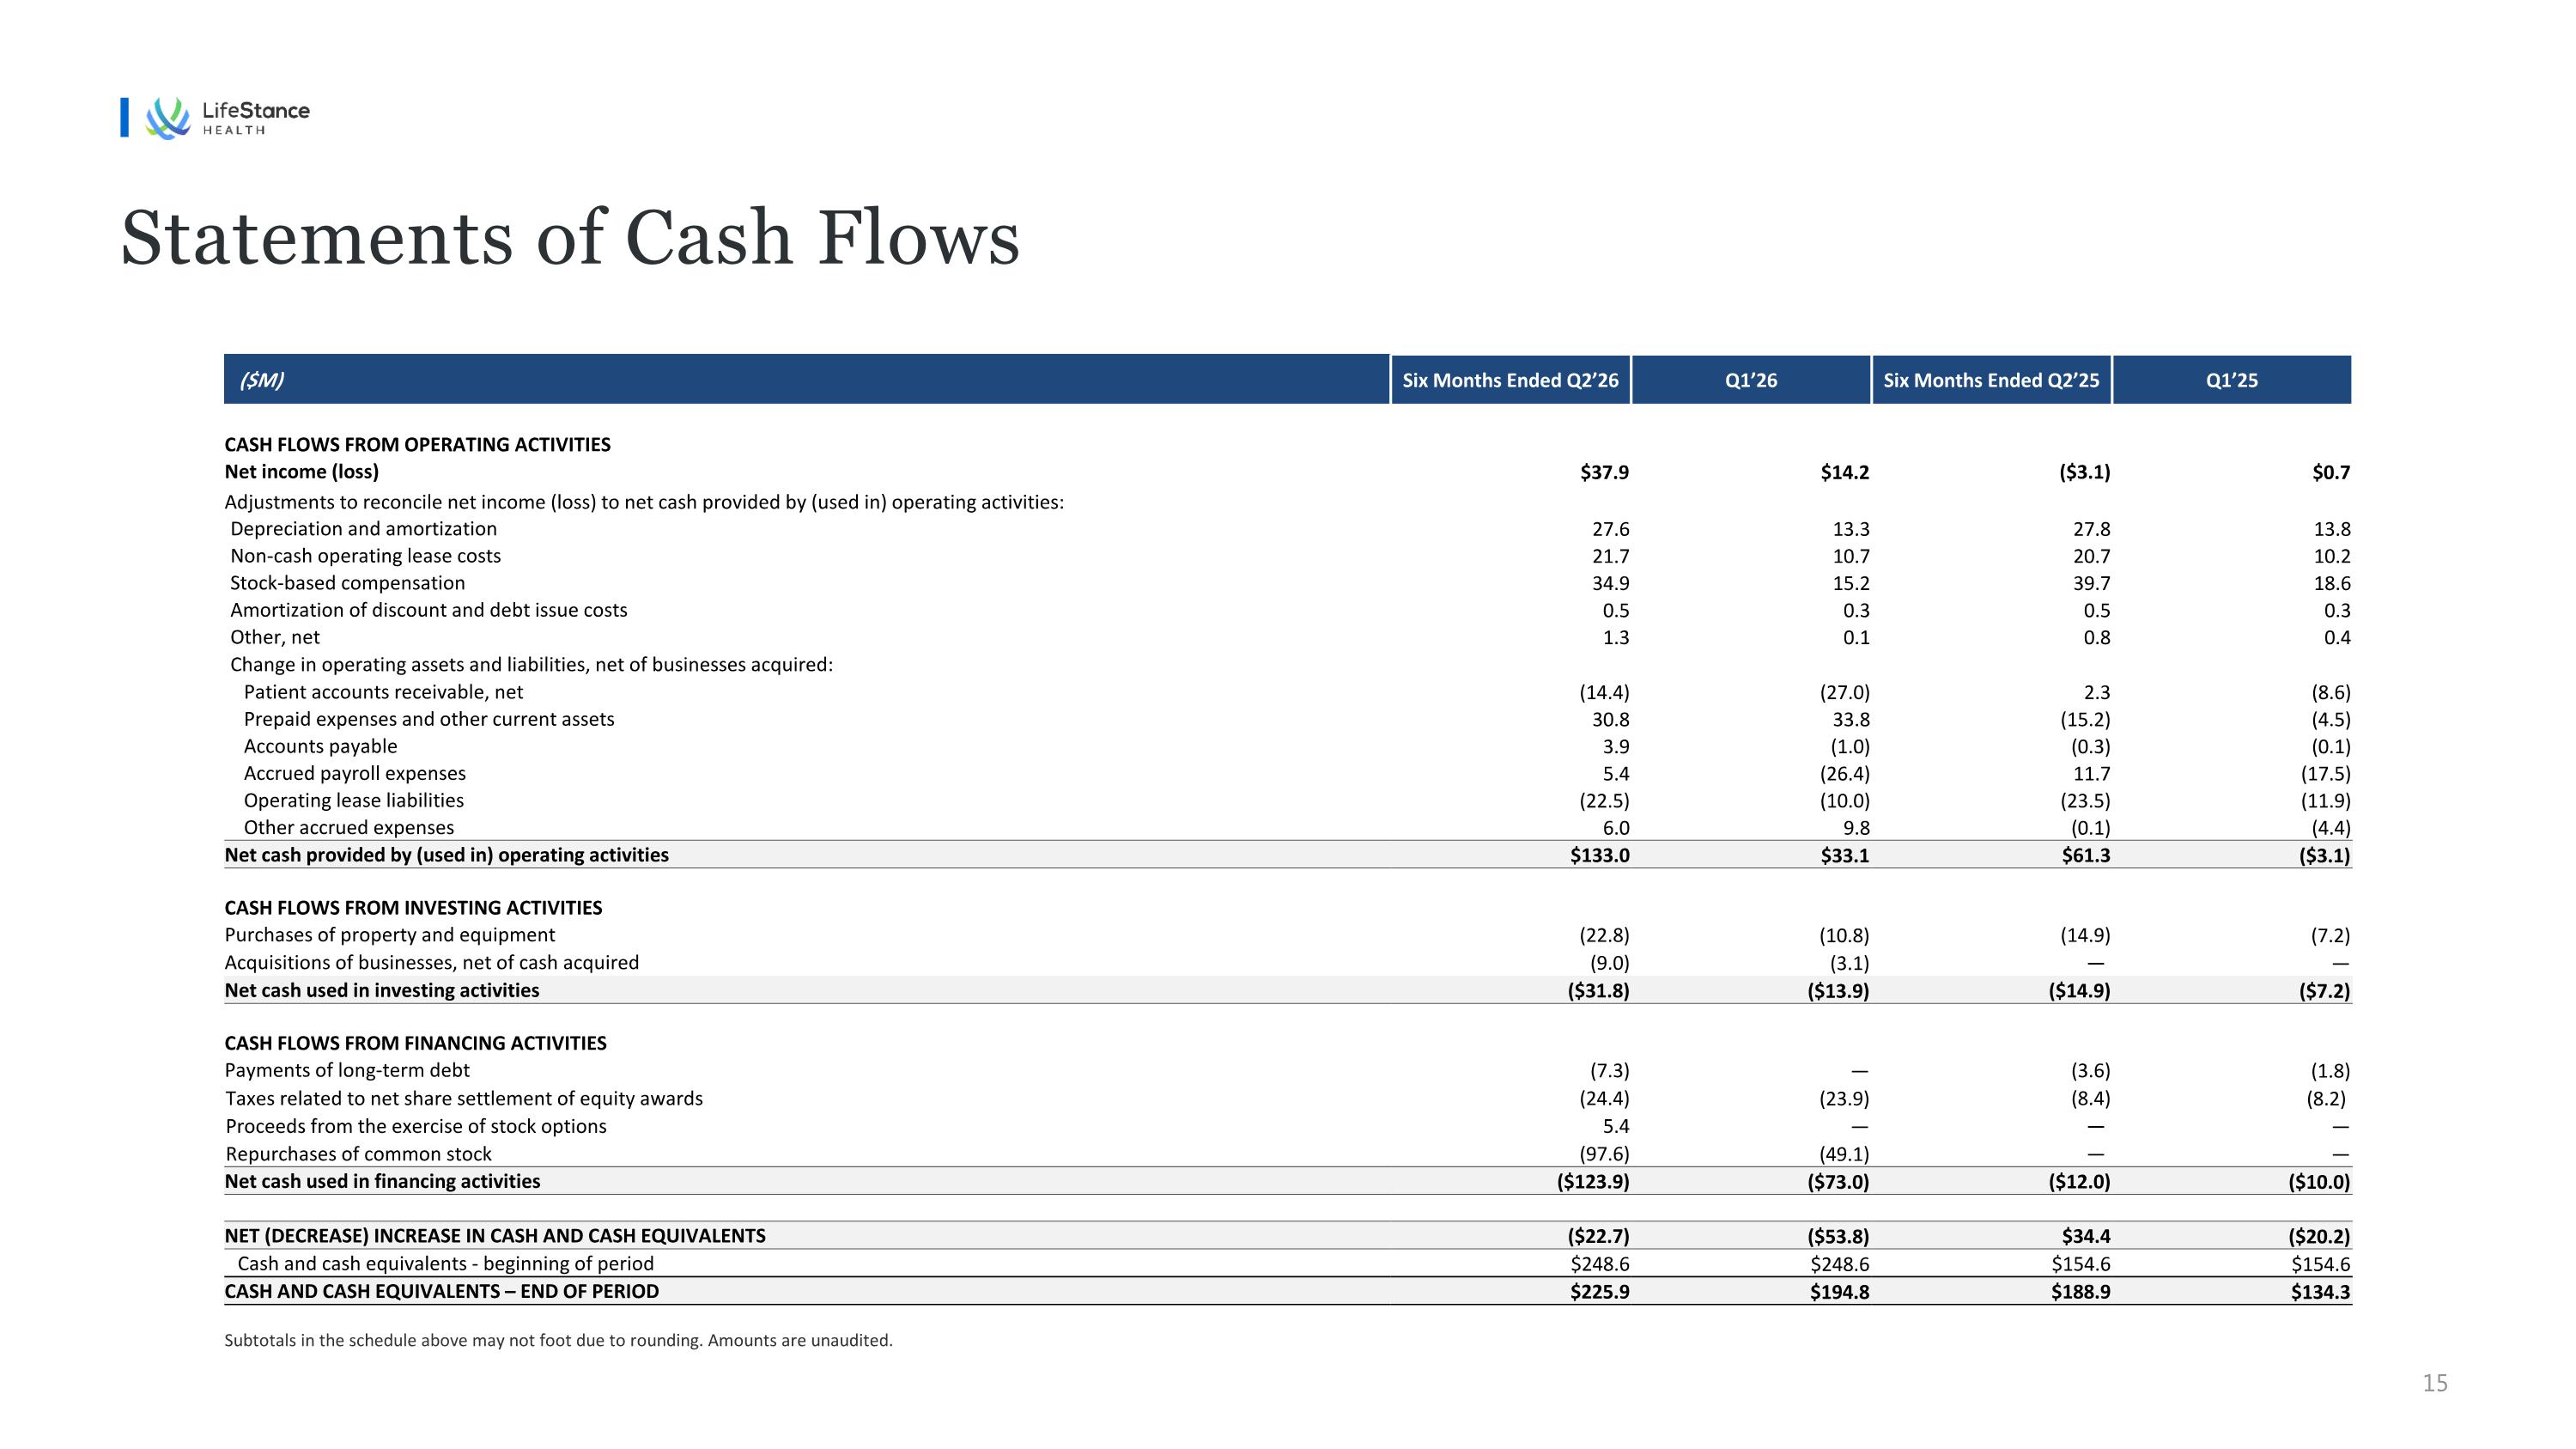
($M) Six Months Ended Q2’26 Q1’26 Six Months Ended Q2’25 Q1’25 CASH FLOWS FROM OPERATING ACTIVITIES Net income (loss) $37.9 $14.2 ($3.1) $0.7 Adjustments to reconcile net income (loss) to net cash provided by (used in) operating activities: Depreciation and amortization 27.6 13.3 27.8 13.8 Non-cash operating lease costs 21.7 10.7 20.7 10.2 Stock-based compensation 34.9 15.2 39.7 18.6 Amortization of discount and debt issue costs 0.5 0.3 0.5 0.3 Other, net 1.3 0.1 0.8 0.4 Change in operating assets and liabilities, net of businesses acquired: Patient accounts receivable, net (14.4) (27.0) 2.3 (8.6) Prepaid expenses and other current assets 30.8 33.8 (15.2) (4.5) Accounts payable 3.9 (1.0) (0.3) (0.1) Accrued payroll expenses 5.4 (26.4) 11.7 (17.5) Operating lease liabilities (22.5) (10.0) (23.5) (11.9) Other accrued expenses 6.0 9.8 (0.1) (4.4) Net cash provided by (used in) operating activities $133.0 $33.1 $61.3 ($3.1) CASH FLOWS FROM INVESTING ACTIVITIES Purchases of property and equipment (22.8) (10.8) (14.9) (7.2) Acquisitions of businesses, net of cash acquired (9.0) (3.1) — — Net cash used in investing activities ($31.8) ($13.9) ($14.9) ($7.2) CASH FLOWS FROM FINANCING ACTIVITIES Payments of long-term debt (7.3) — (3.6) (1.8) Taxes related to net share settlement of equity awards (24.4) (23.9) (8.4) (8.2) Proceeds from the exercise of stock options 5.4 — — — Repurchases of common stock (97.6) (49.1) — — Net cash used in financing activities ($123.9) ($73.0) ($12.0) ($10.0) NET (DECREASE) INCREASE IN CASH AND CASH EQUIVALENTS ($22.7) ($53.8) $34.4 ($20.2) Cash and cash equivalents - beginning of period $248.6 $248.6 $154.6 $154.6 CASH AND CASH EQUIVALENTS – END OF PERIOD $225.9 $194.8 $188.9 $134.3 Subtotals in the schedule above may not foot due to rounding. Amounts are unaudited. Statements of Cash Flows
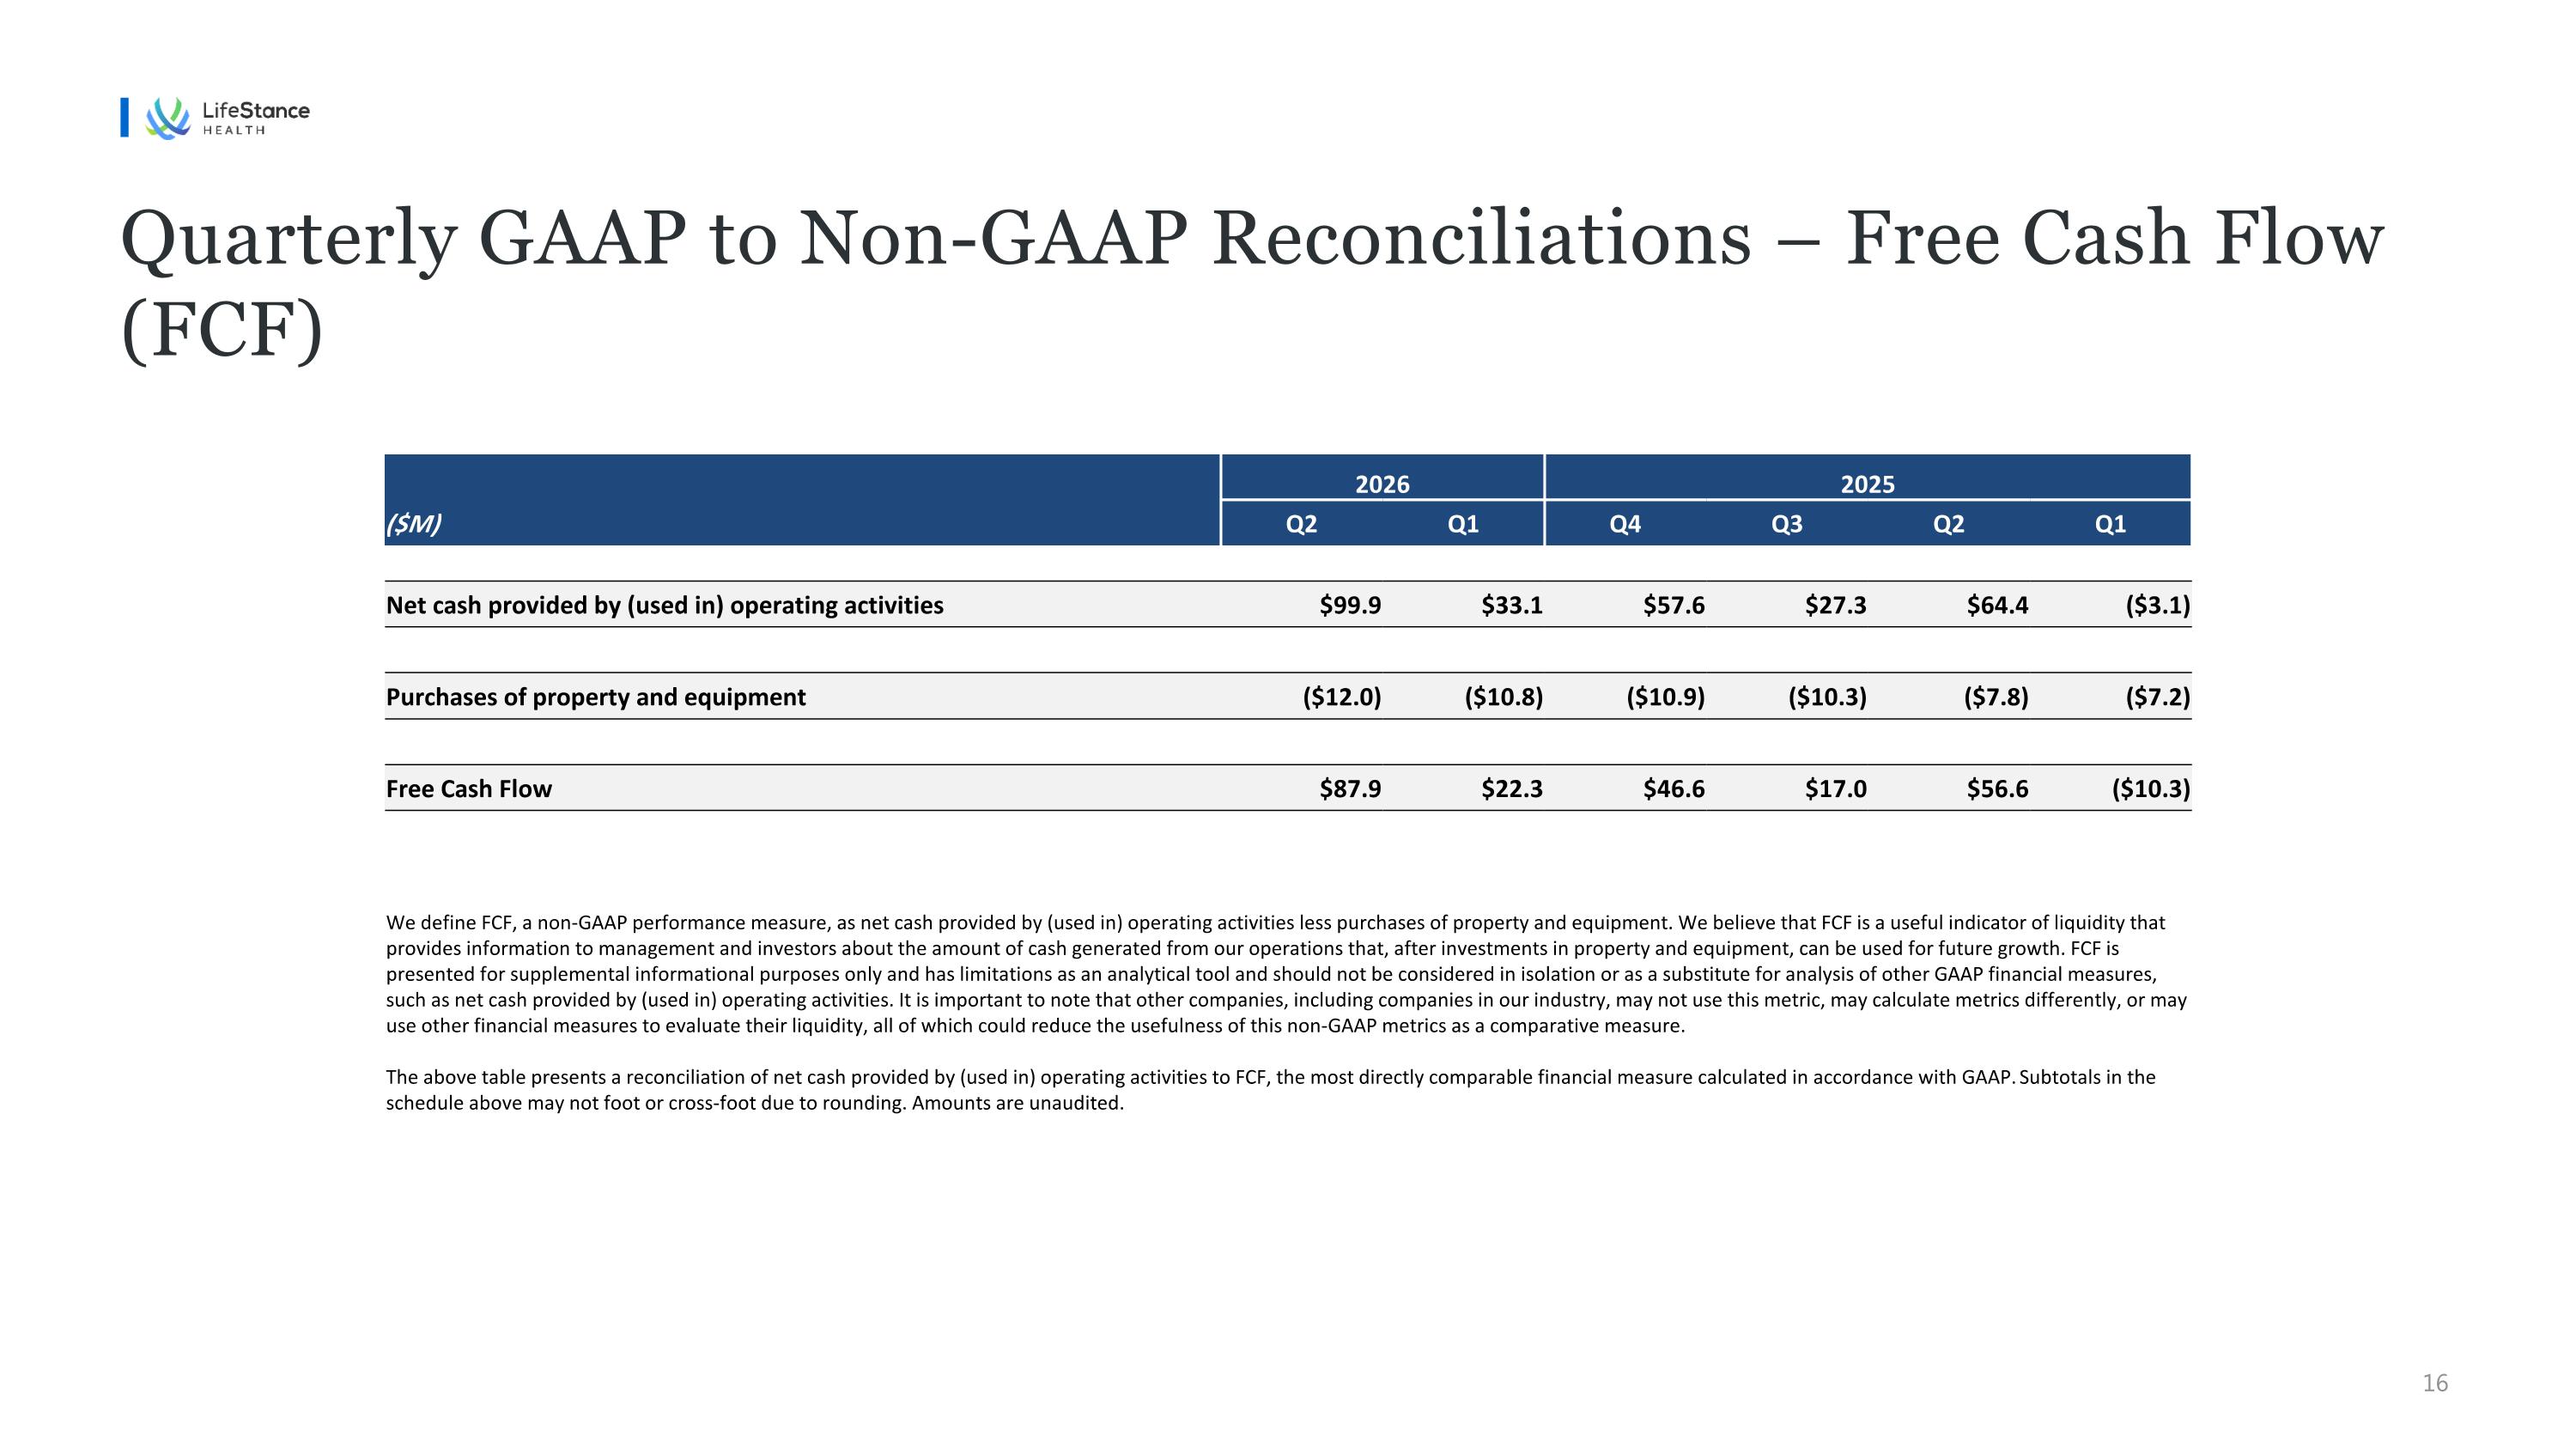
2026 2025 ($M) Q2 Q1 Q4 Q3 Q2 Q1 Net cash provided by (used in) operating activities $99.9 $33.1 $57.6 $27.3 $64.4 ($3.1) Purchases of property and equipment ($12.0) ($10.8) ($10.9) ($10.3) ($7.8) ($7.2) Free Cash Flow $87.9 $22.3 $46.6 $17.0 $56.6 ($10.3) We define FCF, a non-GAAP performance measure, as net cash provided by (used in) operating activities less purchases of property and equipment. We believe that FCF is a useful indicator of liquidity that provides information to management and investors about the amount of cash generated from our operations that, after investments in property and equipment, can be used for future growth. FCF is presented for supplemental informational purposes only and has limitations as an analytical tool and should not be considered in isolation or as a substitute for analysis of other GAAP financial measures, such as net cash provided by (used in) operating activities. It is important to note that other companies, including companies in our industry, may not use this metric, may calculate metrics differently, or may use other financial measures to evaluate their liquidity, all of which could reduce the usefulness of this non-GAAP metrics as a comparative measure. The above table presents a reconciliation of net cash provided by (used in) operating activities to FCF, the most directly comparable financial measure calculated in accordance with GAAP. Subtotals in the schedule above may not foot or cross-foot due to rounding. Amounts are unaudited. Quarterly GAAP to Non-GAAP Reconciliations – Free Cash Flow (FCF)
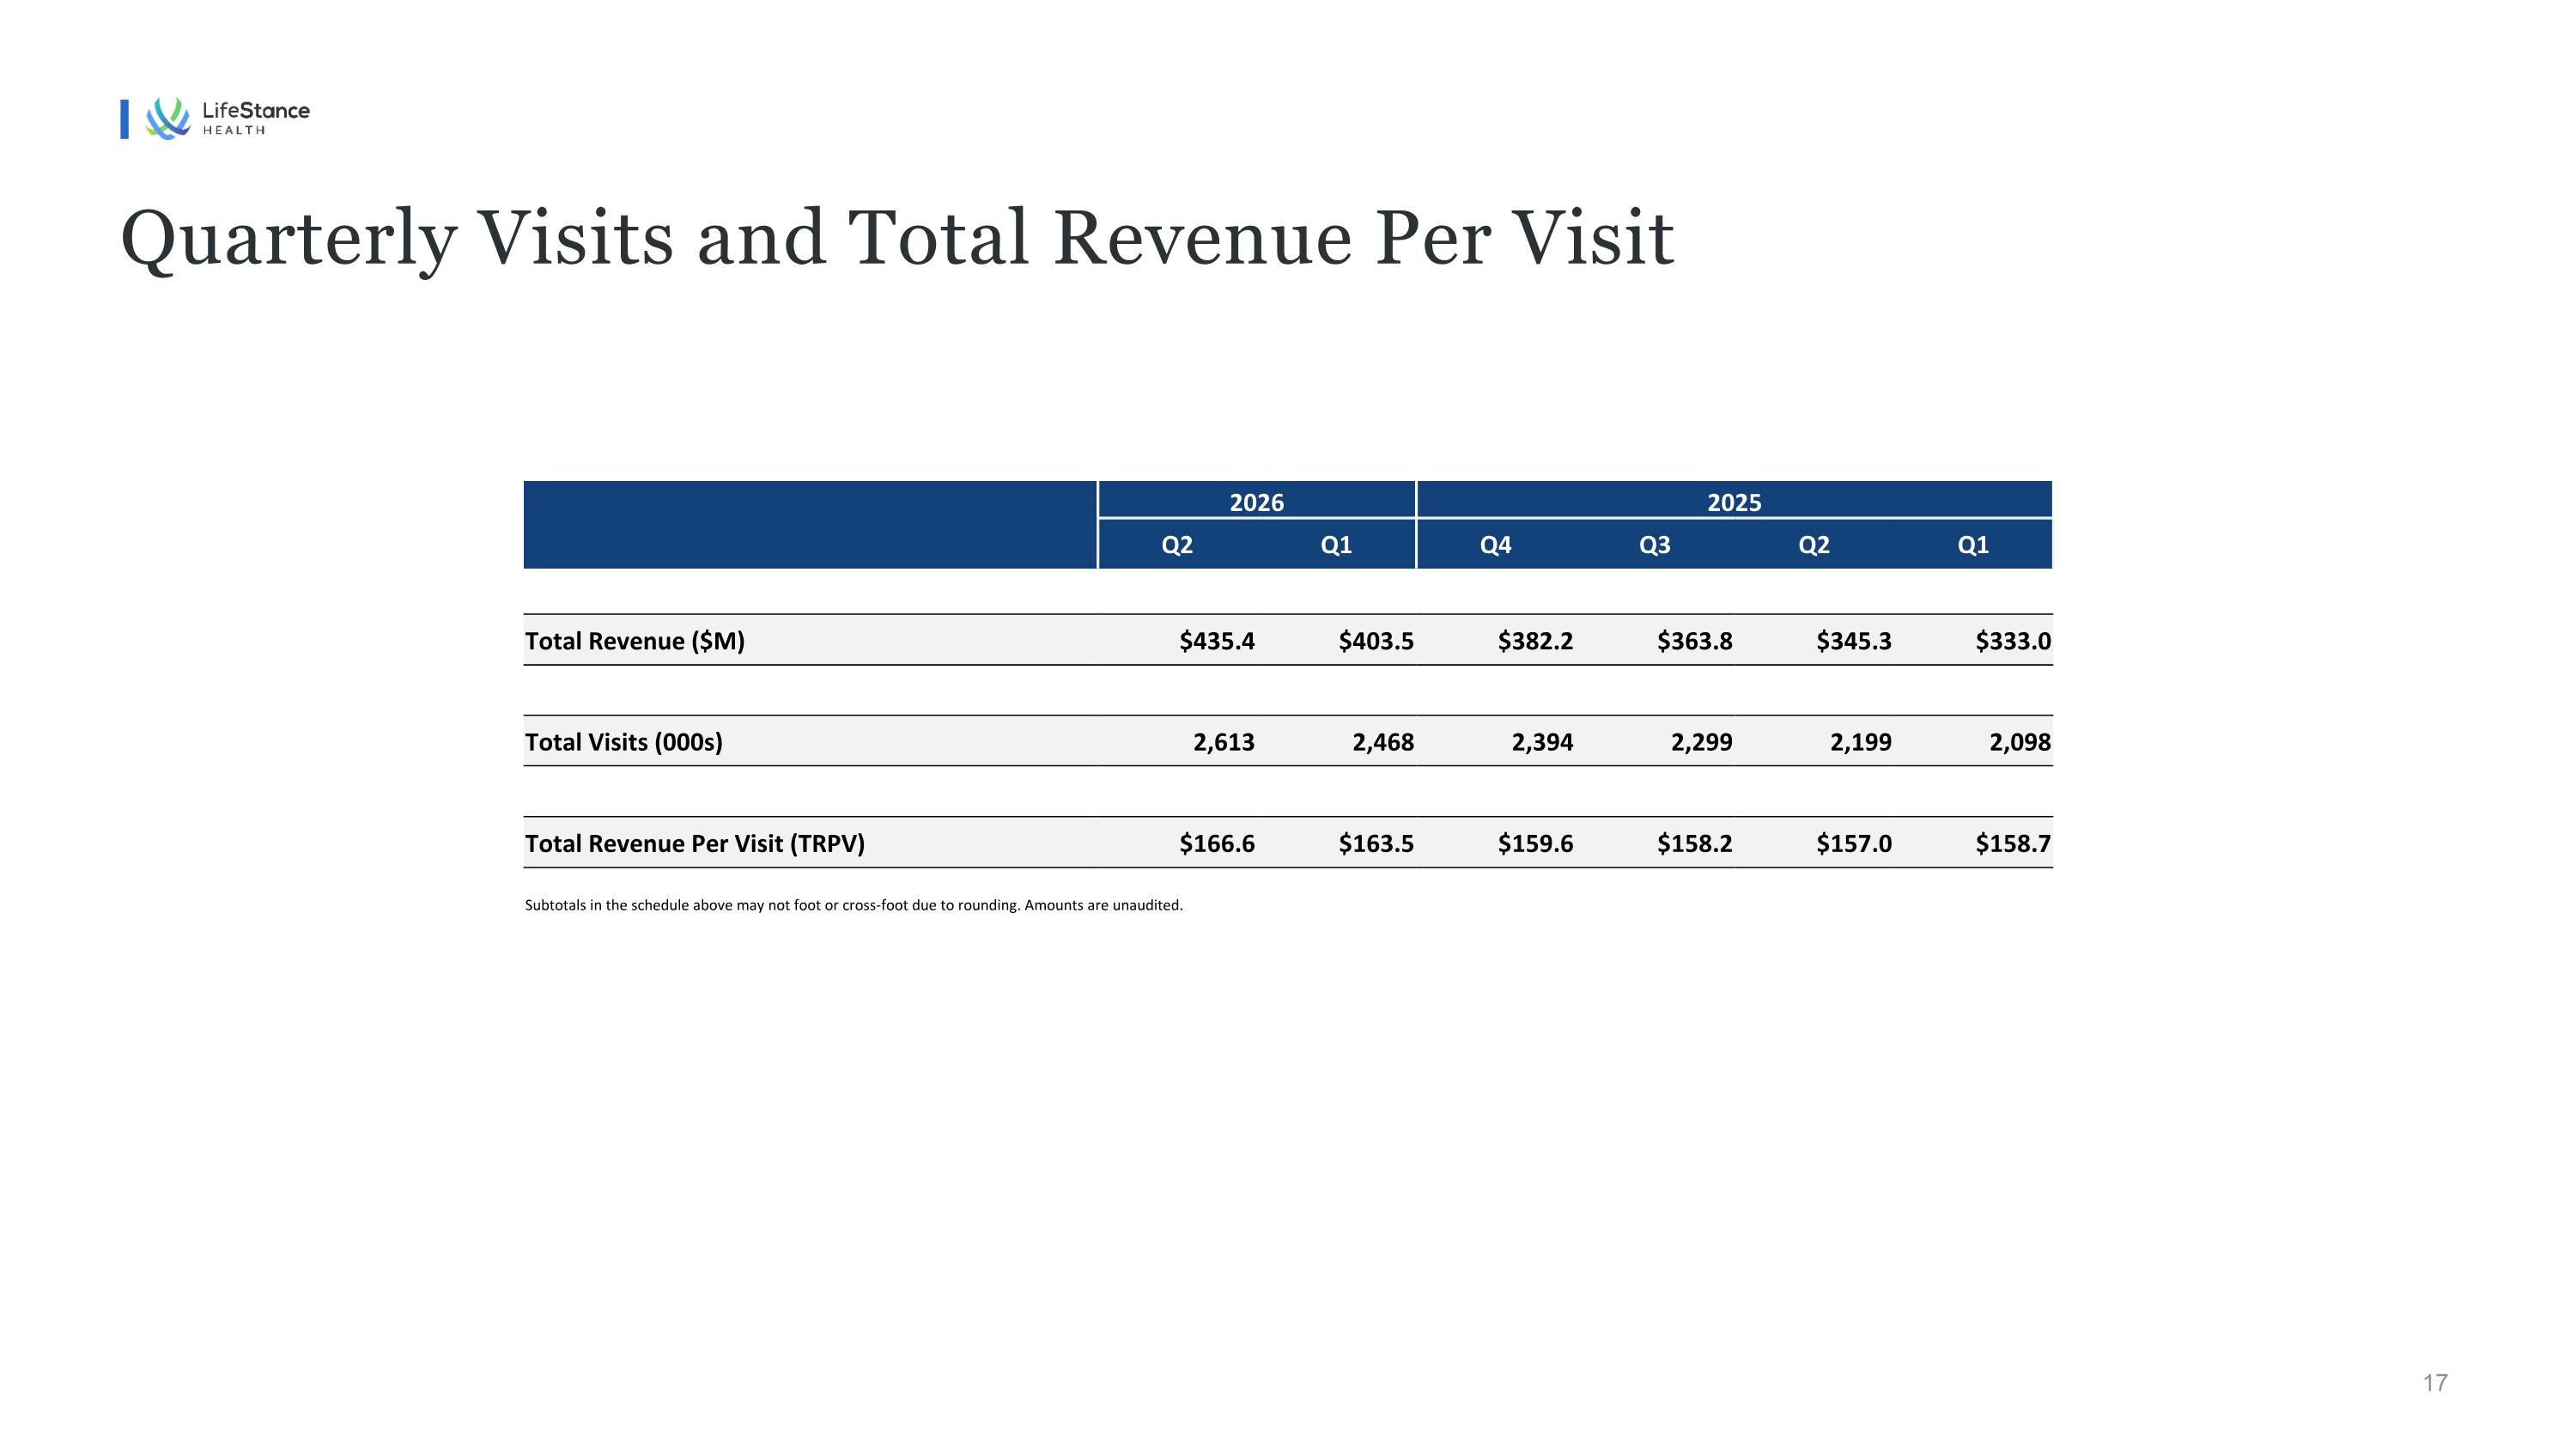
2026 2025 Q2 Q1 Q4 Q3 Q2 Q1 Total Revenue ($M) $435.4 $403.5 $382.2 $363.8 $345.3 $333.0 Total Visits (000s) 2,613 2,468 2,394 2,299 2,199 2,098 Total Revenue Per Visit (TRPV) $166.6 $163.5 $159.6 $158.2 $157.0 $158.7 Subtotals in the schedule above may not foot or cross-foot due to rounding. Amounts are unaudited. Quarterly Visits and Total Revenue Per Visit