
Second Quarter 2026 Earnings Supplement August 6, 2026
2 FORWARD-LOOKING STATEMENTS This communication contains certain “forward-looking statements” within the meaning of federal securities laws. Forward-looking statements may be identified by words such as “years ahead,” “look forward” and similar expressions. Forward-looking statements are not statements of historical fact and reflect Core Natural Resources, Inc.’s (“Core” or “the Company”) current views about future events. No assurances can be given that the forward-looking statements contained in this communication will occur as projected, and actual results may differ materially from those projected. Forward-looking statements are based on current expectations, estimates and assumptions that involve a number of risks and uncertainties that could cause actual results to differ materially from those projected. These risks and uncertainties include, without limitation, uncertainties regarding the ability of Core to mine, upgrade, process, and extract rare earth elements and critical minerals from its existing mines, including uncertainties regarding the financial impacts of such activities; risks related to the prior occurrence of combustion-related activity at Core’s Leer South mine and the risk of future occurrences; the increase in combustion-related gases at Core’s Leer South mine; deterioration in economic conditions or changes in consumption patterns of our customers may decrease demand for our products, impair our ability to collect customer receivables and impair our ability to access capital; volatility and wide fluctuation in coal prices based upon a number of factors beyond our control; an extended decline in the prices we receive for our coal; significant downtime of our equipment or inability to obtain equipment, parts or raw materials; decreases in the availability of, or increases in the price of, commodities or capital equipment used in our coal mining operations; our reliance on major customers, our ability to collect payment from our customers and uncertainty in connection with our customer contracts; our inability to acquire additional coal reserves or resources that are economically recoverable; decreases in coal consumption patterns for steel production, electric power generation and industrial applications; the availability and reliability of transportation facilities and other systems that deliver our coal to market and fluctuations in transportation costs; a loss of our competitive position; inflation that could result in higher costs and decreased profitability; foreign currency fluctuations that could adversely affect the competitiveness of our coal abroad; risks related to the fact that a significant portion of our production is sold in international markets (and may grow) and our compliance with export control and anti-corruption laws; coal users switching to other fuels in order to comply with various environmental standards related to coal combustion emissions; the impact of current and future regulations to address climate change, the discharge, disposal and clean-up of hazardous substances and wastes and employee health and safety on our operating costs as well as on the market for coal; the risks inherent in coal operations, including being subject to unexpected disruptions caused by adverse geological conditions, equipment failure, delays in moving longwall equipment, railroad derailments or strikes, security breaches or terroristic acts and other hazards, delays in the completion of significant construction or repair of equipment, fires, explosions, seismic activities, accidents and weather conditions; failure to obtain or renew surety bonds, letters of credit or insurance coverages on acceptable terms; the effects of coordinating our operations with oil and natural gas drillers and distributors operating on our land; our inability to obtain financing for capital expenditures on satisfactory terms; the effects of our securities being excluded from certain investment funds as a result of environmental, social and corporate governance (“ESG”) practices; the effects of global conflicts on commodity prices and supply chains; the effect of new or existing laws, regulations, tariffs, executive orders or other trade measures; our inability to find suitable joint venture partners, acquisition targets or similar investments or integrating the operations of future acquisitions or investments into our operations; obtaining, maintaining and renewing governmental permits and approvals for our coal operations; the effects of asset retirement obligations, employee-related long-term liabilities and certain other liabilities; uncertainties in estimating our economically recoverable coal reserves; defects in our chain of title for our undeveloped reserves or failure to acquire additional property to perfect our title to coal rights; the outcomes of various legal proceedings; the risk of our debt agreements, our debt and changes in interest rates affecting our operating results and cash flows; information theft, data corruption, operational disruption and/or financial loss resulting from a terrorist attack or cyber incident; the potential failure to retain and attract qualified personnel of the Company; failure to maintain effective internal control over financial reporting; uncertainty with respect to the Company’s common stock, potential stock price volatility and future dilution; uncertainty regarding the timing and value of any dividends we may declare; uncertainty as to whether we will repurchase shares of our common stock; inability of stockholders to bring legal action against us in any forum other than the state courts of Delaware; the risk that the businesses of the Company and Arch Resources, Inc. will not be integrated successfully after the closing of the merger (the “Merger”); the risk that the anticipated benefits of the Merger may not be realized or may take longer to realize than expected; and other unforeseen factors. All such factors are difficult to predict, are beyond Core’s control, and are subject to additional risks and uncertainties, including those detailed in Core’s annual report on Form 10-K for the year ended December 31, 2025, quarterly reports on Form 10-Q, and current reports on Form 8-K that are available on Core’s website at www.corenaturalresources.com and on the SEC’s website at http://www.sec.gov. Forward-looking statements are based on the estimates and opinions of management at the time the statements are made. Core does not undertake any obligation to publicly update any forward-looking statement, whether as a result of new information, future events or otherwise, except as required by law. Readers are cautioned not to place undue reliance on these forward-looking statements that speak only as of the date hereof.
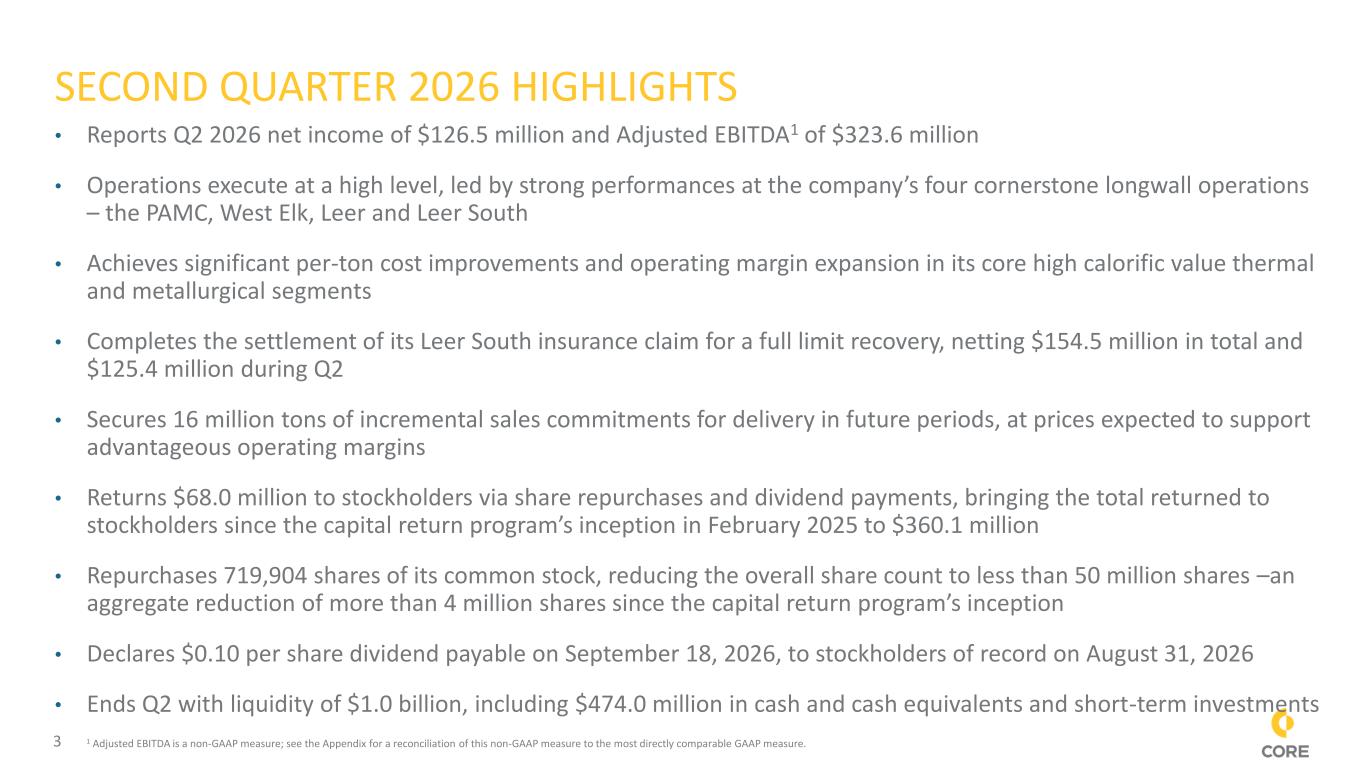
3 SECOND QUARTER 2026 HIGHLIGHTS • Reports Q2 2026 net income of $126.5 million and Adjusted EBITDA1 of $323.6 million • Operations execute at a high level, led by strong performances at the company’s four cornerstone longwall operations – the PAMC, West Elk, Leer and Leer South • Achieves significant per-ton cost improvements and operating margin expansion in its core high calorific value thermal and metallurgical segments • Completes the settlement of its Leer South insurance claim for a full limit recovery, netting $154.5 million in total and $125.4 million during Q2 • Secures 16 million tons of incremental sales commitments for delivery in future periods, at prices expected to support advantageous operating margins • Returns $68.0 million to stockholders via share repurchases and dividend payments, bringing the total returned to stockholders since the capital return program’s inception in February 2025 to $360.1 million • Repurchases 719,904 shares of its common stock, reducing the overall share count to less than 50 million shares –an aggregate reduction of more than 4 million shares since the capital return program’s inception • Declares $0.10 per share dividend payable on September 18, 2026, to stockholders of record on August 31, 2026 • Ends Q2 with liquidity of $1.0 billion, including $474.0 million in cash and cash equivalents and short-term investments 1 Adjusted EBITDA is a non-GAAP measure; see the Appendix for a reconciliation of this non-GAAP measure to the most directly comparable GAAP measure.
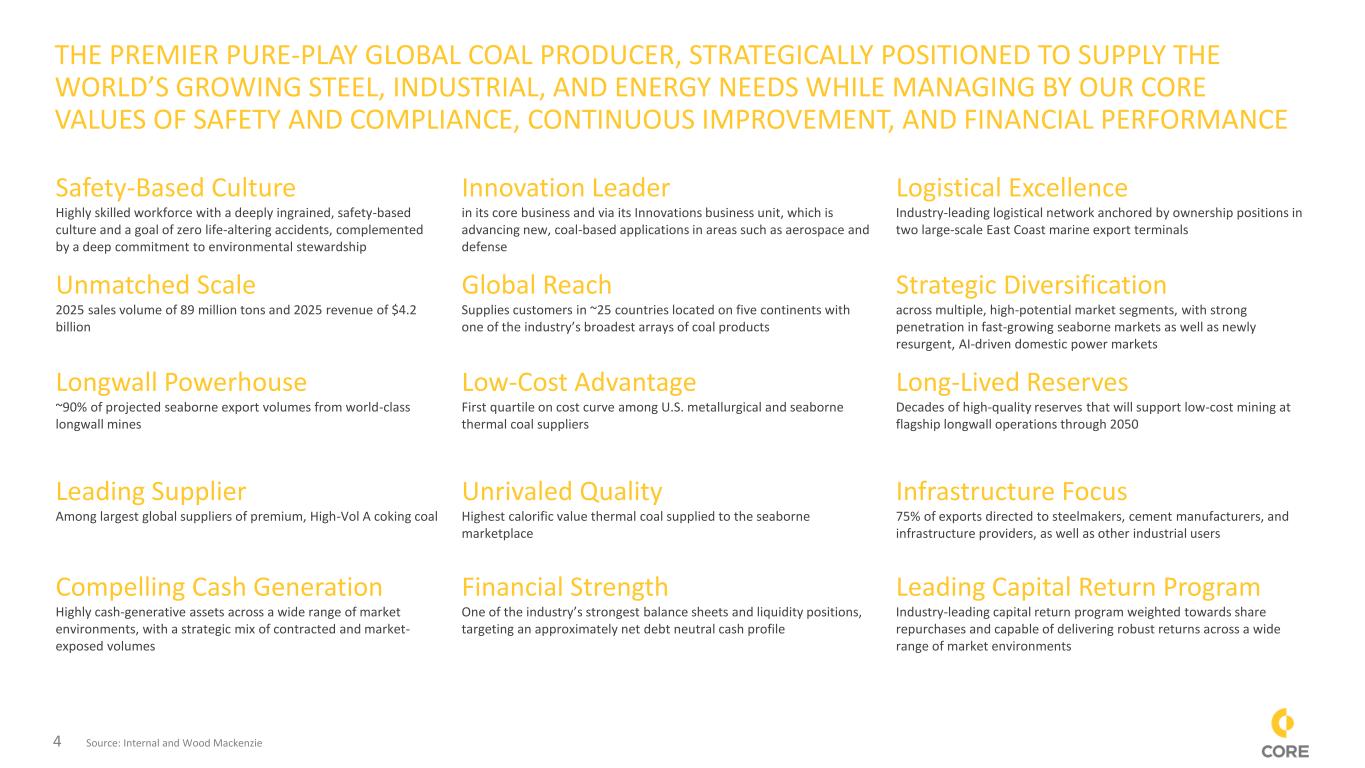
4 THE PREMIER PURE-PLAY GLOBAL COAL PRODUCER, STRATEGICALLY POSITIONED TO SUPPLY THE WORLD’S GROWING STEEL, INDUSTRIAL, AND ENERGY NEEDS WHILE MANAGING BY OUR CORE VALUES OF SAFETY AND COMPLIANCE, CONTINUOUS IMPROVEMENT, AND FINANCIAL PERFORMANCE 4 Safety-Based Culture Highly skilled workforce with a deeply ingrained, safety-based culture and a goal of zero life-altering accidents, complemented by a deep commitment to environmental stewardship Innovation Leader in its core business and via its Innovations business unit, which is advancing new, coal-based applications in areas such as aerospace and defense Logistical Excellence Industry-leading logistical network anchored by ownership positions in two large-scale East Coast marine export terminals Unmatched Scale 2025 sales volume of 89 million tons and 2025 revenue of $4.2 billion Global Reach Supplies customers in ~25 countries located on five continents with one of the industry’s broadest arrays of coal products Strategic Diversification across multiple, high-potential market segments, with strong penetration in fast-growing seaborne markets as well as newly resurgent, AI-driven domestic power markets Longwall Powerhouse ~90% of projected seaborne export volumes from world-class longwall mines Low-Cost Advantage First quartile on cost curve among U.S. metallurgical and seaborne thermal coal suppliers Long-Lived Reserves Decades of high-quality reserves that will support low-cost mining at flagship longwall operations through 2050 Leading Supplier Among largest global suppliers of premium, High-Vol A coking coal Unrivaled Quality Highest calorific value thermal coal supplied to the seaborne marketplace Infrastructure Focus 75% of exports directed to steelmakers, cement manufacturers, and infrastructure providers, as well as other industrial users Compelling Cash Generation Highly cash-generative assets across a wide range of market environments, with a strategic mix of contracted and market- exposed volumes Financial Strength One of the industry’s strongest balance sheets and liquidity positions, targeting an approximately net debt neutral cash profile Leading Capital Return Program Industry-leading capital return program weighted towards share repurchases and capable of delivering robust returns across a wide range of market environments Source: Internal and Wood Mackenzie
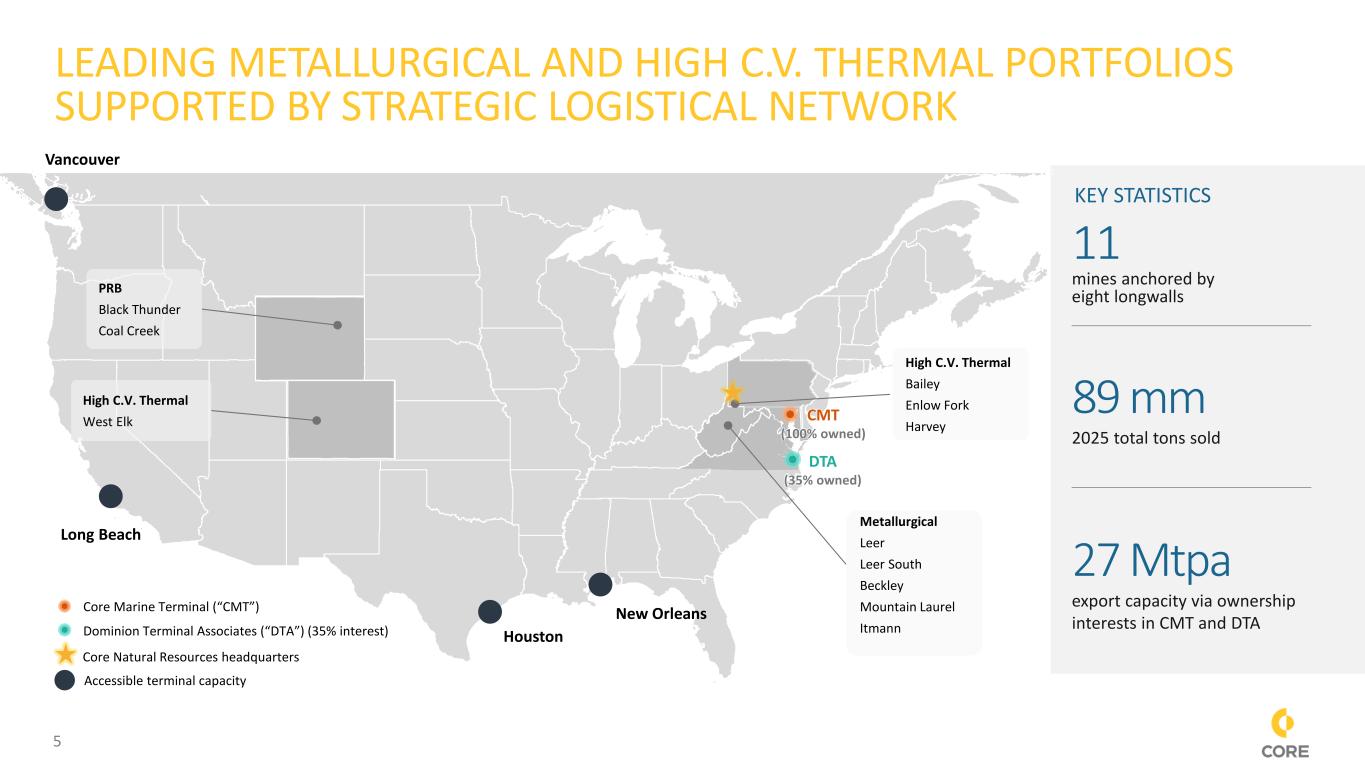
5 11 mines anchored by eight longwalls 89 mm 2025 total tons sold 27 Mtpa export capacity via ownership interests in CMT and DTA KEY STATISTICS Core Marine Terminal (“CMT”) Accessible terminal capacity Core Natural Resources headquarters Vancouver Long Beach Houston New Orleans Dominion Terminal Associates (“DTA”) (35% interest) CMT (100% owned) High C.V. Thermal Bailey Enlow Fork Harvey PRB Black Thunder Coal Creek DTA (35% owned) LEADING METALLURGICAL AND HIGH C.V. THERMAL PORTFOLIOS SUPPORTED BY STRATEGIC LOGISTICAL NETWORK Metallurgical Leer Leer South Beckley Mountain Laurel Itmann High C.V. Thermal West Elk
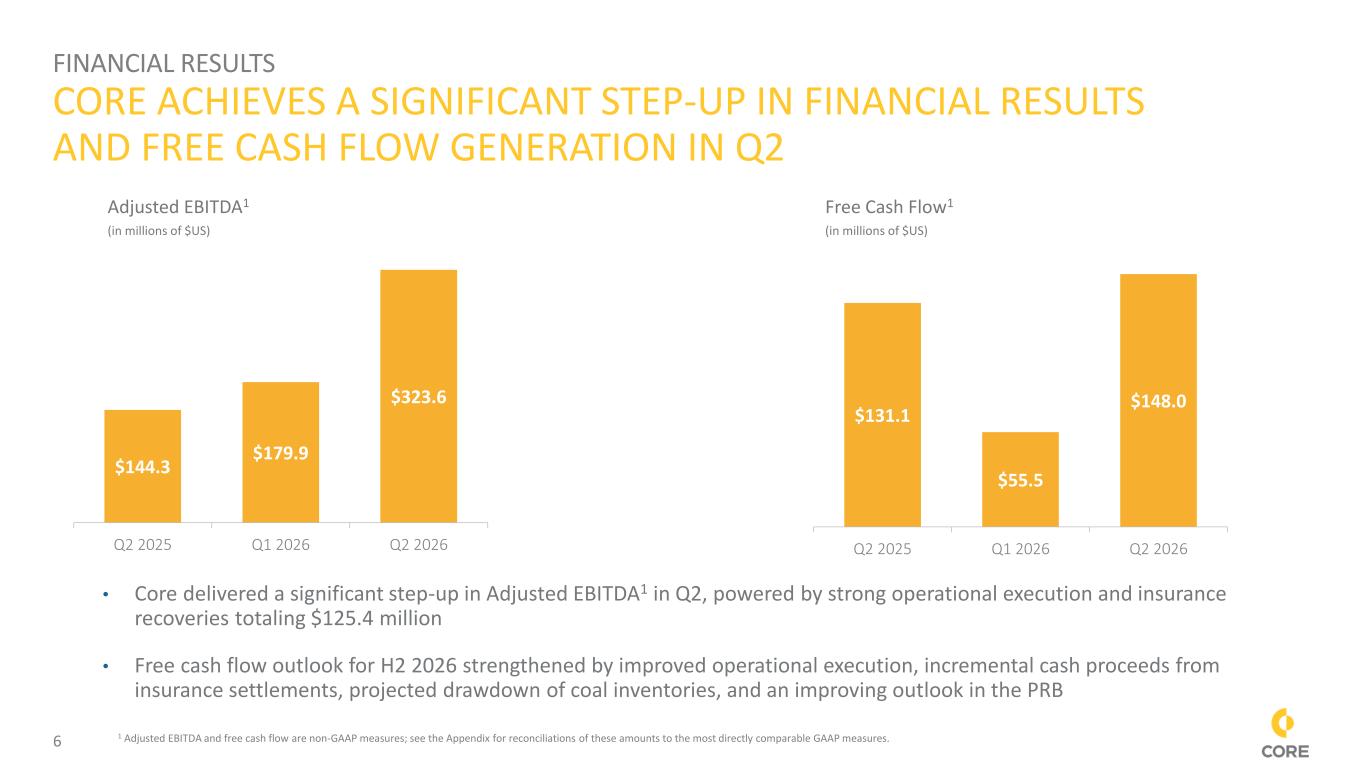
6 FINANCIAL RESULTS CORE ACHIEVES A SIGNIFICANT STEP-UP IN FINANCIAL RESULTS AND FREE CASH FLOW GENERATION IN Q2 $144.3 $179.9 $323.6 Q2 2025 Q1 2026 Q2 2026 Adjusted EBITDA1 (in millions of $US) • Core delivered a significant step-up in Adjusted EBITDA1 in Q2, powered by strong operational execution and insurance recoveries totaling $125.4 million • Free cash flow outlook for H2 2026 strengthened by improved operational execution, incremental cash proceeds from insurance settlements, projected drawdown of coal inventories, and an improving outlook in the PRB $131.1 $55.5 $148.0 Q2 2025 Q1 2026 Q2 2026 Free Cash Flow1 (in millions of $US) 1 Adjusted EBITDA and free cash flow are non-GAAP measures; see the Appendix for reconciliations of these amounts to the most directly comparable GAAP measures.
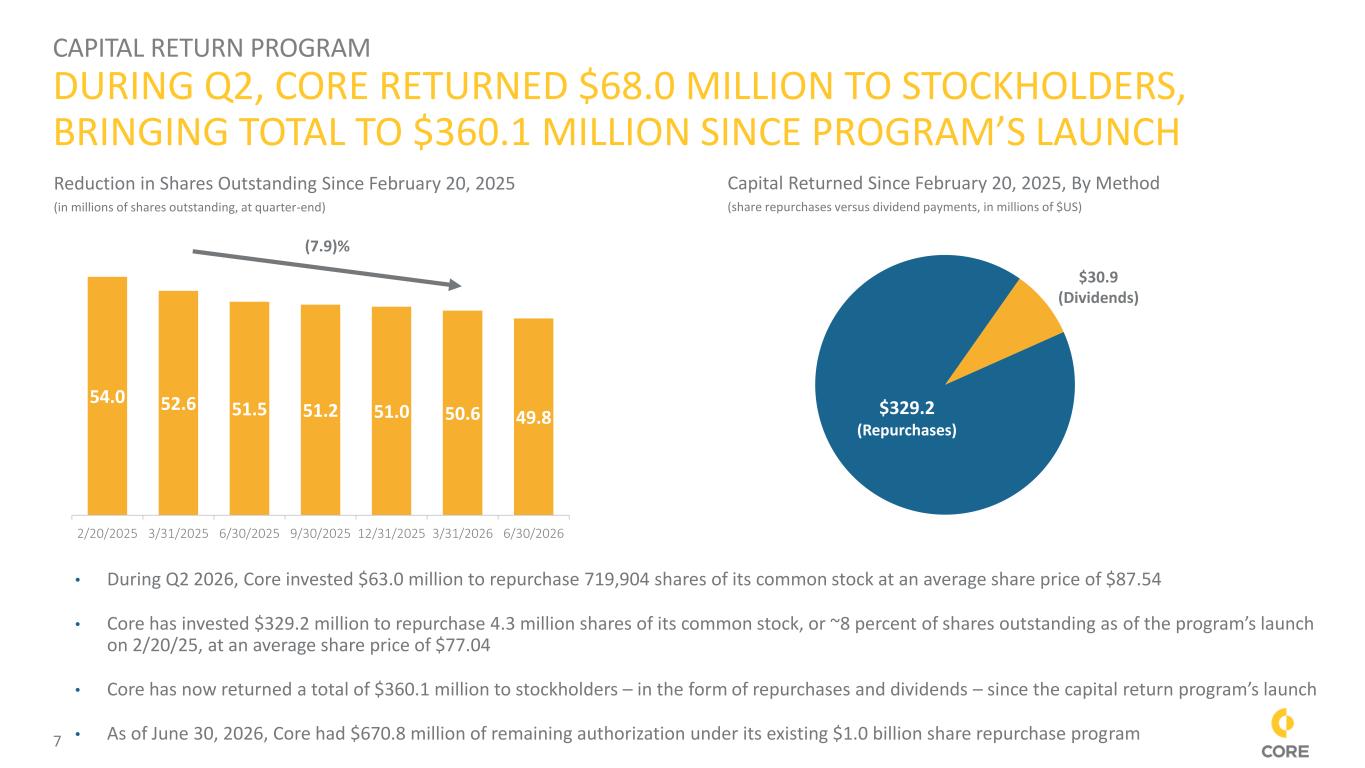
7 CAPITAL RETURN PROGRAM DURING Q2, CORE RETURNED $68.0 MILLION TO STOCKHOLDERS, BRINGING TOTAL TO $360.1 MILLION SINCE PROGRAM’S LAUNCH 54.0 52.6 51.5 51.2 51.0 50.6 49.8 2/20/2025 3/31/2025 6/30/2025 9/30/2025 12/31/2025 3/31/2026 6/30/2026 Reduction in Shares Outstanding Since February 20, 2025 (in millions of shares outstanding, at quarter-end) Capital Returned Since February 20, 2025, By Method (share repurchases versus dividend payments, in millions of $US) $329.2 (Repurchases) $30.9 (Dividends) (7.9)% • During Q2 2026, Core invested $63.0 million to repurchase 719,904 shares of its common stock at an average share price of $87.54 • Core has invested $329.2 million to repurchase 4.3 million shares of its common stock, or ~8 percent of shares outstanding as of the program’s launch on 2/20/25, at an average share price of $77.04 • Core has now returned a total of $360.1 million to stockholders – in the form of repurchases and dividends – since the capital return program’s launch • As of June 30, 2026, Core had $670.8 million of remaining authorization under its existing $1.0 billion share repurchase program
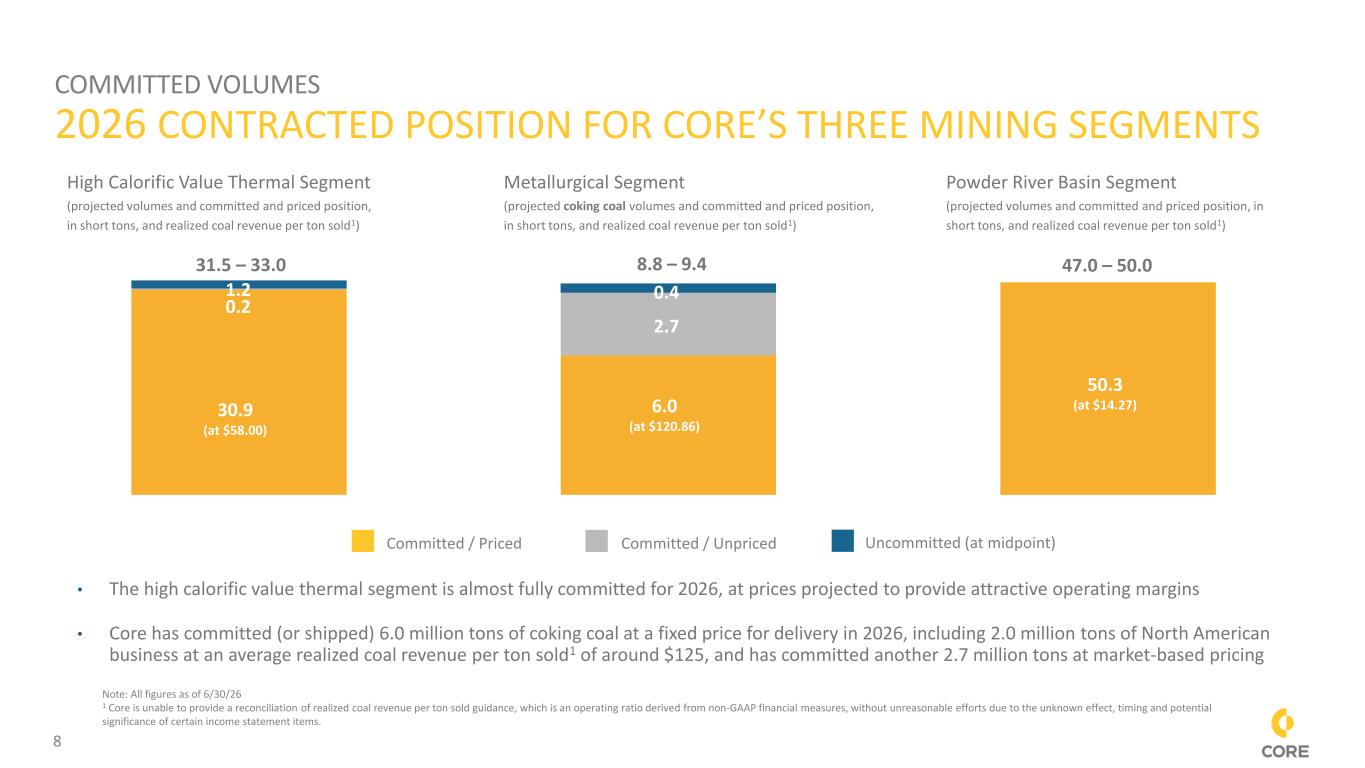
8 COMMITTED VOLUMES 2026 CONTRACTED POSITION FOR CORE’S THREE MINING SEGMENTS High Calorific Value Thermal Segment (projected volumes and committed and priced position, in short tons, and realized coal revenue per ton sold1) Metallurgical Segment (projected coking coal volumes and committed and priced position, in short tons, and realized coal revenue per ton sold1) 30.9 (at $58.00) 31.5 – 33.0 Committed / Priced Committed / Unpriced Uncommitted (at midpoint) 3.5 8.8 – 9.4 3.0 6.0 (at $120.86) 2.7 Powder River Basin Segment (projected volumes and committed and priced position, in short tons, and realized coal revenue per ton sold1) 50.3 (at $14.27) 47.0 – 50.0 • The high calorific value thermal segment is almost fully committed for 2026, at prices projected to provide attractive operating margins • Core has committed (or shipped) 6.0 million tons of coking coal at a fixed price for delivery in 2026, including 2.0 million tons of North American business at an average realized coal revenue per ton sold1 of around $125, and has committed another 2.7 million tons at market-based pricing Note: All figures as of 6/30/26 1 Core is unable to provide a reconciliation of realized coal revenue per ton sold guidance, which is an operating ratio derived from non-GAAP financial measures, without unreasonable efforts due to the unknown effect, timing and potential significance of certain income statement items. 1.2 0.4 0.2
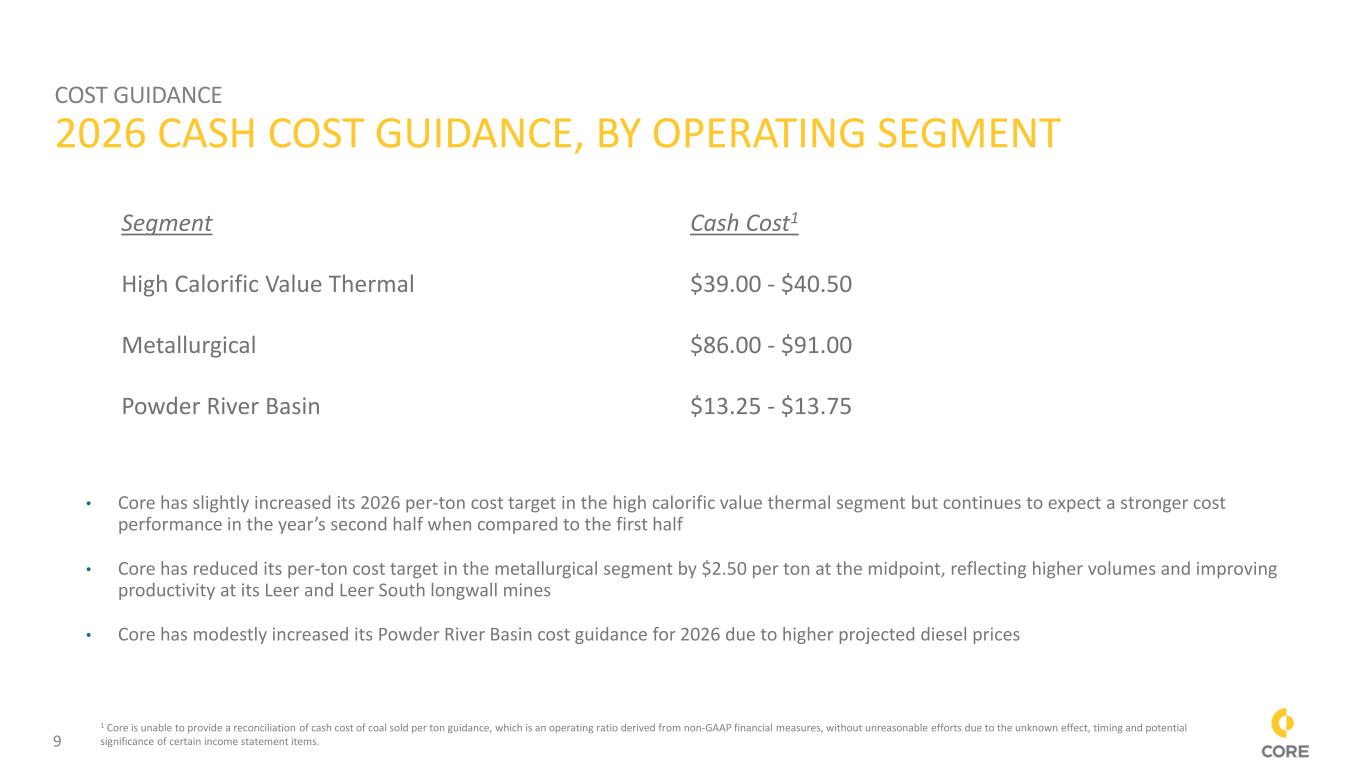
9 2026 CASH COST GUIDANCE, BY OPERATING SEGMENT Segment Cash Cost1 High Calorific Value Thermal $39.00 - $40.50 Metallurgical $86.00 - $91.00 Powder River Basin $13.25 - $13.75 • Core has slightly increased its 2026 per-ton cost target in the high calorific value thermal segment but continues to expect a stronger cost performance in the year’s second half when compared to the first half • Core has reduced its per-ton cost target in the metallurgical segment by $2.50 per ton at the midpoint, reflecting higher volumes and improving productivity at its Leer and Leer South longwall mines • Core has modestly increased its Powder River Basin cost guidance for 2026 due to higher projected diesel prices 1 Core is unable to provide a reconciliation of cash cost of coal sold per ton guidance, which is an operating ratio derived from non-GAAP financial measures, without unreasonable efforts due to the unknown effect, timing and potential significance of certain income statement items. COST GUIDANCE
10 • The President has made a strong U.S. coal industry and the preservation of the coal fleet central tenets of his national energy policy ✓ The Administration has employed Section 202(c) of the Federal Power Act to delay – perhaps indefinitely – the planned retirements of coal-fired generating units in a growing number of states ✓ The President has prioritized reducing the regulatory burden on – and inducing investment in – America’s coal fleet ✓ The Trump Administration views a strong baseload power system – with coal as a key support pillar – as essential to achieving and maintaining long-term global leadership in A.I. ✓ To this end, the DOE has launched multiple tranches of funding in support of the modernization of the U.S. coal fleet ✓ The Administration has also directed the Department of War to prioritize securing – via long-term contracts – coal-based energy to supply defense installations and mission-critical operations • With the support of the Administration, Congress passed constructive, pro-coal legislation in 2025 enhancing the competitiveness of U.S. coal in both domestic and overseas markets – legislation that, among other things: ✓ Designated metallurgical coal as a “critical material” eligible for an Advanced Manufacturing Production Tax Credit (45X) ✓ Lowered markedly the royalty rate on coal mined on federal lands, and ✓ Reduced significantly federal subsidies for renewable energy that have acted to undermine the strength of America’s grid • Most recently, the National Coal Council – at the Trump Administration’s request – published reports with step-by-step instructions on how to 1) ensure the long-term viability of America’s domestic coal fleet, and 2) unlock the full potential of U.S. coal exports THE TRUMP ADMINISTRATION HAS MADE COAL A CORNERSTONE OF ITS NATIONAL ENERGY POLICY
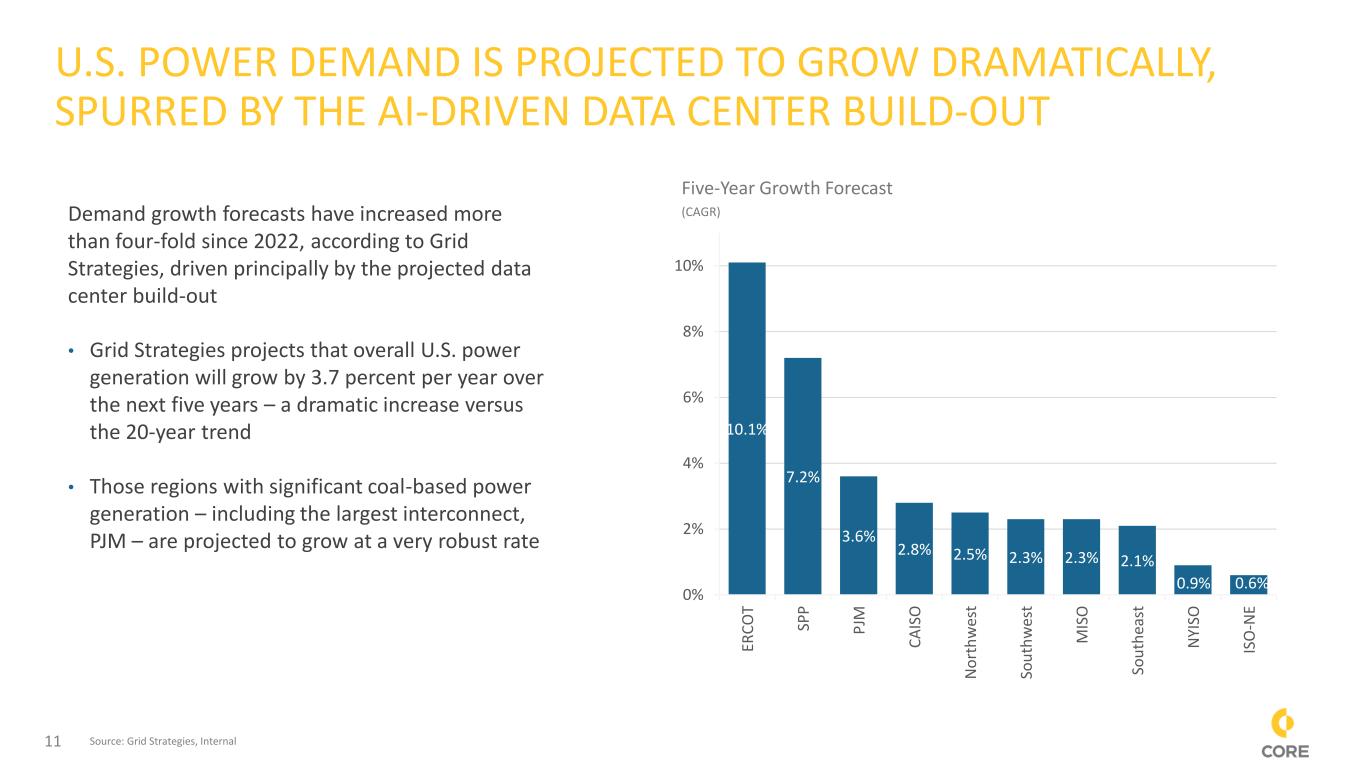
11 U.S. POWER DEMAND IS PROJECTED TO GROW DRAMATICALLY, SPURRED BY THE AI-DRIVEN DATA CENTER BUILD-OUT 10.1% 7.2% 3.6% 2.8% 2.5% 2.3% 2.3% 2.1% 0.9% 0.6% 0% 2% 4% 6% 8% 10% ER C O T SP P P JM C A IS O N o rt h w es t So u th w es t M IS O So u th ea st N YI SO IS O -N E Source: Grid Strategies, Internal Five-Year Growth Forecast (CAGR)Demand growth forecasts have increased more than four-fold since 2022, according to Grid Strategies, driven principally by the projected data center build-out • Grid Strategies projects that overall U.S. power generation will grow by 3.7 percent per year over the next five years – a dramatic increase versus the 20-year trend • Those regions with significant coal-based power generation – including the largest interconnect, PJM – are projected to grow at a very robust rate
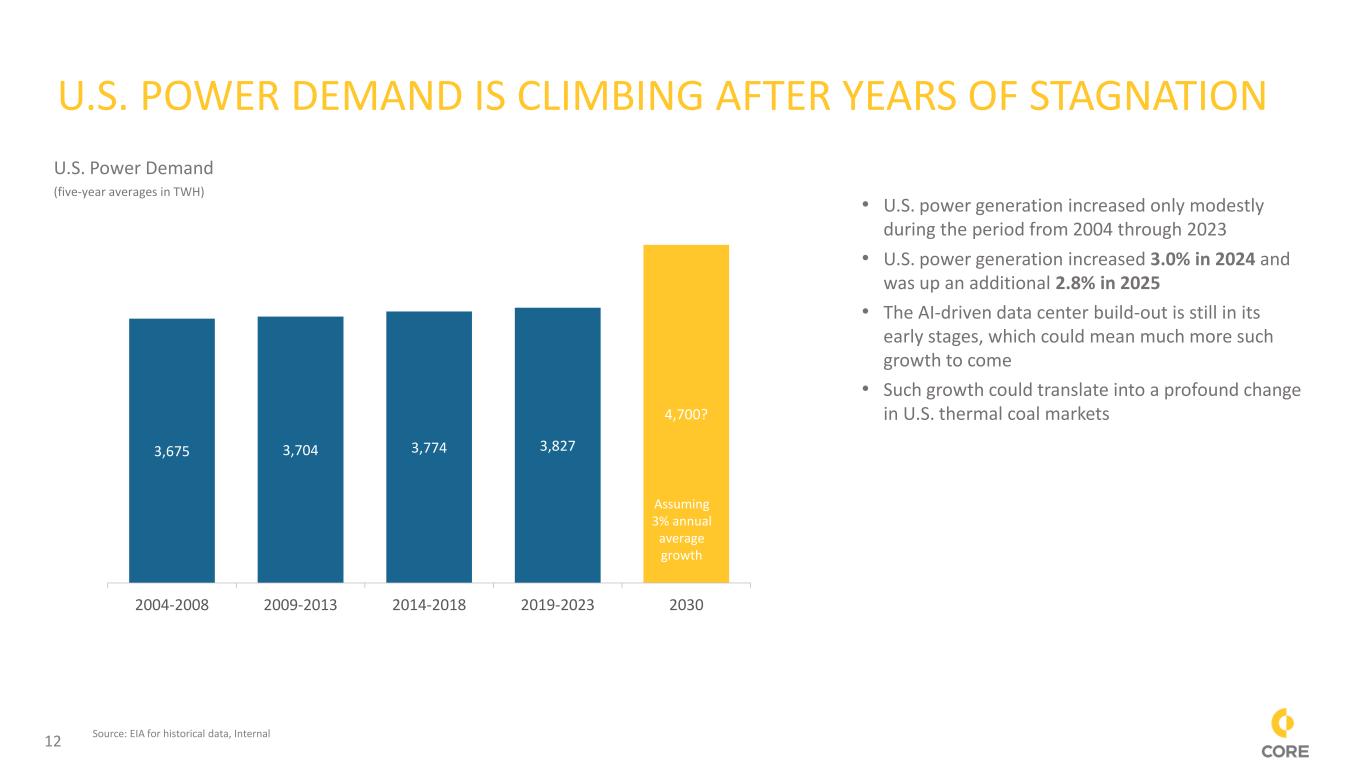
12 U.S. POWER DEMAND IS CLIMBING AFTER YEARS OF STAGNATION • U.S. power generation increased only modestly during the period from 2004 through 2023 • U.S. power generation increased 3.0% in 2024 and was up an additional 2.8% in 2025 • The AI-driven data center build-out is still in its early stages, which could mean much more such growth to come • Such growth could translate into a profound change in U.S. thermal coal markets Source: EIA for historical data, Internal 3,675 3,704 3,774 3,827 4,700? 2004-2008 2009-2013 2014-2018 2019-2023 2030 Assuming 3% annual average growth U.S. Power Demand (five-year averages in TWH)
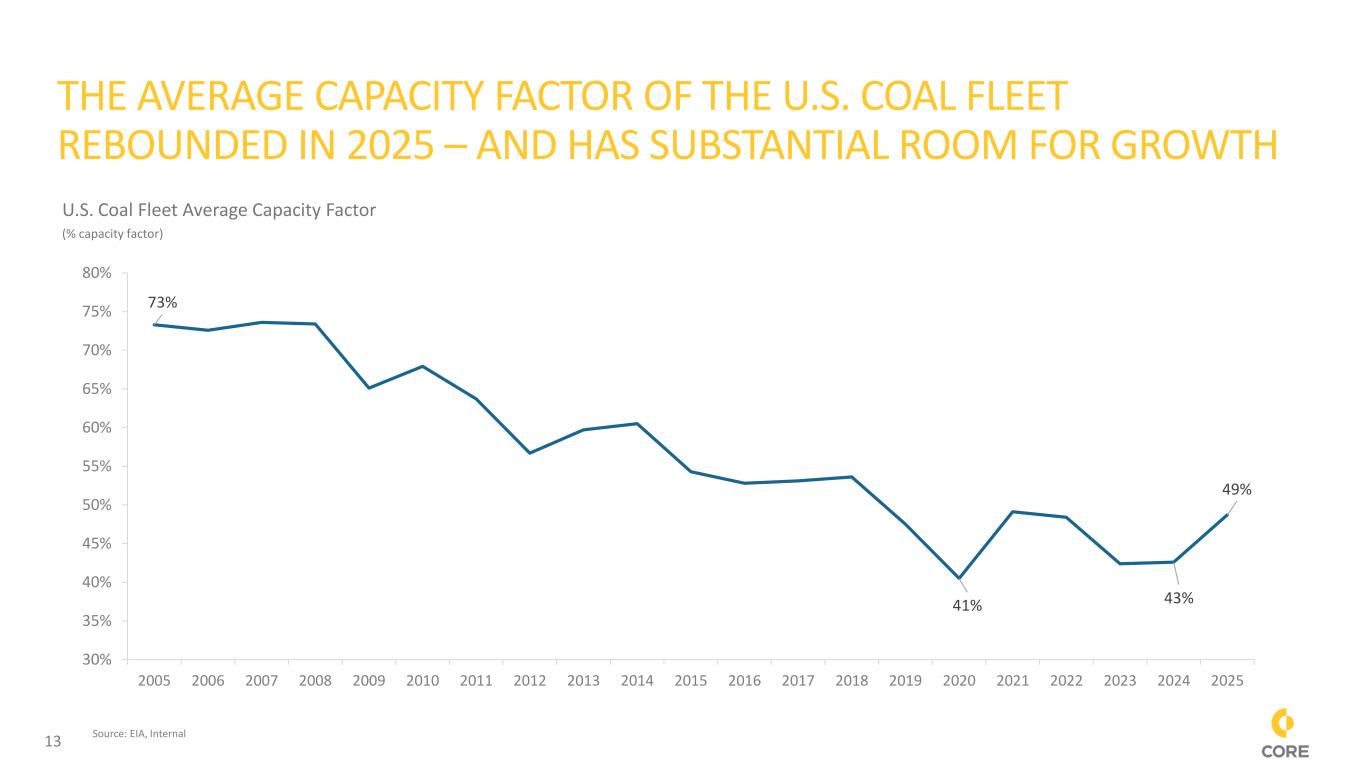
13 THE AVERAGE CAPACITY FACTOR OF THE U.S. COAL FLEET REBOUNDED IN 2025 – AND HAS SUBSTANTIAL ROOM FOR GROWTH Source: EIA, Internal 73% 41% 43% 49% 30% 35% 40% 45% 50% 55% 60% 65% 70% 75% 80% 2005 2006 2007 2008 2009 2010 2011 2012 2013 2014 2015 2016 2017 2018 2019 2020 2021 2022 2023 2024 2025 U.S. Coal Fleet Average Capacity Factor (% capacity factor)
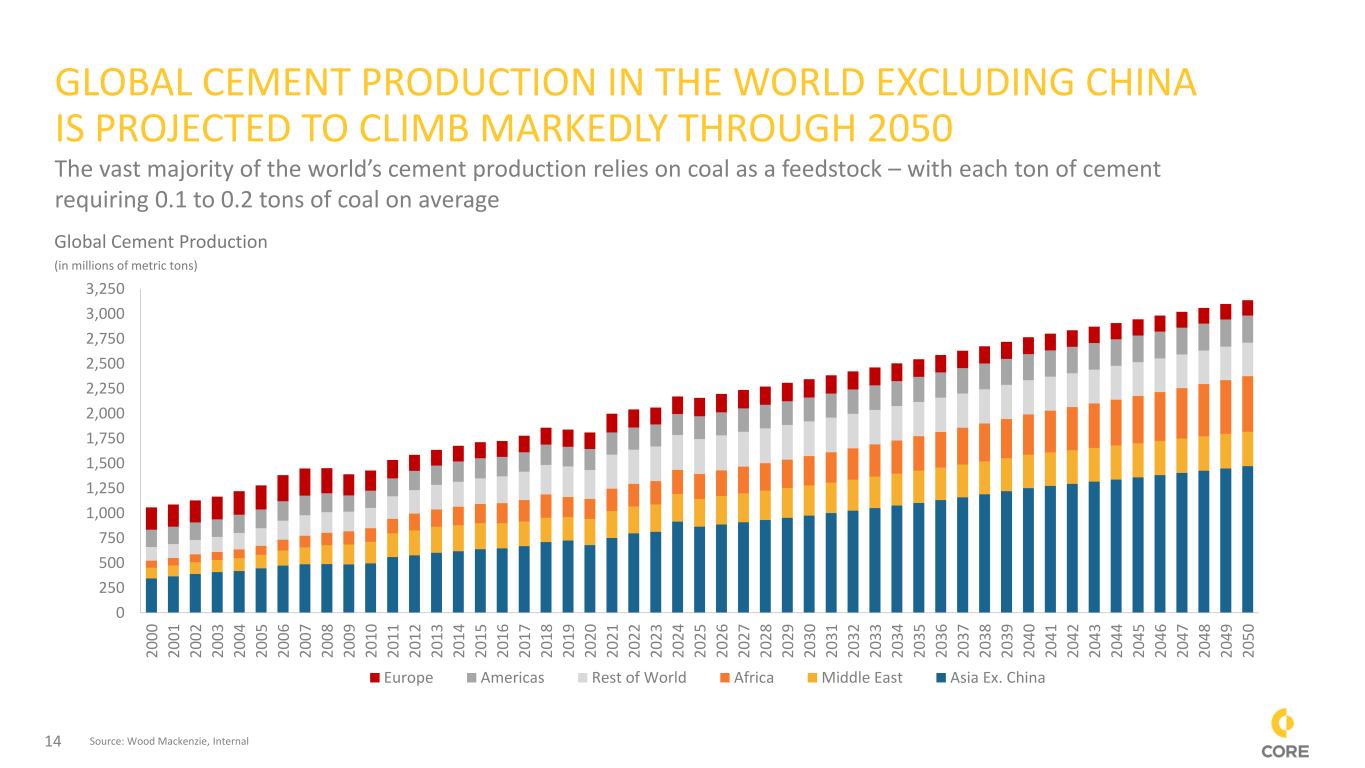
14 GLOBAL CEMENT PRODUCTION IN THE WORLD EXCLUDING CHINA IS PROJECTED TO CLIMB MARKEDLY THROUGH 2050 Global Cement Production (in millions of metric tons) Source: Wood Mackenzie, Internal 0 250 500 750 1,000 1,250 1,500 1,750 2,000 2,250 2,500 2,750 3,000 3,250 2 0 0 0 2 0 0 1 2 0 0 2 2 0 0 3 2 0 0 4 2 0 0 5 2 0 0 6 2 0 0 7 2 0 0 8 2 0 0 9 2 0 1 0 2 0 1 1 2 0 1 2 2 0 1 3 2 0 1 4 2 0 1 5 2 0 1 6 2 0 1 7 2 0 1 8 2 0 1 9 2 0 2 0 2 0 2 1 2 0 2 2 2 0 2 3 2 0 2 4 2 0 2 5 2 0 2 6 2 0 2 7 2 0 2 8 2 0 2 9 2 0 3 0 2 0 3 1 2 0 3 2 2 0 3 3 2 0 3 4 2 0 3 5 2 0 3 6 2 0 3 7 2 0 3 8 2 0 3 9 2 0 4 0 2 0 4 1 2 0 4 2 2 0 4 3 2 0 4 4 2 0 4 5 2 0 4 6 2 0 4 7 2 0 4 8 2 0 4 9 2 0 5 0 Europe Americas Rest of World Africa Middle East Asia Ex. China The vast majority of the world’s cement production relies on coal as a feedstock – with each ton of cement requiring 0.1 to 0.2 tons of coal on average
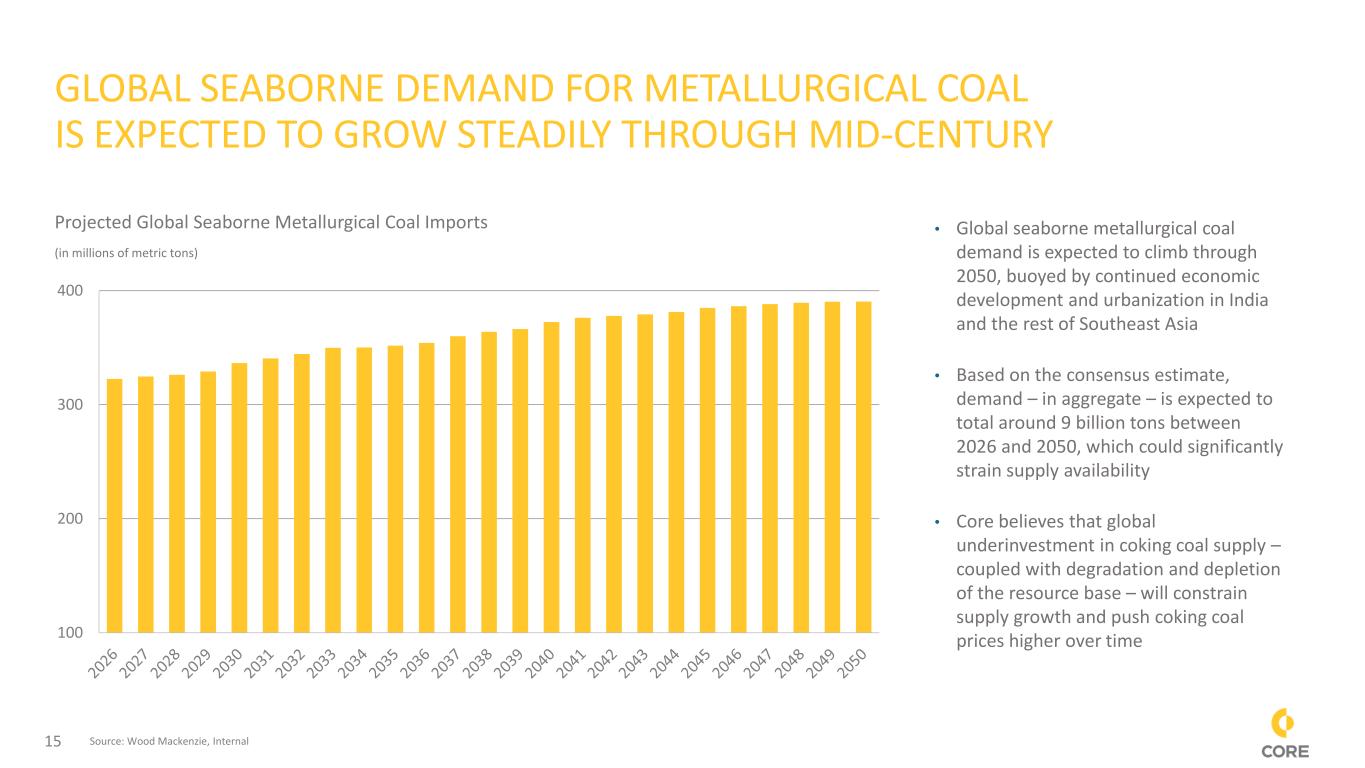
15 GLOBAL SEABORNE DEMAND FOR METALLURGICAL COAL IS EXPECTED TO GROW STEADILY THROUGH MID-CENTURY 100 200 300 400 • Global seaborne metallurgical coal demand is expected to climb through 2050, buoyed by continued economic development and urbanization in India and the rest of Southeast Asia • Based on the consensus estimate, demand – in aggregate – is expected to total around 9 billion tons between 2026 and 2050, which could significantly strain supply availability • Core believes that global underinvestment in coking coal supply – coupled with degradation and depletion of the resource base – will constrain supply growth and push coking coal prices higher over time Projected Global Seaborne Metallurgical Coal Imports (in millions of metric tons) Source: Wood Mackenzie, Internal
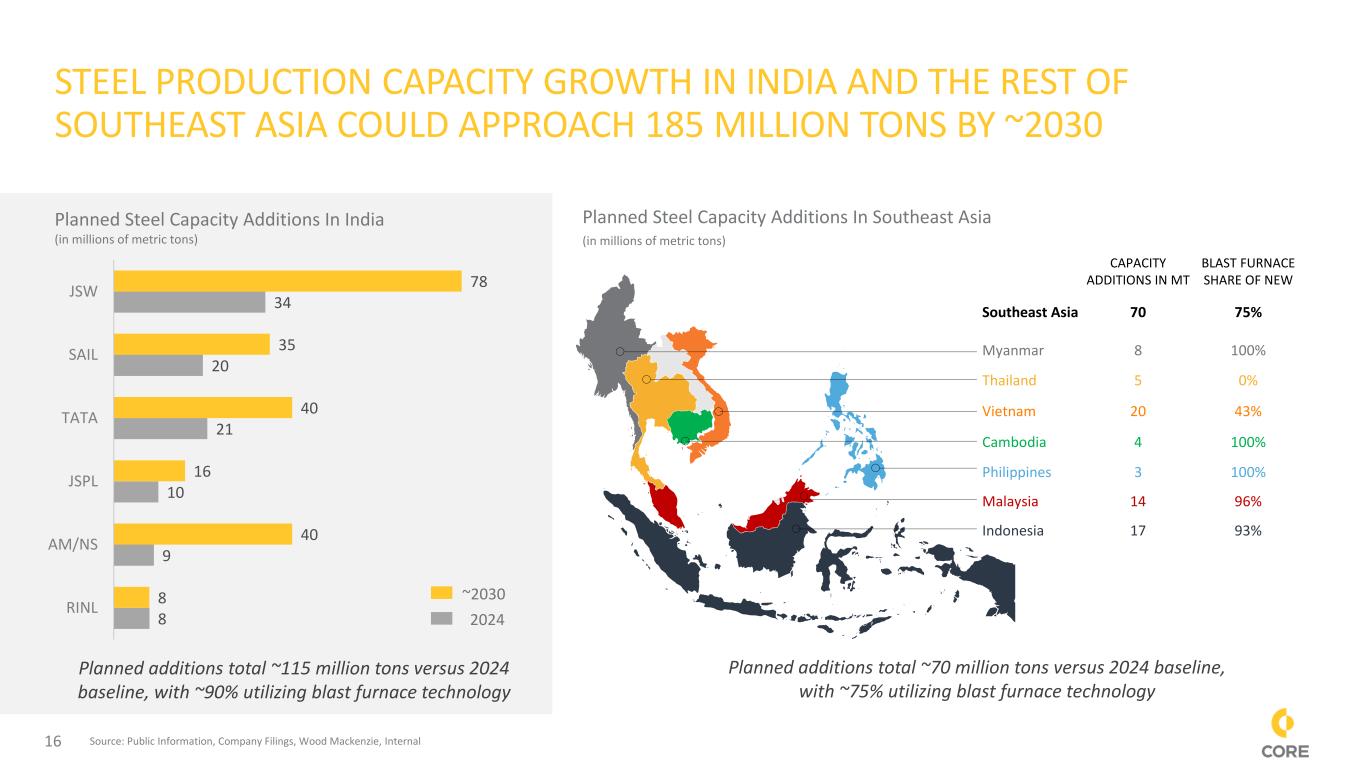
16 STEEL PRODUCTION CAPACITY GROWTH IN INDIA AND THE REST OF SOUTHEAST ASIA COULD APPROACH 185 MILLION TONS BY ~2030 8 9 10 21 20 34 8 40 16 40 35 78 RINL AM/NS JSPL TATA SAIL JSW Planned Steel Capacity Additions In India (in millions of metric tons) Planned Steel Capacity Additions In Southeast Asia (in millions of metric tons) ~2030 2024 CAPACITY ADDITIONS IN MT BLAST FURNACE SHARE OF NEW Southeast Asia 70 75% Myanmar 8 100% Thailand 5 0% Vietnam 20 43% Cambodia 4 100% Philippines 3 100% Malaysia 14 96% Indonesia 17 93% Source: Public Information, Company Filings, Wood Mackenzie, Internal Planned additions total ~115 million tons versus 2024 baseline, with ~90% utilizing blast furnace technology Planned additions total ~70 million tons versus 2024 baseline, with ~75% utilizing blast furnace technology
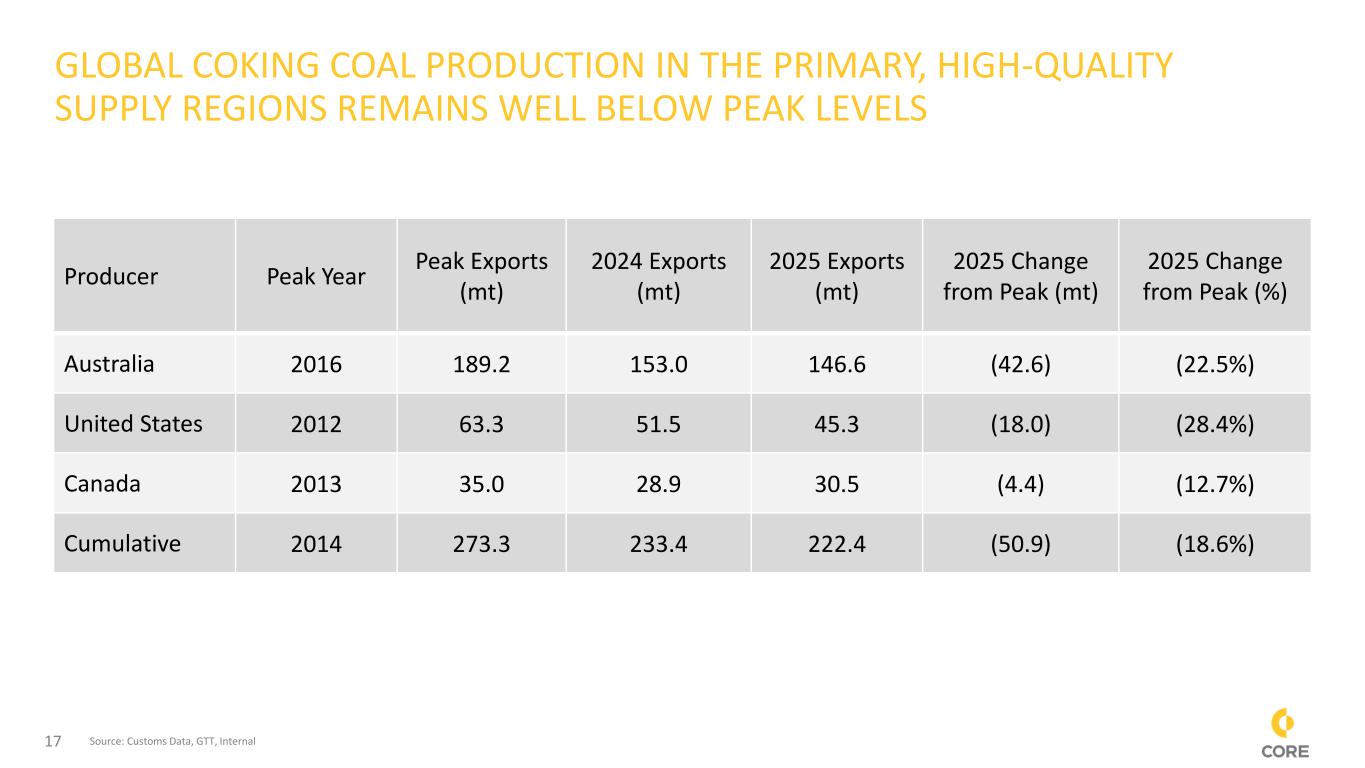
17 GLOBAL COKING COAL PRODUCTION IN THE PRIMARY, HIGH-QUALITY SUPPLY REGIONS REMAINS WELL BELOW PEAK LEVELS Producer Peak Year Peak Exports (mt) 2024 Exports (mt) 2025 Exports (mt) 2025 Change from Peak (mt) 2025 Change from Peak (%) Australia 2016 189.2 153.0 146.6 (42.6) (22.5%) United States 2012 63.3 51.5 45.3 (18.0) (28.4%) Canada 2013 35.0 28.9 30.5 (4.4) (12.7%) Cumulative 2014 273.3 233.4 222.4 (50.9) (18.6%) Source: Customs Data, GTT, Internal
18 • Core has demonstrated elevated ash-basis concentrations of certain rare earth elements (REEs) and critical minerals (CMs) at its large-scale mining operations in the eastern and western United States • The large flow rates and readily accessible nature of byproduct streams at the Pennsylvania Mining Complex – the largest mining complex in the eastern U.S. by a wide margin – as well as at the Leer and Leer South mines could offer unique opportunities for further upgrading ✓ Core’s Innovations group was recently selected by the U.S. Department of Energy to negotiate a substantial grant for the construction of a pilot-scale facility for the extraction of rare earth elements and critical minerals from coal waste tailings at the PAMC • Core is exploring a strategy to leverage the great scale of its PRB operations – which produce ~50 million tons of coal annually – in the areas of selective mining, upgrading, and extraction of REEs and CMs ✓ The enrichment at the coal seam margins at Core’s Black Thunder and Coal Creek mines is consistent with that observed during the U.S. Department of Energy-sponsored CORE-CM Project and reported by other operators in the Powder River Basin ✓ Core has commissioned a qualified engineering firm (Weir International) to complete an Exploration Target Technical Report Summary for its PRB properties by year-end • Core has commenced the next phase of its REE and CM evaluation, which will include an expanded drilling program intended to facilitate additional characterization of the potential resource • Core is continuing to work with Virginia Tech and the University of Wyoming to test and optimize REE / CM concentration and extraction strategies for both its eastern and western U.S. operations POTENTIAL FUTURE OPTIONALITY IN RARE EARTH ELEMENTS AND CRITICAL MINERALS ARENA
19 • Core’s Touchstone Advanced Composites business unit is rapidly becoming a critical supplier of composite tooling and parts to the nation’s aerospace and defense industries ✓ Touchstone manufactures high-performance tooling and parts using its proprietary CFOAM® technology and other carbon and advanced materials ✓ In 2025, Touchstone served more than 40 customers, including Northrop Grumman, Boeing, Anduril, Kratos, and Bell ✓ Touchstone tooling and parts have been deployed in the development and manufacture of many advanced aircraft and spacecraft, including the F-18, F-35 and B-21, as well as in innovative applications such as NASA’s X-59 Quesst and Advanced Composite Solar Sail System ✓ Touchstone is fabricating complex structural tooling and parts for Northrop Grumman’s next-generation YFQ-48A Talon Blue Collaborative Combat Aircraft, and played an integral role in Talon Blue’s recent successful autonomous taxi test in Mojave, California ✓ Touchstone features 75,000 square feet of manufacturing space in Triadelphia, West Virginia, and Fort Worth, Texas • Core’s C-BATT joint venture is developing advanced, domestic, carbon-based battery materials to help solve ongoing supply chain challenges – including a high dependence on Chinese graphite – while offering improvements to both energy density and durability ✓ The AI-driven data center build-out and the future power grid will require significant new investment in grid-scale battery technology ✓ C-BATT recently joined the Defense Industrial Base Consortium (DIBC) and GEN3 6T Battery Alliance, strengthening its engagement with the U.S. defense energy-storage ecosystem ✓ The average American war fighter carries more than 20 pounds of batteries, to name just one critical military application • Core’s Innovations business unit is also advancing a range of carbon-based construction materials, including coal-derived deck board materials CORE’S INNOVATIONS BUSINESS UNIT IS MOVING AHEAD RAPIDLY WITH THE DEVELOPMENT OF PROMISING NEW APPLICATIONS FOR COAL
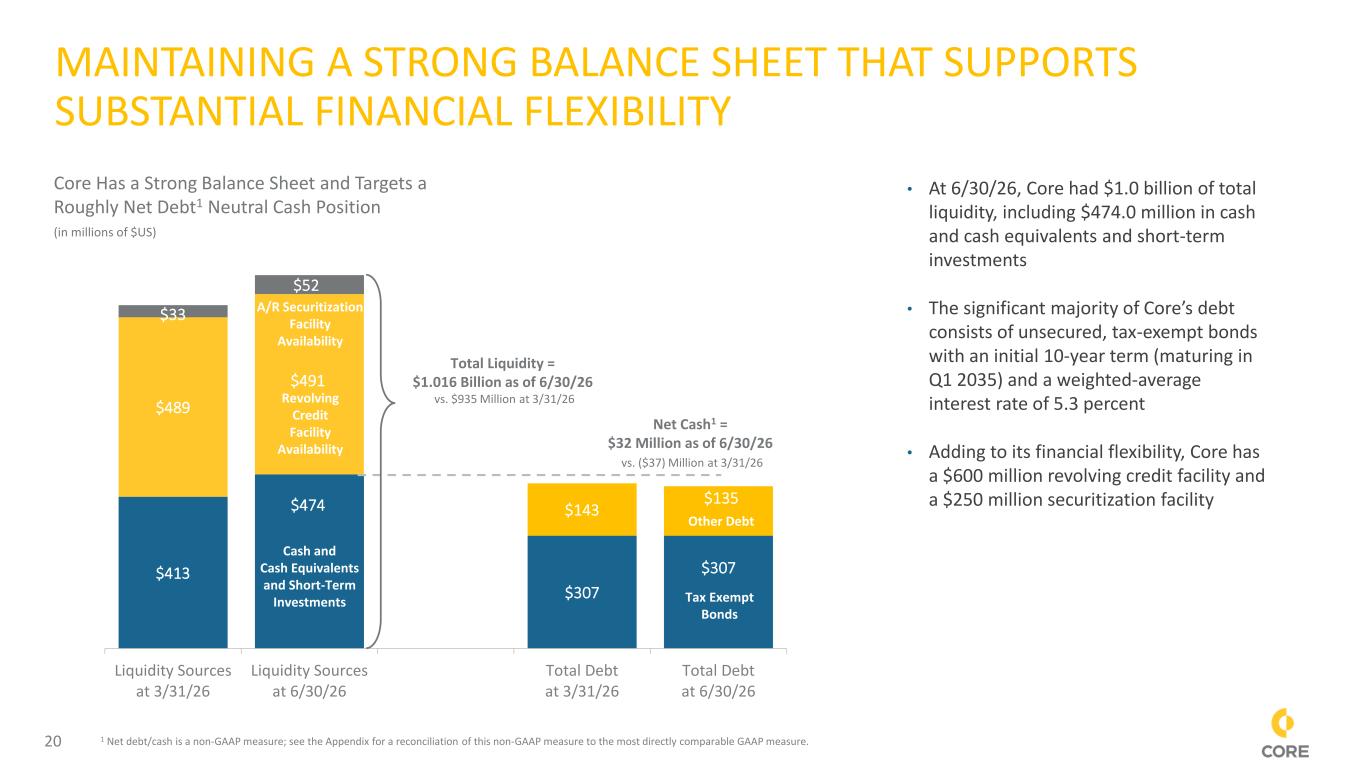
20 $413 $474 $489 $491 $33 $52 $307 $307 $143 $135 Liquidity Sources at 3/31/26 Liquidity Sources at 6/30/26 Total Debt at 3/31/26 Total Debt at 6/30/26 Total Liquidity = $1.016 Billion as of 6/30/26 vs. $935 Million at 3/31/26 Cash and Cash Equivalents and Short-Term Investments Revolving Credit Facility Availability A/R Securitization Facility Availability Tax Exempt Bonds Other Debt MAINTAINING A STRONG BALANCE SHEET THAT SUPPORTS SUBSTANTIAL FINANCIAL FLEXIBILITY Equipment Leases • At 6/30/26, Core had $1.0 billion of total liquidity, including $474.0 million in cash and cash equivalents and short-term investments • The significant majority of Core’s debt consists of unsecured, tax-exempt bonds with an initial 10-year term (maturing in Q1 2035) and a weighted-average interest rate of 5.3 percent • Adding to its financial flexibility, Core has a $600 million revolving credit facility and a $250 million securitization facility Core Has a Strong Balance Sheet and Targets a Roughly Net Debt1 Neutral Cash Position (in millions of $US) 1 Net debt/cash is a non-GAAP measure; see the Appendix for a reconciliation of this non-GAAP measure to the most directly comparable GAAP measure. Net Cash1 = $32 Million as of 6/30/26 vs. ($37) Million at 3/31/26
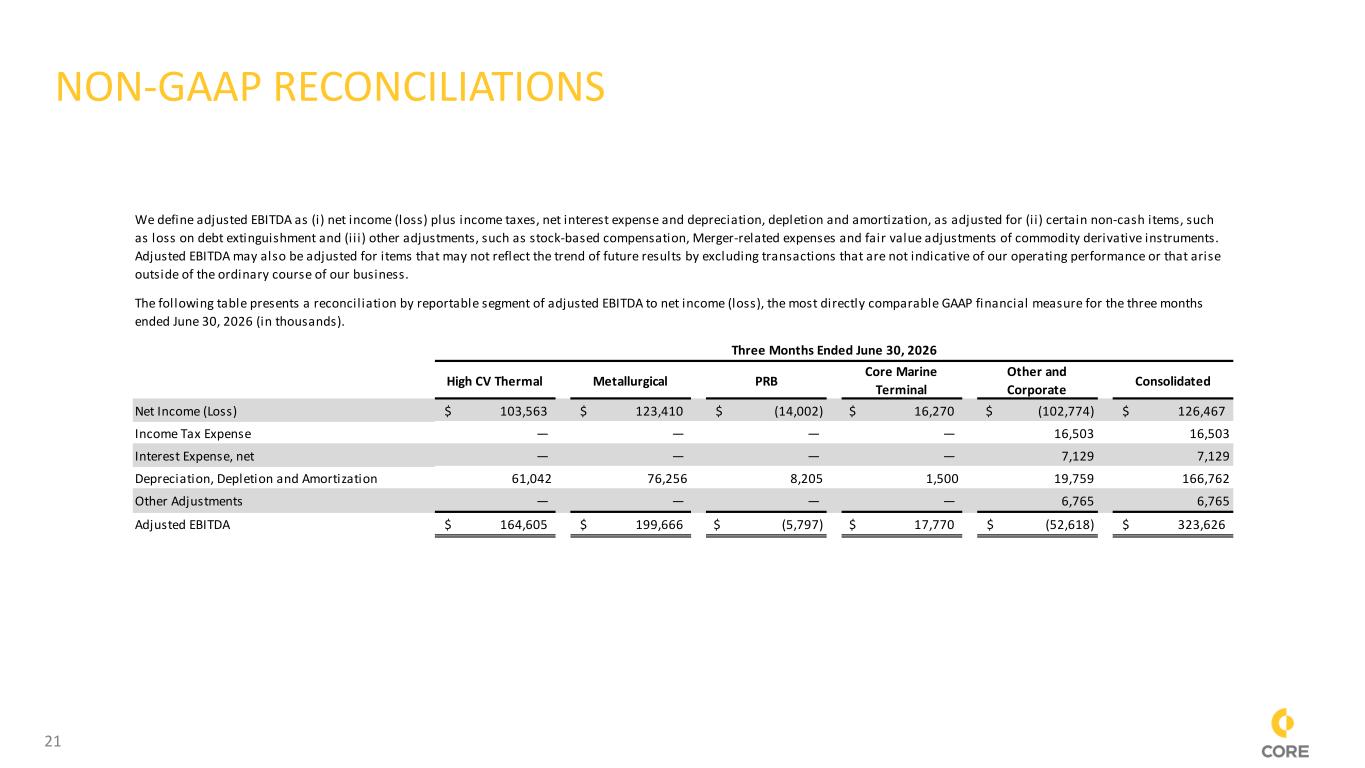
21 NON-GAAP RECONCILIATIONS High CV Thermal Metallurgical PRB Core Marine Terminal Other and Corporate Consolidated Net Income (Loss) 103,563$ 123,410$ (14,002)$ 16,270$ (102,774)$ 126,467$ Income Tax Expense — — — — 16,503 16,503 Interest Expense, net — — — — 7,129 7,129 Depreciation, Depletion and Amortization 61,042 76,256 8,205 1,500 19,759 166,762 Other Adjustments — — — — 6,765 6,765 Adjusted EBITDA 164,605$ 199,666$ (5,797)$ 17,770$ (52,618)$ 323,626$ We define adjusted EBITDA as (i) net income (loss) plus income taxes, net interest expense and depreciation, depletion and amortization, as adjusted for (i i) certain non-cash items, such as loss on debt extinguishment and (ii i) other adjustments, such as stock-based compensation, Merger-related expenses and fair value adjustments of commodity derivative instruments. Adjusted EBITDA may also be adjusted for items that may not reflect the trend of future results by excluding transactions that are not indicative of our operating performance or that arise outside of the ordinary course of our business. The following table presents a reconciliation by reportable segment of adjusted EBITDA to net income (loss), the most directly comparable GAAP financial measure for the three months ended June 30, 2026 (in thousands). Three Months Ended June 30, 2026
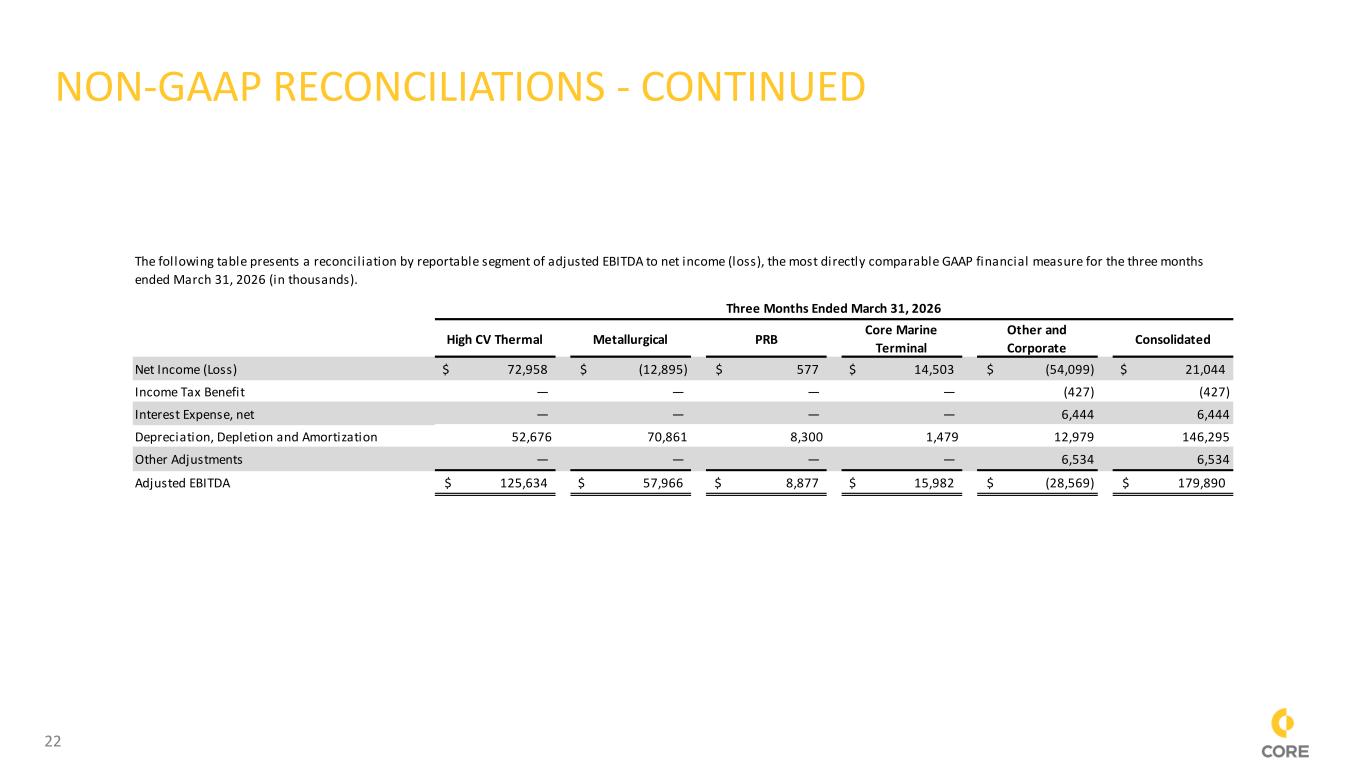
22 NON-GAAP RECONCILIATIONS - CONTINUED High CV Thermal Metallurgical PRB Core Marine Terminal Other and Corporate Consolidated Net Income (Loss) 72,958$ (12,895)$ 577$ 14,503$ (54,099)$ 21,044$ Income Tax Benefit — — — — (427) (427) Interest Expense, net — — — — 6,444 6,444 Depreciation, Depletion and Amortization 52,676 70,861 8,300 1,479 12,979 146,295 Other Adjustments — — — — 6,534 6,534 Adjusted EBITDA 125,634$ 57,966$ 8,877$ 15,982$ (28,569)$ 179,890$ The following table presents a reconciliation by reportable segment of adjusted EBITDA to net income (loss), the most directly comparable GAAP financial measure for the three months ended March 31, 2026 (in thousands). Three Months Ended March 31, 2026
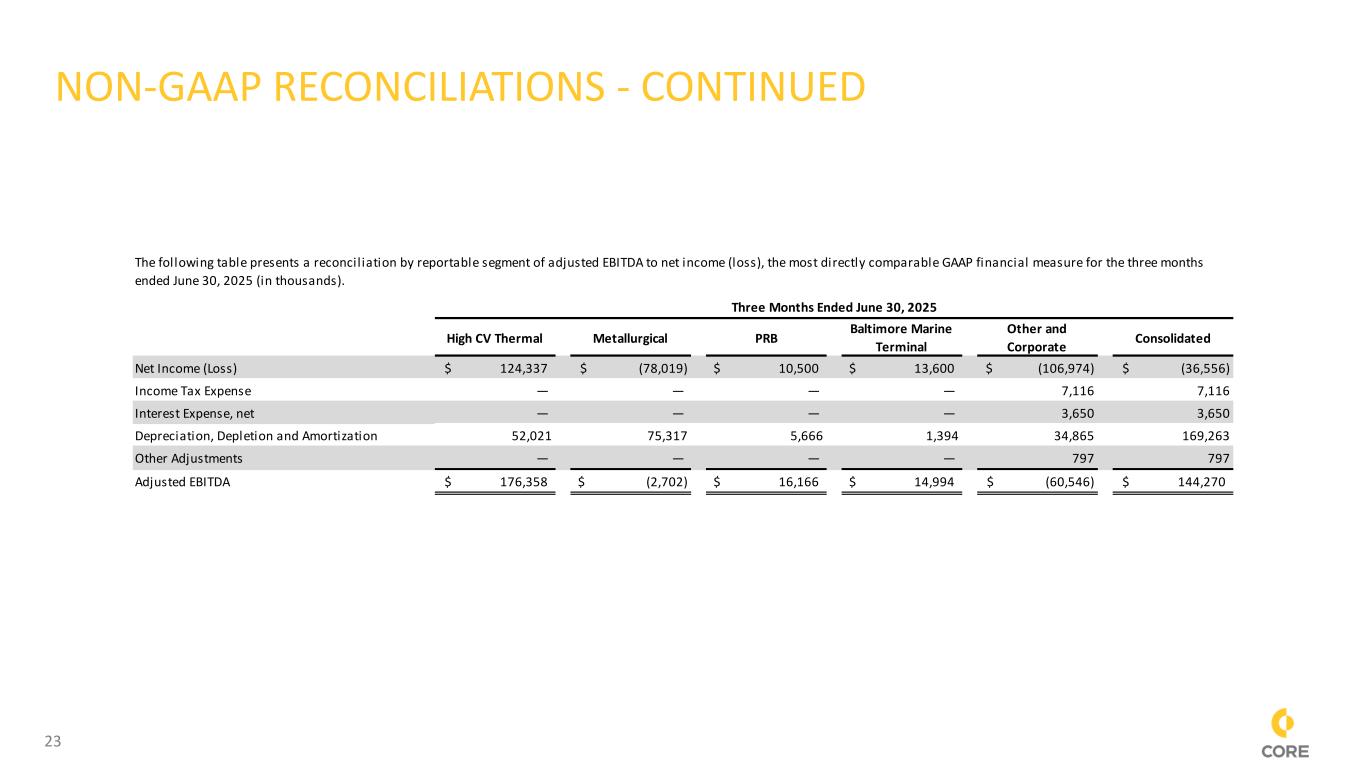
23 NON-GAAP RECONCILIATIONS - CONTINUED High CV Thermal Metallurgical PRB Baltimore Marine Terminal Other and Corporate Consolidated Net Income (Loss) 124,337$ (78,019)$ 10,500$ 13,600$ (106,974)$ (36,556)$ Income Tax Expense — — — — 7,116 7,116 Interest Expense, net — — — — 3,650 3,650 Depreciation, Depletion and Amortization 52,021 75,317 5,666 1,394 34,865 169,263 Other Adjustments — — — — 797 797 Adjusted EBITDA 176,358$ (2,702)$ 16,166$ 14,994$ (60,546)$ 144,270$ Three Months Ended June 30, 2025 The following table presents a reconciliation by reportable segment of adjusted EBITDA to net income (loss), the most directly comparable GAAP financial measure for the three months ended June 30, 2025 (in thousands).
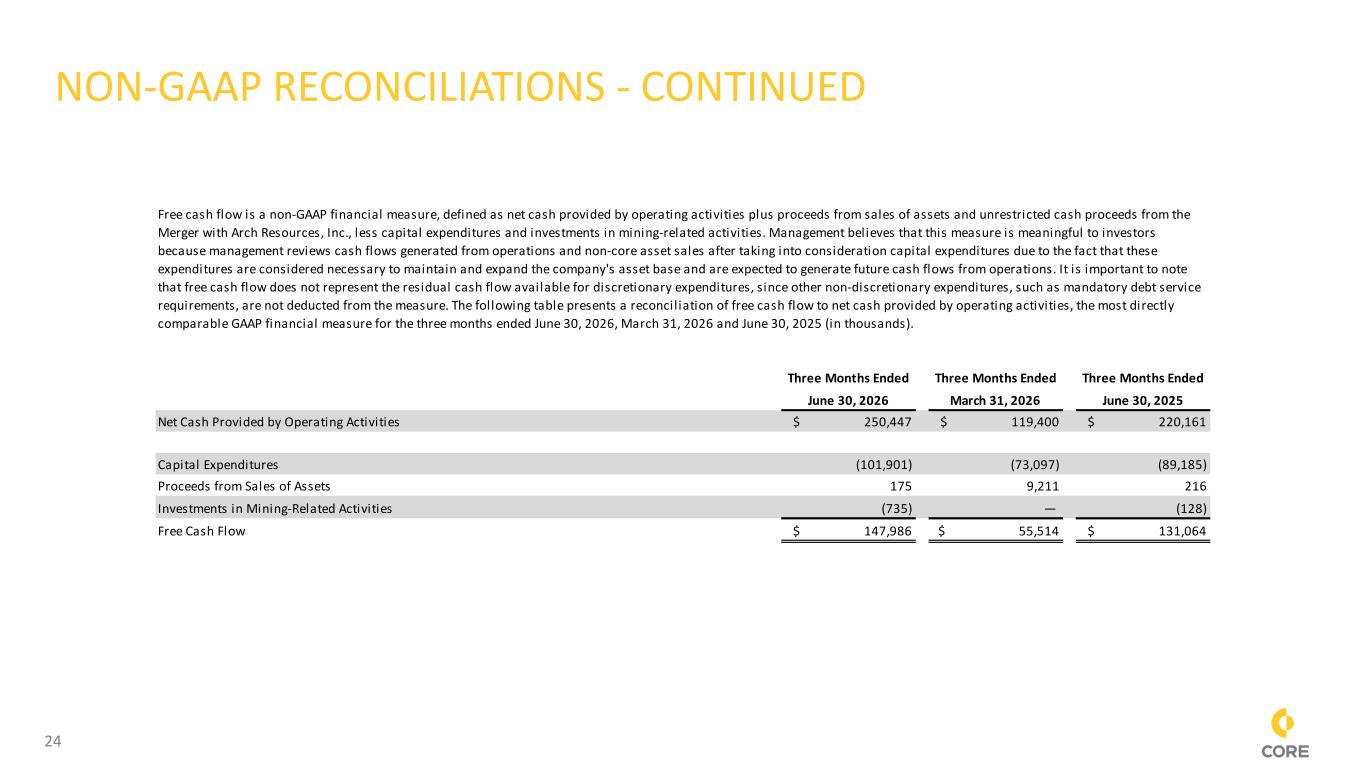
24 NON-GAAP RECONCILIATIONS - CONTINUED Three Months Ended Three Months Ended Three Months Ended June 30, 2026 March 31, 2026 June 30, 2025 Net Cash Provided by Operating Activities $ 250,447 $ 119,400 $ 220,161 Capital Expenditures (101,901) (73,097) (89,185) Proceeds from Sales of Assets 175 9,211 216 Investments in Mining-Related Activities (735) — (128) Free Cash Flow $ 147,986 $ 55,514 $ 131,064 Free cash flow is a non-GAAP financial measure, defined as net cash provided by operating activities plus proceeds from sales of assets and unrestricted cash proceeds from the Merger with Arch Resources, Inc., less capital expenditures and investments in mining-related activities. Management believes that this measure is meaningful to investors because management reviews cash flows generated from operations and non-core asset sales after taking into consideration capital expenditures due to the fact that these expenditures are considered necessary to maintain and expand the company's asset base and are expected to generate future cash flows from operations. It is important to note that free cash flow does not represent the residual cash flow available for discretionary expenditures, since other non-discretionary expenditures, such as mandatory debt service requirements, are not deducted from the measure. The following table presents a reconciliation of free cash flow to net cash provided by operating activities, the most directly comparable GAAP financial measure for the three months ended June 30, 2026, March 31, 2026 and June 30, 2025 (in thousands).
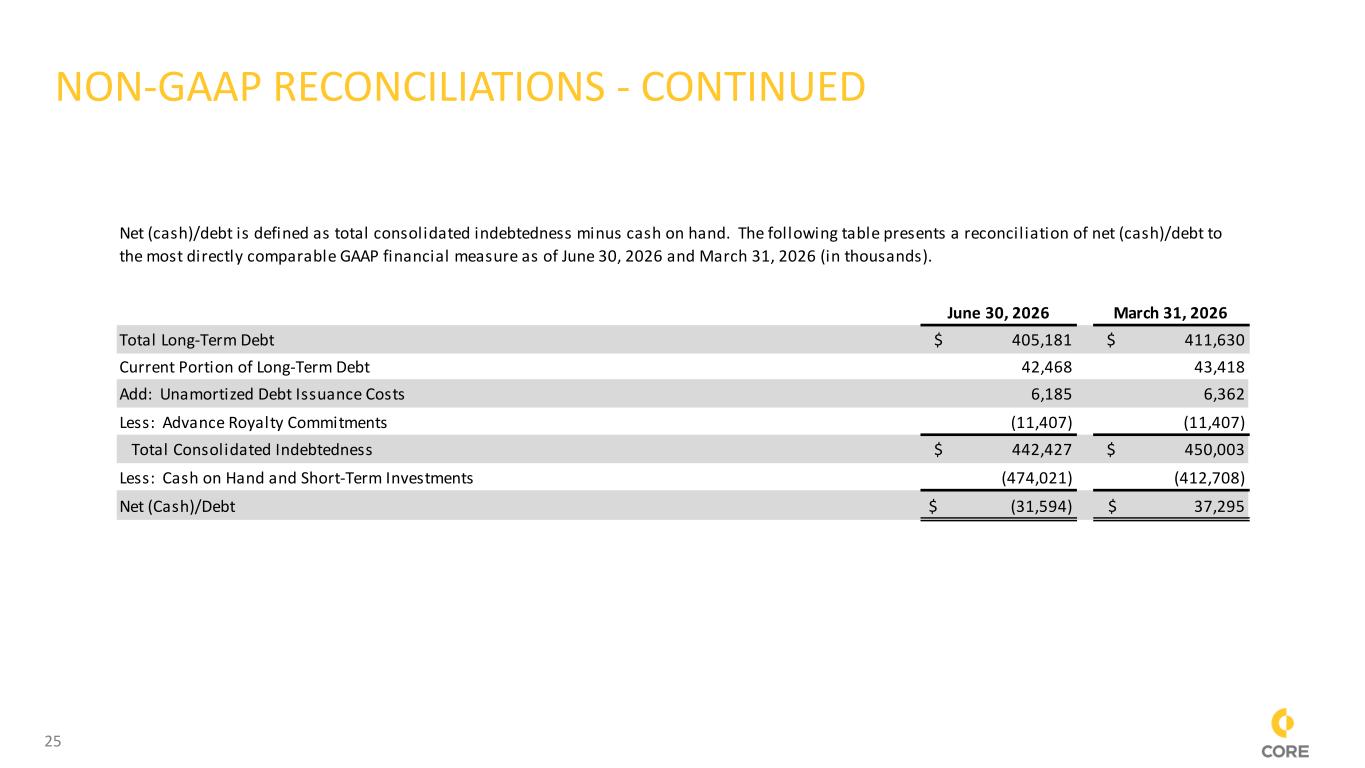
25 NON-GAAP RECONCILIATIONS - CONTINUED June 30, 2026 March 31, 2026 Total Long-Term Debt $ 405,181 $ 411,630 Current Portion of Long-Term Debt 42,468 43,418 Add: Unamortized Debt Issuance Costs 6,185 6,362 Less: Advance Royalty Commitments (11,407) (11,407) Total Consolidated Indebtedness $ 442,427 $ 450,003 Less: Cash on Hand and Short-Term Investments (474,021) (412,708) Net (Cash)/Debt $ (31,594) $ 37,295 Net (cash)/debt is defined as total consolidated indebtedness minus cash on hand. The following table presents a reconciliation of net (cash)/debt to the most directly comparable GAAP financial measure as of June 30, 2026 and March 31, 2026 (in thousands).
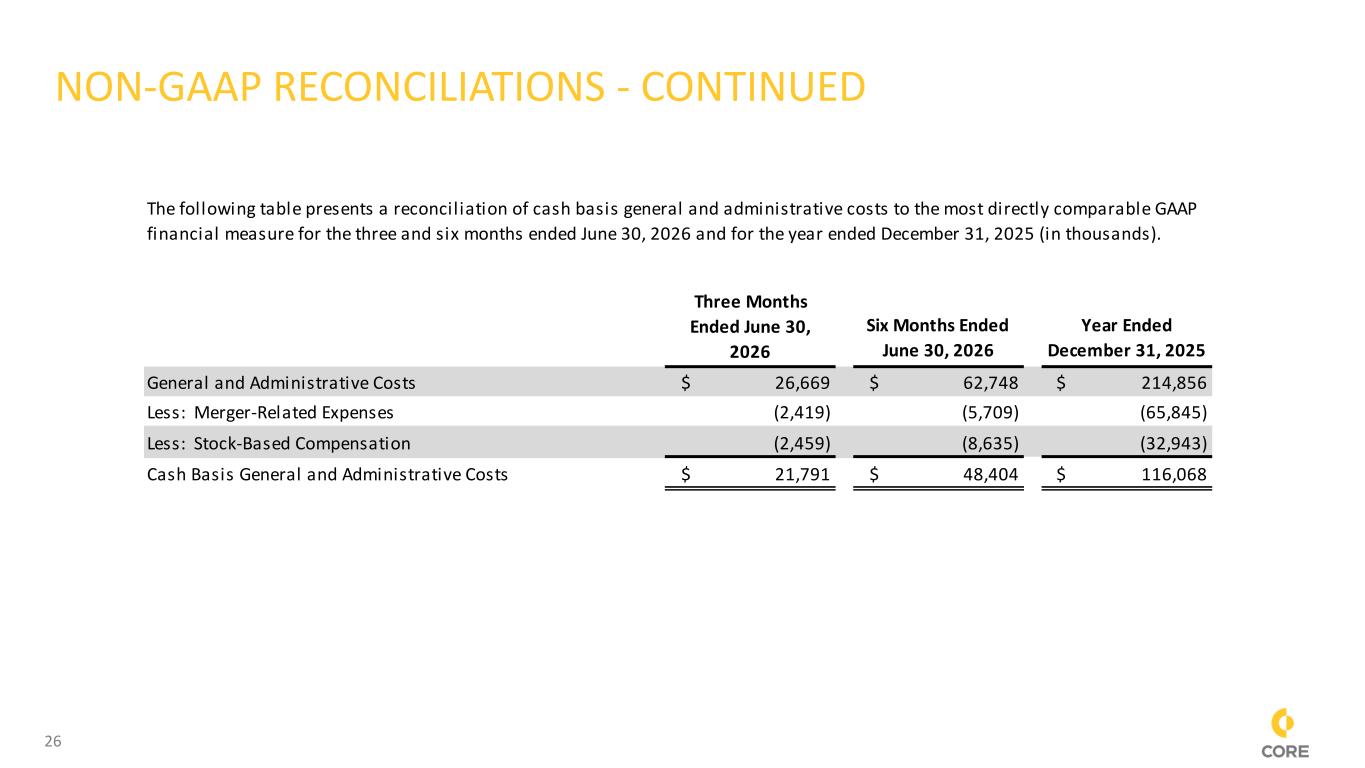
26 NON-GAAP RECONCILIATIONS - CONTINUED Three Months Ended June 30, 2026 Six Months Ended June 30, 2026 Year Ended December 31, 2025 General and Administrative Costs $ 26,669 $ 62,748 $ 214,856 Less: Merger-Related Expenses (2,419) (5,709) (65,845) Less: Stock-Based Compensation (2,459) (8,635) (32,943) Cash Basis General and Administrative Costs $ 21,791 $ 48,404 $ 116,068 The following table presents a reconciliation of cash basis general and administrative costs to the most directly comparable GAAP financial measure for the three and six months ended June 30, 2026 and for the year ended December 31, 2025 (in thousands).