Strengthening our Foundation to Unlock Long-Term Growth Corporate Deck | August 6, 2026
Disclaimer This presentation contains statements about future events and expectations that constitute forward-looking statements. Forward-looking statements are based on our beliefs, assumptions and expectations of our future financial and operating performance and growth plans, taking into account the information currently available to us. These statements are not statements of historical fact. Forward-looking statements involve risks and uncertainties that may cause our actual results to differ materially from the expectations of future results we express or imply in any forward-looking statements, and you should not place undue reliance on such statements. Factors that could contribute to these differences include the following: failure to execute on growth strategies and opportunities; national, international, regional and local economic conditions, including impacts and uncertainty from trade disputes and tariffs on goods imported to the United States and goods exported to other countries; periods of economic slowdown or recession; the impact of supply chain disruptions, including, among others, the impact of labor availability, raw material availability, manufacturing and food production and transportation; uncertainties and risks related to public health crises, adverse economic or real estate developments in our geographic markets or the temperature-controlled warehouse industry; risks associated with the ownership of real estate generally and temperature-controlled warehouses in particular; general economic conditions; acquisition risks, including the failure to identify or complete attractive acquisitions or the failure of acquisitions to perform in accordance with projections or our failure to realize the intended benefits from our acquisitions, including synergies, or disruptions to our plans and operations or unknown or contingent liabilities related to our acquisitions; risks related to failure to consummate our joint venture with EQT on the terms or timeline currently anticipated, or at all, due to the failure to satisfy closing conditions, obtain necessary approvals or consents, or other factors beyond our control; risks related to failure to achieve the anticipated benefits, synergies or returns from our joint venture with EQT, including as a result of unanticipated costs or liabilities, difficulties in integrating joint venture operations, or the failure of the joint venture to perform in accordance with our expectations; risks related to expansions of existing properties and developments of new properties, including failure to meet budgeted or stabilized returns within expected timeframes, or at all, in respect thereof; a failure of our information technology systems, systems conversions and integrations, cybersecurity attacks or a breach of our information security systems, networks or processes could cause business disruptions or loss of confidential information; risks related to privacy and data security concerns, and data collection and transfer restrictions and related foreign regulations; risks related to defaults or non-renewals of significant customer contracts; uncertainty of revenues, given the nature of our customer contracts; increased interest rates and operating costs; our failure to obtain necessary outside financing on attractive terms or at all; risks related to, or restrictions contained in, our debt financings; decreased storage rates or increased vacancy rates; risks related to current and potential international operations and properties; difficulties in expanding our operations into new markets and products, including international markets; risks related to the partial ownership of properties, including our JV investments; our failure to maintain our status as a Real Estate Investment Trust ("REIT"); possible environmental liabilities, including costs, fines or penalties that may be incurred due to necessary remediation of contamination of properties presently or previously owned by us; financial market fluctuations; actions by our competitors and their increasing ability to compete with us; geopolitical conflicts, such as the on-going conflict between Russia and Ukraine and in the Middle East, and any related or resulting disruptions, including increased energy costs; rising inflationary pressures, increased interest rates and operating costs; labor and power costs; labor shortages; risks related to rising construction costs/ risk related to implementation of the new enterprise resource planning system; risks related to natural disasters; changes in applicable governmental regulations and tax legislation, including in the international markets; additional risks with respect to the addition of European operations and properties; changes in real estate and zoning laws and increases in real property tax rates; our relationship with our associates; the occurrence of any work stoppages or any disputes under our collective bargaining agreements and employment related litigation; liabilities as a result of our participation in multi-employer pension plans; uninsured losses or losses in excess of our insurance coverage; the potential liabilities, costs and regulatory impacts associated with our in-house trucking services and the potential disruptions associated with the use of third-party trucking service providers to provide transportation services to our customers; the cost and time requirements as a result of our operation as a publicly traded REIT; changes in foreign currency exchange rates; the impact of anti-takeover provisions in our constituent documents and under Maryland law, which could make an acquisition of us more difficult, limit attempts by our shareholders to replace our directors and affect the price of our shares of common stock of beneficial interest, $0.01 par value per share; or the potential dilutive effect of our common stock offerings, including our ongoing at the market program. Words such as “anticipates,” “believes,” “continues,” “estimates,” “expects,” “goal,” “objectives,” “intends,” “may,” “opportunity,” “plans,” “potential,” “near-term,” “long-term,” “projections,” “assumptions,” “projects,” “guidance,” “forecasts,” “outlook,” “target,” “trends,” “should,” “could,” “would,” “will” and similar expressions are intended to identify such forward-looking statements, although not all forward-looking statements may contain such words. Examples of forward- looking statements included in this presentation include, among others, statements about our expected expansion and development pipeline and our targeted return on invested capital on expansion and development opportunities, statements about industry-wide headwinds and statements about the expected benefits, synergies, or returns from our joint venture transaction with EQT. We qualify any forward-looking statements entirely by these cautionary factors. Other risks, uncertainties and factors, including those discussed under “Risk Factors” in our Annual Report on Form 10-K for the year ended December 31, 2025, and our other reports filed with the Securities and Exchange Commission, could cause our actual results to differ materially from those projected in any forward-looking statements we make. We assume no obligation to update or revise these forward-looking statements for any reason, or to update the reasons actual results could differ materially from those anticipated in these forward-looking statements, even if new information becomes available, in the future, except to the extent required by law. Non-GAAP Measures This presentation contains non-GAAP financial measures, including NAREIT FFO, Core FFO, Adjusted FFO, NAREIT EBITDAre, Core EBITDA, Core EBITDA Margin, segment contribution (NOI) and margin, same store revenues and NOI, constant currency basis and maintenance capital expenditures. Definitions and reconciliations of these non-GAAP metrics to their most comparable GAAP metrics are included herein. Each of these non-GAAP measures included in this presentation has limitations as an analytical tool and should not be considered in isolation or as a substitute for an analysis of the Company's results calculated in accordance with GAAP. In addition, because not all companies use identical calculations, the Company's presentation of non-GAAP measures in this presentation may not be comparable to similarly titled measures disclosed by other companies, including other REITs. 2
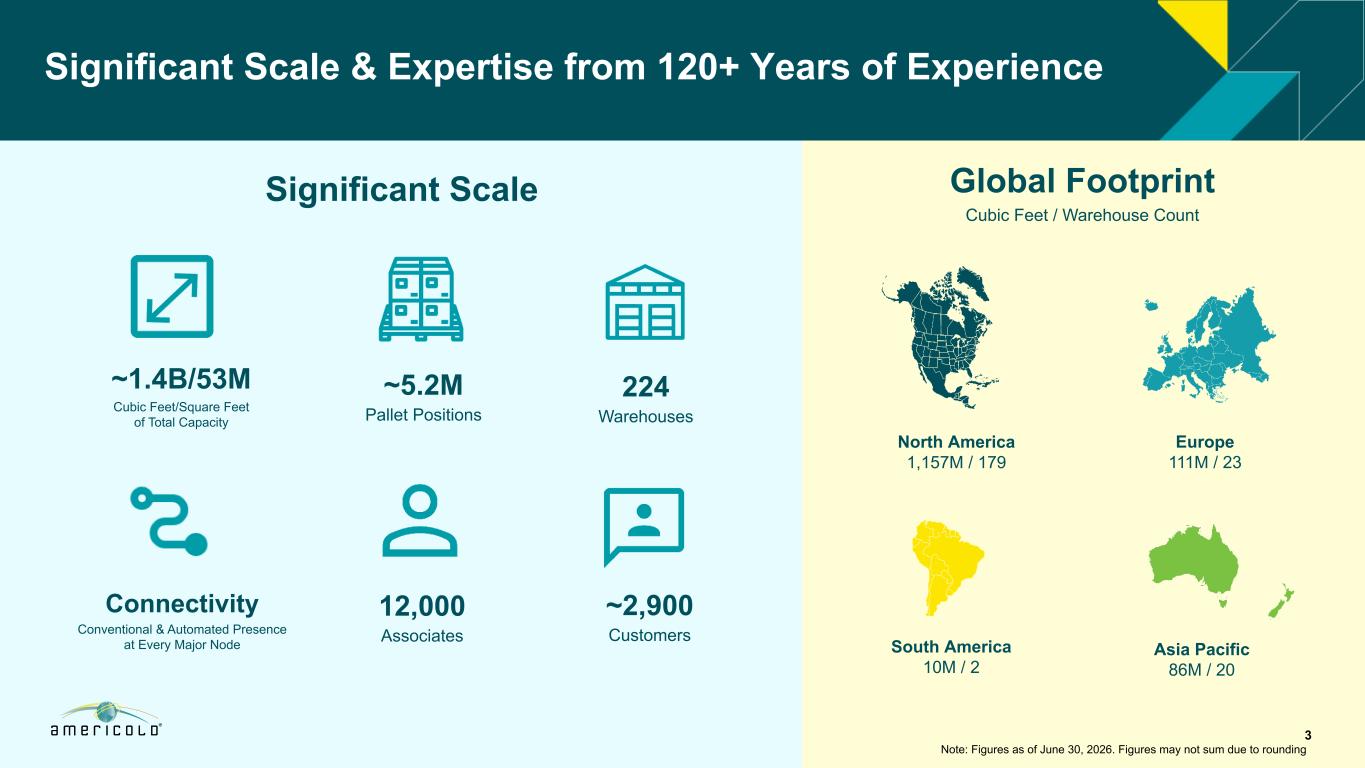
Significant Scale & Expertise from 120+ Years of Experience Significant Scale Global Footprint Cubic Feet / Warehouse Count North America 1,157M / 179 South America 10M / 2 Europe 111M / 23 Asia Pacific 86M / 20 Note: Figures as of June 30, 2026. Figures may not sum due to rounding ~5.2M Pallet Positions 224 Warehouses ~2,900 Customers 12,000 Associates ~1.4B/53M Cubic Feet/Square Feet of Total Capacity Connectivity Conventional & Automated Presence at Every Major Node 3
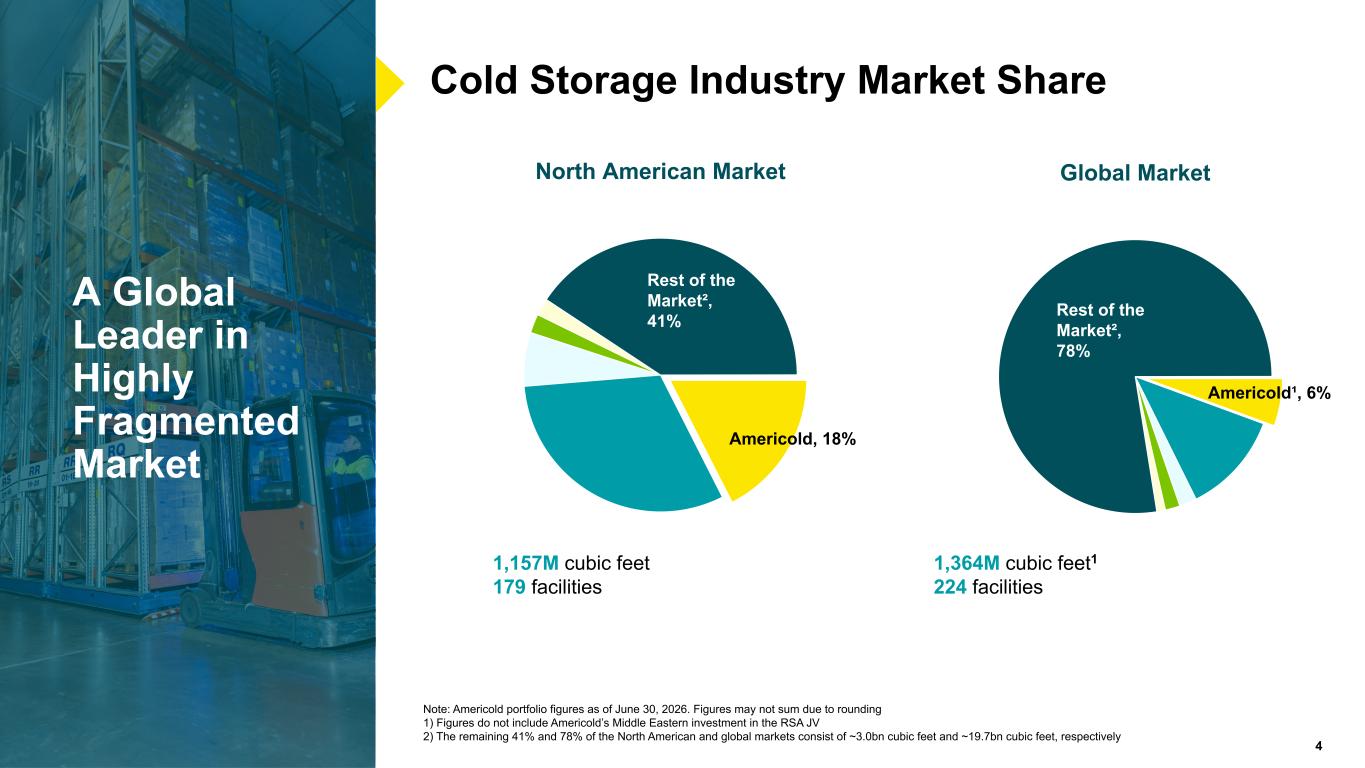
4 A Global Leader in Temperature- Controlled Warehousing Cold Storage Industry Market Share 1,157M cubic feet 179 facilities 1,364M cubic feet1 224 facilities Note: Americold portfolio figures as of June 30, 2026. Figures may not sum due to rounding 1) Figures do not include Americold’s Middle Eastern investment in the RSA JV 2) The remaining 41% and 78% of the North American and global markets consist of ~3.0bn cubic feet and ~19.7bn cubic feet, respectively A Global Leader in Highly Fragmented Market North American Market Americold, 18% Rest of the Market², 41% Global Market Americold¹, 6% Rest of the Market², 78% 4
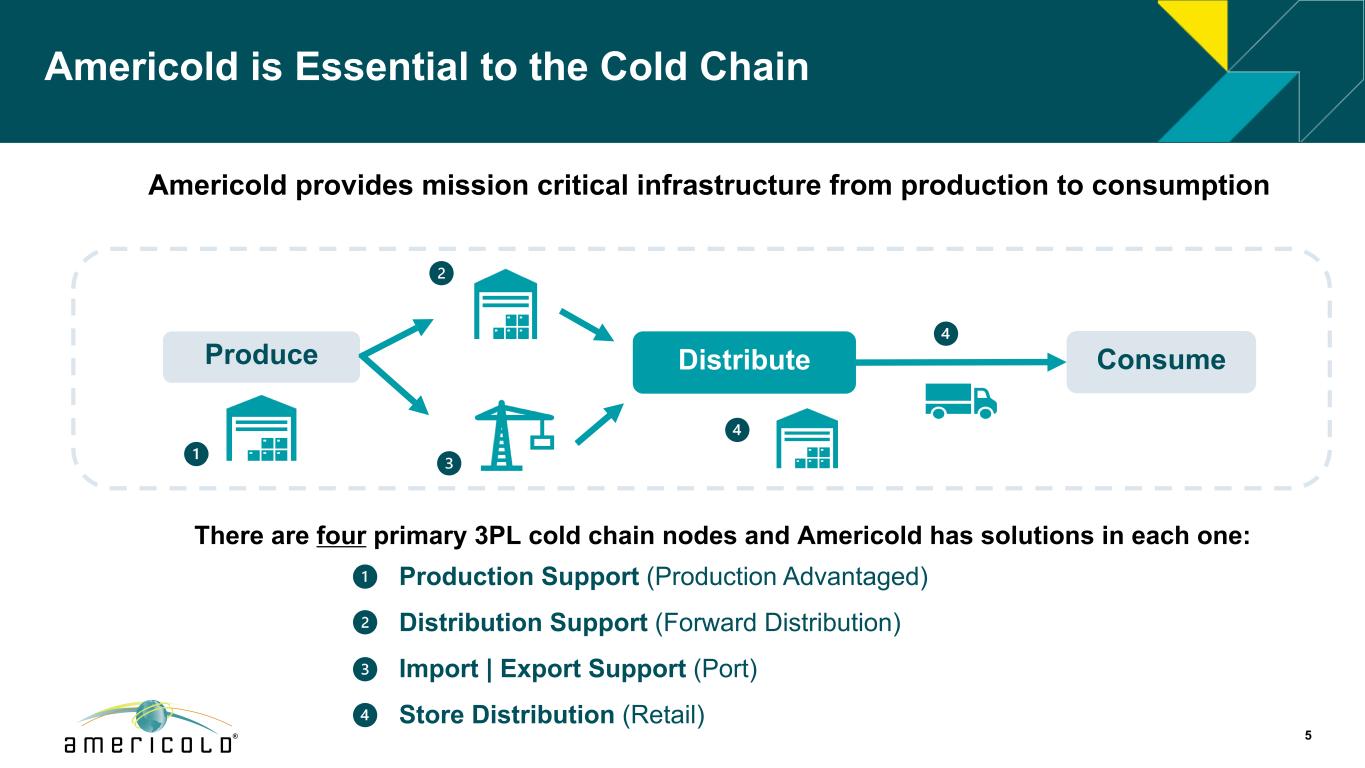
Americold is Essential to the Cold Chain There are four primary 3PL cold chain nodes and Americold has solutions in each one: Production Support (Production Advantaged) Distribution Support (Forward Distribution) Import | Export Support (Port) Store Distribution (Retail) Americold provides mission critical infrastructure from production to consumption Produce Distribute Consume 5
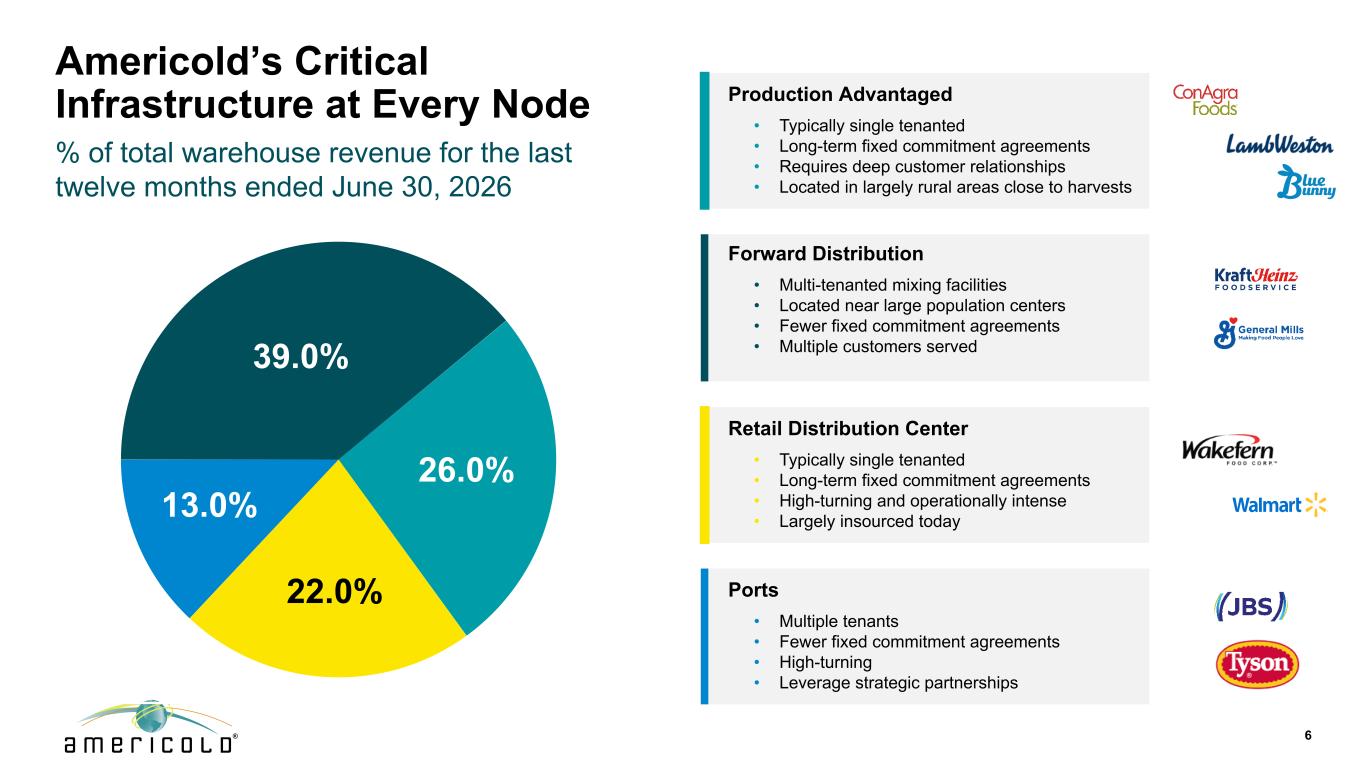
Americold’s Critical Infrastructure at Every Node % of total warehouse revenue for the last twelve months ended June 30, 2026 6 48% 14% 25% Forward Distribution • Multi-tenanted mixing facilities • Located near large population centers • Fewer fixed commitment agreements • Multiple customers served Retail Distribution Center • Typically single tenanted • Long-term fixed commitment agreements • High-turning and operationally intense • Largely insourced today Ports • Multiple tenants • Fewer fixed commitment agreements • High-turning • Leverage strategic partnerships Production Advantaged • Typically single tenanted • Long-term fixed commitment agreements • Requires deep customer relationships • Located in largely rural areas close to harvests 39.0% 26.0% 22.0% 13.0%
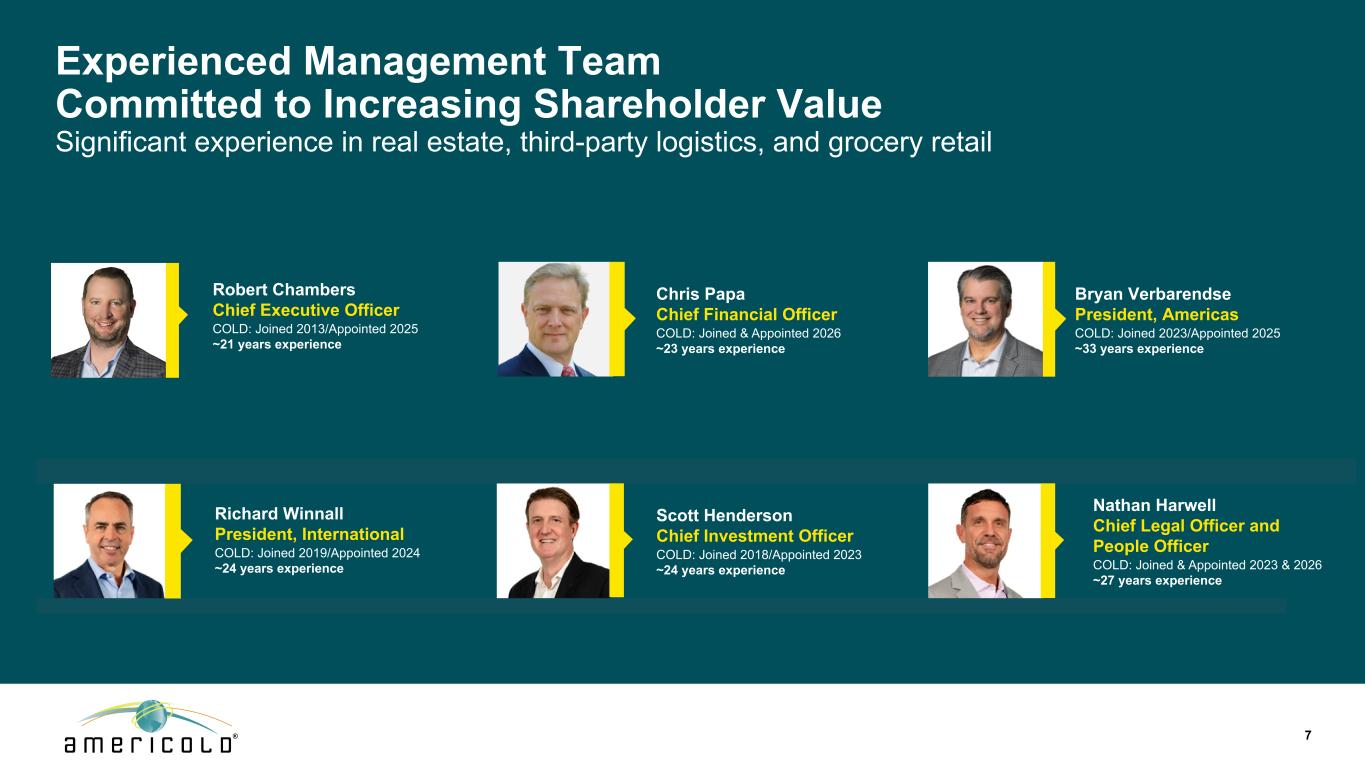
Bryan Verbarendse President, Americas COLD: Joined 2023/Appointed 2025 ~33 years experience Nathan Harwell Chief Legal Officer and People Officer COLD: Joined & Appointed 2023 & 2026 ~27 years experience Experienced Management Team Committed to Increasing Shareholder Value Significant experience in real estate, third-party logistics, and grocery retail Robert Chambers Chief Executive Officer COLD: Joined 2013/Appointed 2025 ~21 years experience Chris Papa Chief Financial Officer COLD: Joined & Appointed 2026 ~23 years experience Richard Winnall President, International COLD: Joined 2019/Appointed 2024 ~24 years experience Scott Henderson Chief Investment Officer COLD: Joined 2018/Appointed 2023 ~24 years experience 7
2026 Key Priorities Strong Organizational Alignment with a Focus on Execution 8 • Strategic capital management to de-lever balance sheet and maintain investment grade profile • Creating value from our real estate through active portfolio management of low profit facilities, NNN leasing of space to tenants, and/or non-strategic asset sales • Driving organic growth by leveraging COLD’s advantages in under-penetrated sectors, such as retail, QSR, convenience, e-commerce, pet food, floral, pharmacy, and more • Limiting inorganic growth to lower-risk projects, such as customer-dedicated, partnership-driven, and international until leverage is reduced • Continued rightsizing of our cost structure - Leverage prior investments in technology and labor to streamline workflows for a more cost-efficient overhead model
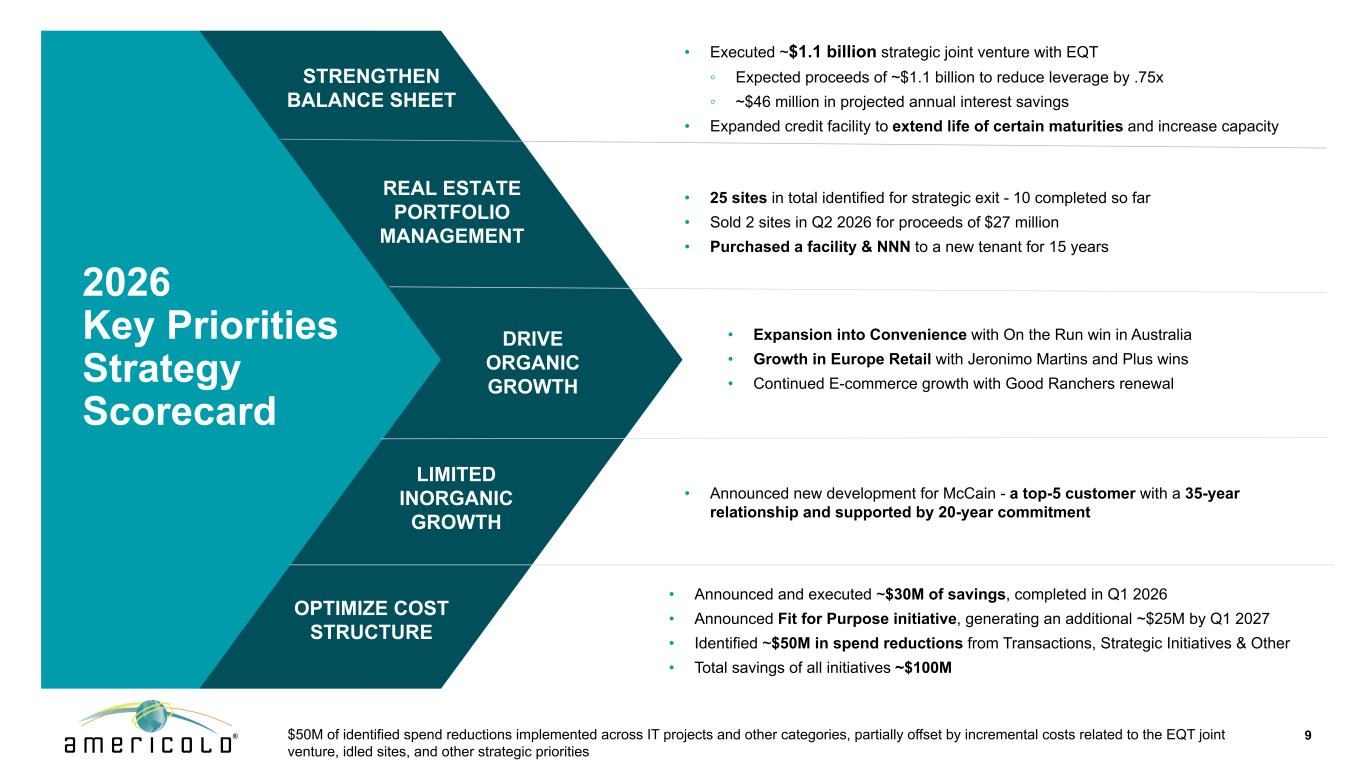
9 2026 Key Priorities Strategy Scorecard STRENGTHEN BALANCE SHEET • Executed ~$1.1 billion strategic joint venture with EQT ◦ Expected proceeds of ~$1.1 billion to reduce leverage by .75x ◦ ~$46 million in projected annual interest savings • Expanded credit facility to extend life of certain maturities and increase capacity DRIVE ORGANIC GROWTH • Expansion into Convenience with On the Run win in Australia • Growth in Europe Retail with Jeronimo Martins and Plus wins • Continued E-commerce growth with Good Ranchers renewal REAL ESTATE PORTFOLIO MANAGEMENT • 25 sites in total identified for strategic exit - 10 completed so far • Sold 2 sites in Q2 2026 for proceeds of $27 million • Purchased a facility & NNN to a new tenant for 15 years OPTIMIZE COST STRUCTURE • Announced and executed ~$30M of savings, completed in Q1 2026 • Announced Fit for Purpose initiative, generating an additional ~$25M by Q1 2027 • Identified ~$50M in spend reductions from Transactions, Strategic Initiatives & Other • Total savings of all initiatives ~$100M LIMITED INORGANIC GROWTH • Announced new development for McCain - a top-5 customer with a 35-year relationship and supported by 20-year commitment $50M of identified spend reductions implemented across IT projects and other categories, partially offset by incremental costs related to the EQT joint venture, idled sites, and other strategic priorities

10 1. Strategic Capital Management
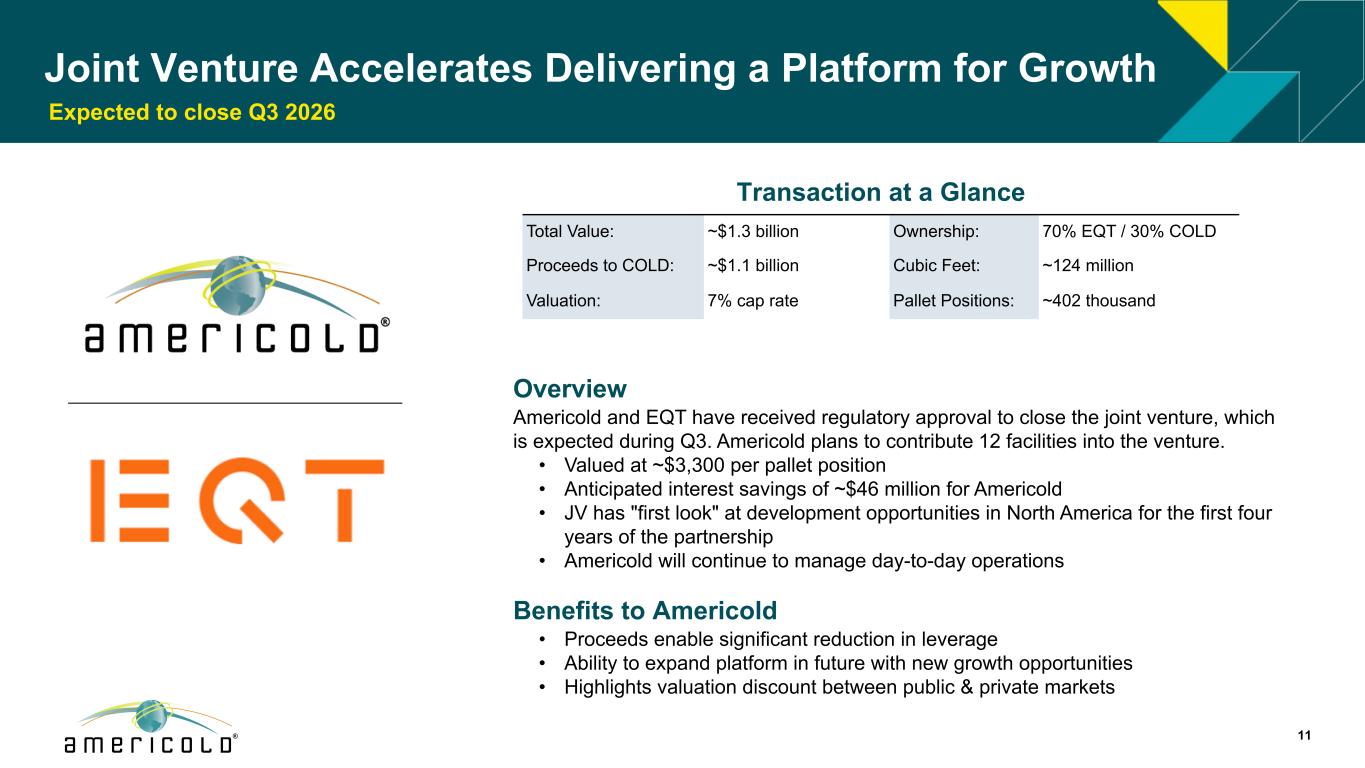
Joint Venture Accelerates Delivering a Platform for Growth 11 Overview Americold and EQT have received regulatory approval to close the joint venture, which is expected during Q3. Americold plans to contribute 12 facilities into the venture. • Valued at ~$3,300 per pallet position • Anticipated interest savings of ~$46 million for Americold • JV has "first look" at development opportunities in North America for the first four years of the partnership • Americold will continue to manage day-to-day operations Benefits to Americold • Proceeds enable significant reduction in leverage • Ability to expand platform in future with new growth opportunities • Highlights valuation discount between public & private markets Transaction at a Glance Total Value: ~$1.3 billion Ownership: 70% EQT / 30% COLD Proceeds to COLD: ~$1.1 billion Cubic Feet: ~124 million Valuation: 7% cap rate Pallet Positions: ~402 thousand Expected to close Q3 2026
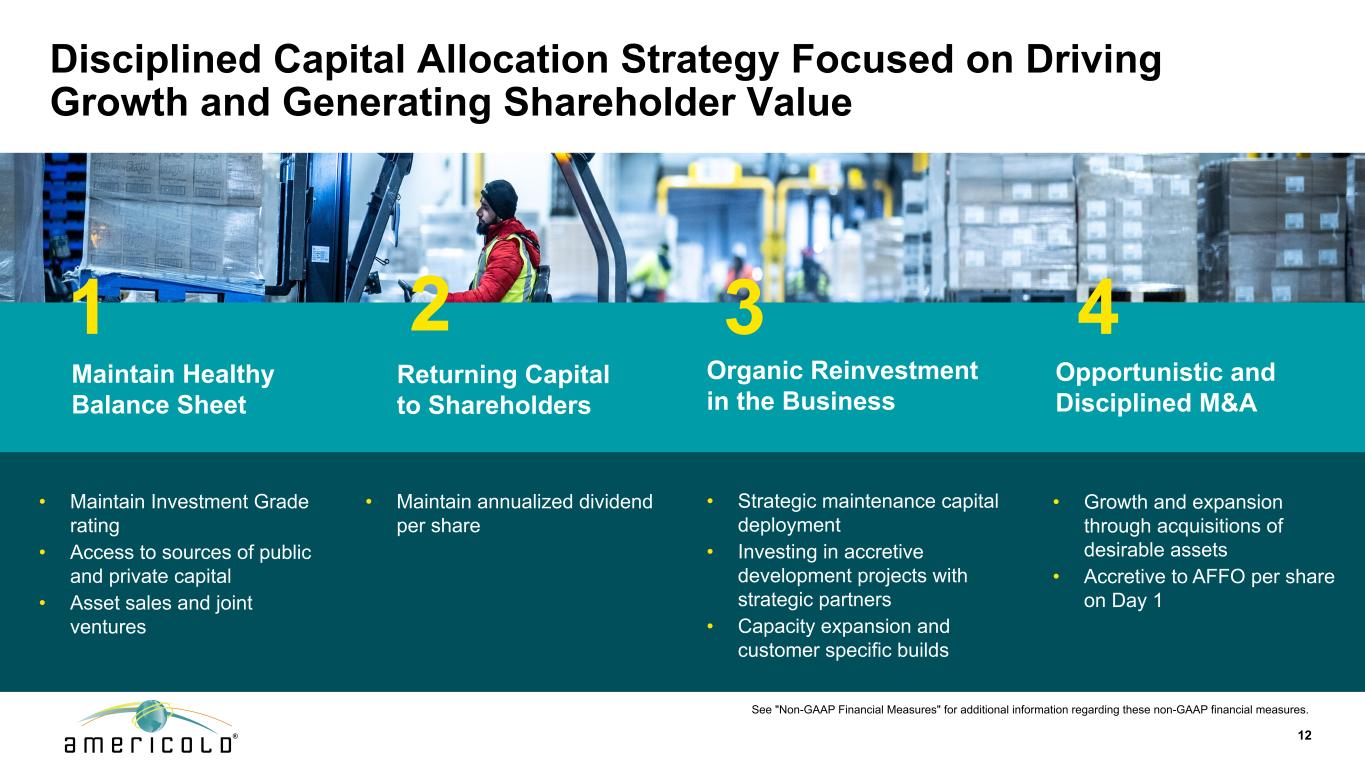
Disciplined Capital Allocation Strategy Focused on Driving Growth and Generating Shareholder Value Organic Reinvestment in the Business Returning Capital to Shareholders Opportunistic and Disciplined M&A • Maintain annualized dividend per share • Growth and expansion through acquisitions of desirable assets • Accretive to AFFO per share on Day 1 • Strategic maintenance capital deployment • Investing in accretive development projects with strategic partners • Capacity expansion and customer specific builds Maintain Healthy Balance Sheet 1 42 3 • Maintain Investment Grade rating • Access to sources of public and private capital • Asset sales and joint ventures 12 See "Non-GAAP Financial Measures" for additional information regarding these non-GAAP financial measures.
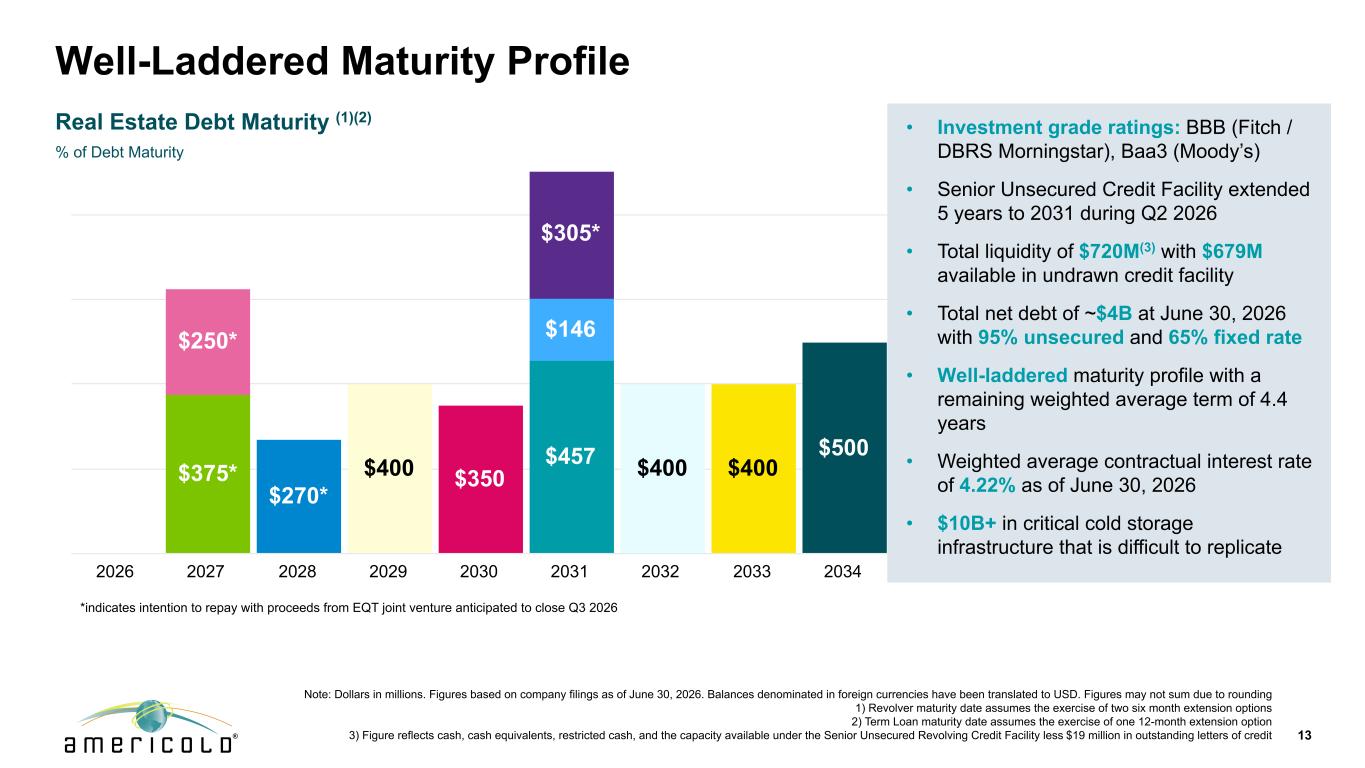
Well-Laddered Maturity Profile Note: Dollars in millions. Figures based on company filings as of June 30, 2026. Balances denominated in foreign currencies have been translated to USD. Figures may not sum due to rounding 1) Revolver maturity date assumes the exercise of two six month extension options 2) Term Loan maturity date assumes the exercise of one 12-month extension option 3) Figure reflects cash, cash equivalents, restricted cash, and the capacity available under the Senior Unsecured Revolving Credit Facility less $19 million in outstanding letters of credit 13 Real Estate Debt Maturity (1)(2) % of Debt Maturity • Investment grade ratings: BBB (Fitch / DBRS Morningstar), Baa3 (Moody’s) • Senior Unsecured Credit Facility extended 5 years to 2031 during Q2 2026 • Total liquidity of $720M(3) with $679M available in undrawn credit facility • Total net debt of ~$4B at June 30, 2026 with 95% unsecured and 65% fixed rate • Well-laddered maturity profile with a remaining weighted average term of 4.4 years • Weighted average contractual interest rate of 4.22% as of June 30, 2026 • $10B+ in critical cold storage infrastructure that is difficult to replicate $375* $270* $400 $350 $457 $400 $400 $500 $250* $146 $305* 2026 2027 2028 2029 2030 2031 2032 2033 2034 *indicates intention to repay with proceeds from EQT joint venture anticipated to close Q3 2026

14 2. Create Value from Real Estate
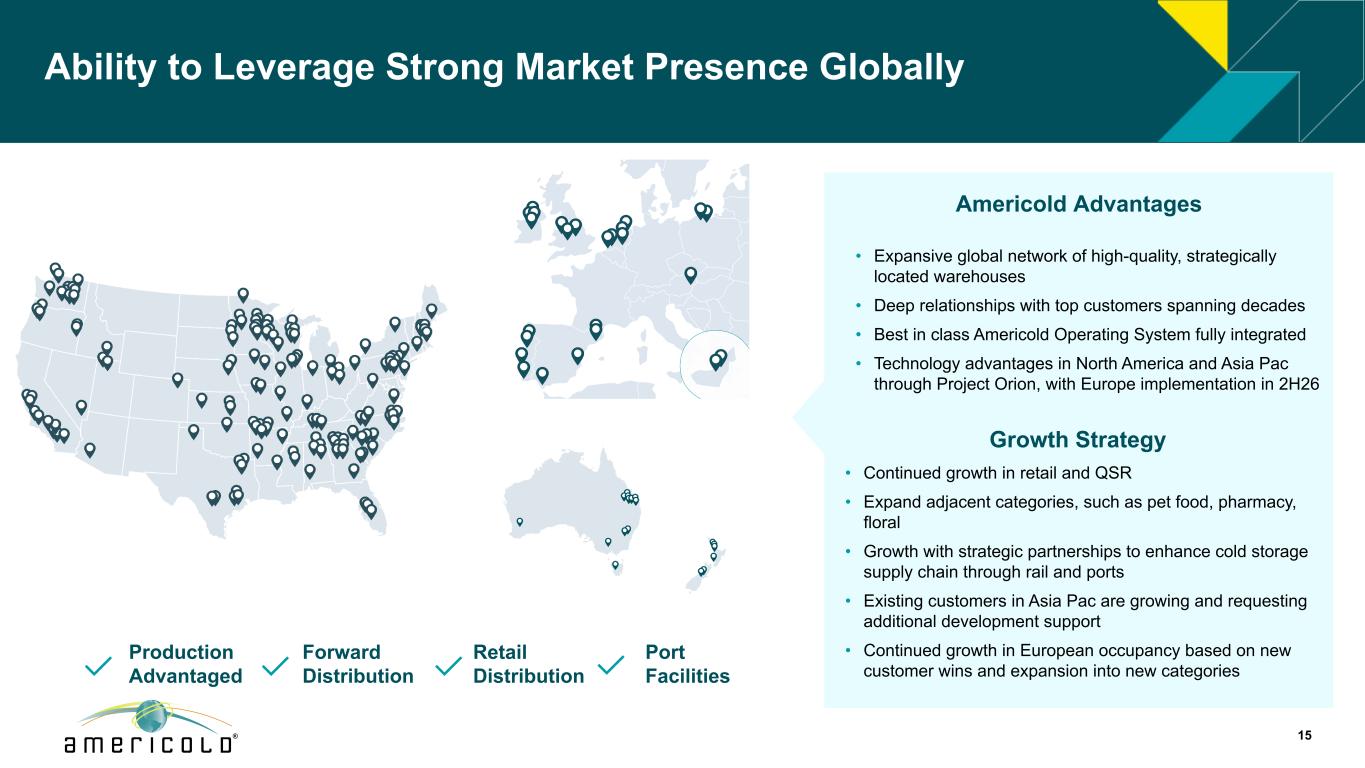
Ability to Leverage Strong Market Presence Globally Production Advantaged Forward Distribution Retail Distribution Port Facilities Americold Advantages • Continued growth in retail and QSR • Expand adjacent categories, such as pet food, pharmacy, floral • Growth with strategic partnerships to enhance cold storage supply chain through rail and ports • Existing customers in Asia Pac are growing and requesting additional development support • Continued growth in European occupancy based on new customer wins and expansion into new categories • Expansive global network of high-quality, strategically located warehouses • Deep relationships with top customers spanning decades • Best in class Americold Operating System fully integrated • Technology advantages in North America and Asia Pac through Project Orion, with Europe implementation in 2H26 Growth Strategy 15
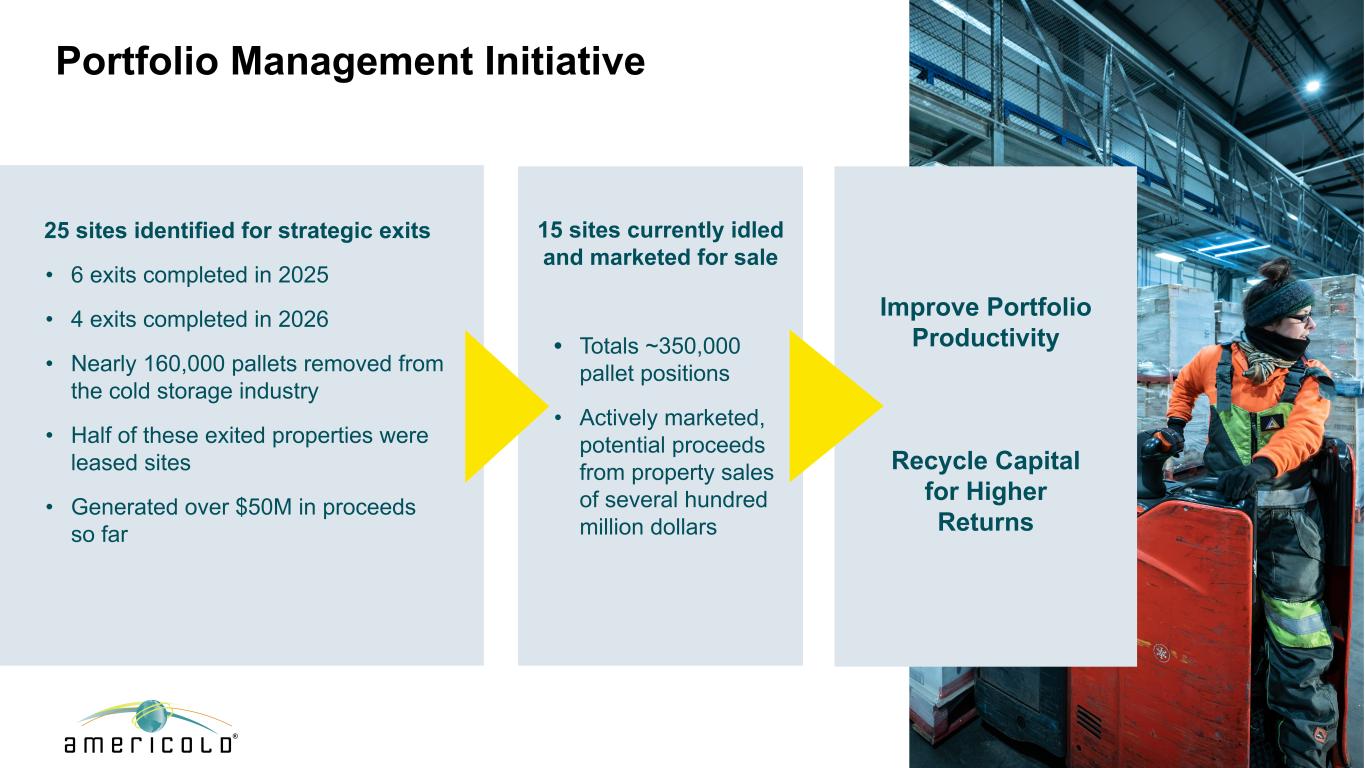
15 sites currently idled and marketed for sale • Totals ~350,000 pallet positions • Actively marketed, potential proceeds from property sales of several hundred million dollars Portfolio Management Initiative 16 Improve Portfolio Productivity Recycle Capital for Higher Returns 25 sites identified for strategic exits • 6 exits completed in 2025 • 4 exits completed in 2026 • Nearly 160,000 pallets removed from the cold storage industry • Half of these exited properties were leased sites • Generated over $50M in proceeds so far

17 3. Drive Organic Growth
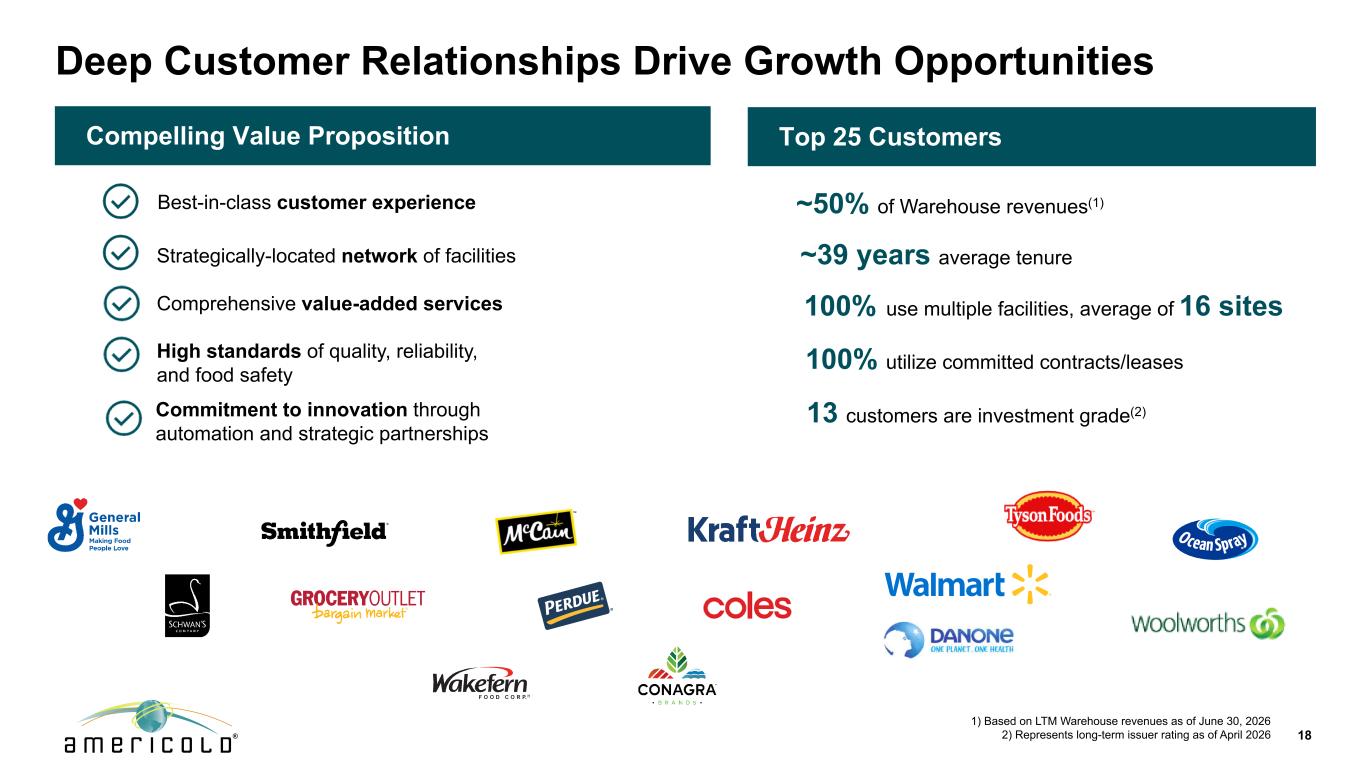
Deep Customer Relationships Drive Growth Opportunities Strategically-located network of facilities Comprehensive value-added services Top 25 Customers Best-in-class customer experience High standards of quality, reliability, and food safety Commitment to innovation through automation and strategic partnerships 18 ~39 years average tenure 13 customers are investment grade(2) 100% utilize committed contracts/leases ~50% of Warehouse revenues(1) 1) Based on LTM Warehouse revenues as of June 30, 2026 2) Represents long-term issuer rating as of April 2026 Compelling Value Proposition 100% use multiple facilities, average of 16 sites
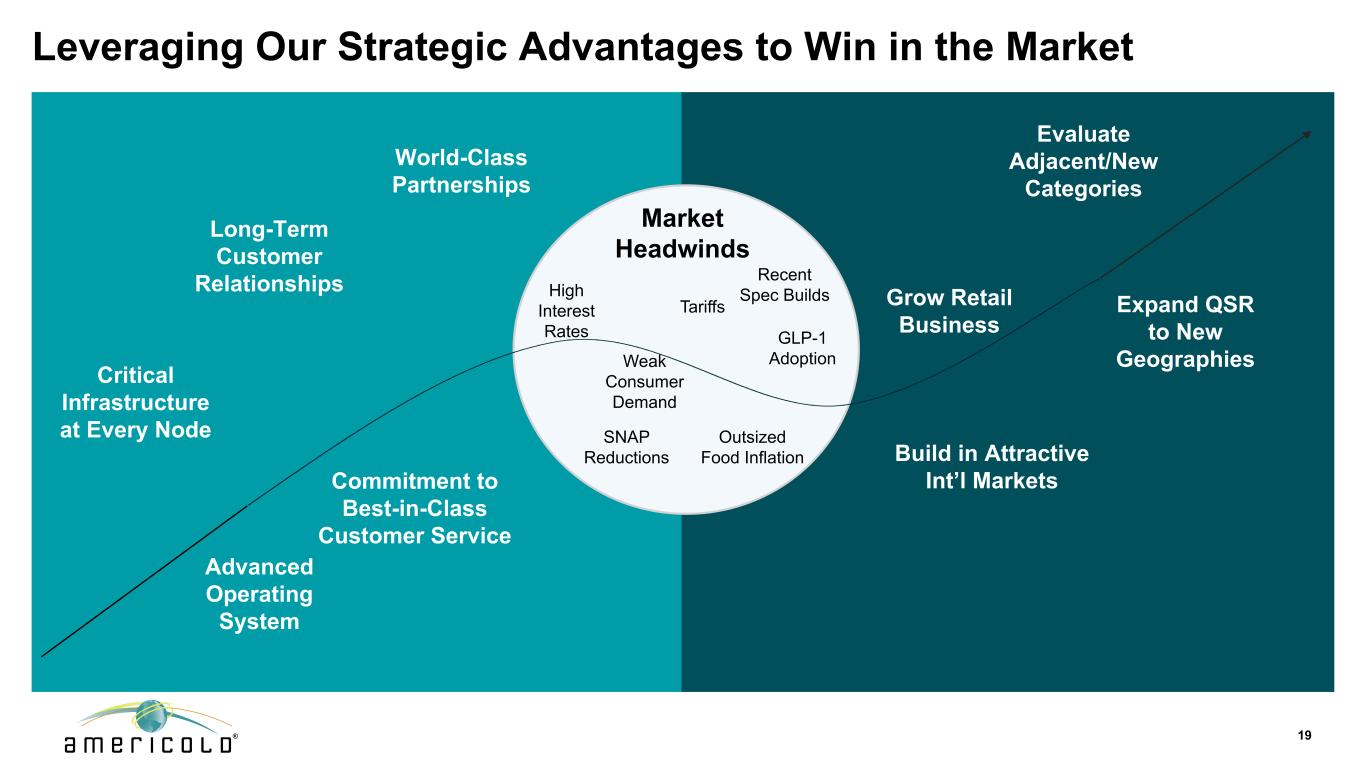
Leveraging Our Strategic Advantages to Win in the Market Market Headwinds Weak Consumer Demand Tariffs High Interest Rates GLP-1 Adoption Outsized Food Inflation Recent Spec Builds SNAP Reductions Critical Infrastructure at Every Node Advanced Operating System Commitment to Best-in-Class Customer Service Long-Term Customer Relationships World-Class Partnerships Expand QSR to New Geographies Build in Attractive Int’l Markets Grow Retail Business Evaluate Adjacent/New Categories 19
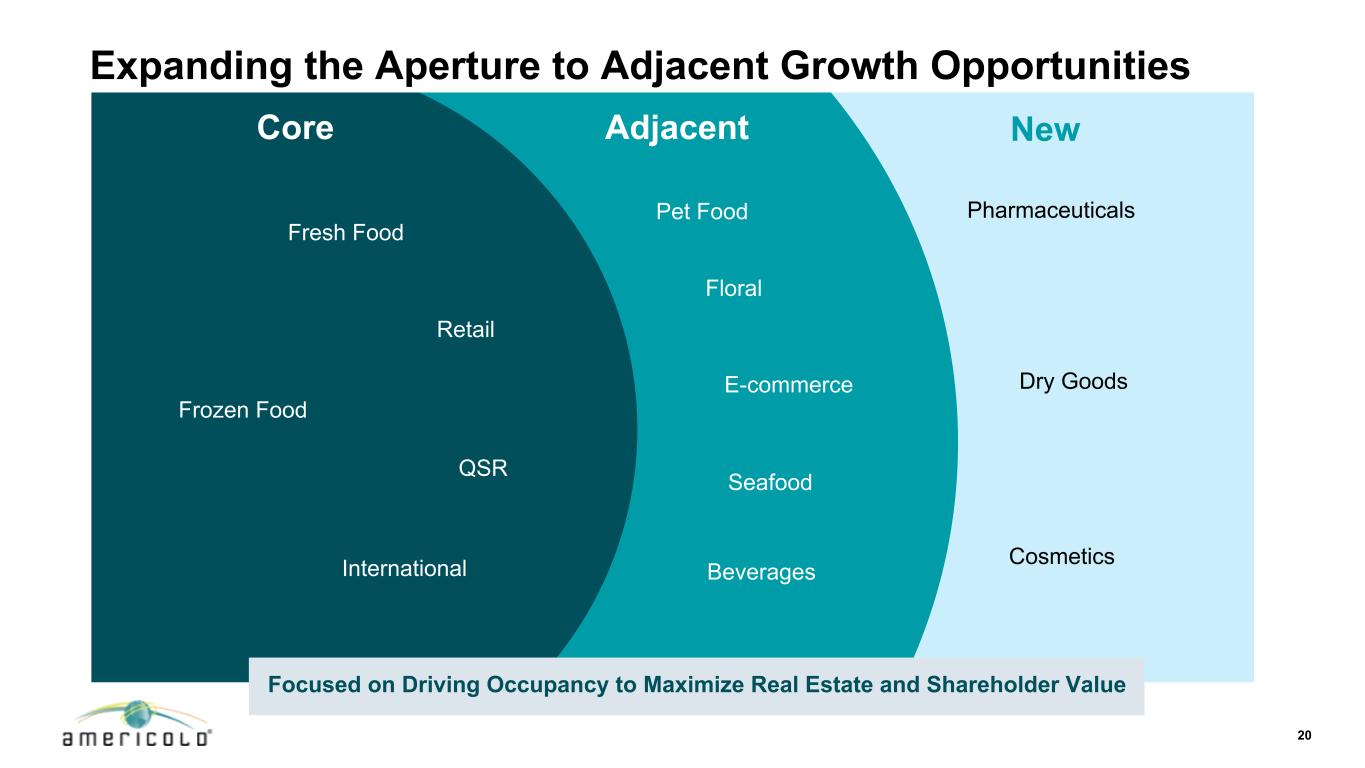
Frozen Food Pharmaceuticals Fresh Food Retail QSR International Pet Food Floral Seafood Beverages Expanding the Aperture to Adjacent Growth Opportunities Dry Goods Cosmetics E-commerce Core Adjacent New 20 Focused on Driving Occupancy to Maximize Real Estate and Shareholder Value
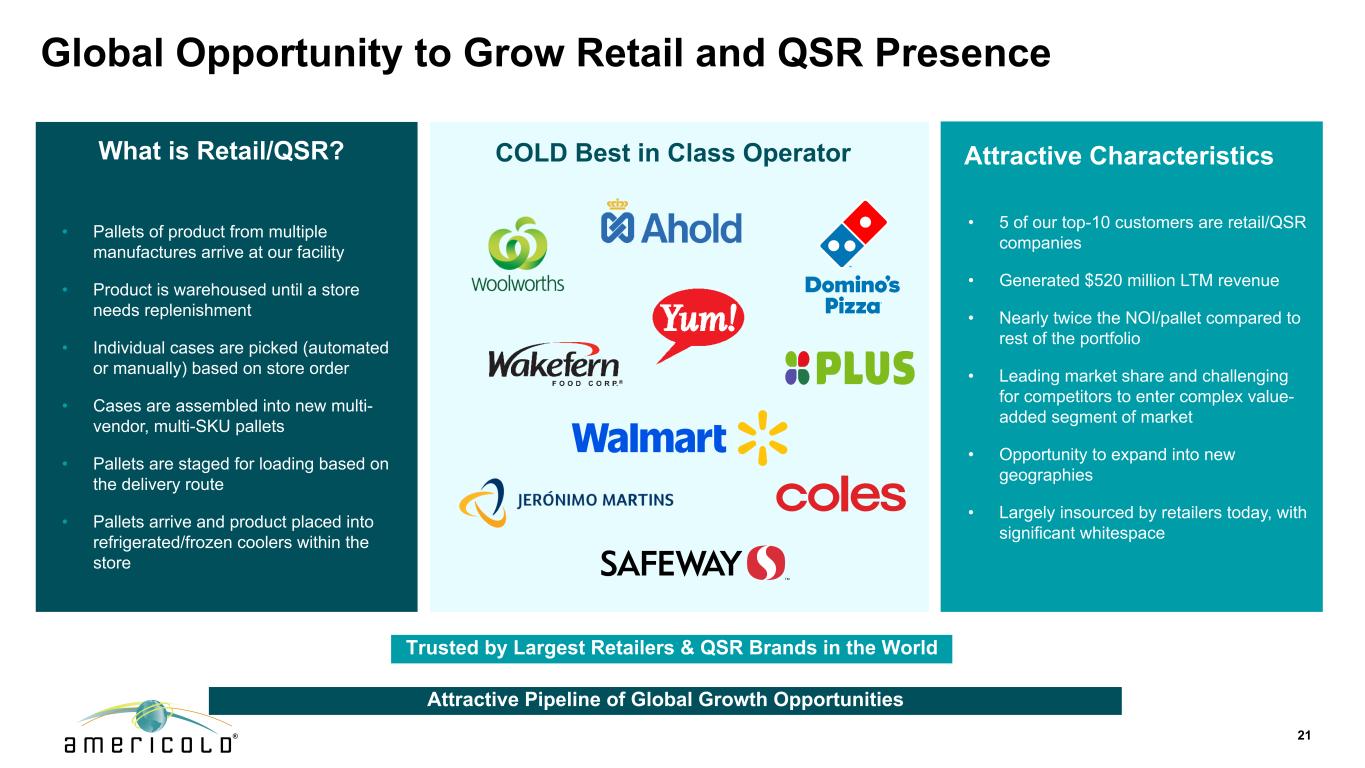
Global Opportunity to Grow Retail and QSR Presence COLD Best in Class Operator Trusted by Largest Retailers & QSR Brands in the World What is Retail/QSR? • Pallets of product from multiple manufactures arrive at our facility • Product is warehoused until a store needs replenishment • Individual cases are picked (automated or manually) based on store order • Cases are assembled into new multi- vendor, multi-SKU pallets • Pallets are staged for loading based on the delivery route • Pallets arrive and product placed into refrigerated/frozen coolers within the store Attractive Characteristics • 5 of our top-10 customers are retail/QSR companies • Generated $520 million LTM revenue • Nearly twice the NOI/pallet compared to rest of the portfolio • Leading market share and challenging for competitors to enter complex value- added segment of market • Opportunity to expand into new geographies • Largely insourced by retailers today, with significant whitespace 21 Attractive Pipeline of Global Growth Opportunities

22 4. Pursue Lower- Risk Projects
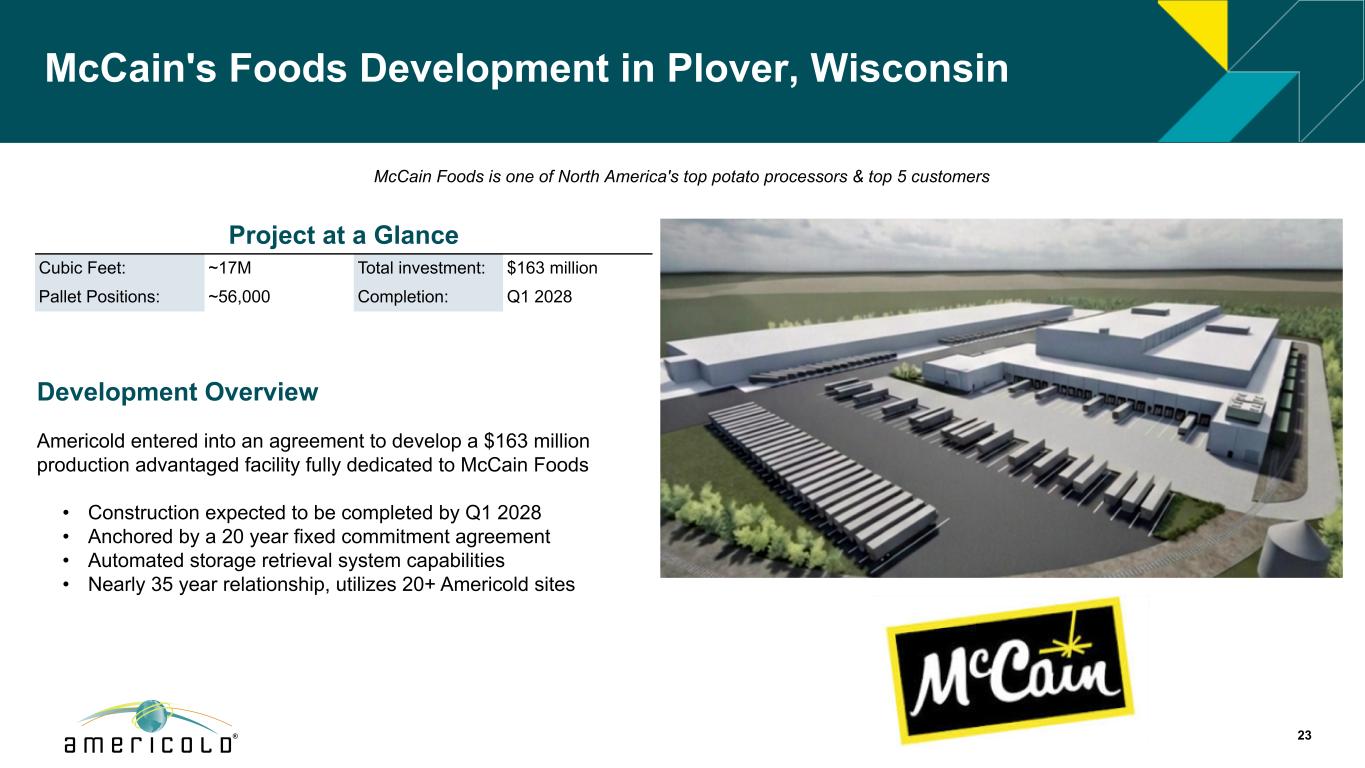
McCain's Foods Development in Plover, Wisconsin 23 McCain Foods is one of North America's top potato processors & top 5 customers Development Overview Americold entered into an agreement to develop a $163 million production advantaged facility fully dedicated to McCain Foods • Construction expected to be completed by Q1 2028 • Anchored by a 20 year fixed commitment agreement • Automated storage retrieval system capabilities • Nearly 35 year relationship, utilizes 20+ Americold sites Project at a Glance Cubic Feet: ~17M Total investment: $163 million Pallet Positions: ~56,000 Completion: Q1 2028
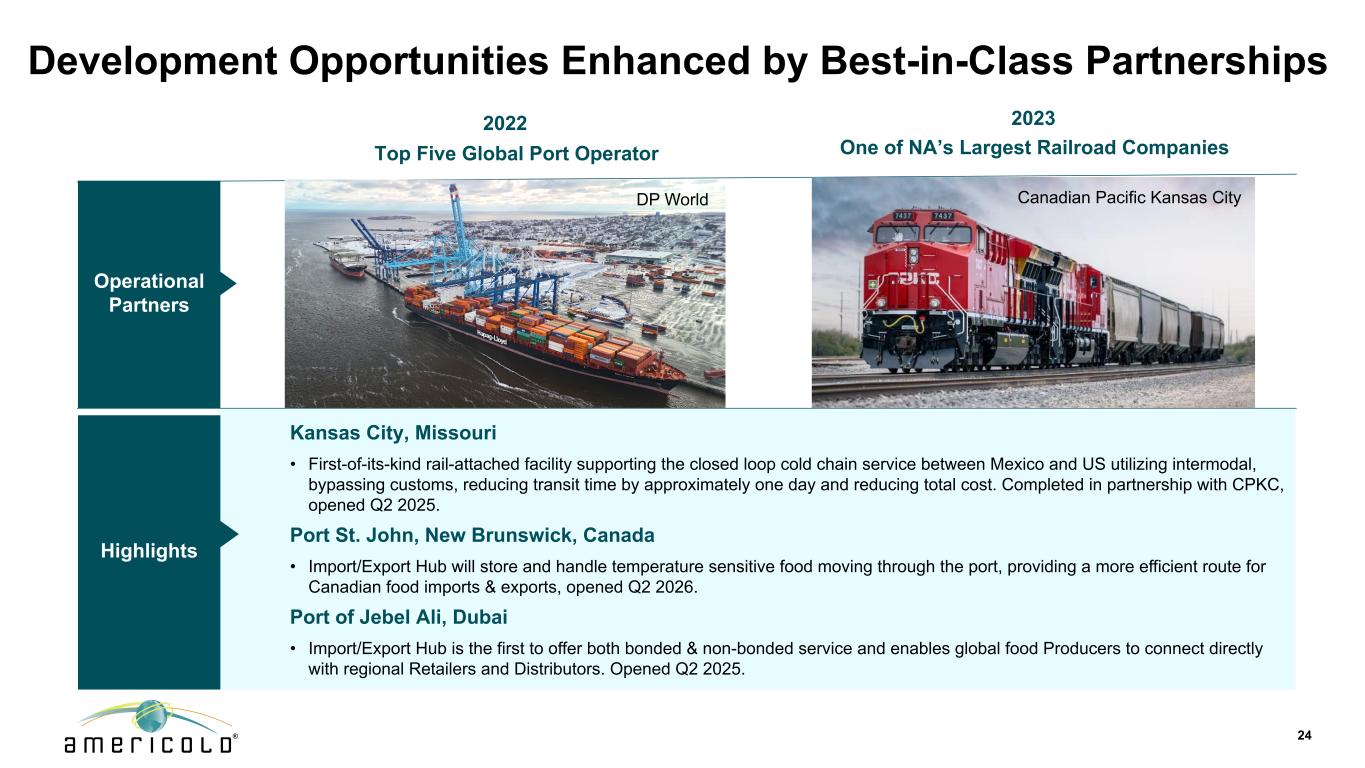
Operational Partners Development Opportunities Enhanced by Best-in-Class Partnerships 24 Kansas City, Missouri • First-of-its-kind rail-attached facility supporting the closed loop cold chain service between Mexico and US utilizing intermodal, bypassing customs, reducing transit time by approximately one day and reducing total cost. Completed in partnership with CPKC, opened Q2 2025. Port St. John, New Brunswick, Canada • Import/Export Hub will store and handle temperature sensitive food moving through the port, providing a more efficient route for Canadian food imports & exports, opened Q2 2026. Port of Jebel Ali, Dubai • Import/Export Hub is the first to offer both bonded & non-bonded service and enables global food Producers to connect directly with regional Retailers and Distributors. Opened Q2 2025. Highlights Top Five Global Port Operator 2022 One of NA’s Largest Railroad Companies 2023 DP World Canadian Pacific Kansas City

25 5. Rightsize Cost Structure
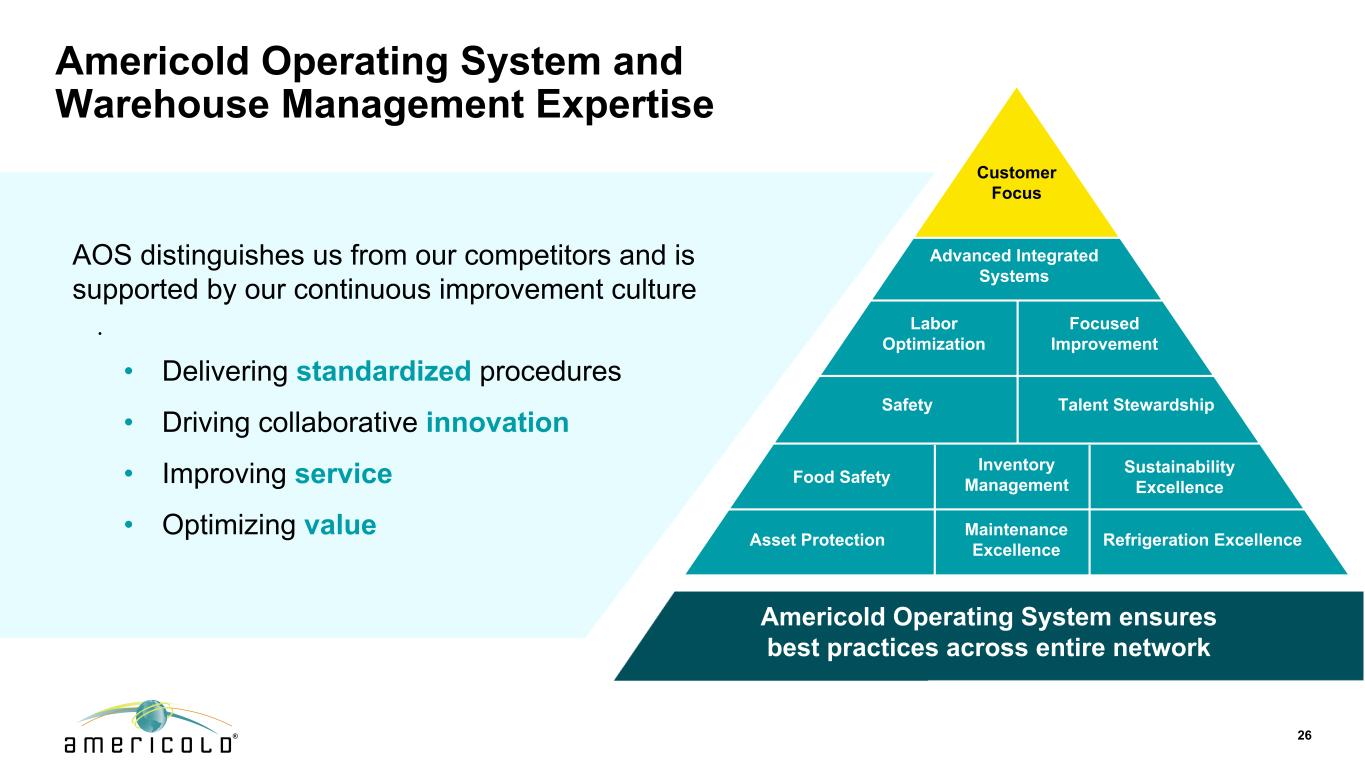
Americold Operating System and Warehouse Management Expertise Americold Operating System ensures best practices across entire network 26 Customer Focus Labor Optimization Focused Improvement Safety Talent Stewardship Food Safety Asset Protection Inventory Management Sustainability Excellence Refrigeration Excellence Advanced Integrated Systems Maintenance Excellence AOS distinguishes us from our competitors and is supported by our continuous improvement culture • • Delivering standardized procedures • Driving collaborative innovation • Improving service • Optimizing value
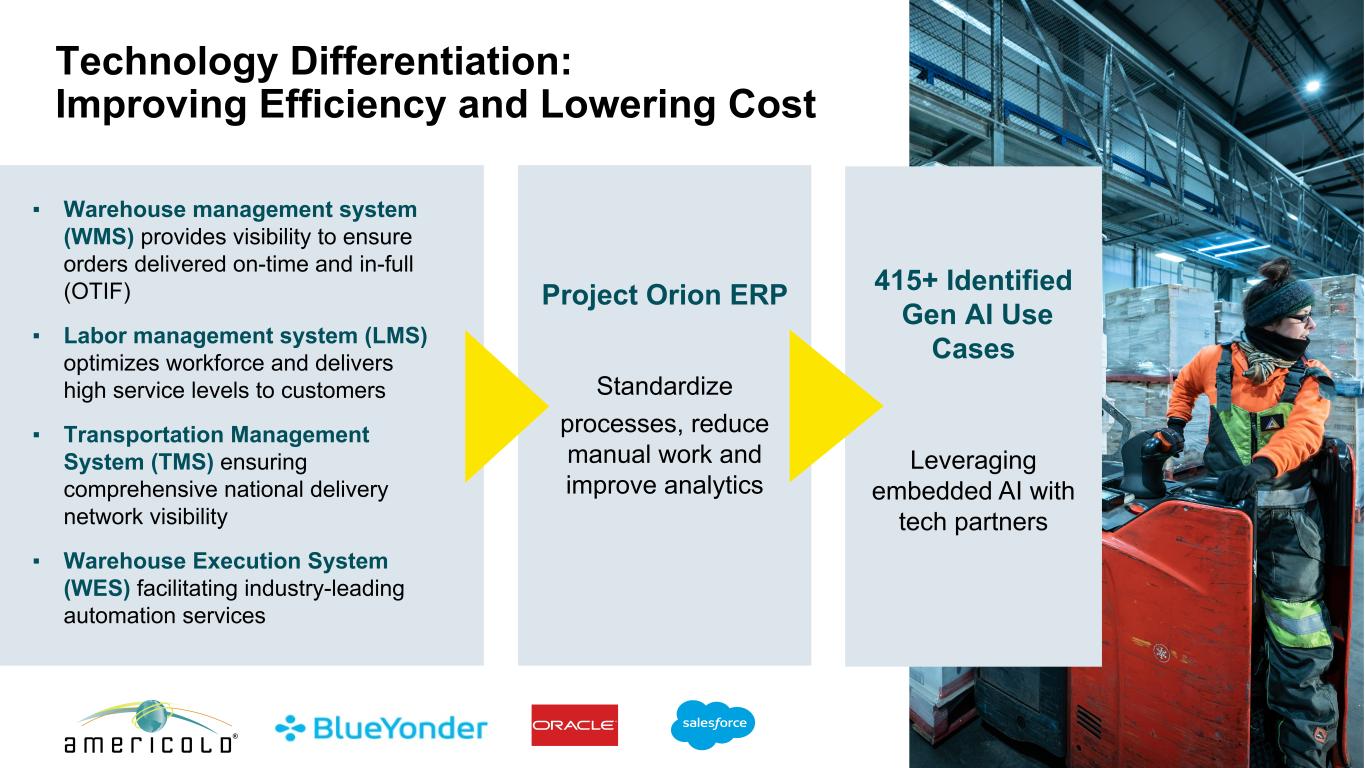
Technology Differentiation: Improving Efficiency and Lowering Cost 27 Project Orion ERP Standardize processes, reduce manual work and improve analytics ▪ Warehouse management system (WMS) provides visibility to ensure orders delivered on-time and in-full (OTIF) ▪ Labor management system (LMS) optimizes workforce and delivers high service levels to customers ▪ Transportation Management System (TMS) ensuring comprehensive national delivery network visibility ▪ Warehouse Execution System (WES) facilitating industry-leading automation services 415+ Identified Gen AI Use Cases Leveraging embedded AI with tech partners
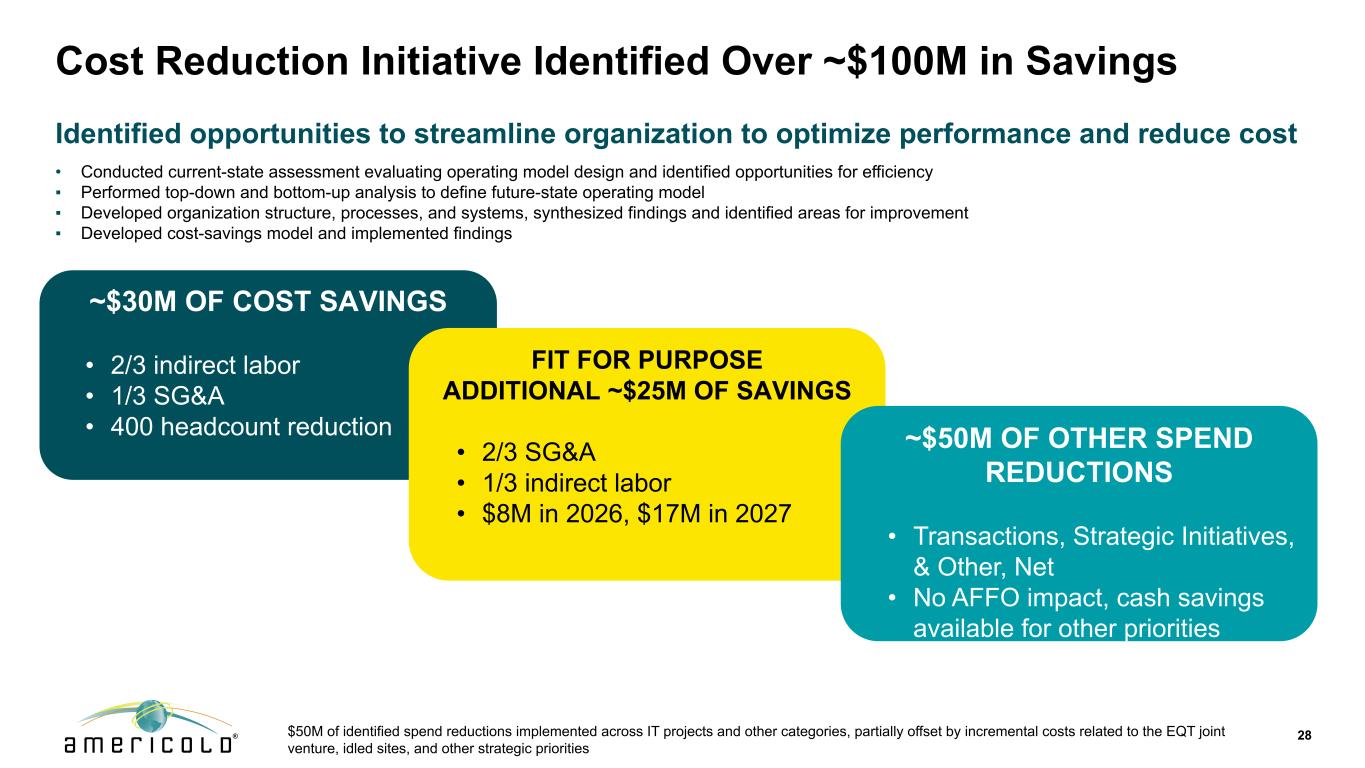
28 Cost Reduction Initiative Identified Over ~$100M in Savings ~$30M OF COST SAVINGS • 2/3 indirect labor • 1/3 SG&A • 400 headcount reduction FIT FOR PURPOSE ADDITIONAL ~$25M OF SAVINGS • 2/3 SG&A • 1/3 indirect labor • $8M in 2026, $17M in 2027 ~$50M OF OTHER SPEND REDUCTIONS • Transactions, Strategic Initiatives, & Other, Net • No AFFO impact, cash savings available for other priorities Identified opportunities to streamline organization to optimize performance and reduce cost • Conducted current-state assessment evaluating operating model design and identified opportunities for efficiency ▪ Performed top-down and bottom-up analysis to define future-state operating model ▪ Developed organization structure, processes, and systems, synthesized findings and identified areas for improvement ▪ Developed cost-savings model and implemented findings $50M of identified spend reductions implemented across IT projects and other categories, partially offset by incremental costs related to the EQT joint venture, idled sites, and other strategic priorities
29 6. Financial Performance
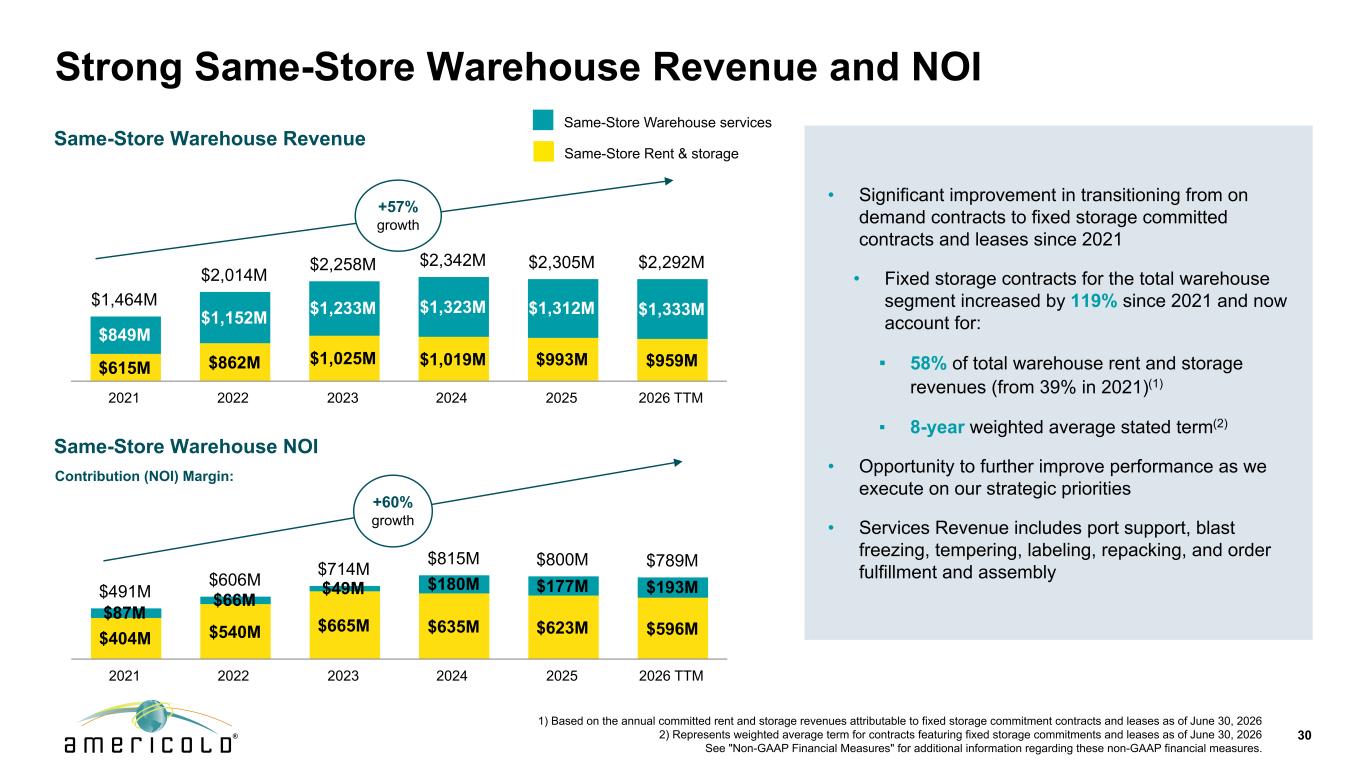
Strong Same-Store Warehouse Revenue and NOI 30 1) Based on the annual committed rent and storage revenues attributable to fixed storage commitment contracts and leases as of June 30, 2026 2) Represents weighted average term for contracts featuring fixed storage commitments and leases as of June 30, 2026 See "Non-GAAP Financial Measures" for additional information regarding these non-GAAP financial measures. • Significant improvement in transitioning from on demand contracts to fixed storage committed contracts and leases since 2021 • Fixed storage contracts for the total warehouse segment increased by 119% since 2021 and now account for: ▪ 58% of total warehouse rent and storage revenues (from 39% in 2021)(1) ▪ 8-year weighted average stated term(2) • Opportunity to further improve performance as we execute on our strategic priorities • Services Revenue includes port support, blast freezing, tempering, labeling, repacking, and order fulfillment and assembly Same-Store Warehouse Revenue Same-Store Warehouse NOI Contribution (NOI) Margin: Same-Store Warehouse services Same-Store Rent & storage $1,464M $2,014M $2,258M $2,342M $2,305M $2,292M $615M $862M $1,025M $1,019M $993M $959M $849M $1,152M $1,233M $1,323M $1,312M $1,333M 2021 2022 2023 2024 2025 2026 TTM +57% growth $491M $606M $714M $815M $800M $789M $404M $540M $665M $635M $623M $596M $87M $66M $49M $180M $177M $193M 2021 2022 2023 2024 2025 2026 TTM +60% growth
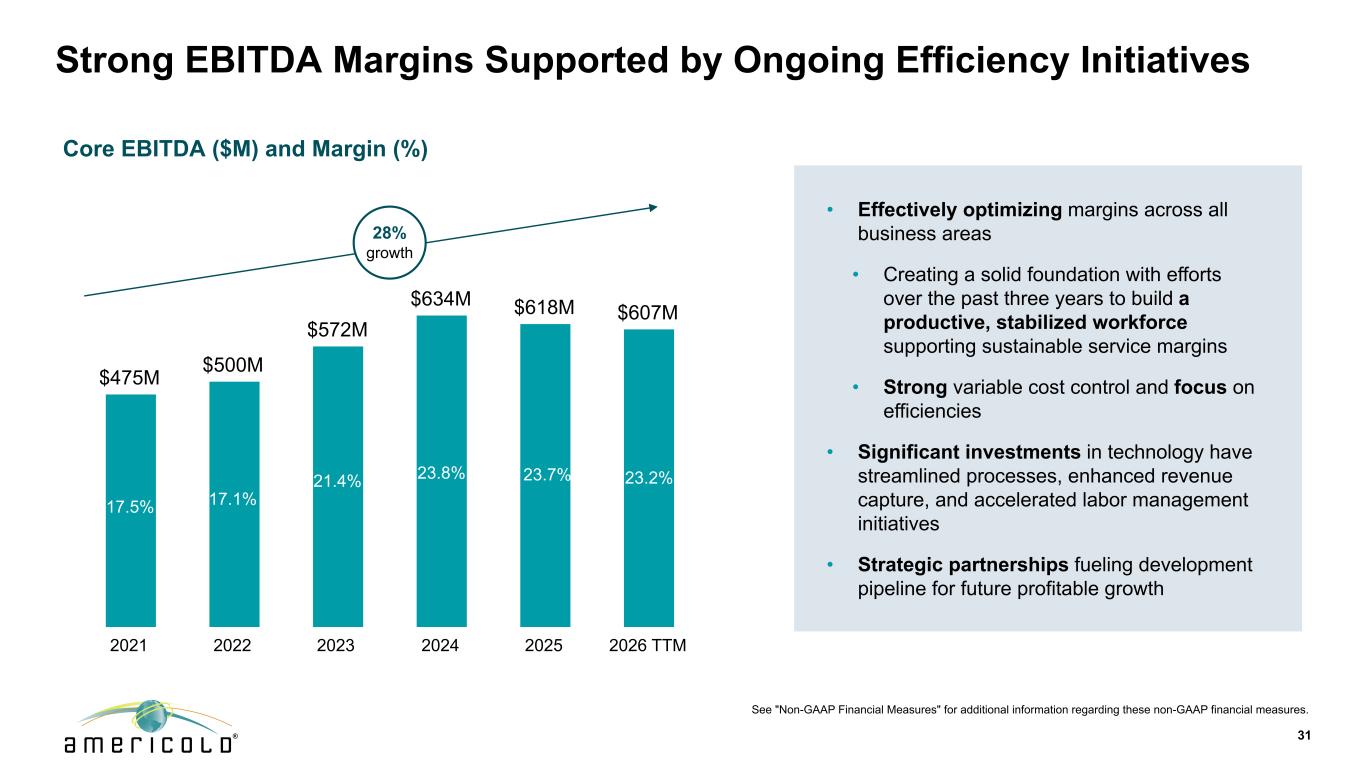
Strong EBITDA Margins Supported by Ongoing Efficiency Initiatives 31 Core EBITDA ($M) and Margin (%) 17.5% • Effectively optimizing margins across all business areas • Creating a solid foundation with efforts over the past three years to build a productive, stabilized workforce supporting sustainable service margins • Strong variable cost control and focus on efficiencies • Significant investments in technology have streamlined processes, enhanced revenue capture, and accelerated labor management initiatives • Strategic partnerships fueling development pipeline for future profitable growth 17.5% 17.5% See "Non-GAAP Financial Measures" for additional information regarding these non-GAAP financial measures. . 17.1% 28% growth . 17.1% 21.4% 23.8% $475M $500M $572M $634M $618M $607M 2021 2022 2023 2024 2025 2026 TTM 17.5% 21.4% 23.2% 17.1% 23.8% 23.7%
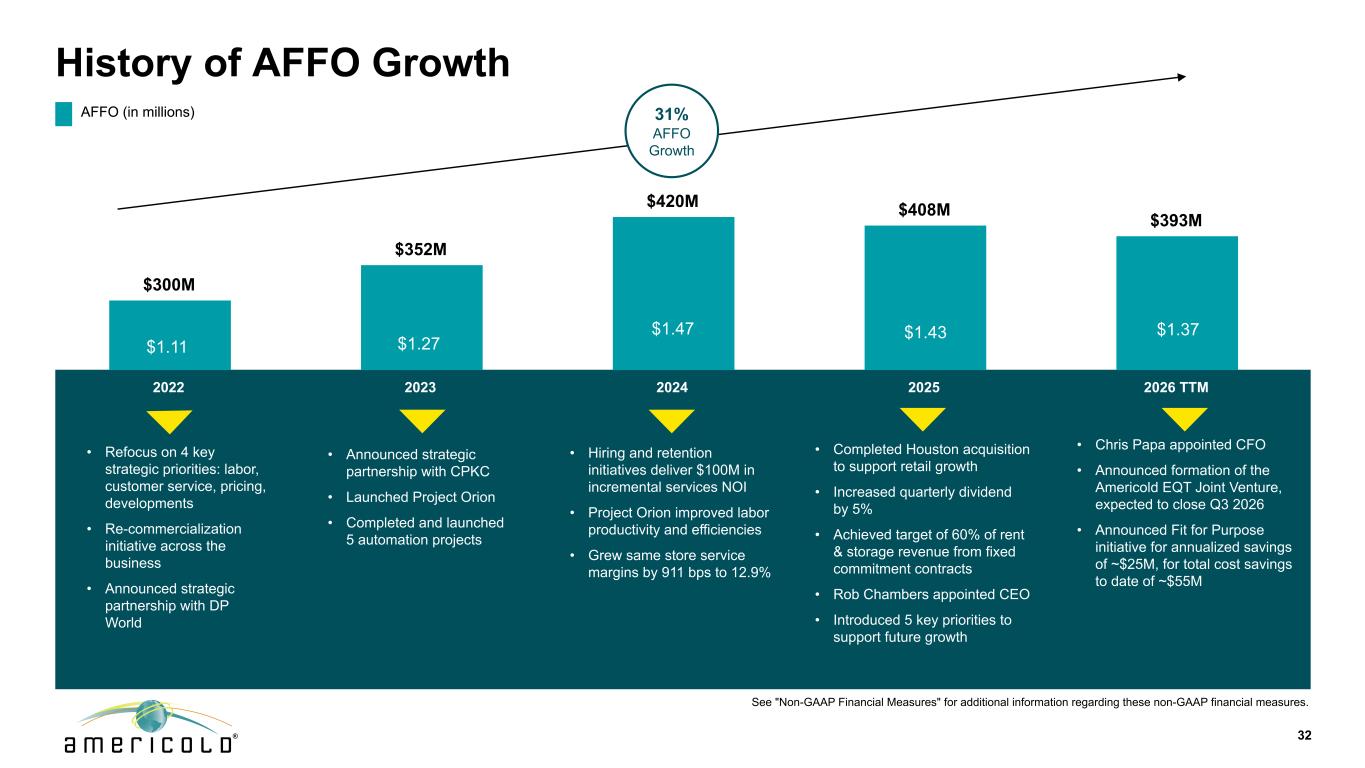
History of AFFO Growth 32 • Hiring and retention initiatives deliver $100M in incremental services NOI • Project Orion improved labor productivity and efficiencies • Grew same store service margins by 911 bps to 12.9% • Refocus on 4 key strategic priorities: labor, customer service, pricing, developments • Re-commercialization initiative across the business • Announced strategic partnership with DP World • Announced strategic partnership with CPKC • Launched Project Orion • Completed and launched 5 automation projects AFFO (in millions) $1.11 $1.27 $1.47$1.11 $1.43 $1.11 $1.47 • Completed Houston acquisition to support retail growth • Increased quarterly dividend by 5% • Achieved target of 60% of rent & storage revenue from fixed commitment contracts • Rob Chambers appointed CEO • Introduced 5 key priorities to support future growth See "Non-GAAP Financial Measures" for additional information regarding these non-GAAP financial measures. $1.27 31% AFFO Growth . . . $300M $352M $420M $408M $393M 2022 2023 2024 2025 2026 TTM $1.11 $1.37.. • Chris Papa appointed CFO • Announced formation of the Americold EQT Joint Venture, expected to close Q3 2026 • Announced Fit for Purpose initiative for annualized savings of ~$25M, for total cost savings to date of ~$55M 27 $1.47 $1.43
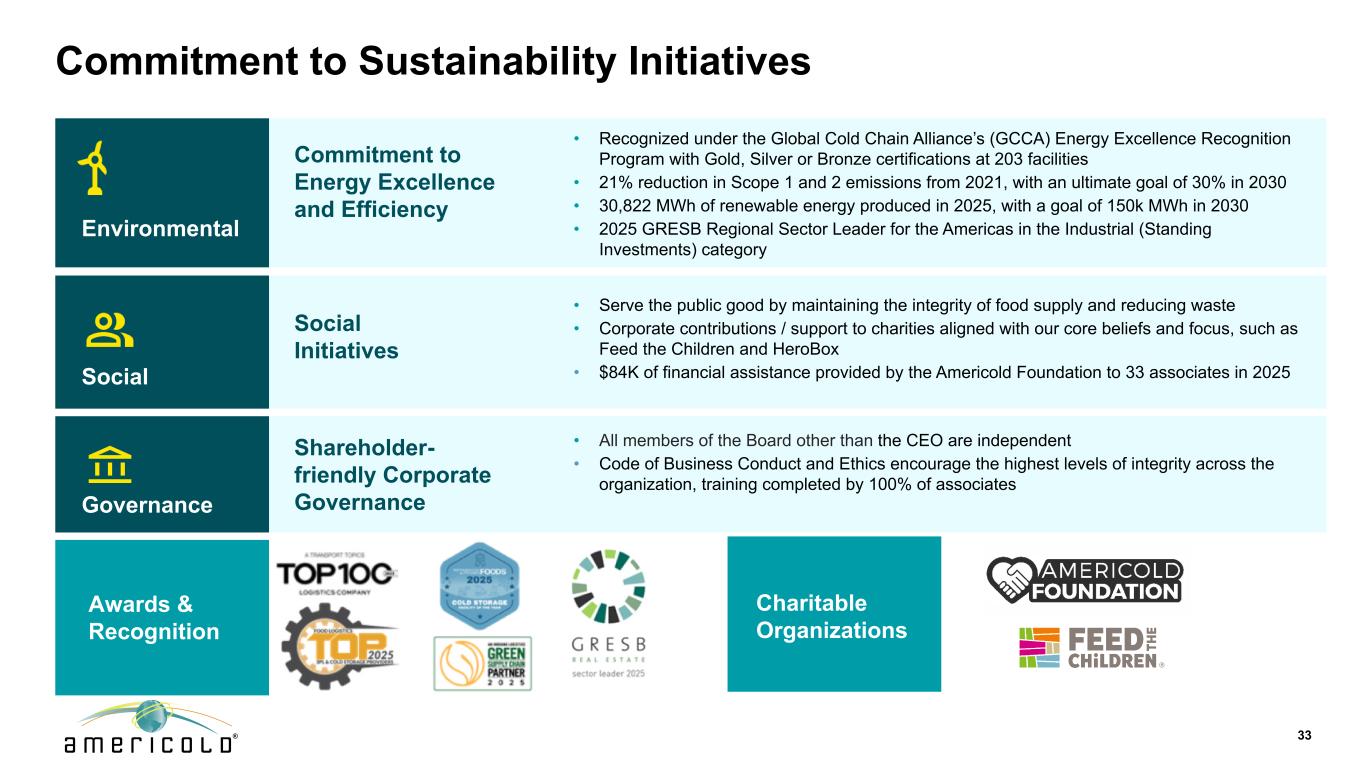
Commitment to Sustainability Initiatives Environmental Commitment to Energy Excellence and Efficiency • Recognized under the Global Cold Chain Alliance’s (GCCA) Energy Excellence Recognition Program with Gold, Silver or Bronze certifications at 203 facilities • 21% reduction in Scope 1 and 2 emissions from 2021, with an ultimate goal of 30% in 2030 • 30,822 MWh of renewable energy produced in 2025, with a goal of 150k MWh in 2030 • 2025 GRESB Regional Sector Leader for the Americas in the Industrial (Standing Investments) category Social Social Initiatives • Serve the public good by maintaining the integrity of food supply and reducing waste • Corporate contributions / support to charities aligned with our core beliefs and focus, such as Feed the Children and HeroBox • $84K of financial assistance provided by the Americold Foundation to 33 associates in 2025 Governance Shareholder- friendly Corporate Governance • All members of the Board other than the CEO are independent • Code of Business Conduct and Ethics encourage the highest levels of integrity across the organization, training completed by 100% of associates Awards & Recognition Charitable Organizations 33
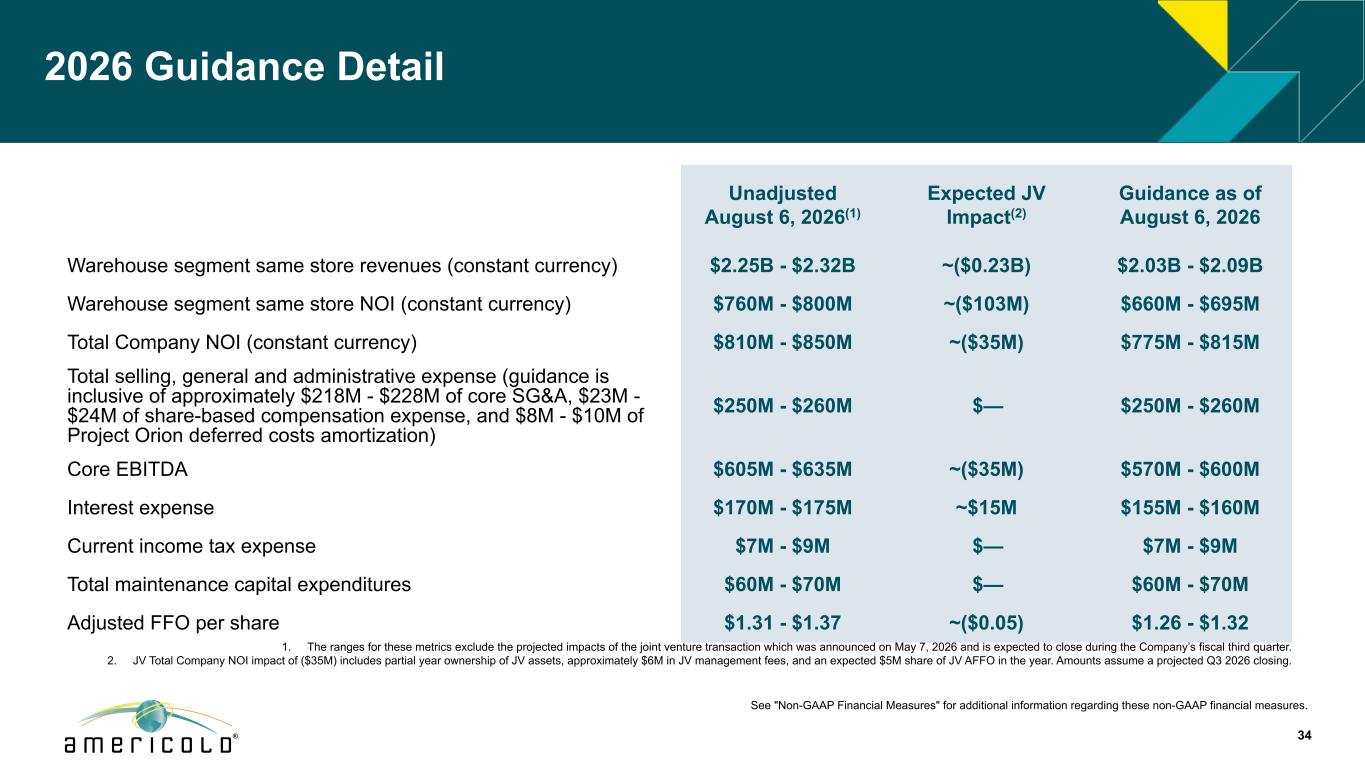
2026 Guidance Detail Unadjusted August 6, 2026(1) Expected JV Impact(2) Guidance as of August 6, 2026 Warehouse segment same store revenues (constant currency) $2.25B - $2.32B ~($0.23B) $2.03B - $2.09B Warehouse segment same store NOI (constant currency) $760M - $800M ~($103M) $660M - $695M Total Company NOI (constant currency) $810M - $850M ~($35M) $775M - $815M Total selling, general and administrative expense (guidance is inclusive of approximately $218M - $228M of core SG&A, $23M - $24M of share-based compensation expense, and $8M - $10M of Project Orion deferred costs amortization) $250M - $260M $— $250M - $260M Core EBITDA $605M - $635M ~($35M) $570M - $600M Interest expense $170M - $175M ~$15M $155M - $160M Current income tax expense $7M - $9M $— $7M - $9M Total maintenance capital expenditures $60M - $70M $— $60M - $70M Adjusted FFO per share $1.31 - $1.37 ~($0.05) $1.26 - $1.32 See "Non-GAAP Financial Measures" for additional information regarding these non-GAAP financial measures. 34 1. The ranges for these metrics exclude the projected impacts of the joint venture transaction which was announced on May 7, 2026 and is expected to close during the Company’s fiscal third quarter. 2. JV Total Company NOI impact of ($35M) includes partial year ownership of JV assets, approximately $6M in JV management fees, and an expected $5M share of JV AFFO in the year. Amounts assume a projected Q3 2026 closing.
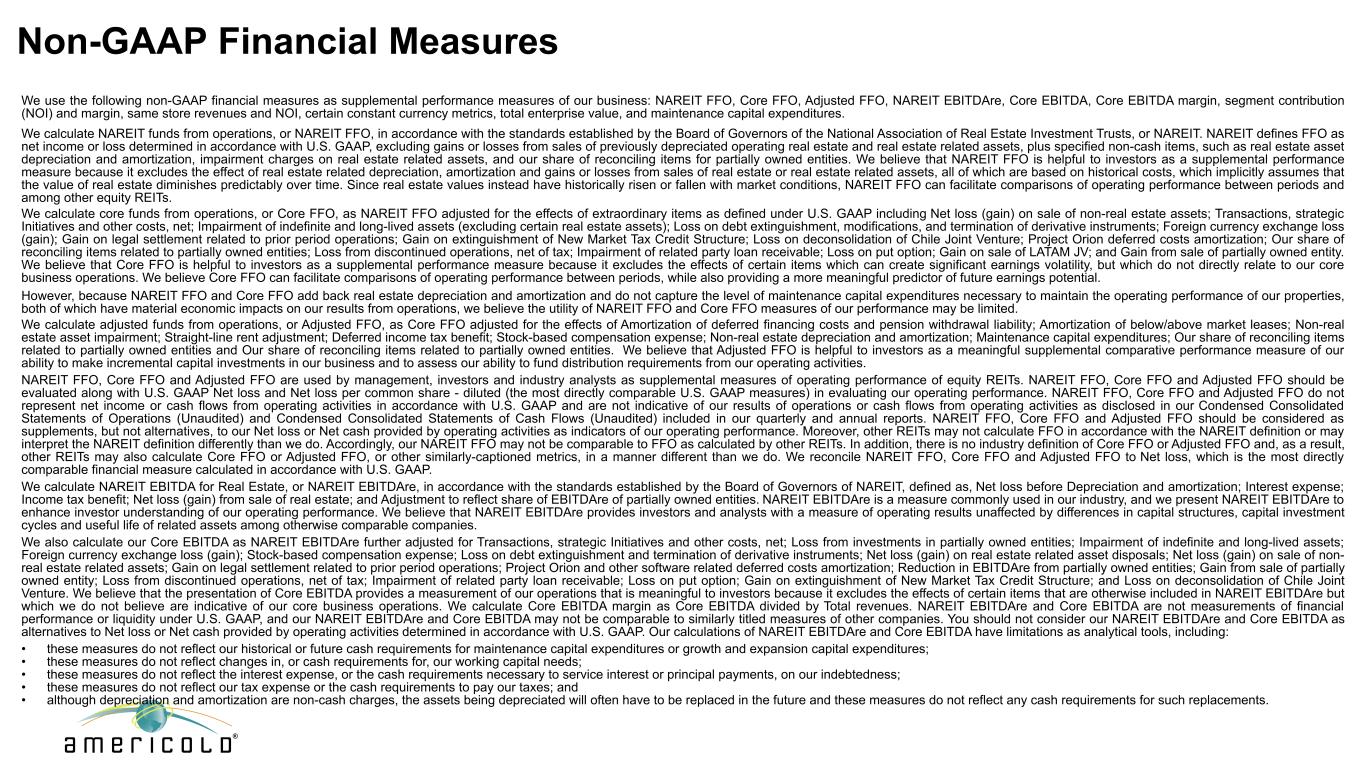
Non-GAAP Financial Measures 35 We use the following non-GAAP financial measures as supplemental performance measures of our business: NAREIT FFO, Core FFO, Adjusted FFO, NAREIT EBITDAre, Core EBITDA, Core EBITDA margin, segment contribution (NOI) and margin, same store revenues and NOI, certain constant currency metrics, total enterprise value, and maintenance capital expenditures. We calculate NAREIT funds from operations, or NAREIT FFO, in accordance with the standards established by the Board of Governors of the National Association of Real Estate Investment Trusts, or NAREIT. NAREIT defines FFO as net income or loss determined in accordance with U.S. GAAP, excluding gains or losses from sales of previously depreciated operating real estate and real estate related assets, plus specified non-cash items, such as real estate asset depreciation and amortization, impairment charges on real estate related assets, and our share of reconciling items for partially owned entities. We believe that NAREIT FFO is helpful to investors as a supplemental performance measure because it excludes the effect of real estate related depreciation, amortization and gains or losses from sales of real estate or real estate related assets, all of which are based on historical costs, which implicitly assumes that the value of real estate diminishes predictably over time. Since real estate values instead have historically risen or fallen with market conditions, NAREIT FFO can facilitate comparisons of operating performance between periods and among other equity REITs. We calculate core funds from operations, or Core FFO, as NAREIT FFO adjusted for the effects of extraordinary items as defined under U.S. GAAP including Net loss (gain) on sale of non-real estate assets; Transactions, strategic Initiatives and other costs, net; Impairment of indefinite and long-lived assets (excluding certain real estate assets); Loss on debt extinguishment, modifications, and termination of derivative instruments; Foreign currency exchange loss (gain); Gain on legal settlement related to prior period operations; Gain on extinguishment of New Market Tax Credit Structure; Loss on deconsolidation of Chile Joint Venture; Project Orion deferred costs amortization; Our share of reconciling items related to partially owned entities; Loss from discontinued operations, net of tax; Impairment of related party loan receivable; Loss on put option; Gain on sale of LATAM JV; and Gain from sale of partially owned entity. We believe that Core FFO is helpful to investors as a supplemental performance measure because it excludes the effects of certain items which can create significant earnings volatility, but which do not directly relate to our core business operations. We believe Core FFO can facilitate comparisons of operating performance between periods, while also providing a more meaningful predictor of future earnings potential. However, because NAREIT FFO and Core FFO add back real estate depreciation and amortization and do not capture the level of maintenance capital expenditures necessary to maintain the operating performance of our properties, both of which have material economic impacts on our results from operations, we believe the utility of NAREIT FFO and Core FFO measures of our performance may be limited. We calculate adjusted funds from operations, or Adjusted FFO, as Core FFO adjusted for the effects of Amortization of deferred financing costs and pension withdrawal liability; Amortization of below/above market leases; Non-real estate asset impairment; Straight-line rent adjustment; Deferred income tax benefit; Stock-based compensation expense; Non-real estate depreciation and amortization; Maintenance capital expenditures; Our share of reconciling items related to partially owned entities and Our share of reconciling items related to partially owned entities. We believe that Adjusted FFO is helpful to investors as a meaningful supplemental comparative performance measure of our ability to make incremental capital investments in our business and to assess our ability to fund distribution requirements from our operating activities. NAREIT FFO, Core FFO and Adjusted FFO are used by management, investors and industry analysts as supplemental measures of operating performance of equity REITs. NAREIT FFO, Core FFO and Adjusted FFO should be evaluated along with U.S. GAAP Net loss and Net loss per common share - diluted (the most directly comparable U.S. GAAP measures) in evaluating our operating performance. NAREIT FFO, Core FFO and Adjusted FFO do not represent net income or cash flows from operating activities in accordance with U.S. GAAP and are not indicative of our results of operations or cash flows from operating activities as disclosed in our Condensed Consolidated Statements of Operations (Unaudited) and Condensed Consolidated Statements of Cash Flows (Unaudited) included in our quarterly and annual reports. NAREIT FFO, Core FFO and Adjusted FFO should be considered as supplements, but not alternatives, to our Net loss or Net cash provided by operating activities as indicators of our operating performance. Moreover, other REITs may not calculate FFO in accordance with the NAREIT definition or may interpret the NAREIT definition differently than we do. Accordingly, our NAREIT FFO may not be comparable to FFO as calculated by other REITs. In addition, there is no industry definition of Core FFO or Adjusted FFO and, as a result, other REITs may also calculate Core FFO or Adjusted FFO, or other similarly-captioned metrics, in a manner different than we do. We reconcile NAREIT FFO, Core FFO and Adjusted FFO to Net loss, which is the most directly comparable financial measure calculated in accordance with U.S. GAAP. We calculate NAREIT EBITDA for Real Estate, or NAREIT EBITDAre, in accordance with the standards established by the Board of Governors of NAREIT, defined as, Net loss before Depreciation and amortization; Interest expense; Income tax benefit; Net loss (gain) from sale of real estate; and Adjustment to reflect share of EBITDAre of partially owned entities. NAREIT EBITDAre is a measure commonly used in our industry, and we present NAREIT EBITDAre to enhance investor understanding of our operating performance. We believe that NAREIT EBITDAre provides investors and analysts with a measure of operating results unaffected by differences in capital structures, capital investment cycles and useful life of related assets among otherwise comparable companies. We also calculate our Core EBITDA as NAREIT EBITDAre further adjusted for Transactions, strategic Initiatives and other costs, net; Loss from investments in partially owned entities; Impairment of indefinite and long-lived assets; Foreign currency exchange loss (gain); Stock-based compensation expense; Loss on debt extinguishment and termination of derivative instruments; Net loss (gain) on real estate related asset disposals; Net loss (gain) on sale of non- real estate related assets; Gain on legal settlement related to prior period operations; Project Orion and other software related deferred costs amortization; Reduction in EBITDAre from partially owned entities; Gain from sale of partially owned entity; Loss from discontinued operations, net of tax; Impairment of related party loan receivable; Loss on put option; Gain on extinguishment of New Market Tax Credit Structure; and Loss on deconsolidation of Chile Joint Venture. We believe that the presentation of Core EBITDA provides a measurement of our operations that is meaningful to investors because it excludes the effects of certain items that are otherwise included in NAREIT EBITDAre but which we do not believe are indicative of our core business operations. We calculate Core EBITDA margin as Core EBITDA divided by Total revenues. NAREIT EBITDAre and Core EBITDA are not measurements of financial performance or liquidity under U.S. GAAP, and our NAREIT EBITDAre and Core EBITDA may not be comparable to similarly titled measures of other companies. You should not consider our NAREIT EBITDAre and Core EBITDA as alternatives to Net loss or Net cash provided by operating activities determined in accordance with U.S. GAAP. Our calculations of NAREIT EBITDAre and Core EBITDA have limitations as analytical tools, including: • these measures do not reflect our historical or future cash requirements for maintenance capital expenditures or growth and expansion capital expenditures; • these measures do not reflect changes in, or cash requirements for, our working capital needs; • these measures do not reflect the interest expense, or the cash requirements necessary to service interest or principal payments, on our indebtedness; • these measures do not reflect our tax expense or the cash requirements to pay our taxes; and • although depreciation and amortization are non-cash charges, the assets being depreciated will often have to be replaced in the future and these measures do not reflect any cash requirements for such replacements.
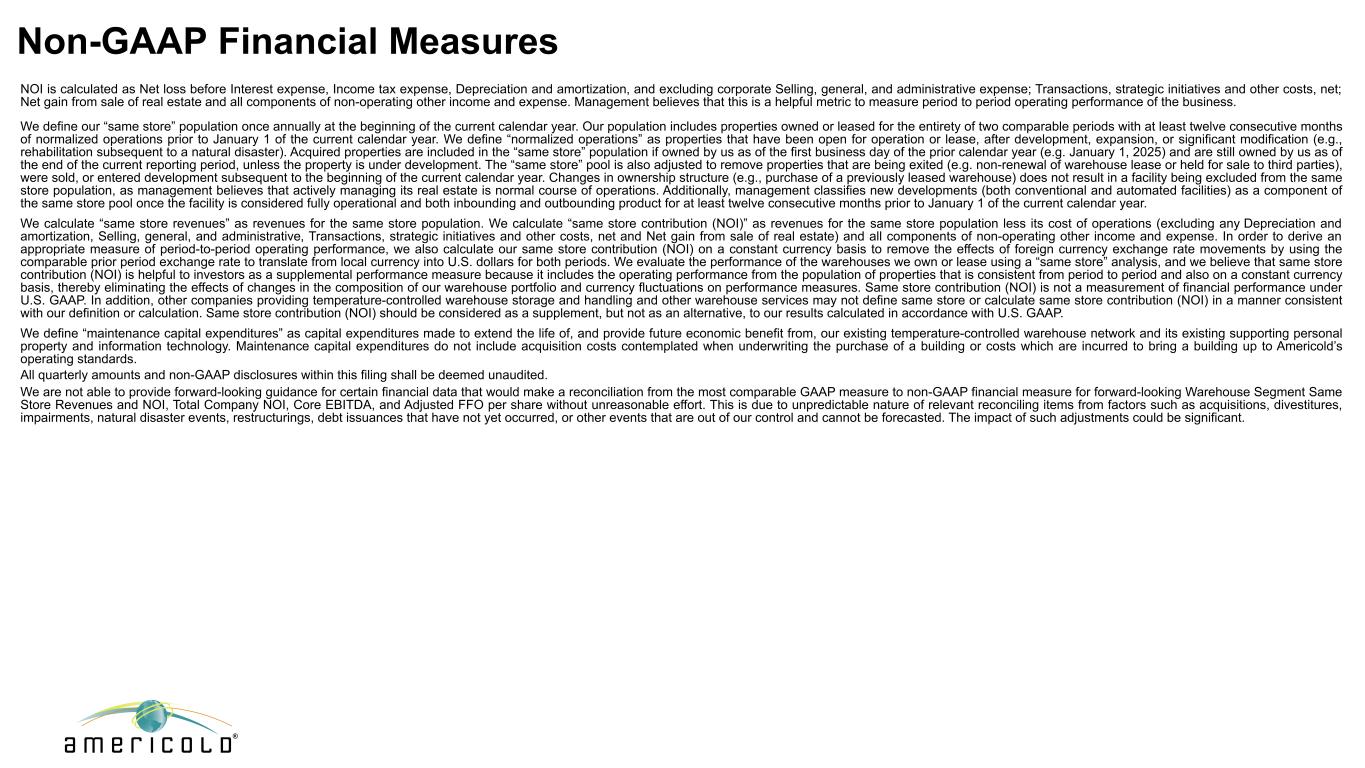
Non-GAAP Financial Measures 36 NOI is calculated as Net loss before Interest expense, Income tax expense, Depreciation and amortization, and excluding corporate Selling, general, and administrative expense; Transactions, strategic initiatives and other costs, net; Net gain from sale of real estate and all components of non-operating other income and expense. Management believes that this is a helpful metric to measure period to period operating performance of the business. We define our “same store” population once annually at the beginning of the current calendar year. Our population includes properties owned or leased for the entirety of two comparable periods with at least twelve consecutive months of normalized operations prior to January 1 of the current calendar year. We define “normalized operations” as properties that have been open for operation or lease, after development, expansion, or significant modification (e.g., rehabilitation subsequent to a natural disaster). Acquired properties are included in the “same store” population if owned by us as of the first business day of the prior calendar year (e.g. January 1, 2025) and are still owned by us as of the end of the current reporting period, unless the property is under development. The “same store” pool is also adjusted to remove properties that are being exited (e.g. non-renewal of warehouse lease or held for sale to third parties), were sold, or entered development subsequent to the beginning of the current calendar year. Changes in ownership structure (e.g., purchase of a previously leased warehouse) does not result in a facility being excluded from the same store population, as management believes that actively managing its real estate is normal course of operations. Additionally, management classifies new developments (both conventional and automated facilities) as a component of the same store pool once the facility is considered fully operational and both inbounding and outbounding product for at least twelve consecutive months prior to January 1 of the current calendar year. We calculate “same store revenues” as revenues for the same store population. We calculate “same store contribution (NOI)” as revenues for the same store population less its cost of operations (excluding any Depreciation and amortization, Selling, general, and administrative, Transactions, strategic initiatives and other costs, net and Net gain from sale of real estate) and all components of non-operating other income and expense. In order to derive an appropriate measure of period-to-period operating performance, we also calculate our same store contribution (NOI) on a constant currency basis to remove the effects of foreign currency exchange rate movements by using the comparable prior period exchange rate to translate from local currency into U.S. dollars for both periods. We evaluate the performance of the warehouses we own or lease using a “same store” analysis, and we believe that same store contribution (NOI) is helpful to investors as a supplemental performance measure because it includes the operating performance from the population of properties that is consistent from period to period and also on a constant currency basis, thereby eliminating the effects of changes in the composition of our warehouse portfolio and currency fluctuations on performance measures. Same store contribution (NOI) is not a measurement of financial performance under U.S. GAAP. In addition, other companies providing temperature-controlled warehouse storage and handling and other warehouse services may not define same store or calculate same store contribution (NOI) in a manner consistent with our definition or calculation. Same store contribution (NOI) should be considered as a supplement, but not as an alternative, to our results calculated in accordance with U.S. GAAP. We define “maintenance capital expenditures” as capital expenditures made to extend the life of, and provide future economic benefit from, our existing temperature-controlled warehouse network and its existing supporting personal property and information technology. Maintenance capital expenditures do not include acquisition costs contemplated when underwriting the purchase of a building or costs which are incurred to bring a building up to Americold’s operating standards. All quarterly amounts and non-GAAP disclosures within this filing shall be deemed unaudited. We are not able to provide forward-looking guidance for certain financial data that would make a reconciliation from the most comparable GAAP measure to non-GAAP financial measure for forward-looking Warehouse Segment Same Store Revenues and NOI, Total Company NOI, Core EBITDA, and Adjusted FFO per share without unreasonable effort. This is due to unpredictable nature of relevant reconciling items from factors such as acquisitions, divestitures, impairments, natural disaster events, restructurings, debt issuances that have not yet occurred, or other events that are out of our control and cannot be forecasted. The impact of such adjustments could be significant.
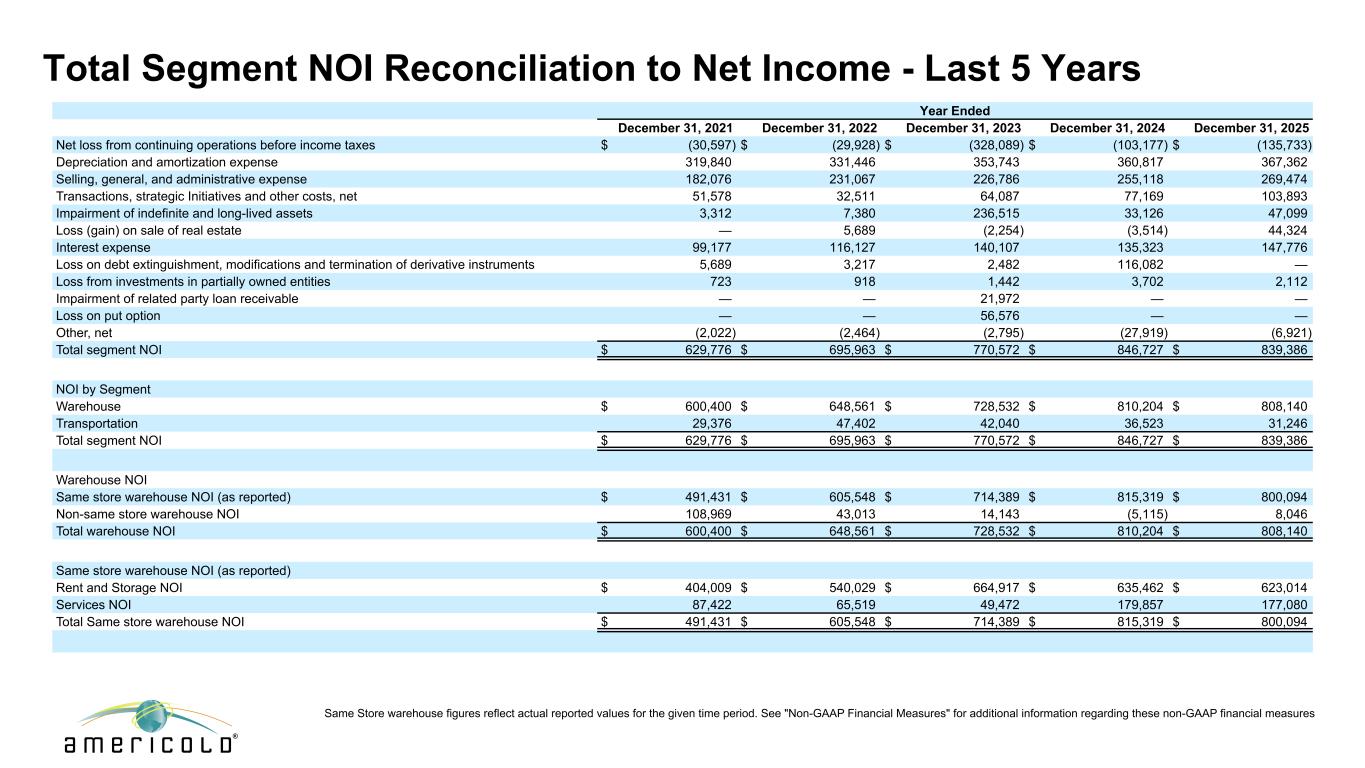
Total Segment NOI Reconciliation to Net Income - Last 5 Years 37 Year Ended December 31, 2021 December 31, 2022 December 31, 2023 December 31, 2024 December 31, 2025 Net loss from continuing operations before income taxes $ (30,597) $ (29,928) $ (328,089) $ (103,177) $ (135,733) Depreciation and amortization expense 319,840 331,446 353,743 360,817 367,362 Selling, general, and administrative expense 182,076 231,067 226,786 255,118 269,474 Transactions, strategic Initiatives and other costs, net 51,578 32,511 64,087 77,169 103,893 Impairment of indefinite and long-lived assets 3,312 7,380 236,515 33,126 47,099 Loss (gain) on sale of real estate — 5,689 (2,254) (3,514) 44,324 Interest expense 99,177 116,127 140,107 135,323 147,776 Loss on debt extinguishment, modifications and termination of derivative instruments 5,689 3,217 2,482 116,082 — Loss from investments in partially owned entities 723 918 1,442 3,702 2,112 Impairment of related party loan receivable — — 21,972 — — Loss on put option — — 56,576 — — Other, net (2,022) (2,464) (2,795) (27,919) (6,921) Total segment NOI $ 629,776 $ 695,963 $ 770,572 $ 846,727 $ 839,386 NOI by Segment Warehouse $ 600,400 $ 648,561 $ 728,532 $ 810,204 $ 808,140 Transportation 29,376 47,402 42,040 36,523 31,246 Total segment NOI $ 629,776 $ 695,963 $ 770,572 $ 846,727 $ 839,386 Warehouse NOI Same store warehouse NOI (as reported) $ 491,431 $ 605,548 $ 714,389 $ 815,319 $ 800,094 Non-same store warehouse NOI 108,969 43,013 14,143 (5,115) 8,046 Total warehouse NOI $ 600,400 $ 648,561 $ 728,532 $ 810,204 $ 808,140 Same store warehouse NOI (as reported) Rent and Storage NOI $ 404,009 $ 540,029 $ 664,917 $ 635,462 $ 623,014 Services NOI 87,422 65,519 49,472 179,857 177,080 Total Same store warehouse NOI $ 491,431 $ 605,548 $ 714,389 $ 815,319 $ 800,094 Same Store warehouse figures reflect actual reported values for the given time period. See "Non-GAAP Financial Measures" for additional information regarding these non-GAAP financial measures
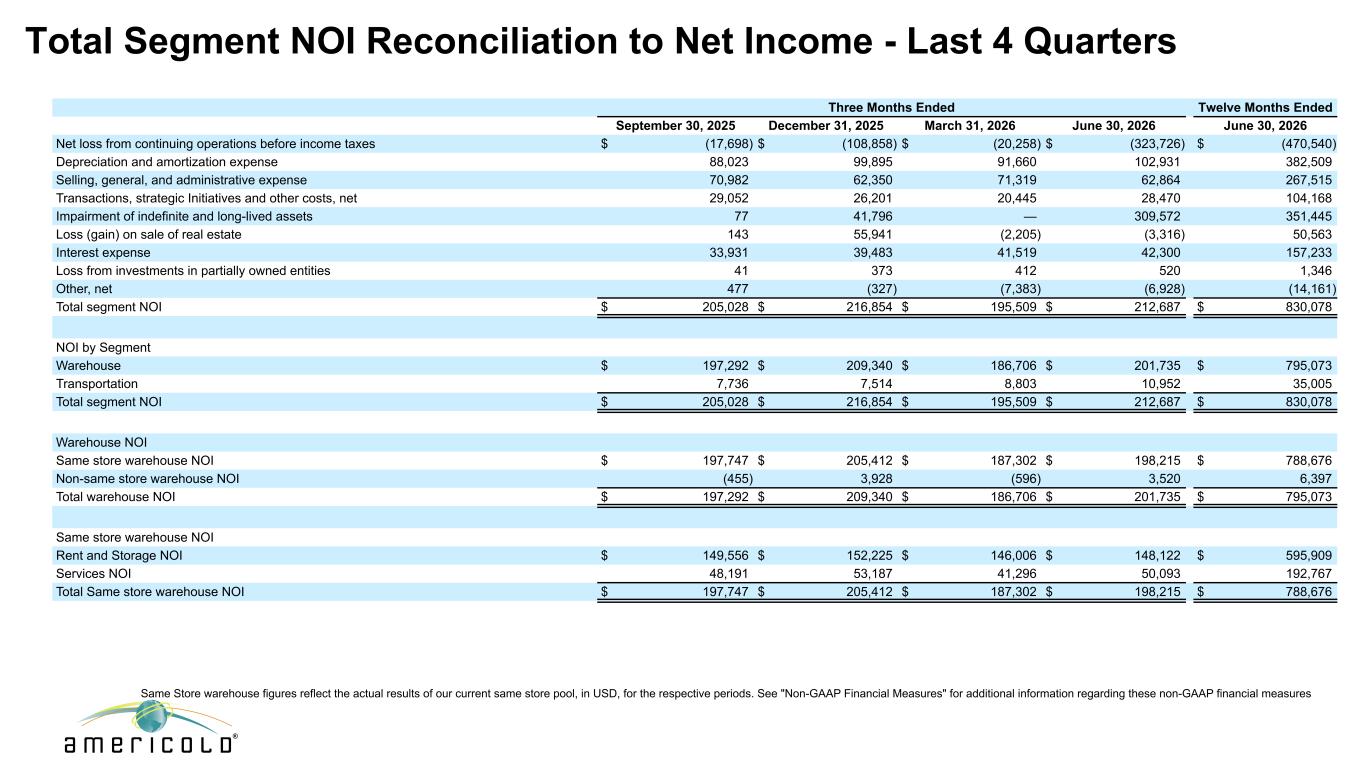
Total Segment NOI Reconciliation to Net Income - Last 4 Quarters 38 Three Months Ended Twelve Months Ended September 30, 2025 December 31, 2025 March 31, 2026 June 30, 2026 June 30, 2026 Net loss from continuing operations before income taxes $ (17,698) $ (108,858) $ (20,258) $ (323,726) $ (470,540) Depreciation and amortization expense 88,023 99,895 91,660 102,931 382,509 Selling, general, and administrative expense 70,982 62,350 71,319 62,864 267,515 Transactions, strategic Initiatives and other costs, net 29,052 26,201 20,445 28,470 104,168 Impairment of indefinite and long-lived assets 77 41,796 — 309,572 351,445 Loss (gain) on sale of real estate 143 55,941 (2,205) (3,316) 50,563 Interest expense 33,931 39,483 41,519 42,300 157,233 Loss from investments in partially owned entities 41 373 412 520 1,346 Other, net 477 (327) (7,383) (6,928) (14,161) Total segment NOI $ 205,028 $ 216,854 $ 195,509 $ 212,687 $ 830,078 NOI by Segment Warehouse $ 197,292 $ 209,340 $ 186,706 $ 201,735 $ 795,073 Transportation 7,736 7,514 8,803 10,952 35,005 Total segment NOI $ 205,028 $ 216,854 $ 195,509 $ 212,687 $ 830,078 Warehouse NOI Same store warehouse NOI $ 197,747 $ 205,412 $ 187,302 $ 198,215 $ 788,676 Non-same store warehouse NOI (455) 3,928 (596) 3,520 6,397 Total warehouse NOI $ 197,292 $ 209,340 $ 186,706 $ 201,735 $ 795,073 Same store warehouse NOI Rent and Storage NOI $ 149,556 $ 152,225 $ 146,006 $ 148,122 $ 595,909 Services NOI 48,191 53,187 41,296 50,093 192,767 Total Same store warehouse NOI $ 197,747 $ 205,412 $ 187,302 $ 198,215 $ 788,676 Same Store warehouse figures reflect the actual results of our current same store pool, in USD, for the respective periods. See "Non-GAAP Financial Measures" for additional information regarding these non-GAAP financial measures
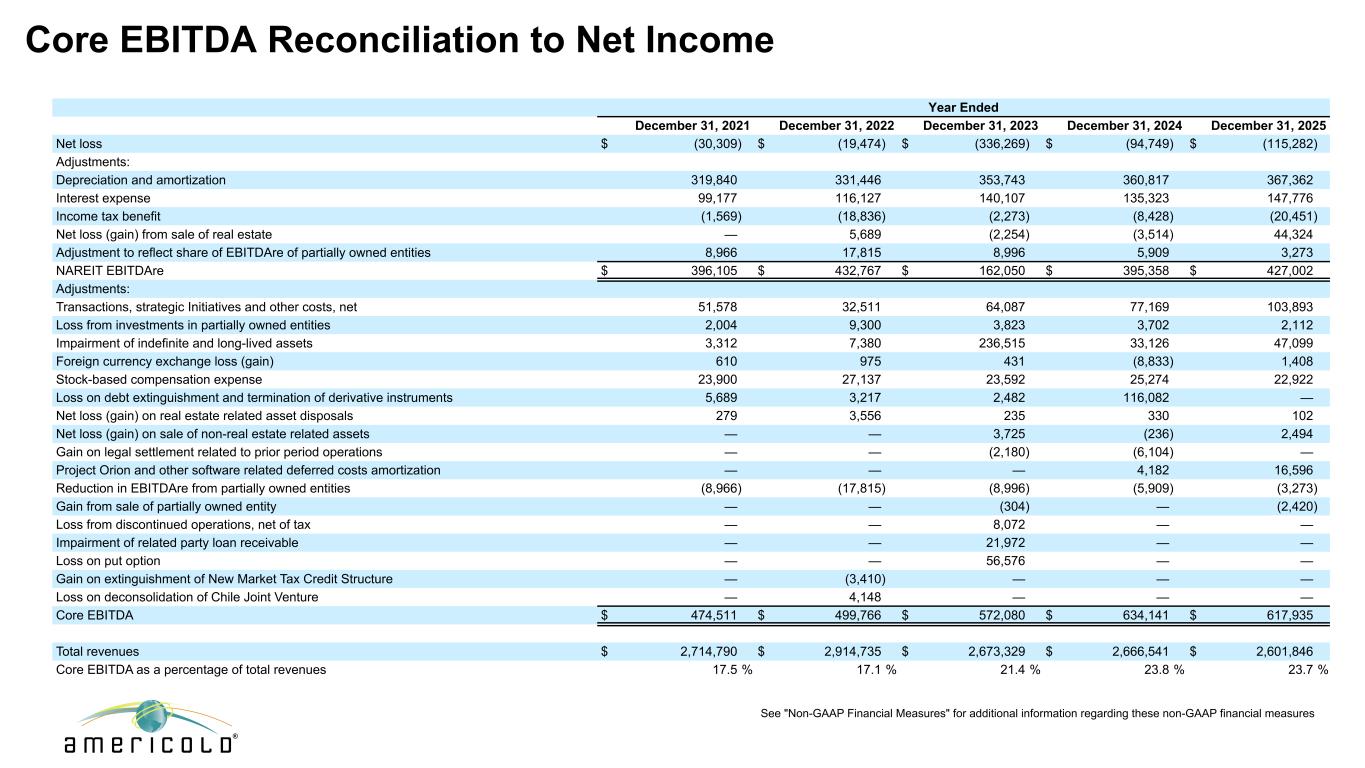
Core EBITDA Reconciliation to Net Income 39 Year Ended December 31, 2021 December 31, 2022 December 31, 2023 December 31, 2024 December 31, 2025 Net loss $ (30,309) $ (19,474) $ (336,269) $ (94,749) $ (115,282) Adjustments: Depreciation and amortization 319,840 331,446 353,743 360,817 367,362 Interest expense 99,177 116,127 140,107 135,323 147,776 Income tax benefit (1,569) (18,836) (2,273) (8,428) (20,451) Net loss (gain) from sale of real estate — 5,689 (2,254) (3,514) 44,324 Adjustment to reflect share of EBITDAre of partially owned entities 8,966 17,815 8,996 5,909 3,273 NAREIT EBITDAre $ 396,105 $ 432,767 $ 162,050 $ 395,358 $ 427,002 Adjustments: Transactions, strategic Initiatives and other costs, net 51,578 32,511 64,087 77,169 103,893 Loss from investments in partially owned entities 2,004 9,300 3,823 3,702 2,112 Impairment of indefinite and long-lived assets 3,312 7,380 236,515 33,126 47,099 Foreign currency exchange loss (gain) 610 975 431 (8,833) 1,408 Stock-based compensation expense 23,900 27,137 23,592 25,274 22,922 Loss on debt extinguishment and termination of derivative instruments 5,689 3,217 2,482 116,082 — Net loss (gain) on real estate related asset disposals 279 3,556 235 330 102 Net loss (gain) on sale of non-real estate related assets — — 3,725 (236) 2,494 Gain on legal settlement related to prior period operations — — (2,180) (6,104) — Project Orion and other software related deferred costs amortization — — — 4,182 16,596 Reduction in EBITDAre from partially owned entities (8,966) (17,815) (8,996) (5,909) (3,273) Gain from sale of partially owned entity — — (304) — (2,420) Loss from discontinued operations, net of tax — — 8,072 — — Impairment of related party loan receivable — — 21,972 — — Loss on put option — — 56,576 — — Gain on extinguishment of New Market Tax Credit Structure — (3,410) — — — Loss on deconsolidation of Chile Joint Venture — 4,148 — — — Core EBITDA $ 474,511 $ 499,766 $ 572,080 $ 634,141 $ 617,935 Total revenues $ 2,714,790 $ 2,914,735 $ 2,673,329 $ 2,666,541 $ 2,601,846 Core EBITDA as a percentage of total revenues 17.5 % 17.1 % 21.4 % 23.8 % 23.7 % See "Non-GAAP Financial Measures" for additional information regarding these non-GAAP financial measures
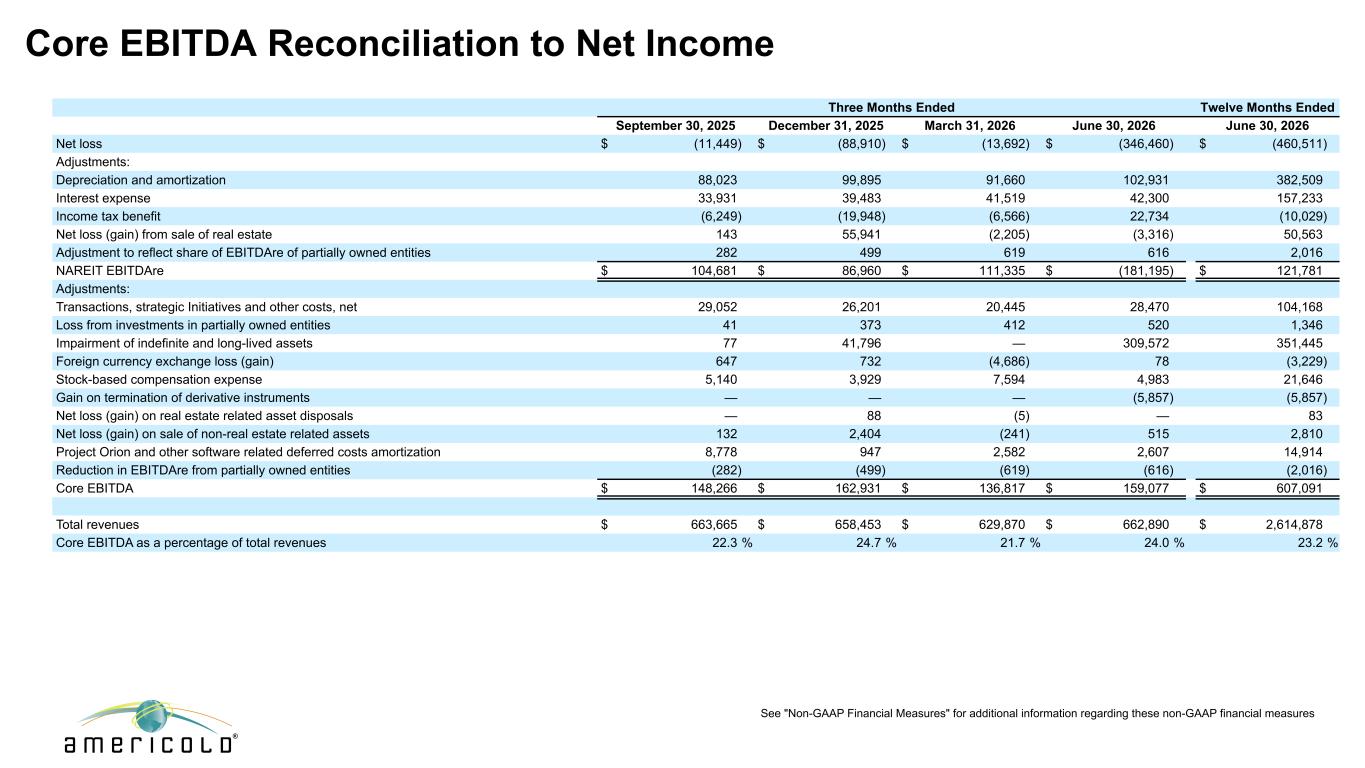
Core EBITDA Reconciliation to Net Income 40 Three Months Ended Twelve Months Ended September 30, 2025 December 31, 2025 March 31, 2026 June 30, 2026 June 30, 2026 Net loss $ (11,449) $ (88,910) $ (13,692) $ (346,460) $ (460,511) Adjustments: Depreciation and amortization 88,023 99,895 91,660 102,931 382,509 Interest expense 33,931 39,483 41,519 42,300 157,233 Income tax benefit (6,249) (19,948) (6,566) 22,734 (10,029) Net loss (gain) from sale of real estate 143 55,941 (2,205) (3,316) 50,563 Adjustment to reflect share of EBITDAre of partially owned entities 282 499 619 616 2,016 NAREIT EBITDAre $ 104,681 $ 86,960 $ 111,335 $ (181,195) $ 121,781 Adjustments: Transactions, strategic Initiatives and other costs, net 29,052 26,201 20,445 28,470 104,168 Loss from investments in partially owned entities 41 373 412 520 1,346 Impairment of indefinite and long-lived assets 77 41,796 — 309,572 351,445 Foreign currency exchange loss (gain) 647 732 (4,686) 78 (3,229) Stock-based compensation expense 5,140 3,929 7,594 4,983 21,646 Gain on termination of derivative instruments — — — (5,857) (5,857) Net loss (gain) on real estate related asset disposals — 88 (5) — 83 Net loss (gain) on sale of non-real estate related assets 132 2,404 (241) 515 2,810 Project Orion and other software related deferred costs amortization 8,778 947 2,582 2,607 14,914 Reduction in EBITDAre from partially owned entities (282) (499) (619) (616) (2,016) Core EBITDA $ 148,266 $ 162,931 $ 136,817 $ 159,077 $ 607,091 Total revenues $ 663,665 $ 658,453 $ 629,870 $ 662,890 $ 2,614,878 Core EBITDA as a percentage of total revenues 22.3 % 24.7 % 21.7 % 24.0 % 23.2 % See "Non-GAAP Financial Measures" for additional information regarding these non-GAAP financial measures
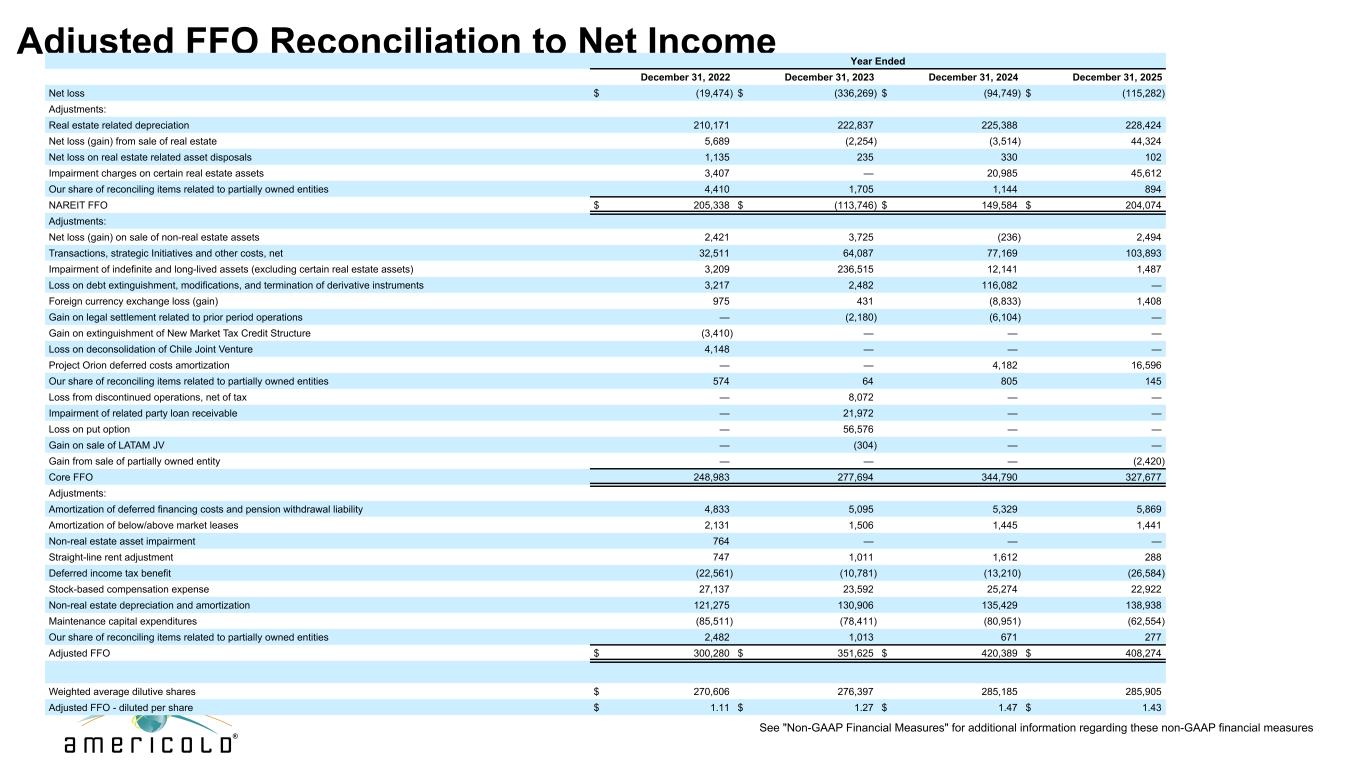
Adjusted FFO Reconciliation to Net Income 41 Year Ended December 31, 2022 December 31, 2023 December 31, 2024 December 31, 2025 Net loss $ (19,474) $ (336,269) $ (94,749) $ (115,282) Adjustments: Real estate related depreciation 210,171 222,837 225,388 228,424 Net loss (gain) from sale of real estate 5,689 (2,254) (3,514) 44,324 Net loss on real estate related asset disposals 1,135 235 330 102 Impairment charges on certain real estate assets 3,407 — 20,985 45,612 Our share of reconciling items related to partially owned entities 4,410 1,705 1,144 894 NAREIT FFO $ 205,338 $ (113,746) $ 149,584 $ 204,074 Adjustments: Net loss (gain) on sale of non-real estate assets 2,421 3,725 (236) 2,494 Transactions, strategic Initiatives and other costs, net 32,511 64,087 77,169 103,893 Impairment of indefinite and long-lived assets (excluding certain real estate assets) 3,209 236,515 12,141 1,487 Loss on debt extinguishment, modifications, and termination of derivative instruments 3,217 2,482 116,082 — Foreign currency exchange loss (gain) 975 431 (8,833) 1,408 Gain on legal settlement related to prior period operations — (2,180) (6,104) — Gain on extinguishment of New Market Tax Credit Structure (3,410) — — — Loss on deconsolidation of Chile Joint Venture 4,148 — — — Project Orion deferred costs amortization — — 4,182 16,596 Our share of reconciling items related to partially owned entities 574 64 805 145 Loss from discontinued operations, net of tax — 8,072 — — Impairment of related party loan receivable — 21,972 — — Loss on put option — 56,576 — — Gain on sale of LATAM JV — (304) — — Gain from sale of partially owned entity — — — (2,420) Core FFO 248,983 277,694 344,790 327,677 Adjustments: Amortization of deferred financing costs and pension withdrawal liability 4,833 5,095 5,329 5,869 Amortization of below/above market leases 2,131 1,506 1,445 1,441 Non-real estate asset impairment 764 — — — Straight-line rent adjustment 747 1,011 1,612 288 Deferred income tax benefit (22,561) (10,781) (13,210) (26,584) Stock-based compensation expense 27,137 23,592 25,274 22,922 Non-real estate depreciation and amortization 121,275 130,906 135,429 138,938 Maintenance capital expenditures (85,511) (78,411) (80,951) (62,554) Our share of reconciling items related to partially owned entities 2,482 1,013 671 277 Adjusted FFO $ 300,280 $ 351,625 $ 420,389 $ 408,274 Weighted average dilutive shares $ 270,606 276,397 285,185 285,905 Adjusted FFO - diluted per share $ 1.11 $ 1.27 $ 1.47 $ 1.43 See "Non-GAAP Financial Measures" for additional information regarding these non-GAAP financial measures
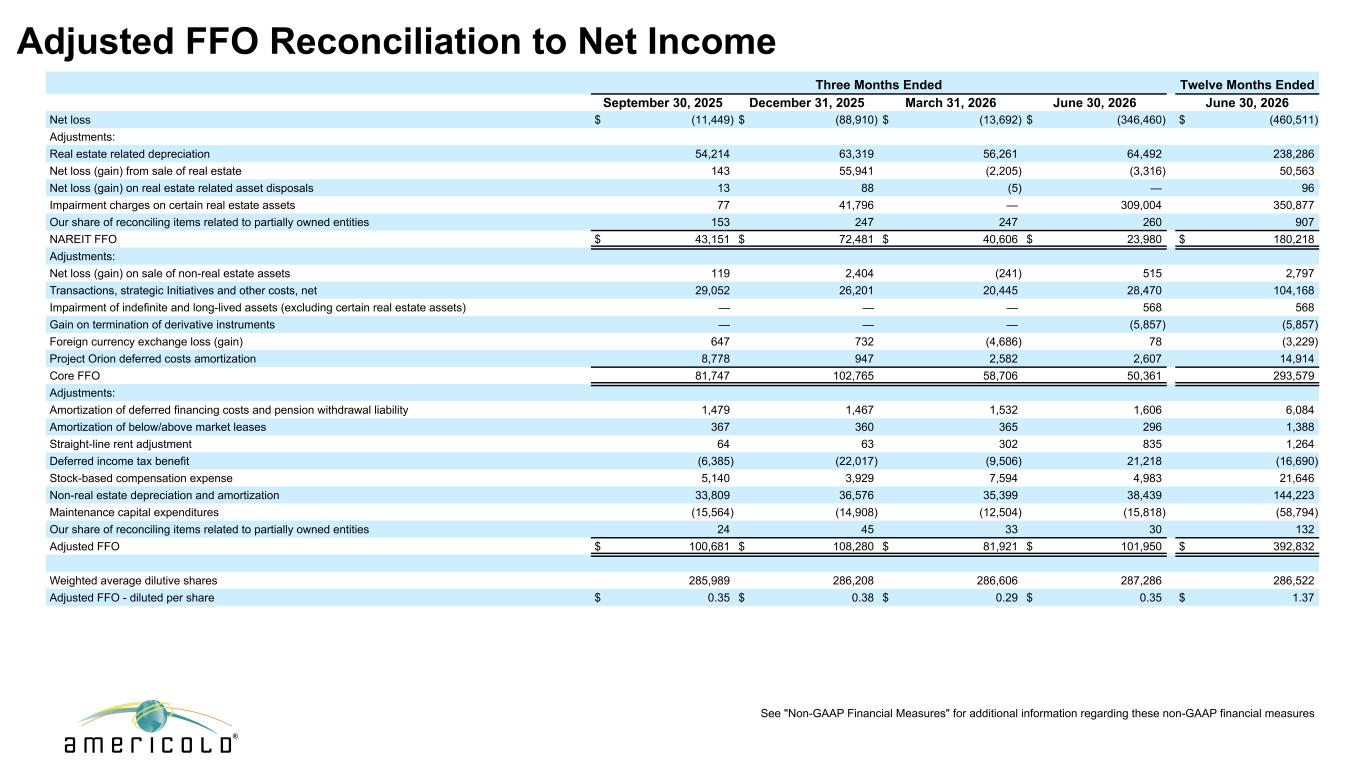
Adjusted FFO Reconciliation to Net Income 42 Three Months Ended Twelve Months Ended September 30, 2025 December 31, 2025 March 31, 2026 June 30, 2026 June 30, 2026 Net loss $ (11,449) $ (88,910) $ (13,692) $ (346,460) $ (460,511) Adjustments: Real estate related depreciation 54,214 63,319 56,261 64,492 238,286 Net loss (gain) from sale of real estate 143 55,941 (2,205) (3,316) 50,563 Net loss (gain) on real estate related asset disposals 13 88 (5) — 96 Impairment charges on certain real estate assets 77 41,796 — 309,004 350,877 Our share of reconciling items related to partially owned entities 153 247 247 260 907 NAREIT FFO $ 43,151 $ 72,481 $ 40,606 $ 23,980 $ 180,218 Adjustments: Net loss (gain) on sale of non-real estate assets 119 2,404 (241) 515 2,797 Transactions, strategic Initiatives and other costs, net 29,052 26,201 20,445 28,470 104,168 Impairment of indefinite and long-lived assets (excluding certain real estate assets) — — — 568 568 Gain on termination of derivative instruments — — — (5,857) (5,857) Foreign currency exchange loss (gain) 647 732 (4,686) 78 (3,229) Project Orion deferred costs amortization 8,778 947 2,582 2,607 14,914 Core FFO 81,747 102,765 58,706 50,361 293,579 Adjustments: Amortization of deferred financing costs and pension withdrawal liability 1,479 1,467 1,532 1,606 6,084 Amortization of below/above market leases 367 360 365 296 1,388 Straight-line rent adjustment 64 63 302 835 1,264 Deferred income tax benefit (6,385) (22,017) (9,506) 21,218 (16,690) Stock-based compensation expense 5,140 3,929 7,594 4,983 21,646 Non-real estate depreciation and amortization 33,809 36,576 35,399 38,439 144,223 Maintenance capital expenditures (15,564) (14,908) (12,504) (15,818) (58,794) Our share of reconciling items related to partially owned entities 24 45 33 30 132 Adjusted FFO $ 100,681 $ 108,280 $ 81,921 $ 101,950 $ 392,832 Weighted average dilutive shares 285,989 286,208 286,606 287,286 286,522 Adjusted FFO - diluted per share $ 0.35 $ 0.38 $ 0.29 $ 0.35 $ 1.37 See "Non-GAAP Financial Measures" for additional information regarding these non-GAAP financial measures