1 | January 8, 2026 | Proprietary | © 2025 Curtiss-Wright Q2 2026 - EARNINGS CONFERENCE CALL August 6, 2026 Conference Call Dial-in numbers: (800) 343-5172 (domestic) (203) 518-9856 (international) Conference code: CWQ226
2 | August 6, 2026 | Proprietary | © 2026 Curtiss-Wright Please note that the information provided in this presentation is accurate as of the date of the original presentation. The presentation will remain posted on this website from one to twelve months following the initial presentation, but content will not be updated to reflect new information that may become available after the original presentation posting. The presentation contains forward-looking statements within the meaning of Section 27A of the Securities Act of 1933, as amended ("Securities Act"), Section 21E of the Securities Exchange Act of 1934, as amended ("Exchange Act"), and the Private Securities Litigation Reform Act of 1995. Such forward-looking statements only speak as of the date of this report and Curtiss-Wright Corporation assumes no obligation to update the information included in this report. Such forward-looking statements include, among other things, management's estimates of future performance, revenue and earnings, our management's growth objectives, our management’s ability to integrate our acquisition, and our management's ability to produce consistent operating improvements. These forward-looking statements are based on expectations as of the time the statements were made only, and are subject to a number of risks and uncertainties which could cause us to fail to achieve our then-current financial projections and other expectations, including the impact of a global pandemic or national epidemic. This presentation also includes certain non-GAAP financial measures with reconciliations to GAAP financial measures being made available in the earnings release and this presentation that are posted to our website and furnished with the SEC. We undertake no duty to update this information. More information about potential factors that could affect our business and financial results is included in our filings with the Securities and Exchange Commission, including our Annual Reports on Form 10-K and Quarterly Reports on Form 10-Q, including, among other sections, under the captions, "Risk Factors" and "Management's Discussion and Analysis of Financial Condition and Results of Operations," which is on file with the SEC and available at the SEC's website at www.sec.gov. SAFE HARBOR STATEMENT
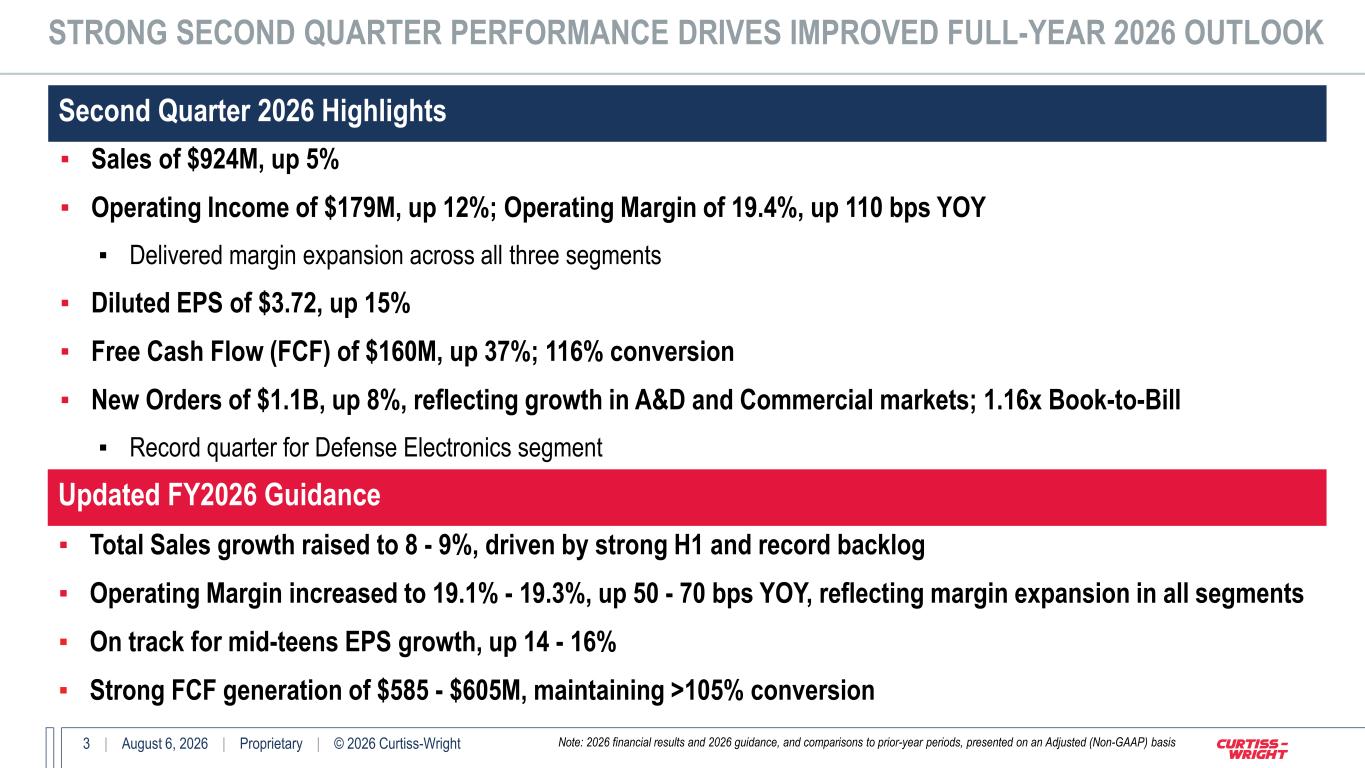
3 | August 6, 2026 | Proprietary | © 2026 Curtiss-Wright Second Quarter 2026 Highlights STRONG SECOND QUARTER PERFORMANCE DRIVES IMPROVED FULL-YEAR 2026 OUTLOOK ▪ Sales of $924M, up 5% ▪ Operating Income of $179M, up 12%; Operating Margin of 19.4%, up 110 bps YOY ▪ Delivered margin expansion across all three segments ▪ Diluted EPS of $3.72, up 15% ▪ Free Cash Flow (FCF) of $160M, up 37%; 116% conversion ▪ New Orders of $1.1B, up 8%, reflecting growth in A&D and Commercial markets; 1.16x Book-to-Bill ▪ Record quarter for Defense Electronics segment Updated FY2026 Guidance ▪ Total Sales growth raised to 8 - 9%, driven by strong H1 and record backlog ▪ Operating Margin increased to 19.1% - 19.3%, up 50 - 70 bps YOY, reflecting margin expansion in all segments ▪ On track for mid-teens EPS growth, up 14 - 16% ▪ Strong FCF generation of $585 - $605M, maintaining >105% conversion Note: 2026 financial results and 2026 guidance, and comparisons to prior-year periods, presented on an Adjusted (Non-GAAP) basis
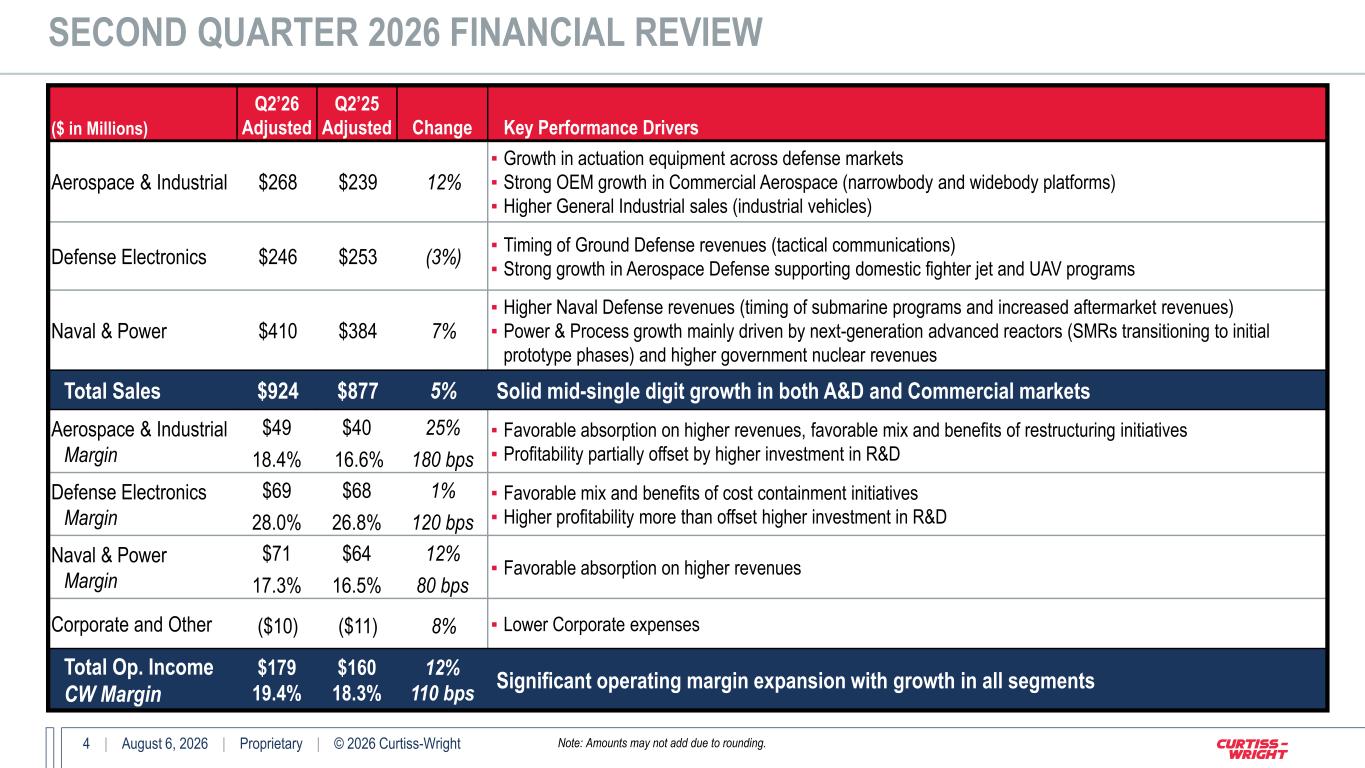
4 | August 6, 2026 | Proprietary | © 2026 Curtiss-Wright ($ in Millions) Q2’26 Adjusted Q2’25 Adjusted Change Key Performance Drivers Aerospace & Industrial $268 $239 12% ▪ Growth in actuation equipment across defense markets ▪ Strong OEM growth in Commercial Aerospace (narrowbody and widebody platforms) ▪ Higher General Industrial sales (industrial vehicles) Defense Electronics $246 $253 (3%) ▪ Timing of Ground Defense revenues (tactical communications) ▪ Strong growth in Aerospace Defense supporting domestic fighter jet and UAV programs Naval & Power $410 $384 7% ▪ Higher Naval Defense revenues (timing of submarine programs and increased aftermarket revenues) ▪ Power & Process growth mainly driven by next-generation advanced reactors (SMRs transitioning to initial prototype phases) and higher government nuclear revenues Total Sales $924 $877 5% Solid mid-single digit growth in both A&D and Commercial markets Aerospace & Industrial Margin $49 18.4% $40 16.6% 25% 180 bps ▪ Favorable absorption on higher revenues, favorable mix and benefits of restructuring initiatives ▪ Profitability partially offset by higher investment in R&D Defense Electronics Margin $69 28.0% $68 26.8% 1% 120 bps ▪ Favorable mix and benefits of cost containment initiatives ▪ Higher profitability more than offset higher investment in R&D Naval & Power Margin $71 17.3% $64 16.5% 12% 80 bps ▪ Favorable absorption on higher revenues Corporate and Other ($10) ($11) 8% ▪ Lower Corporate expenses Total Op. Income CW Margin $179 19.4% $160 18.3% 12% 110 bps Significant operating margin expansion with growth in all segments SECOND QUARTER 2026 FINANCIAL REVIEW Note: Amounts may not add due to rounding.
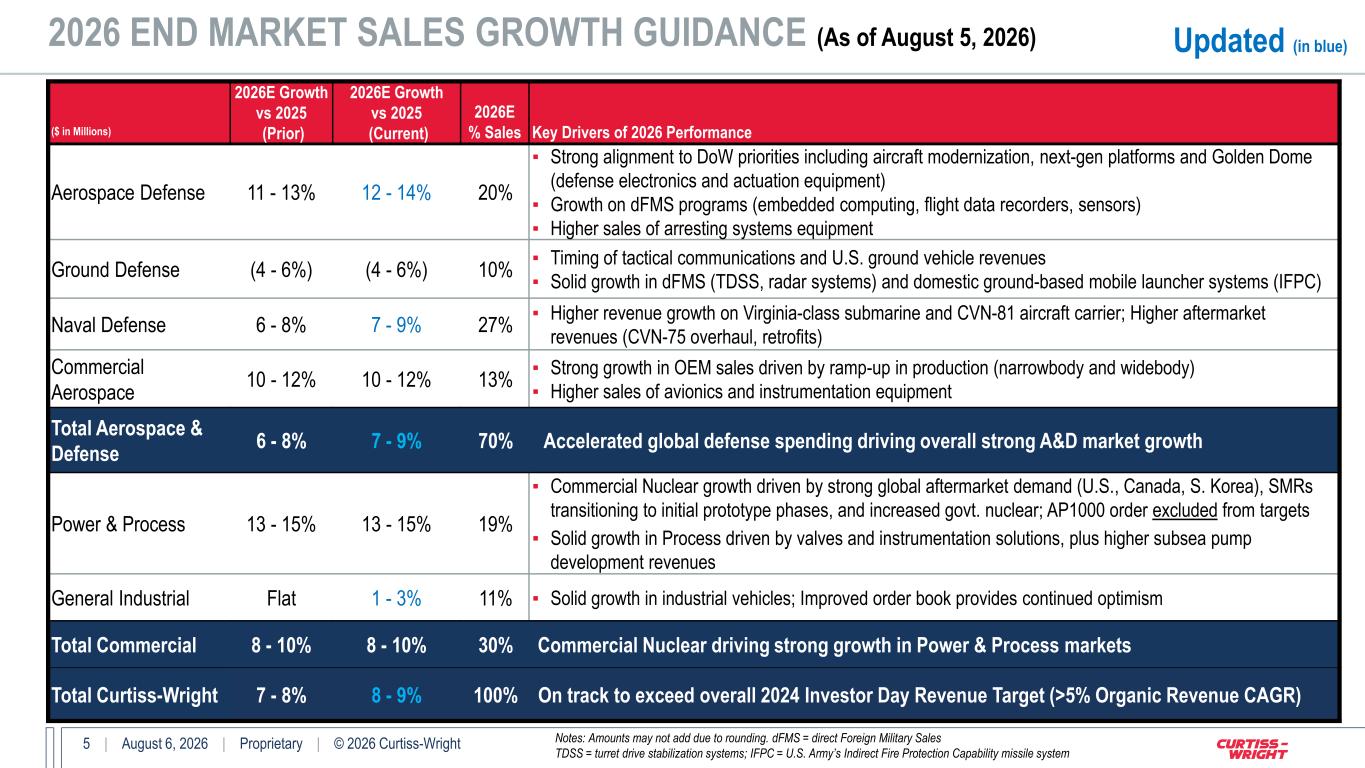
5 | August 6, 2026 | Proprietary | © 2026 Curtiss-Wright 2026 END MARKET SALES GROWTH GUIDANCE (As of August 5, 2026) Notes: Amounts may not add due to rounding. dFMS = direct Foreign Military Sales TDSS = turret drive stabilization systems; IFPC = U.S. Army’s Indirect Fire Protection Capability missile system ($ in Millions) 2026E Growth vs 2025 (Prior) 2026E Growth vs 2025 (Current) 2026E % Sales Key Drivers of 2026 Performance Aerospace Defense 11 - 13% 12 - 14% 20% ▪ Strong alignment to DoW priorities including aircraft modernization, next-gen platforms and Golden Dome (defense electronics and actuation equipment) ▪ Growth on dFMS programs (embedded computing, flight data recorders, sensors) ▪ Higher sales of arresting systems equipment Ground Defense (4 - 6%) (4 - 6%) 10% ▪ Timing of tactical communications and U.S. ground vehicle revenues ▪ Solid growth in dFMS (TDSS, radar systems) and domestic ground-based mobile launcher systems (IFPC) Naval Defense 6 - 8% 7 - 9% 27% ▪ Higher revenue growth on Virginia-class submarine and CVN-81 aircraft carrier; Higher aftermarket revenues (CVN-75 overhaul, retrofits) Commercial Aerospace 10 - 12% 10 - 12% 13% ▪ Strong growth in OEM sales driven by ramp-up in production (narrowbody and widebody) ▪ Higher sales of avionics and instrumentation equipment Total Aerospace & Defense 6 - 8% 7 - 9% 70% Accelerated global defense spending driving overall strong A&D market growth Power & Process 13 - 15% 13 - 15% 19% ▪ Commercial Nuclear growth driven by strong global aftermarket demand (U.S., Canada, S. Korea), SMRs transitioning to initial prototype phases, and increased govt. nuclear; AP1000 order excluded from targets ▪ Solid growth in Process driven by valves and instrumentation solutions, plus higher subsea pump development revenues General Industrial Flat 1 - 3% 11% ▪ Solid growth in industrial vehicles; Improved order book provides continued optimism Total Commercial 8 - 10% 8 - 10% 30% Commercial Nuclear driving strong growth in Power & Process markets Total Curtiss-Wright 7 - 8% 8 - 9% 100% On track to exceed overall 2024 Investor Day Revenue Target (>5% Organic Revenue CAGR) Updated (in blue)
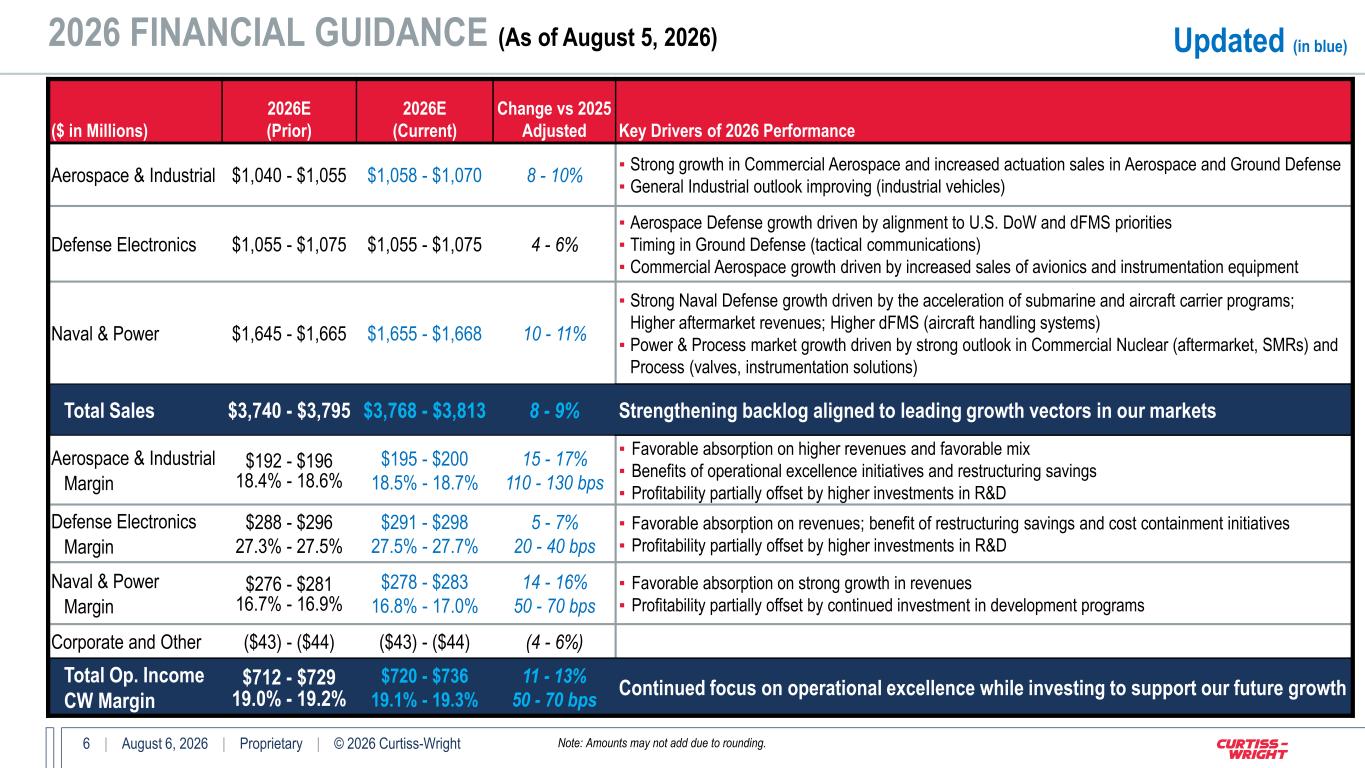
6 | August 6, 2026 | Proprietary | © 2026 Curtiss-Wright 2026 FINANCIAL GUIDANCE (As of August 5, 2026) ($ in Millions) 2026E (Prior) 2026E (Current) Change vs 2025 Adjusted Key Drivers of 2026 Performance Aerospace & Industrial $1,040 - $1,055 $1,058 - $1,070 8 - 10% ▪ Strong growth in Commercial Aerospace and increased actuation sales in Aerospace and Ground Defense ▪ General Industrial outlook improving (industrial vehicles) Defense Electronics $1,055 - $1,075 $1,055 - $1,075 4 - 6% ▪ Aerospace Defense growth driven by alignment to U.S. DoW and dFMS priorities ▪ Timing in Ground Defense (tactical communications) ▪ Commercial Aerospace growth driven by increased sales of avionics and instrumentation equipment Naval & Power $1,645 - $1,665 $1,655 - $1,668 10 - 11% ▪ Strong Naval Defense growth driven by the acceleration of submarine and aircraft carrier programs; Higher aftermarket revenues; Higher dFMS (aircraft handling systems) ▪ Power & Process market growth driven by strong outlook in Commercial Nuclear (aftermarket, SMRs) and Process (valves, instrumentation solutions) Total Sales $3,740 - $3,795 $3,768 - $3,813 8 - 9% Strengthening backlog aligned to leading growth vectors in our markets Aerospace & Industrial Margin $192 - $196 18.4% - 18.6% $195 - $200 18.5% - 18.7% 15 - 17% 110 - 130 bps ▪ Favorable absorption on higher revenues and favorable mix ▪ Benefits of operational excellence initiatives and restructuring savings ▪ Profitability partially offset by higher investments in R&D Defense Electronics Margin $288 - $296 27.3% - 27.5% $291 - $298 27.5% - 27.7% 5 - 7% 20 - 40 bps ▪ Favorable absorption on revenues; benefit of restructuring savings and cost containment initiatives ▪ Profitability partially offset by higher investments in R&D Naval & Power Margin $276 - $281 16.7% - 16.9% $278 - $283 16.8% - 17.0% 14 - 16% 50 - 70 bps ▪ Favorable absorption on strong growth in revenues ▪ Profitability partially offset by continued investment in development programs Corporate and Other ($43) - ($44) ($43) - ($44) (4 - 6%) Total Op. Income CW Margin $712 - $729 19.0% - 19.2% $720 - $736 19.1% - 19.3% 11 - 13% 50 - 70 bps Continued focus on operational excellence while investing to support our future growth Updated (in blue) Note: Amounts may not add due to rounding.
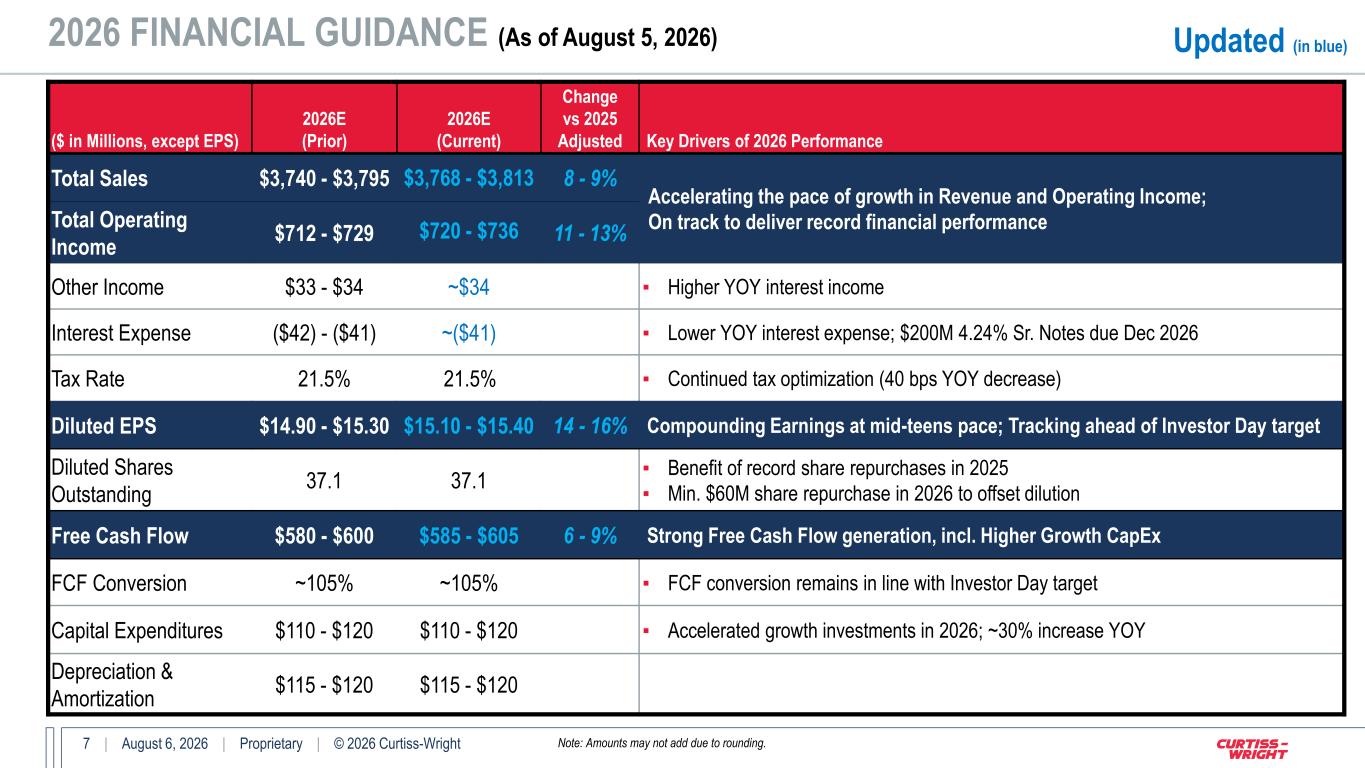
7 | August 6, 2026 | Proprietary | © 2026 Curtiss-Wright 2026 FINANCIAL GUIDANCE (As of August 5, 2026) ($ in Millions, except EPS) 2026E (Prior) 2026E (Current) Change vs 2025 Adjusted Key Drivers of 2026 Performance Total Sales $3,740 - $3,795 $3,768 - $3,813 8 - 9% Accelerating the pace of growth in Revenue and Operating Income; On track to deliver record financial performanceTotal Operating Income $712 - $729 $720 - $736 11 - 13% Other Income $33 - $34 ~$34 ▪ Higher YOY interest income Interest Expense ($42) - ($41) ~($41) ▪ Lower YOY interest expense; $200M 4.24% Sr. Notes due Dec 2026 Tax Rate 21.5% 21.5% ▪ Continued tax optimization (40 bps YOY decrease) Diluted EPS $14.90 - $15.30 $15.10 - $15.40 14 - 16% Compounding Earnings at mid-teens pace; Tracking ahead of Investor Day target Diluted Shares Outstanding 37.1 37.1 ▪ Benefit of record share repurchases in 2025 ▪ Min. $60M share repurchase in 2026 to offset dilution Free Cash Flow $580 - $600 $585 - $605 6 - 9% Strong Free Cash Flow generation, incl. Higher Growth CapEx FCF Conversion ~105% ~105% ▪ FCF conversion remains in line with Investor Day target Capital Expenditures $110 - $120 $110 - $120 ▪ Accelerated growth investments in 2026; ~30% increase YOY Depreciation & Amortization $115 - $120 $115 - $120 Updated (in blue) Note: Amounts may not add due to rounding.
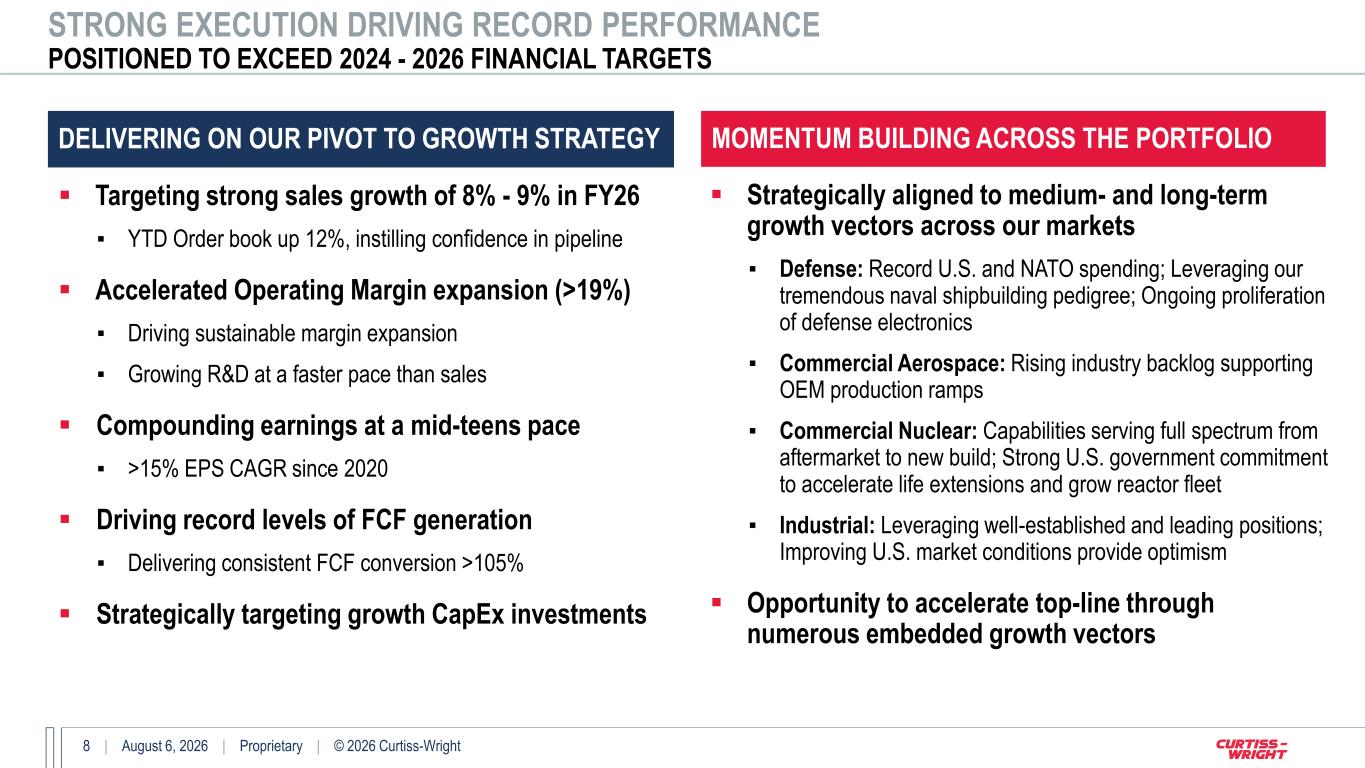
8 | August 6, 2026 | Proprietary | © 2026 Curtiss-Wright MOMENTUM BUILDING ACROSS THE PORTFOLIO STRONG EXECUTION DRIVING RECORD PERFORMANCE POSITIONED TO EXCEED 2024 - 2026 FINANCIAL TARGETS ▪ Targeting strong sales growth of 8% - 9% in FY26 ▪ YTD Order book up 12%, instilling confidence in pipeline ▪ Accelerated Operating Margin expansion (>19%) ▪ Driving sustainable margin expansion ▪ Growing R&D at a faster pace than sales ▪ Compounding earnings at a mid-teens pace ▪ >15% EPS CAGR since 2020 ▪ Driving record levels of FCF generation ▪ Delivering consistent FCF conversion >105% ▪ Strategically targeting growth CapEx investments DELIVERING ON OUR PIVOT TO GROWTH STRATEGY ▪ Strategically aligned to medium- and long-term growth vectors across our markets ▪ Defense: Record U.S. and NATO spending; Leveraging our tremendous naval shipbuilding pedigree; Ongoing proliferation of defense electronics ▪ Commercial Aerospace: Rising industry backlog supporting OEM production ramps ▪ Commercial Nuclear: Capabilities serving full spectrum from aftermarket to new build; Strong U.S. government commitment to accelerate life extensions and grow reactor fleet ▪ Industrial: Leveraging well-established and leading positions; Improving U.S. market conditions provide optimism ▪ Opportunity to accelerate top-line through numerous embedded growth vectors
9 | August 6, 2026 | Proprietary | © 2026 Curtiss-Wright Appendix
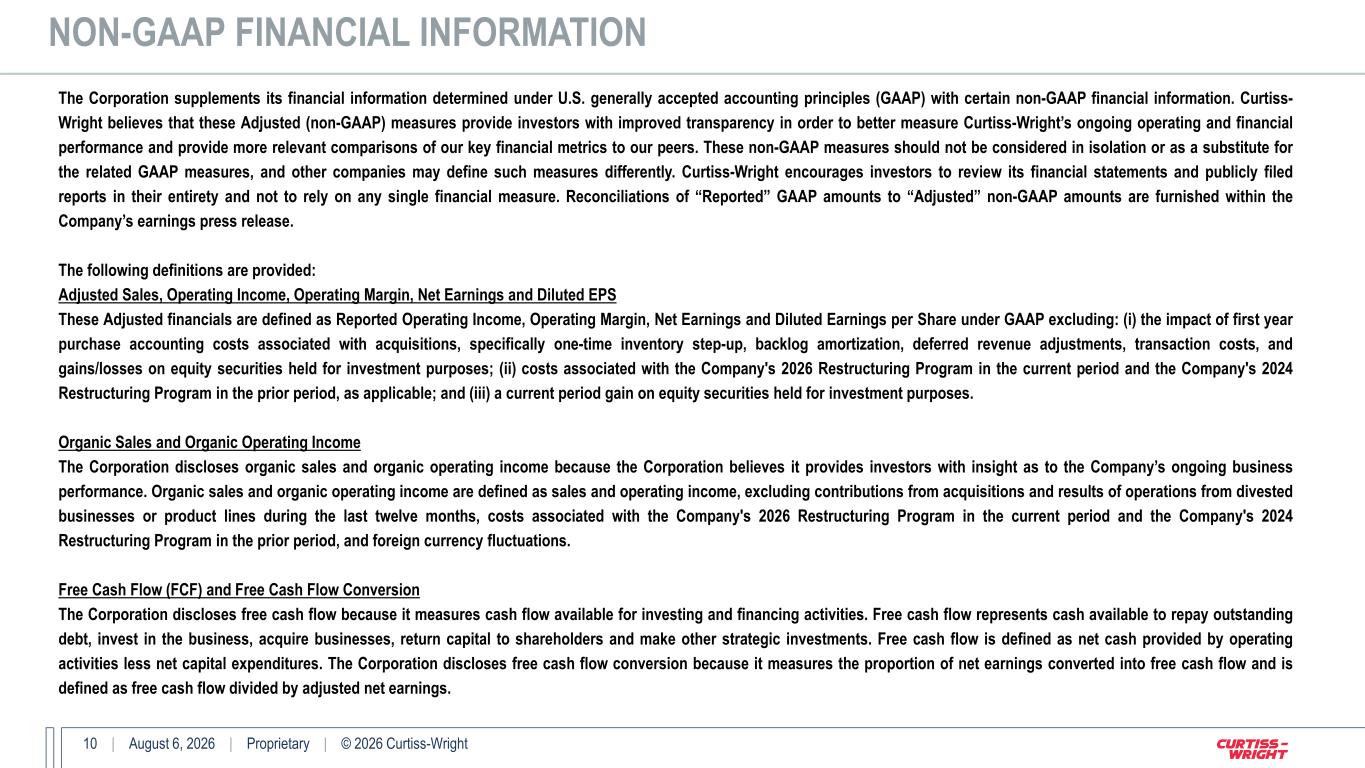
10 | August 6, 2026 | Proprietary | © 2026 Curtiss-Wright The Corporation supplements its financial information determined under U.S. generally accepted accounting principles (GAAP) with certain non-GAAP financial information. Curtiss- Wright believes that these Adjusted (non-GAAP) measures provide investors with improved transparency in order to better measure Curtiss-Wright’s ongoing operating and financial performance and provide more relevant comparisons of our key financial metrics to our peers. These non-GAAP measures should not be considered in isolation or as a substitute for the related GAAP measures, and other companies may define such measures differently. Curtiss-Wright encourages investors to review its financial statements and publicly filed reports in their entirety and not to rely on any single financial measure. Reconciliations of “Reported” GAAP amounts to “Adjusted” non-GAAP amounts are furnished within the Company’s earnings press release. The following definitions are provided: Adjusted Sales, Operating Income, Operating Margin, Net Earnings and Diluted EPS These Adjusted financials are defined as Reported Operating Income, Operating Margin, Net Earnings and Diluted Earnings per Share under GAAP excluding: (i) the impact of first year purchase accounting costs associated with acquisitions, specifically one-time inventory step-up, backlog amortization, deferred revenue adjustments, transaction costs, and gains/losses on equity securities held for investment purposes; (ii) costs associated with the Company's 2026 Restructuring Program in the current period and the Company's 2024 Restructuring Program in the prior period, as applicable; and (iii) a current period gain on equity securities held for investment purposes. Organic Sales and Organic Operating Income The Corporation discloses organic sales and organic operating income because the Corporation believes it provides investors with insight as to the Company’s ongoing business performance. Organic sales and organic operating income are defined as sales and operating income, excluding contributions from acquisitions and results of operations from divested businesses or product lines during the last twelve months, costs associated with the Company's 2026 Restructuring Program in the current period and the Company's 2024 Restructuring Program in the prior period, and foreign currency fluctuations. Free Cash Flow (FCF) and Free Cash Flow Conversion The Corporation discloses free cash flow because it measures cash flow available for investing and financing activities. Free cash flow represents cash available to repay outstanding debt, invest in the business, acquire businesses, return capital to shareholders and make other strategic investments. Free cash flow is defined as net cash provided by operating activities less net capital expenditures. The Corporation discloses free cash flow conversion because it measures the proportion of net earnings converted into free cash flow and is defined as free cash flow divided by adjusted net earnings. NON-GAAP FINANCIAL INFORMATION
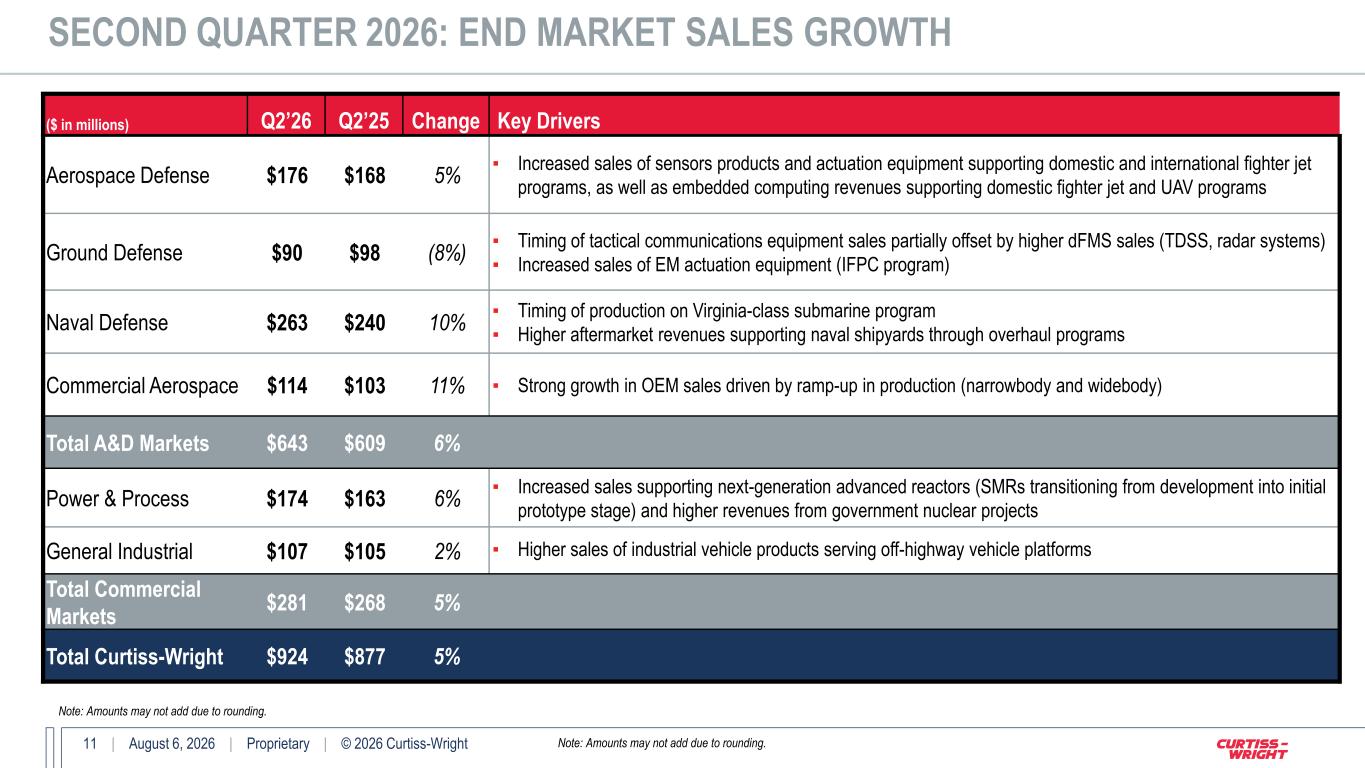
11 | August 6, 2026 | Proprietary | © 2026 Curtiss-Wright ($ in millions) Q2’26 Q2’25 Change Key Drivers Aerospace Defense $176 $168 5% ▪ Increased sales of sensors products and actuation equipment supporting domestic and international fighter jet programs, as well as embedded computing revenues supporting domestic fighter jet and UAV programs Ground Defense $90 $98 (8%) ▪ Timing of tactical communications equipment sales partially offset by higher dFMS sales (TDSS, radar systems) ▪ Increased sales of EM actuation equipment (IFPC program) Naval Defense $263 $240 10% ▪ Timing of production on Virginia-class submarine program ▪ Higher aftermarket revenues supporting naval shipyards through overhaul programs Commercial Aerospace $114 $103 11% ▪ Strong growth in OEM sales driven by ramp-up in production (narrowbody and widebody) Total A&D Markets $643 $609 6% Power & Process $174 $163 6% ▪ Increased sales supporting next-generation advanced reactors (SMRs transitioning from development into initial prototype stage) and higher revenues from government nuclear projects General Industrial $107 $105 2% ▪ Higher sales of industrial vehicle products serving off-highway vehicle platforms Total Commercial Markets $281 $268 5% Total Curtiss-Wright $924 $877 5% SECOND QUARTER 2026: END MARKET SALES GROWTH Note: Amounts may not add due to rounding. Note: Amounts may not add due to rounding.
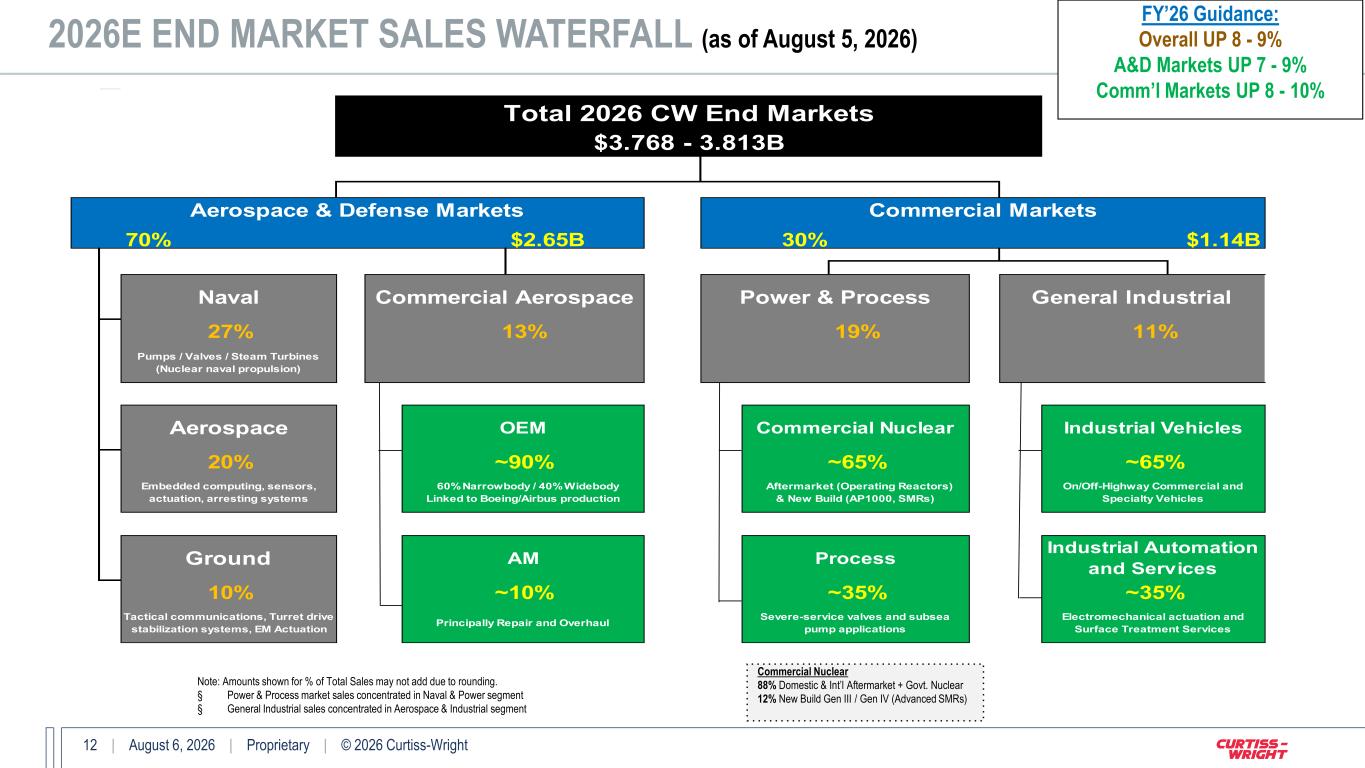
12 | August 6, 2026 | Proprietary | © 2026 Curtiss-Wright 2026E END MARKET SALES WATERFALL (as of August 5, 2026) Note: Amounts shown for % of Total Sales may not add due to rounding. § Power & Process market sales concentrated in Naval & Power segment § General Industrial sales concentrated in Aerospace & Industrial segment Commercial Nuclear 88% Domestic & Int’l Aftermarket + Govt. Nuclear 12% New Build Gen III / Gen IV (Advanced SMRs) 70% $2.65B 30% $1.14B Industrial Vehicles Tactical communications, Turret drive stabilization systems, EM Actuation Principally Repair and Overhaul Aerospace & Defense Markets Commercial Markets 27% 13% 20% 10% ~90% ~10% Embedded computing, sensors, actuation, arresting systems 60% Narrowbody / 40% Widebody Linked to Boeing/Airbus production Aerospace OEM Total 2026 CW End Markets $3.768 - 3.813B General IndustrialNaval Commercial Aerospace Power & Process Pumps / Valves / Steam Turbines (Nuclear naval propulsion) Ground AM ~35% 19% 11% ~65% Severe-service valves and subsea pump applications ~65% Electromechanical actuation and Surface Treatment Services Aftermarket (Operating Reactors) & New Build (AP1000, SMRs) On/Off-Highway Commercial and Specialty Vehicles Commercial Nuclear Process Industrial Automation and Services ~35% FY’26 Guidance: Overall UP 8 - 9% A&D Markets UP 7 - 9% Comm’l Markets UP 8 - 10%