
THIRD QUARTER FY2026 EARNINGS AUGUST 6, 2026
2 SAFE HARBOR The information provided in this presentation may include forward-looking statements relating to future events or the future financial performance of the Company. Because such statements are subject to risks and uncertainties, actual results may differ materially from those expressed or implied by such forward-looking statements. Words such as “aims”, “anticipates,” “plans,” “expects,” “intends,” “will,” “potential,” “hope” and similar expressions are intended to identify forward-looking statements. These forward-looking statements are based upon current expectations of the Company and involve assumptions that may never materialize or may prove to be incorrect. Actual results and the timing of events could differ materially from those anticipated in such forward-looking statements as a result of various risks and uncertainties. Detailed information regarding factors that may cause actual results to differ materially from the results expressed or implied by statements relating to the Company may be found in the Company’s periodic filings with the Commission, including the factors described in the sections entitled “Risk Factors,” copies of which may be obtained from the SEC’s website at www.sec.gov. The Company does not undertake any obligation to update forward-looking statements contained in this presentation.

3 LEE ENTERPRISES: AT-A-GLANCE Breaking newsServing 114 local markets across the USIntensely local content Lee Enterprises is a leading provider of high quality, trusted, local news and information. Our robust local and national digital media and advertising platforms are the fastest growing in the industry. Today, as throughout our history, in every one of the communities we serve, no competitor can match the indispensable local news, information and advertising we deliver to huge audiences of all ages.
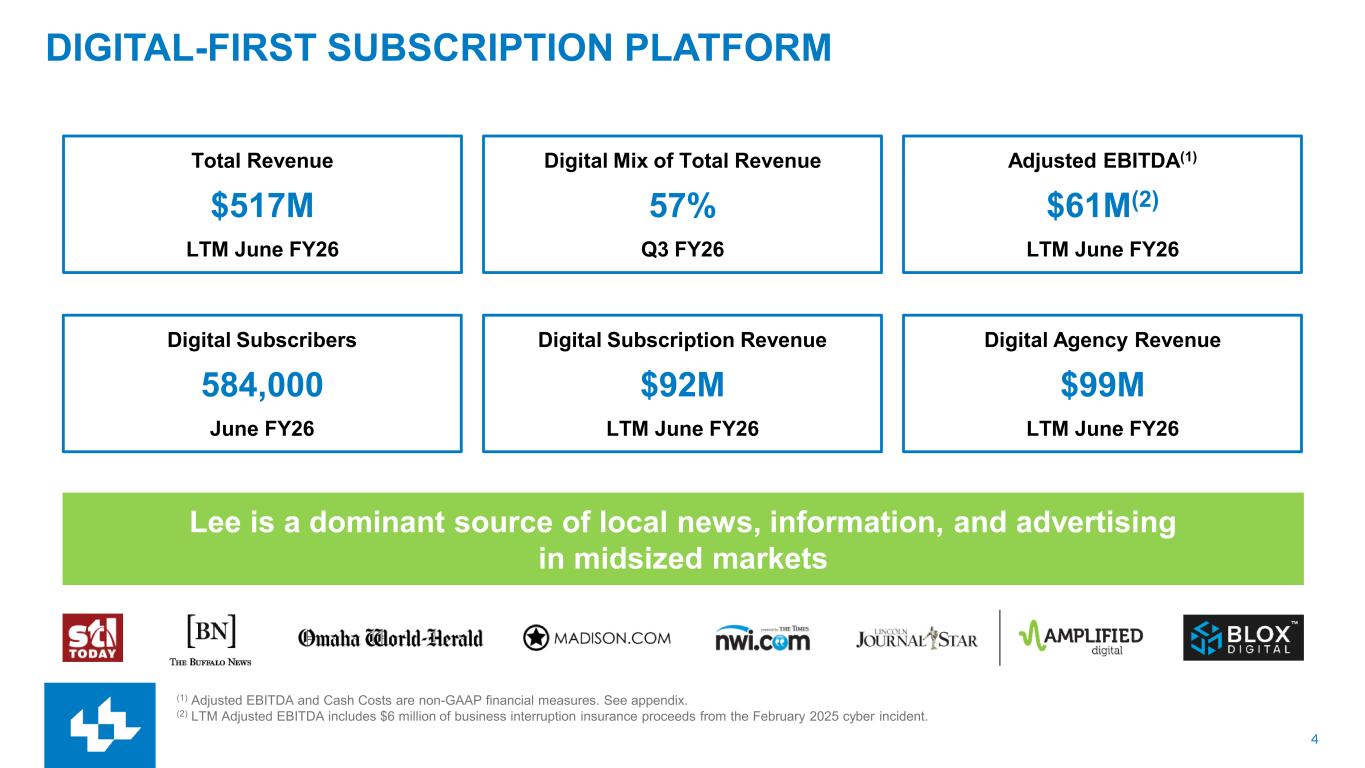
4 DIGITAL-FIRST SUBSCRIPTION PLATFORM Total Revenue $517M LTM June FY26 Digital Mix of Total Revenue 57% Q3 FY26 Adjusted EBITDA(1) $61M(2) LTM June FY26 Digital Subscribers 584,000 June FY26 Digital Subscription Revenue $92M LTM June FY26 Lee is a dominant source of local news, information, and advertising in midsized markets Digital Agency Revenue $99M LTM June FY26 (1) Adjusted EBITDA and Cash Costs are non-GAAP financial measures. See appendix. (2) LTM Adjusted EBITDA includes $6 million of business interruption insurance proceeds from the February 2025 cyber incident.
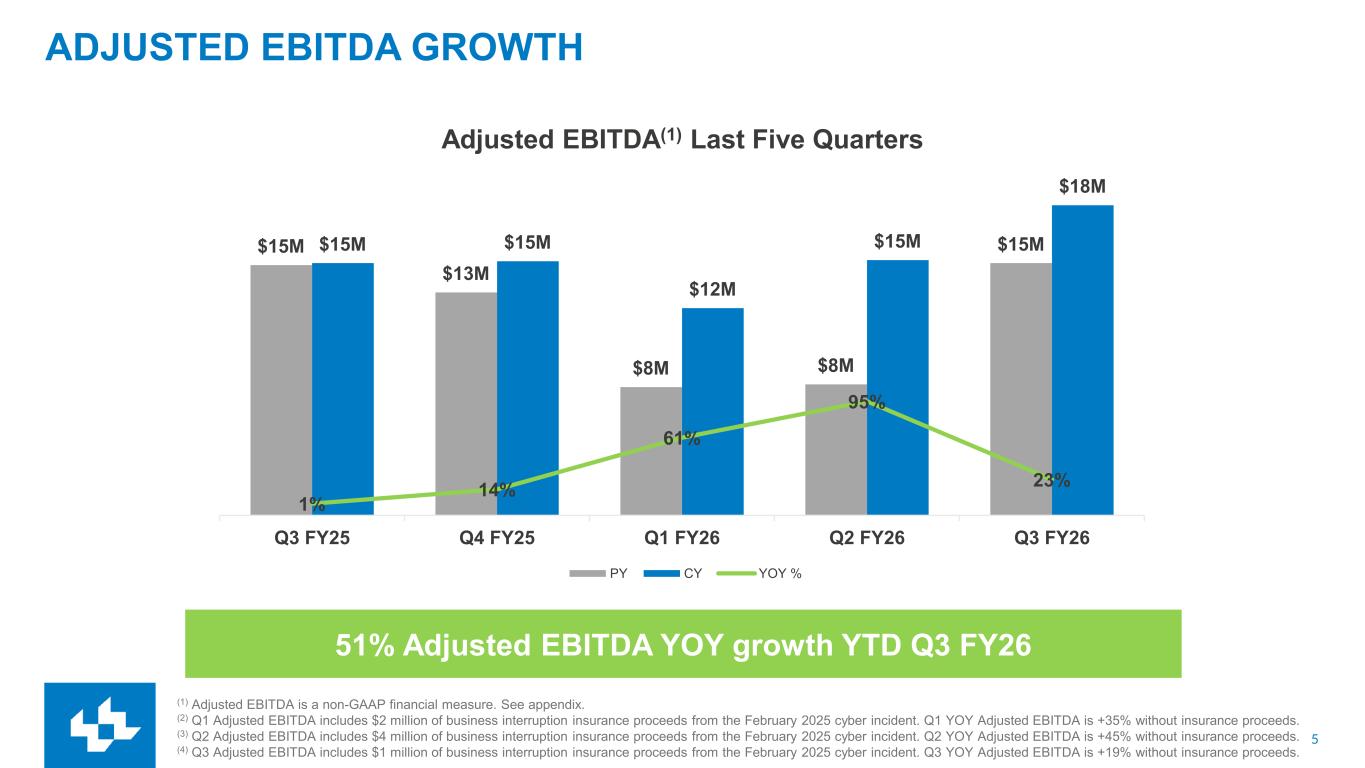
5 ADJUSTED EBITDA GROWTH (1) Adjusted EBITDA is a non-GAAP financial measure. See appendix. (2) Q1 Adjusted EBITDA includes $2 million of business interruption insurance proceeds from the February 2025 cyber incident. Q1 YOY Adjusted EBITDA is +35% without insurance proceeds. (3) Q2 Adjusted EBITDA includes $4 million of business interruption insurance proceeds from the February 2025 cyber incident. Q2 YOY Adjusted EBITDA is +45% without insurance proceeds. (4) Q3 Adjusted EBITDA includes $1 million of business interruption insurance proceeds from the February 2025 cyber incident. Q3 YOY Adjusted EBITDA is +19% without insurance proceeds. 51% Adjusted EBITDA YOY growth YTD Q3 FY26 $15M $13M $8M $8M $15M$15M $15M $12M $15M $18M 1% 14% 61% 95% 23% -10% 40% 90% 140% 190% 240% 290% - 2.0 4.0 6.0 8.0 10.0 12.0 14.0 16.0 18.0 20.0 Q3 FY25 Q4 FY25 Q1 FY26 Q2 FY26 Q3 FY26 Adjusted EBITDA(1) Last Five Quarters PY CY YOY %
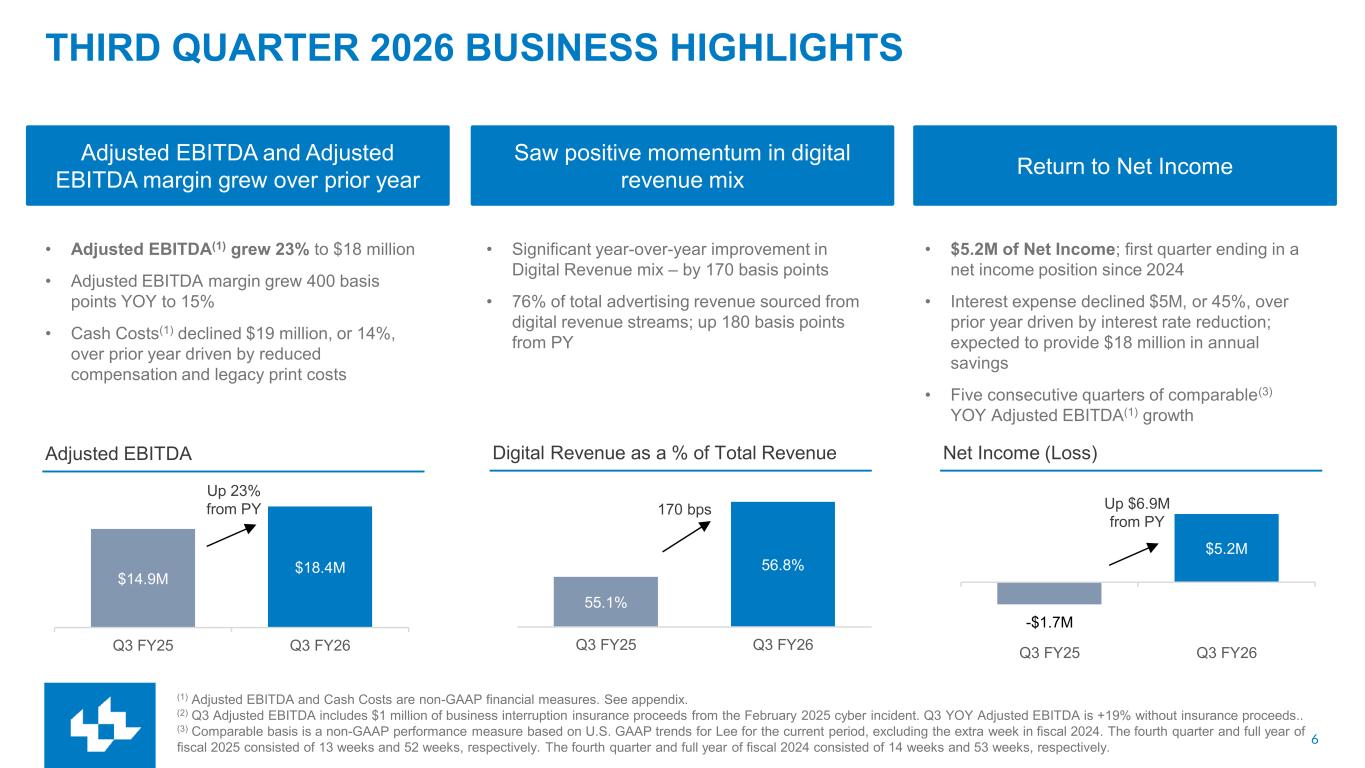
6 55.1% 56.8% Q3 FY25 Q3 FY26 $14.9M $18.4M Q3 FY25 Q3 FY26 THIRD QUARTER 2026 BUSINESS HIGHLIGHTS Adjusted EBITDA and Adjusted EBITDA margin grew over prior year • Adjusted EBITDA(1) grew 23% to $18 million • Adjusted EBITDA margin grew 400 basis points YOY to 15% • Cash Costs(1) declined $19 million, or 14%, over prior year driven by reduced compensation and legacy print costs Saw positive momentum in digital revenue mix Return to Net Income • Significant year-over-year improvement in Digital Revenue mix – by 170 basis points • 76% of total advertising revenue sourced from digital revenue streams; up 180 basis points from PY • $5.2M of Net Income; first quarter ending in a net income position since 2024 • Interest expense declined $5M, or 45%, over prior year driven by interest rate reduction; expected to provide $18 million in annual savings • Five consecutive quarters of comparable(3) YOY Adjusted EBITDA(1) growth (1) Adjusted EBITDA and Cash Costs are non-GAAP financial measures. See appendix. (2) Q3 Adjusted EBITDA includes $1 million of business interruption insurance proceeds from the February 2025 cyber incident. Q3 YOY Adjusted EBITDA is +19% without insurance proceeds.. (3) Comparable basis is a non-GAAP performance measure based on U.S. GAAP trends for Lee for the current period, excluding the extra week in fiscal 2024. The fourth quarter and full year of fiscal 2025 consisted of 13 weeks and 52 weeks, respectively. The fourth quarter and full year of fiscal 2024 consisted of 14 weeks and 53 weeks, respectively. Net Income (Loss)Digital Revenue as a % of Total RevenueAdjusted EBITDA Up 23% from PY 170 bps Up $6.9M from PY -$1.7M $5.2M Q3 FY25 Q3 FY26
7 STRATEGIES TO EXPAND DIGITAL ADVERTISING REVENUE 1. Recurring Revenue: • Move from transactional sales to predictable & performance-based deals 2. Integrated Solutions: • End-to-end marketing services that drive deeper client relationships 3. Data-driven Growth: • Utilize owned platforms and product innovation to create a scalable competitive advantage Key Themes Driving profitable, recurring revenue
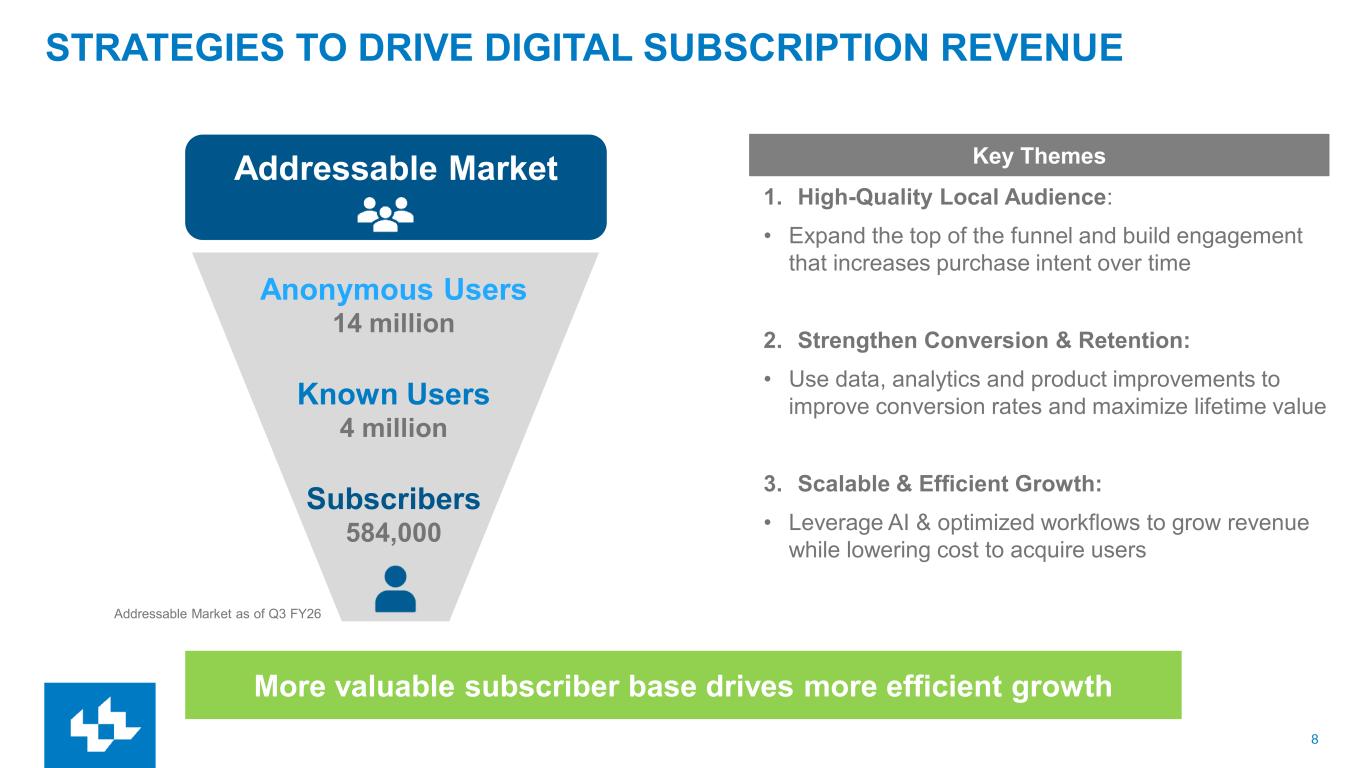
8 STRATEGIES TO DRIVE DIGITAL SUBSCRIPTION REVENUE Addressable Market Anonymous Users 14 million Known Users 4 million Subscribers 584,000 Addressable Market as of Q3 FY26 1. High-Quality Local Audience: • Expand the top of the funnel and build engagement that increases purchase intent over time 2. Strengthen Conversion & Retention: • Use data, analytics and product improvements to improve conversion rates and maximize lifetime value 3. Scalable & Efficient Growth: • Leverage AI & optimized workflows to grow revenue while lowering cost to acquire users Key Themes More valuable subscriber base drives more efficient growth
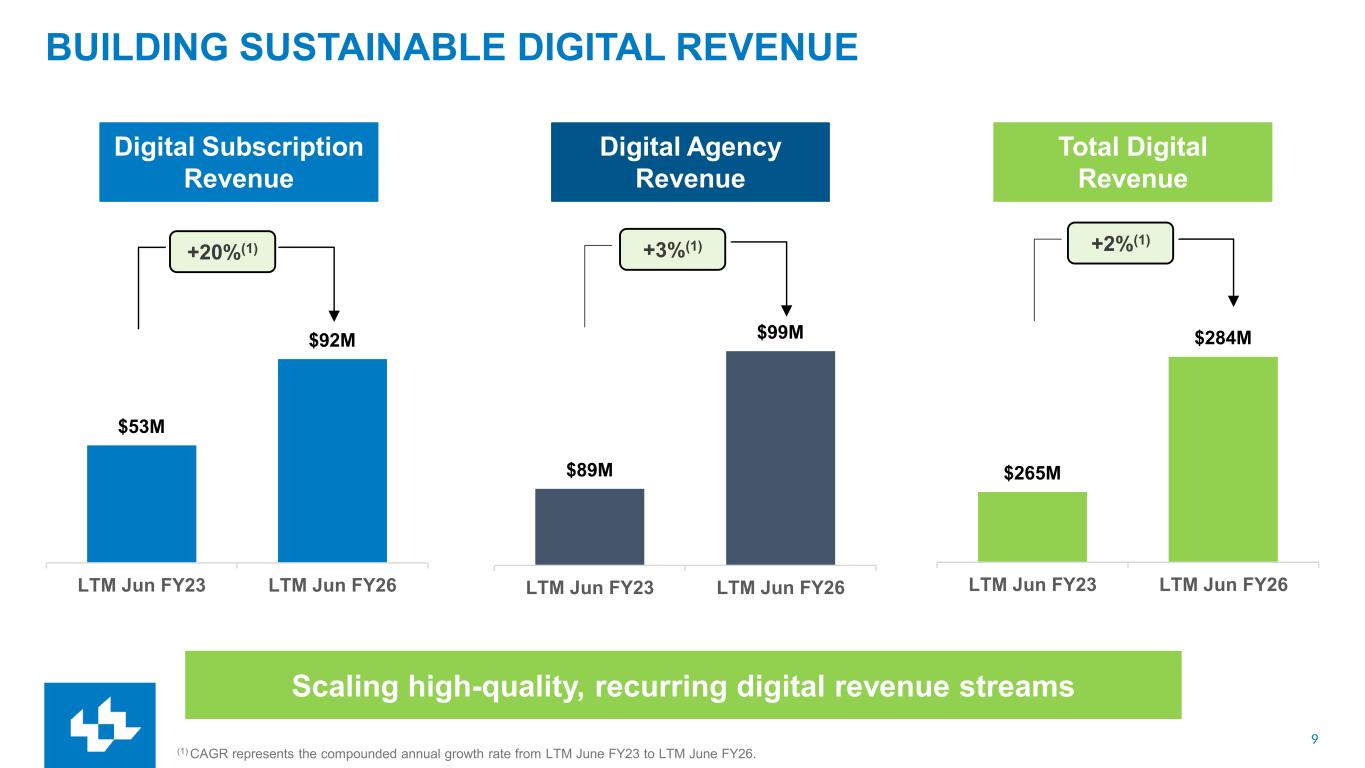
9 BUILDING SUSTAINABLE DIGITAL REVENUE (1) CAGR represents the compounded annual growth rate from LTM June FY23 to LTM June FY26. Scaling high-quality, recurring digital revenue streams Digital Subscription Revenue +20%(1) Digital Agency Revenue +3%(1) +2%(1) Total Digital Revenue $53M $92M LTM Jun FY23 LTM Jun FY26 $89M $99M LTM Jun FY23 LTM Jun FY26 $265M $284M LTM Jun FY23 LTM Jun FY26
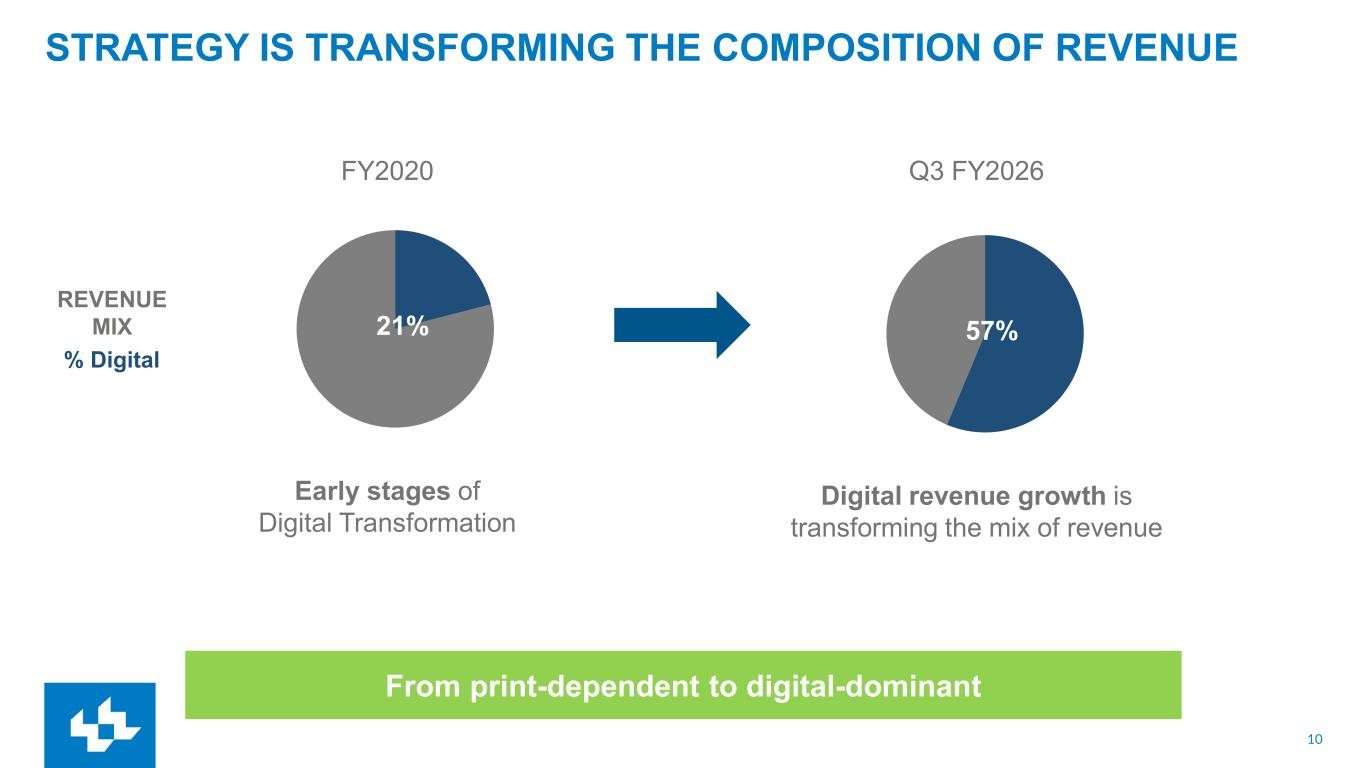
10 STRATEGY IS TRANSFORMING THE COMPOSITION OF REVENUE Early stages of Digital Transformation Digital revenue growth is transforming the mix of revenue FY2020 REVENUE MIX % Digital 7% 21% Q3 FY2026 57% From print-dependent to digital-dominant
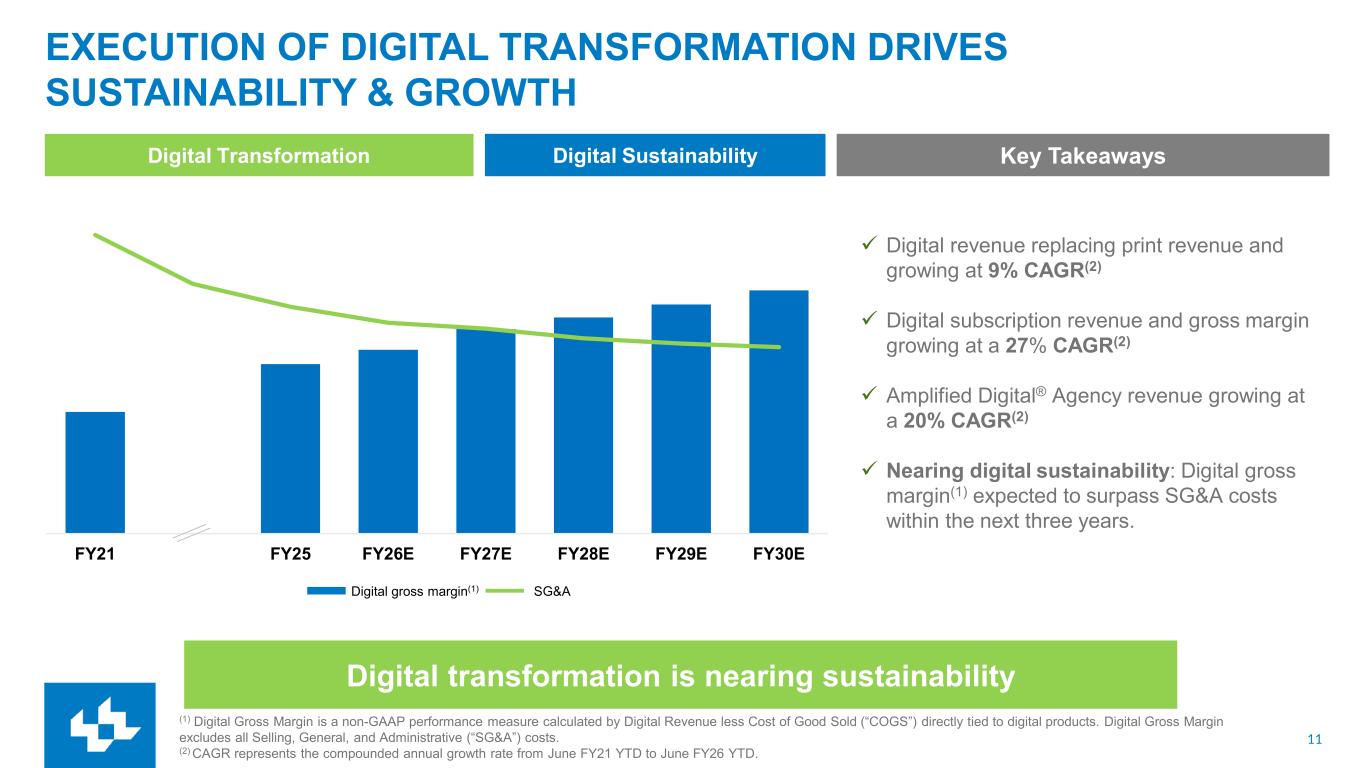
11 FY21 FY25 FY26E FY27E FY28E FY29E FY30E EXECUTION OF DIGITAL TRANSFORMATION DRIVES SUSTAINABILITY & GROWTH Digital Transformation Digital Sustainability Digital transformation is nearing sustainability Digital gross margin(1) SG&A Key Takeaways ✓ Digital revenue replacing print revenue and growing at 9% CAGR(2) ✓ Digital subscription revenue and gross margin growing at a 27% CAGR(2) ✓ Amplified Digital® Agency revenue growing at a 20% CAGR(2) ✓ Nearing digital sustainability: Digital gross margin(1) expected to surpass SG&A costs within the next three years. (1) Digital Gross Margin is a non-GAAP performance measure calculated by Digital Revenue less Cost of Good Sold (“COGS”) directly tied to digital products. Digital Gross Margin excludes all Selling, General, and Administrative (“SG&A”) costs. (2) CAGR represents the compounded annual growth rate from June FY21 YTD to June FY26 YTD.
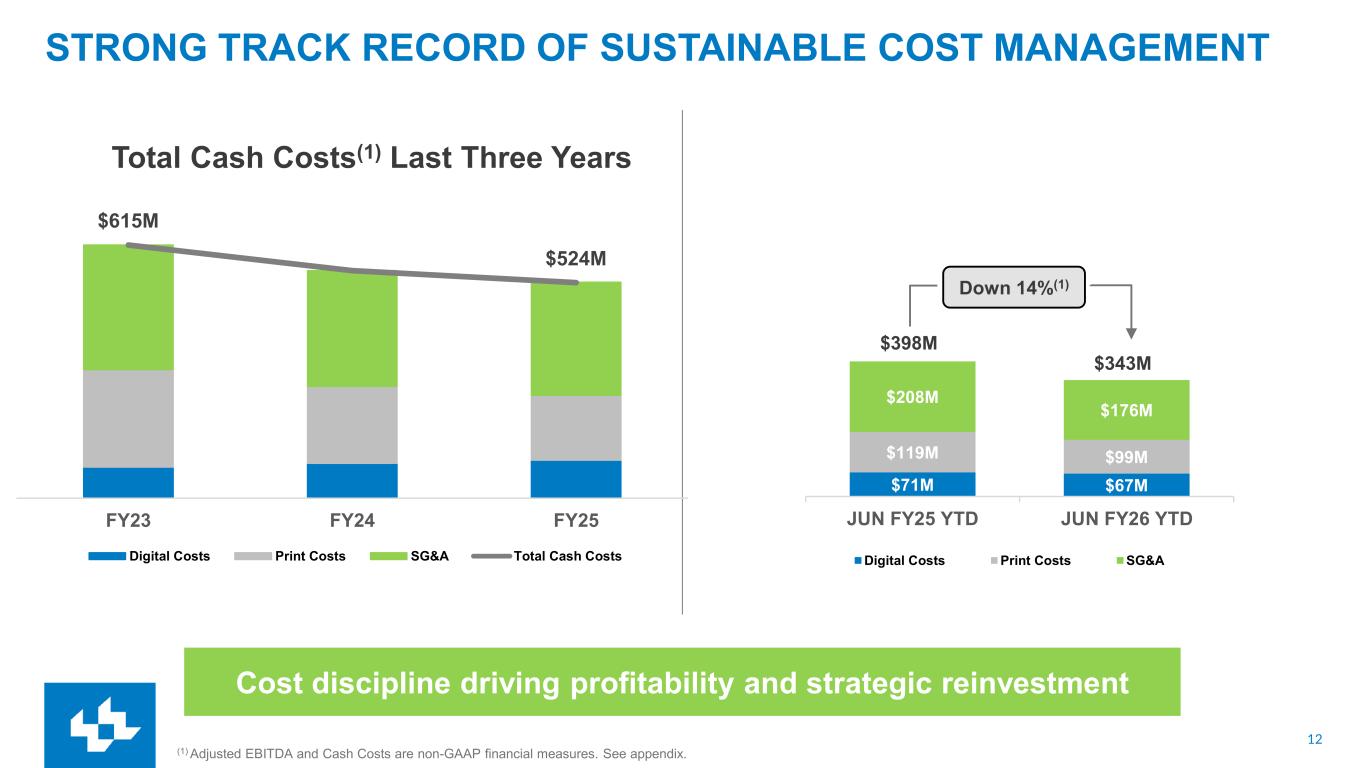
12 $71M $67M $119M $99M $208M $176M JUN FY25 YTD JUN FY26 YTD Digital Costs Print Costs SG&A STRONG TRACK RECORD OF SUSTAINABLE COST MANAGEMENT Cost discipline driving profitability and strategic reinvestment (1) Adjusted EBITDA and Cash Costs are non-GAAP financial measures. See appendix. Down 14%(1) $343M $398M $615M $524M FY23 FY24 FY25 Digital Costs Print Costs SG&A Total Cash Costs Total Cash Costs(1) Last Three Years
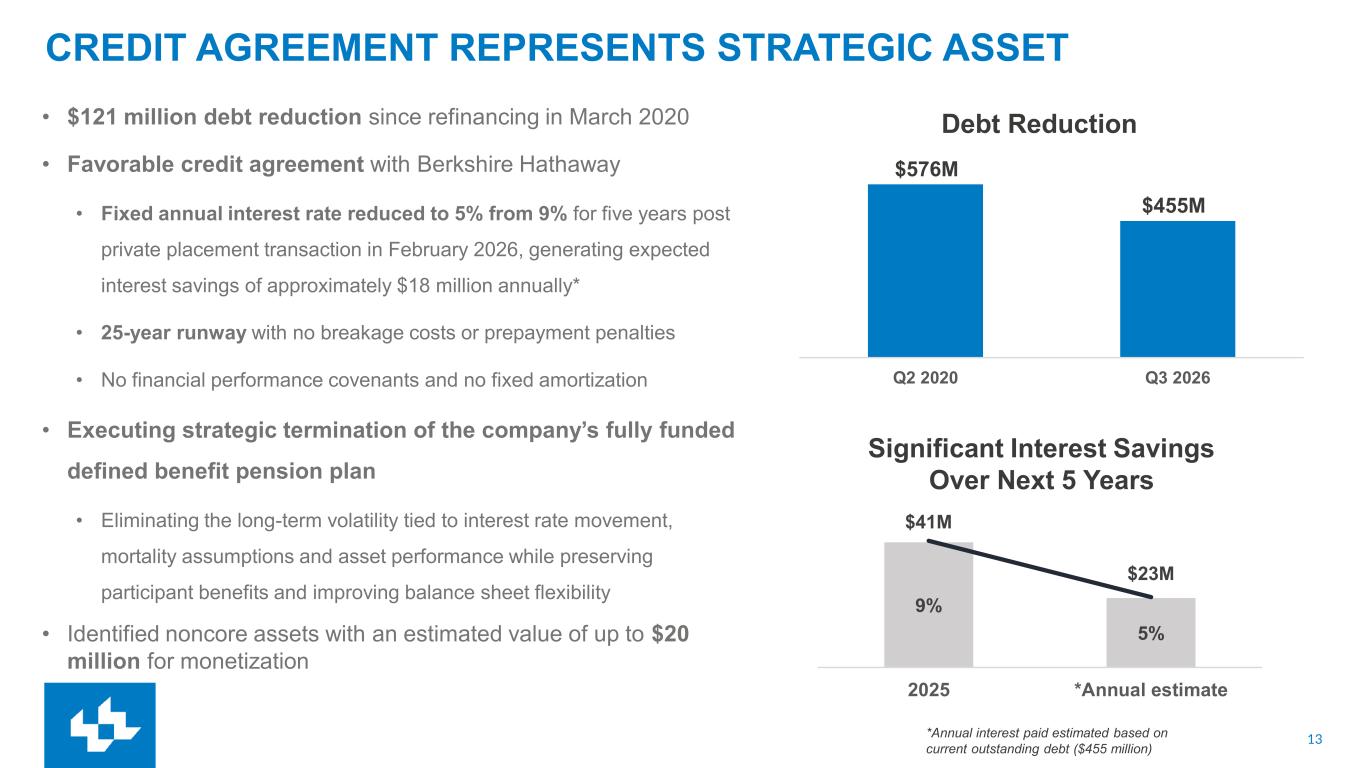
13 Q2 2020 Q3 2026 CREDIT AGREEMENT REPRESENTS STRATEGIC ASSET • $121 million debt reduction since refinancing in March 2020 • Favorable credit agreement with Berkshire Hathaway • Fixed annual interest rate reduced to 5% from 9% for five years post private placement transaction in February 2026, generating expected interest savings of approximately $18 million annually* • 25-year runway with no breakage costs or prepayment penalties • No financial performance covenants and no fixed amortization • Executing strategic termination of the company’s fully funded defined benefit pension plan • Eliminating the long-term volatility tied to interest rate movement, mortality assumptions and asset performance while preserving participant benefits and improving balance sheet flexibility • Identified noncore assets with an estimated value of up to $20 million for monetization $576M $455M Debt Reduction Significant Interest Savings Over Next 5 Years *Annual interest paid estimated based on current outstanding debt ($455 million) 9% 5% $41M $23M 2025 *Annual estimate
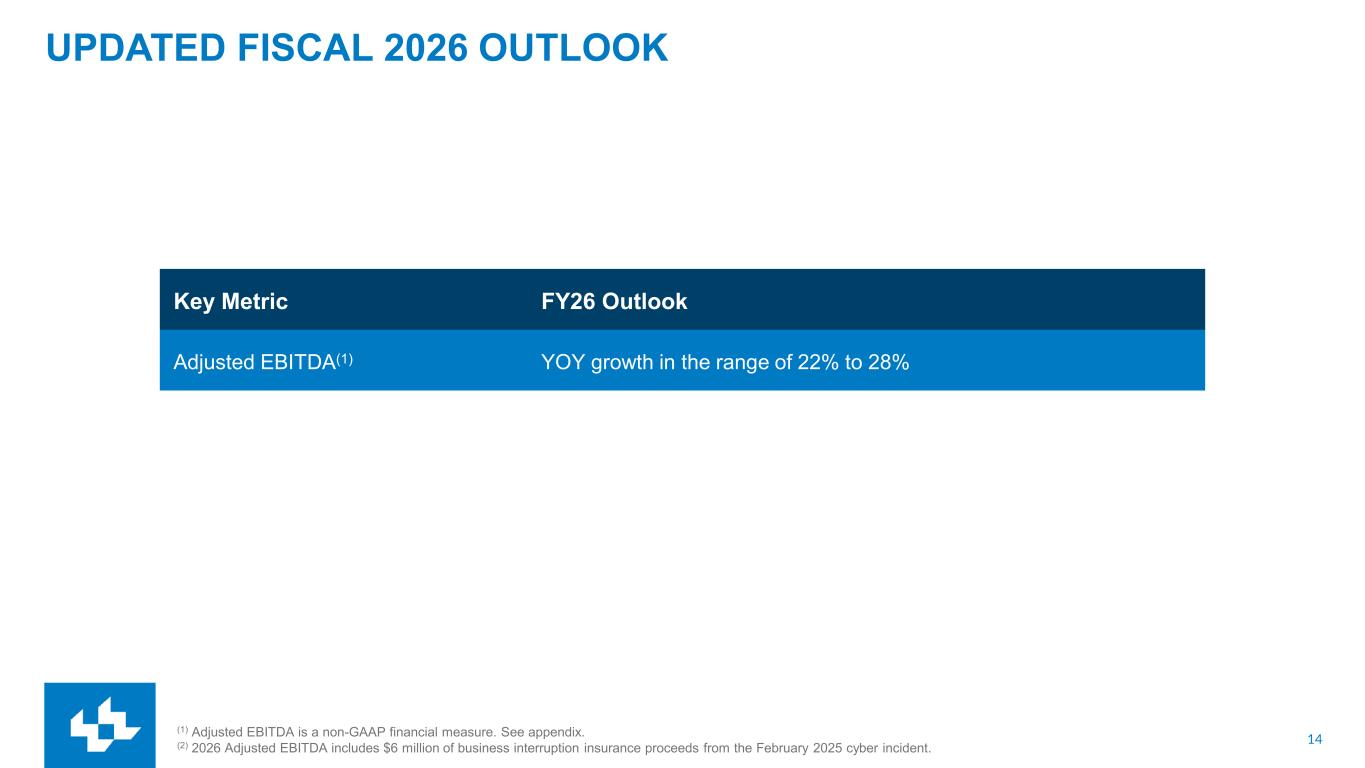
14 UPDATED FISCAL 2026 OUTLOOK (1) Adjusted EBITDA is a non-GAAP financial measure. See appendix. (2) 2026 Adjusted EBITDA includes $6 million of business interruption insurance proceeds from the February 2025 cyber incident. Key Metric FY26 Outlook Adjusted EBITDA(1) YOY growth in the range of 22% to 28%

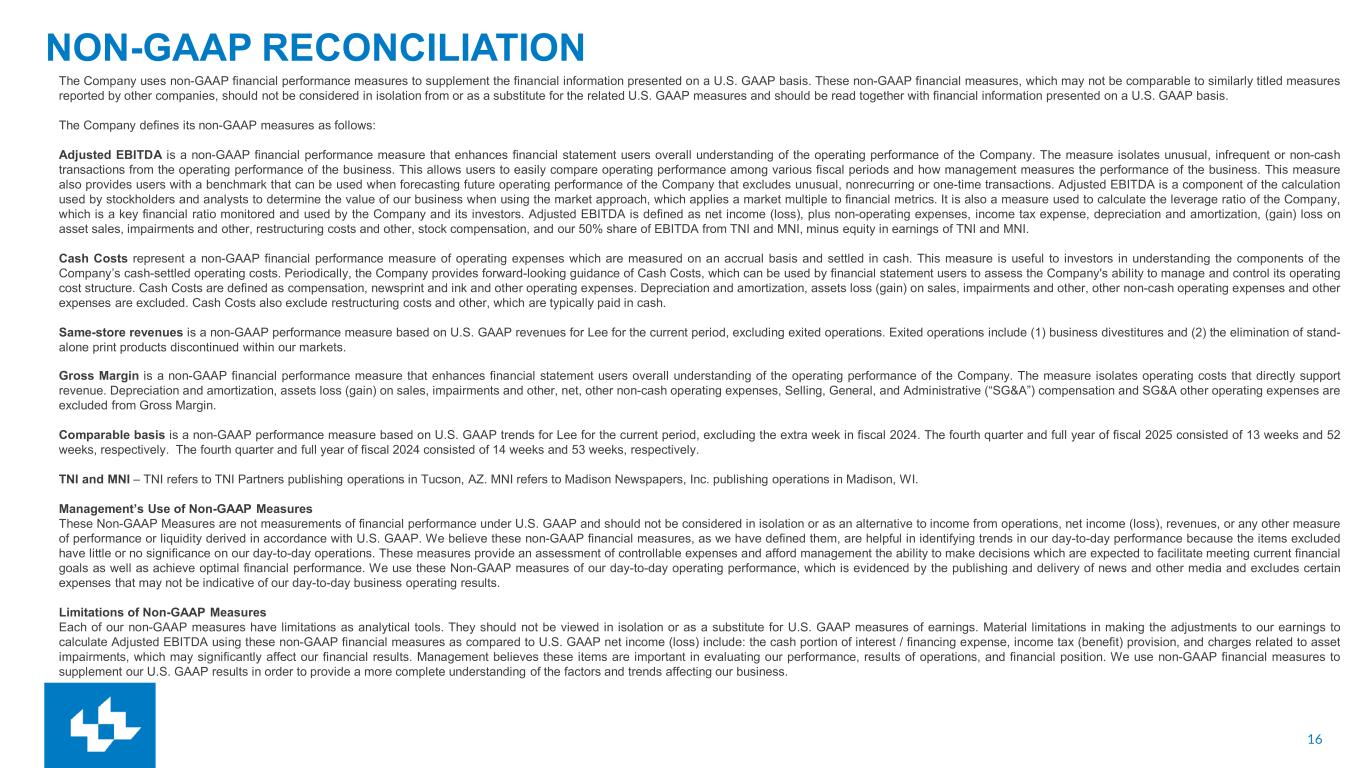
16 NON-GAAP RECONCILIATION The Company uses non-GAAP financial performance measures to supplement the financial information presented on a U.S. GAAP basis. These non-GAAP financial measures, which may not be comparable to similarly titled measures reported by other companies, should not be considered in isolation from or as a substitute for the related U.S. GAAP measures and should be read together with financial information presented on a U.S. GAAP basis. The Company defines its non-GAAP measures as follows: Adjusted EBITDA is a non-GAAP financial performance measure that enhances financial statement users overall understanding of the operating performance of the Company. The measure isolates unusual, infrequent or non-cash transactions from the operating performance of the business. This allows users to easily compare operating performance among various fiscal periods and how management measures the performance of the business. This measure also provides users with a benchmark that can be used when forecasting future operating performance of the Company that excludes unusual, nonrecurring or one-time transactions. Adjusted EBITDA is a component of the calculation used by stockholders and analysts to determine the value of our business when using the market approach, which applies a market multiple to financial metrics. It is also a measure used to calculate the leverage ratio of the Company, which is a key financial ratio monitored and used by the Company and its investors. Adjusted EBITDA is defined as net income (loss), plus non-operating expenses, income tax expense, depreciation and amortization, (gain) loss on asset sales, impairments and other, restructuring costs and other, stock compensation, and our 50% share of EBITDA from TNI and MNI, minus equity in earnings of TNI and MNI. Cash Costs represent a non-GAAP financial performance measure of operating expenses which are measured on an accrual basis and settled in cash. This measure is useful to investors in understanding the components of the Company’s cash-settled operating costs. Periodically, the Company provides forward-looking guidance of Cash Costs, which can be used by financial statement users to assess the Company's ability to manage and control its operating cost structure. Cash Costs are defined as compensation, newsprint and ink and other operating expenses. Depreciation and amortization, assets loss (gain) on sales, impairments and other, other non-cash operating expenses and other expenses are excluded. Cash Costs also exclude restructuring costs and other, which are typically paid in cash. Same-store revenues is a non-GAAP performance measure based on U.S. GAAP revenues for Lee for the current period, excluding exited operations. Exited operations include (1) business divestitures and (2) the elimination of stand- alone print products discontinued within our markets. Gross Margin is a non-GAAP financial performance measure that enhances financial statement users overall understanding of the operating performance of the Company. The measure isolates operating costs that directly support revenue. Depreciation and amortization, assets loss (gain) on sales, impairments and other, net, other non-cash operating expenses, Selling, General, and Administrative (“SG&A”) compensation and SG&A other operating expenses are excluded from Gross Margin. Comparable basis is a non-GAAP performance measure based on U.S. GAAP trends for Lee for the current period, excluding the extra week in fiscal 2024. The fourth quarter and full year of fiscal 2025 consisted of 13 weeks and 52 weeks, respectively. The fourth quarter and full year of fiscal 2024 consisted of 14 weeks and 53 weeks, respectively. TNI and MNI – TNI refers to TNI Partners publishing operations in Tucson, AZ. MNI refers to Madison Newspapers, Inc. publishing operations in Madison, WI. Management’s Use of Non-GAAP Measures These Non-GAAP Measures are not measurements of financial performance under U.S. GAAP and should not be considered in isolation or as an alternative to income from operations, net income (loss), revenues, or any other measure of performance or liquidity derived in accordance with U.S. GAAP. We believe these non-GAAP financial measures, as we have defined them, are helpful in identifying trends in our day-to-day performance because the items excluded have little or no significance on our day-to-day operations. These measures provide an assessment of controllable expenses and afford management the ability to make decisions which are expected to facilitate meeting current financial goals as well as achieve optimal financial performance. We use these Non-GAAP measures of our day-to-day operating performance, which is evidenced by the publishing and delivery of news and other media and excludes certain expenses that may not be indicative of our day-to-day business operating results. Limitations of Non-GAAP Measures Each of our non-GAAP measures have limitations as analytical tools. They should not be viewed in isolation or as a substitute for U.S. GAAP measures of earnings. Material limitations in making the adjustments to our earnings to calculate Adjusted EBITDA using these non-GAAP financial measures as compared to U.S. GAAP net income (loss) include: the cash portion of interest / financing expense, income tax (benefit) provision, and charges related to asset impairments, which may significantly affect our financial results. Management believes these items are important in evaluating our performance, results of operations, and financial position. We use non-GAAP financial measures to supplement our U.S. GAAP results in order to provide a more complete understanding of the factors and trends affecting our business.
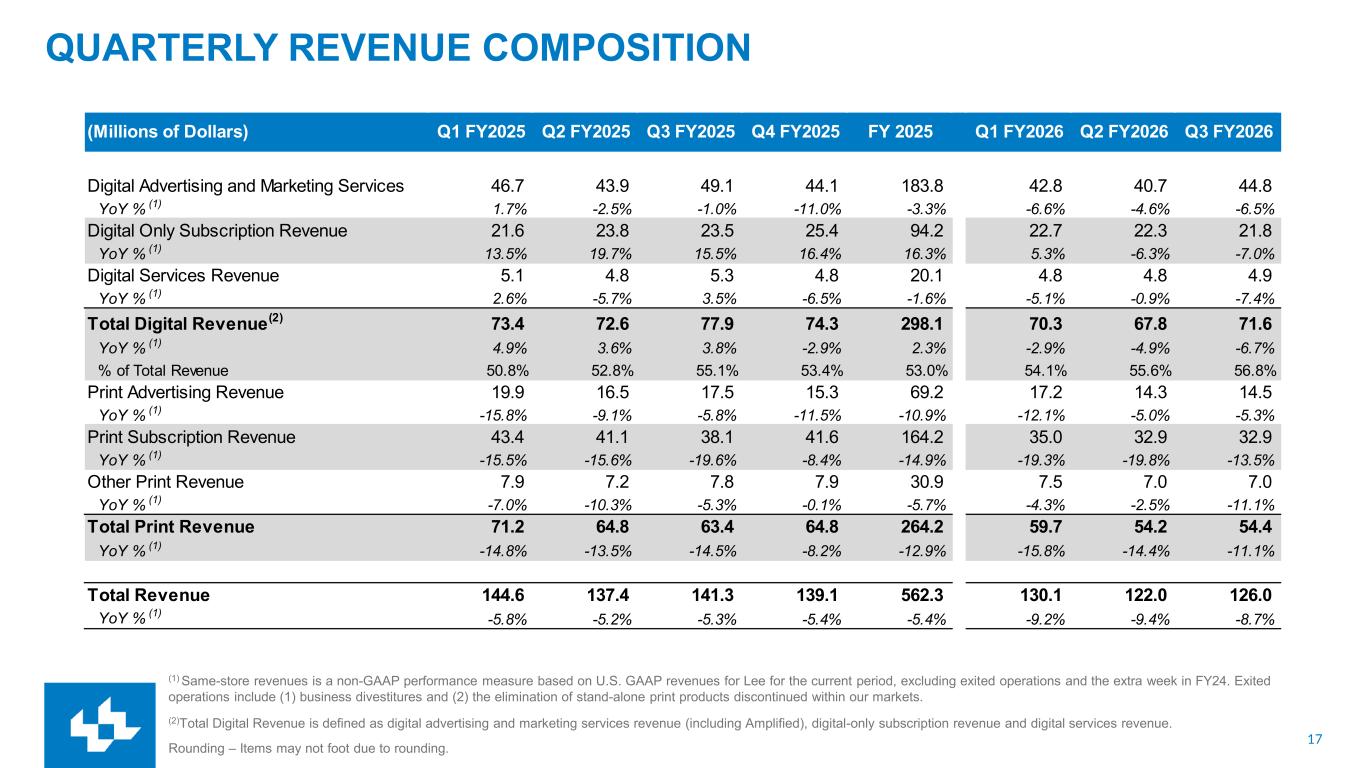
17 QUARTERLY REVENUE COMPOSITION (1) Same-store revenues is a non-GAAP performance measure based on U.S. GAAP revenues for Lee for the current period, excluding exited operations and the extra week in FY24. Exited operations include (1) business divestitures and (2) the elimination of stand-alone print products discontinued within our markets. (2)Total Digital Revenue is defined as digital advertising and marketing services revenue (including Amplified), digital-only subscription revenue and digital services revenue. Rounding – Items may not foot due to rounding. (Millions of Dollars) Q1 FY2025 Q2 FY2025 Q3 FY2025 Q4 FY2025 FY 2025 Q1 FY2026 Q2 FY2026 Q3 FY2026 Digital Advertising and Marketing Services 46.7 43.9 49.1 44.1 183.8 42.8 40.7 44.8 YoY % (1) 1.7% -2.5% -1.0% -11.0% -3.3% -6.6% -4.6% -6.5% Digital Only Subscription Revenue 21.6 23.8 23.5 25.4 94.2 22.7 22.3 21.8 YoY % (1) 13.5% 19.7% 15.5% 16.4% 16.3% 5.3% -6.3% -7.0% Digital Services Revenue 5.1 4.8 5.3 4.8 20.1 4.8 4.8 4.9 YoY % (1) 2.6% -5.7% 3.5% -6.5% -1.6% -5.1% -0.9% -7.4% Total Digital Revenue(2) 73.4 72.6 77.9 74.3 298.1 70.3 67.8 71.6 YoY % (1) 4.9% 3.6% 3.8% -2.9% 2.3% -2.9% -4.9% -6.7% % of Total Revenue 50.8% 52.8% 55.1% 53.4% 53.0% 54.1% 55.6% 56.8% Print Advertising Revenue 19.9 16.5 17.5 15.3 69.2 17.2 14.3 14.5 YoY % (1) -15.8% -9.1% -5.8% -11.5% -10.9% -12.1% -5.0% -5.3% Print Subscription Revenue 43.4 41.1 38.1 41.6 164.2 35.0 32.9 32.9 YoY % (1) -15.5% -15.6% -19.6% -8.4% -14.9% -19.3% -19.8% -13.5% Other Print Revenue 7.9 7.2 7.8 7.9 30.9 7.5 7.0 7.0 YoY % (1) -7.0% -10.3% -5.3% -0.1% -5.7% -4.3% -2.5% -11.1% Total Print Revenue 71.2 64.8 63.4 64.8 264.2 59.7 54.2 54.4 YoY % (1) -14.8% -13.5% -14.5% -8.2% -12.9% -15.8% -14.4% -11.1% Total Revenue 144.6 137.4 141.3 139.1 562.3 130.1 122.0 126.0 YoY % (1) -5.8% -5.2% -5.3% -5.4% -5.4% -9.2% -9.4% -8.7%
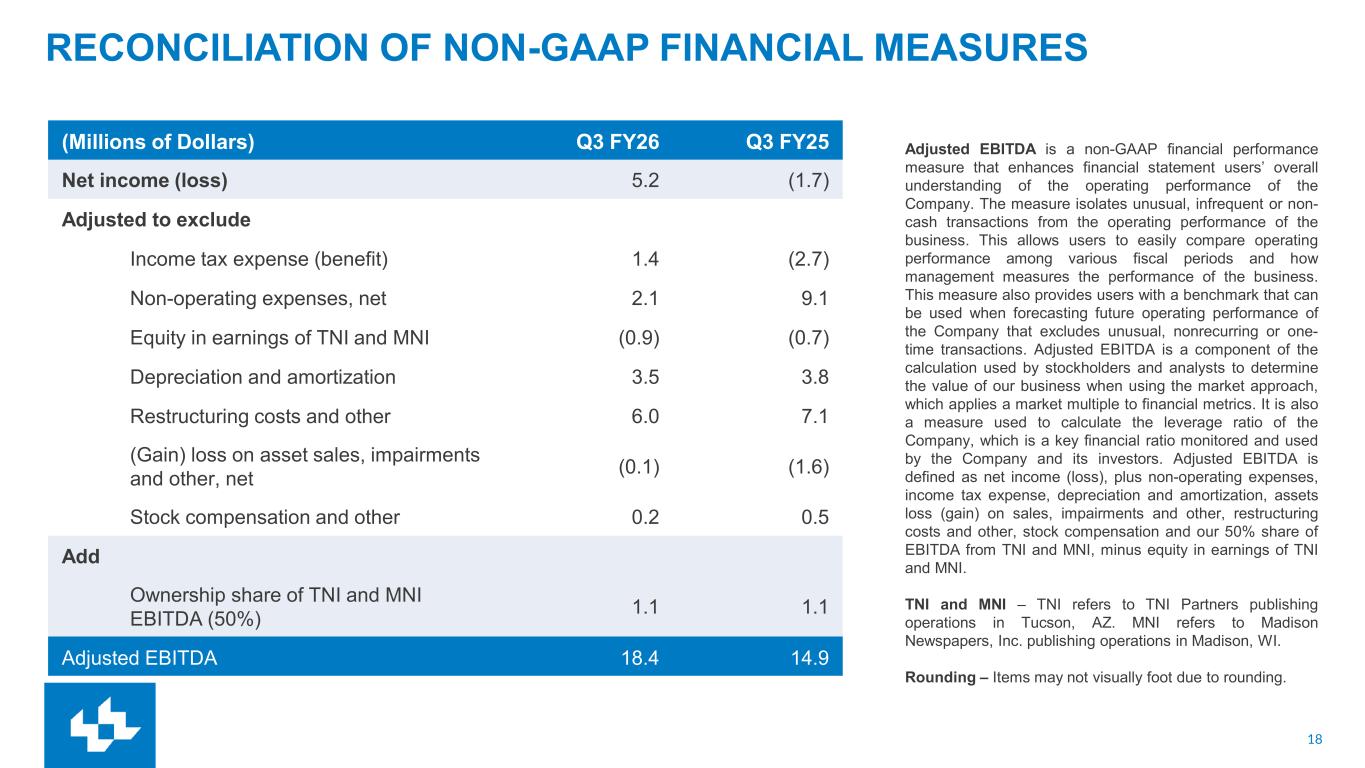
18 RECONCILIATION OF NON-GAAP FINANCIAL MEASURES (Millions of Dollars) Q3 FY26 Q3 FY25 Net income (loss) 5.2 (1.7) Adjusted to exclude Income tax expense (benefit) 1.4 (2.7) Non-operating expenses, net 2.1 9.1 Equity in earnings of TNI and MNI (0.9) (0.7) Depreciation and amortization 3.5 3.8 Restructuring costs and other 6.0 7.1 (Gain) loss on asset sales, impairments and other, net (0.1) (1.6) Stock compensation and other 0.2 0.5 Add Ownership share of TNI and MNI EBITDA (50%) 1.1 1.1 Adjusted EBITDA 18.4 14.9 Adjusted EBITDA is a non-GAAP financial performance measure that enhances financial statement users’ overall understanding of the operating performance of the Company. The measure isolates unusual, infrequent or non- cash transactions from the operating performance of the business. This allows users to easily compare operating performance among various fiscal periods and how management measures the performance of the business. This measure also provides users with a benchmark that can be used when forecasting future operating performance of the Company that excludes unusual, nonrecurring or one- time transactions. Adjusted EBITDA is a component of the calculation used by stockholders and analysts to determine the value of our business when using the market approach, which applies a market multiple to financial metrics. It is also a measure used to calculate the leverage ratio of the Company, which is a key financial ratio monitored and used by the Company and its investors. Adjusted EBITDA is defined as net income (loss), plus non-operating expenses, income tax expense, depreciation and amortization, assets loss (gain) on sales, impairments and other, restructuring costs and other, stock compensation and our 50% share of EBITDA from TNI and MNI, minus equity in earnings of TNI and MNI. TNI and MNI – TNI refers to TNI Partners publishing operations in Tucson, AZ. MNI refers to Madison Newspapers, Inc. publishing operations in Madison, WI. Rounding – Items may not visually foot due to rounding.
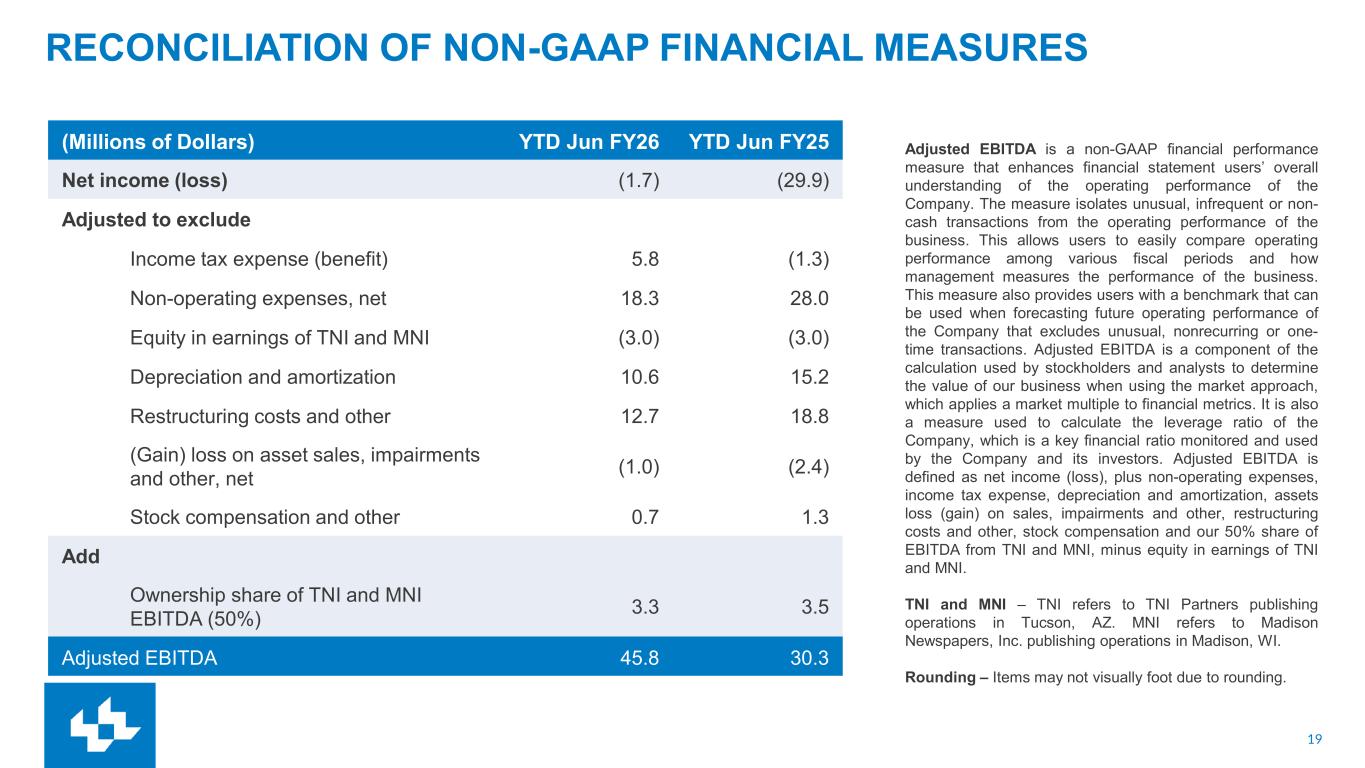
19 RECONCILIATION OF NON-GAAP FINANCIAL MEASURES Adjusted EBITDA is a non-GAAP financial performance measure that enhances financial statement users’ overall understanding of the operating performance of the Company. The measure isolates unusual, infrequent or non- cash transactions from the operating performance of the business. This allows users to easily compare operating performance among various fiscal periods and how management measures the performance of the business. This measure also provides users with a benchmark that can be used when forecasting future operating performance of the Company that excludes unusual, nonrecurring or one- time transactions. Adjusted EBITDA is a component of the calculation used by stockholders and analysts to determine the value of our business when using the market approach, which applies a market multiple to financial metrics. It is also a measure used to calculate the leverage ratio of the Company, which is a key financial ratio monitored and used by the Company and its investors. Adjusted EBITDA is defined as net income (loss), plus non-operating expenses, income tax expense, depreciation and amortization, assets loss (gain) on sales, impairments and other, restructuring costs and other, stock compensation and our 50% share of EBITDA from TNI and MNI, minus equity in earnings of TNI and MNI. TNI and MNI – TNI refers to TNI Partners publishing operations in Tucson, AZ. MNI refers to Madison Newspapers, Inc. publishing operations in Madison, WI. Rounding – Items may not visually foot due to rounding. (Millions of Dollars) YTD Jun FY26 YTD Jun FY25 Net income (loss) (1.7) (29.9) Adjusted to exclude Income tax expense (benefit) 5.8 (1.3) Non-operating expenses, net 18.3 28.0 Equity in earnings of TNI and MNI (3.0) (3.0) Depreciation and amortization 10.6 15.2 Restructuring costs and other 12.7 18.8 (Gain) loss on asset sales, impairments and other, net (1.0) (2.4) Stock compensation and other 0.7 1.3 Add Ownership share of TNI and MNI EBITDA (50%) 3.3 3.5 Adjusted EBITDA 45.8 30.3
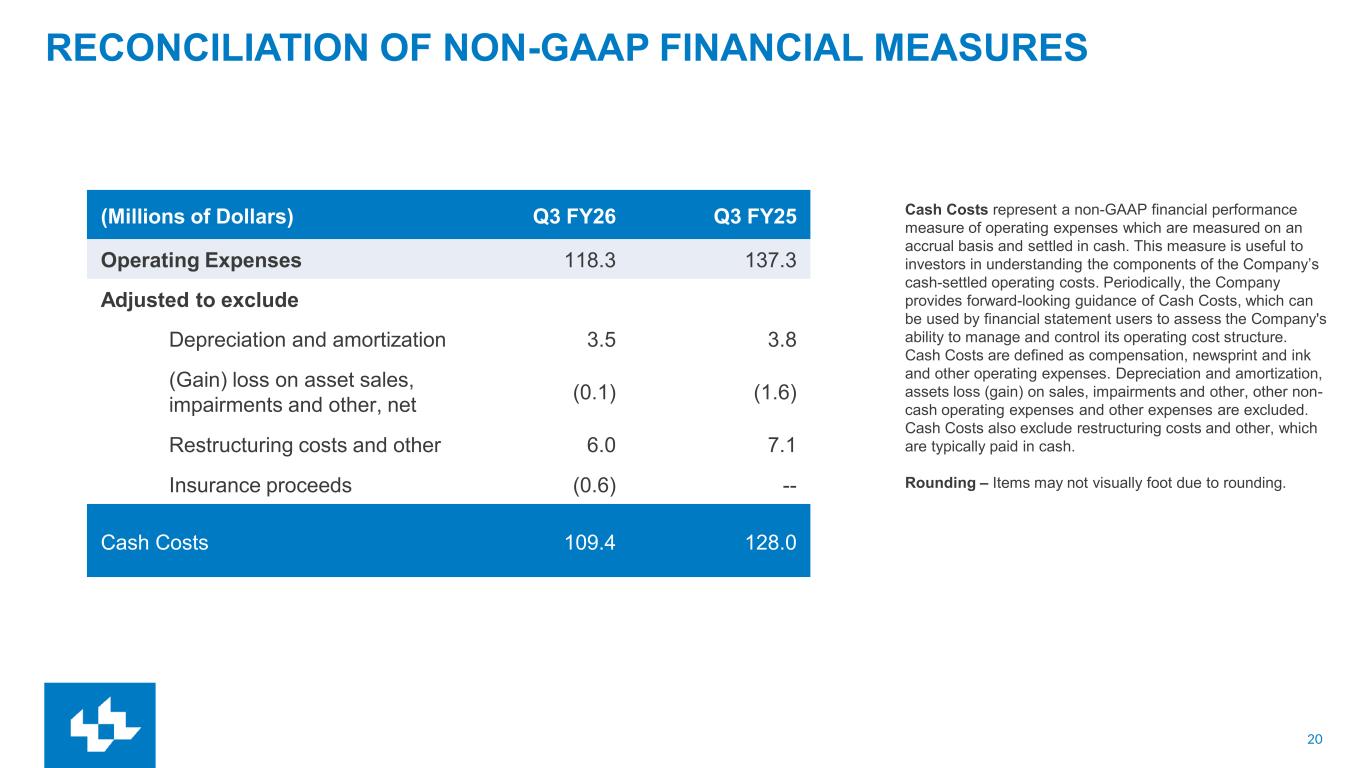
20 RECONCILIATION OF NON-GAAP FINANCIAL MEASURES Cash Costs represent a non-GAAP financial performance measure of operating expenses which are measured on an accrual basis and settled in cash. This measure is useful to investors in understanding the components of the Company’s cash-settled operating costs. Periodically, the Company provides forward-looking guidance of Cash Costs, which can be used by financial statement users to assess the Company's ability to manage and control its operating cost structure. Cash Costs are defined as compensation, newsprint and ink and other operating expenses. Depreciation and amortization, assets loss (gain) on sales, impairments and other, other non- cash operating expenses and other expenses are excluded. Cash Costs also exclude restructuring costs and other, which are typically paid in cash. Rounding – Items may not visually foot due to rounding. (Millions of Dollars) Q3 FY26 Q3 FY25 Operating Expenses 118.3 137.3 Adjusted to exclude Depreciation and amortization 3.5 3.8 (Gain) loss on asset sales, impairments and other, net (0.1) (1.6) Restructuring costs and other 6.0 7.1 Insurance proceeds (0.6) -- Cash Costs 109.4 128.0
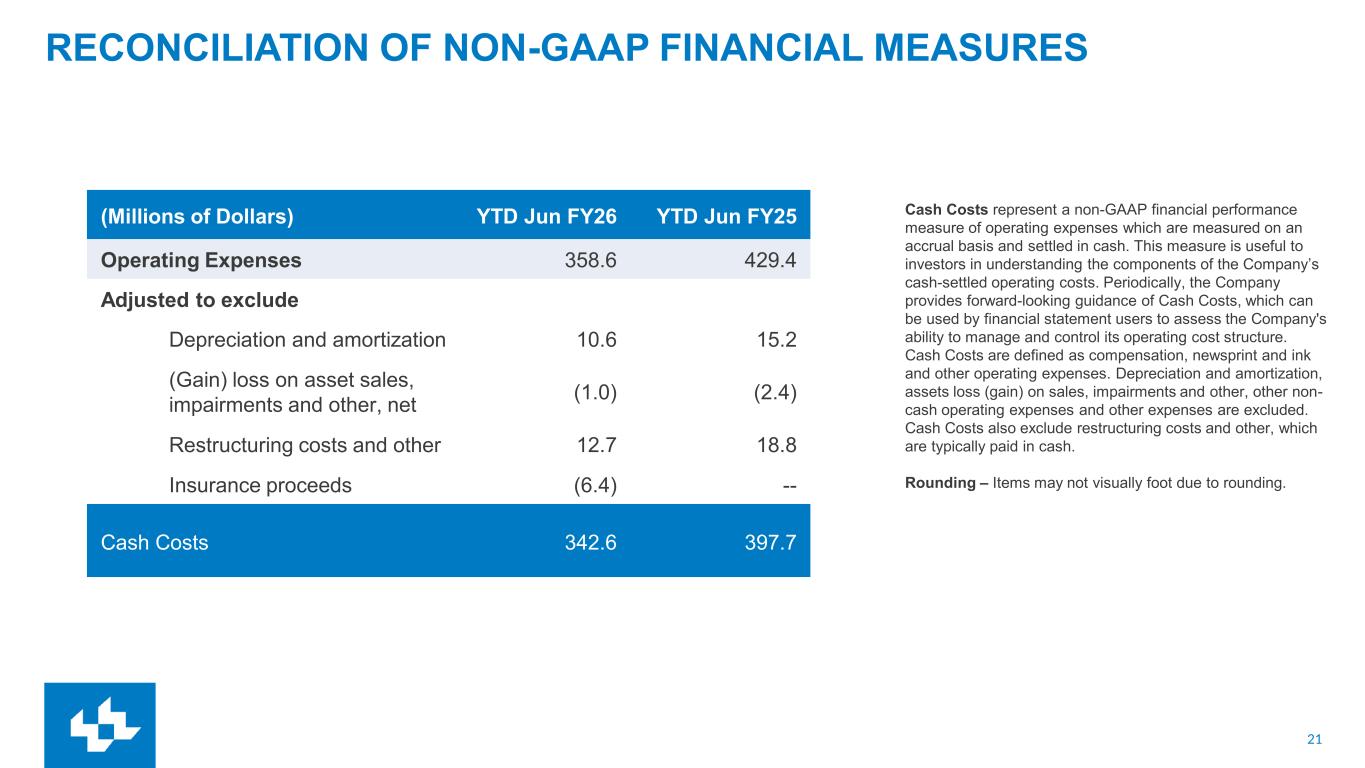
21 RECONCILIATION OF NON-GAAP FINANCIAL MEASURES Cash Costs represent a non-GAAP financial performance measure of operating expenses which are measured on an accrual basis and settled in cash. This measure is useful to investors in understanding the components of the Company’s cash-settled operating costs. Periodically, the Company provides forward-looking guidance of Cash Costs, which can be used by financial statement users to assess the Company's ability to manage and control its operating cost structure. Cash Costs are defined as compensation, newsprint and ink and other operating expenses. Depreciation and amortization, assets loss (gain) on sales, impairments and other, other non- cash operating expenses and other expenses are excluded. Cash Costs also exclude restructuring costs and other, which are typically paid in cash. Rounding – Items may not visually foot due to rounding. (Millions of Dollars) YTD Jun FY26 YTD Jun FY25 Operating Expenses 358.6 429.4 Adjusted to exclude Depreciation and amortization 10.6 15.2 (Gain) loss on asset sales, impairments and other, net (1.0) (2.4) Restructuring costs and other 12.7 18.8 Insurance proceeds (6.4) -- Cash Costs 342.6 397.7
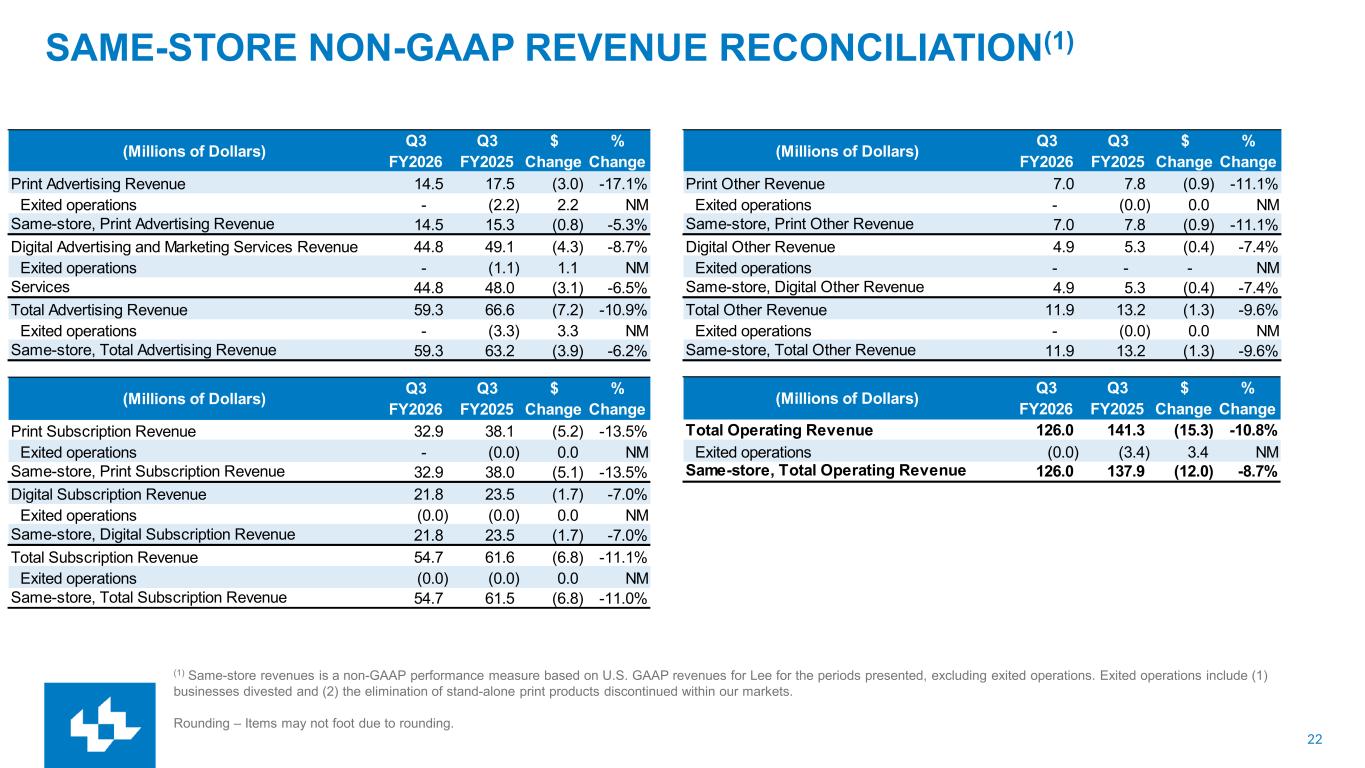
22 SAME-STORE NON-GAAP REVENUE RECONCILIATION(1) (1) Same-store revenues is a non-GAAP performance measure based on U.S. GAAP revenues for Lee for the periods presented, excluding exited operations. Exited operations include (1) businesses divested and (2) the elimination of stand-alone print products discontinued within our markets. Rounding – Items may not foot due to rounding. (Millions of Dollars) Q3 FY2026 Q3 FY2025 $ Change % Change Print Advertising Revenue 14.5 17.5 (3.0) -17.1% Exited operations - (2.2) 2.2 NM Same-store, Print Advertising Revenue 14.5 15.3 (0.8) -5.3% Digital Advertising and Marketing Services Revenue 44.8 49.1 (4.3) -8.7% Exited operations - (1.1) 1.1 NMSam -stor , Digital Advertising and Marketing Services 44.8 48.0 (3.1) -6.5% Total Advertising Revenue 59.3 66.6 (7.2) -10.9% Exited operations - (3.3) 3.3 NM Same-store, Total Advertising Revenue 59.3 63.2 (3.9) -6.2% (Millions of Dollars) Q3 FY2026 Q3 FY2025 $ Change % Change Print Subscription Revenue 32.9 38.1 (5.2) -13.5% Exited operations - (0.0) 0.0 NM Same-store, Print Subscription Revenue 32.9 38.0 (5.1) -13.5% Digital Subscription Revenue 21.8 23.5 (1.7) -7.0% Exited operations (0.0) (0.0) 0.0 NM Same-store, Digital Subscription Revenue 21.8 23.5 (1.7) -7.0% Total Subscription Revenue 54.7 61.6 (6.8) -11.1% Exited operations (0.0) (0.0) 0.0 NM Same-store, Total Subscription Revenue 54.7 61.5 (6.8) -11.0% (Millions of Dollars) Q3 FY2026 Q3 FY2025 $ Change % Change Print Other Revenue 7.0 7.8 (0.9) -11.1% Exited operations - (0.0) 0.0 NM Same-store, Print Other Revenue 7.0 7.8 (0.9) -11.1% Digital Other Revenue 4.9 5.3 (0.4) -7.4% Exited operations - - - NM Same-store, Digital Other Revenue 4.9 5.3 (0.4) -7.4% Total Other Revenue 11.9 13.2 (1.3) -9.6% Exited operations - (0.0) 0.0 NM Same-store, Total Other Revenue 11.9 13.2 (1.3) -9.6% (Millions of Dollars) Q3 FY2026 Q3 FY2025 $ Change % Change Total Operating Revenue 126.0 141.3 (15.3) -10.8% Exited operations (0.0) (3.4) 3.4 NM Same-store, Total Operating Revenue 126.0 137.9 (12.0) -8.7%
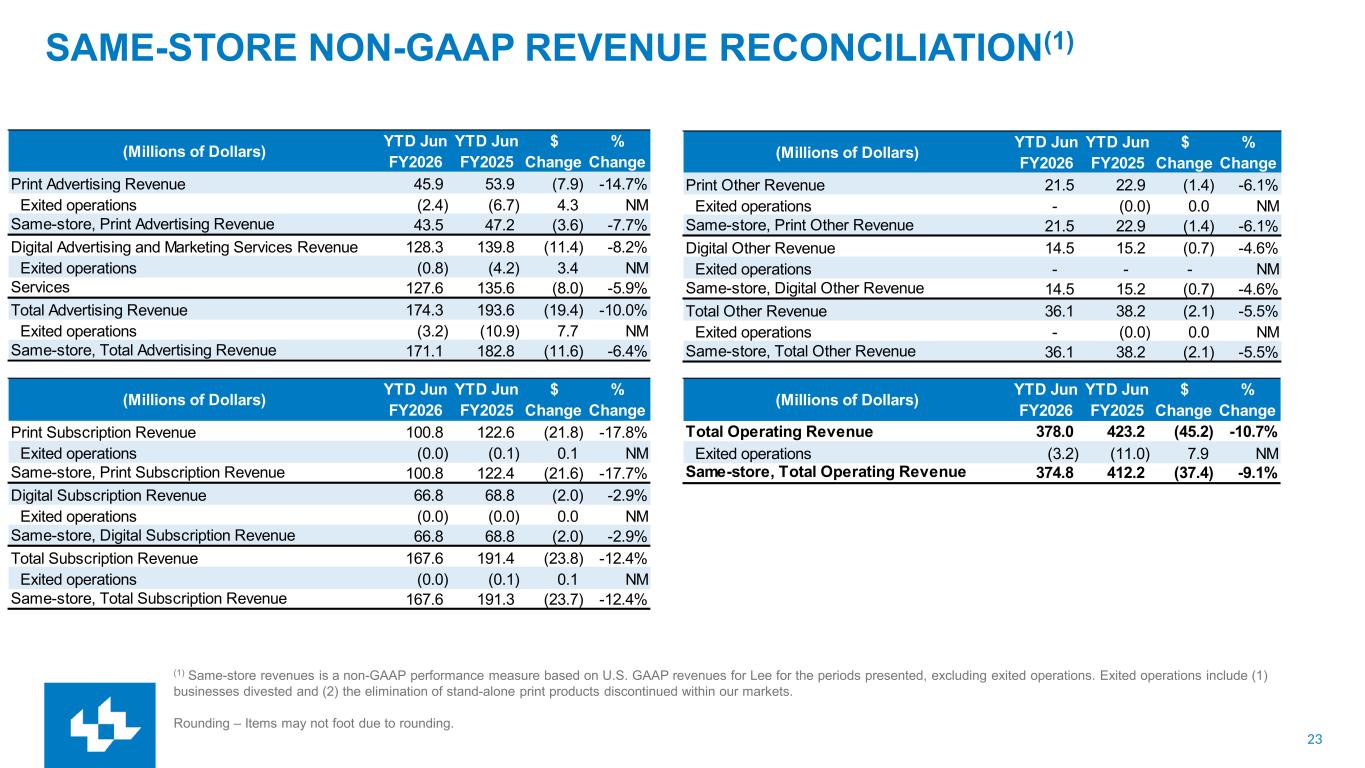
23 SAME-STORE NON-GAAP REVENUE RECONCILIATION(1) (1) Same-store revenues is a non-GAAP performance measure based on U.S. GAAP revenues for Lee for the periods presented, excluding exited operations. Exited operations include (1) businesses divested and (2) the elimination of stand-alone print products discontinued within our markets. Rounding – Items may not foot due to rounding. (Millions of Dollars) YTD Jun FY2026 YTD Jun FY2025 $ Change % Change Print Advertising Revenue 45.9 53.9 (7.9) -14.7% Exited operations (2.4) (6.7) 4.3 NM Same-store, Print Advertising Revenue 43.5 47.2 (3.6) -7.7% Digital Advertising and Marketing Services Revenue 128.3 139.8 (11.4) -8.2% Exited operations (0.8) (4.2) 3.4 NMSam -stor , Digital Advertising and Marketing Services 127.6 135.6 (8.0) -5.9% Total Advertising Revenue 174.3 193.6 (19.4) -10.0% Exited operations (3.2) (10.9) 7.7 NM Same-store, Total Advertising Revenue 171.1 182.8 (11.6) -6.4% (Millions of Dollars) YTD Jun FY2026 YTD Jun FY2025 $ Change % Change Print Subscription Revenue 100.8 122.6 (21.8) -17.8% Exited operations (0.0) (0.1) 0.1 NM Same-store, Print Subscription Revenue 100.8 122.4 (21.6) -17.7% Digital Subscription Revenue 66.8 68.8 (2.0) -2.9% Exited operations (0.0) (0.0) 0.0 NM Same-store, Digital Subscription Revenue 66.8 68.8 (2.0) -2.9% Total Subscription Revenue 167.6 191.4 (23.8) -12.4% Exited operations (0.0) (0.1) 0.1 NM Same-store, Total Subscription Revenue 167.6 191.3 (23.7) -12.4% (Millions of Dollars) YTD Jun FY2026 YTD Jun FY2025 $ Change % Change Print Other Revenue 21.5 22.9 (1.4) -6.1% Exited operations - (0.0) 0.0 NM Same-store, Print Other Revenue 21.5 22.9 (1.4) -6.1% Digital Other Revenue 14.5 15.2 (0.7) -4.6% Exited operations - - - NM Same-store, Digital Other Revenue 14.5 15.2 (0.7) -4.6% Total Other Revenue 36.1 38.2 (2.1) -5.5% Exited operations - (0.0) 0.0 NM Same-store, Total Other Revenue 36.1 38.2 (2.1) -5.5% (Millions of Dollars) YTD Jun FY2026 YTD Jun FY2025 $ Change % Change Total Operating Revenue 378.0 423.2 (45.2) -10.7% Exited operations (3.2) (11.0) 7.9 NM Same-store, Total Operating Revenue 374.8 412.2 (37.4) -9.1%
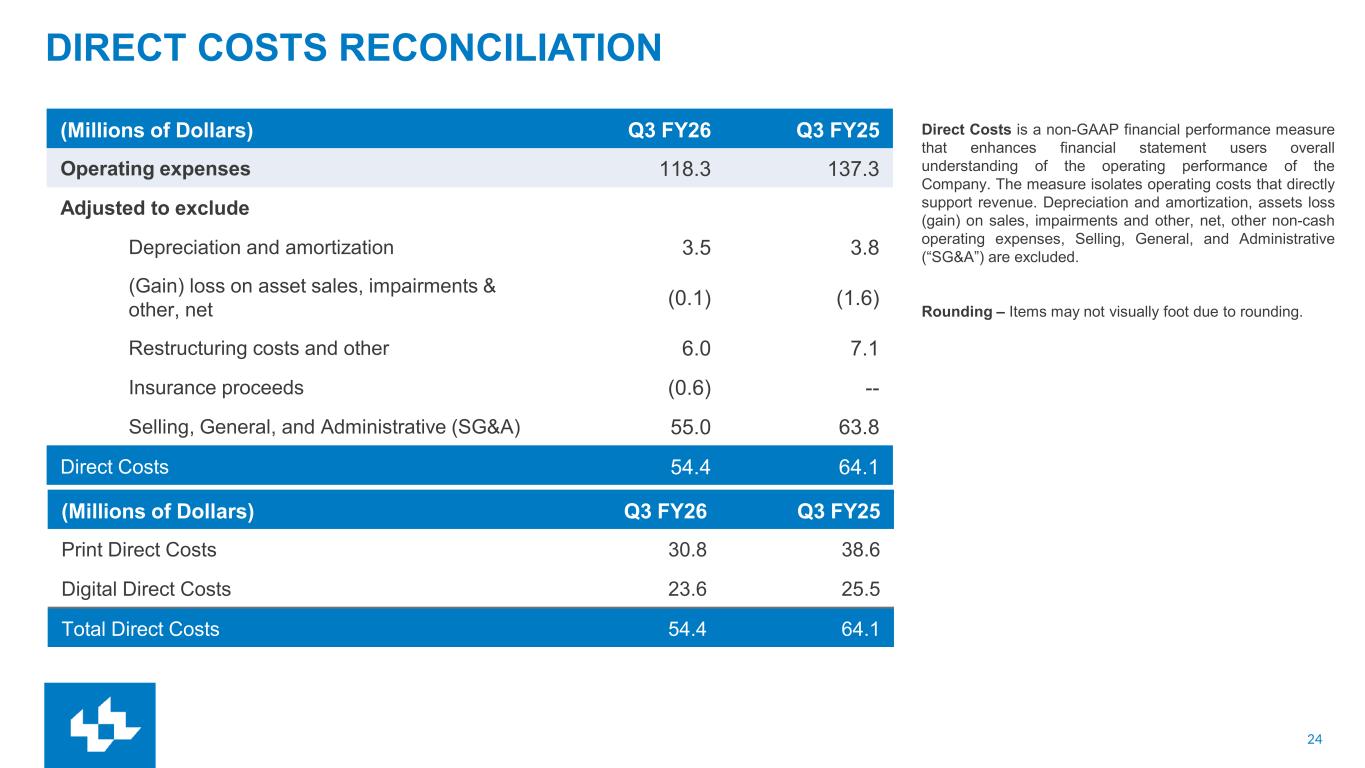
24 DIRECT COSTS RECONCILIATION (Millions of Dollars) Q3 FY26 Q3 FY25 Operating expenses 118.3 137.3 Adjusted to exclude Depreciation and amortization 3.5 3.8 (Gain) loss on asset sales, impairments & other, net (0.1) (1.6) Restructuring costs and other 6.0 7.1 Insurance proceeds (0.6) -- Selling, General, and Administrative (SG&A) 55.0 63.8 Direct Costs 54.4 64.1 Direct Costs is a non-GAAP financial performance measure that enhances financial statement users overall understanding of the operating performance of the Company. The measure isolates operating costs that directly support revenue. Depreciation and amortization, assets loss (gain) on sales, impairments and other, net, other non-cash operating expenses, Selling, General, and Administrative (“SG&A”) are excluded. Rounding – Items may not visually foot due to rounding. (Millions of Dollars) Q3 FY26 Q3 FY25 Print Direct Costs 30.8 38.6 Digital Direct Costs 23.6 25.5 Total Direct Costs 54.4 64.1
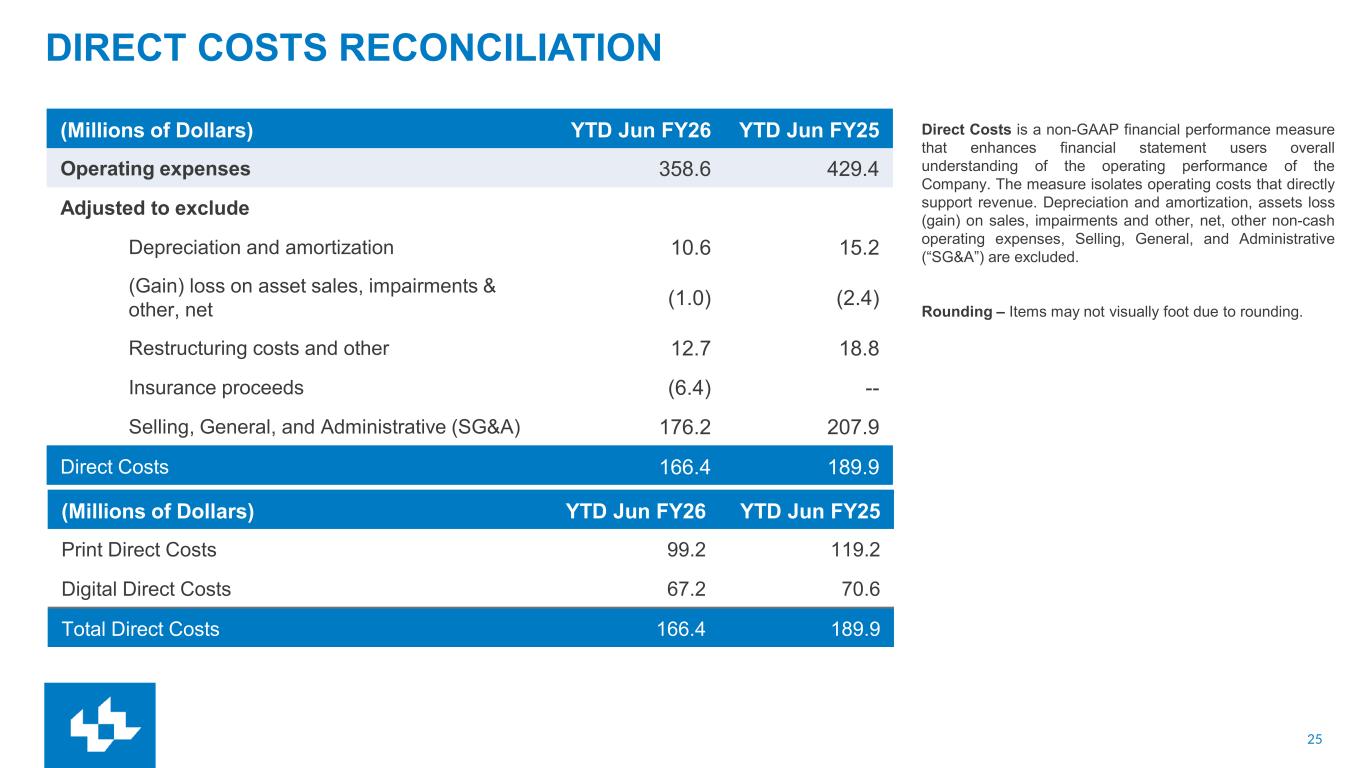
25 DIRECT COSTS RECONCILIATION (Millions of Dollars) YTD Jun FY26 YTD Jun FY25 Operating expenses 358.6 429.4 Adjusted to exclude Depreciation and amortization 10.6 15.2 (Gain) loss on asset sales, impairments & other, net (1.0) (2.4) Restructuring costs and other 12.7 18.8 Insurance proceeds (6.4) -- Selling, General, and Administrative (SG&A) 176.2 207.9 Direct Costs 166.4 189.9 Direct Costs is a non-GAAP financial performance measure that enhances financial statement users overall understanding of the operating performance of the Company. The measure isolates operating costs that directly support revenue. Depreciation and amortization, assets loss (gain) on sales, impairments and other, net, other non-cash operating expenses, Selling, General, and Administrative (“SG&A”) are excluded. Rounding – Items may not visually foot due to rounding. (Millions of Dollars) YTD Jun FY26 YTD Jun FY25 Print Direct Costs 99.2 119.2 Digital Direct Costs 67.2 70.6 Total Direct Costs 166.4 189.9