Shareholder Report
May 31, 2026
USD ($)
$ / shares
This report describes changes to the Fund that occurred during the reporting period.
WHAT WERE THE FUND COSTS FOR THE PAST YEAR? (based on a hypothetical $10,000 investment)
|
Fund Name
|
Costs of a $10,000 investment
|
Costs paid as a percentage of a $10,000 investment
|
|
Alexis Practical Tactical ETF
|
$98
|
0.85%
|
HOW DID THE FUND PERFORM LAST YEAR AND WHAT AFFECTED ITS PERFORMANCE?
In the 12-months since our last annual report, LEXI returned 29.80% on a NAV basis, substantially outperforming its blended benchmark, which returned 22.47%. Of the 3 benchmark component indexes, the Morningstar Global Index led with a total return of 31.00%, closely followed by the S&P500 index with a gain of 29.78%. The aggregate bond index earned 5.13%.
WHAT FACTORS INFLUENCED PERFORMANCE
LEXI’s website touches on 3 ways we seek to add value through market cycles. First is attempting to participate more in recoveries than declines. The relatively stellar 12-month performance of LEXI relative to its benchmark was partly attributable to the market’s rapid recovery from an early 2025 meltdown. As discussed in our last annual report, LEXI took advantage of indiscriminate selling in the 2025 correction to add to beaten down tech leaders. These names surged as stocks rebounded off the 2025 lows. There were other more modest pullbacks including in March 2026. Periodically selling into strength and buying into weakness proved fruitful over this period.
We also attempt to add value by avoiding lagging areas and embracing market leadership. In this period, Technology was boosted by AI enthusiasm and outsized exposure to technology contributed to LEXI’s performance relative to its benchmark. Growth and Momentum outpaced Value and cyclical stocks outperformed defensive names.
The third strategy LEXI uses to outpace benchmarks and peers over time is to tactically allocate to alternative asset classes like Gold and REITs. In this period, LEXI had considerable exposure to gold that surged in 2025 through Q1 2026. This gold position was sold in early 2026 following its spectacular run – an example of benefiting from our use of gold and our disciplined approach to selling and rebalancing when we see indications that trends have run their course.
POSITIONING
Although the adviser sees potential for stocks to extend gains through 2026 and beyond, LEXI has turned more cautious as of the close of the fiscal year citing several catalysts for a possible correction. These include new Fed leadership, pending mid-term elections and the weight of a stock market priced for perfection. The earnings outlook is stellar but rich valuations reflect significant optimism may already be priced in. LEXI’s portfolio is broadly diversified to allow the portfolio to capitalize on pullbacks and potential leadership changes.
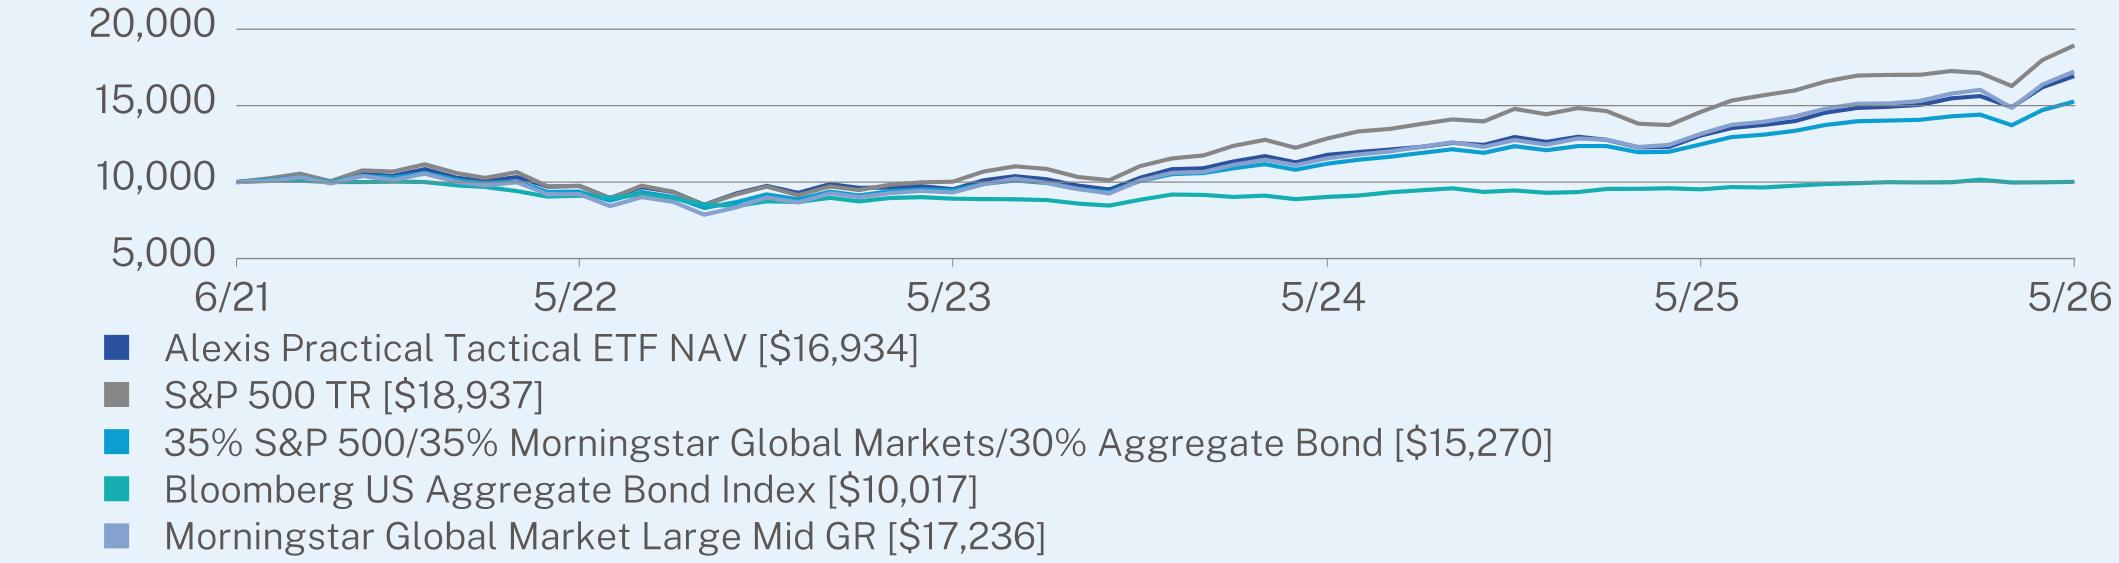
ANNUAL AVERAGE TOTAL RETURN (%)
|
|
1 Year
|
Since Inception
(06/30/2021) |
|
Alexis Practical Tactical ETF NAV
|
29.80
|
11.31
|
|
S&P 500 TR
|
29.78
|
13.87
|
|
35% S&P 500/35% Morningstar Global Markets/30% Aggregate Bond
|
22.47
|
8.99
|
|
Bloomberg US Aggregate Bond Index
|
5.13
|
0.03
|
|
Morningstar Global Market Large Mid GR
|
31.00
|
11.71
|
Visit www.lexietf.com for more recent performance information.
KEY FUND STATISTICS (as of May 31, 2026)
|
Net Assets
|
$199,244,456
|
|
Number of Holdings
|
44
|
|
Net Advisory Fee
|
$1,229,655
|
|
Portfolio Turnover
|
15%
|
|
30-Day SEC Yield
|
1.46%
|
WHAT DID THE FUND INVEST IN? (as of May 31, 2026)
|
Security Type
|
(%)
|
|
Exchange Traded Funds
|
75.6%
|
|
Common Stocks
|
11.3%
|
|
U.S. Treasury Bills
|
1.5%
|
|
Written Options
|
-0.1%
|
|
Cash & Other
|
11.7%
|