Shareholder Report
May 31, 2026
USD ($)
$ / shares
WHAT WERE THE FUND COSTS FOR THE LAST SIX MONTHS? (based on a hypothetical $10,000 investment)
|
Fund Name
|
Costs of a $10,000 investment
|
Costs paid as a percentage of a $10,000 investment*
|
|
YCG Enhanced Fund
|
$57
|
1.19%
|
HOW DID THE FUND PERFORM DURING THE LAST SIX-MONTHS AND WHAT AFFECTED ITS PERFORMANCE?
High-quality, difficult-to-disrupt businesses have broadly lagged as capital has rotated away from quality and into concentrated AI themes. In most environments, investors value predictable, durable growth and will pay a premium for it. Right now, the market is doing the opposite, selling these businesses to chase the gold rush. We do not believe that can continue indefinitely. Our businesses are growing their earnings. Their stock prices simply have not yet followed. Historically, patient owners of quality have been rewarded after stretches like this one.
No one can say how long the market will keep undervaluing quality. What we do know is that the broad market is expensive and heavily concentrated in an AI narrative whose economics are uncertain and whose earnings growth may not prove sustainable. By contrast, we do not question the durability of this portfolio. We think of it as a fortress of global champions. For that reason, we believe there has never been a more compelling setup for the Fund portfolio to outperform the market than there is today.
Notable contributors to performance over the 6 months to May 31, 2026 were Linde, MSCI, Amazon.com, Alphabet and Canadian National Railway. Notable detractors to performance over the 6 months to May 31, 2026 were Fair Isaac, Hermßs, Intuit, CoStar Group and Copart.
In our Annual and Semi-Annual reports, we include all of the required quantitative information, such as financial statements, detailed footnotes, performance reports and fund holdings. We also produce a Manager Commentary which is a more qualitative perspective on fund performance, discuss our thoughts on individual holdings, and share our investment outlook. You may obtain a copy of the current Manager Commentary either on the Fund’s website at https://www.ycgfunds.com/fund-summary/or by calling 1-855-444-9243.
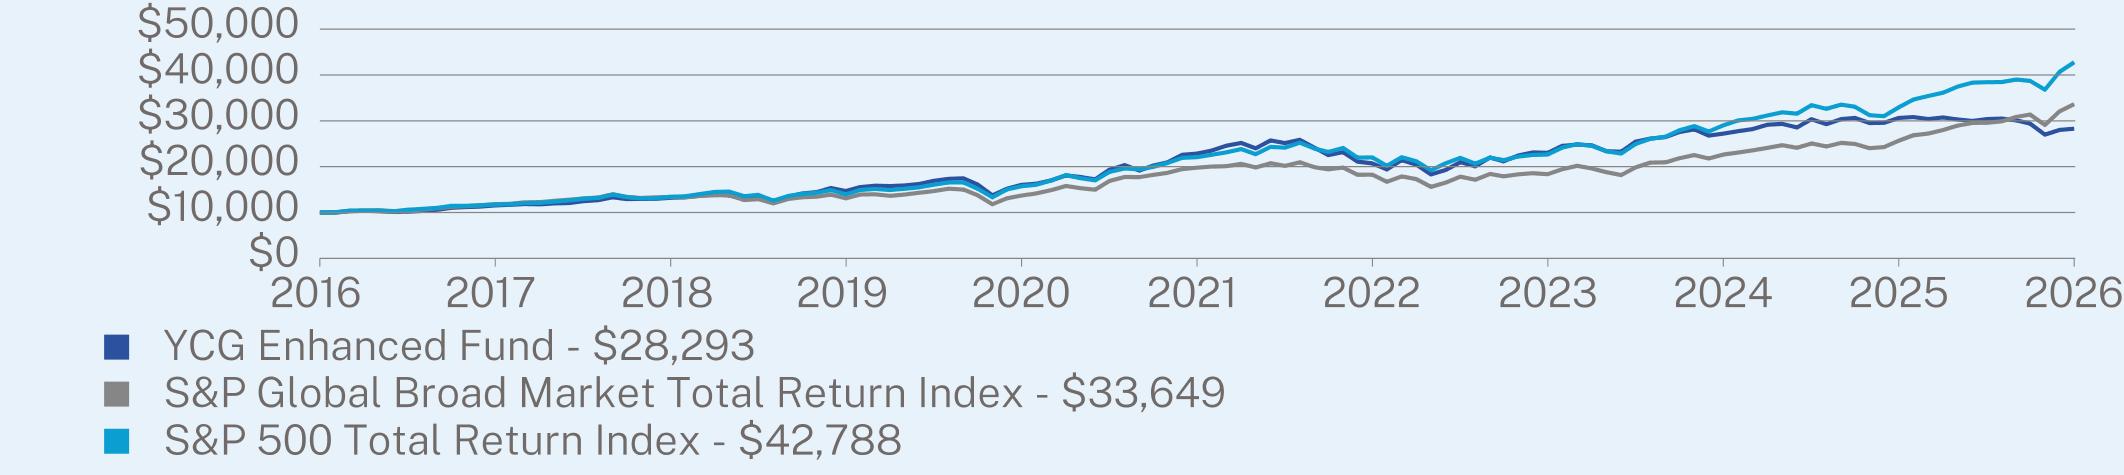
ANNUAL AVERAGE TOTAL RETURNS (%) (as of May 31, 2026)
|
|
1 Year
|
5 Year
|
10 Year
|
|
YCG Enhanced Fund (without sales charge)
|
-7.66
|
4.36
|
10.96
|
|
S&P Global Broad Market Total Return Index
|
31.01
|
11.21
|
12.90
|
|
S&P 500 Total Return Index
|
29.78
|
14.15
|
15.65
|
Visit https://www.ycgfunds.com/fund-summary/ for more recent performance information.
KEY FUND STATISTICS (as of May 31, 2026)
|
Net Assets
|
$505,129,049
|
|
Number of Holdings
|
65
|
|
Portfolio Turnover Rate
|
17%
|
WHAT DID THE FUND INVEST IN? (as of May 31, 2026)*
|
Top Sectors
|
(%)
|
|
Financials
|
32.6%
|
|
Industrials
|
24.8%
|
|
Information Technology
|
11.4%
|
|
Consumer Discretionary
|
10.5%
|
|
Materials
|
6.9%
|
|
Communication Services
|
4.2%
|
|
Consumer Staples
|
1.6%
|
|
Cash & Other
|
8.0%
|
|
Top Holdings
|
(%)
|
|
Copart, Inc.
|
6.4%
|
|
Moody’s Corp.
|
6.2%
|
|
Fair Isaac Corp.
|
6.1%
|
|
MasterCard, Inc. - Class A
|
5.6%
|
|
Microsoft Corp.
|
5.3%
|
|
MSCI, Inc.
|
5.2%
|
|
Hermés International
|
4.7%
|
|
TransDigm Group, Inc.
|
4.4%
|
|
Linde PLC
|
4.0%
|
|
CME Group, Inc.
|
3.9%
|
|
Top Ten Countries
|
(%)
|
|
United States
|
82.5%
|
|
Ireland
|
4.8%
|
|
France
|
4.7%
|
|
Canada
|
4.2%
|
|
Italy
|
2.0%
|
|
Cash & Other
|
1.8%
|
| [1] |
|
||
| [2] |
|