
Earnings Conference Call Second Quarter 2026 August 6, 2026
This presentation contains certain forward-looking statements within the meaning of the Private Securities Litigation Reform Act of 1995 that are subject to risks and uncertainties. Words such as “could,” “may,” “expects,” “anticipates,” “will,” “targets,” “goals,” “projects,” “intends,” “plans,” “believes,” “seeks,” “estimates,” “predicts,” and variations on such words, and similar expressions that reflect our current views with respect to future events and operational, economic, and financial performance, are intended to identify such forward-looking statements. These forward-looking statements include, but are not limited to, statements regarding the acquisition of Calpine Corporation, the pro forma combined company and its operations, strategies and plans, enhancements to investment-grade credit profile, synergies, opportunities and anticipated future performance and capital structure, and expected accretion to earnings per share and free cash flow. Information adjusted for the acquisition should not be considered a forecast of future results. Forward-looking statements are based on current expectations, estimates and assumptions that involve a number of risks and uncertainties that could cause actual results to differ materially from those projected. The factors that could cause actual results to differ materially from the forward-looking statements made by Constellation Energy Corporation and Constellation Energy Generation, LLC, (the Registrants) include those factors discussed herein, as well as the items discussed in (1) the Registrants’ 2025 Annual Report on Form 10-K in (a) Part I, ITEM 1A. Risk Factors, (b) Part II, ITEM 7. Management’s Discussion and Analysis of Financial Condition and Results of Operations, and (c) Part II, ITEM 8. Financial Statements and Supplementary Data: Note 18 — Commitments and Contingencies; (2) the Registrants’ Second Quarter 2026 Quarterly Report on Form 10-Q (to be filed on August 6, 2026) in (a) Part II, ITEM 1A. Risk Factors, (b) Part I, ITEM 2. Management’s Discussion and Analysis of Financial Condition and Results of Operations, and (c) Part I, ITEM 1. Financial Statements: Note 15 — Commitments and Contingencies; and (3) other factors discussed in filings with the SEC by the Registrants. Investors are cautioned not to place undue reliance on these forward-looking statements, whether written or oral, which apply only as of the date of this presentation. Neither Registrant undertakes any obligation to publicly release any revision to its forward-looking statements to reflect events or circumstances after the date of this presentation. Cautionary Statements Regarding Forward-Looking Information 2
The Registrants report their financial results in accordance with accounting principles generally accepted in the United States (GAAP). Constellation supplements the reporting of financial information determined in accordance with GAAP with certain non-GAAP financial measures, including: • Adjusted Operating Earnings (and/or its per share equivalent) exclude certain costs, expenses, gains and losses and other specified items, including adjustments for unrealized gains or losses on economic hedges, interest rate swaps, and fair value adjustments related to gas imbalances and equity investments, decommissioning related activity, asset impairments, certain amounts associated with plant retirements and divestitures, pension and other post-employment benefits (OPEB) non-service credits, and other items as set forth in the Appendix • Free cash flows before growth (FCFbG) is cash flows from operations less capital expenditures under GAAP for maintenance and nuclear fuel, equity investments, and adjusted for changes in collateral and non-recurring costs-to-achieve (CTA) • Adjusted gross margin is defined as adjusted operating revenues less adjusted purchased power and fuel expense, excluding revenue related to decommissioning, gross receipts tax, variable interest entities, and net of direct cost of sales for certain end-user businesses – Adjusted operating revenues excludes the unrealized gains or losses on economic hedging activities due to the volatility and unpredictability of the future changes in commodity prices – Adjusted purchased power and fuel excludes the unrealized gains or losses on economic hedging activities and fair value adjustments related to gas imbalances due to the volatility and unpredictability of the future changes in commodity prices • Adjusted operating and maintenance (O&M) excludes direct cost of sales for certain end-user businesses, Asset Retirement Obligation (ARO) accretion expense from unregulated units and decommissioning costs that do not affect profit and loss, the impact from operating and maintenance expense related to variable interest entities at Constellation, and other items as set forth in the reconciliation in the Appendix Due to the forward-looking nature of our Adjusted Operating Earnings guidance, Projected Adjusted Gross Margin, and Projected Free Cash Flow Before Growth, we are unable to reconcile these non-GAAP financial measures to the comparable GAAP measures given the inherent uncertainty required in projecting gains and losses associated with the various fair value adjustments required by GAAP. These adjustments include future changes in fair value impacting the derivative instruments utilized in our current business operations, as well as the debt and equity securities held within our nuclear decommissioning trusts, which may have a material impact on our future GAAP results. Non-GAAP Financial Measures 3
This information is intended to enhance an investor’s overall understanding of period over period financial results and provide an indication of Constellation’s operating performance by excluding items that are considered by management to be not directly related to the ongoing operations of the business. In addition, this information is among the primary indicators management uses as a basis for evaluating performance, allocating resources, setting incentive compensation targets and planning and forecasting of future periods. These non-GAAP financial measures are not a presentation defined under GAAP and may not be comparable to other companies’ presentations of similarly titled financial measures. Constellation has provided these non-GAAP financial measures as supplemental information and in addition to the financial measures that are calculated and presented in accordance with GAAP. These non-GAAP measures should not be deemed more useful than, a substitute for, or an alternative to the most comparable GAAP measures provided in the materials presented. Non-GAAP financial measures are identified by the phrase “non-GAAP” or an asterisk (*). Reconciliations of these non-GAAP measures to the most comparable GAAP measures are provided in the appendices and attachments to this presentation. Non-GAAP Financial Measures Continued 4
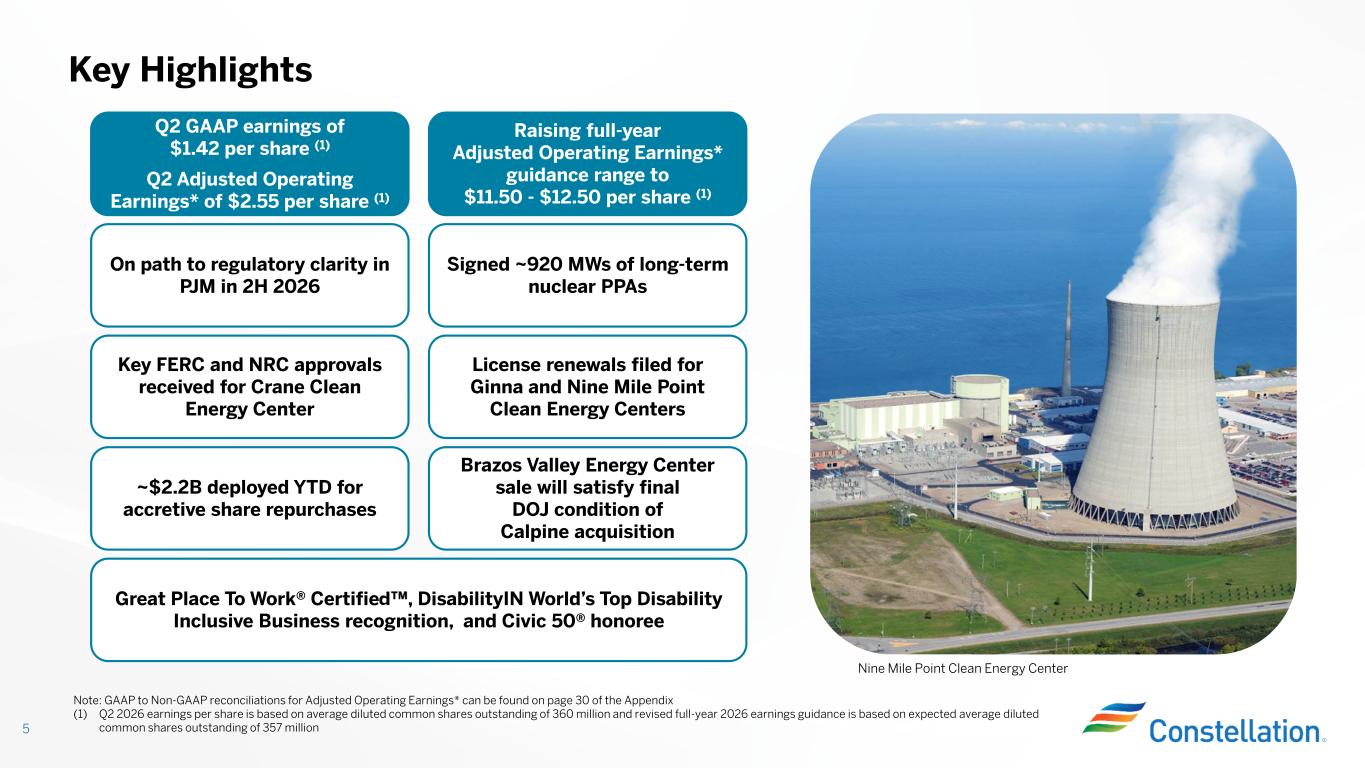
Key Highlights 5 License renewals filed for Ginna and Nine Mile Point Clean Energy Centers Great Place To Work® Certified , DisabilityIN World’s Top Disability Inclusive Business recognition, and Civic 50® honoree Q2 GAAP earnings of $1.42 per share (1) Q2 Adjusted Operating Earnings* of $2.55 per share (1) Raising full-year Adjusted Operating Earnings* guidance range to $11.50 - $12.50 per share (1) Signed ~920 MWs of long-term nuclear PPAs Note: GAAP to Non-GAAP reconciliations for Adjusted Operating Earnings* can be found on page 30 of the Appendix (1) Q2 2026 earnings per share is based on average diluted common shares outstanding of 360 million and revised full-year 2026 earnings guidance is based on expected average diluted common shares outstanding of 357 million Nine Mile Point Clean Energy Center ~$2.2B deployed YTD for accretive share repurchases Key FERC and NRC approvals received for Crane Clean Energy Center On path to regulatory clarity in PJM in 2H 2026 Brazos Valley Energy Center sale will satisfy final DOJ condition of Calpine acquisition
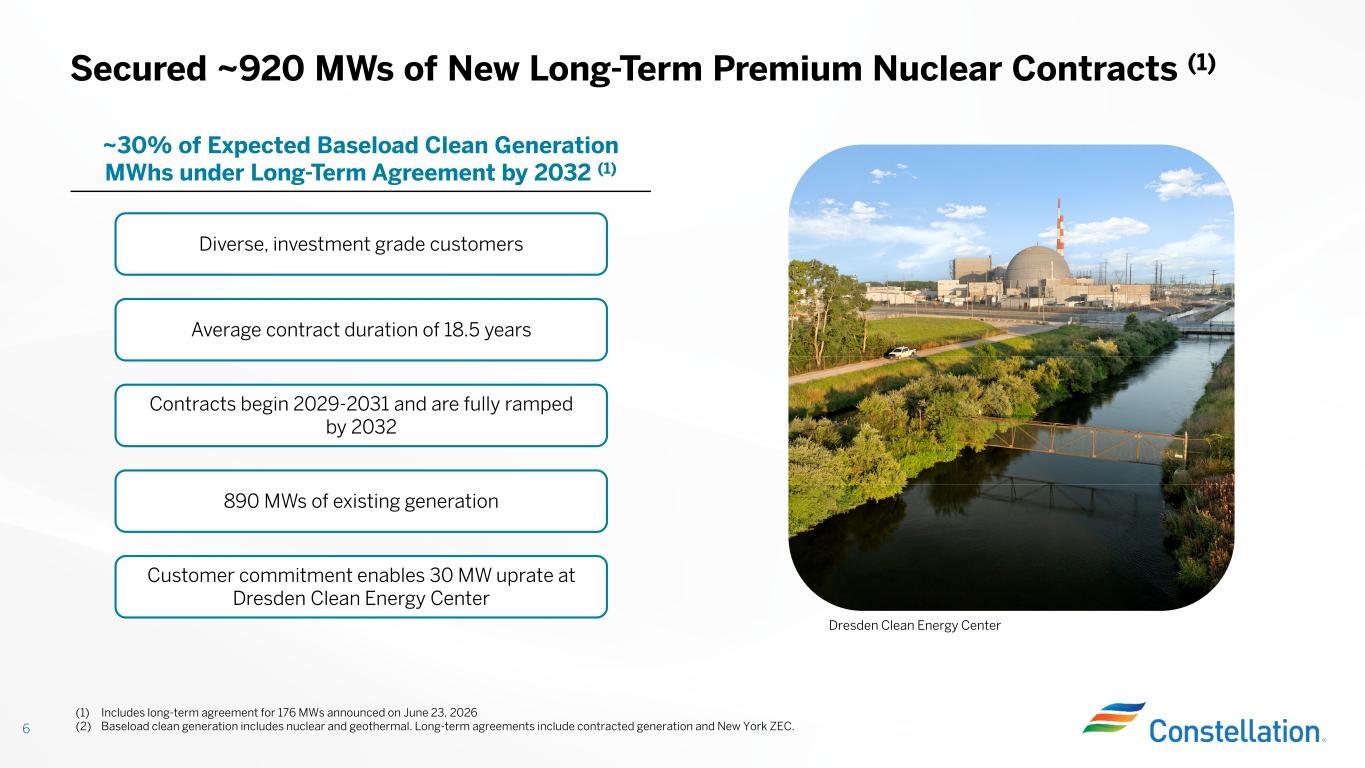
Secured ~920 MWs of New Long-Term Premium Nuclear Contracts (1) ~30% of Expected Baseload Clean Generation MWhs under Long-Term Agreement by 2032 (1) 6 Average contract duration of 18.5 years 890 MWs of existing generation Diverse, investment grade customers Dresden Clean Energy Center Customer commitment enables 30 MW uprate at Dresden Clean Energy Center Contracts begin 2029-2031 and are fully ramped by 2032 (1) Includes long-term agreement for 176 MWs announced on June 23, 2026 (2) Baseload clean generation includes nuclear and geothermal. Long-term agreements include contracted generation and New York ZEC.
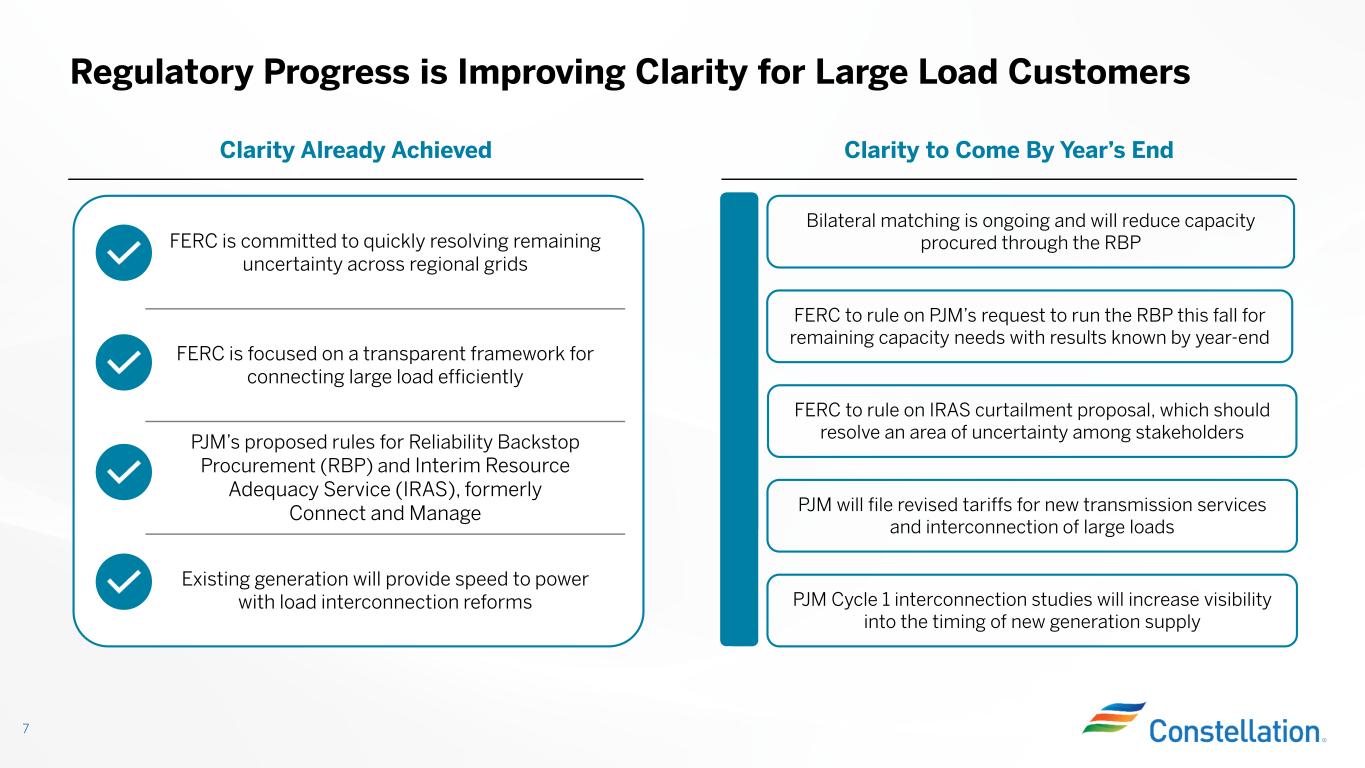
FERC is committed to quickly resolving remaining uncertainty across regional grids FERC is focused on a transparent framework for connecting large load efficiently PJM’s proposed rules for Reliability Backstop Procurement (RBP) and Interim Resource Adequacy Service (IRAS), formerly Connect and Manage Existing generation will provide speed to power with load interconnection reforms Regulatory Progress is Improving Clarity for Large Load Customers 7 Clarity to Come By Year’s EndClarity Already Achieved Bilateral matching is ongoing and will reduce capacity procured through the RBP FERC to rule on PJM’s request to run the RBP this fall for remaining capacity needs with results known by year-end PJM will file revised tariffs for new transmission services and interconnection of large loads FERC to rule on IRAS curtailment proposal, which should resolve an area of uncertainty among stakeholders PJM Cycle 1 interconnection studies will increase visibility into the timing of new generation supply
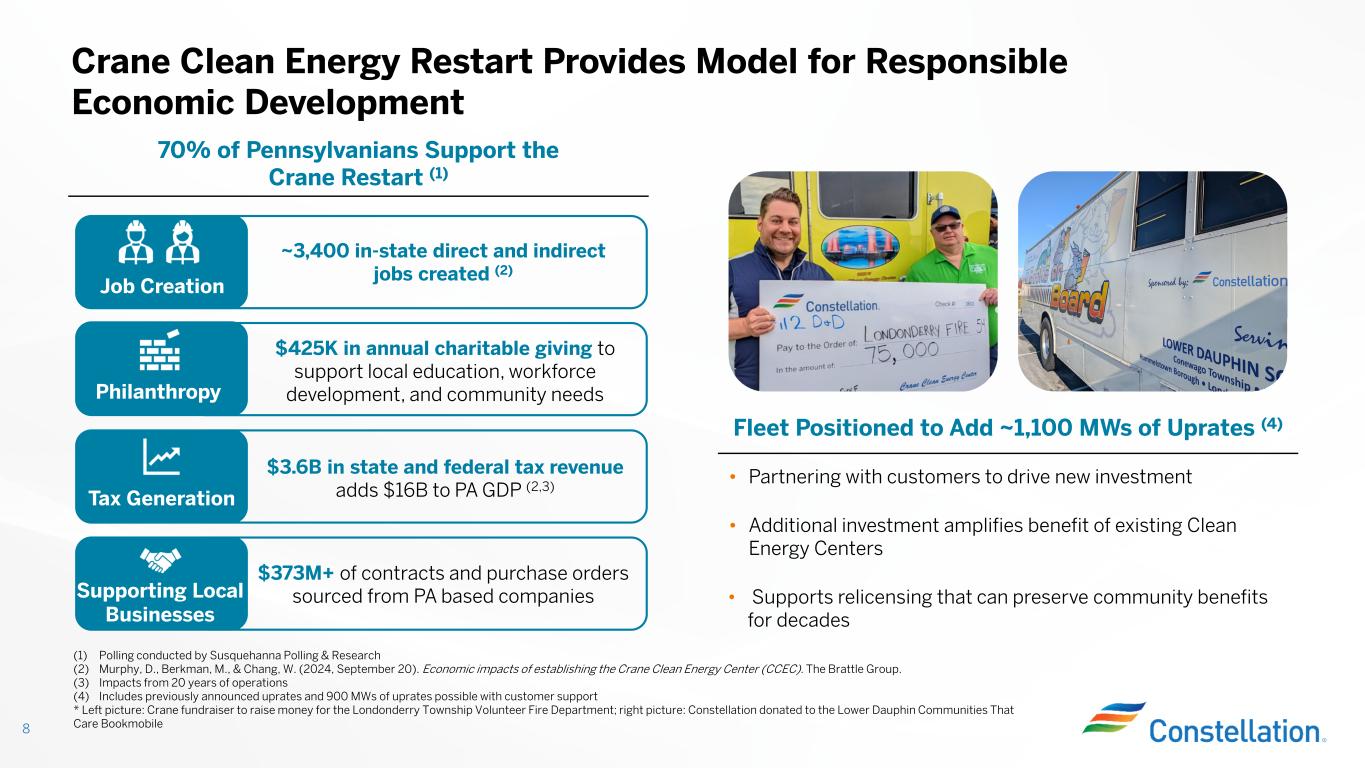
• Partnering with customers to drive new investment • Additional investment amplifies benefit of existing Clean Energy Centers • Supports relicensing that can preserve community benefits for decades Crane Clean Energy Restart Provides Model for Responsible Economic Development 8 70% of Pennsylvanians Support the Crane Restart (1) Tax Generation Job Creation Philanthropy $3.6B in state and federal tax revenue adds $16B to PA GDP (2,3) ~3,400 in-state direct and indirect jobs created (2) Supporting Local Businesses $373M+ of contracts and purchase orders sourced from PA based companies $425K in annual charitable giving to support local education, workforce development, and community needs Fleet Positioned to Add ~1,100 MWs of Uprates (4) (1) Polling conducted by Susquehanna Polling & Research (2) Murphy, D., Berkman, M., & Chang, W. (2024, September 20). Economic impacts of establishing the Crane Clean Energy Center (CCEC). The Brattle Group. (3) Impacts from 20 years of operations (4) Includes previously announced uprates and 900 MWs of uprates possible with customer support * Left picture: Crane fundraiser to raise money for the Londonderry Township Volunteer Fire Department; right picture: Constellation donated to the Lower Dauphin Communities That Care Bookmobile
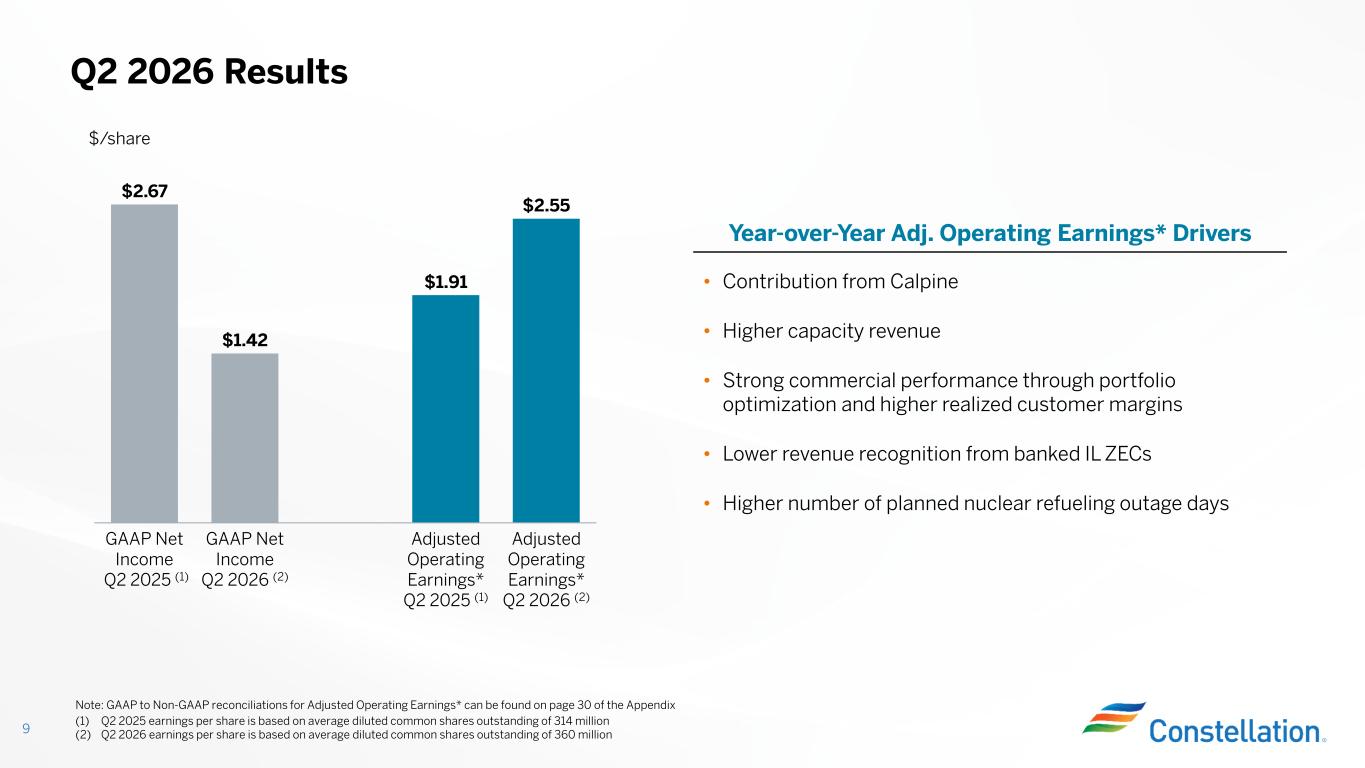
(1) Q2 2025 earnings per share is based on average diluted common shares outstanding of 314 million (2) Q2 2026 earnings per share is based on average diluted common shares outstanding of 360 million Q2 2026 Results 9 Year-over-Year Adj. Operating Earnings* Drivers $2.67 $1.42 $1.91 $2.55 GAAP Net Income Q2 2025 (1) GAAP Net Income Q2 2026 (2) Adjusted Operating Earnings* Q2 2025 (1) Adjusted Operating Earnings* Q2 2026 (2) • Contribution from Calpine • Higher capacity revenue • Strong commercial performance through portfolio optimization and higher realized customer margins • Lower revenue recognition from banked IL ZECs • Higher number of planned nuclear refueling outage days Note: GAAP to Non-GAAP reconciliations for Adjusted Operating Earnings* can be found on page 30 of the Appendix $/share
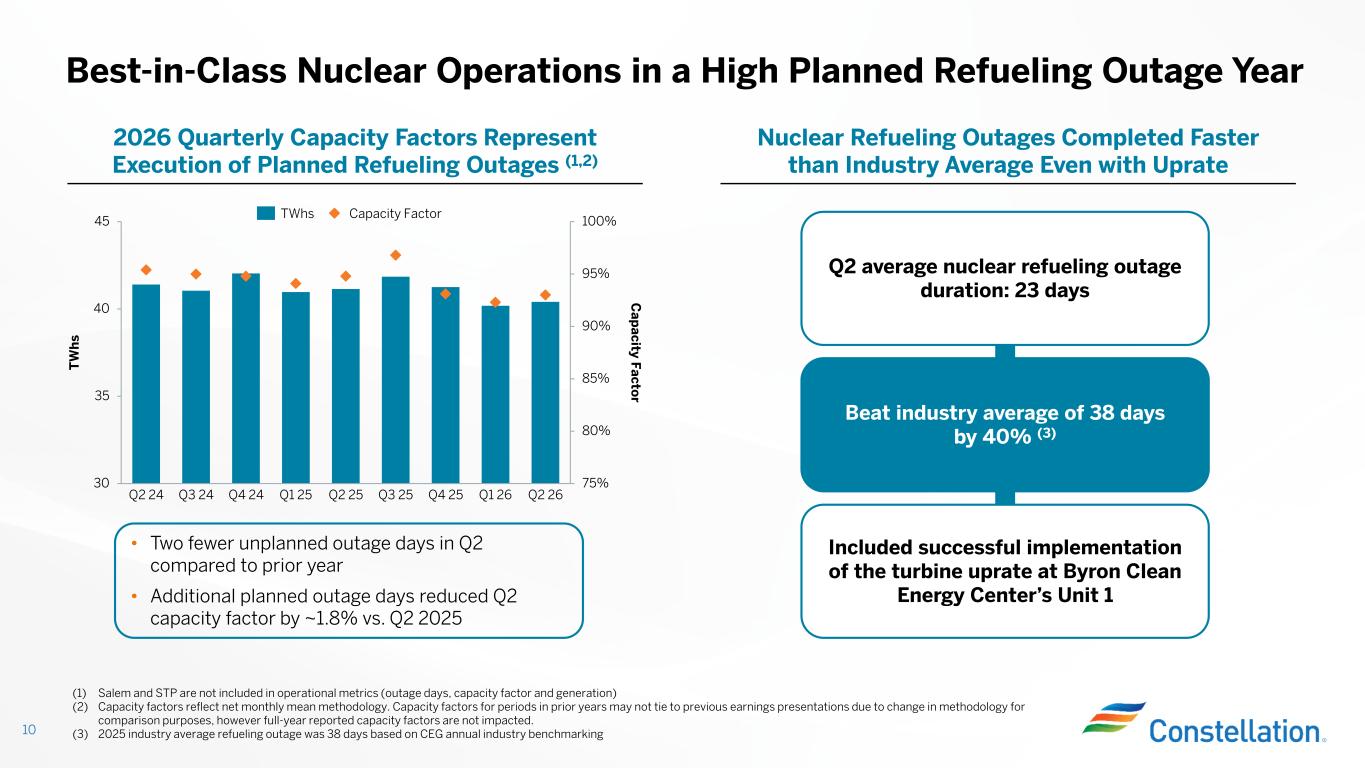
Best-in-Class Nuclear Operations in a High Planned Refueling Outage Year 10 75% 80% 85% 90% 95% 100% 30 35 40 45 T W h s C ap acity F acto r Q2 24 Q3 24 Q4 24 Q1 25 Q2 25 Q3 25 Q4 25 Q1 26 Q2 26 TWhs Capacity Factor Nuclear Refueling Outages Completed Faster than Industry Average Even with Uprate 2026 Quarterly Capacity Factors Represent Execution of Planned Refueling Outages (1,2) Included successful implementation of the turbine uprate at Byron Clean Energy Center’s Unit 1 Beat industry average of 38 days by 40% (3) (1) Salem and STP are not included in operational metrics (outage days, capacity factor and generation) (2) Capacity factors reflect net monthly mean methodology. Capacity factors for periods in prior years may not tie to previous earnings presentations due to change in methodology for comparison purposes, however full-year reported capacity factors are not impacted. (3) 2025 industry average refueling outage was 38 days based on CEG annual industry benchmarking • Two fewer unplanned outage days in Q2 compared to prior year • Additional planned outage days reduced Q2 capacity factor by ~1.8% vs. Q2 2025 Q2 average nuclear refueling outage duration: 23 days
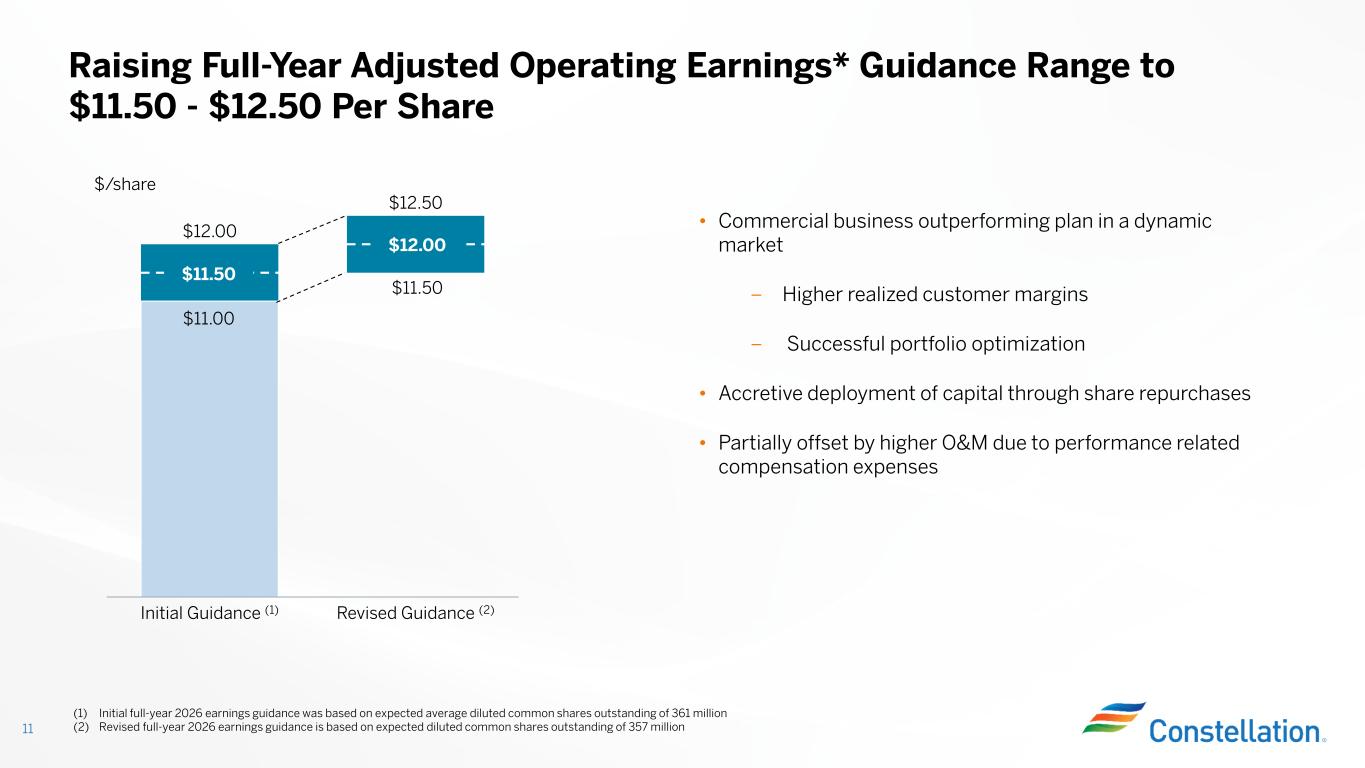
(1) Initial full-year 2026 earnings guidance was based on expected average diluted common shares outstanding of 361 million (2) Revised full-year 2026 earnings guidance is based on expected diluted common shares outstanding of 357 million Raising Full-Year Adjusted Operating Earnings* Guidance Range to $11.50 - $12.50 Per Share 11 • Commercial business outperforming plan in a dynamic market – Higher realized customer margins – Successful portfolio optimization • Accretive deployment of capital through share repurchases • Partially offset by higher O&M due to performance related compensation expenses $/share Initial Guidance (1) Revised Guidance (2) $12.00 $12.50 $11.00 $11.50 $11.50 $12.00
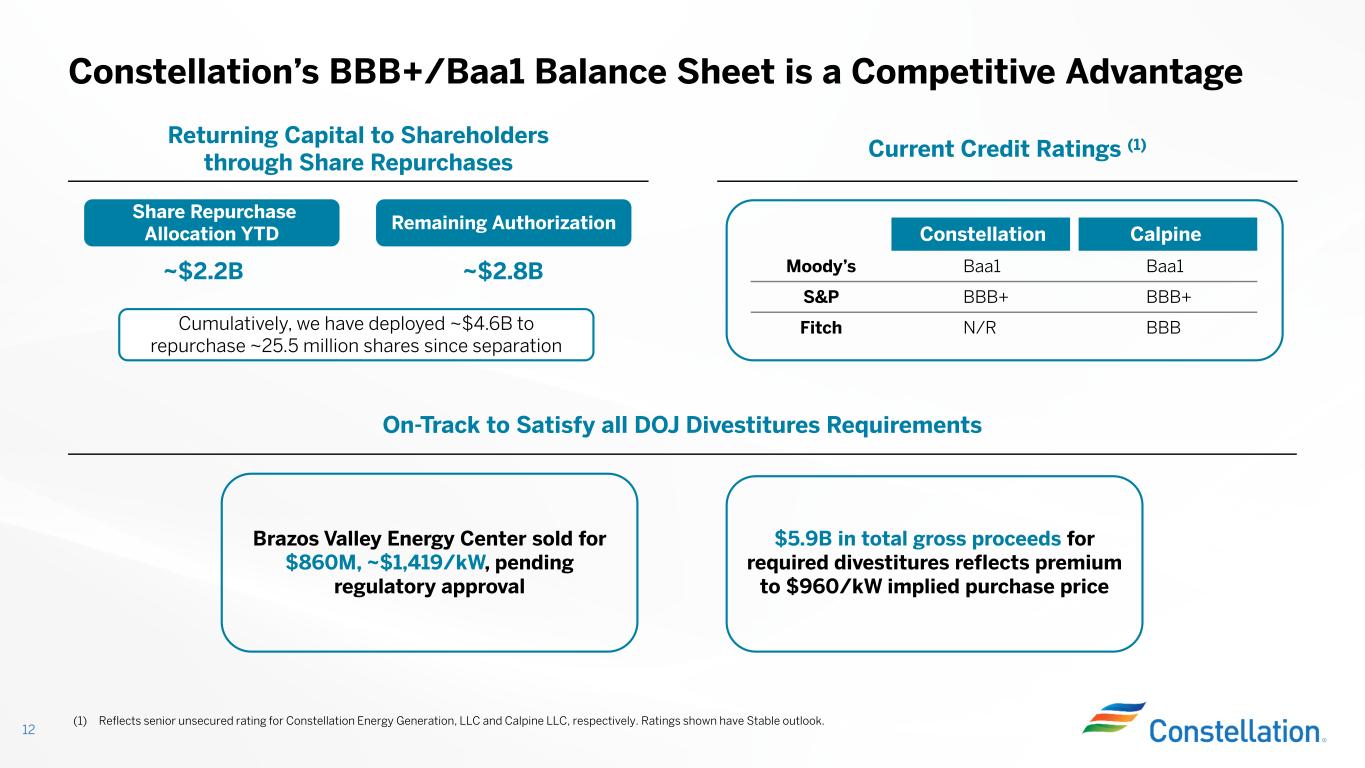
Constellation’s BBB+/Baa1 Balance Sheet is a Competitive Advantage Current Credit Ratings (1)Returning Capital to Shareholders through Share Repurchases 12 On-Track to Satisfy all DOJ Divestitures Requirements (1) Reflects senior unsecured rating for Constellation Energy Generation, LLC and Calpine LLC, respectively. Ratings shown have Stable outlook. Share Repurchase Allocation YTD ~$2.2B Remaining Authorization Cumulatively, we have deployed ~$4.6B to repurchase ~25.5 million shares since separation ~$2.8B CalpineConstellation Baa1Baa1Moody’s BBB+BBB+S&P BBBN/RFitch Brazos Valley Energy Center sold for $860M, ~$1,419/kW, pending regulatory approval $5.9B in total gross proceeds for required divestitures reflects premium to $960/kW implied purchase price
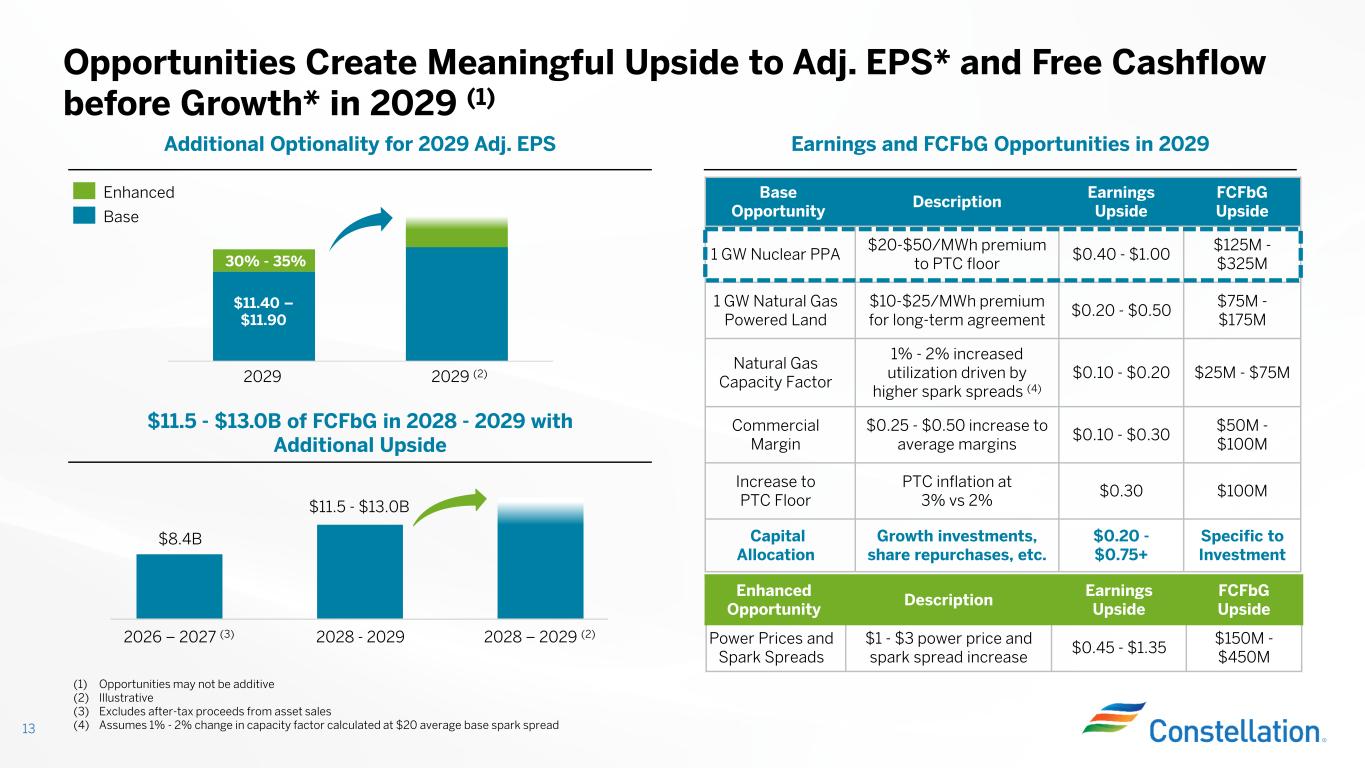
Opportunities Create Meaningful Upside to Adj. EPS* and Free Cashflow before Growth* in 2029 (1) 13 Earnings and FCFbG Opportunities in 2029Additional Optionality for 2029 Adj. EPS (1) Opportunities may not be additive (2) Illustrative (3) Excludes after-tax proceeds from asset sales (4) Assumes 1% - 2% change in capacity factor calculated at $20 average base spark spread 30% - 35% $11.40 – $11.90 Enhanced Base 2029 2029 (2) $11.5 - $13.0B of FCFbG in 2028 - 2029 with Additional Upside 2026 – 2027 (3) 2028 - 2029 2028 – 2029 (2) $8.4B $11.5 - $13.0B FCFbG Upside Earnings Upside Description Enhanced Opportunity $150M - $450M $0.45 - $1.35 $1 - $3 power price and spark spread increase Power Prices and Spark Spreads FCFbG Upside Earnings Upside Description Base Opportunity $125M - $325M $0.40 - $1.00 $20-$50/MWh premium to PTC floor 1 GW Nuclear PPA $75M - $175M $0.20 - $0.50 $10-$25/MWh premium for long-term agreement 1 GW Natural Gas Powered Land $25M - $75M$0.10 - $0.20 1% - 2% increased utilization driven by higher spark spreads (4) Natural Gas Capacity Factor $50M - $100M $0.10 - $0.30 $0.25 - $0.50 increase to average margins Commercial Margin $100M$0.30 PTC inflation at 3% vs 2% Increase to PTC Floor Specific to Investment $0.20 - $0.75+ Growth investments, share repurchases, etc. Capital Allocation
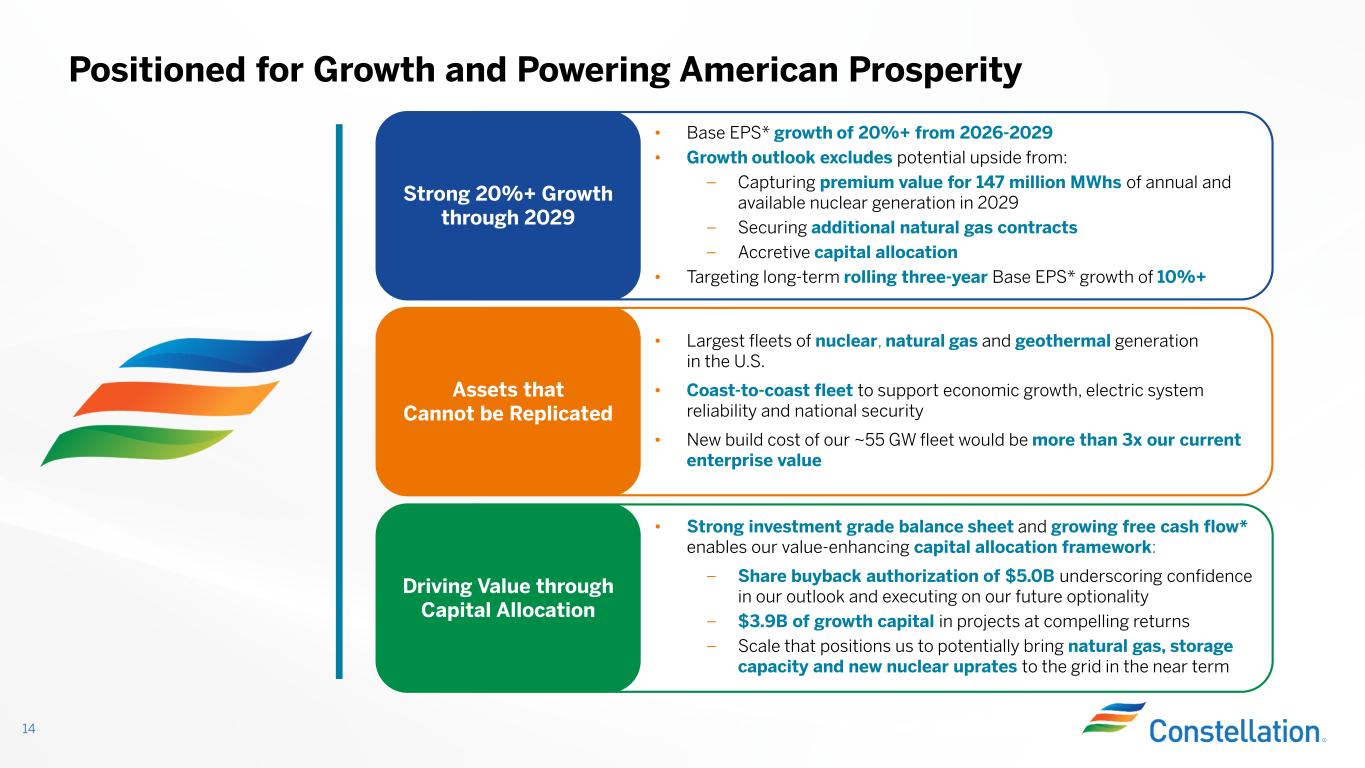
Positioned for Growth and Powering American Prosperity 14 Strong 20%+ Growth through 2029 • Base EPS* growth of 20%+ from 2026-2029 • Growth outlook excludes potential upside from: – Capturing premium value for 147 million MWhs of annual and available nuclear generation in 2029 – Securing additional natural gas contracts – Accretive capital allocation • Targeting long-term rolling three-year Base EPS* growth of 10%+ Assets that Cannot be Replicated • Largest fleets of nuclear, natural gas and geothermal generation in the U.S. • Coast-to-coast fleet to support economic growth, electric system reliability and national security • New build cost of our ~55 GW fleet would be more than 3x our current enterprise value Driving Value through Capital Allocation • Strong investment grade balance sheet and growing free cash flow* enables our value-enhancing capital allocation framework: – Share buyback authorization of $5.0B underscoring confidence in our outlook and executing on our future optionality – $3.9B of growth capital in projects at compelling returns – Scale that positions us to potentially bring natural gas, storage capacity and new nuclear uprates to the grid in the near term

Additional Disclosures 15
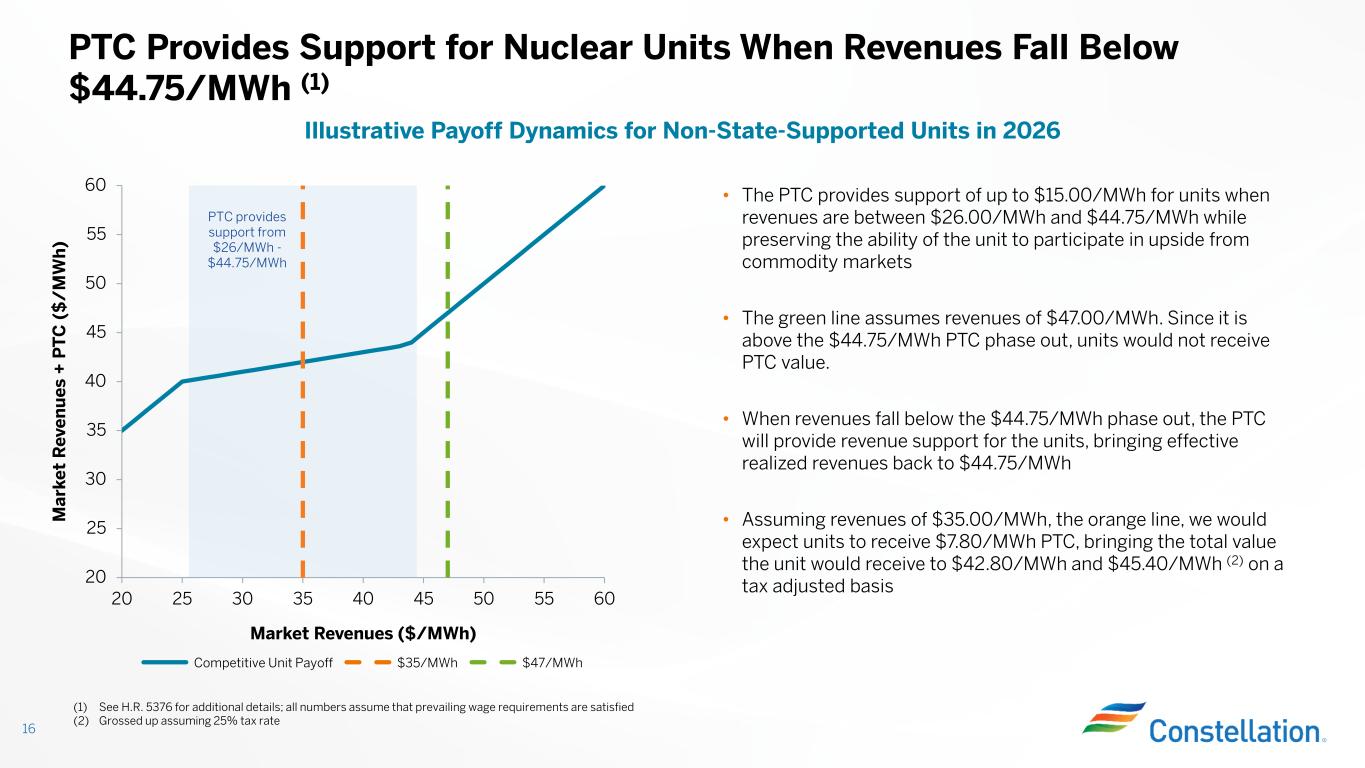
20 25 30 35 40 45 50 55 60 20 25 30 35 40 45 50 55 60 Market Revenues ($/MWh) M ar ke t R ev en u es + P T C ( $ / M W h ) 16 PTC Provides Support for Nuclear Units When Revenues Fall Below $44.75/MWh (1) Illustrative Payoff Dynamics for Non-State-Supported Units in 2026 • The PTC provides support of up to $15.00/MWh for units when revenues are between $26.00/MWh and $44.75/MWh while preserving the ability of the unit to participate in upside from commodity markets • The green line assumes revenues of $47.00/MWh. Since it is above the $44.75/MWh PTC phase out, units would not receive PTC value. • When revenues fall below the $44.75/MWh phase out, the PTC will provide revenue support for the units, bringing effective realized revenues back to $44.75/MWh • Assuming revenues of $35.00/MWh, the orange line, we would expect units to receive $7.80/MWh PTC, bringing the total value the unit would receive to $42.80/MWh and $45.40/MWh (2) on a tax adjusted basis Competitive Unit Payoff $35/MWh $47/MWh PTC provides support from $26/MWh - $44.75/MWh (1) See H.R. 5376 for additional details; all numbers assume that prevailing wage requirements are satisfied (2) Grossed up assuming 25% tax rate
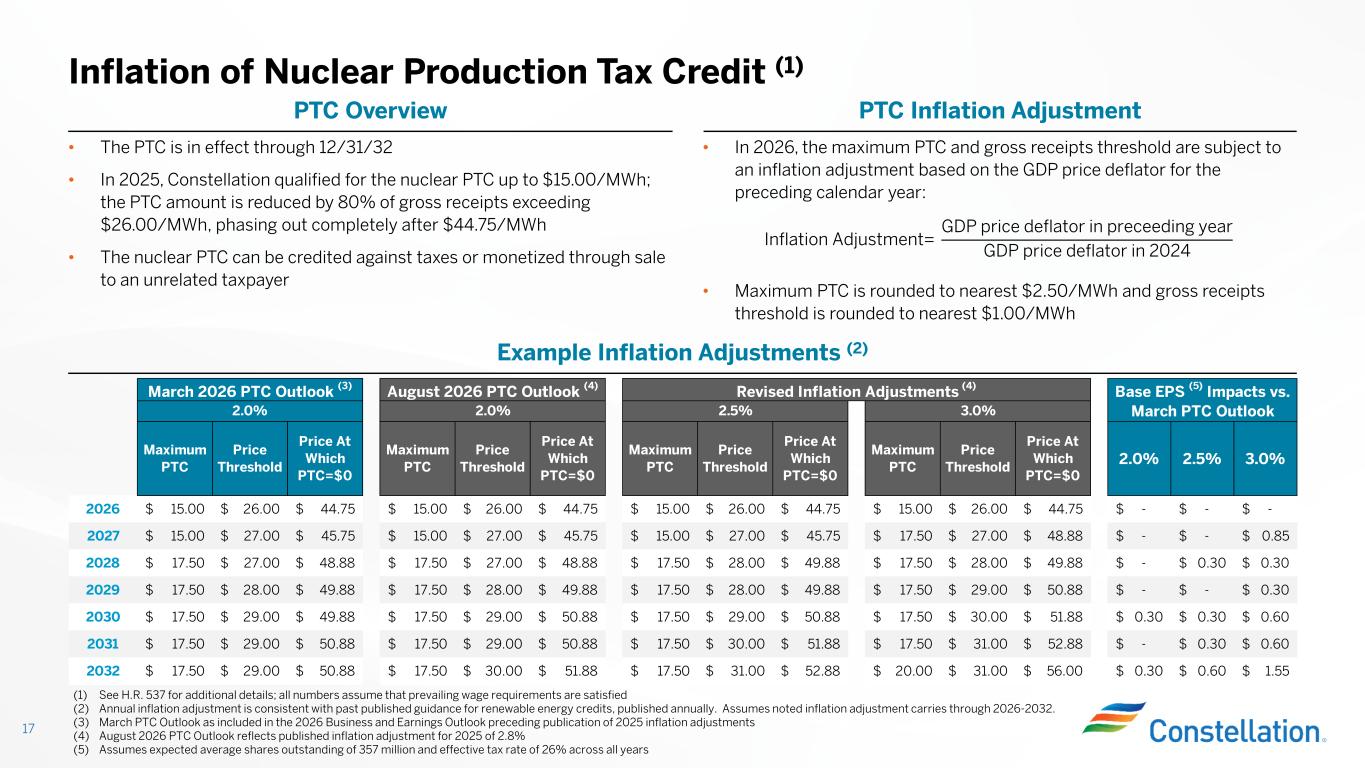
• In 2026, the maximum PTC and gross receipts threshold are subject to an inflation adjustment based on the GDP price deflator for the preceding calendar year: • Maximum PTC is rounded to nearest $2.50/MWh and gross receipts threshold is rounded to nearest $1.00/MWh Inflation of Nuclear Production Tax Credit (1) 17 (1) See H.R. 537 for additional details; all numbers assume that prevailing wage requirements are satisfied (2) Annual inflation adjustment is consistent with past published guidance for renewable energy credits, published annually. Assumes noted inflation adjustment carries through 2026-2032. (3) March PTC Outlook as included in the 2026 Business and Earnings Outlook preceding publication of 2025 inflation adjustments (4) August 2026 PTC Outlook reflects published inflation adjustment for 2025 of 2.8% (5) Assumes expected average shares outstanding of 357 million and effective tax rate of 26% across all years PTC Inflation AdjustmentPTC Overview Inflation Adjustment= GDP price deflator in preceeding year GDP price deflator in 2024 • The PTC is in effect through 12/31/32 • In 2025, Constellation qualified for the nuclear PTC up to $15.00/MWh; the PTC amount is reduced by 80% of gross receipts exceeding $26.00/MWh, phasing out completely after $44.75/MWh • The nuclear PTC can be credited against taxes or monetized through sale to an unrelated taxpayer Example Inflation Adjustments (2) Maximum PTC Price Threshold Price At Which PTC=$0 Maximum PTC Price Threshold Price At Which PTC=$0 Maximum PTC Price Threshold Price At Which PTC=$0 Maximum PTC Price Threshold Price At Which PTC=$0 2.0% 2.5% 3.0% 2026 15.00$ 26.00$ 44.75$ 15.00$ 26.00$ 44.75$ 15.00$ 26.00$ 44.75$ 15.00$ 26.00$ 44.75$ -$ -$ -$ 2027 15.00$ 27.00$ 45.75$ 15.00$ 27.00$ 45.75$ 15.00$ 27.00$ 45.75$ 17.50$ 27.00$ 48.88$ -$ -$ 0.85$ 2028 17.50$ 27.00$ 48.88$ 17.50$ 27.00$ 48.88$ 17.50$ 28.00$ 49.88$ 17.50$ 28.00$ 49.88$ -$ 0.30$ 0.30$ 2029 17.50$ 28.00$ 49.88$ 17.50$ 28.00$ 49.88$ 17.50$ 28.00$ 49.88$ 17.50$ 29.00$ 50.88$ -$ -$ 0.30$ 2030 17.50$ 29.00$ 49.88$ 17.50$ 29.00$ 50.88$ 17.50$ 29.00$ 50.88$ 17.50$ 30.00$ 51.88$ 0.30$ 0.30$ 0.60$ 2031 17.50$ 29.00$ 50.88$ 17.50$ 29.00$ 50.88$ 17.50$ 30.00$ 51.88$ 17.50$ 31.00$ 52.88$ -$ 0.30$ 0.60$ 2032 17.50$ 29.00$ 50.88$ 17.50$ 30.00$ 51.88$ 17.50$ 31.00$ 52.88$ 20.00$ 31.00$ 56.00$ 0.30$ 0.60$ 1.55$ Base EPS (5) Impacts vs. March PTC Outlook August 2026 PTC Outlook (4) Revised Inflation Adjustments (4) 2.0% 3.0% March 2026 PTC Outlook (3) 2.0% 2.5%
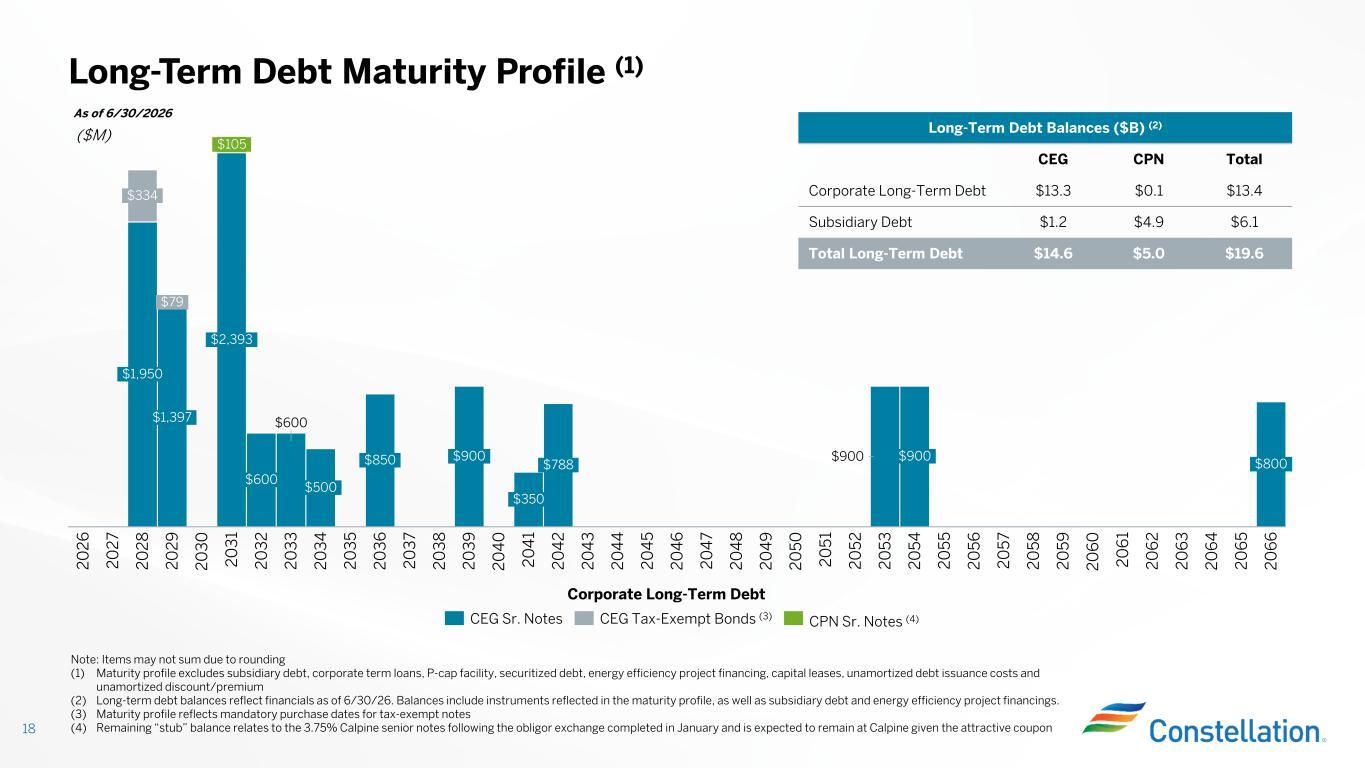
18 $600 $900 $334 2 0 2 8 $1,397 $79 2 0 2 6 2 0 3 0 $2,393 $105 2 0 3 1 $600 2 0 3 2 2 0 2 9 2 0 3 3 $500 2 0 3 4 2 0 3 5 $850 2 0 3 6 2 0 3 7 2 0 3 8 $900 2 0 3 9 2 0 4 0 $350 2 0 4 1 $788 2 0 4 2 2 0 4 3 2 0 4 4 2 0 4 5 2 0 4 6 2 0 4 7 2 0 4 8 2 0 4 9 2 0 5 0 2 0 5 1 2 0 5 2 2 0 2 7 2 0 5 3 $900 $1,950 2 0 5 5 2 0 5 6 2 0 5 7 2 0 5 8 2 0 5 9 2 0 6 0 2 0 5 4 2 0 6 2 2 0 6 3 2 0 6 4 2 0 6 5 $800 2 0 6 6 2 0 6 1 CEG Sr. Notes CEG Tax-Exempt Bonds (3) CPN Sr. Notes (4) As of 6/30/2026 Long-Term Debt Maturity Profile (1) Long-Term Debt Balances ($B) (2) TotalCPNCEG $13.4$0.1$13.3Corporate Long-Term Debt $6.1$4.9$1.2Subsidiary Debt $19.6$5.0$14.6Total Long-Term Debt ($M) Note: Items may not sum due to rounding (1) Maturity profile excludes subsidiary debt, corporate term loans, P-cap facility, securitized debt, energy efficiency project financing, capital leases, unamortized debt issuance costs and unamortized discount/premium (2) Long-term debt balances reflect financials as of 6/30/26. Balances include instruments reflected in the maturity profile, as well as subsidiary debt and energy efficiency project financings. (3) Maturity profile reflects mandatory purchase dates for tax-exempt notes (4) Remaining “stub” balance relates to the 3.75% Calpine senior notes following the obligor exchange completed in January and is expected to remain at Calpine given the attractive coupon Corporate Long-Term Debt
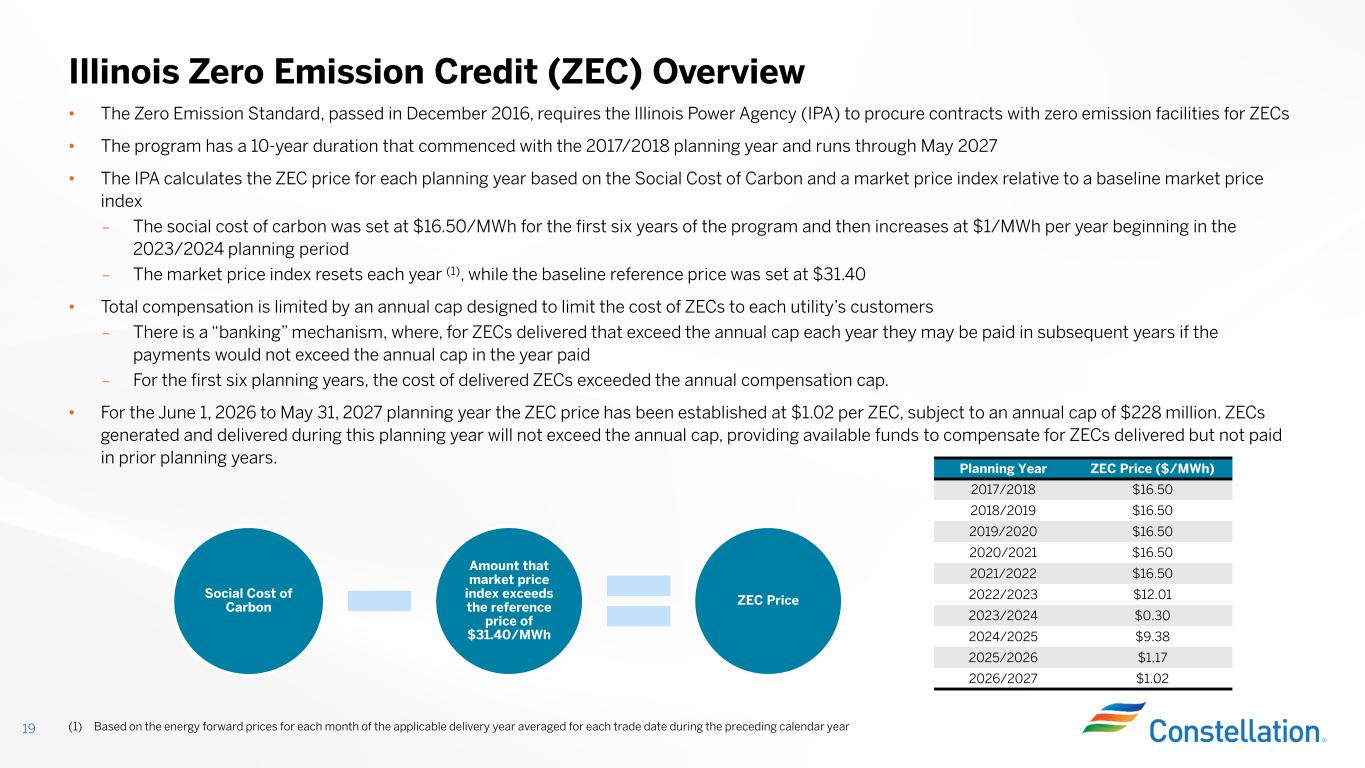
• The Zero Emission Standard, passed in December 2016, requires the Illinois Power Agency (IPA) to procure contracts with zero emission facilities for ZECs • The program has a 10-year duration that commenced with the 2017/2018 planning year and runs through May 2027 • The IPA calculates the ZEC price for each planning year based on the Social Cost of Carbon and a market price index relative to a baseline market price index – The social cost of carbon was set at $16.50/MWh for the first six years of the program and then increases at $1/MWh per year beginning in the 2023/2024 planning period – The market price index resets each year (1), while the baseline reference price was set at $31.40 • Total compensation is limited by an annual cap designed to limit the cost of ZECs to each utility’s customers – There is a “banking” mechanism, where, for ZECs delivered that exceed the annual cap each year they may be paid in subsequent years if the payments would not exceed the annual cap in the year paid – For the first six planning years, the cost of delivered ZECs exceeded the annual compensation cap. • For the June 1, 2026 to May 31, 2027 planning year the ZEC price has been established at $1.02 per ZEC, subject to an annual cap of $228 million. ZECs generated and delivered during this planning year will not exceed the annual cap, providing available funds to compensate for ZECs delivered but not paid in prior planning years. Illinois Zero Emission Credit (ZEC) Overview Social Cost of Carbon Amount that market price index exceeds the reference price of $31.40/MWh ZEC Price (1) Based on the energy forward prices for each month of the applicable delivery year averaged for each trade date during the preceding calendar year19 ZEC Price ($/MWh)Planning Year $16.502017/2018 $16.502018/2019 $16.502019/2020 $16.502020/2021 $16.502021/2022 $12.012022/2023 $0.302023/2024 $9.382024/2025 $1.172025/2026 $1.022026/2027

Modeling Slides 20
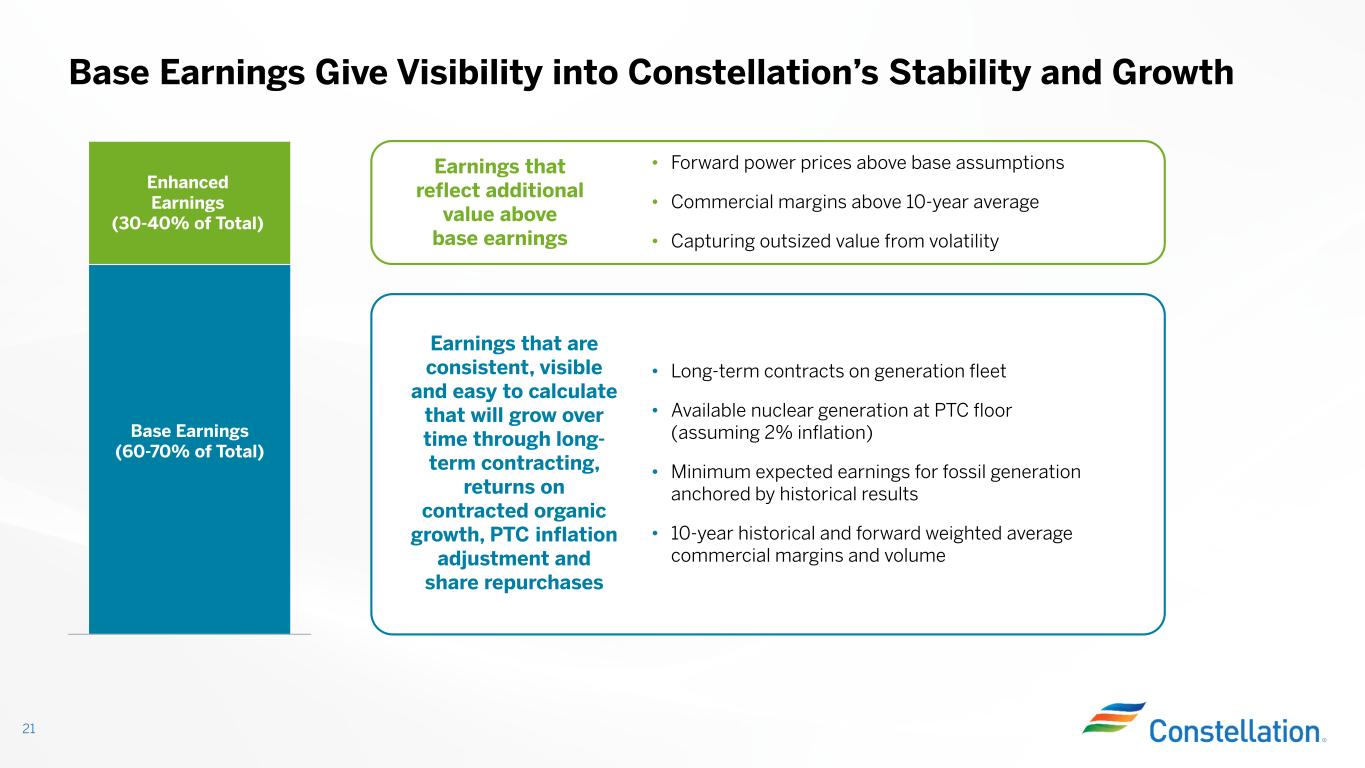
Base Earnings Give Visibility into Constellation’s Stability and Growth 21 Enhanced Earnings (30-40% of Total) Base Earnings (60-70% of Total) Earnings that reflect additional value above base earnings Earnings that are consistent, visible and easy to calculate that will grow over time through long- term contracting, returns on contracted organic growth, PTC inflation adjustment and share repurchases • Forward power prices above base assumptions • Commercial margins above 10-year average • Capturing outsized value from volatility • Long-term contracts on generation fleet • Available nuclear generation at PTC floor (assuming 2% inflation) • Minimum expected earnings for fossil generation anchored by historical results • 10-year historical and forward weighted average commercial margins and volume
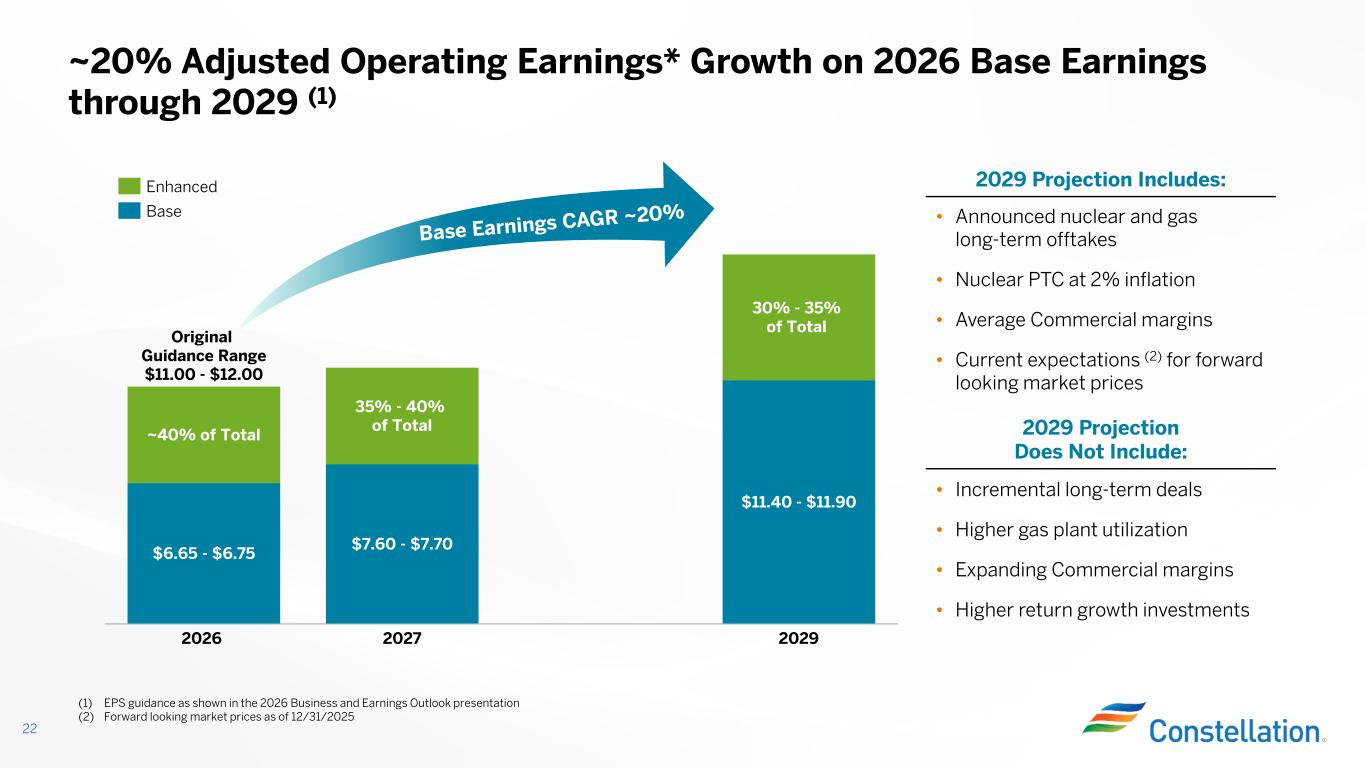
~20% Adjusted Operating Earnings* Growth on 2026 Base Earnings through 2029 (1) 22 $6.65 - $6.75 ~40% of Total 2026 $7.60 - $7.70 35% - 40% of Total 2027 $11.40 - $11.90 30% - 35% of Total 2029 Original Guidance Range $11.00 - $12.00 (1) EPS guidance as shown in the 2026 Business and Earnings Outlook presentation (2) Forward looking market prices as of 12/31/2025 2029 Projection Includes: 2029 Projection Does Not Include: • Incremental long-term deals • Higher gas plant utilization • Expanding Commercial margins • Higher return growth investments • Announced nuclear and gas long-term offtakes • Nuclear PTC at 2% inflation • Average Commercial margins • Current expectations (2) for forward looking market prices Enhanced Base
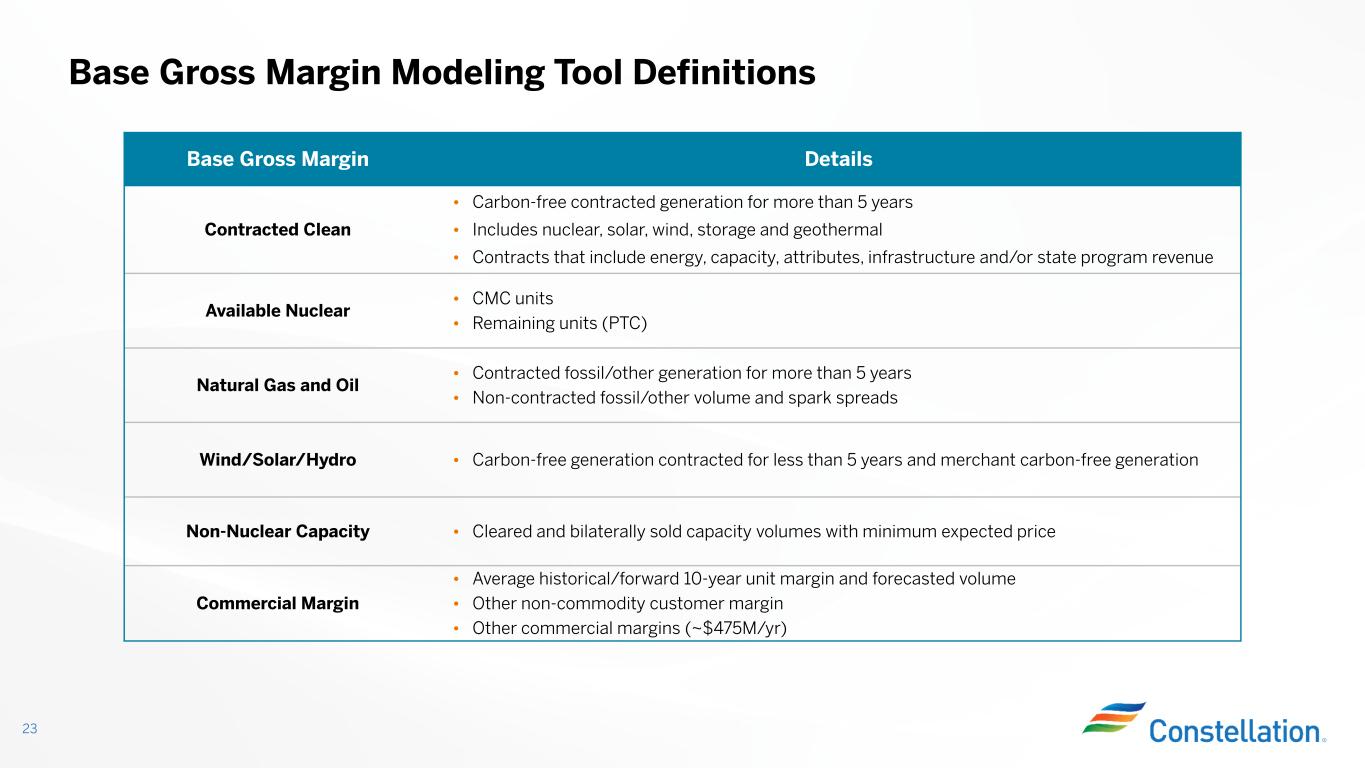
Base Gross Margin Modeling Tool Definitions 23 DetailsBase Gross Margin • Carbon-free contracted generation for more than 5 years • Includes nuclear, solar, wind, storage and geothermal • Contracts that include energy, capacity, attributes, infrastructure and/or state program revenue Contracted Clean • CMC units • Remaining units (PTC) Available Nuclear • Contracted fossil/other generation for more than 5 years • Non-contracted fossil/other volume and spark spreads Natural Gas and Oil • Carbon-free generation contracted for less than 5 years and merchant carbon-free generation Wind/Solar/Hydro • Cleared and bilaterally sold capacity volumes with minimum expected priceNon-Nuclear Capacity • Average historical/forward 10-year unit margin and forecasted volume • Other non-commodity customer margin • Other commercial margins (~$475M/yr) Commercial Margin
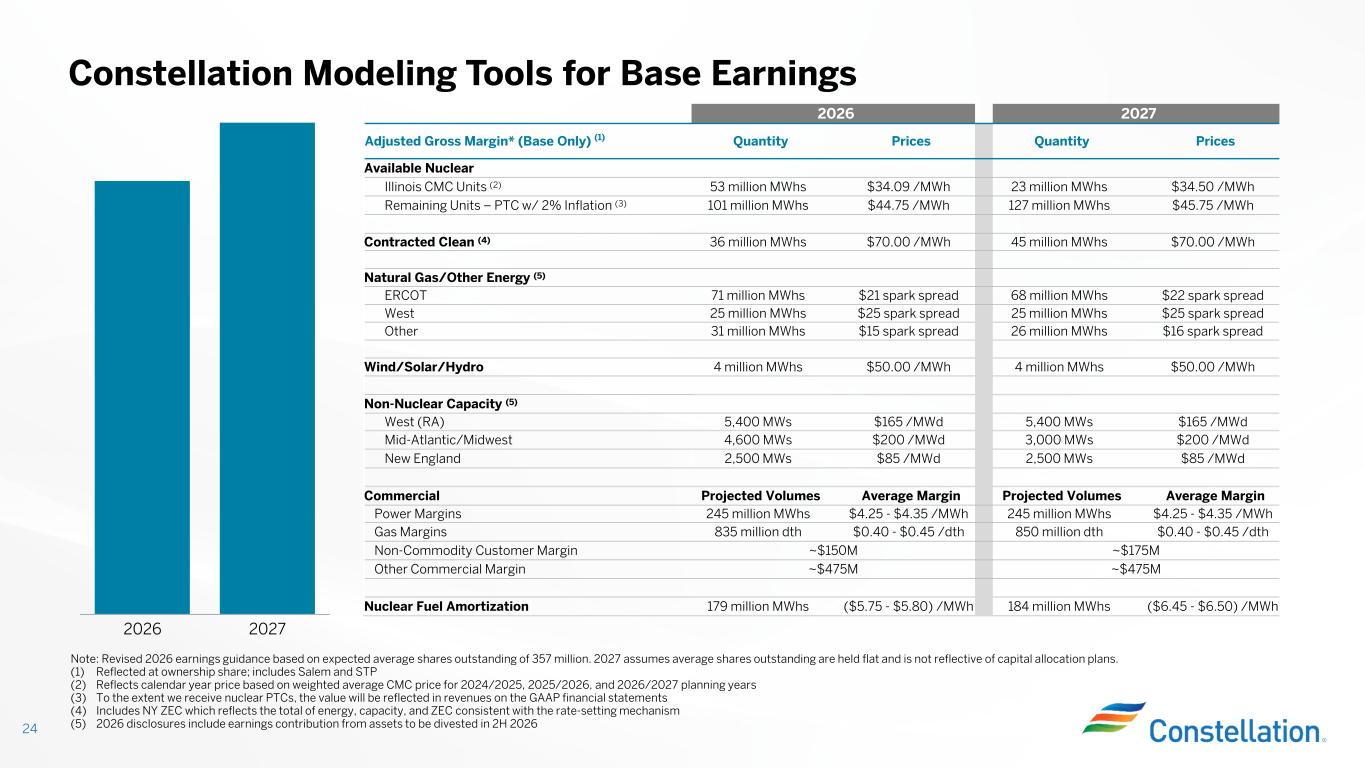
Constellation Modeling Tools for Base Earnings 24 Note: Revised 2026 earnings guidance based on expected average shares outstanding of 357 million. 2027 assumes average shares outstanding are held flat and is not reflective of capital allocation plans. (1) Reflected at ownership share; includes Salem and STP (2) Reflects calendar year price based on weighted average CMC price for 2024/2025, 2025/2026, and 2026/2027 planning years (3) To the extent we receive nuclear PTCs, the value will be reflected in revenues on the GAAP financial statements (4) Includes NY ZEC which reflects the total of energy, capacity, and ZEC consistent with the rate-setting mechanism (5) 2026 disclosures include earnings contribution from assets to be divested in 2H 2026 20272026 PricesQuantityPricesQuantityAdjusted Gross Margin* (Base Only) (1) Available Nuclear $34.50 /MWh23 million MWhs$34.09 /MWh53 million MWhsIllinois CMC Units (2) $45.75 /MWh127 million MWhs$44.75 /MWh101 million MWhsRemaining Units – PTC w/ 2% Inflation (3) $70.00 /MWh45 million MWhs$70.00 /MWh36 million MWhsContracted Clean (4) Natural Gas/Other Energy (5) $22 spark spread68 million MWhs$21 spark spread71 million MWhsERCOT $25 spark spread25 million MWhs$25 spark spread25 million MWhsWest $16 spark spread26 million MWhs$15 spark spread31 million MWhsOther $50.00 /MWh4 million MWhs$50.00 /MWh4 million MWhsWind/Solar/Hydro Non-Nuclear Capacity (5) $165 /MWd5,400 MWs$165 /MWd5,400 MWsWest (RA) $200 /MWd3,000 MWs$200 /MWd4,600 MWsMid-Atlantic/Midwest $85 /MWd2,500 MWs$85 /MWd2,500 MWsNew England Average MarginProjected VolumesAverage MarginProjected VolumesCommercial $4.25 - $4.35 /MWh245 million MWhs$4.25 - $4.35 /MWh245 million MWhsPower Margins $0.40 - $0.45 /dth850 million dth$0.40 - $0.45 /dth835 million dthGas Margins ~$175M~$150MNon-Commodity Customer Margin ~$475M~$475MOther Commercial Margin ($6.45 - $6.50) /MWh184 million MWhs($5.75 - $5.80) /MWh179 million MWhsNuclear Fuel Amortization 2026 2027
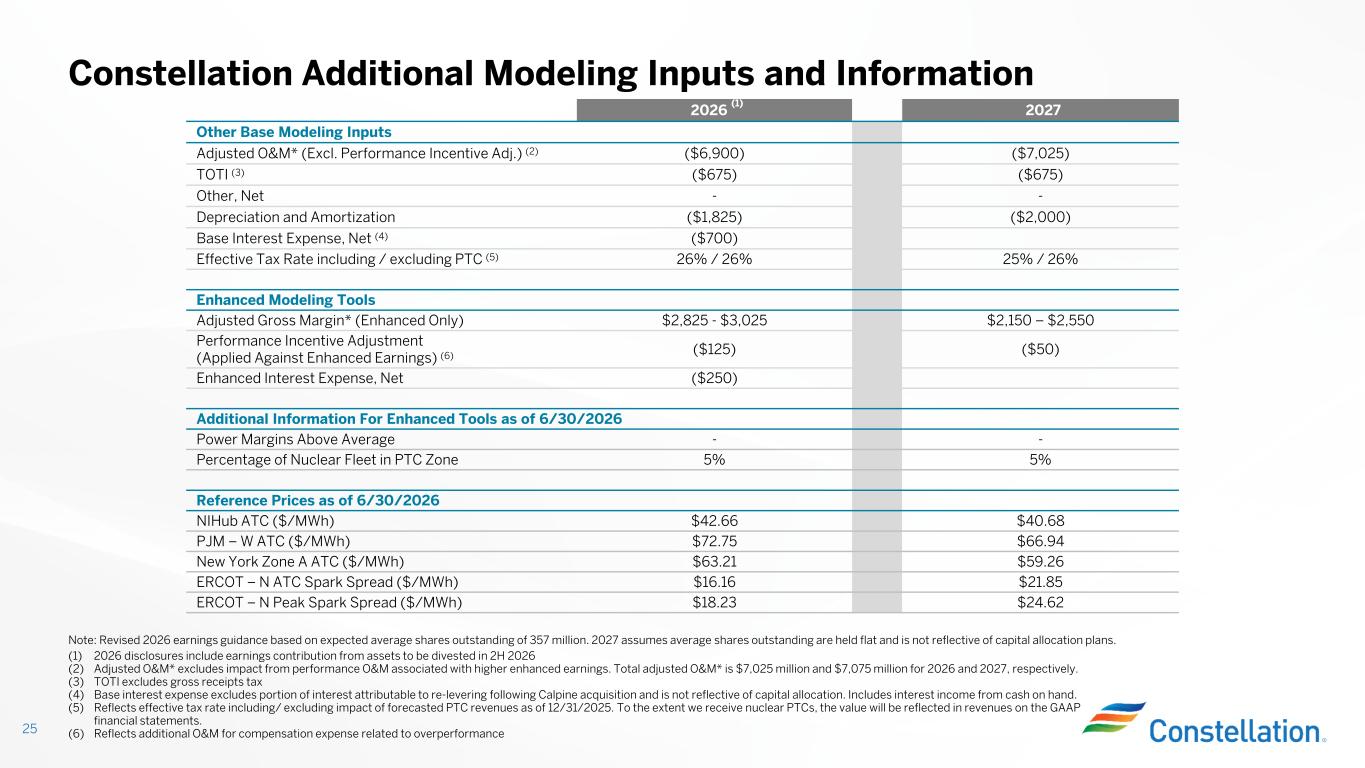
Constellation Additional Modeling Inputs and Information 25 (1) 2026 disclosures include earnings contribution from assets to be divested in 2H 2026 (2) Adjusted O&M* excludes impact from performance O&M associated with higher enhanced earnings. Total adjusted O&M* is $7,025 million and $7,075 million for 2026 and 2027, respectively. (3) TOTI excludes gross receipts tax (4) Base interest expense excludes portion of interest attributable to re-levering following Calpine acquisition and is not reflective of capital allocation. Includes interest income from cash on hand. (5) Reflects effective tax rate including/ excluding impact of forecasted PTC revenues as of 12/31/2025. To the extent we receive nuclear PTCs, the value will be reflected in revenues on the GAAP financial statements. (6) Reflects additional O&M for compensation expense related to overperformance 20272026 (1) Other Base Modeling Inputs ($7,025)($6,900)Adjusted O&M* (Excl. Performance Incentive Adj.) (2) ($675)($675)TOTI (3) --Other, Net ($2,000)($1,825)Depreciation and Amortization ($700)Base Interest Expense, Net (4) 25% / 26%26% / 26%Effective Tax Rate including / excluding PTC (5) Enhanced Modeling Tools $2,150 – $2,550$2,825 - $3,025Adjusted Gross Margin* (Enhanced Only) ($50)($125) Performance Incentive Adjustment (Applied Against Enhanced Earnings) (6) ($250)Enhanced Interest Expense, Net Additional Information For Enhanced Tools as of 6/30/2026 --Power Margins Above Average 5%5%Percentage of Nuclear Fleet in PTC Zone Reference Prices as of 6/30/2026 $40.68$42.66NIHub ATC ($/MWh) $66.94$72.75PJM – W ATC ($/MWh) $59.26$63.21New York Zone A ATC ($/MWh) $21.85$16.16ERCOT – N ATC Spark Spread ($/MWh) $24.62$18.23ERCOT – N Peak Spark Spread ($/MWh) Note: Revised 2026 earnings guidance based on expected average shares outstanding of 357 million. 2027 assumes average shares outstanding are held flat and is not reflective of capital allocation plans.
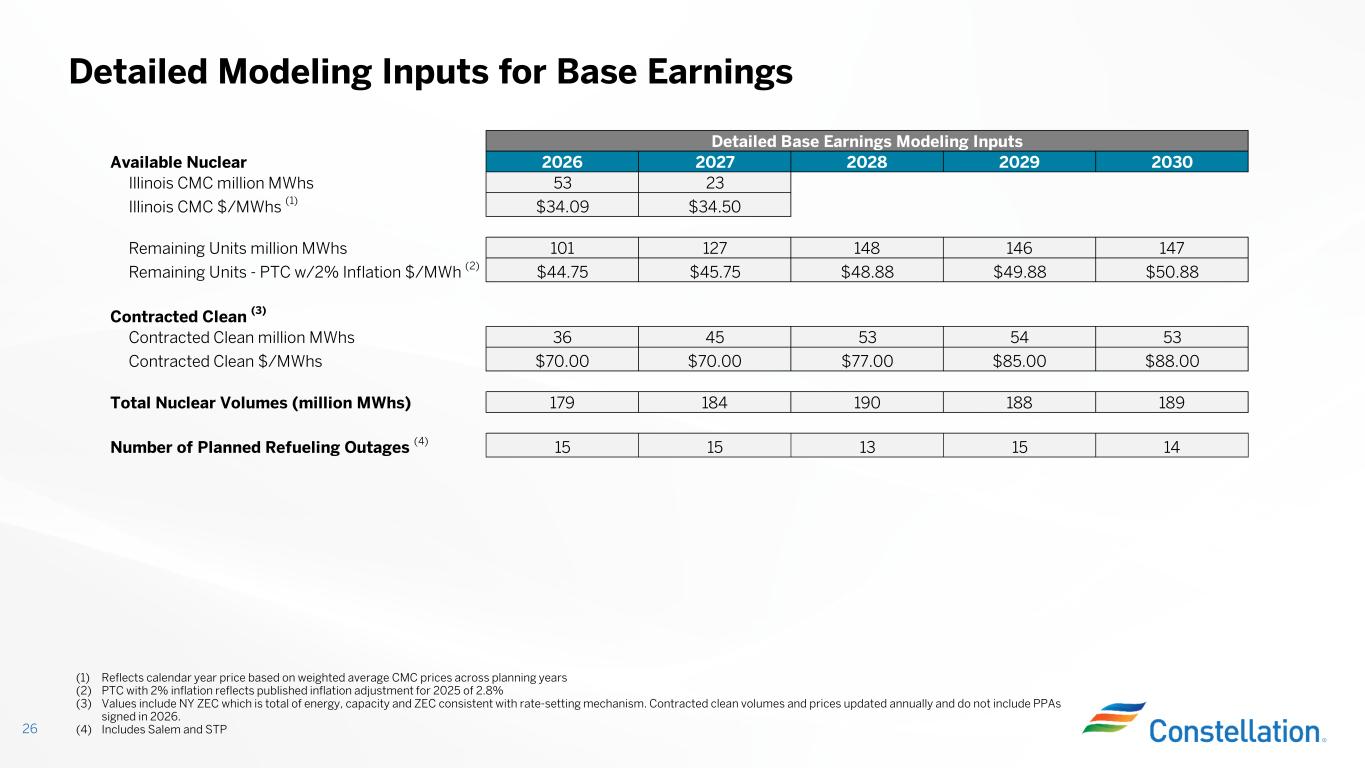
Detailed Modeling Inputs for Base Earnings 26 (1) Reflects calendar year price based on weighted average CMC prices across planning years (2) PTC with 2% inflation reflects published inflation adjustment for 2025 of 2.8% (3) Values include NY ZEC which is total of energy, capacity and ZEC consistent with rate-setting mechanism. Contracted clean volumes and prices updated annually and do not include PPAs signed in 2026. (4) Includes Salem and STP Detailed Base Earnings Modeling Inputs Available Nuclear 2026 2027 2028 2029 2030 Illinois CMC million MWhs 53 23 Illinois CMC $/MWhs (1) $34.09 $34.50 Remaining Units million MWhs 101 127 148 146 147 Remaining Units - PTC w/2% Inflation $/MWh (2) $44.75 $45.75 $48.88 $49.88 $50.88 Contracted Clean (3) Contracted Clean million MWhs 36 45 53 54 53 Contracted Clean $/MWhs $70.00 $70.00 $77.00 $85.00 $88.00 Total Nuclear Volumes (million MWhs) 179 184 190 188 189 Number of Planned Refueling Outages (4) 15 15 13 15 14
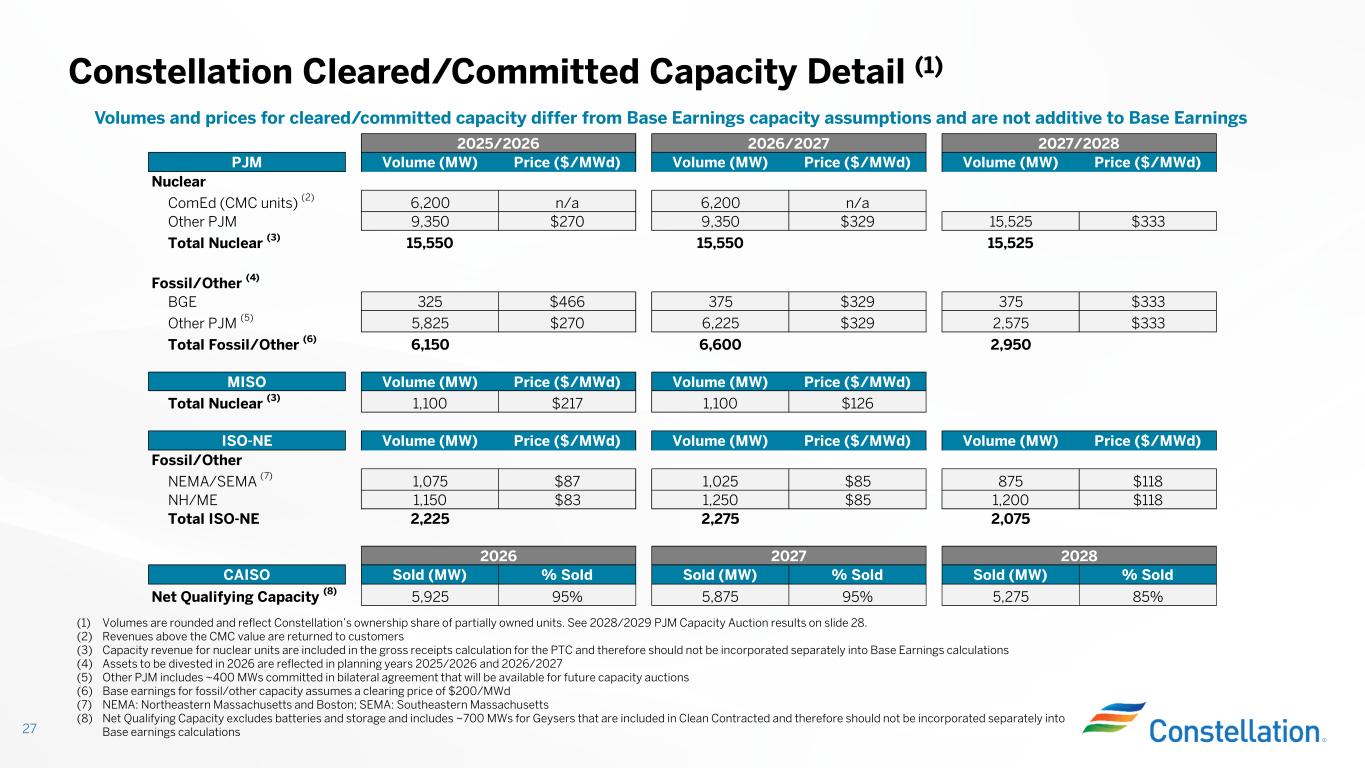
Constellation Cleared/Committed Capacity Detail (1) 27 (1) Volumes are rounded and reflect Constellation’s ownership share of partially owned units. See 2028/2029 PJM Capacity Auction results on slide 28. (2) Revenues above the CMC value are returned to customers (3) Capacity revenue for nuclear units are included in the gross receipts calculation for the PTC and therefore should not be incorporated separately into Base Earnings calculations (4) Assets to be divested in 2026 are reflected in planning years 2025/2026 and 2026/2027 (5) Other PJM includes ~400 MWs committed in bilateral agreement that will be available for future capacity auctions (6) Base earnings for fossil/other capacity assumes a clearing price of $200/MWd (7) NEMA: Northeastern Massachusetts and Boston; SEMA: Southeastern Massachusetts (8) Net Qualifying Capacity excludes batteries and storage and includes ~700 MWs for Geysers that are included in Clean Contracted and therefore should not be incorporated separately into Base earnings calculations Volumes and prices for cleared/committed capacity differ from Base Earnings capacity assumptions and are not additive to Base Earnings PJM Volume (MW) Price ($/MWd) Volume (MW) Price ($/MWd) Volume (MW) Price ($/MWd) Nuclear ComEd (CMC units) (2) 6,200 n/a 6,200 n/a Other PJM 9,350 $270 9,350 $329 15,525 $333 Total Nuclear (3) 15,550 15,550 15,525 Fossil/Other (4) BGE 325 $466 375 $329 375 $333 Other PJM (5) 5,825 $270 6,225 $329 2,575 $333 Total Fossil/Other (6) 6,150 6,600 2,950 MISO Volume (MW) Price ($/MWd) Volume (MW) Price ($/MWd) Total Nuclear (3) 1,100 $217 1,100 $126 ISO-NE Volume (MW) Price ($/MWd) Volume (MW) Price ($/MWd) Volume (MW) Price ($/MWd) Fossil/Other NEMA/SEMA (7) 1,075 $87 1,025 $85 875 $118 NH/ME 1,150 $83 1,250 $85 1,200 $118 Total ISO-NE 2,225 2,275 2,075 CAISO Sold (MW) % Sold Sold (MW) % Sold Sold (MW) % Sold Net Qualifying Capacity (8) 5,925 95% 5,875 95% 5,275 85% 2025/2026 2026/2027 2027/2028 2026 2027 2028
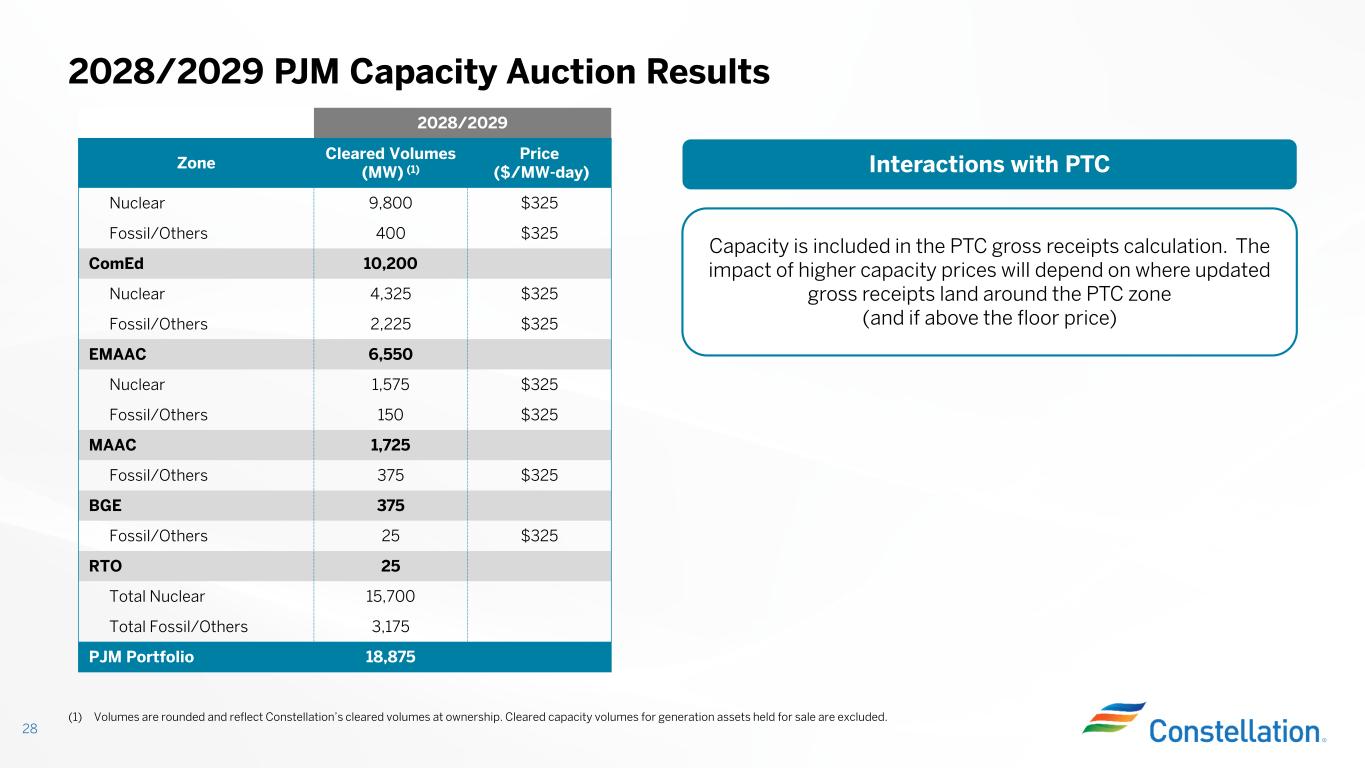
2028/2029 PJM Capacity Auction Results 28 2028/2029 Price ($/MW-day) Cleared Volumes (MW) (1)Zone $3259,800Nuclear $325400Fossil/Others 10,200ComEd $3254,325Nuclear $3252,225Fossil/Others 6,550EMAAC $3251,575Nuclear $325150Fossil/Others 1,725MAAC $325375Fossil/Others 375BGE $32525Fossil/Others 25RTO 15,700Total Nuclear 3,175Total Fossil/Others 18,875PJM Portfolio (1) Volumes are rounded and reflect Constellation’s cleared volumes at ownership. Cleared capacity volumes for generation assets held for sale are excluded. Interactions with PTC Capacity is included in the PTC gross receipts calculation. The impact of higher capacity prices will depend on where updated gross receipts land around the PTC zone (and if above the floor price)
Appendix Reconciliation of Non-GAAP Measures 29
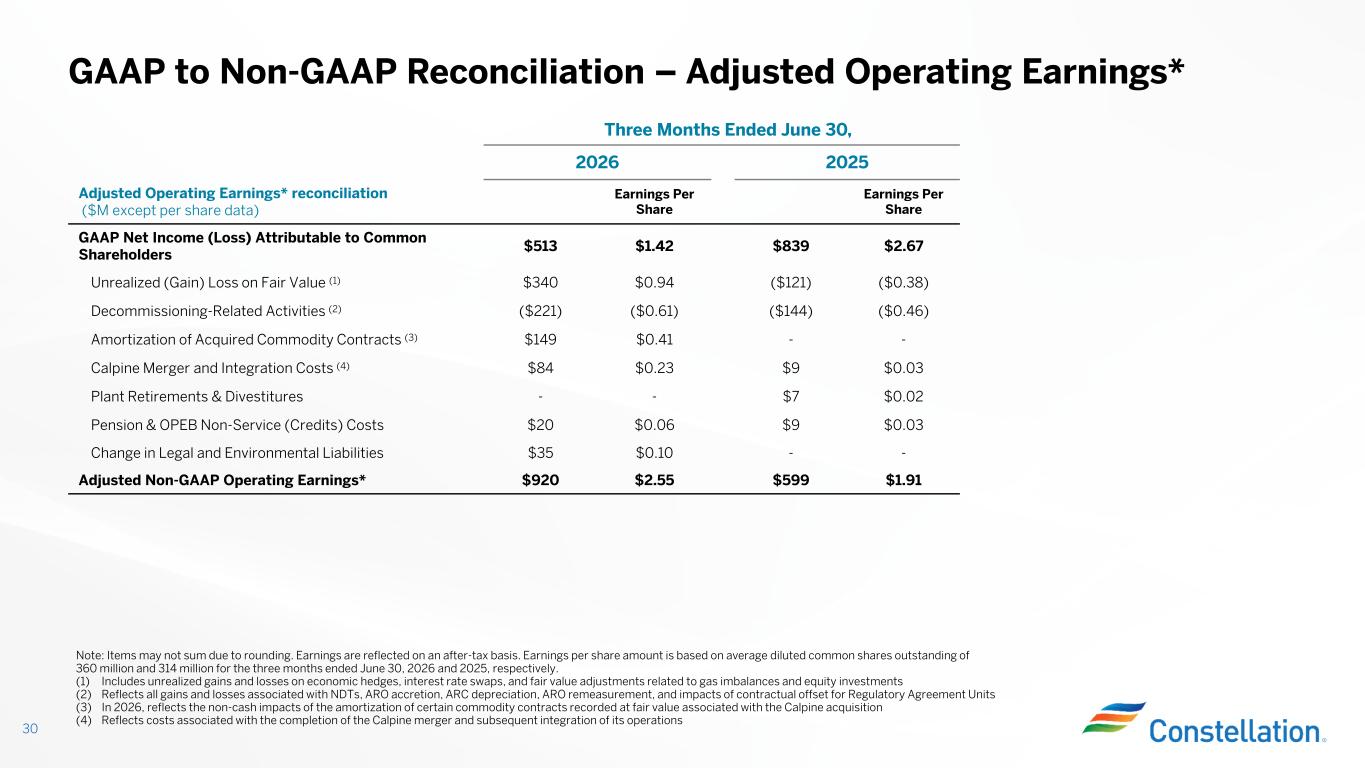
Three Months Ended June 30, 20252026 Earnings Per Share Earnings Per Share Adjusted Operating Earnings* reconciliation ($M except per share data) $2.67$839$1.42$513 GAAP Net Income (Loss) Attributable to Common Shareholders ($0.38)($121)$0.94$340Unrealized (Gain) Loss on Fair Value (1) ($0.46)($144)($0.61)($221)Decommissioning-Related Activities (2) --$0.41$149Amortization of Acquired Commodity Contracts (3) $0.03$9$0.23$84Calpine Merger and Integration Costs (4) $0.02$7--Plant Retirements & Divestitures $0.03$9$0.06$20Pension & OPEB Non-Service (Credits) Costs --$0.10$35Change in Legal and Environmental Liabilities $1.91$599$2.55$920Adjusted Non-GAAP Operating Earnings* GAAP to Non-GAAP Reconciliation – Adjusted Operating Earnings* 30 Note: Items may not sum due to rounding. Earnings are reflected on an after-tax basis. Earnings per share amount is based on average diluted common shares outstanding of 360 million and 314 million for the three months ended June 30, 2026 and 2025, respectively. (1) Includes unrealized gains and losses on economic hedges, interest rate swaps, and fair value adjustments related to gas imbalances and equity investments (2) Reflects all gains and losses associated with NDTs, ARO accretion, ARC depreciation, ARO remeasurement, and impacts of contractual offset for Regulatory Agreement Units (3) In 2026, reflects the non-cash impacts of the amortization of certain commodity contracts recorded at fair value associated with the Calpine acquisition (4) Reflects costs associated with the completion of the Calpine merger and subsequent integration of its operations
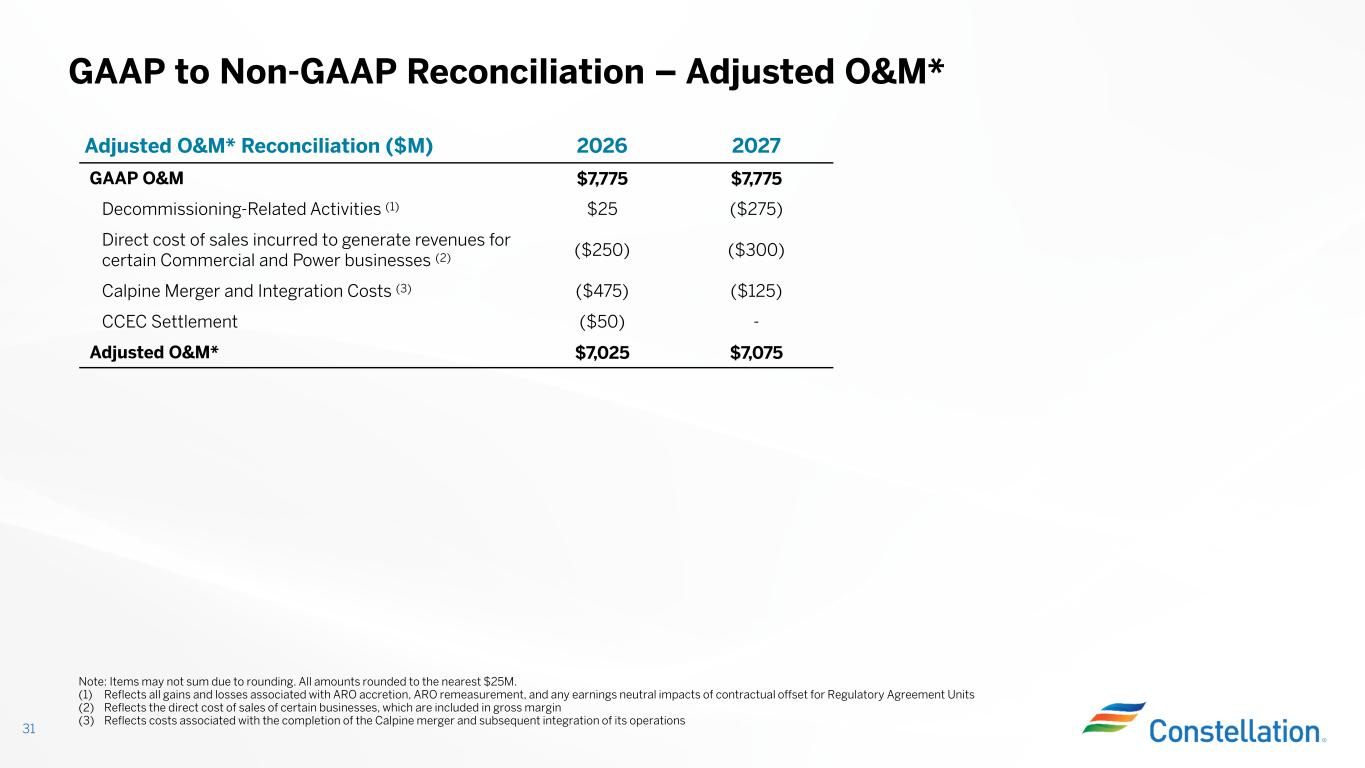
GAAP to Non-GAAP Reconciliation – Adjusted O&M* 31 20272026Adjusted O&M* Reconciliation ($M) $7,775$7,775GAAP O&M ($275)$25Decommissioning-Related Activities (1) ($300)($250) Direct cost of sales incurred to generate revenues for certain Commercial and Power businesses (2) ($125)($475)Calpine Merger and Integration Costs (3) -($50)CCEC Settlement $7,075$7,025Adjusted O&M* Note: Items may not sum due to rounding. All amounts rounded to the nearest $25M. (1) Reflects all gains and losses associated with ARO accretion, ARO remeasurement, and any earnings neutral impacts of contractual offset for Regulatory Agreement Units (2) Reflects the direct cost of sales of certain businesses, which are included in gross margin (3) Reflects costs associated with the completion of the Calpine merger and subsequent integration of its operations
32 Contact Information InvestorRelations@constellation.com Links Events and Presentations Reports & SEC Filings Constellation Sustainability Report Nuclear 101