
© 2026 Kelly Services, Inc. All rights reserved. August 6, 2026 Q2 2026 Exhibit 99.2

© 2026 Kelly Services, Inc. All rights reserved. 2 Financials
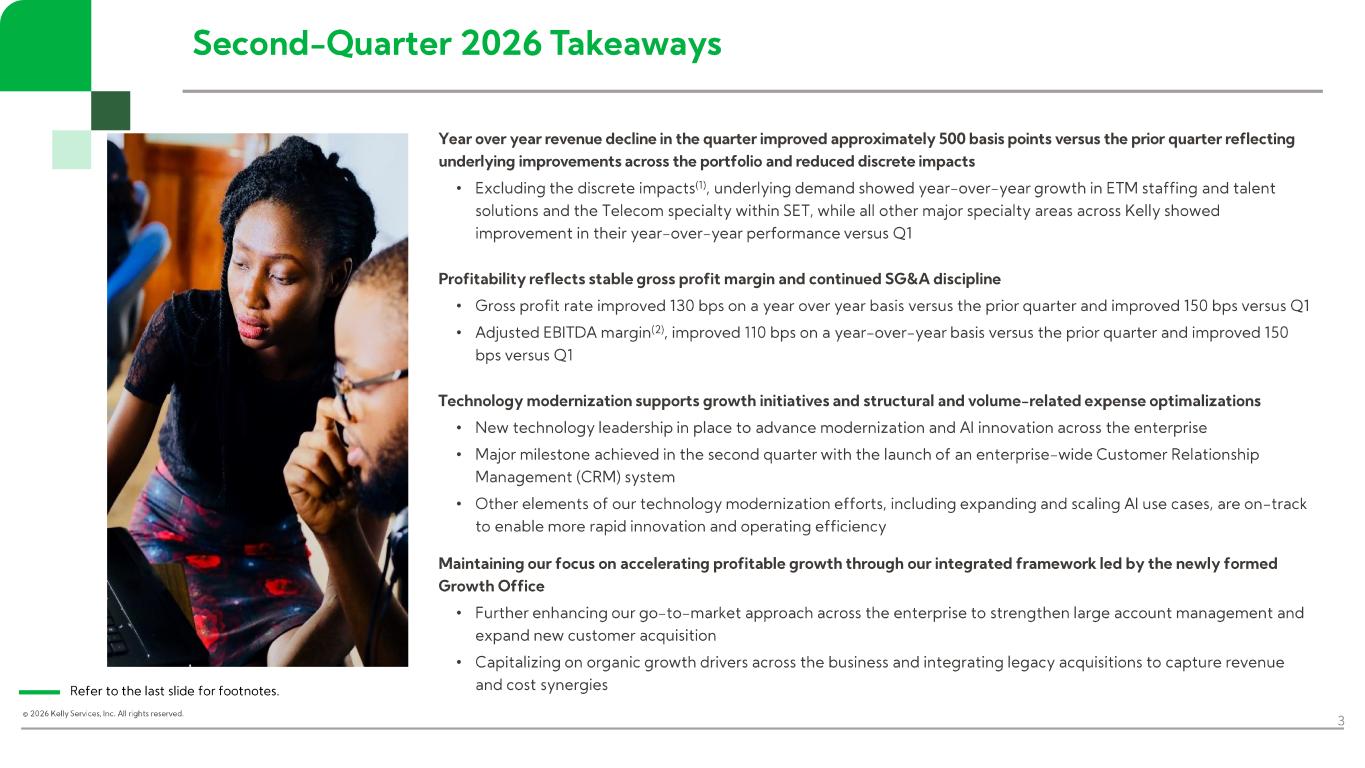
© 2026 Kelly Services, Inc. All rights reserved. Second - Quarter 2026 Takeaways 3 Year over year revenue decline in the quarter improved approximately 500 basis points versus the prior quarter reflecting underlying improvements across the portfolio and reduced discrete impacts • Excluding the discrete impacts (1), underlying demand showed year - over - year growth in ETM staffing and talent solutions and the Telecom specialty within SET, while all other major specialty areas across Kelly showed improvement in their year - over - year performance versus Q1 Profitability reflects stable gross profit margin and continued SG&A discipline • Gross profit rate improved 130 bps on a year over year basis versus the prior quarter and improved 150 bps versus Q1 • Adjusted EBITDA margin (2) , improved 110 bps on a year - over - year basis versus the prior quarter and improved 150 bps versus Q1 Technology modernization supports growth initiatives and structural and volume - related expense optimalizations • New technology leadership in place to advance modernization and AI innovation across the enterprise • Major milestone achieved in the second quarter with the launch of an enterprise - wide Customer Relationship Management (CRM) system • Other elements of our technology modernization efforts, including expanding and scaling AI use cases, are on - track to enable more rapid innovation and operating efficiency Maintaining our focus on accelerating profitable growth through our integrated framework led by the newly formed Growth Office • Further enhancing our go - to - market approach across the enterprise to strengthen large account management and expand new customer acquisition • Capitalizing on organic growth drivers across the business and integrating legacy acquisitions to capture revenue and cost synergiesRefer to the last slide for footnotes.
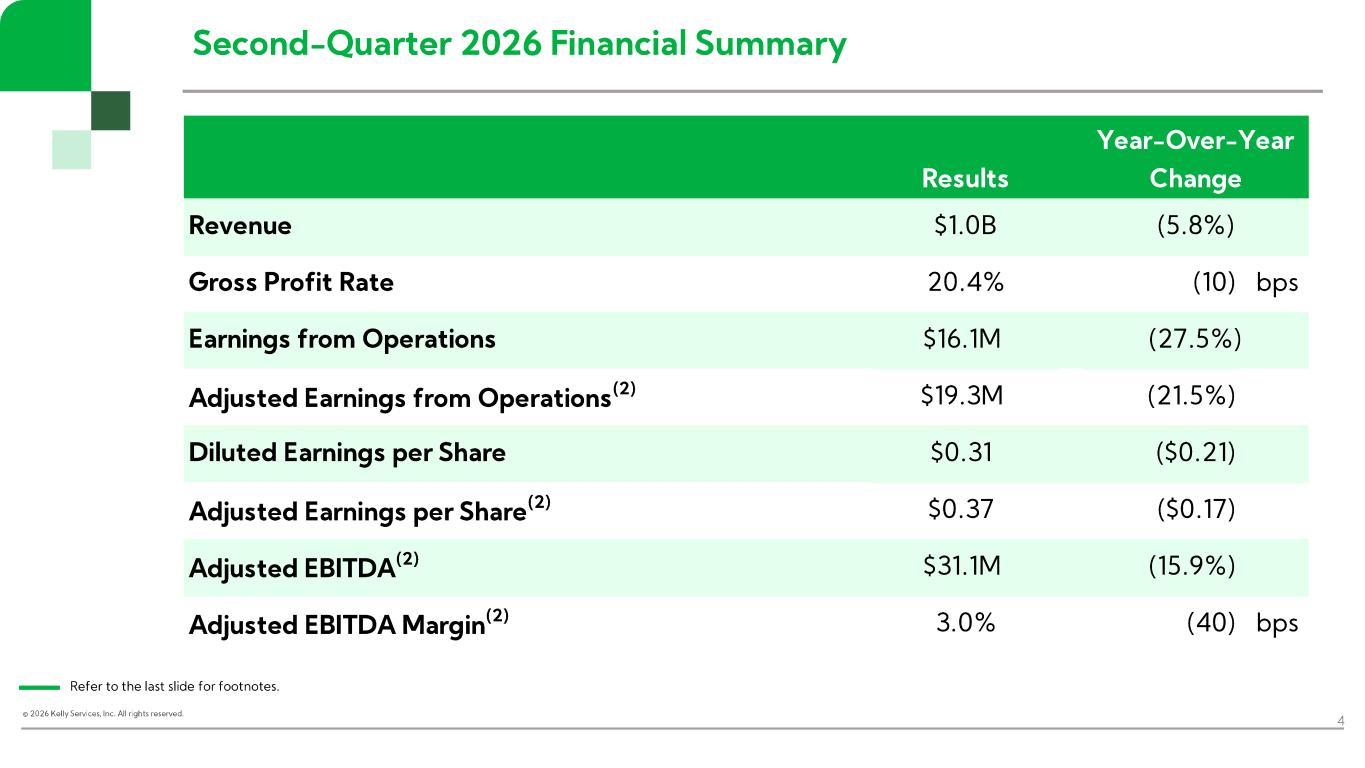
© 2026 Kelly Services, Inc. All rights reserved. Second - Quarter 2026 Financial Summary 4 Refer to the last slide for footnotes. Results Revenue $1.0B Gross Profit Rate 20.4% (10) bps Earnings from Operations $16.1M Adjusted Earnings from Operations (2) $19.3M (21.5%) Diluted Earnings per Share $0.31 ($0.21) Adjusted Earnings per Share (2) $0.37 ($0.17) Adjusted EBITDA (2) $31.1M (15.9%) Adjusted EBITDA Margin (2) 3.0% (40) bps Year-Over-Year Change (5.8%) (27.5%)
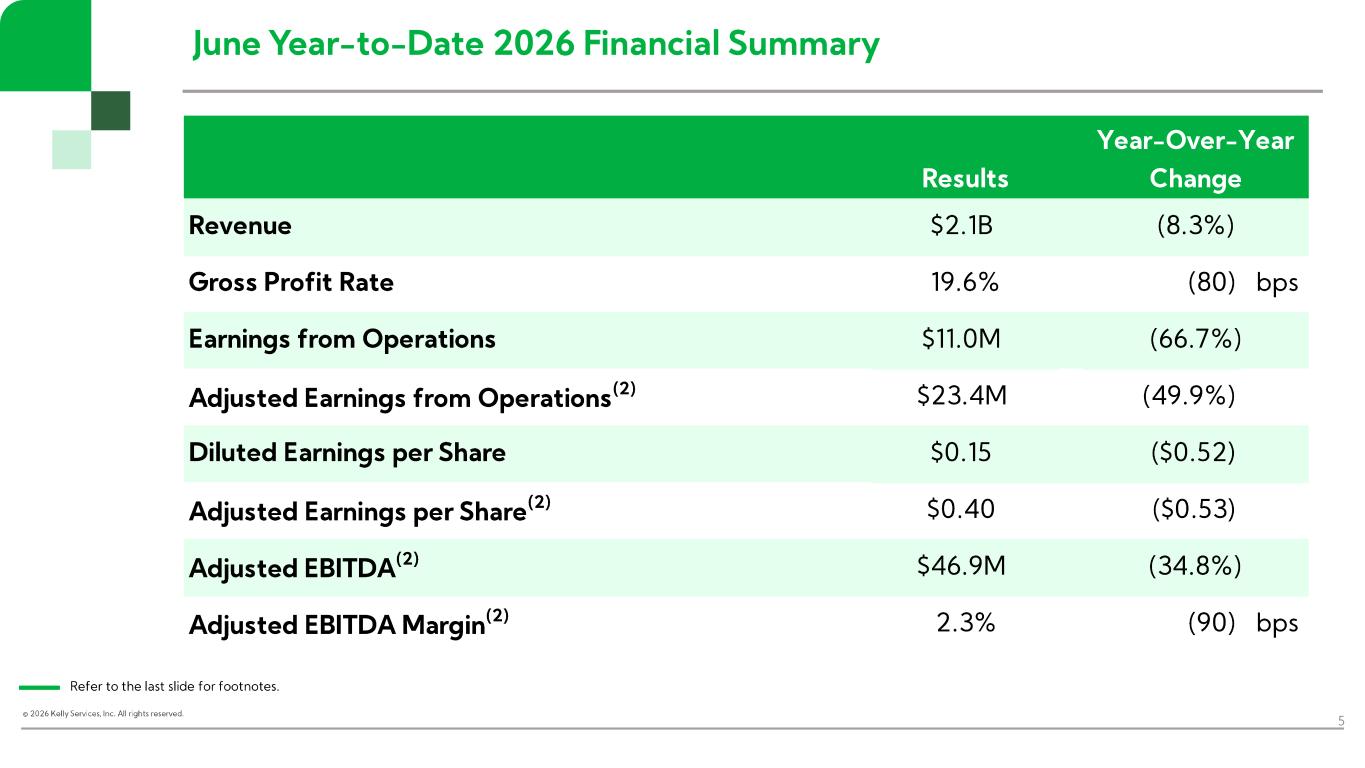
© 2026 Kelly Services, Inc. All rights reserved. June Year - to- Date 2026 Financial Summary 5 Refer to the last slide for footnotes. Results Revenue $2.1B Gross Profit Rate 19.6% (80) bps Earnings from Operations $11.0M Adjusted Earnings from Operations (2) $23.4M (49.9%) Diluted Earnings per Share $0.15 ($0.52) Adjusted Earnings per Share (2) $0.40 ($0.53) Adjusted EBITDA (2) $46.9M Adjusted EBITDA Margin (2) 2.3% (90) bps (34.8%) Year-Over-Year Change (8.3%) (66.7%)
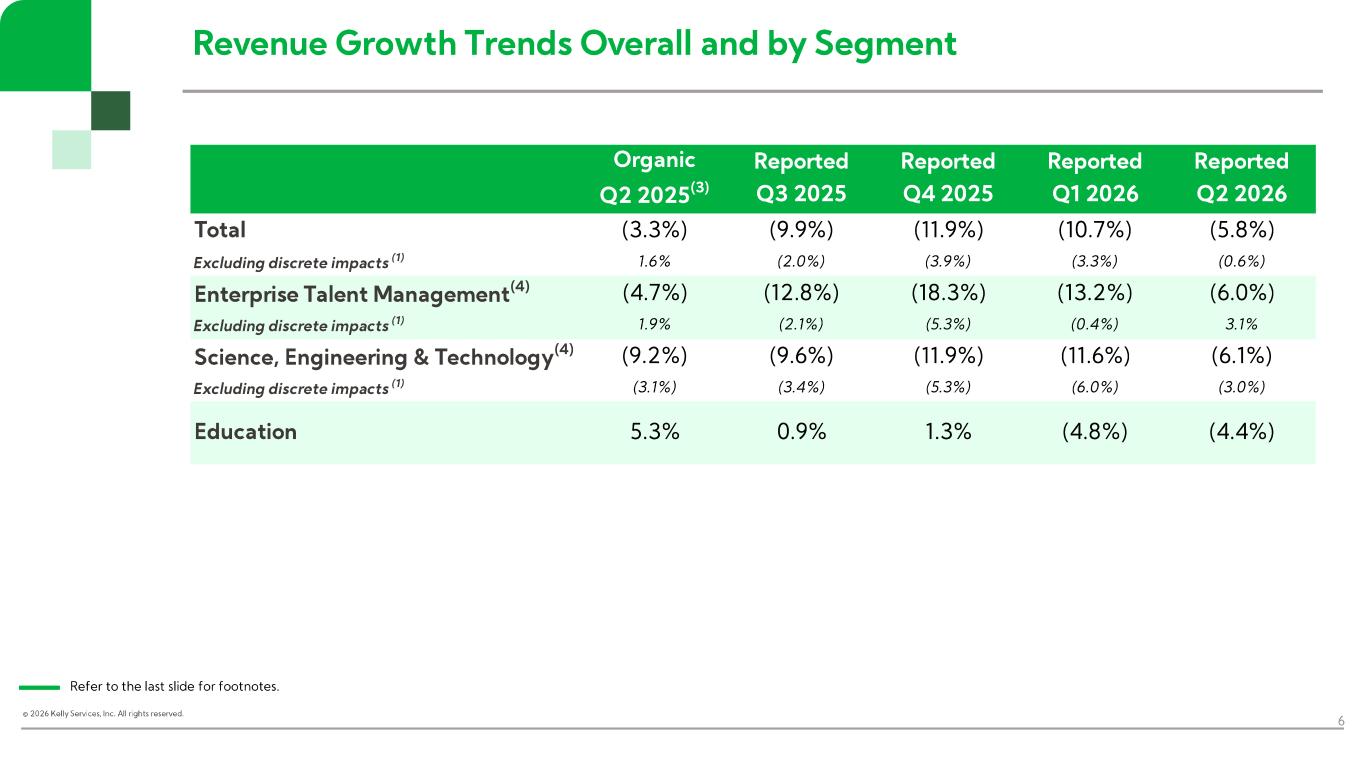
© 2026 Kelly Services, Inc. All rights reserved. Revenue Growth Trends Overall and by Segment 6 Refer to the last slide for footnotes. Organic Q2 2025 (3) Reported Q3 2025 Reported Q4 2025 Reported Q1 2026 Reported Q2 2026 Total (3.3%) (9.9%) (11.9%) (10.7%) (5.8%) Excluding discrete impacts (1) 1.6% (2.0%) (3.9%) (3.3%) (0.6%) Enterprise Talent Management (4) (4.7%) (12.8%) (18.3%) (13.2%) (6.0%) Excluding discrete impacts (1) 1.9% (2.1%) (5.3%) (0.4%) 3.1% Science, Engineering & Technology (4) (9.2%) (9.6%) (11.9%) (11.6%) (6.1%) Excluding discrete impacts (1) (3.1%) (3.4%) (5.3%) (6.0%) (3.0%) Education 5.3% 0.9% 1.3% (4.8%) (4.4%)
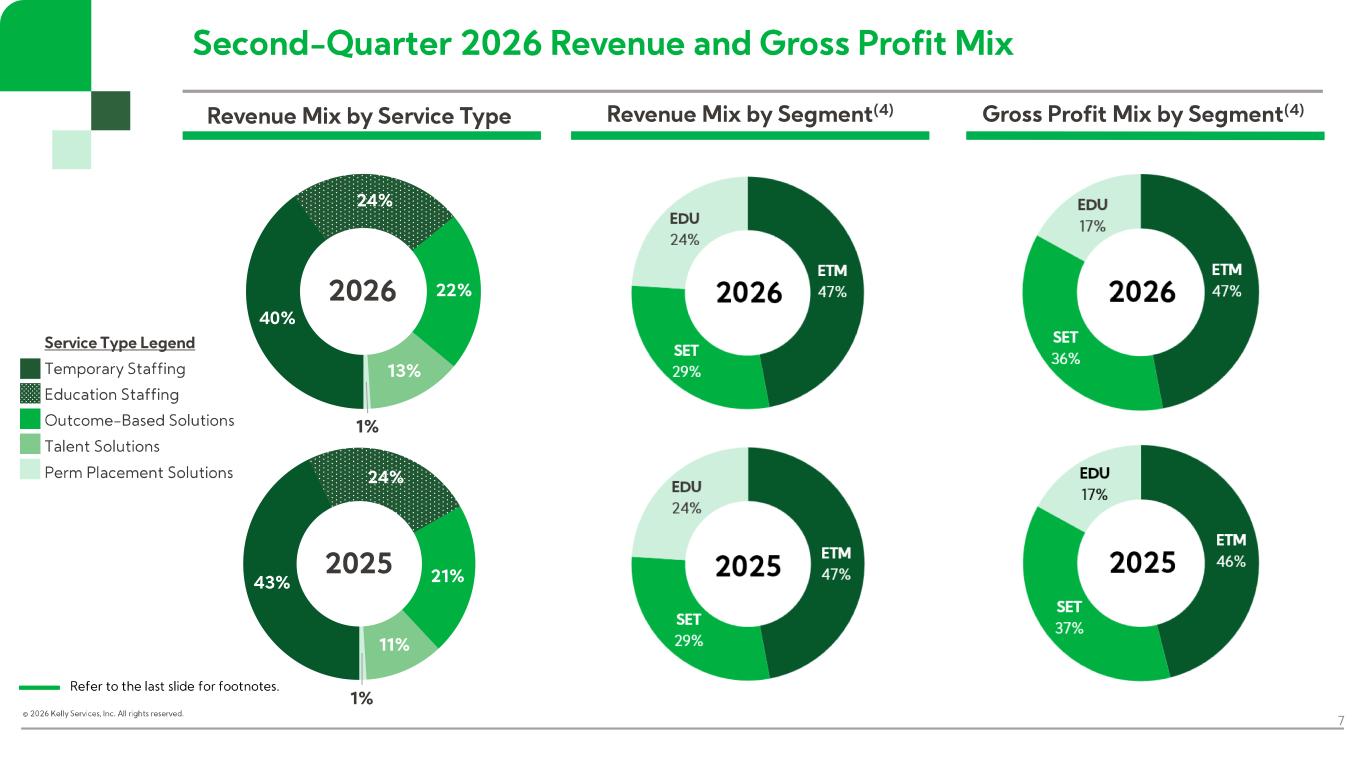
© 2026 Kelly Services, Inc. All rights reserved. 43% 24% 21% 11% 1% 2025 Second - Quarter 2026 Revenue and Gross Profit Mix 7 Revenue Mix by Service Type Gross Profit Mix by Segment (4) Refer to the last slide for footnotes. 40% 24% 22% 13% 1% 2026 Service Type Legend Temporary Staffing Education Staffing Outcome - Based Solutions Talent Solutions Perm Placement Solutions Revenue Mix by Segment (4)
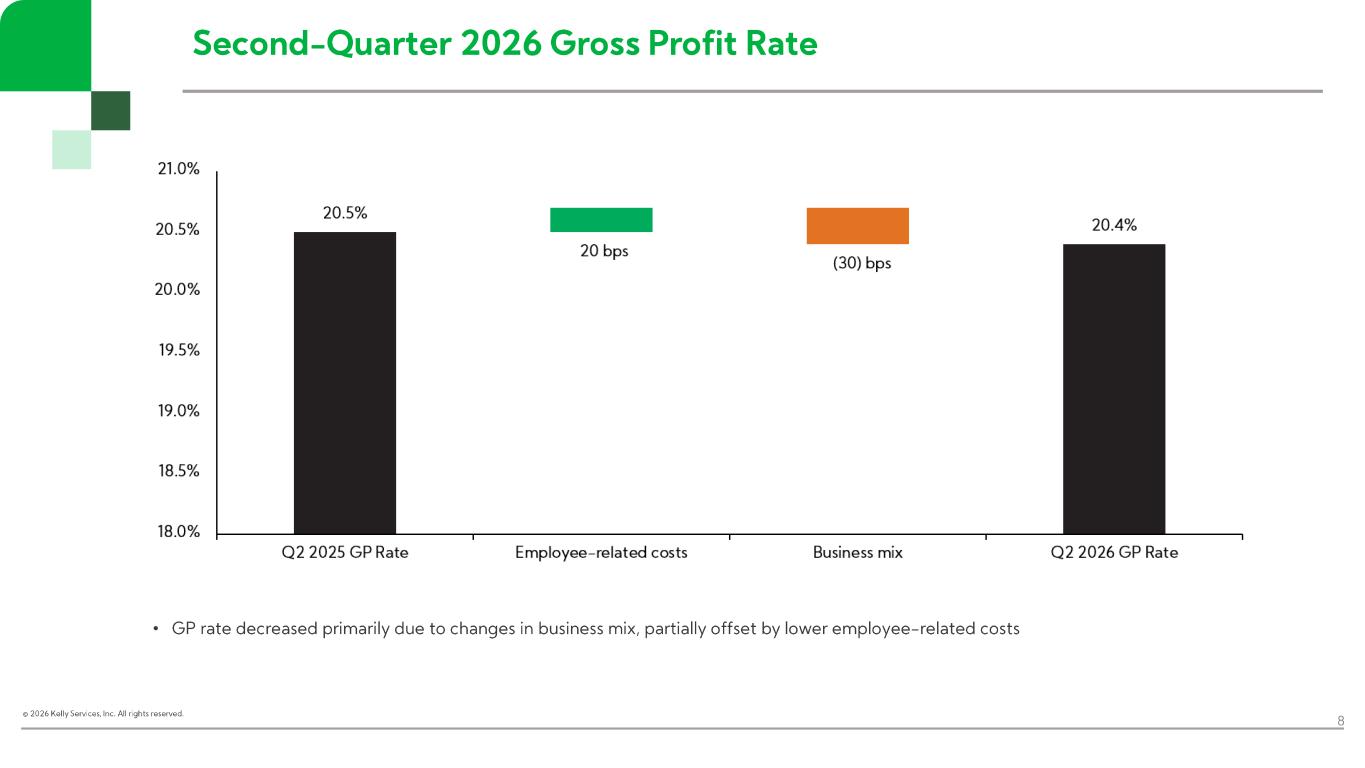
© 2026 Kelly Services, Inc. All rights reserved. Second - Quarter 2026 Gross Profit Rate 8 • GP rate decreased primarily due to changes in business mix, partially offset by lower employee - related costs
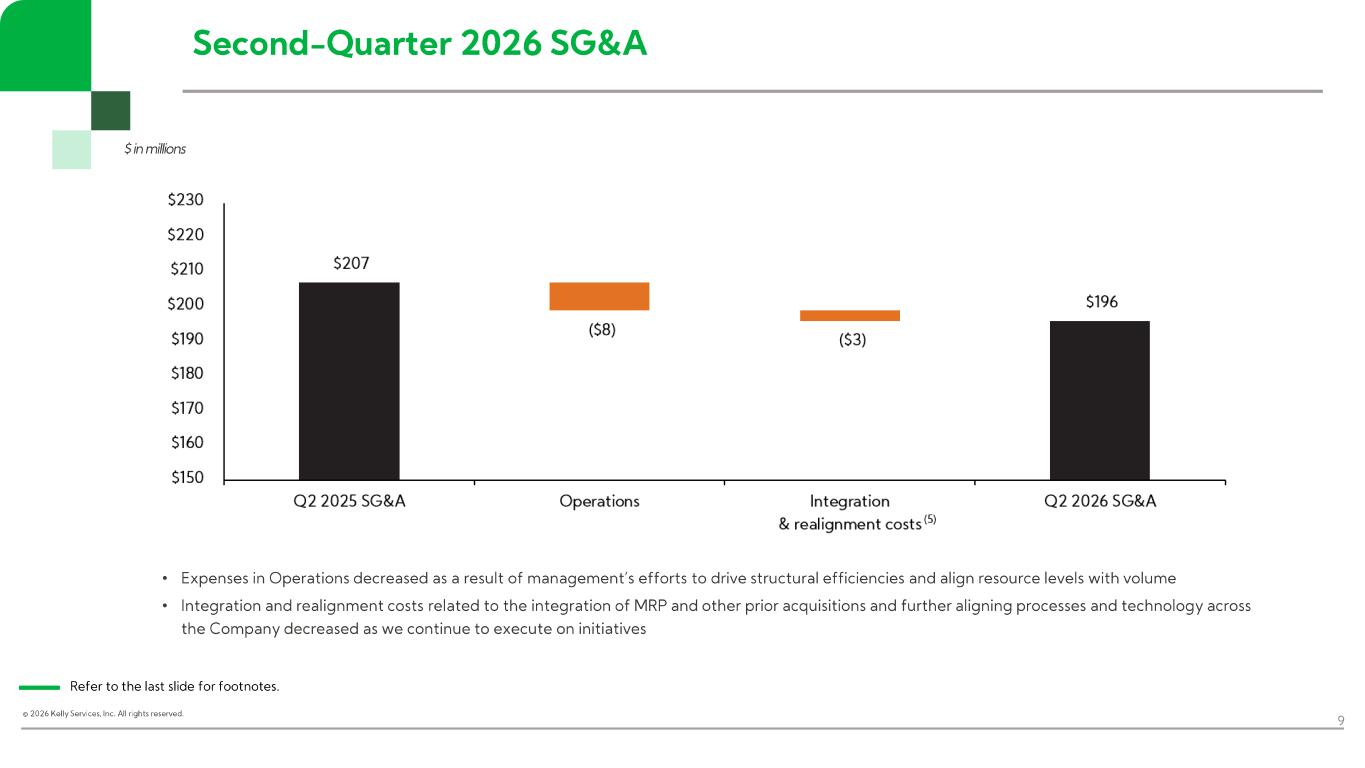
© 2026 Kelly Services, Inc. All rights reserved. 9 • Expenses in Operations decreased as a result of management’s efforts to drive structural efficiencies and align resource leve ls with volume • Integration and realignment costs related to the integration of MRP and other prior acquisitions and further aligning process es and technology across the Company decreased as we continue to execute on initiatives $ in millions Refer to the last slide for footnotes. Second - Quarter 2026 SG&A
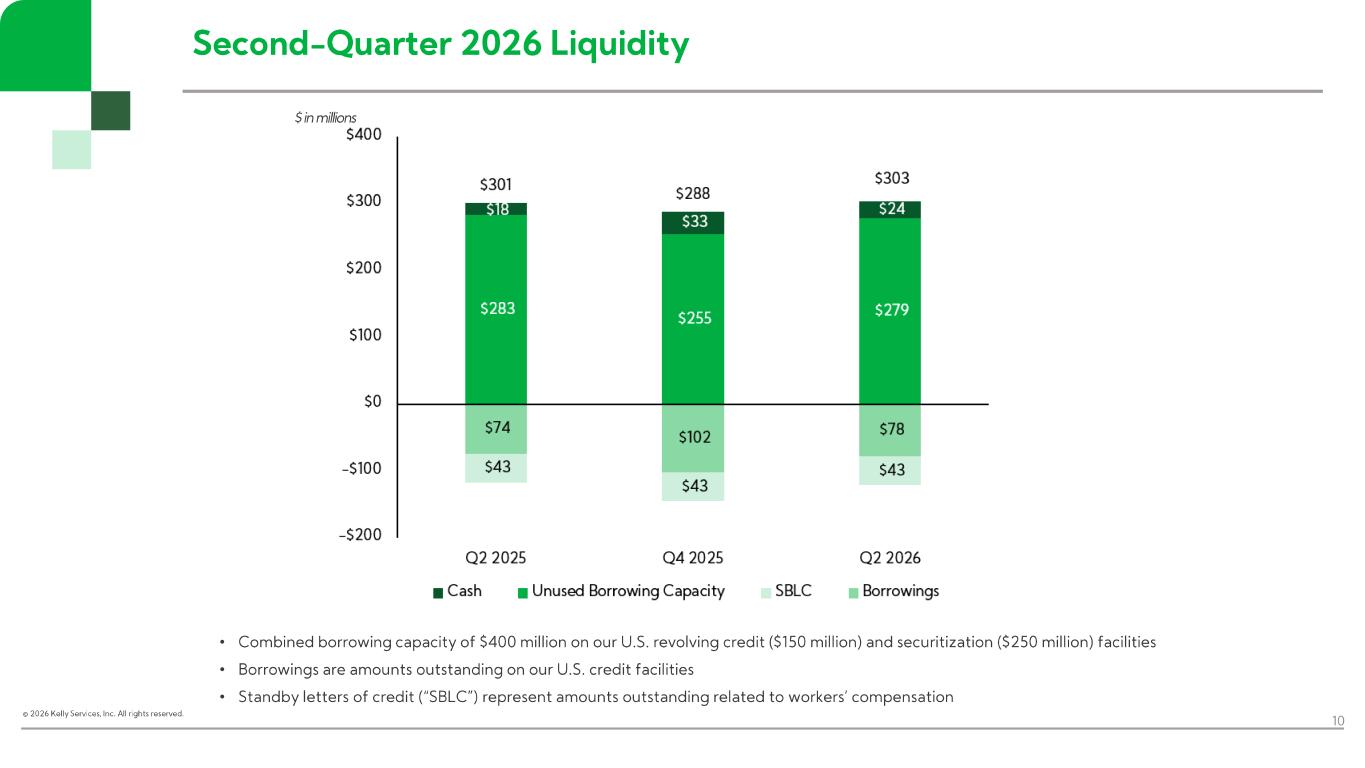
© 2026 Kelly Services, Inc. All rights reserved. Second - Quarter 2026 Liquidity 10 $ in millions • Combined borrowing capacity of $400 million on our U.S. revolving credit ($150 million) and securitization ($250 million) fac ilities • Borrowings are amounts outstanding on our U.S. credit facilities • Standby letters of credit (“SBLC”) represent amounts outstanding related to workers’ compensation
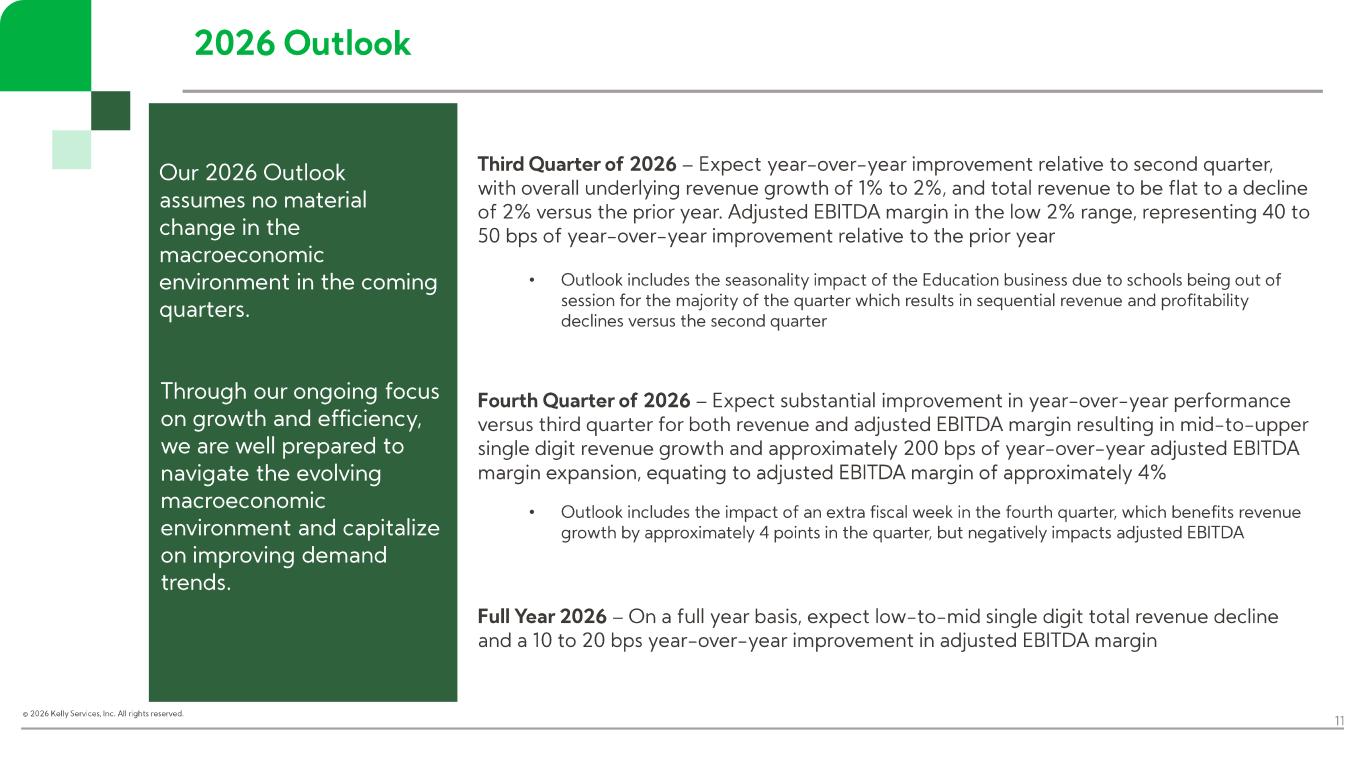
© 2026 Kelly Services, Inc. All rights reserved. 2026 Outlook 11 Our 2026 Outlook assumes no material change in the macroeconomic environment in the coming quarters. Through our ongoing focus on growth and efficiency, we are well prepared to navigate the evolving macroeconomic environment and capitalize on improving demand trends. Third Quarter of 2026 – Expect year - over - year improvement relative to second quarter, with overall underlying revenue growth of 1% to 2%, and total revenue to be flat to a decline of 2% versus the prior year. Adjusted EBITDA margin in the low 2% range, representing 40 to 50 bps of year - over - year improvement relative to the prior year • Outlook includes the seasonality impact of the Education business due to schools being out of session for the majority of the quarter which results in sequential revenue and profitability declines versus the second quarter Fourth Quarter of 2026 – Expect substantial improvement in year - over - year performance versus third quarter for both revenue and adjusted EBITDA margin resulting in mid - to- upper single digit revenue growth and approximately 200 bps of year - over - year adjusted EBITDA margin expansion, equating to adjusted EBITDA margin of approximately 4% • Outlook includes the impact of an extra fiscal week in the fourth quarter, which benefits revenue growth by approximately 4 points in the quarter, but negatively impacts adjusted EBITDA Full Year 2026 – On a full year basis, expect low - to- mid single digit total revenue decline and a 10 to 20 bps year - over - year improvement in adjusted EBITDA margin

© 2026 Kelly Services, Inc. All rights reserved. 12 Presentation Disclosures
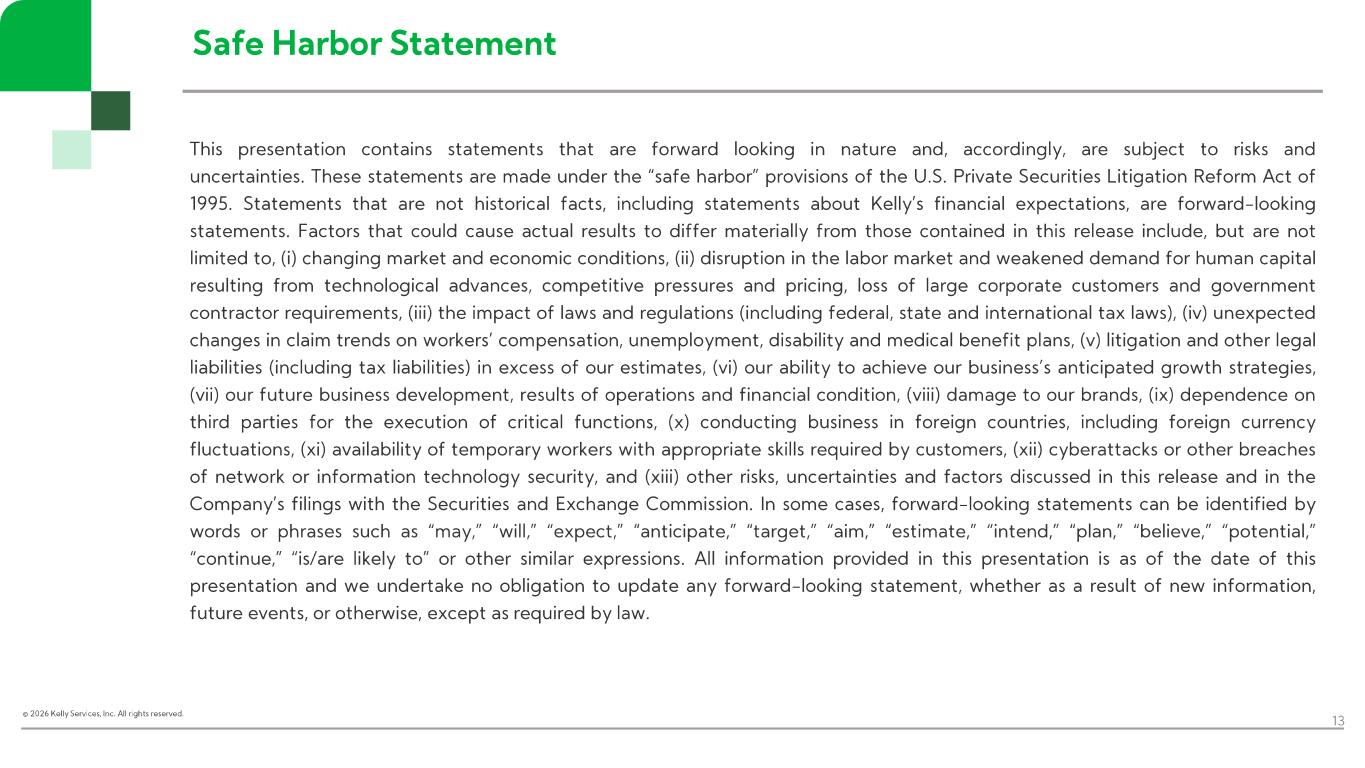
© 2026 Kelly Services, Inc. All rights reserved. 13 Safe Harbor Statement This presentation contains statements that are forward looking in nature and, accordingly, are subject to risks and uncertainties . These statements are made under the “safe harbor” provisions of the U.S . Private Securities Litigation Reform Act of 1995. Statements that are not historical facts, including statements about Kelly’s financial expectations, are forward - looking statements . Factors that could cause actual results to differ materially from those contained in this release include, but are not limited to, (i) changing market and economic conditions, (ii) disruption in the labor market and weakened demand for human capital resulting from technological advances, competitive pressures and pricing, loss of large corporate customers and government contractor requirements, (iii) the impact of laws and regulations (including federal, state and international tax laws), (iv) unexpected changes in claim trends on workers’ compensation, unemployment, disability and medical benefit plans, (v) litigation and other legal liabilities (including tax liabilities) in excess of our estimates, (vi) our ability to achieve our business’s anticipated growth strategies, (vii) our future business development, results of operations and financial condition, (viii) damage to our brands, (ix) dependence on third parties for the execution of critical functions, (x) conducting business in foreign countries, including foreign currency fluctuations, (xi) availability of temporary workers with appropriate skills required by customers, (xii) cyberattacks or other breaches of network or information technology security, and (xiii) other risks, uncertainties and factors discussed in this release and in the Company’s filings with the Securities and Exchange Commission . In some cases, forward - looking statements can be identified by words or phrases such as “may,” “will,” “expect,” “anticipate,” “target,” “aim,” “estimate,” “intend,” “plan,” “believe,” “potential,” “continue,” “is/are likely to” or other similar expressions . All information provided in this presentation is as of the date of this presentation and we undertake no obligation to update any forward - looking statement, whether as a result of new information, future events, or otherwise, except as required by law .
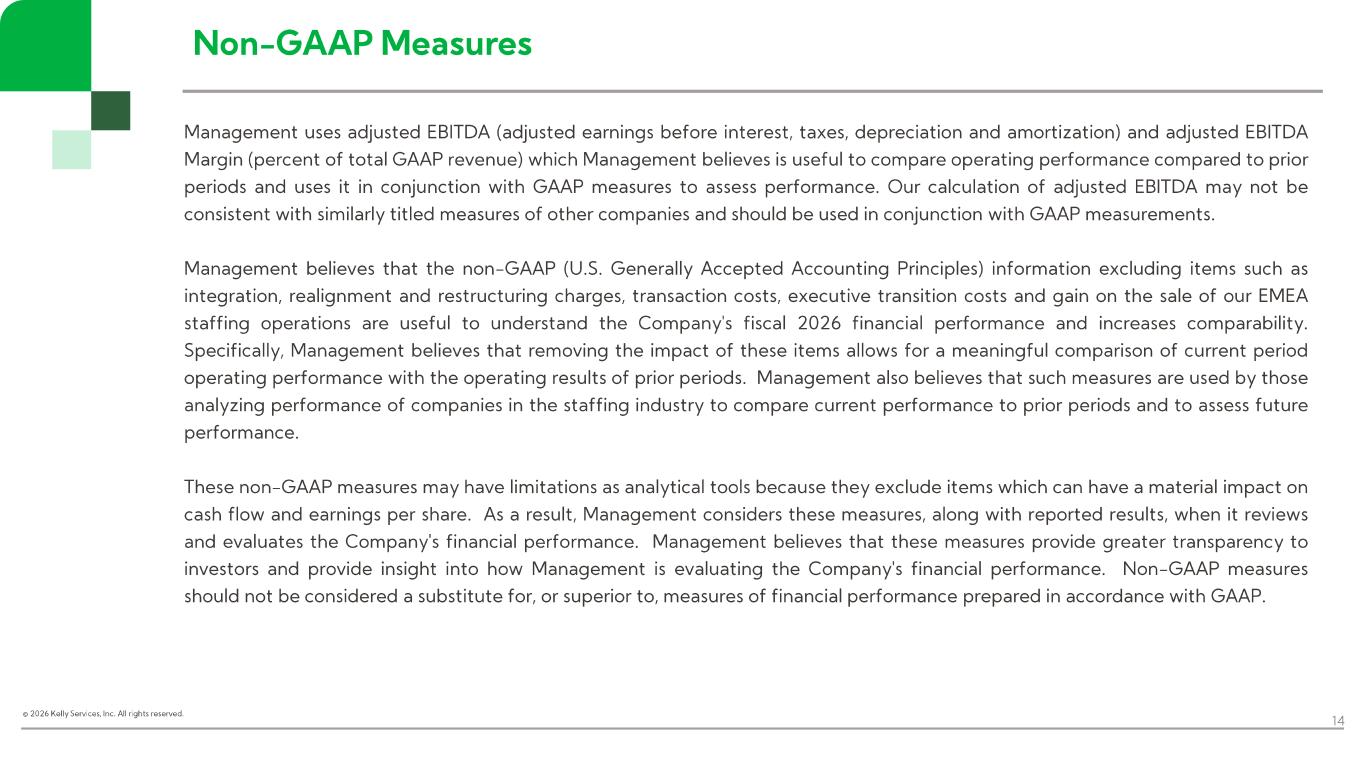
© 2026 Kelly Services, Inc. All rights reserved. 14 Non - GAAP Measures Management uses adjusted EBITDA (adjusted earnings before interest, taxes, depreciation and amortization) and adjusted EBITDA Margin (percent of total GAAP revenue) which Management believes is useful to compare operating performance compared to prior periods and uses it in conjunction with GAAP measures to assess performance . Our calculation of adjusted EBITDA may not be consistent with similarly titled measures of other companies and should be used in conjunction with GAAP measurements . Management believes that the non - GAAP (U .S . Generally Accepted Accounting Principles) information excluding items such as integration, realignment and restructuring charges, transaction costs, executive transition costs and gain on the sale of our EMEA staffing operations are useful to understand the Company's fiscal 2026 financial performance and increases comparability . Specifically, Management believes that removing the impact of these items allows for a meaningful comparison of current period operating performance with the operating results of prior periods . Management also believes that such measures are used by those analyzing performance of companies in the staffing industry to compare current performance to prior periods and to assess future performance . These non - GAAP measures may have limitations as analytical tools because they exclude items which can have a material impact on cash flow and earnings per share . As a result, Management considers these measures, along with reported results, when it reviews and evaluates the Company's financial performance . Management believes that these measures provide greater transparency to investors and provide insight into how Management is evaluating the Company's financial performance . Non - GAAP measures should not be considered a substitute for, or superior to, measures of financial performance prepared in accordance with GAAP .

© 2026 Kelly Services, Inc. All rights reserved. 15 Appendix
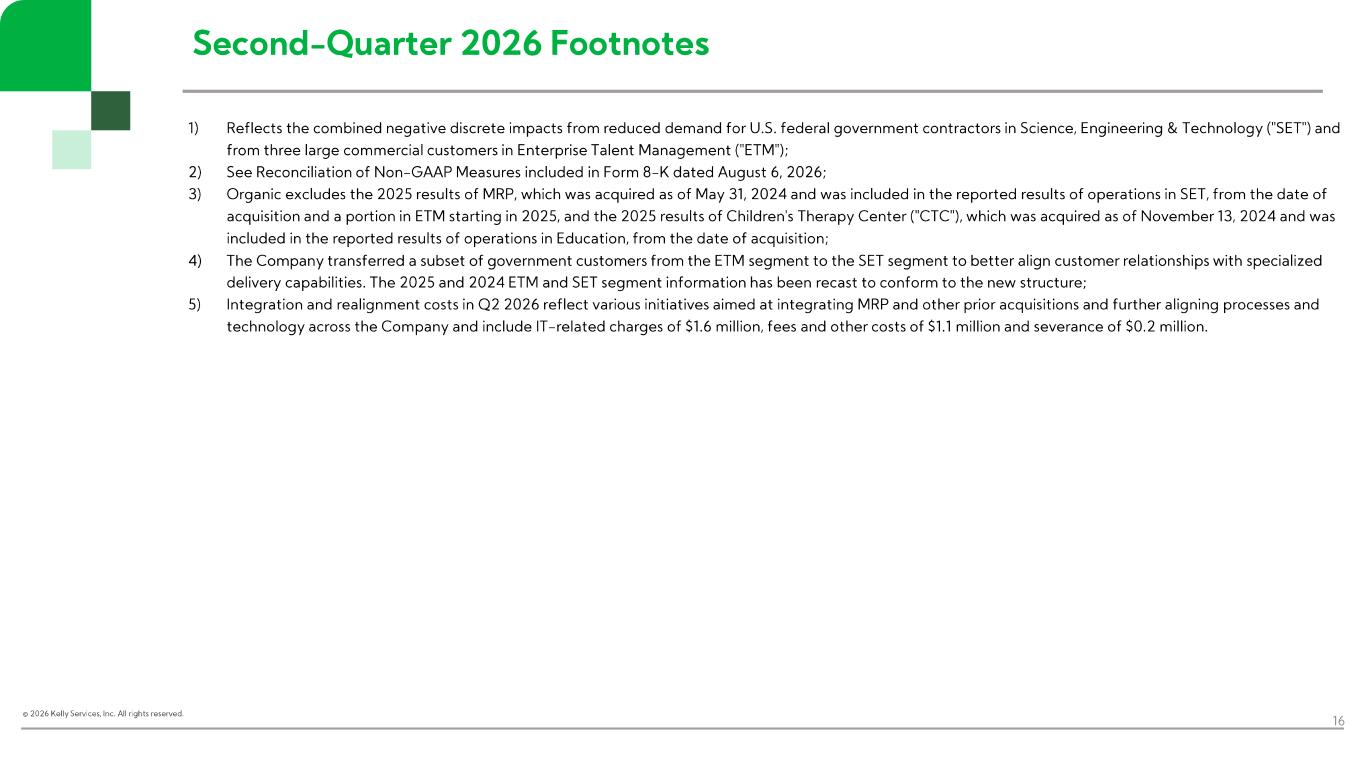
© 2026 Kelly Services, Inc. All rights reserved. Second - Quarter 2026 Footnotes 16 1) Reflects the combined negative discrete impacts from reduced demand for U.S. federal government contractors in Science, Engin eer ing & Technology ("SET") and from three large commercial customers in Enterprise Talent Management ("ETM"); 2) See Reconciliation of Non - GAAP Measures included in Form 8 - K dated August 6, 2026; 3) Organic excludes the 2025 results of MRP, which was acquired as of May 31, 2024 and was included in the reported results of o per ations in SET, from the date of acquisition and a portion in ETM starting in 2025, and the 2025 results of Children's Therapy Center ("CTC"), which was acqui red as of November 13, 2024 and was included in the reported results of operations in Education, from the date of acquisition; 4) The Company transferred a subset of government customers from the ETM segment to the SET segment to better align customer rel ati onships with specialized delivery capabilities. The 2025 and 2024 ETM and SET segment information has been recast to conform to the new structure; 5) Integration and realignment costs in Q2 2026 reflect various initiatives aimed at integrating MRP and other prior acquisition s and further aligning processes and technology across the Company and include IT - related charges of $1.6 million, fees and other costs of $1.1 million and severance of $0.2 million.