Exhibit 99.1
A u g u s t 2 0 2 6 Find, mine and deliver the planet's most important and essential minerals that enable the world and humankind to create, innovate, and prosper. Second Quarter 2026 Presentation of Financial Results August 6, 2026
2 Forward - Looking Information This presentation contains “forward - looking information” and “forward - looking statements”, as defined in applicable securities laws (collectively, “forward - looking statements”) including the Private Securities Litigation Reform Act of 1995 which include, but are not limited to, statements with respect to the activities, events or developments that we expect or anticipate will or may occur in the future, including our guidance and targets . Known and unknown risks, uncertainties and other factors, many of which are beyond our ability to predict or control, could cause actual results to differ materially from those contained in the forward - looking statements . Non - IFRS Financial Measures Set out below are reconciliations for certain non - GAAP financial measures (including non - GAAP ratios) utilized by the Company in this Earnings Release : Adjusted EBITDA ; Adjusted net Income, cash operating costs per gold equivalent ounce sold ; AISCs ; Net Debt ; and Adjusted EBITDA Margin, which are non - GAAP financial measures . These non - GAAP measures do not have any standardized meaning within IFRS and therefore may not be comparable to similar measures presented by other companies . The Company believes that these measures provide investors with additional information which is useful in evaluating the Company’s performance and should not be considered in isolation or as a substitute for measures of performance prepared in accordance with IFRS . Technical Information The technical information in this presentation has been approved and verified by Farshid Ghazanfari, P . Geo . , who is the Qualified Person as that term is defined under NI 43 - 101 and S - K 1300 for Aura . Readers are further cautioned that mineral resources that are not mineral reserves do not have demonstrated economic viability . All technical information relating to Aura’s properties and the Company’s mineral reserves and resources is available on SEDAR at www . sedar . com and EDGAR on www . sec . gov . Readers are also advised to refer to the latest annual information form and technical reports of the Company as well as other continuous disclosure documents filed by the Company available at www . sedar . com and www . sec . gov .
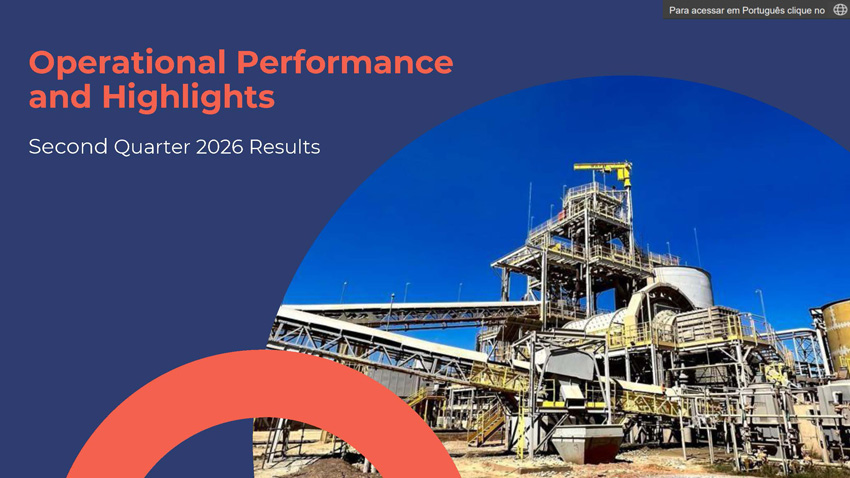
Second Quarter 2026 Results Operational Performance and Highlights
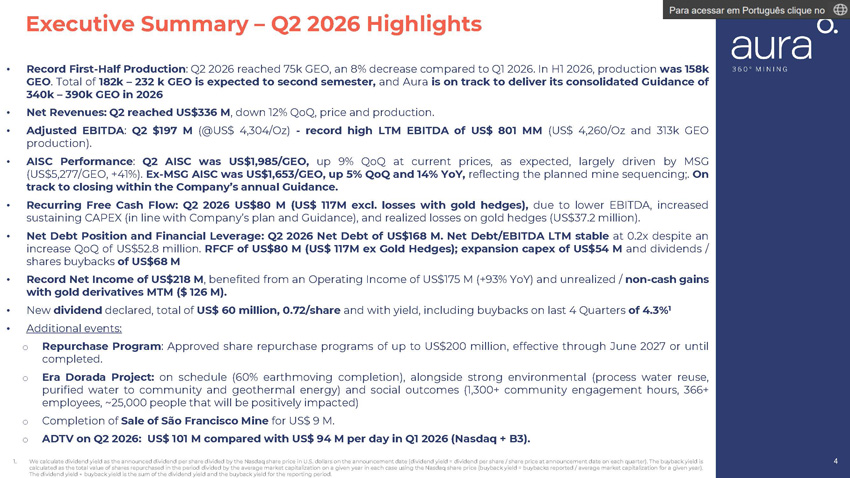
NASDAQ: AUGO | B3:AURA33 www.auraminerals.com Executive Summary – Q2 2026 Highlights 4 • Record First - Half Production : Q 2 2026 reached 75 k GEO, an 8 % decrease compared to Q 1 2026 . In H 1 2026 , production was 158 k GEO . Total of 182 k – 232 k GEO is expected to second semester, and Aura is on track to deliver its consolidated Guidance of 340 k – 390 k GEO in 2026 • Net Revenues: Q2 reached US$336 M , down 12% QoQ, price and production. • Adjusted EBITDA : Q2 $197 M (@US$ 4,304/Oz) - record high LTM EBITDA of US$ 801 MM (US$ 4,260/Oz and 313k GEO production). • AISC Performance : Q 2 AISC was US $ 1 , 985 /GEO, up 9 % QoQ at current prices, as expected, largely driven by MSG (US $ 5 , 277 /GEO, + 41 % ) . Ex - MSG AISC was US $ 1 , 653 /GEO, up 5 % QoQ and 14 % YoY, reflecting the planned mine sequencing ;. On track to closing within the Company’s annual Guidance . • Recurring Free Cash Flow : Q 2 2026 US $ 80 M (US $ 117 M excl . losses with gold hedges), due to lower EBITDA, increased sustaining CAPEX (in line with Company’s plan and Guidance), and realized losses on gold hedges (US $ 37 . 2 million) . • Net Debt Position and Financial Leverage : Q 2 2026 Net Debt of US $ 168 M . Net Debt/EBITDA LTM stable at 0 . 2 x despite an increase QoQ of US $ 52 . 8 million . RFCF of US $ 80 M (US $ 117 M ex Gold Hedges) ; expansion capex of US $ 54 M and dividends / shares buybacks of US $ 68 M • Record Net Income of US $ 218 M , benefited from an Operating Income of US $ 175 M (+ 93 % YoY) and unrealized / non - cash gains with gold derivatives MTM ( $ 126 M) . • New dividend declared, total of US$ 60 million, 0.72/share and with yield, including buybacks on last 4 Quarters of 4.3% 1 • Additional events: o Repurchase Program : Approved share repurchase programs of up to US$200 million, effective through June 2027 or until completed. o Era Dorada Project : on schedule ( 60 % earthmoving completion), alongside strong environmental (process water reuse, purified water to community and geothermal energy) and social outcomes ( 1 , 300 + community engagement hours, 366 + employees, ~ 25 , 000 people that will be positively impacted) o Completion of Sale of São Francisco Mine for US$ 9 M. o ADTV on Q2 2026: US$ 101 M compared with US$ 94 M per day in Q1 2026 (Nasdaq + B3). 1. We calculate dividend yield as the announced dividend per share divided by the Nasdaq share price in U . S . dollars on the announcement date (dividend yield = dividend per share / share price at announcement date on each quarter) . The buyback yield is calculated as the total value o f shares repurchased in the period divided by the average market capitalization on a given year in each case using the Nasdaq share price (buyback yield = buybacks reported / average market capitalization for a given year) . The dividend yield + buyback yield is the sum o f the dividend yield and the buyback yield for the reporting period .
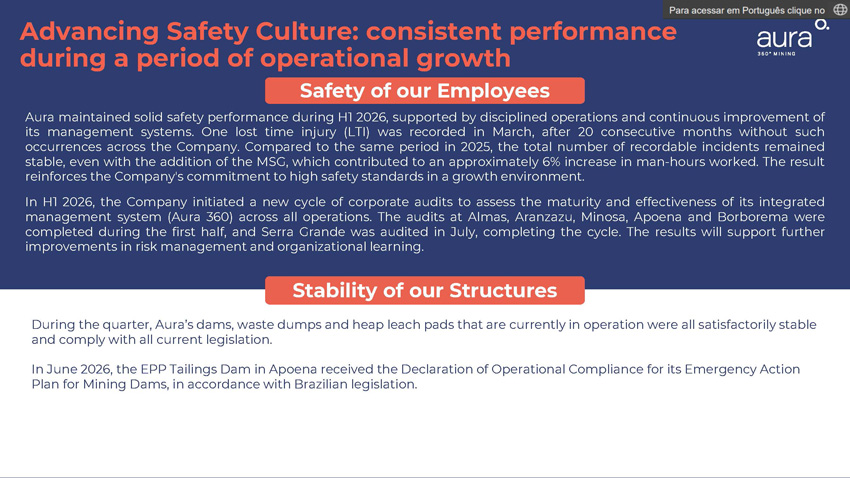
Advancing Safety Culture: consistent performance during a period of operational growth Stability of our Structures Safety of our Employees Aura maintained solid safety performance during H 1 2026 , supported by disciplined operations and continuous improvement of its management systems . One lost time injury (LTI) was recorded in March, after 20 consecutive months without such occurrences across the Company . Compared to the same period in 2025 , the total number of recordable incidents remained stable, even with the addition of the MSG, which contributed to an approximately 6 % increase in man - hours worked . The result reinforces the Company's commitment to high safety standards in a growth environment . In H 1 2026 , the Company initiated a new cycle of corporate audits to assess the maturity and effectiveness of its integrated management system (Aura 360 ) across all operations . The audits at Almas, Aranzazu, Minosa, Apoena and Borborema were completed during the first half, and Serra Grande was audited in July, completing the cycle . The results will support further improvements in risk management and organizational learning . During the quarter, Aura’s dams, waste dumps and heap leach pads that are currently in operation were all satisfactorily stable and comply with all current legislation. In June 2026, the EPP Tailings Dam in Apoena received the Declaration of Operational Compliance for its Emergency Action Plan for Mining Dams, in accordance with Brazilian legislation.
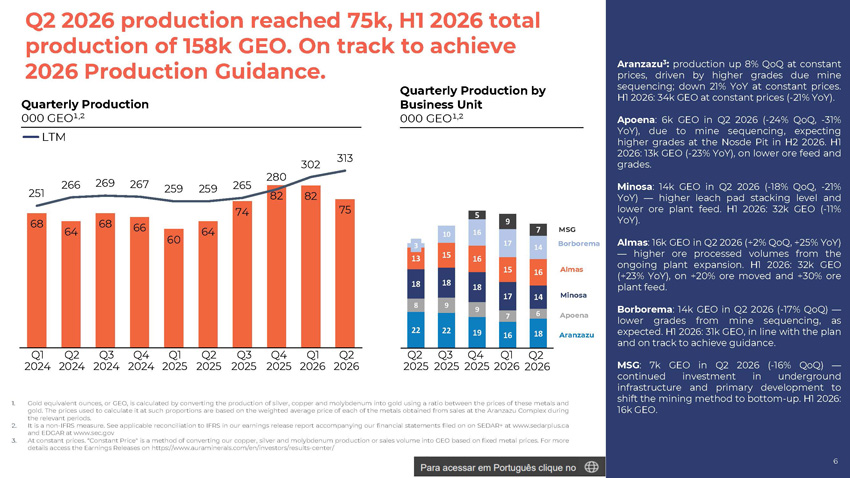
NASDAQ: AUGO | B3:AURA33 www.auraminerals.com Q2 2026 production reached 75k, H1 2026 total production of 158k GEO. On track to achieve 2026 Production Guidance. 6 Quarterly Production 000 GEO¹ , ² Quarterly Production by Business Unit 000 GEO¹ , ² LTM 1. Gold equivalent ounces, or GEO, is calculated by converting the production of silver, copper and molybdenum into gold using a ratio between the prices of these metals and gold . The prices used to calculate it at such proportions are based on the weighted average price of each of the metals obtained from sales at the Aranzazu Complex during the relevant periods . 2. It is a non - IFRS measure . See applicable reconciliation to IFRS in our earnings release report accompanying our financial statements filed on on SEDAR+ at www . sedarplus . ca and EDGAR at www . sec . gov 3. At constant prices . “Constant Price" is a method of converting our copper, silver and molybdenum production or sales volume into GEO based on fixed metal prices . For more details access the Earnings Releases on https : //www . auraminerals . com/en/investors/results - center/ Aranzazu 3 : production up 8 % QoQ at constant prices, driven by higher grades due mine sequencing ; down 21 % YoY at constant prices . H 1 2026 : 34 k GEO at constant prices ( - 21 % YoY) . Apoena : 6 k GEO in Q 2 2026 ( - 24 % QoQ, - 31 % YoY), due to mine sequencing, expecting higher grades at the Nosde Pit in H 2 2026 . H 1 2026 : 13 k GEO ( - 23 % YoY), on lower ore feed and grades . Minosa : 14 k GEO in Q 2 2026 ( - 18 % QoQ, - 21 % YoY) — higher leach pad stacking level and lower ore plant feed . H 1 2026 : 32 k GEO ( - 11 % YoY) . Almas : 16 k GEO in Q 2 2026 (+ 2 % QoQ, + 25 % YoY) — higher ore processed volumes from the ongoing plant expansion . H 1 2026 : 32 k GEO (+ 23 % YoY), on + 20 % ore moved and + 30 % ore plant feed . Borborema : 14 k GEO in Q 2 2026 ( - 17 % QoQ) — lower grades from mine sequencing, as expected . H 1 2026 : 31 k GEO, in line with the plan and on track to achieve guidance . MSG : 7 k GEO in Q 2 2026 ( - 16 % QoQ) — continued investment in underground infrastructure and primary development to shift the mining method to bottom - up . H 1 2026 : 16 k GEO . 68 64 68 66 60 64 74 82 82 75 251 266 269 267 259 259 265 280 302 313 MSG Borborema 22 22 19 8 9 9 18 18 18 13 15 16 Almas 16 15 Minosa 14 17 Apoena 6 7 Aranzazu 18 16 3 10 16 17 14 5 9 7 Q2 Q3 Q4 Q1 Q2 2025 2025 2025 2026 2026 Q1 Q2 Q3 Q4 Q1 Q2 Q3 Q4 Q1 Q2 2024 2024 2024 2024 2025 2025 2025 2025 2026 2026
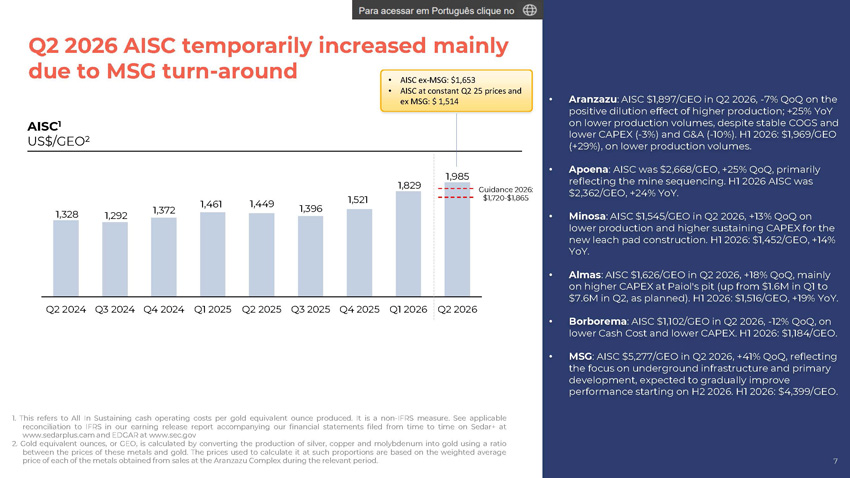
NASDAQ: AUGO | B3:AURA33 www.auraminerals.com Q2 2026 AISC temporarily increased mainly due to MSG turn - around 7 AISC 1 US$/GEO 2 • Aranzazu : AISC $1,897/GEO in Q2 2026, - 7% QoQ on the positive dilution effect of higher production; +25% YoY on lower production volumes, despite stable COGS and lower CAPEX ( - 3%) and G&A ( - 10%). H1 2026: $1,969/GEO (+29%), on lower production volumes. • Apoena : AISC was $2,668/GEO, +25% QoQ, primarily reflecting the mine sequencing. H1 2026 AISC was $2,362/GEO, +24% YoY. • Minosa : AISC $1,545/GEO in Q2 2026, +13% QoQ on lower production and higher sustaining CAPEX for the new leach pad construction. H1 2026: $1,452/GEO, +14% YoY. • Almas : AISC $1,626/GEO in Q2 2026, +18% QoQ, mainly on higher CAPEX at Paiol's pit (up from $1.6M in Q1 to $7.6M in Q2, as planned). H1 2026: $1,516/GEO, +19% YoY. • Borborema : AISC $1,102/GEO in Q2 2026, - 12% QoQ, on lower Cash Cost and lower CAPEX. H1 2026: $1,184/GEO. • MSG : AISC $5,277/GEO in Q2 2026, +41% QoQ, reflecting the focus on underground infrastructure and primary development, expected to gradually improve performance starting on H2 2026. H1 2026: $4,399/GEO. 1. This refers to All In Sustaining cash operating costs per gold equivalent ounce produced . It is a non - IFRS measure . See applicable reconciliation to IFRS in our earning release report accompanying our financial statements filed from time to time on Sedar+ at www . sedarplus . cam and EDGAR at www . sec . gov 2. Gold equivalent ounces, or GEO, is calculated by converting the production of silver, copper and molybdenum into gold using a ratio between the prices of these metals and gold . The prices used to calculate it at such proportions are based on the weighted average price of each of the metals obtained from sales at the Aranzazu Complex during the relevant period . 1,328 1,292 1,372 1,461 1,449 1,396 1,521 1,829 1,985 Q2 2024 Q3 2024 Q4 2024 Q1 2025 Q2 2025 Q3 2025 Q4 2025 Q1 2026 Q2 2026 • AISC ex - MSG: $1,653 • AISC at constant Q2 25 prices and ex MSG: $ 1,514 Guidance 2026: $1,720 - $1,865
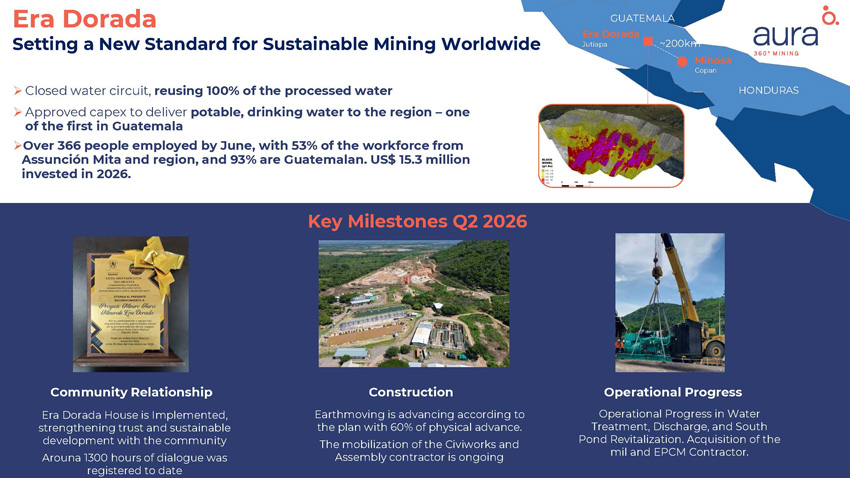
HONDURAS GUATEMALA Era Dorada Jutiapa ~200km Minosa Copan » Closed water circuit, reusing 100% of the processed water » Approved capex to deliver potable, drinking water to the region – one of the first in Guatemala » Over 366 people employed by June, with 53% of the workforce from Assunción Mita and region, and 93% are Guatemalan. US$ 15.3 million invested in 2026. Era Dorada Setting a New Standard for Sustainable Mining Worldwide Key Milestones Q2 2026 Community Relationship Era Dorada House is Implemented, strengthening trust and sustainable development with the community Arouna 1300 hours of dialogue was registered to date Construction Earthmoving is advancing according to the plan with 60% of physical advance. The mobilization of the Civiworks and Assembly contractor is ongoing Operational Progress Operational Progress in Water Treatment, Discharge, and South Pond Revitalization. Acquisition of the mil and EPCM Contractor.
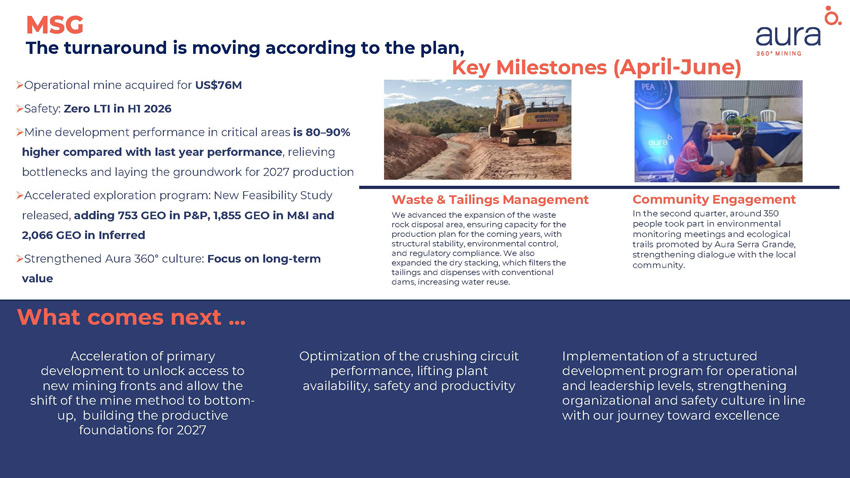
» Operational mine acquired for US$76M » Safety: Zero LTI in H1 2026 » Mine development performance in critical areas is 80 – 90% higher compared with last year performance , relieving bottlenecks and laying the groundwork for 2027 production » Accelerated exploration program : New Feasibility Study released, adding 753 GEO in P&P, 1 , 855 GEO in M&I and 2 , 066 GEO in Inferred » Strengthened Aura 360 ƒ culture : Focus on long - term value MSG The turnaround is moving according to the plan, Key Milestones ( April - June ) Waste & Tailings Management We advanced the expansion of the waste rock disposal area, ensuring capacity for the production plan for the coming years, with structural stability, environmental control, and regulatory compliance. We also expanded the dry stacking, which filters the tailings and dispenses with conventional dams, increasing water reuse. Community Engagement In the second quarter, around 350 people took part in environmental monitoring meetings and ecological trails promoted by Aura Serra Grande, strengthening dialogue with the local community. What comes next ... Acceleration of primary development to unlock access to new mining fronts and allow the shift of the mine method to bottom - up, building the productive foundations for 2027 Optimization of the crushing circuit performance, lifting plant availability, safety and productivity Implementation of a structured development program for operational and leadership levels, strengthening organizational and safety culture in line with our journey toward excellence
Second Quarter 2026 Results Financial Results
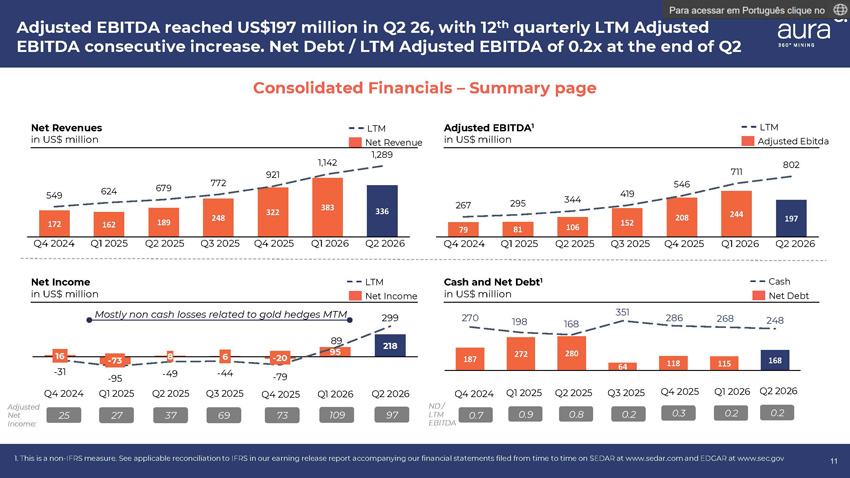
11 Adjusted EBITDA reached US$197 million in Q2 26, with 12 th quarterly LTM Adjusted EBITDA consecutive increase. Net Debt / LTM Adjusted EBITDA of 0.2x at the end of Q2 1. This is a non - IFRS measure. See applicable reconciliation to IFRS in our earning release report accompanying our financial statements filed from time to time on SEDAR at www.sedar.com and EDGAR at www.sec.gov Consolidated Financials – Summary page Net Revenues in US$ million Adjusted EBITDA 1 in US$ million Net Income Cash and Net Debt 1 in US$ million LTM Adjusted Ebitda LTM in US$ million Net Income Cash Net Debt LTM Net Revenue Adjusted Net Income: 25 Mostly non cash losses related to gold hedges MTM ND / LTM EBITDA 0.7 27 Q4 2024 Q1 2025 16 - 73 8 6 - 20 95 218 - 31 89 299 Q4 2024 - 95 Q1 2025 187 272 280 64 118 115 168 270 198 168 351 286 268 248 Q4 2024 Q2 2025 0.8 Q2 2025 37 - 49 Q2 2025 Q1 2025 0.9 Q3 2025 172 162 189 248 322 383 336 549 624 679 772 921 1,142 1,289 79 81 106 152 208 244 197 267 295 344 419 546 711 802 Q3 2025 0.2 69 - 44 Q3 2025 Q4 2025 0.3 Q4 2025 - 79 Q4 2025 73 Q1 2026 Q1 2026 109 0.2 Q1 2026 Q2 2026 Q4 2024 Q1 2025 Q2 2025 Q3 2025 Q4 2025 Q1 2026 Q2 2026 Q2 2026 97 0.2 Q2 2026
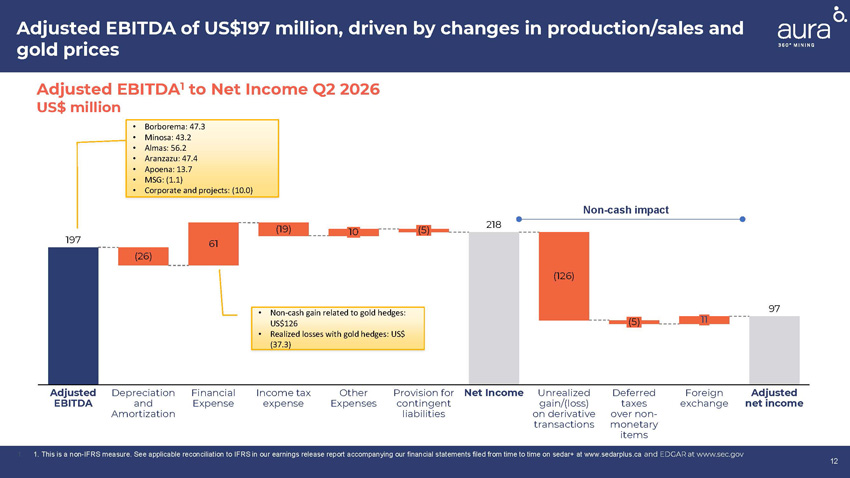
12 Adjusted EBITDA of US$197 million, driven by changes in production/sales and gold prices 1. 1. This is a non - IFRS measure. See applicable reconciliation to IFRS in our earnings release report accompanying our financial statements filed from time to time on sedar+ at www.sedarplus.ca and EDGAR at www.sec.gov Adjusted EBITDA 1 to Net Income Q2 2026 US$ million • Borborema: 47.3 • Minosa: 43.2 • Almas: 56.2 • Aranzazu: 47.4 • Apoena: 13.7 • MSG: (1.1) • Corporate and projects: (10.0) • Non - cash gain related to gold hedges: US$126 • Realized losses with gold hedges: US$ (37.3) (5) 11 (26) 61 (19) 10 197 218 97 (126) (5) Adjusted Foreign Deferred Unrealized Net Income Provision for Other Income tax Financial Depreciation Adjusted net income exchange taxes gain/(loss) contingent Expenses expense Expense and EBITDA over non - on derivative liabilities Amortization monetary transactions items Non - cash impact
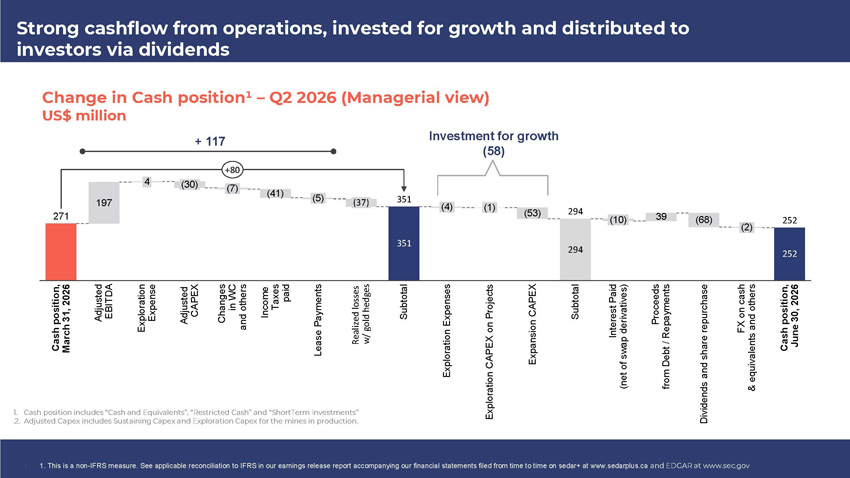
Strong cashflow from operations, invested for growth and distributed to investors via dividends 1. Cash position includes “Cash and Equivalents”, “Restricted Cash” and “ShortTerm Investments” .2. Adjusted Capex includes Sustaining Capex and Exploration Capex for the mines in production. 1. 1. This is a non - IFRS measure. See applicable reconciliation to IFRS in our earnings release report accompanying our financial statements filed from time to time on sedar+ at www.sedarplus.ca and EDGAR at www.sec.gov Change in Cash position¹ – Q2 2026 (Managerial view) US$ million Investment for growth (58) Expansion CAPEX 294 Subtotal (10) Interest Paid (net of swap derivatives) 39 Proceeds from Debt / Repayments (7) Dividends and share repurchase Cash position, March 31, 2026 (2) FX on cash & equivalents and others 252 Cash position, June 30, 2026 197 (68) Adjusted EBITD A 4 Exploration Expens e (30) Adjusted CAPE X Changes in WC and others (41) Income Taxe s paid (5) Lease Payments (37) Realized losses w/ gold hedges 351 Subtotal (4) (53) 351 294 252 Exploration Expenses (1) Exploration CAPEX on Projects 271 +80 + 117
Contact: Investor Relations natasha.utescher@auraminerals.com ri@auraminerals.com www.auraminerals.com

Q&A