
Exhibit 99.1 NASDAQ: DTI INVESTOR PRESENTATION FALL 2026 DRILLINGTOOLS.COM
FORWARD LOOKING STATEMENTS General: Drilling Tools International Corporation (“DTI”) is making this presentation available in connection with the release of its financial results for the three months ended June 30, 2026. The information contained in this presentation does not purport to be all-inclusive or to contain all information that prospective investors may require. Prospective investors are encouraged to conduct their own analysis and review of information contained in this presentation as well as important additional information through the Securities and Exchange Commission’s (“SEC”) EDGAR system at www.sec.gov and on our website at www.drillingtools.com. Forward-Looking Statements: This presentation and the oral statements made in connection herewith include “forward-looking statements” within the meaning of the “safe harbor” provisions of the Private Securities Litigation Reform Act of 1995. DTI’s actual results may differ from its expectations, estimates and projections, and, consequently, you should not rely on these forward-looking statements as predictions of future events. The words “anticipate,” “believe,” “continue,” “could,” “estimate,” “expect,” “intends,” “may,” “might,” “plan,” “possible,” “potential,” “predict,” “project,” “should,” “will,” “would” and similar expressions may identify forward-looking statements, but the absence of these words does not mean that a statement is not forward looking. These forward-looking statements include, but are not limited to, statements regarding DTI and its management team’s expectations, hopes, beliefs, intentions or strategies regarding the future. In addition, any statements that refer to projections, forecasts or other characterizations of future events or circumstances, including any underlying assumptions, are forward-looking statements. Forward-looking statements in this presentation may include, for example, statements about: (1) the demand for DTI’s products and services, which is influenced by the general level activity in the oil and gas industry; (2) DTI’s ability to retain its customers, particularly those that contribute to a large portion of its revenue; (3) DTI’s ability to employ and retain a sufficient number of skilled and qualified workers, including its key personnel; (4) DTI’s ability to source tools and raw materials at a reasonable cost; (5) DTI’s ability to market its services in a competitive industry; (6) DTI’s ability to execute, integrate and realize the benefits of acquisitions, and manage the resulting growth of its business; (7) potential liability for claims arising from damage or harm caused by the operation of DTI’s tools, or otherwise arising from the dangerous activities that are inherent in the oil and gas industry; (8) DTI’s ability to obtain additional capital; (9) potential political, regulatory, economic and social disruptions in the countries in which DTI conducts business, including changes in tax laws or tax rates; (10) DTI’s dependence on its information technology systems, in particular Customer Order Management Portal and Support System, for the efficient operation of DTI’s business; (11) DTI’s ability to comply with applicable laws, regulations and rules, including those related to the environment, greenhouse gases and climate change; (12) DTI’s ability to maintain an effective system of disclosure controls and internal control over financial reporting; (13) the potential for volatility in the market price of DTI’s common stock; (14) the impact of increased legal, accounting, administrative and other costs incurred as a public company, including the impact of possible shareholder litigation; (15) the potential for issuance of additional shares of DTI’s common stock or other equity securities; (16) DTI’s ability to maintain the listing of its common stock on Nasdaq; and (17) other risks and uncertainties separately provided to you and indicated from time to time described in DTI’s most recent Forms 10-K, 10-Q and 8-K filed with or furnished to the SEC. These forward-looking statements are based on DTI management's current expectations and assumptions about future events and are based on currently available information as to the outcome and timing of future events. DTI cautions that the foregoing list of factors is not exclusive and not to place undue reliance upon any forward-looking statements, including projections, which speak only as of the date made. You should also carefully consider the risks and uncertainties described and the information presented in DTI’s current annual report on Form 10-K filed March 6, 2026 and in subsequent current, quarterly and annual reports filed with or furnished to the SEC. These filings or potential filings may identify and address other important risks and uncertainties that could cause actual events and results to differ materially from those contained in the forward-looking statements referred hereto. DTI undertakes no obligation to and accepts no obligation to release publicly any updates or revisions to any forward-looking statements or to reflect any change in its expectations or any change in events, conditions or circumstances on which any such statement is based, except as required by law. Industry, Market Data and Partnerships: In this presentation, DTI relies on and refers to certain information and statistics regarding the markets and industries in which DTI competes. Such information and statistics are based on management’s estimates and/or obtained from third-party sources, including reports by market research firms and company filings. While DTI believes such third-party information is reliable, there can be no assurance as to the accuracy or completeness of the indicated information. DTI has not independently verified the accuracy or completeness of the information provided by the third-party sources. This presentation contains descriptions of certain key business partnerships of DTI. These descriptions are based on DTI’s management team’s discussion with such counterparties, certain non-binding written agreements and the latest available information and estimates as of the date of this presentation. Use of Projections: This presentation contains projected financial information with respect to DTI. Such projected financial information constitutes forward-looking information, is for illustrative purposes only and should not be relied upon as necessarily being indicative of future results. Further, illustrative presentations are not necessarily based on management’s projections, estimates, expectations or targets but are presented for illustrative purposes only. DTI’s independent auditors have not audited, reviewed, compiled or performed any procedures with respect to the financial information projections for the purpose of their inclusion in this presentation, and, accordingly, they did not express an opinion or provide any other form of assurance with respect thereto for the purpose of this presentation. The assumptions and estimates underlying such financial forecast information are inherently uncertain and are subject to a wide variety of significant business, economic, competitive and other risks and uncertainties. See “Forward-Looking Statements” above. Actual results may differ materially from the results contemplated by the financial forecast information contained in this presentation, and the inclusion of such information in this presentation is not intended, and should not be regarded, as a representation by any person that the results reflected in such forecasts will be achieved. Further, the metrics referenced in this presentation regarding select aspects of DTI’s operations were selected by DTI on a subjective basis. Such metrics are provided solely for illustrative purposes to demonstrate elements of DTI’s business, are incomplete and are not necessarily indicative of DTI’s performance or future performance or overall operations. Any views expressed herein reflect the judgment of DTI as of the date of this presentation and may be subject to change if DTI becomes aware of any information, whether specific to a transaction or general (including changes in prevailing capital markets conditions), which may have an impact on any such views. You should not assume that any information in this overview is accurate as of any date other than the date hereof or as otherwise specified herein. There can be no assurance that historical trends will continue. Any investment in DTI’s common stock entails a high degree of risk. No assurance can be given that investors will receive a return on their capital, and investors could lose part or all of their investment. Non-GAAP Financial Measures: This presentation includes certain financial measures not presented in accordance with generally accepted accounting principles (“GAAP”), including, but not limited to: Adjusted EBITDA, Adjusted Net Income (Loss), Adjusted Free Cash Flow, and certain ratios and other metrics derived therefrom. Note that other companies may calculate these non-GAAP financial measures differently, and, therefore, such financial measures may not be directly comparable to similarly titled measures of other companies. Further, these non-GAAP financial measures are not measures of financial performance in accordance with GAAP and may exclude items that are significant in understanding and assessing DTI’s financial results. Therefore, these measures should not be considered in isolation or as an alternative to net income (loss), net cash (used in) provided by operating activities or other measures of profitability, liquidity or performance under GAAP. You should be aware that DTI’s presentation of these measures may not be comparable to similarly titled measures used by other companies. DTI believes these non-GAAP financial measures provide useful information to management and investors regarding certain financial and business trends relating to DTI’s results of operations. DTI believes that the use of these non-GAAP financial measures provides an additional tool for investors to use in evaluating ongoing operating results and trends in DTI, and in comparing DTI’s financial measures with those of other similar companies, many of which present similar non-GAAP financial measures to investors. These non-GAAP financial measures are subject to inherent limitations as they reflect the exercise of judgment by management about which items of expense and income are excluded or included in determining these non-GAAP financial measures. Please refer to footnotes where presented on each page of this presentation or to the tables herein for a reconciliation of these measures to what DTI believes are the most directly comparable measure evaluated in accordance with GAAP. Reconciliation of historical non-GAAP measures to comparable GAAP measures are provided in the Appendix. This presentation also includes certain projections of non-GAAP financial measures. Reconciliation of these items to net income include gains or losses on sale or consolidation transactions, accelerated depreciation, impairment charges, gains or losses on retirement of debt, variations in effective tax rate and fluctuations in net working capital, which are difficult to predict and estimate and are primarily dependent on future events. Rounding: Certain monetary amounts, percentages and other figures included in this presentation have been subject to rounding adjustments. Certain other amounts that appear in this presentation may not sum due to rounding. Trademarks: This presentation contains trademarks, service marks, trade names and copyrights of DTI and other companies, which are the property of their respective owners. Solely for convenience, some of the trademarks, service marks, trade names and copyrights referred to in this presentation may be listed without the TM, SM, © or ® symbols, but DTI will assert, to the fullest extent under applicable law, the rights of the applicable owners, if any, to these trademarks, service marks, trade names and copyrights. Further, third-party logos included in this presentation may represent past or present vendors or suppliers of materials and/or products to DTI for use in connection with its business or may be provided simply for illustrative purposes only. Inclusion of such logos does not necessarily imply affiliation with or endorsement by such firms or businesses. There is no guarantee that DTI will work, or continue to work, with any of the firms or businesses whose logos are included herein in the future.
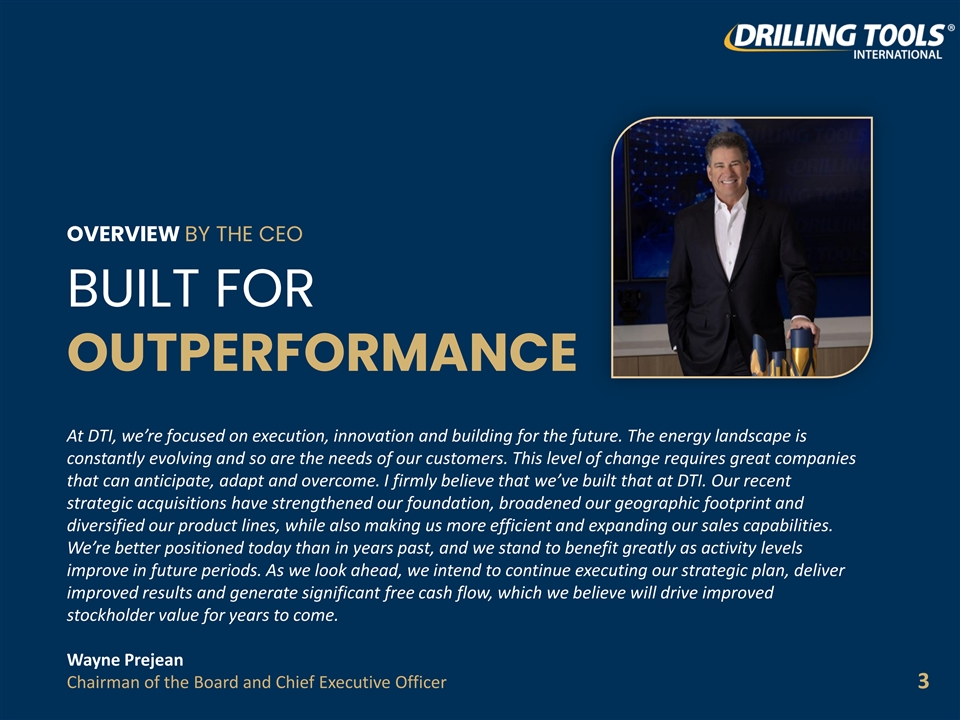
OVERVIEW BY THE CEO BUILT FOR OUTPERFORMANCE At DTI, we’re focused on execution, innovation and building for the future. The energy landscape is constantly evolving and so are the needs of our customers. This level of change requires great companies that can anticipate, adapt and overcome. I firmly believe that we’ve built that at DTI. Our recent strategic acquisitions have strengthened our foundation, broadened our geographic footprint and diversified our product lines, while also making us more efficient and expanding our sales capabilities. We’re better positioned today than in years past, and we stand to benefit greatly as activity levels improve in future periods. As we look ahead, we intend to continue executing our strategic plan, deliver improved results and generate significant free cash flow, which we believe will drive improved stockholder value for years to come. Wayne Prejean Chairman of the Board and Chief Executive Officer 3
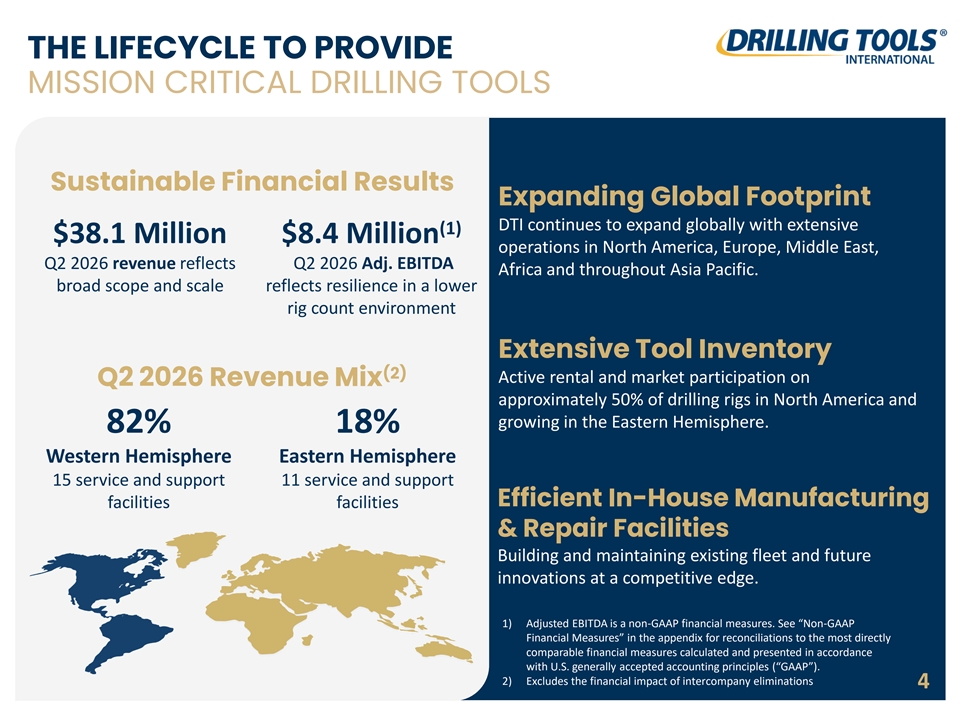
THE LIFECYCLE TO PROVIDE MISSION CRITICAL DRILLING TOOLS Sustainable Financial Results Expanding Global Footprint DTI continues to expand globally with extensive (1) $38.1 Million $8.4 Million operations in North America, Europe, Middle East, Q2 2026 revenue reflects Q2 2026 Adj. EBITDA Africa and throughout Asia Pacific. broad scope and scale reflects resilience in a lower rig count environment Extensive Tool Inventory (2) Active rental and market participation on Q2 2026 Revenue Mix approximately 50% of drilling rigs in North America and growing in the Eastern Hemisphere. 82% 18% Western Hemisphere Eastern Hemisphere 15 service and support 11 service and support Efficient In-House Manufacturing facilities facilities & Repair Facilities Building and maintaining existing fleet and future innovations at a competitive edge. 1) Adjusted EBITDA is a non-GAAP financial measures. See “Non-GAAP Financial Measures” in the appendix for reconciliations to the most directly comparable financial measures calculated and presented in accordance with U.S. generally accepted accounting principles (“GAAP”). 2) Excludes the financial impact of intercompany eliminations 4
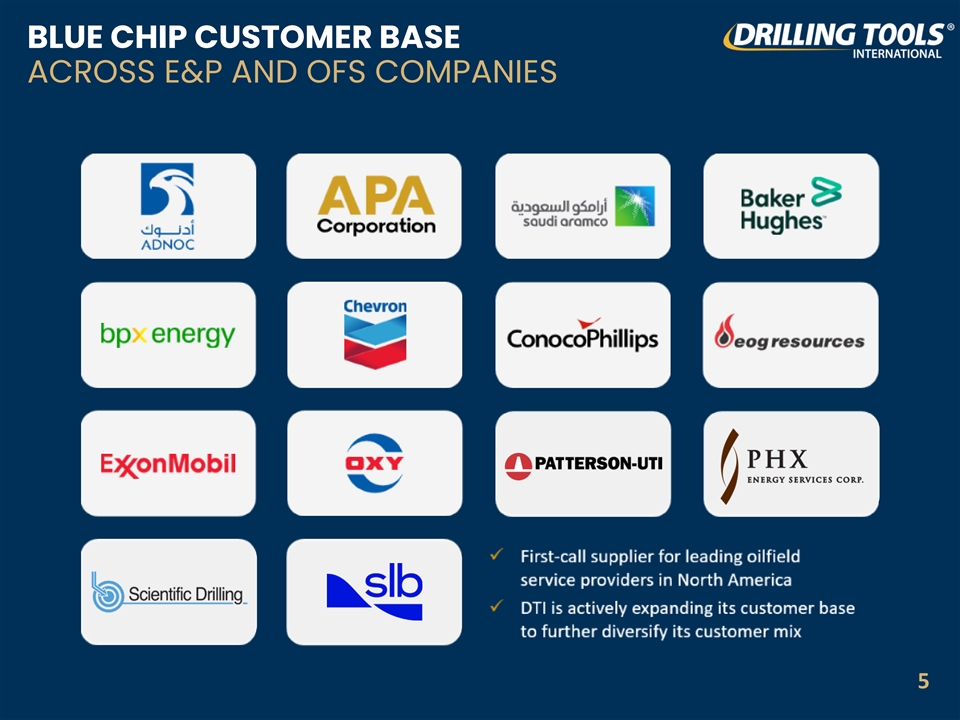
BLUE CHIP CUSTOMER BASE ACROSS E&P AND OFS COMPANIES 5
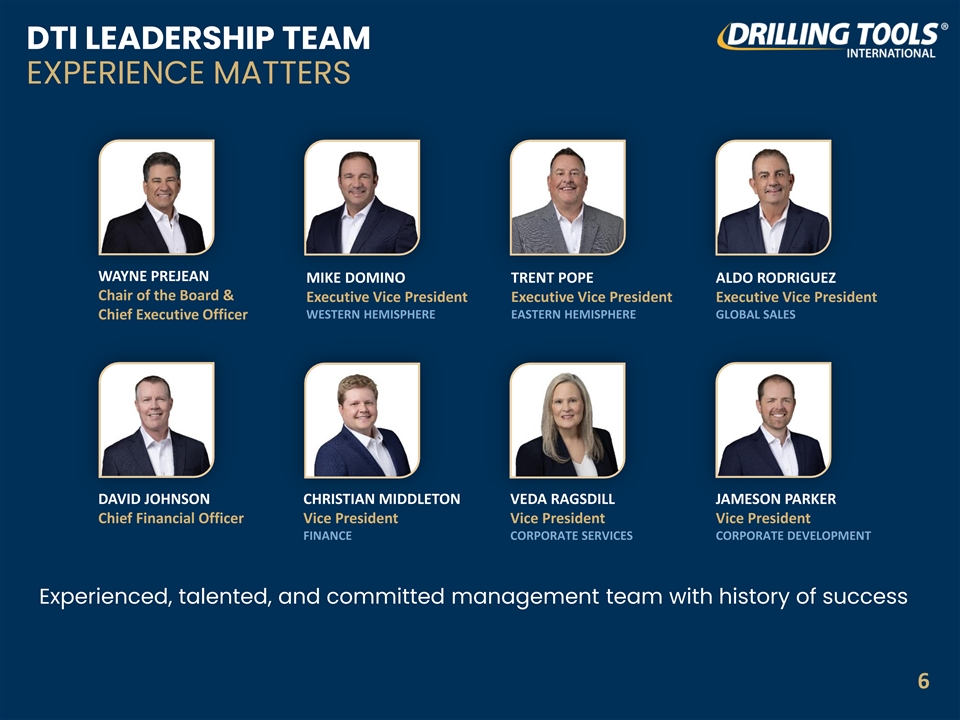
DTI LEADERSHIP TEAM EXPERIENCE MATTERS WAYNE PREJEAN MIKE DOMINO TRENT POPE ALDO RODRIGUEZ Chair of the Board & Executive Vice President Executive Vice President Executive Vice President WESTERN HEMISPHERE EASTERN HEMISPHERE GLOBAL SALES Chief Executive Officer DAVID JOHNSON CHRISTIAN MIDDLETON VEDA RAGSDILL JAMESON PARKER Chief Financial Officer Vice President Vice President Vice President FINANCE CORPORATE SERVICES CORPORATE DEVELOPMENT Experienced, talented, and committed management team with history of success 6
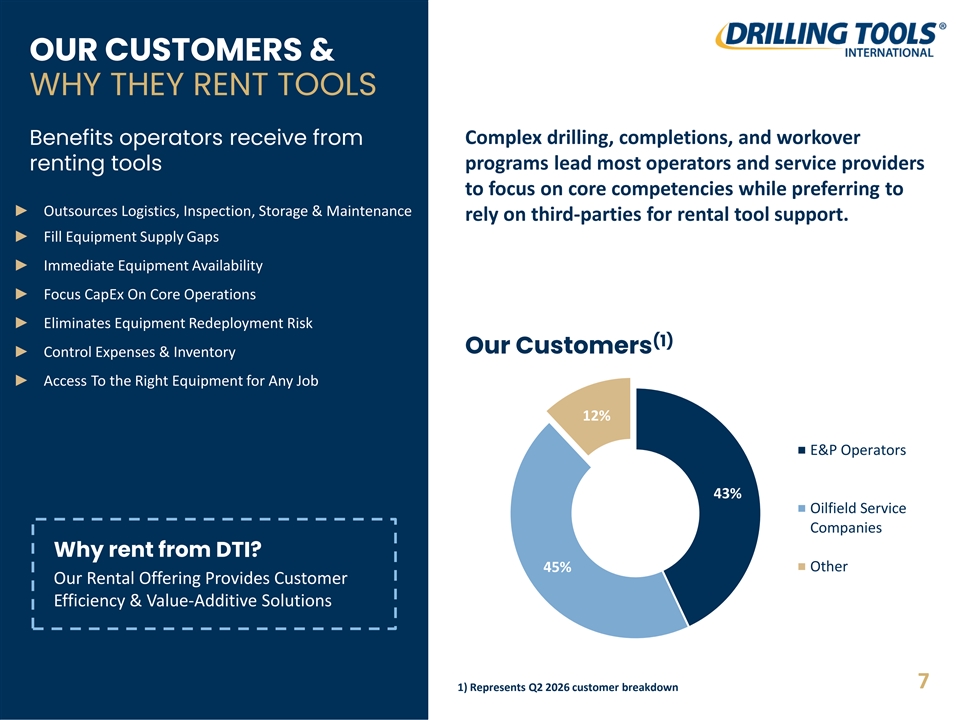
OUR CUSTOMERS & WHY THEY RENT TOOLS Complex drilling, completions, and workover Benefits operators receive from programs lead most operators and service providers renting tools to focus on core competencies while preferring to ► Outsources Logistics, Inspection, Storage & Maintenance rely on third-parties for rental tool support. ► Fill Equipment Supply Gaps ► Immediate Equipment Availability ► Focus CapEx On Core Operations ► Eliminates Equipment Redeployment Risk (1) Our Customers ► Control Expenses & Inventory ► Access To the Right Equipment for Any Job 12% E&P Operators 43% Oilfield Service Companies Why rent from DTI? 45% Other Our Rental Offering Provides Customer Efficiency & Value-Additive Solutions 7 1) Represents Q2 2026 customer breakdown
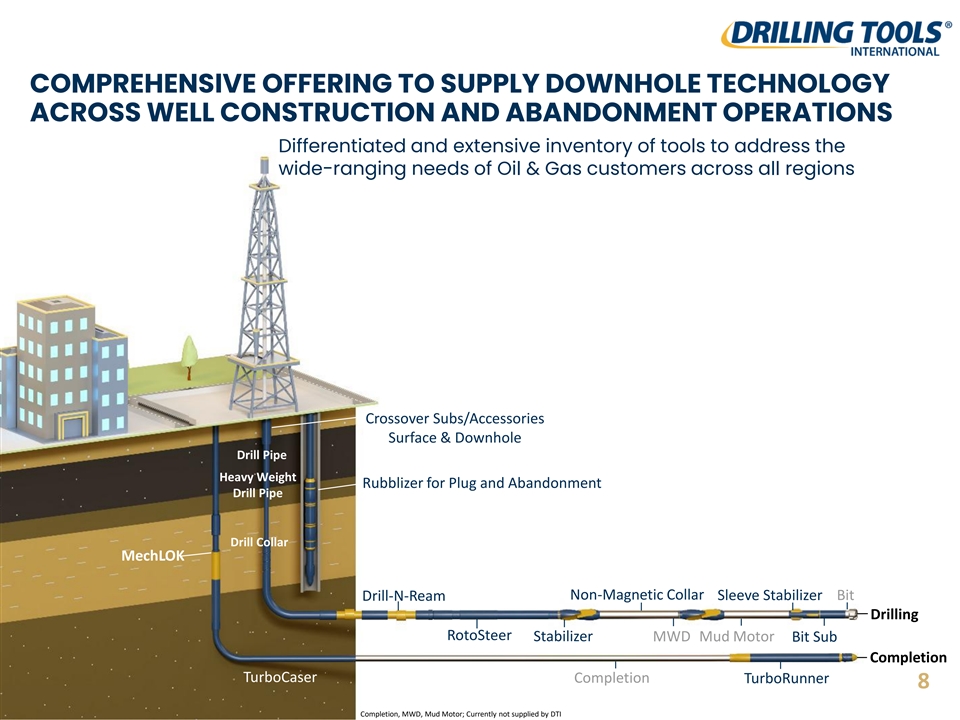
COMPREHENSIVE OFFERING TO SUPPLY DOWNHOLE TECHNOLOGY ACROSS WELL CONSTRUCTION AND ABANDONMENT OPERATIONS Differentiated and extensive inventory of tools to address the wide-ranging needs of Oil & Gas customers across all regions Crossover Subs/Accessories Surface & Downhole Drill Pipe Heavy Weight Rubblizer for Plug and Abandonment Drill Pipe Drill Collar MechLOK Non-Magnetic Collar Sleeve Stabilizer Bit Drill-N-Ream Drilling RotoSteer Stabilizer MWD Mud Motor Bit Sub Completion TurboCaser Completion TurboRunner 8 Completion, MWD, Mud Motor; Currently not supplied by DTI
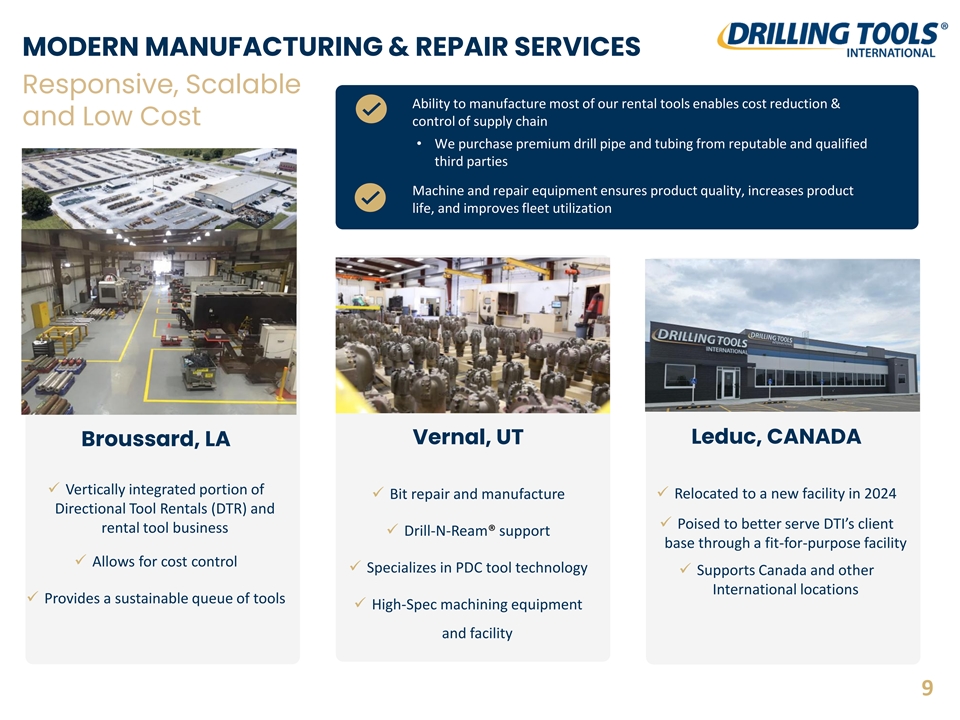
MODERN MANUFACTURING & REPAIR SERVICES Responsive, Scalable Ability to manufacture most of our rental tools enables cost reduction & and Low Cost control of supply chain • We purchase premium drill pipe and tubing from reputable and qualified third parties Machine and repair equipment ensures product quality, increases product life, and improves fleet utilization Vernal, UT Leduc, CANADA Broussard, LA ✓ Vertically integrated portion of ✓ Bit repair and manufacture✓ Relocated to a new facility in 2024 Directional Tool Rentals (DTR) and ✓ Poised to better serve DTI’s client rental tool business ✓ Drill-N-Ream® support base through a fit-for-purpose facility ✓ Allows for cost control ✓ Specializes in PDC tool technology ✓ Supports Canada and other International locations ✓ Provides a sustainable queue of tools ✓ High-Spec machining equipment and facility 9
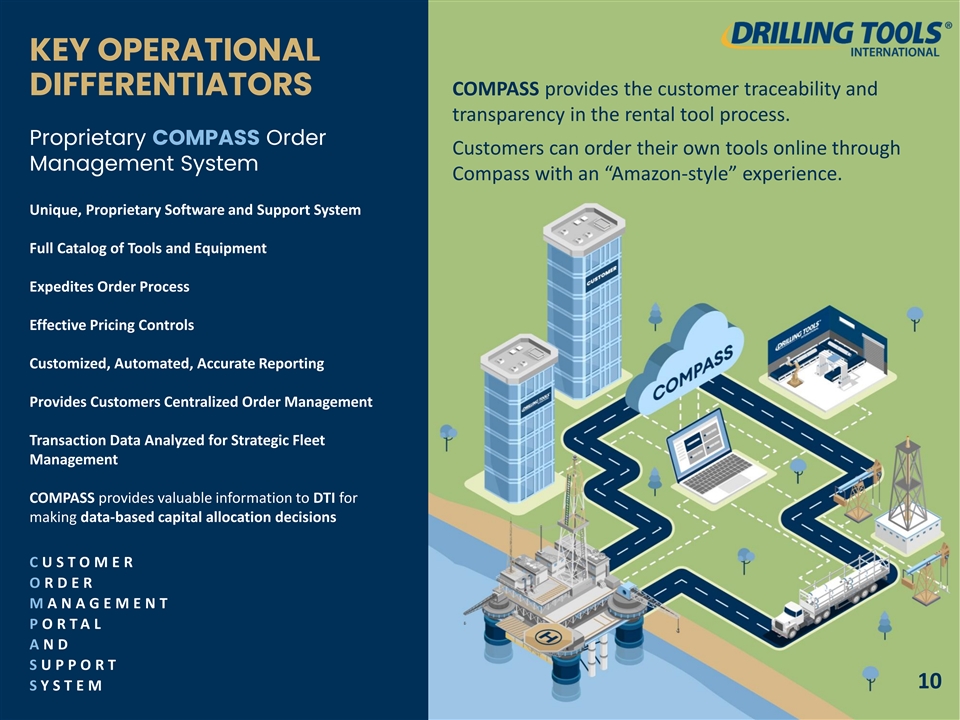
KEY OPERATIONAL DIFFERENTIATORS COMPASS provides the customer traceability and transparency in the rental tool process. Proprietary COMPASS Order Customers can order their own tools online through Management System Compass with an “Amazon-style” experience. Unique, Proprietary Software and Support System Full Catalog of Tools and Equipment Expedites Order Process Effective Pricing Controls Customized, Automated, Accurate Reporting Provides Customers Centralized Order Management Transaction Data Analyzed for Strategic Fleet Management COMPASS provides valuable information to DTI for making data-based capital allocation decisions C U S T O M E R O R D E R M A N A G E M E N T P O R T A L A N D S U P P O R T 10 S Y S T E M
EXECUTING OUR STRATEGIC PLAN DELIVERING RESILIENT RESULTS DTI ACHIEVEMENTS SINCE BECOMING A PUBLIC COMPANY IN JUNE 2023 (1) ➢ Have grown annual Adjusted Free Cash Flow each year since going public (2) ➢ Maintaining healthy Adjusted Free Cash Flow Margins ➢ Despite declining activity levels in 2025, Adjusted FCF Margin grew from 11.1% to 12.0% ➢ Reaffirmed 2026 Outlook represents growth at the midpoint after achieving the high-end of 2025 guidance ranges despite muted U.S. Land drilling and completions activity ➢ Eastern Hemisphere has grown from less than 1% to approximately 18% of total revenue in Q2 2026 ➢ Executed and fully integrated four acquisitions ➢ Deep Casing Tools / Superior Drilling Products / European Drilling Projects / Titan Tools ➢ Improved liquidity and strengthened the balance sheet ➢ Expanded the ABL Credit Facility from $60 million to $80 million ➢ Added a $25 million term loan maturing in March 2029 (3) ➢ Improved Leverage Ratio to a conservative 1.1x at year-end 2025 ➢ Grew portfolio from 2 to 16 patented products ➢ Approximately 150 active patents supporting those technologies. (1) Adjusted Free Cash Flow is a non-GAAP financial measure. See “Non-GAAP Financial Measures” in the appendix for reconciliations to the most directly comparable financial measures calculated and presented in accordance with U.S. generally accepted accounting principles (“GAAP”). (2) Adjusted Free Cash Flow Margin is defined as Adjusted EBITDA less Gross Capital Expenditures divided by Total Revenue 11 (3) Leverage Ratio reflects DTI’s Net Debt to Trailing Twelve-Month Adjusted EBITDA Multiple; Net Debt is defined as Total Debt less Cash and Cash Equivalents
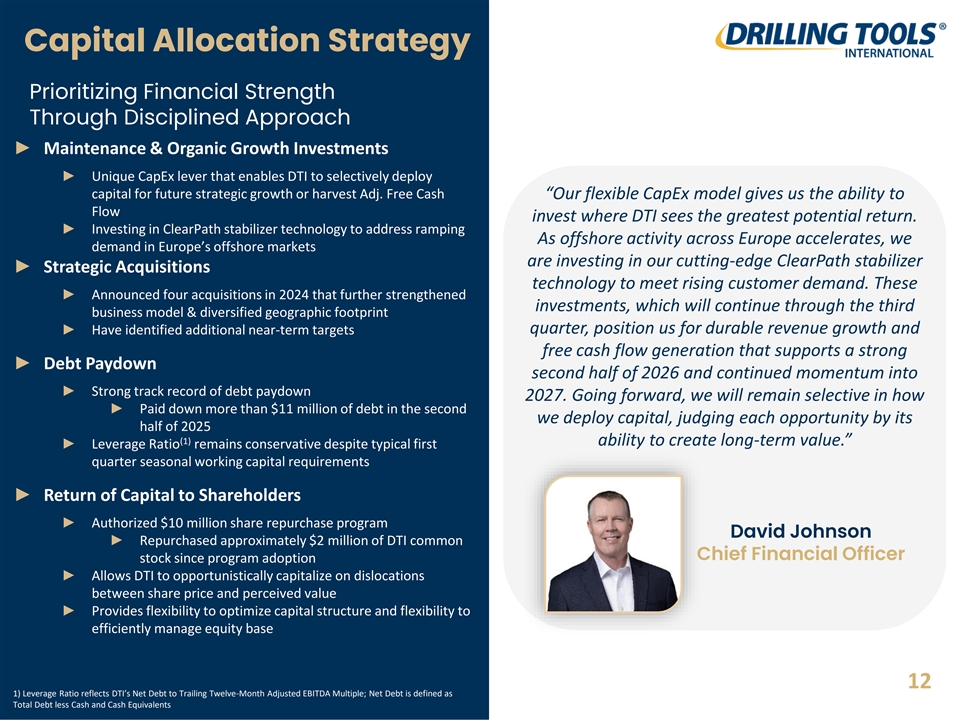
Capital Allocation Strategy Prioritizing Financial Strength Through Disciplined Approach ► Maintenance & Organic Growth Investments ► Unique CapEx lever that enables DTI to selectively deploy capital for future strategic growth or harvest Adj. Free Cash “Our flexible CapEx model gives us the ability to Flow invest where DTI sees the greatest potential return. ► Investing in ClearPath stabilizer technology to address ramping As offshore activity across Europe accelerates, we demand in Europe’s offshore markets are investing in our cutting-edge ClearPath stabilizer ► Strategic Acquisitions technology to meet rising customer demand. These ► Announced four acquisitions in 2024 that further strengthened investments, which will continue through the third business model & diversified geographic footprint quarter, position us for durable revenue growth and ► Have identified additional near-term targets free cash flow generation that supports a strong ► Debt Paydown second half of 2026 and continued momentum into ► Strong track record of debt paydown 2027. Going forward, we will remain selective in how ► Paid down more than $11 million of debt in the second we deploy capital, judging each opportunity by its half of 2025 (1) ability to create long-term value.” ► Leverage Ratio remains conservative despite typical first quarter seasonal working capital requirements ► Return of Capital to Shareholders ► Authorized $10 million share repurchase program David Johnson ► Repurchased approximately $2 million of DTI common Chief Financial Officer stock since program adoption ► Allows DTI to opportunistically capitalize on dislocations between share price and perceived value ► Provides flexibility to optimize capital structure and flexibility to efficiently manage equity base 12 1) Leverage Ratio reflects DTI’s Net Debt to Trailing Twelve-Month Adjusted EBITDA Multiple; Net Debt is defined as Total Debt less Cash and Cash Equivalents
ORGANIC GROWTH DRIVERS ✓ Results include contributions from all acquisitions to date ✓ Leverage our global footprint of distribution and sales channel to market ✓ Expand scope of tools & services through technological advancements ✓ Leading edge downhole technology for extended reach drilling ✓ Proprietary examples: Deep Casing Tools / Next Generation Stabilizers – ClearPath ✓ RotoSteer / Drill-N-Ream® / SafeFloat ✓ Grow customer base and gain global market share utilizing acquisitions / technology ✓ Trend towards longer laterals favors DTI’s new technology ✓ International markets adopting unconventional “shale type” drilling applications ✓ DTI is well positioned to supply in those markets ✓ Stand to benefit as existing customers enter new International markets ✓ Positioned for drilling applications outside of traditional Oil and Gas ✓ Geothermal, Lithium Exploration/Extraction, Etc. 13
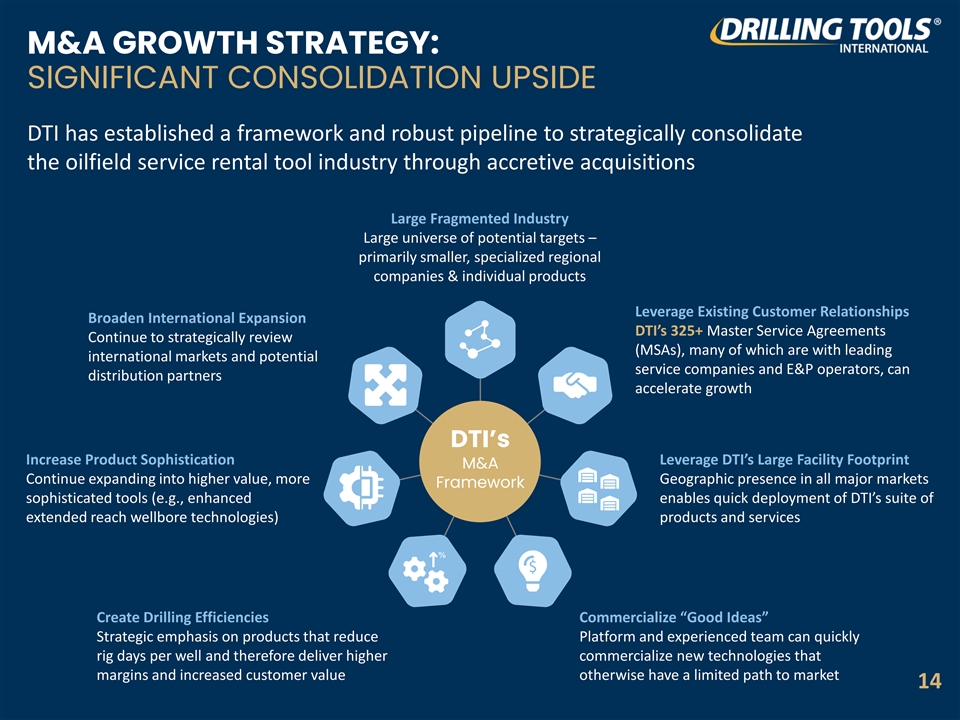
M&A GROWTH STRATEGY: SIGNIFICANT CONSOLIDATION UPSIDE DTI has established a framework and robust pipeline to strategically consolidate the oilfield service rental tool industry through accretive acquisitions Large Fragmented Industry Large universe of potential targets – primarily smaller, specialized regional companies & individual products Leverage Existing Customer Relationships Broaden International Expansion DTI’s 325+ Master Service Agreements Continue to strategically review (MSAs), many of which are with leading international markets and potential service companies and E&P operators, can distribution partners accelerate growth DTI’s Increase Product Sophistication Leverage DTI’s Large Facility Footprint M&A Continue expanding into higher value, more Geographic presence in all major markets Framework sophisticated tools (e.g., enhanced enables quick deployment of DTI’s suite of extended reach wellbore technologies) products and services Create Drilling Efficiencies Commercialize “Good Ideas” Strategic emphasis on products that reduce Platform and experienced team can quickly rig days per well and therefore deliver higher commercialize new technologies that margins and increased customer value otherwise have a limited path to market 14
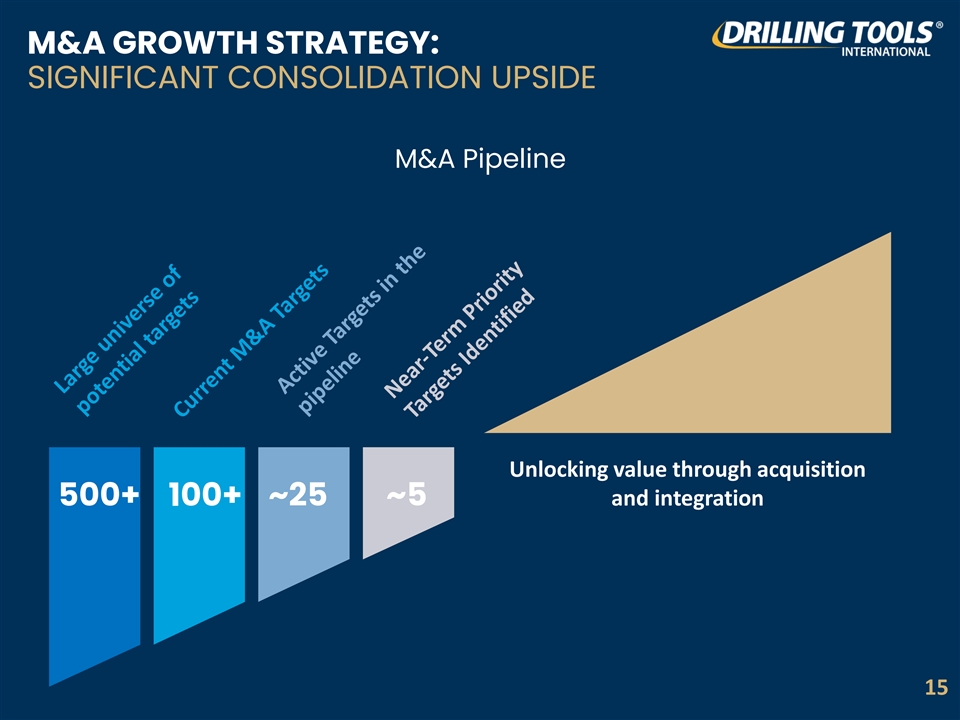
M&A GROWTH STRATEGY: SIGNIFICANT CONSOLIDATION UPSIDE M&A Pipeline Unlocking value through acquisition ~25 ~5 and integration 500+ 100+ 15
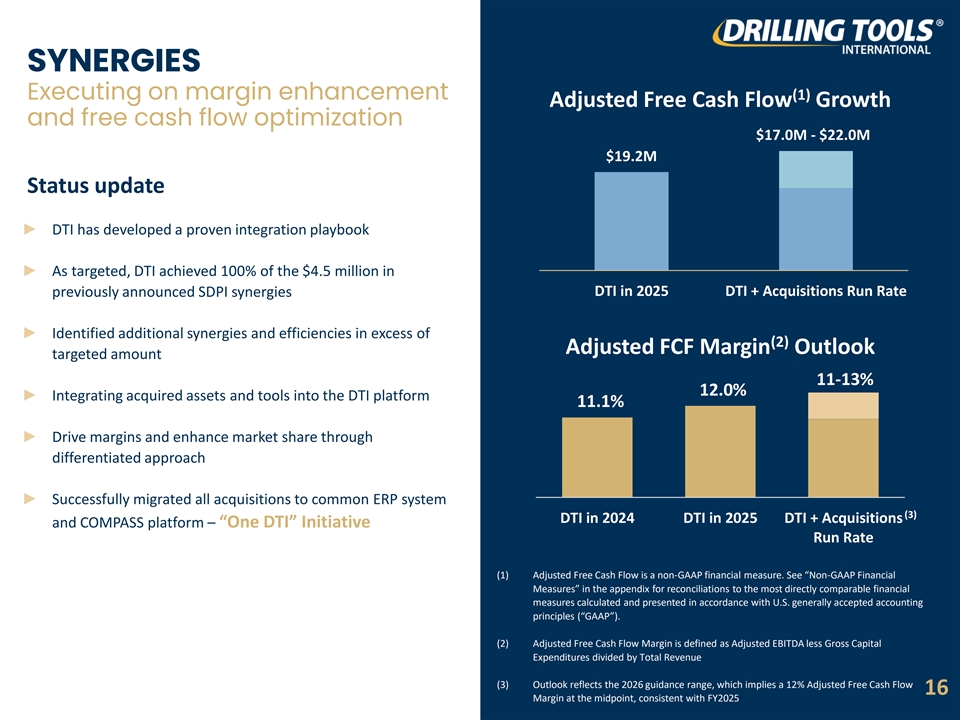
SYNERGIES Executing on margin enhancement (1) Adjusted Free Cash Flow Growth and free cash flow optimization $17.0M - $22.0M $19.2M Status update ► DTI has developed a proven integration playbook ► As targeted, DTI achieved 100% of the $4.5 million in DTI in 2025 DTI + Acquisitions Run Rate previously announced SDPI synergies ► Identified additional synergies and efficiencies in excess of (2) Adjusted FCF Margin Outlook targeted amount 11-13% 12.0% ► Integrating acquired assets and tools into the DTI platform 11.1% ► Drive margins and enhance market share through differentiated approach ► Successfully migrated all acquisitions to common ERP system (3) DTI in 2024 DTI in 2025 DTI + Acquisitions and COMPASS platform – “One DTI” Initiative Run Rate (1) Adjusted Free Cash Flow is a non-GAAP financial measure. See “Non-GAAP Financial Measures” in the appendix for reconciliations to the most directly comparable financial measures calculated and presented in accordance with U.S. generally accepted accounting principles (“GAAP”). (2) Adjusted Free Cash Flow Margin is defined as Adjusted EBITDA less Gross Capital Expenditures divided by Total Revenue (3) Outlook reflects the 2026 guidance range, which implies a 12% Adjusted Free Cash Flow 16 Margin at the midpoint, consistent with FY2025
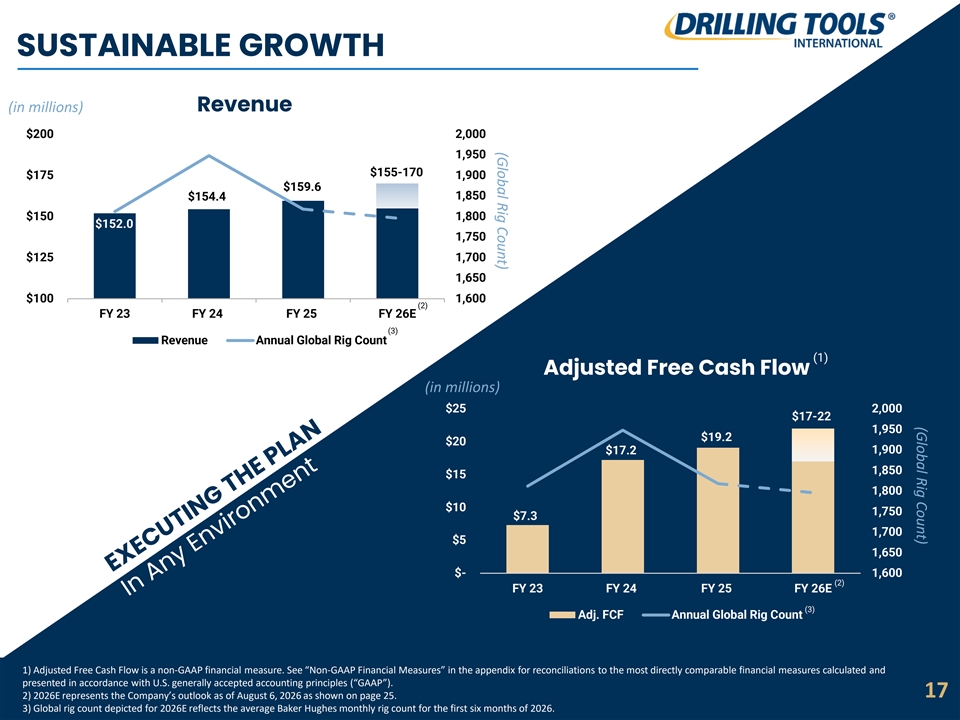
(Global Rig Count) (Global Rig Count) SUSTAINABLE GROWTH (in millions) Revenue $200 2,000 1,950 $155-170 $175 1,900 $159.6 1,850 $154.4 $150 1,800 $152.0 1,750 $125 1,700 1,650 $100 1,600 (2) FY 23 FY 24 FY 25 FY 26E (3) Revenue Annual Global Rig Count (1) Adjusted Free Cash Flow (in millions) $25 2,000 $17-22 1,950 $19.2 $20 1,900 $17.2 1,850 $15 1,800 $10 1,750 $7.3 1,700 $5 1,650 $- 1,600 (2) FY 23 FY 24 FY 25 FY 26E (3) Adj. FCF Annual Global Rig Count 1) Adjusted Free Cash Flow is a non-GAAP financial measure. See “Non-GAAP Financial Measures” in the appendix for reconciliations to the most directly comparable financial measures calculated and presented in accordance with U.S. generally accepted accounting principles (“GAAP”). 17 2) 2026E represents the Company’s outlook as of August 6, 2026 as shown on page 25. 3) Global rig count depicted for 2026E reflects the average Baker Hughes monthly rig count for the first six months of 2026.
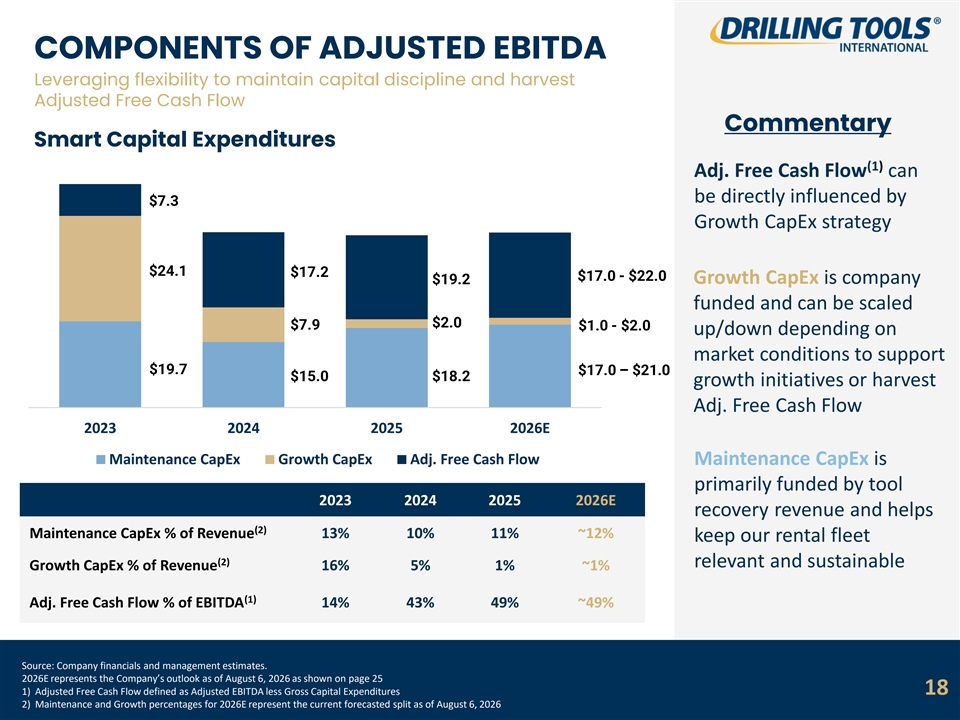
COMPONENTS OF ADJUSTED EBITDA Leveraging flexibility to maintain capital discipline and harvest Adjusted Free Cash Flow Commentary Smart Capital Expenditures (1) Adj. Free Cash Flow can be directly influenced by $7.3 Growth CapEx strategy $24.1 $17.2 $17.0 - $22.0 $19.2 Growth CapEx is company funded and can be scaled $2.0 $7.9 $1.0 - $2.0 up/down depending on market conditions to support $19.7 $17.0 – $21.0 $15.0 $18.2 growth initiatives or harvest Adj. Free Cash Flow 2023 2024 2025 2026E Maintenance CapEx Growth CapEx Adj. Free Cash Flow Maintenance CapEx is primarily funded by tool 2023 2024 2025 2026E recovery revenue and helps (2) Maintenance CapEx % of Revenue 13% 10% 11% ~12% keep our rental fleet (2) relevant and sustainable Growth CapEx % of Revenue 16% 5% 1% ~1% (1) Adj. Free Cash Flow % of EBITDA 14% 43% 49% ~49% Source: Company financials and management estimates. 2026E represents the Company’s outlook as of August 6, 2026 as shown on page 25 1) Adjusted Free Cash Flow defined as Adjusted EBITDA less Gross Capital Expenditures 18 2) Maintenance and Growth percentages for 2026E represent the current forecasted split as of August 6, 2026
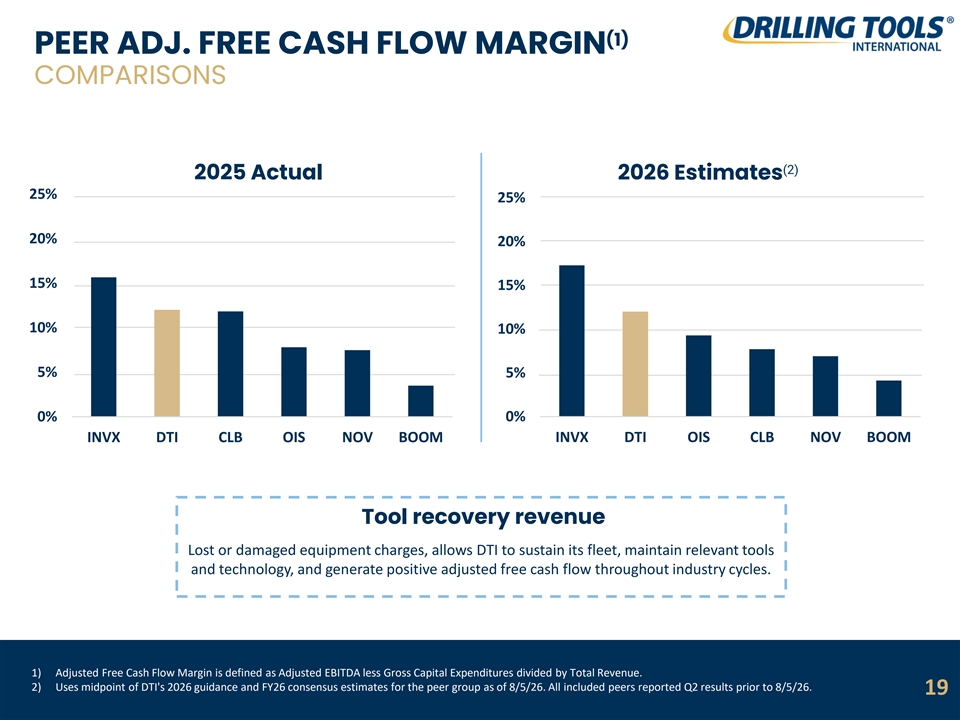
(1) PEER ADJ. FREE CASH FLOW MARGIN COMPARISONS (2) 2025 Actual 2026 Estimates 25% 25% 20% 20% 15% 15% 10% 10% 5% 5% 0% 0% INVX DTI CLB OIS NOV BOOM INVX DTI OIS CLB NOV BOOM Tool recovery revenue Lost or damaged equipment charges, allows DTI to sustain its fleet, maintain relevant tools and technology, and generate positive adjusted free cash flow throughout industry cycles. 1) Adjusted Free Cash Flow Margin is defined as Adjusted EBITDA less Gross Capital Expenditures divided by Total Revenue. 2) Uses midpoint of DTI's 2026 guidance and FY26 consensus estimates for the peer group as of 8/5/26. All included peers reported Q2 results prior to 8/5/26. 19
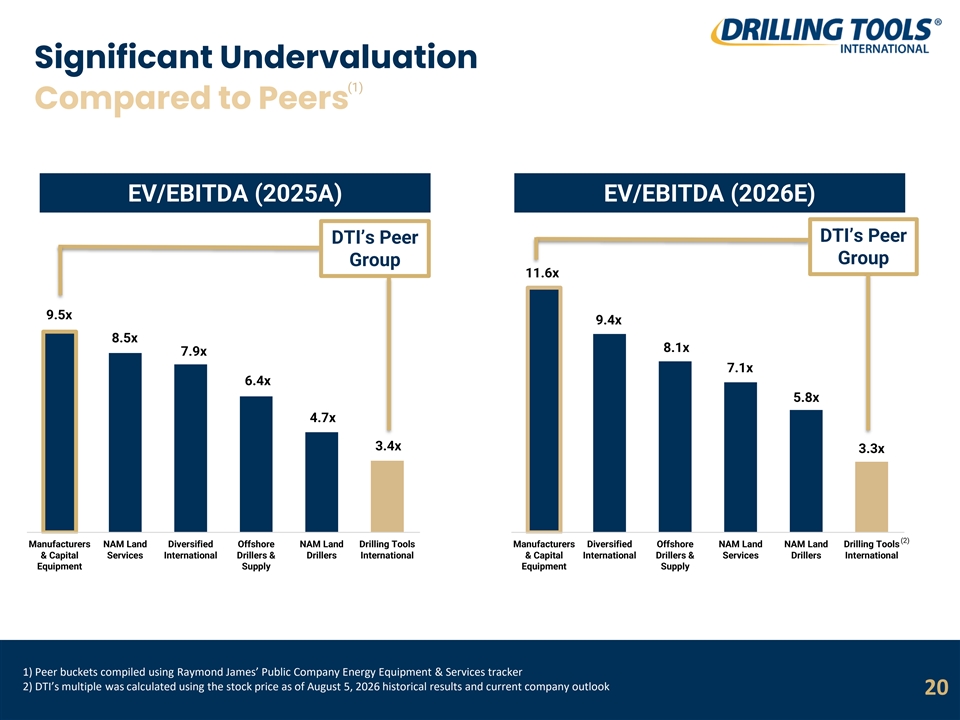
Significant Undervaluation (1) Compared to Peers EV/EBITDA (2025A) EV/EBITDA (2026E) DTI’s Peer DTI’s Peer Group Group 11.6x 9.5x 9.4x 8.5x 8.1x 7.9x 7.1x 6.4x 5.8x 4.7x 3.4x 3.3x (2) Manufacturers NAM Land Diversified Offshore NAM Land Drilling Tools Manufacturers Diversified Offshore NAM Land NAM Land Drilling Tools & Capital Services International Drillers & Drillers International & Capital International Drillers & Services Drillers International Equipment Supply Equipment Supply 1) Peer buckets compiled using Raymond James’ Public Company Energy Equipment & Services tracker 2) DTI’s multiple was calculated using the stock price as of August 5, 2026 historical results and current company outlook 20
GEOGRAPHIC SEGMENTS 21
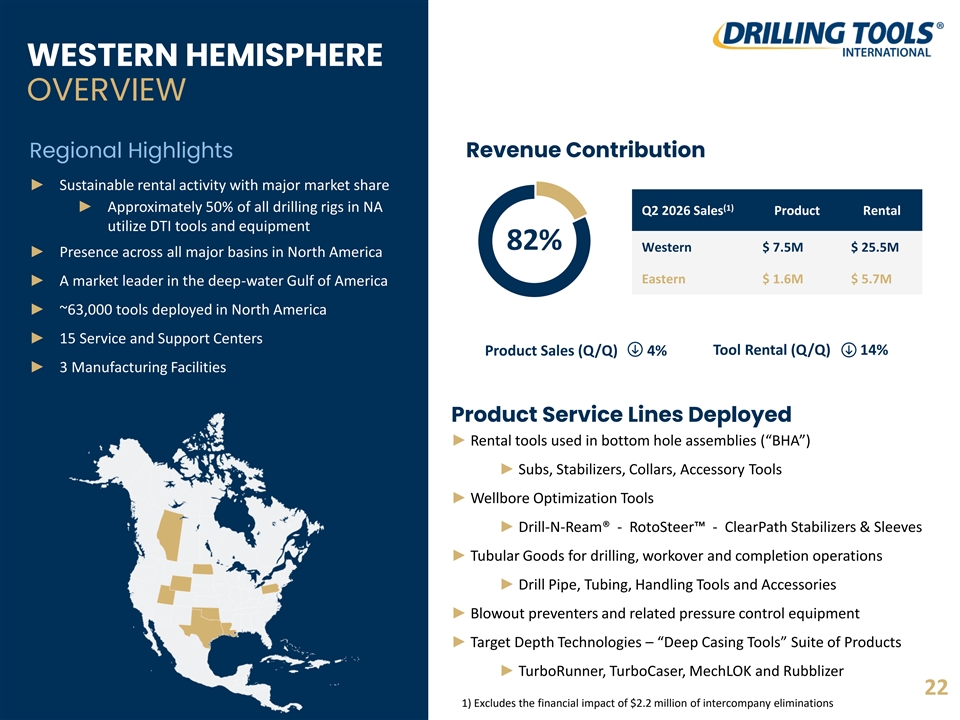
WESTERN HEMISPHERE OVERVIEW Regional Highlights Revenue Contribution ► Sustainable rental activity with major market share (1) ► Approximately 50% of all drilling rigs in NA Q2 2026 Sales Product Rental utilize DTI tools and equipment 82% Western $ 7.5M $ 25.5M ► Presence across all major basins in North America Eastern $ 1.6M $ 5.7M ► A market leader in the deep-water Gulf of America ► ~63,000 tools deployed in North America ► 15 Service and Support Centers Tool Rental (Q/Q) 14% Product Sales (Q/Q) 4% ► 3 Manufacturing Facilities Product Service Lines Deployed ► Rental tools used in bottom hole assemblies (“BHA”) ► Subs, Stabilizers, Collars, Accessory Tools ► Wellbore Optimization Tools ► Drill-N-Ream® - RotoSteer - ClearPath Stabilizers & Sleeves ► Tubular Goods for drilling, workover and completion operations ► Drill Pipe, Tubing, Handling Tools and Accessories ► Blowout preventers and related pressure control equipment ► Target Depth Technologies – “Deep Casing Tools” Suite of Products ► TurboRunner, TurboCaser, MechLOK and Rubblizer 22 1) Excludes the financial impact of $2.2 million of intercompany eliminations
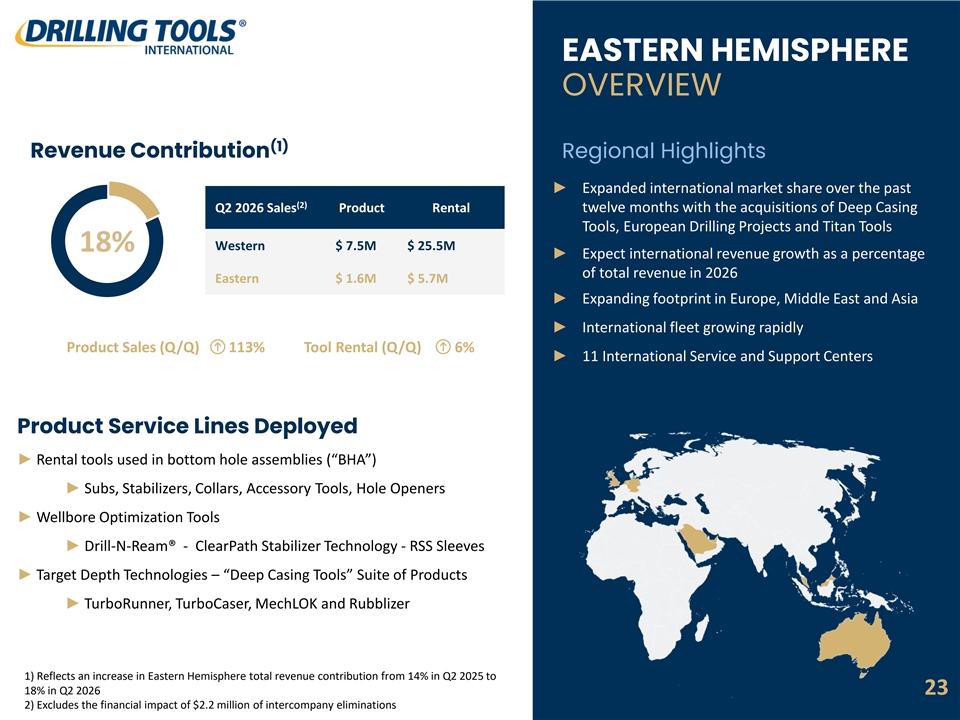
► Tubular Goods for drilling, workover and completion operations ► Drill Pipe, Tubing, Handling Tools and Accessories ► Blowout preventers and related pressure control equipment EASTERN HEMISPHERE OVERVIEW (1) Revenue Contribution Regional Highlights ► Expanded international market share over the past (2) Q2 2026 Sales Product Rental twelve months with the acquisitions of Deep Casing Tools, European Drilling Projects and Titan Tools Western $ 7.5M $ 25.5M 18% ► Expect international revenue growth as a percentage of total revenue in 2026 Eastern $ 1.6M $ 5.7M ► Expanding footprint in Europe, Middle East and Asia ► International fleet growing rapidly Product Sales (Q/Q) 113% Tool Rental (Q/Q) 6% ► 11 International Service and Support Centers Product Service Lines Deployed ► Rental tools used in bottom hole assemblies (“BHA”) ► Subs, Stabilizers, Collars, Accessory Tools, Hole Openers ► Wellbore Optimization Tools ► Drill-N-Ream® - ClearPath Stabilizer Technology - RSS Sleeves ► Target Depth Technologies – “Deep Casing Tools” Suite of Products ► TurboRunner, TurboCaser, MechLOK and Rubblizer 1) Reflects an increase in Eastern Hemisphere total revenue contribution from 14% in Q2 2025 to 18% in Q2 2026 23 2) Excludes the financial impact of $2.2 million of intercompany eliminations
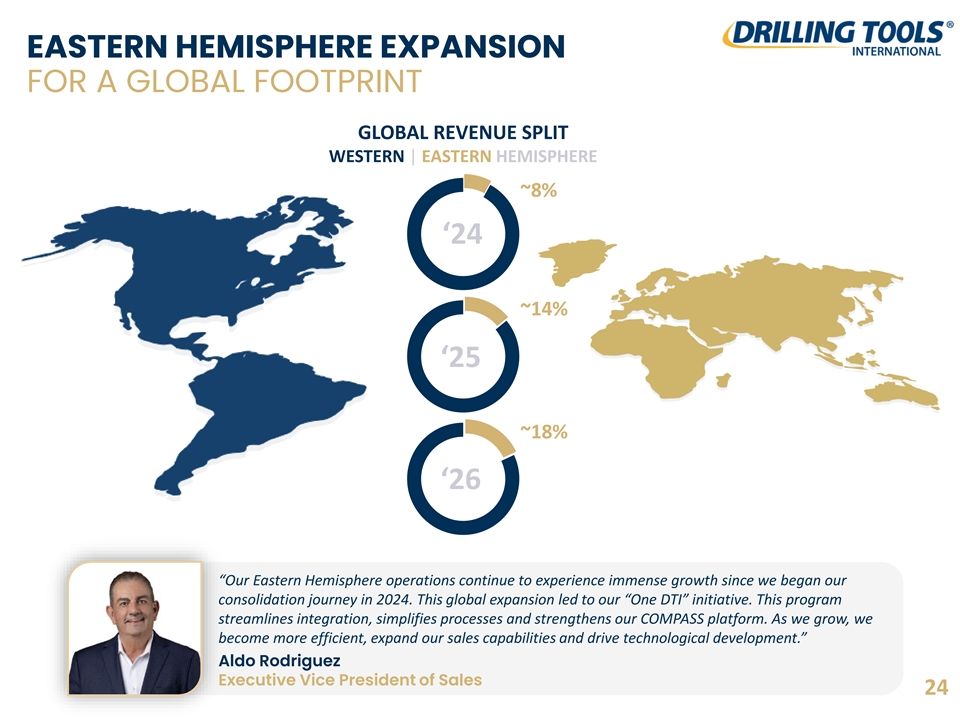
EASTERN HEMISPHERE EXPANSION FOR A GLOBAL FOOTPRINT GLOBAL REVENUE SPLIT WESTERN | EASTERN HEMISPHERE ~8% ‘24 ~14% ‘25 ~18% ‘26 “Our Eastern Hemisphere operations continue to experience immense growth since we began our consolidation journey in 2024. This global expansion led to our “One DTI” initiative. This program streamlines integration, simplifies processes and strengthens our COMPASS platform. As we grow, we become more efficient, expand our sales capabilities and drive technological development.” Aldo Rodriguez Executive Vice President of Sales 24
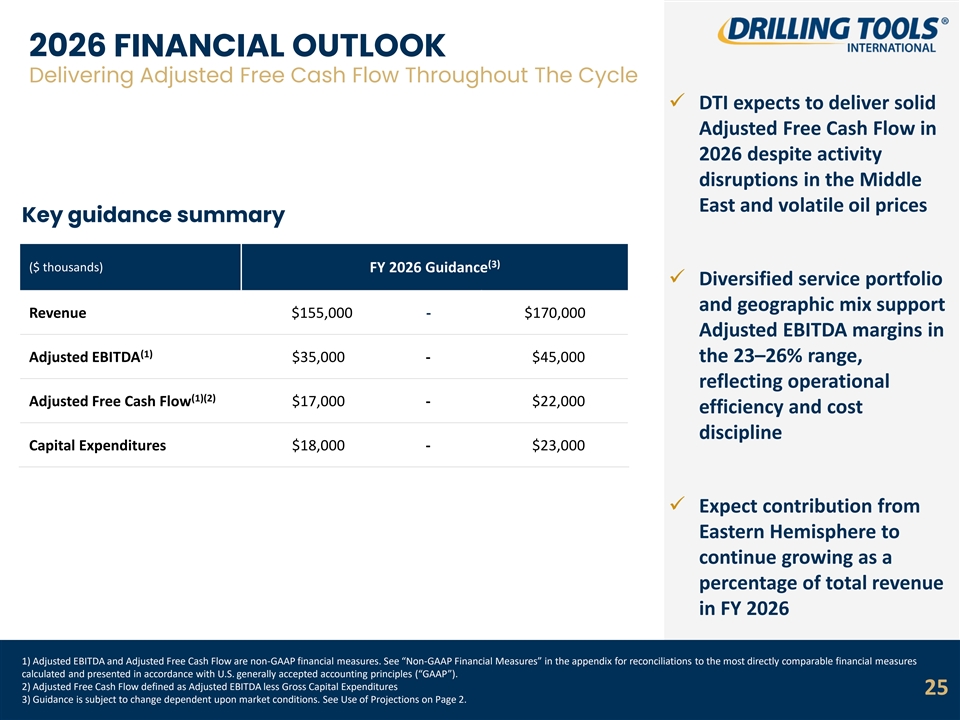
2026 FINANCIAL OUTLOOK Delivering Adjusted Free Cash Flow Throughout The Cycle ✓ DTI expects to deliver solid Adjusted Free Cash Flow in 2026 despite activity disruptions in the Middle East and volatile oil prices Key guidance summary (3) ($ thousands) FY 2026 Guidance ✓ Diversified service portfolio and geographic mix support Revenue $155,000 - $170,000 Adjusted EBITDA margins in (1) Adjusted EBITDA $35,000 - $45,000 the 23–26% range, reflecting operational (1)(2) Adjusted Free Cash Flow $17,000 - $22,000 efficiency and cost discipline Capital Expenditures $18,000 - $23,000 ✓ Expect contribution from Eastern Hemisphere to continue growing as a percentage of total revenue in FY 2026 1) Adjusted EBITDA and Adjusted Free Cash Flow are non-GAAP financial measures. See “Non-GAAP Financial Measures” in the appendix for reconciliations to the most directly comparable financial measures calculated and presented in accordance with U.S. generally accepted accounting principles (“GAAP”). 2) Adjusted Free Cash Flow defined as Adjusted EBITDA less Gross Capital Expenditures 25 3) Guidance is subject to change dependent upon market conditions. See Use of Projections on Page 2.
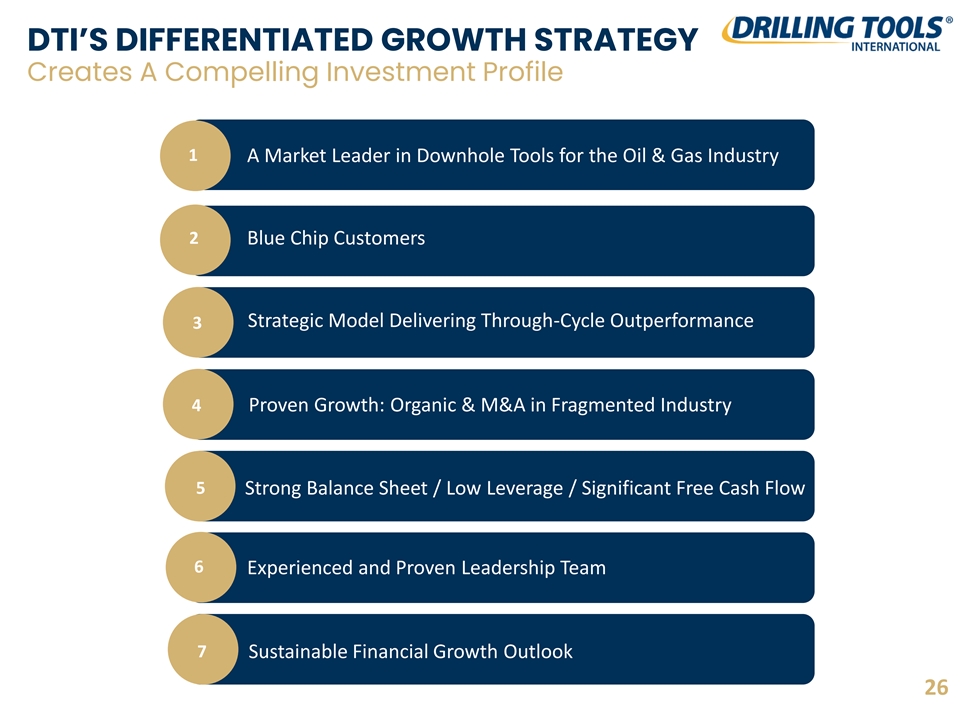
DTI’S DIFFERENTIATED GROWTH STRATEGY Creates A Compelling Investment Profile 1 A Market Leader in Downhole Tools for the Oil & Gas Industry 2 Blue Chip Customers Strategic Model Delivering Through-Cycle Outperformance 3 4 Proven Growth: Organic & M&A in Fragmented Industry 5 Strong Balance Sheet / Low Leverage / Significant Free Cash Flow 6 Experienced and Proven Leadership Team 7 Sustainable Financial Growth Outlook 26
ADDITIONAL INFORMATION 27
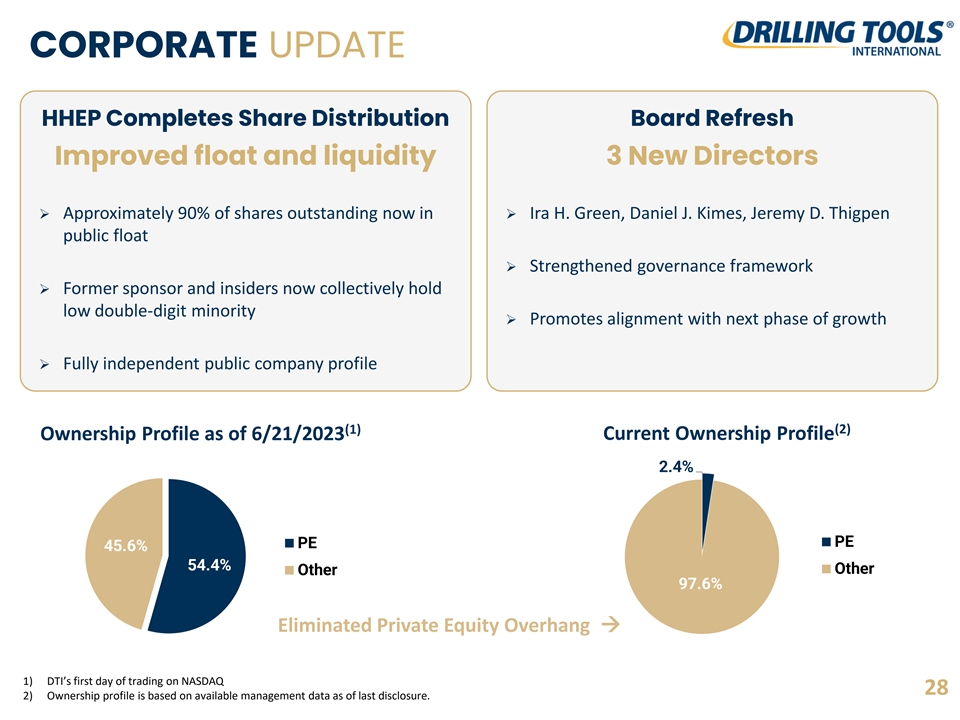
ORGANIZATIONAL STRUCTURE CORPORATE UPDATE HHEP Completes Share Distribution Board Refresh Improved float and liquidity 3 New Directors ➢ Approximately 90% of shares outstanding now in ➢ Ira H. Green, Daniel J. Kimes, Jeremy D. Thigpen public float ➢ Strengthened governance framework ➢ Former sponsor and insiders now collectively hold low double-digit minority ➢ Promotes alignment with next phase of growth ➢ Fully independent public company profile (2) (1) Ownership Profile as of 6/21/2023 Current Ownership Profile 2.4% PE PE 45.6% 54.4% Other Other 97.6% Eliminated Private Equity Overhang → 1) DTI’s first day of trading on NASDAQ 28 2) Ownership profile is based on available management data as of last disclosure.
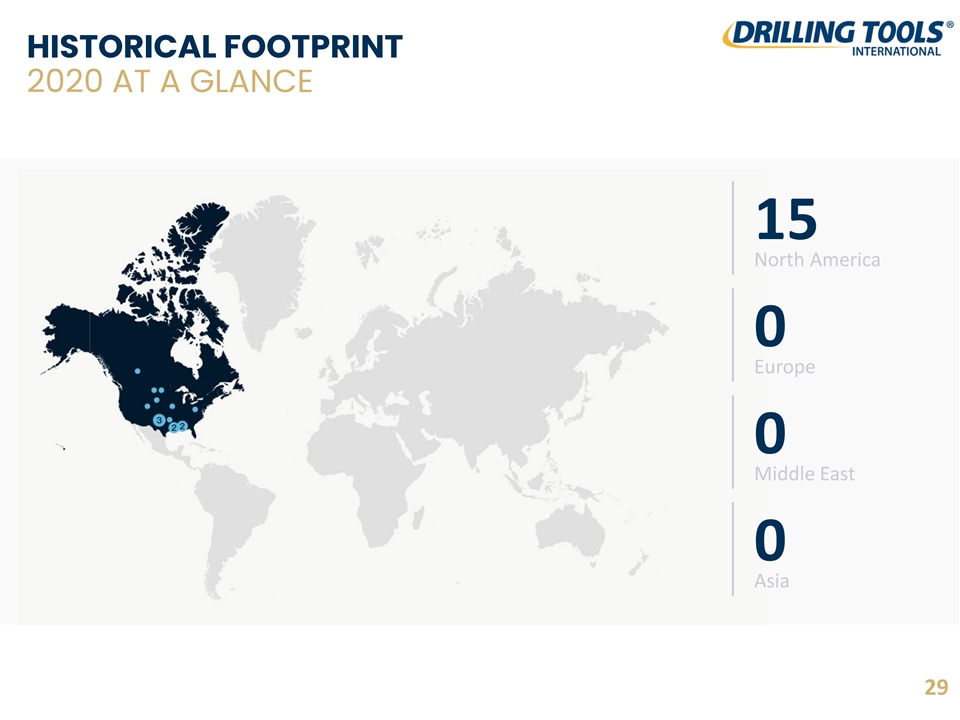
HISTORICAL FOOTPRINT 2020 AT A GLANCE 15 North America 0 Europe 0 Middle East 0 Asia 29
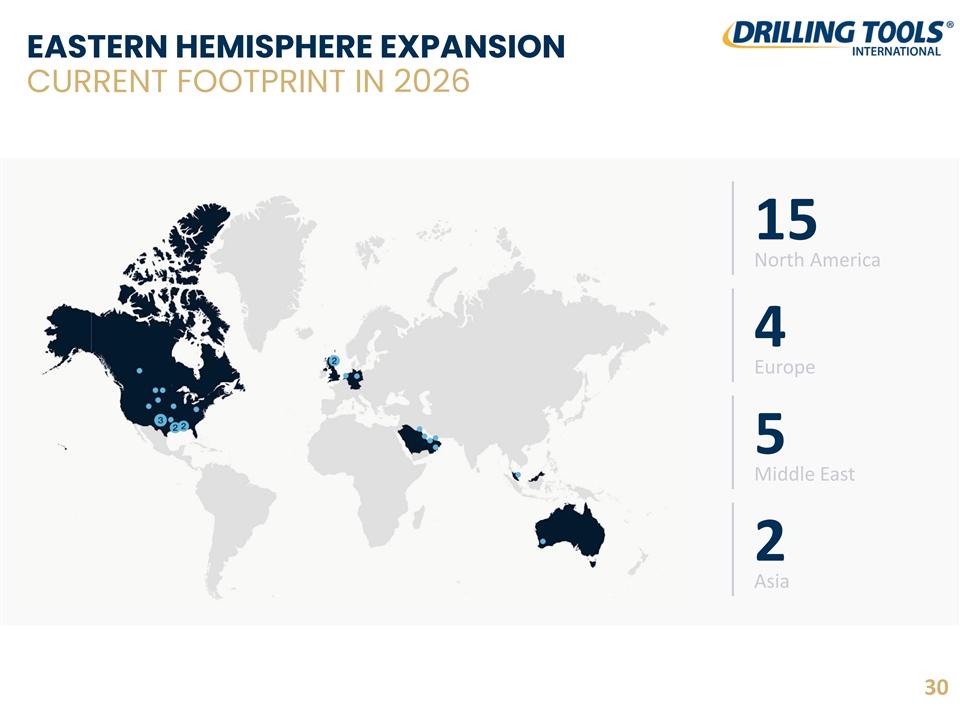
EASTERN HEMISPHERE EXPANSION CURRENT FOOTPRINT IN 2026 15 North America 4 Europe 5 Middle East 2 Asia 30
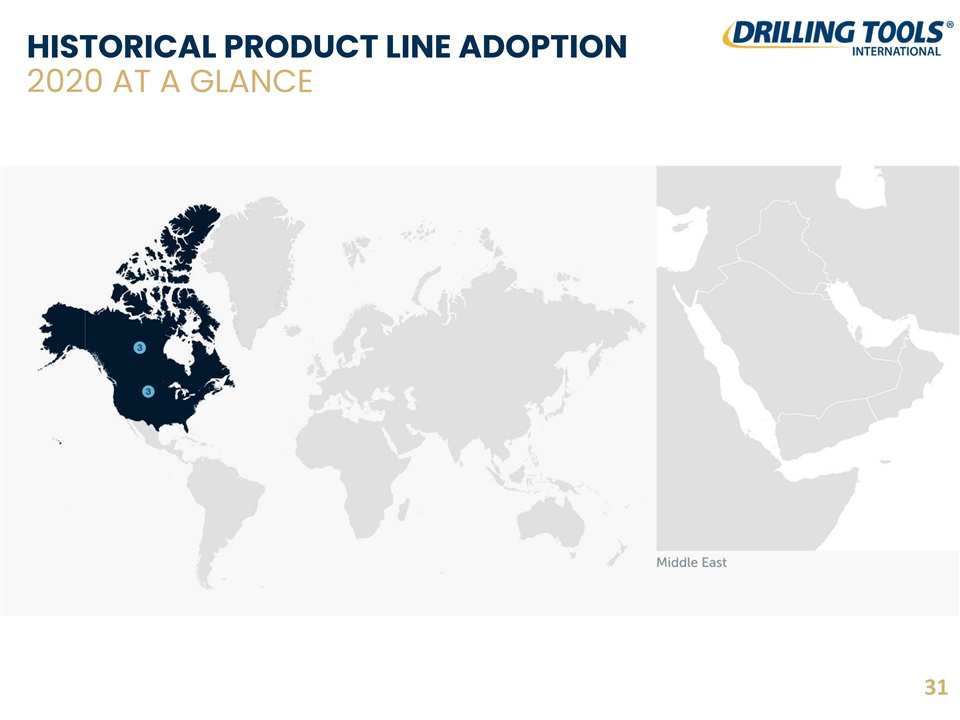
HISTORICAL PRODUCT LINE ADOPTION 2020 AT A GLANCE 31
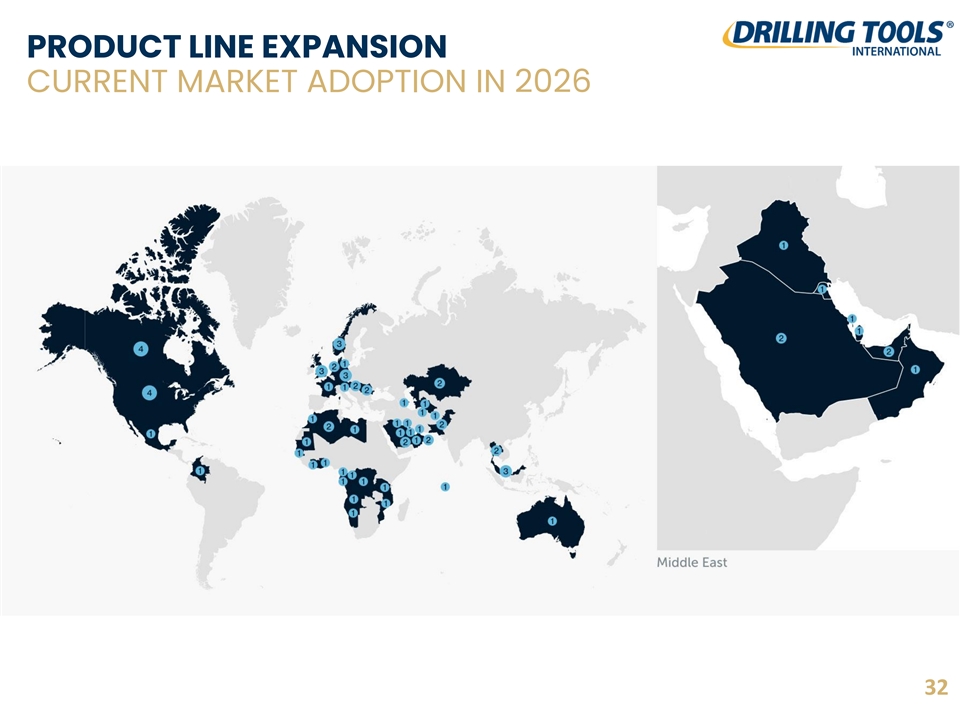
PRODUCT LINE EXPANSION CURRENT MARKET ADOPTION IN 2026 32
ESG & SAFETY ARE INTEGRAL TO OUR SUCCESS DTI is committed to environmental stewardship ✓ Continuous evaluations and control measures to ensure minimization of waste ✓ Pursuing highest levels of operational proficiency to reduce rework, and use of chemicals and waste Environmental ✓ Actively promoting recycling including extensive rental tool recycling and refurbishment programs & opportunities to redeploy equipment for energy transition markets such as geothermal, carbon capture and storage ✓ Identify and control exposures to limit potential injury and production Social interruptions or damages (+Safety) ✓ Continual contributions to local community events, charities and employee activities DTI’s leadership is focused on deriving long-term value for all stakeholders by: (1) ✓ Executive accountability through the election of an independent board Governance ✓ Strong internal controls 33 1) A majority of our directors are independent for the purposes of the applicable Nasdaq and Securities Exchange Commission rules.
FINANCIAL INFORMATION 34
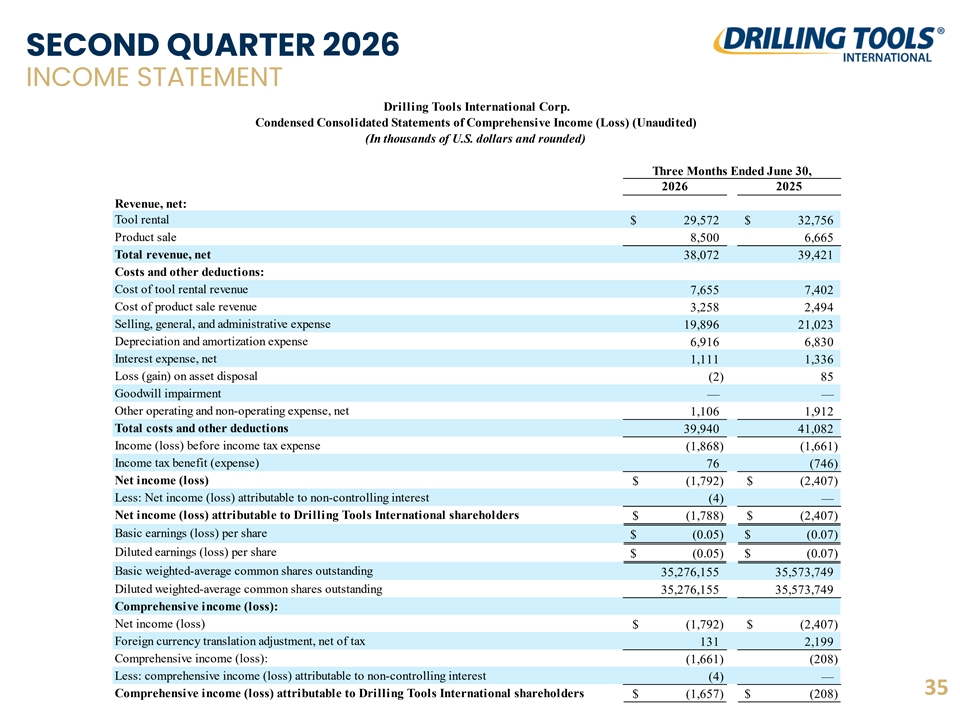
SECOND QUARTER 2026 INCOME STATEMENT Drilling Tools International Corp. Condensed Consolidated Statements of Comprehensive Income (Loss) (Unaudited) (In thousands of U.S. dollars and rounded) Three Months Ended June 30, 2026 2025 Revenue, net: Tool rental $ 2 9,572 $ 3 2,756 Product sale 8,500 6 ,665 Total revenue, net 3 8,072 39,421 Costs and other deductions: Cost of tool rental revenue 7 ,655 7 ,402 Cost of product sale revenue 3,258 2,494 Selling, general, and administrative expense 1 9,896 21,023 Depreciation and amortization expense 6 ,916 6 ,830 Interest expense, net 1,111 1 ,336 Loss (gain) on asset disposal (2) 85 Goodwill impairment — — Other operating and non-operating expense, net 1,106 1,912 Total costs and other deductions 39,940 4 1,082 Income (loss) before income tax expense ( 1,868) ( 1,661) Income tax benefit (expense) 76 (746) Net income (loss) $ ( 1,792) $ (2,407) Less: Net income (loss) attributable to non-controlling interest ( 4) — Net income (loss) attributable to Drilling Tools International shareholders $ (1,788) $ (2,407) Basic earnings (loss) per share $ ( 0.05) $ (0.07) Diluted earnings (loss) per share $ (0.05) $ (0.07) Basic weighted-average common shares outstanding 35,276,155 35,573,749 Diluted weighted-average common shares outstanding 35,276,155 3 5,573,749 Comprehensive income (loss): Net income (loss) $ (1,792) $ (2,407) Foreign currency translation adjustment, net of tax 131 2 ,199 Comprehensive income (loss): ( 1,661) ( 208) Less: comprehensive income (loss) attributable to non-controlling interest ( 4) — 35 Comprehensive income (loss) attributable to Drilling Tools International shareholders $ (1,657) $ ( 208)
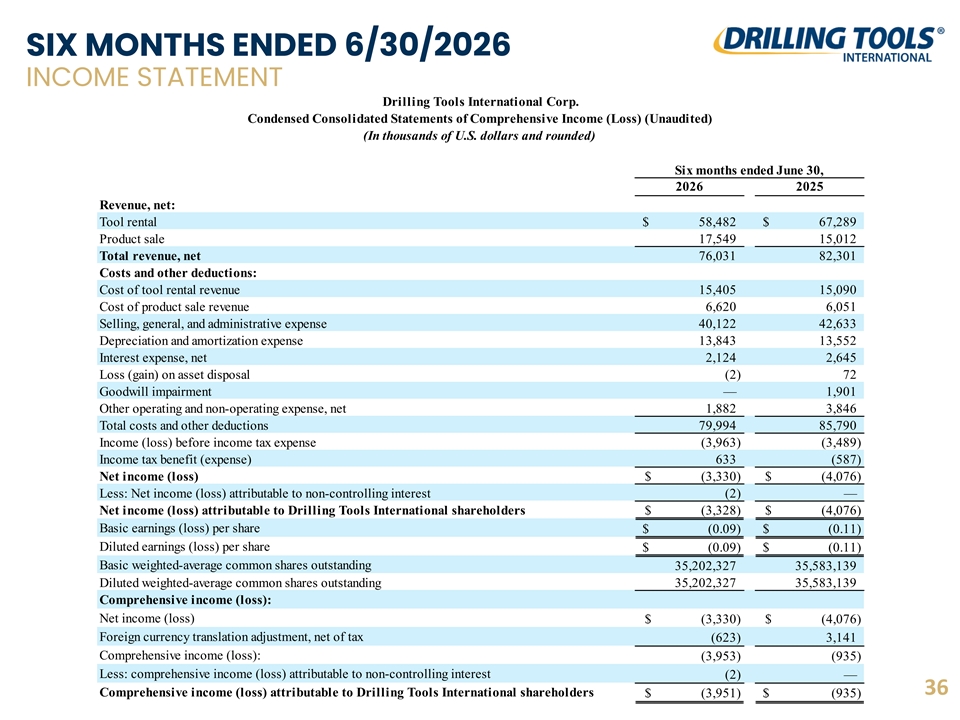
SIX MONTHS ENDED 6/30/2026 INCOME STATEMENT Drilling Tools International Corp. Condensed Consolidated Statements of Comprehensive Income (Loss) (Unaudited) (In thousands of U.S. dollars and rounded) Six months ended June 30, 2026 2025 Revenue, net: Tool rental $ 58,482 $ 6 7,289 Product sale 17,549 15,012 Total revenue, net 76,031 82,301 Costs and other deductions: Cost of tool rental revenue 15,405 1 5,090 Cost of product sale revenue 6 ,620 6,051 Selling, general, and administrative expense 40,122 4 2,633 Depreciation and amortization expense 1 3,843 13,552 Interest expense, net 2,124 2 ,645 Loss (gain) on asset disposal ( 2) 72 Goodwill impairment — 1,901 Other operating and non-operating expense, net 1 ,882 3 ,846 Total costs and other deductions 7 9,994 85,790 Income (loss) before income tax expense (3,963) (3,489) Income tax benefit (expense) 633 (587) Net income (loss) $ (3,330) $ ( 4,076) Less: Net income (loss) attributable to non-controlling interest ( 2) — Net income (loss) attributable to Drilling Tools International shareholders $ (3,328) $ (4,076) Basic earnings (loss) per share $ ( 0.09) $ (0.11) Diluted earnings (loss) per share $ ( 0.09) $ (0.11) Basic weighted-average common shares outstanding 3 5,202,327 3 5,583,139 Diluted weighted-average common shares outstanding 35,202,327 35,583,139 Comprehensive income (loss): Net income (loss) $ (3,330) $ ( 4,076) Foreign currency translation adjustment, net of tax (623) 3,141 Comprehensive income (loss): (3,953) ( 935) Less: comprehensive income (loss) attributable to non-controlling interest (2) — 36 Comprehensive income (loss) attributable to Drilling Tools International shareholders $ (3,951) $ (935)
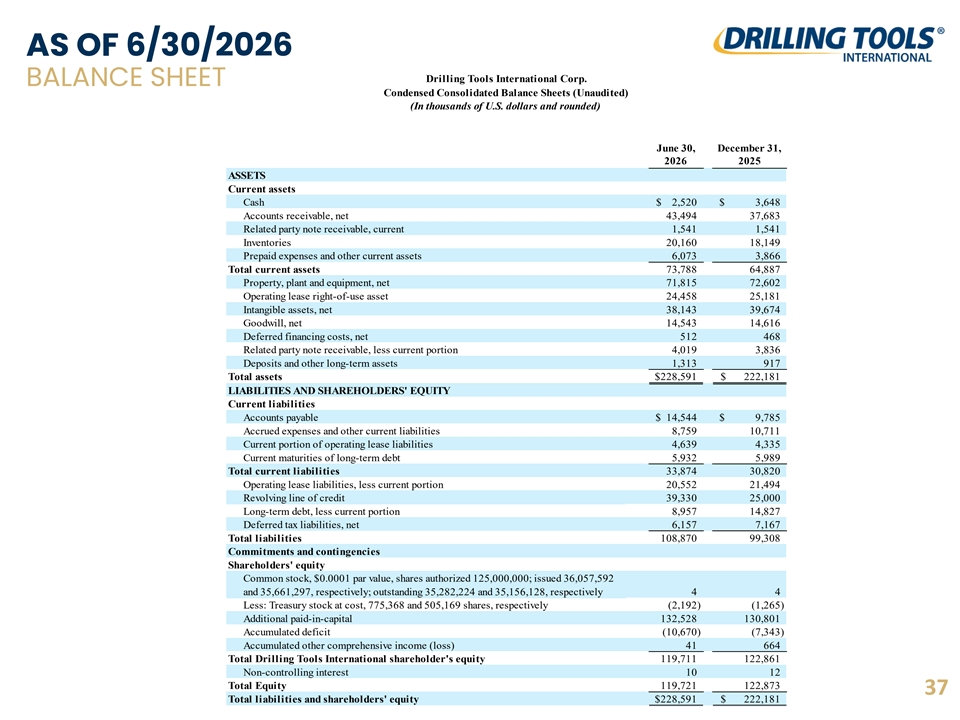
AS OF 6/30/2026 Drilling Tools International Corp. BALANCE SHEET Condensed Consolidated Balance Sheets (Unaudited) (In thousands of U.S. dollars and rounded) June 30, December 31, 2026 2025 ASSETS Current assets Cash $ 2,520 $ 3,648 Accounts receivable, net 43,494 37,683 Related party note receivable, current 1,541 1,541 Inventories 20,160 1 8,149 Prepaid expenses and other current assets 6,073 3 ,866 Total current assets 73,788 64,887 Property, plant and equipment, net 71,815 7 2,602 Operating lease right-of-use asset 2 4,458 25,181 Intangible assets, net 38,143 3 9,674 Goodwill, net 1 4,543 14,616 Deferred financing costs, net 512 468 Related party note receivable, less current portion 4 ,019 3 ,836 Deposits and other long-term assets 1,313 917 Total assets $ 228,591 $ 222,181 LIABILITIES AND SHAREHOLDERS' EQUITY Current liabilities Accounts payable $ 14,544 $ 9 ,785 Accrued expenses and other current liabilities 8 ,759 1 0,711 Current portion of operating lease liabilities 4 ,639 4,335 Current maturities of long-term debt 5 ,932 5,989 Total current liabilities 33,874 3 0,820 Operating lease liabilities, less current portion 20,552 21,494 Revolving line of credit 39,330 25,000 Long-term debt, less current portion 8,957 1 4,827 Deferred tax liabilities, net 6,157 7 ,167 Total liabilities 108,870 99,308 Commitments and contingencies Shareholders' equity Common stock, $0.0001 par value, shares authorized 125,000,000; issued 36,057,592 and 35,661,297, respectively; outstanding 35,282,224 and 35,156,128, respectively 4 4 Less: Treasury stock at cost, 775,368 and 505,169 shares, respectively (2,192) ( 1,265) Additional paid-in-capital 1 32,528 130,801 Accumulated deficit (10,670) (7,343) Accumulated other comprehensive income (loss) 41 664 Total Drilling Tools International shareholder's equity 119,711 122,861 Non-controlling interest 10 12 Total Equity 119,721 122,873 37 Total liabilities and shareholders' equity $ 228,591 $ 222,181
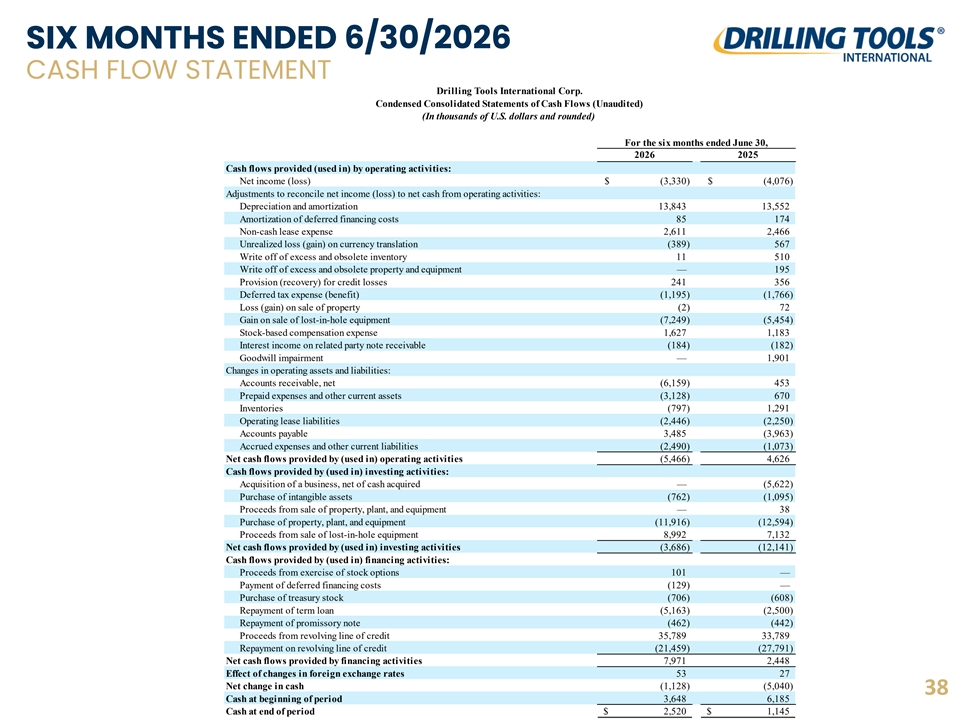
SIX MONTHS ENDED 6/30/2026 CASH FLOW STATEMENT Drilling Tools International Corp. Condensed Consolidated Statements of Cash Flows (Unaudited) (In thousands of U.S. dollars and rounded) For the six months ended June 30, 2026 2025 Cash flows provided (used in) by operating activities: Net income (loss) $ (3,330) $ (4,076) Adjustments to reconcile net income (loss) to net cash from operating activities: Depreciation and amortization 1 3,843 13,552 Amortization of deferred financing costs 85 174 Non-cash lease expense 2 ,611 2 ,466 Unrealized loss (gain) on currency translation ( 389) 567 Write off of excess and obsolete inventory 11 510 Write off of excess and obsolete property and equipment — 195 Provision (recovery) for credit losses 241 356 Deferred tax expense (benefit) ( 1,195) (1,766) Loss (gain) on sale of property ( 2) 72 Gain on sale of lost-in-hole equipment ( 7,249) (5,454) Stock-based compensation expense 1 ,627 1,183 Interest income on related party note receivable (184) ( 182) Goodwill impairment — 1,901 Changes in operating assets and liabilities: Accounts receivable, net (6,159) 453 Prepaid expenses and other current assets ( 3,128) 670 Inventories ( 797) 1 ,291 Operating lease liabilities ( 2,446) (2,250) Accounts payable 3 ,485 (3,963) Accrued expenses and other current liabilities (2,490) ( 1,073) Net cash flows provided by (used in) operating activities (5,466) 4,626 Cash flows provided by (used in) investing activities: Acquisition of a business, net of cash acquired — (5,622) Purchase of intangible assets ( 762) (1,095) Proceeds from sale of property, plant, and equipment — 38 Purchase of property, plant, and equipment (11,916) (12,594) Proceeds from sale of lost-in-hole equipment 8,992 7,132 Net cash flows provided by (used in) investing activities (3,686) (12,141) Cash flows provided by (used in) financing activities: Proceeds from exercise of stock options 101 — Payment of deferred financing costs (129) — Purchase of treasury stock ( 706) (608) Repayment of term loan (5,163) ( 2,500) Repayment of promissory note (462) (442) Proceeds from revolving line of credit 35,789 33,789 Repayment on revolving line of credit ( 21,459) (27,791) Net cash flows provided by financing activities 7,971 2,448 Effect of changes in foreign exchange rates 53 27 Net change in cash (1,128) (5,040) 38 Cash at beginning of period 3,648 6,185 Cash at end of period $ 2,520 $ 1 ,145
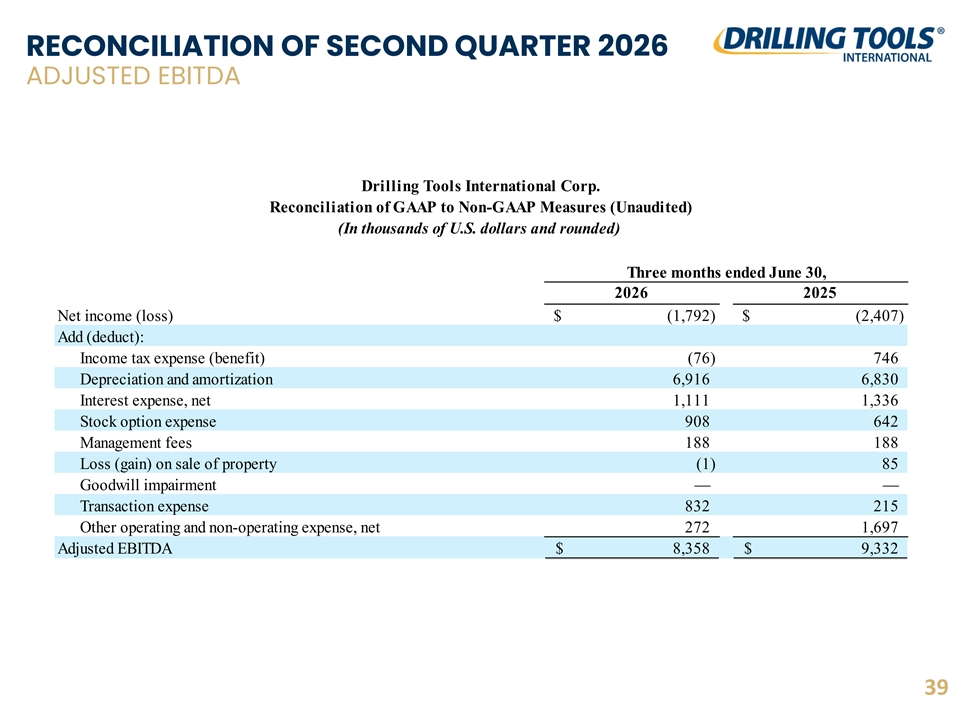
RECONCILIATION OF SECOND QUARTER 2026 ADJUSTED EBITDA Drilling Tools International Corp. Reconciliation of GAAP to Non-GAAP Measures (Unaudited) (In thousands of U.S. dollars and rounded) Three months ended June 30, 2026 2025 Net income (loss) $ ( 1,792) $ ( 2,407) Add (deduct): Income tax expense (benefit) ( 76) 746 Depreciation and amortization 6,916 6,830 Interest expense, net 1,111 1 ,336 Stock option expense 908 642 Management fees 188 188 Loss (gain) on sale of property ( 1) 85 Goodwill impairment — — Transaction expense 832 215 Other operating and non-operating expense, net 272 1 ,697 Adjusted EBITDA $ 8,358 $ 9 ,332 39
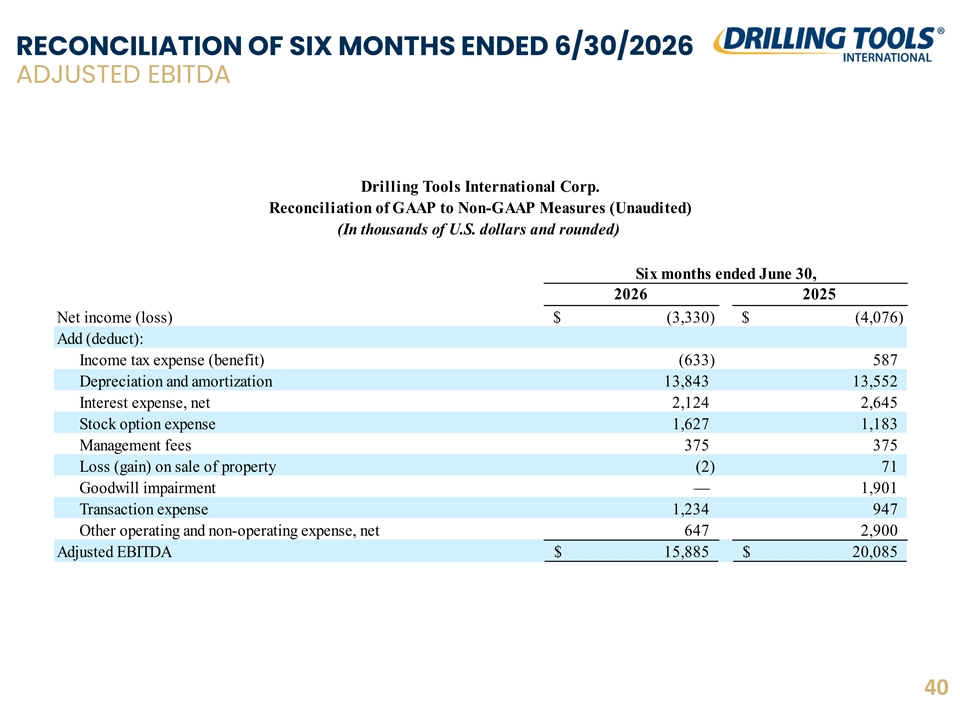
RECONCILIATION OF SIX MONTHS ENDED 6/30/2026 ADJUSTED EBITDA Drilling Tools International Corp. Reconciliation of GAAP to Non-GAAP Measures (Unaudited) (In thousands of U.S. dollars and rounded) Six months ended June 30, 2026 2025 Net income (loss) $ ( 3,330) $ ( 4,076) Add (deduct): Income tax expense (benefit) (633) 587 Depreciation and amortization 13,843 13,552 Interest expense, net 2 ,124 2 ,645 Stock option expense 1 ,627 1,183 Management fees 375 375 Loss (gain) on sale of property (2) 71 Goodwill impairment — 1,901 Transaction expense 1 ,234 947 Other operating and non-operating expense, net 647 2,900 Adjusted EBITDA $ 1 5,885 $ 2 0,085 40
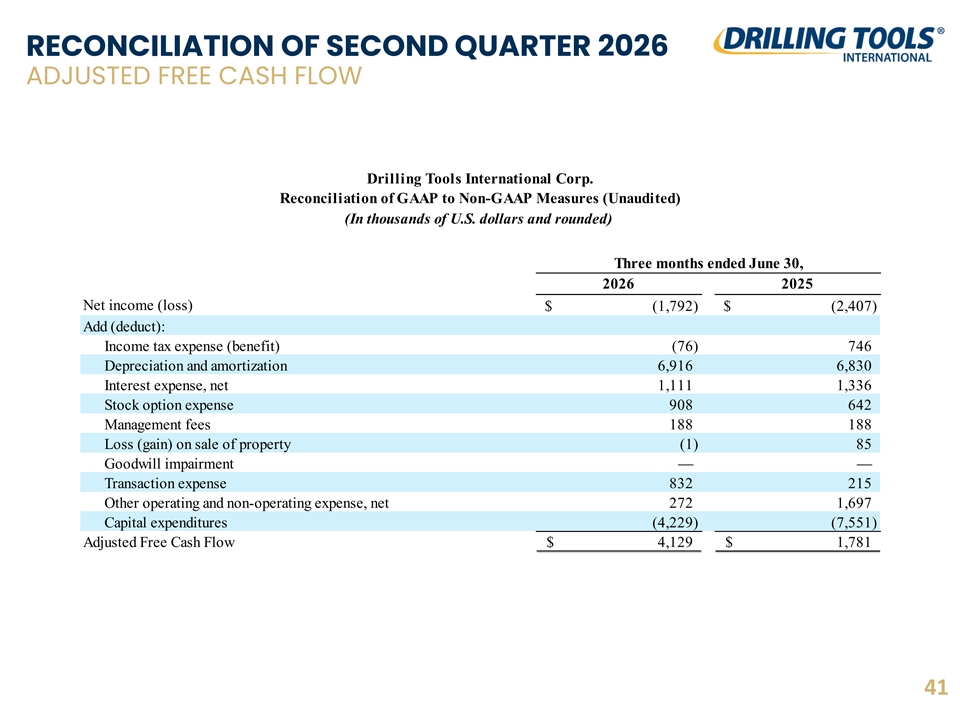
RECONCILIATION OF SECOND QUARTER 2026 ADJUSTED FREE CASH FLOW Drilling Tools International Corp. Reconciliation of GAAP to Non-GAAP Measures (Unaudited) (In thousands of U.S. dollars and rounded) Three months ended June 30, 2026 2025 Net income (loss) $ ( 1,792) $ ( 2,407) Add (deduct): Income tax expense (benefit) ( 76) 746 Depreciation and amortization 6,916 6 ,830 Interest expense, net 1,111 1 ,336 Stock option expense 908 642 Management fees 188 188 Loss (gain) on sale of property (1) 85 Goodwill impairment — — Transaction expense 832 215 Other operating and non-operating expense, net 272 1,697 Capital expenditures (4,229) (7,551) Adjusted Free Cash Flow $ 4,129 $ 1,781 41
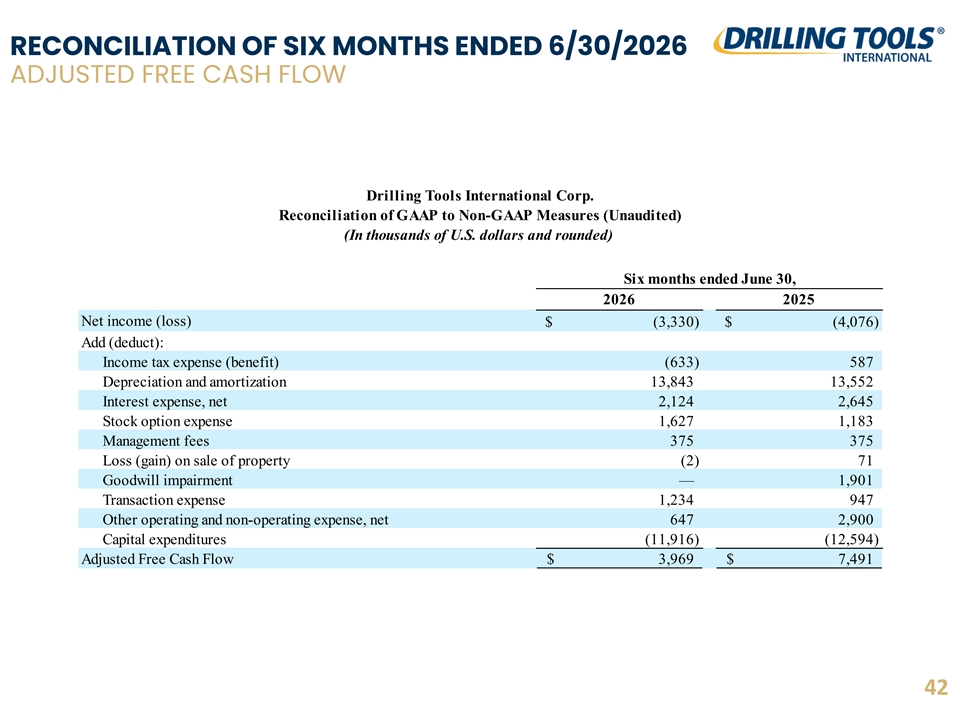
RECONCILIATION OF SIX MONTHS ENDED 6/30/2026 ADJUSTED FREE CASH FLOW Drilling Tools International Corp. Reconciliation of GAAP to Non-GAAP Measures (Unaudited) (In thousands of U.S. dollars and rounded) Six months ended June 30, 2026 2025 Net income (loss) $ ( 3,330) $ ( 4,076) Add (deduct): Income tax expense (benefit) (633) 587 Depreciation and amortization 13,843 13,552 Interest expense, net 2 ,124 2 ,645 Stock option expense 1,627 1,183 Management fees 375 375 Loss (gain) on sale of property (2) 71 Goodwill impairment — 1,901 Transaction expense 1 ,234 947 Other operating and non-operating expense, net 647 2,900 Capital expenditures ( 11,916) (12,594) Adjusted Free Cash Flow $ 3,969 $ 7,491 42
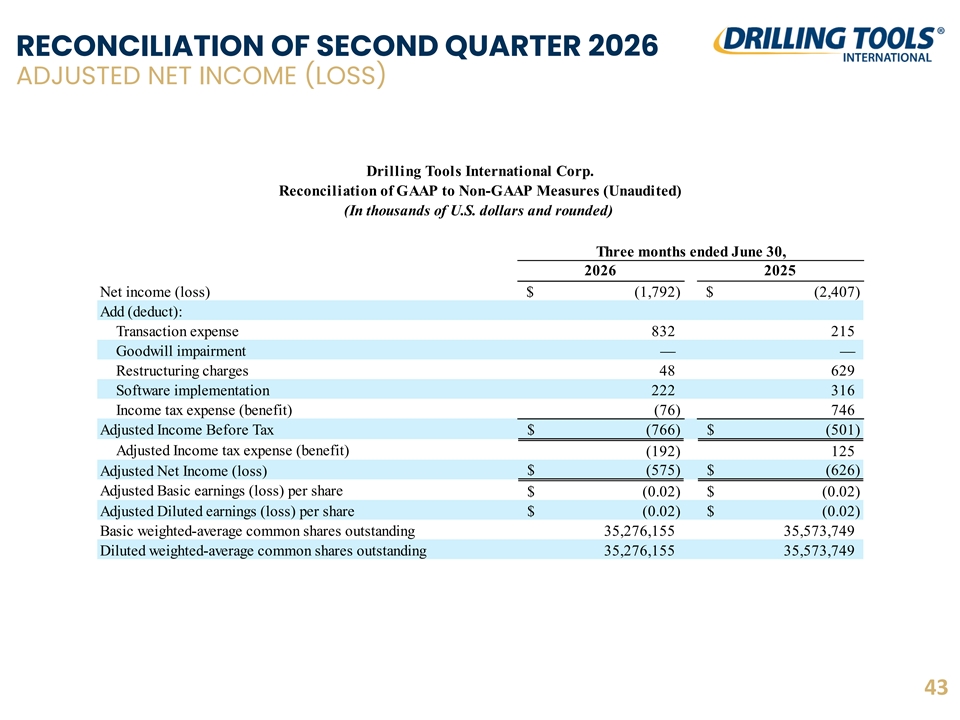
RECONCILIATION OF SECOND QUARTER 2026 ADJUSTED NET INCOME (LOSS) Drilling Tools International Corp. Reconciliation of GAAP to Non-GAAP Measures (Unaudited) (In thousands of U.S. dollars and rounded) Three months ended June 30, 2026 2025 Net income (loss) $ ( 1,792) $ ( 2,407) Add (deduct): Transaction expense 832 215 Goodwill impairment — — Restructuring charges 48 629 Software implementation 222 316 Income tax expense (benefit) ( 76) 746 Adjusted Income Before Tax $ ( 766) $ ( 501) Adjusted Income tax expense (benefit) ( 192) 125 $ ( 575) $ (626) Adjusted Net Income (loss) Adjusted Basic earnings (loss) per share $ ( 0.02) $ ( 0.02) Adjusted Diluted earnings (loss) per share $ ( 0.02) $ ( 0.02) Basic weighted-average common shares outstanding 35,276,155 35,573,749 Diluted weighted-average common shares outstanding 35,276,155 35,573,749 43
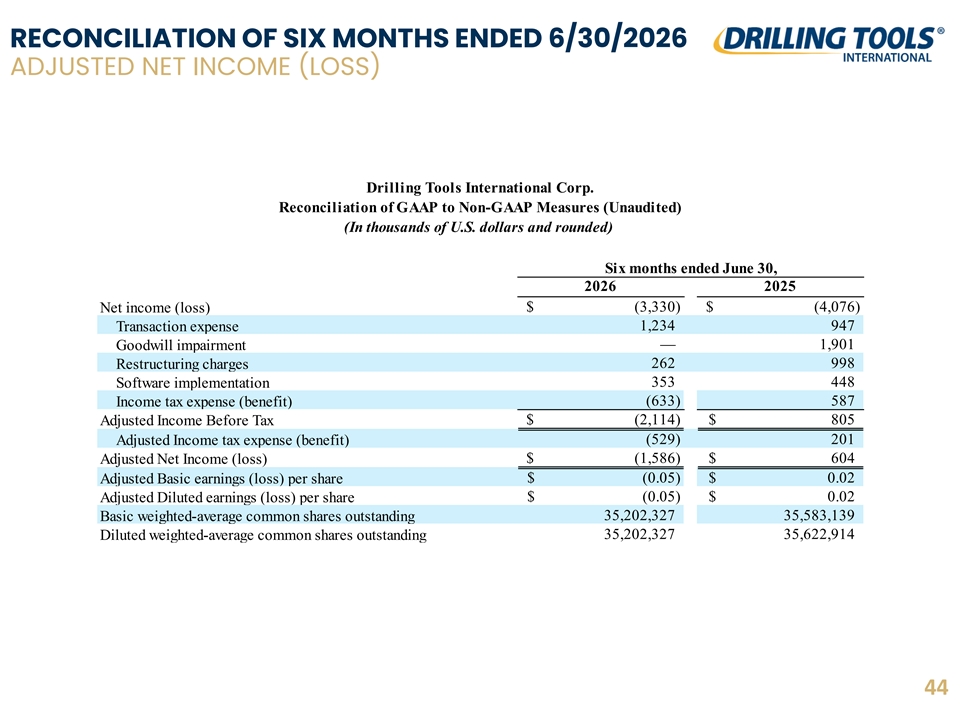
RECONCILIATION OF SIX MONTHS ENDED 6/30/2026 ADJUSTED NET INCOME (LOSS) Drilling Tools International Corp. Reconciliation of GAAP to Non-GAAP Measures (Unaudited) (In thousands of U.S. dollars and rounded) Six months ended June 30, 2026 2025 $ ( 3,330) $ ( 4,076) Net income (loss) 1 ,234 947 Transaction expense — 1,901 Goodwill impairment 262 998 Restructuring charges 353 448 Software implementation (633) 587 Income tax expense (benefit) $ ( 2,114) $ 805 Adjusted Income Before Tax ( 529) 201 Adjusted Income tax expense (benefit) $ (1,586) $ 604 Adjusted Net Income (loss) $ (0.05) $ 0 .02 Adjusted Basic earnings (loss) per share $ ( 0.05) $ 0.02 Adjusted Diluted earnings (loss) per share 35,202,327 35,583,139 Basic weighted-average common shares outstanding 3 5,202,327 35,622,914 Diluted weighted-average common shares outstanding 44
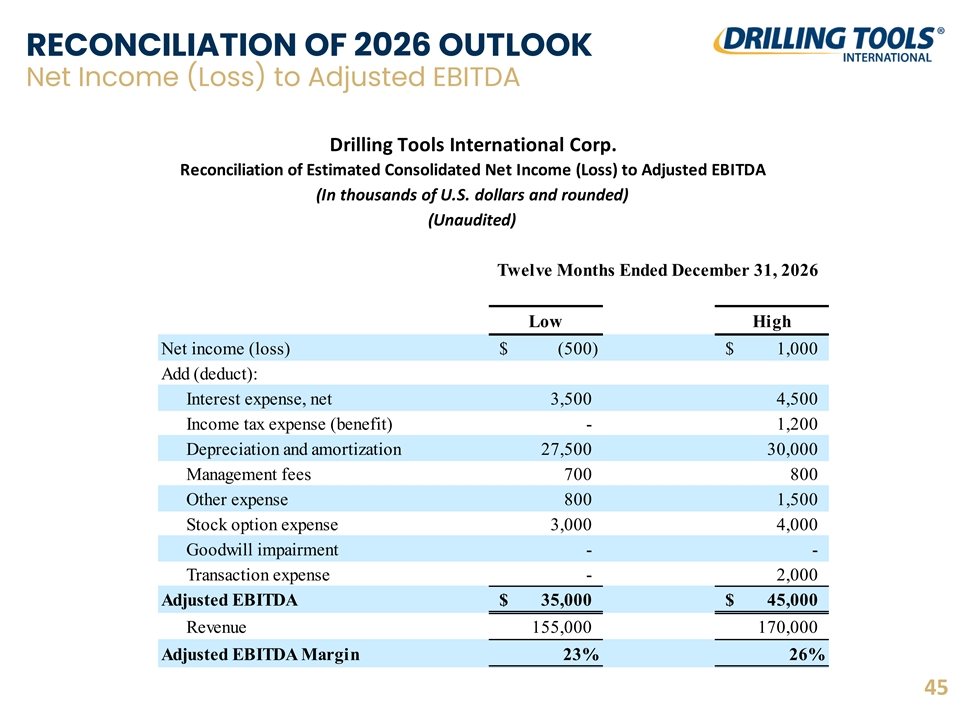
RECONCILIATION OF 2026 OUTLOOK Net Income (Loss) to Adjusted EBITDA Drilling Tools International Corp. Reconciliation of Estimated Consolidated Net Income (Loss) to Adjusted EBITDA (In thousands of U.S. dollars and rounded) (Unaudited) Twelve Months Ended December 31, 2026 Low High Net income (loss) $ (500) $ 1 ,000 Add (deduct): Interest expense, net 3,500 4,500 Income tax expense (benefit) - 1,200 Depreciation and amortization 27,500 30,000 Management fees 700 800 Other expense 800 1,500 Stock option expense 3,000 4,000 Goodwill impairment - - Transaction expense - 2,000 Adjusted EBITDA $ 35,000 $ 45,000 Revenue 155,000 170,000 Adjusted EBITDA Margin 23% 26% 45
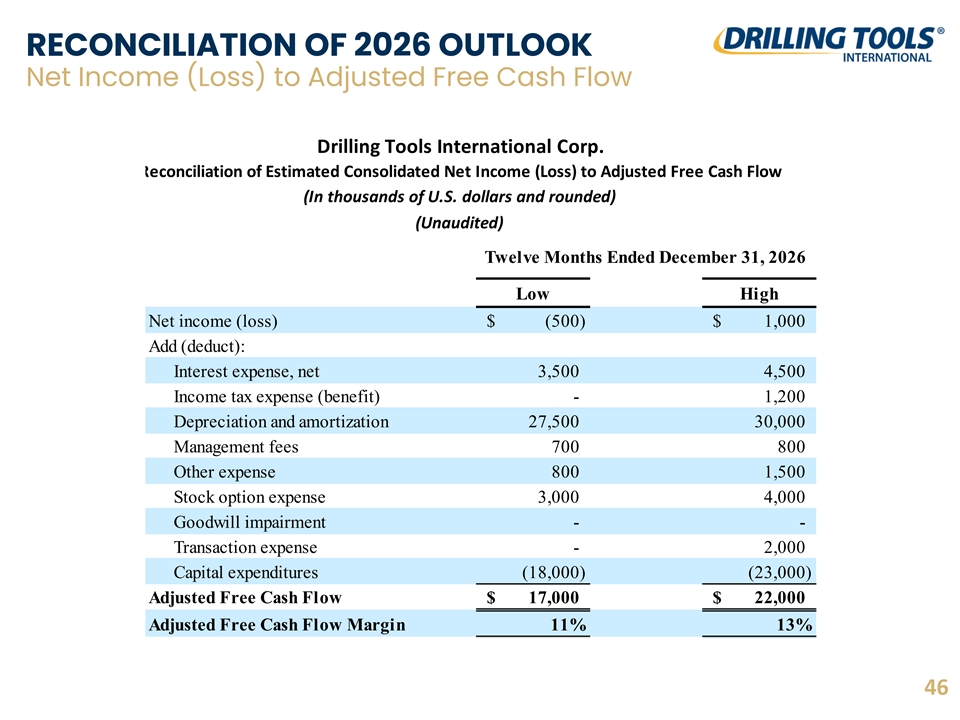
RECONCILIATION OF 2026 OUTLOOK Net Income (Loss) to Adjusted Free Cash Flow Drilling Tools International Corp. Reconciliation of Estimated Consolidated Net Income (Loss) to Adjusted Free Cash Flow (In thousands of U.S. dollars and rounded) (Unaudited) Twelve Months Ended December 31, 2026 Low High Net income (loss) $ (500) $ 1 ,000 Add (deduct): Interest expense, net 3,500 4,500 Income tax expense (benefit) - 1,200 Depreciation and amortization 27,500 3 0,000 Management fees 700 800 Other expense 800 1,500 Stock option expense 3,000 4,000 Goodwill impairment - - Transaction expense - 2,000 Capital expenditures (18,000) (23,000) Adjusted Free Cash Flow $ 17,000 $ 22,000 Adjusted Free Cash Flow Margin 11% 13% 46