
We power the Experience Economy Enabling businesses to deliver the Moments that Matter Q2 2026 Shareholder Letter | Investors.shift4.com Exhibit 99.1
2 Non-GAAP Financial Measures and Key Performance Indicators Forward-Looking Statements We use supplemental measures of our performance which are derived from our consolidated financial information but which are not presented in our consolidated financial statements prepared in accordance with U.S. generally accepted accounting principles ("GAAP"). These non-GAAP financial measures include: gross revenue less network fees, which includes interchange and adjustment fees; non-GAAP net income; non-GAAP EPS; free cash flow; Adjusted Free Cash Flow; earnings before interest expense, interest income, income taxes, depreciation, and amortization (“EBITDA”); Adjusted EBITDA; Adjusted EBITDA conversion rate; and Adjusted EBITDA margin. Gross revenue less network fees ("GRLNF"), including total and organic, represents a key performance metric that management uses to measure changes in the mix and value derived from our customer base as we continue to execute our strategy to expand our reach to serve larger, complex merchants. Non-GAAP net income represents net income adjusted for certain non-cash and other nonrecurring items that management believes are not indicative of ongoing operations, such as amortization of acquired intangible assets, acquisition, restructuring and integration costs, revaluation of contingent liabilities, gain on sale of subsidiaries, impairment of intangible assets, loss on extinguishment of debt, gain (loss) on investments in securities, change in TRA liability, equity-based compensation, and foreign exchange and other nonrecurring items. Adjusted EBITDA is the primary financial performance measure used by management to evaluate its business and monitor results of operations. Adjusted EBITDA represents EBITDA further adjusted for certain non-cash and other nonrecurring items that management believes are not indicative of ongoing operations. These adjustments include acquisition, restructuring and integration costs, revaluation of contingent liabilities, gain on sale of subsidiaries, impairment of intangible assets, loss on extinguishment of debt, gain (loss) on investments in securities, change in TRA liability, equity-based compensation, and foreign exchange and other nonrecurring items. Adjusted EBITDA Margin represents Adjusted EBITDA divided by GRLNF. Free cash flow represents net cash provided by operating activities adjusted for certain non-discretionary capital expenditures. Adjusted Free Cash Flow represents free cash flow further adjusted for certain transactions that are not indicative of future operating cash flows, including acquisition, restructuring and integration costs, other nonrecurring expenses, and nonrecurring strategic capital expenditures that are not indicative of ongoing activities. We believe Adjusted Free Cash Flow is useful to measure the funds generated in a given period that are available to invest in the business, to repurchase stock and to make strategic decisions. The Adjusted EBITDA conversion rate is calculated as Adjusted Free Cash Flow divided by Adjusted EBITDA. We use non-GAAP financial measures to supplement financial information presented on a GAAP basis. We believe that excluding certain items from our GAAP results allows management to better understand our consolidated financial performance and, in the case of Adjusted Free Cash Flow, our liquidity, from period to period and better project our future consolidated financial performance as forecasts are developed at a level of detail different from that used to prepare GAAP-based financial measures. Moreover, we believe these non-GAAP financial measures provide our stakeholders with useful information to help them evaluate our operating results by facilitating an enhanced understanding of our operating performance and, in the case of Adjusted Free Cash Flow, our liquidity, and enabling them to make more meaningful period to period comparisons. There are limitations to the use of the non-GAAP financial measures presented in this letter. Our non-GAAP financial measures may not be comparable to similarly titled measures of other companies. Other companies, including companies in our industry, may calculate non-GAAP financial measures differently than we do, limiting the usefulness of those measures for comparative purposes. The non-GAAP financial measures are not meant to be considered as indicators of performance, or in the case of Adjusted Free Cash Flow, as an indicator of liquidity, in isolation from or as a substitute for financial information prepared in accordance with GAAP, and should be read only in conjunction with financial information presented on a GAAP basis. Reconciliations of EBITDA, Adjusted EBITDA, GRLNF, Non-GAAP net income, Non-GAAP EPS, free cash flow and Adjusted Free Cash Flow to, in each case, its most directly comparable GAAP financial measure are presented in Appendix - Financial Information. For 2026, we are unable to provide a reconciliation of GRLNF, Adjusted EBITDA, Adjusted Free Cash Flow and Non-GAAP EPS to Gross Profit, Net Income, net cash provided by operating activities, and net income (loss) per Class A and C share, respectively, the nearest comparable GAAP measures, without unreasonable efforts. We encourage you to review the reconciliations in conjunction with the presentation of the non-GAAP financial measures for each of the periods presented. In future fiscal periods, we may exclude such items and may incur income and expenses similar to these excluded items. In addition, key performance indicators include volume, Blended Spread and margin. Volume is defined as the total dollar amount of payments that we deliver for settlement on behalf of our merchants. Included in volume are dollars routed via our international payments platform, alternative payment methods, including cryptocurrency, stored value, gift cards and stock donations, plus volume we route to third party merchant acquirers on behalf of strategic enterprise merchant relationships. We do maintain transaction processing on certain legacy platforms that are not defined as volume. Blended Spread represents the average yield Shift4 earns on the average volume processed for a given period after network fees. Blended Spread is calculated as payments-based revenue less gateway revenue and network fees for a given period divided by the volume processed for the same period. This letter contains forward-looking statements within the meaning of the Private Securities Litigation Reform Act of 1995. Shift4 Payments, Inc. (“we,” “our,” the “Company,” or “Shift4”) intends such forward-looking statements to be covered by the safe harbor provisions for forward-looking statements contained in Section 27A of the Securities Act of 1933, as amended and Section 21E of the Securities Exchange Act of 1934, as amended. All statements contained in this letter, other than statements of historical fact, including, without limitation, statements relating to our position as a leader within our industry; our future results of operations and financial position, status of our growth algorithm, business strategy and plans; the anticipated benefits of and costs associated with recent acquisitions; objectives of management for future operations and activities, including, among others, statements regarding expected growth, international expansion, including expansion of Shift4One in 15 countries by year end, macroeconomic factors and their impacts on our business, future capital expenditures, debt covenant compliance, financing activities, debt service obligations, the Simplification Transactions, the Company Benefits, future negotiations with our Founder, our financial outlook and guidance for the third quarter, fourth quarter, and full year 2026 or any other period, including key performance indicators, anticipated synergies and financial results as a result of the Global Blue acquisition, and the timing of any of the foregoing are forward-looking statements. In some cases, you can identify forward-looking statements by terms such as “may,” “will,” “should,” “expect,” “plan,” “anticipate,” “could,” “intend,” “target,” “project,” “contemplate,” “believe,” “estimate,” “predict,” “potential,” or “continue” or the negative of these terms or other similar expressions, though not all forward-looking statements can be identified by such terms or expressions. We have based these forward-looking statements largely on our current expectations and projections about future events and financial trends that we believe may affect our business, financial condition and results of operations. These forward-looking statements speak only as of the date of this letter. These statements are neither promises nor guarantees, but involve known and unknown risks, uncertainties and other important factors that may cause our actual results, performance or achievements to be materially different from any future results, performance or achievements expressed or implied by the forward-looking statements, including, but not limited to, the following: We use supplemental measures of our performance which are derived from our consolidated financial information but which are not presented in our consolidated financial statements prepared in accordance with U.S. generally accepted accounting principles ("GAAP"). These non-GAAP financial measures include: gross revenue less network fees, which includes interchange and adjustment fees; non-GAAP net income; non-GAAP EPS; free cash flow; Adjusted Free Cash Flow; earnings before interest expense, interest income, income taxes, depreciation, and amortization (“EBITDA”); Adjusted EBITDA; Adjusted EBITDA conversion rate; and Adjusted EBITDA margin. Gross revenue less network fees ("GRLNF"), including total and organic, represents a key performance metric that management uses to measure changes in the mix and value derived from our customer base as we continue to execute our strategy to expand our reach to serve larger, complex merchants. Non-GAAP net income represents net income adjusted for certain non-cash and other nonrecurring items that management believes are not indicative of ongoing operations, such as amortization of acquired intangible assets, acquisition, restructuring and integration costs, revaluation of contingent liabilities, gain on sale of subsidiaries, impairment of intangible assets, loss on extinguishment of debt, gain (loss) on investments in securities, change in TRA liability, equity-based compensation, and foreign exchange and other nonrecurring items. Adjusted EBITDA is the primary financial performance measure used by management to evaluate its business and monitor results of operations. Adjusted EBITDA represents EBITDA further adjusted for certain non-cash and other nonrecurring items that management believes are not indicative of ongoing operations. These adjustments include acquisition, restructuring and integration costs, revaluation of contingent liabilities, gain on sale of subsidiaries, impairment of intangible assets, loss on extinguishment of debt, gain (loss) on investments in securities, change in TRA liability, equity-based compensation, and foreign exchange and other nonrecurring items. Adjusted EBITDA Margin represents Adjusted EBITDA divided by GRLNF. Free cash flow represents net cash provided by operating activities adjusted for certain non-discretionary capital expenditures. Adjusted Free Cash Flow represents free cash flow further adjusted for certain transactions that are not indicative of future operating cash flows, including acquisition, restructuring and integration costs, other nonrecurring expenses, and nonrecurring strategic capital expenditures that are not indicative of ongoing activities. We believe Adjusted Free Cash Flow is useful to measure the funds generated in a given period that are available to invest in the business, to repurchase stock and to make strategic decisions. The Adjusted EBITDA conversion rate is calculated as Adjusted Free Cash Flow divided by Adjusted EBITDA. We use non-GAAP financial measures to supplement financial information presented on a GAAP basis. We believe that excluding certain items from our GAAP results allows management to better understand our consolidated financial performance and, in the case of Adjusted Free Cash Flow, our liquidity, from period to period and better project our future consolidated financial performance as forecasts are developed at a level of detail different from that used to prepare GAAP-based financial measures. Moreover, we believe these non-GAAP financial measures provide our stakeholders with useful information to help them evaluate our operating results by facilitating an enhanced understanding of our operating performance and, in the case of Adjusted Free Cash Flow, our liquidity, and enabling them to make more meaningful period to period comparisons. There are limitations to the use of the non-GAAP financial measures presented in this letter. Our non-GAAP financial measures may not be comparable to similarly titled measures of other companies. Other companies, including companies in our industry, may calculate non-GAAP financial measures differently than we do, limiting the usefulness of those measures for comparative purposes. The non-GAAP financial measures are not meant to be considered as indicators of performance, or in the case of Adjusted Free Cash Flow, as an indicator of liquidity, in isolation from or as a substitute for financial information prepared in accordance with GAAP, and should be read only in conjunction with financial information presented on a GAAP basis. Reconciliations of EBITDA, Adjusted EBITDA, GRLNF, Non-GAAP net income, Non-GAAP EPS, free cash flow and Adjusted Free Cash Flow to, in each case, its most directly comparable GAAP financial measure are presented in Appendix - Financial Information. For 2026, we are unable to provide a reconciliation of GRLNF, Adjusted EBITDA, Adjusted Free Cash Flow and Non-GAAP EPS to Gross Profit, Net Income, net cash provided by operating activities, and net income per Class A and C share, respectively, the nearest comparable GAAP measures, without unreasonable efforts. We encourage you to review the reconciliations in conjunction with the presentation of the non-GAAP financial measures for each of the periods presented. In future fiscal periods, we may exclude such items and may incur income and expenses similar to these excluded items. In addition, key performance indicators include volume, Blended Spread and margin. Volume is defined as the total dollar amount of payments that we deliver for settlement on behalf of our merchants. Included in volume are dollars routed via our international payments platform, alternative payment methods, including cryptocurrency, stored value, gift cards and stock donations, plus volume we route to third party merchant acquirers on behalf of strategic enterprise merchant relationships. We do maintain transaction processing on certain legacy platforms that are not defined as volume. Blended Spread represents the average yield Shift4 earns on the average volume processed for a given period after network fees. Blended Spread is calculated as payments-based revenue less gateway revenue and network fees for a given period divided by the volume processed for the same period. the inability to integrate the Global Blue business successfully or realize the synergies and related benefits; the substantial and increasingly intense competition worldwide in the financial services, payments and payment technology industries; potential changes in the competitive landscape, including disintermediation from other participants in the payments chain; the effect of global economic, political and other conditions on trends in consumer, business and government spending; fluctuations in inflation; our ability to anticipate and respond to changing industry trends and the needs and preferences of our merchants and consumers; our reliance on third-party vendors to provide products and services; risks associated with acquisitions; dispositions, and other strategic transactions; risks associated with our Series A Mandatory Convertible Preferred Stock; our inability to protect our IT systems and confidential information, as well as the IT systems of third parties we rely on, from continually evolving cybersecurity risks, security breaches or other technological risks; compliance with governmental regulation and other legal obligations, particularly related to privacy, data protection and information security, marketing across different markets where we conduct our business; risks associated with a variety of laws and regulations, including those relating to financial services, money-laundering, anti-bribery, sanctions, and counter-terrorist financing, consumer protection and cryptocurrencies; our ability to continue to expand our share of the existing payment processing markets or expand into new markets; additional risks associated with our expansion into international operations, including compliance with and changes in foreign regulations governmental policies, as well as exposure to foreign exchange rates; our ability to integrate and interoperate our services and products with a variety of operating systems, software, devices, and web browsers; and our dependence, in part, on our merchant and software partner relationships and strategic partnerships with various institutions to operate and grow our business, and the timing of any of the foregoing. These and other important factors discussed under the caption “Risk Factors” in Part I, Item 1A. in our Annual Report on Form 10-K for the fiscal year ended December 31, 2025, Part II, Item 1A. in our Quarterly Report on Form 10-Q for the period ended June 30, 2026, and our other filings with the Securities and Exchange Commission could cause actual results to differ materially from those indicated by the forward-looking statements made in this letter. Any such forward-looking statements represent management’s estimates as of the date of this letter. While we may elect to update such forward-looking statements at some point in the future, we disclaim any obligation to do so, even if subsequent events cause our views to change.
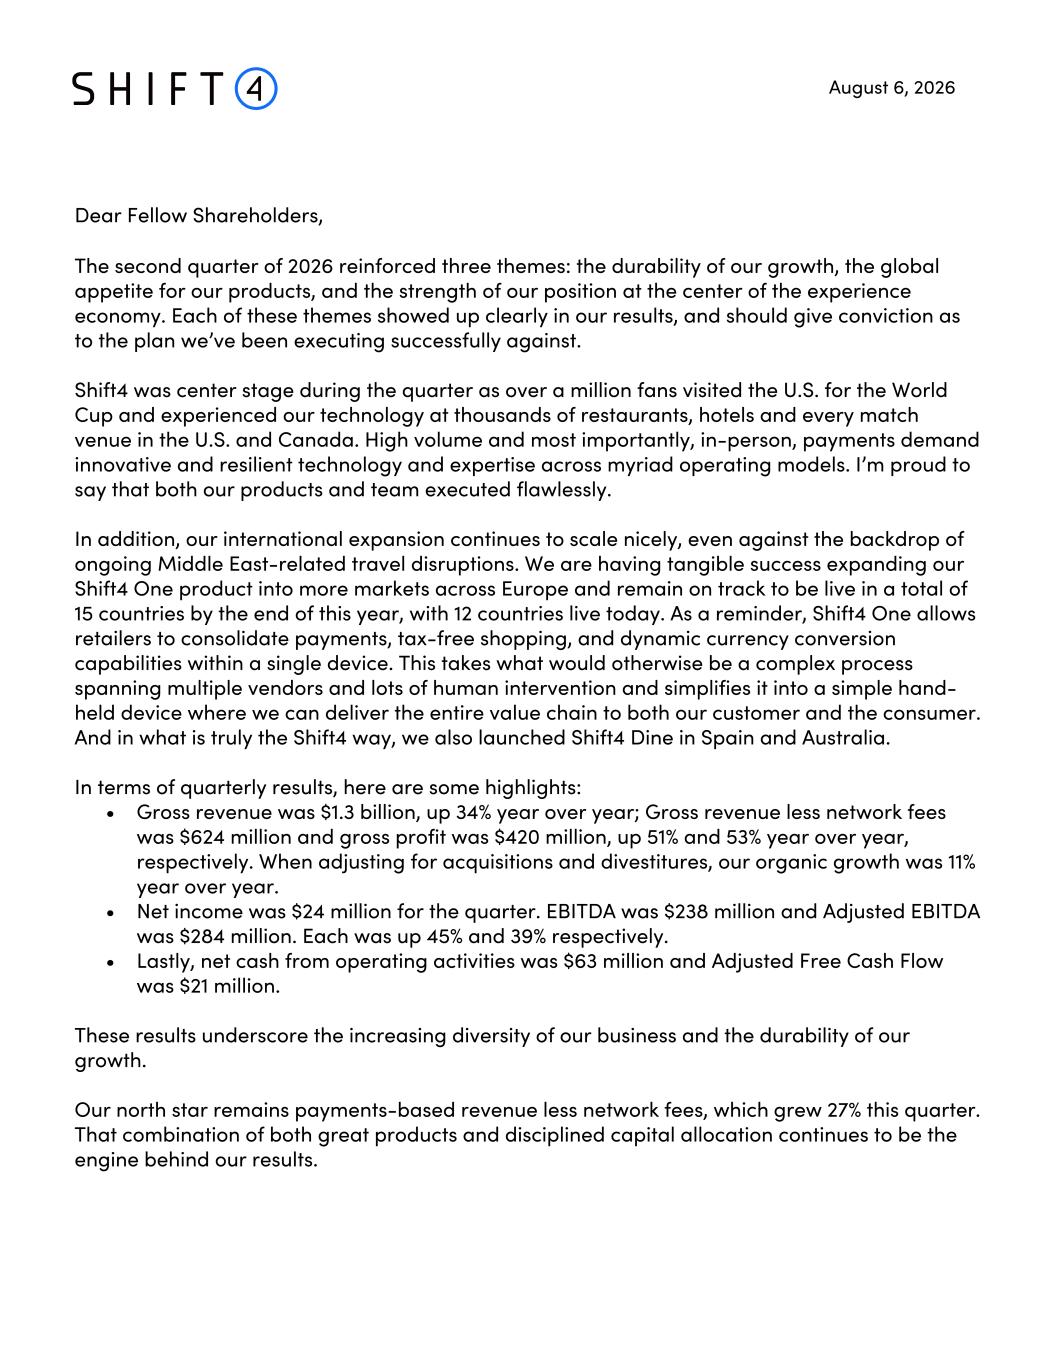
Dear Fellow Shareholders, The second quarter of 2026 reinforced three themes: the durability of our growth, the global appetite for our products, and the strength of our position at the center of the experience economy. Each of these themes showed up clearly in our results, and should give conviction as to the plan we’ve been executing successfully against. Shift4 was center stage during the quarter as over a million fans visited the U.S. for the World Cup and experienced our technology at thousands of restaurants, hotels and every match venue in the U.S. and Canada. High volume and most importantly, in-person, payments demand innovative and resilient technology and expertise across myriad operating models. I’m proud to say that both our products and team executed flawlessly. In addition, our international expansion continues to scale nicely, even against the backdrop of ongoing Middle East-related travel disruptions. We are having tangible success expanding our Shift4 One product into more markets across Europe and remain on track to be live in a total of 15 countries by the end of this year, with 12 countries live today. As a reminder, Shift4 One allows retailers to consolidate payments, tax-free shopping, and dynamic currency conversion capabilities within a single device. This takes what would otherwise be a complex process spanning multiple vendors and lots of human intervention and simplifies it into a simple hand- held device where we can deliver the entire value chain to both our customer and the consumer. And in what is truly the Shift4 way, we also launched Shift4 Dine in Spain and Australia. In terms of quarterly results, here are some highlights: • Gross revenue was $1.3 billion, up 34% year over year; Gross revenue less network fees was $624 million and gross profit was $420 million, up 51% and 53% year over year, respectively. When adjusting for acquisitions and divestitures, our organic growth was 11% year over year. • Net income was $24 million for the quarter. EBITDA was $238 million and Adjusted EBITDA was $284 million. Each was up 45% and 39% respectively. • Lastly, net cash from operating activities was $63 million and Adjusted Free Cash Flow was $21 million. These results underscore the increasing diversity of our business and the durability of our growth. Our north star remains payments-based revenue less network fees, which grew 27% this quarter. That combination of both great products and disciplined capital allocation continues to be the engine behind our results. August 6, 2026
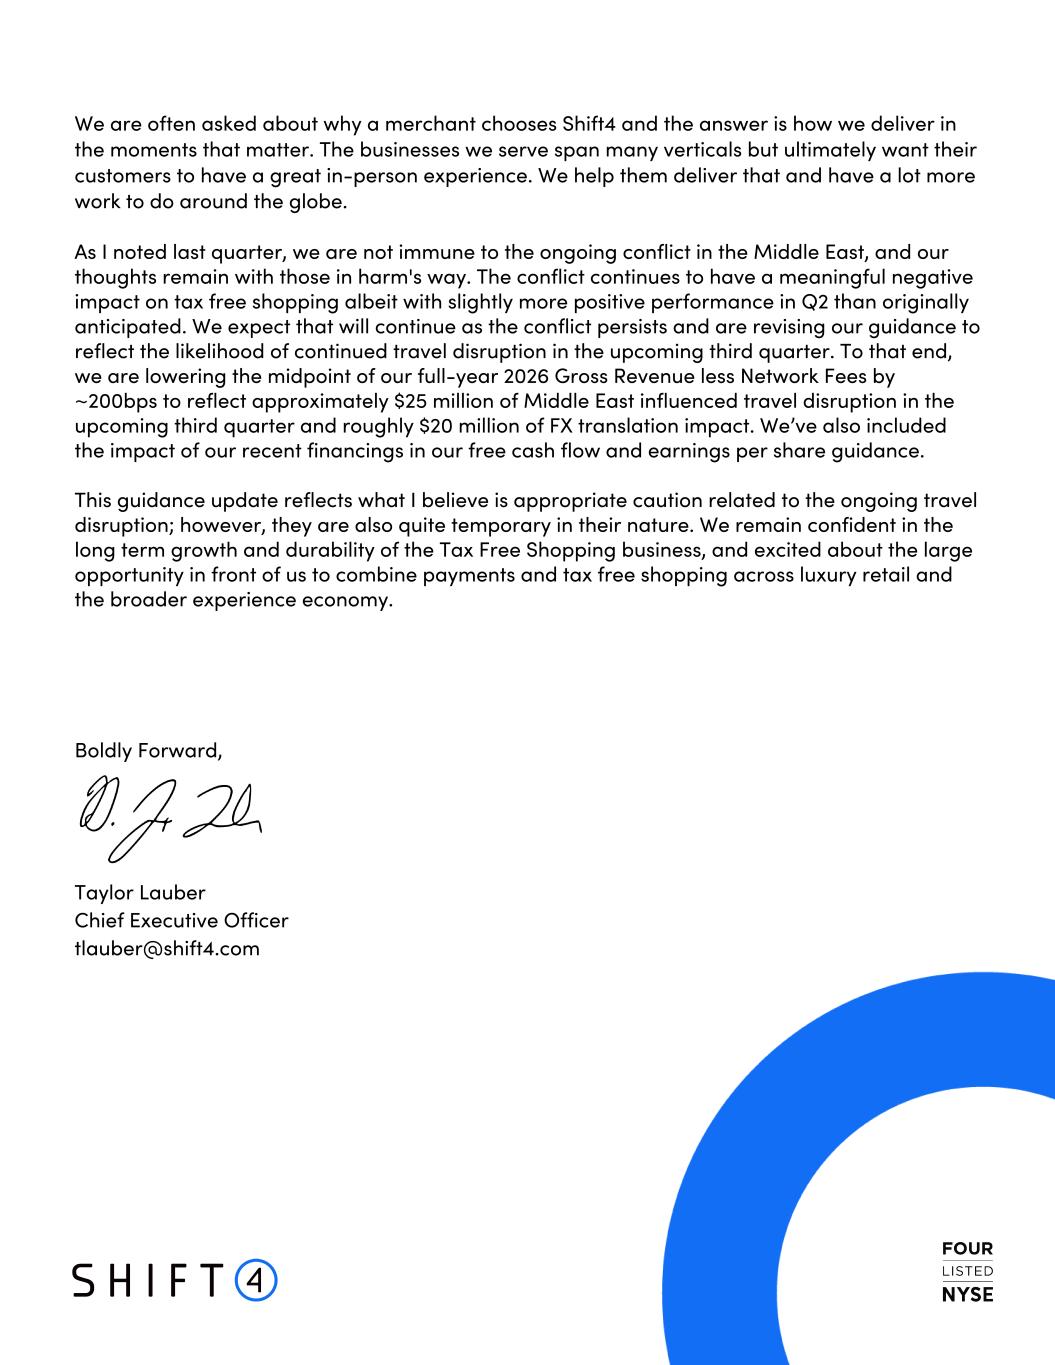
We are often asked about why a merchant chooses Shift4 and the answer is how we deliver in the moments that matter. The businesses we serve span many verticals but ultimately want their customers to have a great in-person experience. We help them deliver that and have a lot more work to do around the globe. As I noted last quarter, we are not immune to the ongoing conflict in the Middle East, and our thoughts remain with those in harm's way. The conflict continues to have a meaningful negative impact on tax free shopping albeit with slightly more positive performance in Q2 than originally anticipated. We expect that will continue as the conflict persists and are revising our guidance to reflect the likelihood of continued travel disruption in the upcoming third quarter. To that end, we are lowering the midpoint of our full-year 2026 Gross Revenue less Network Fees by ~200bps to reflect approximately $25 million of Middle East influenced travel disruption in the upcoming third quarter and roughly $20 million of FX translation impact. We’ve also included the impact of our recent financings in our free cash flow and earnings per share guidance. This guidance update reflects what I believe is appropriate caution related to the ongoing travel disruption; however, they are also quite temporary in their nature. We remain confident in the long term growth and durability of the Tax Free Shopping business, and excited about the large opportunity in front of us to combine payments and tax free shopping across luxury retail and the broader experience economy. Boldly Forward, Taylor Lauber Chief Executive Officer tlauber@shift4.com TBU - TAYLOR LETTER (will iterate separately in google doc)
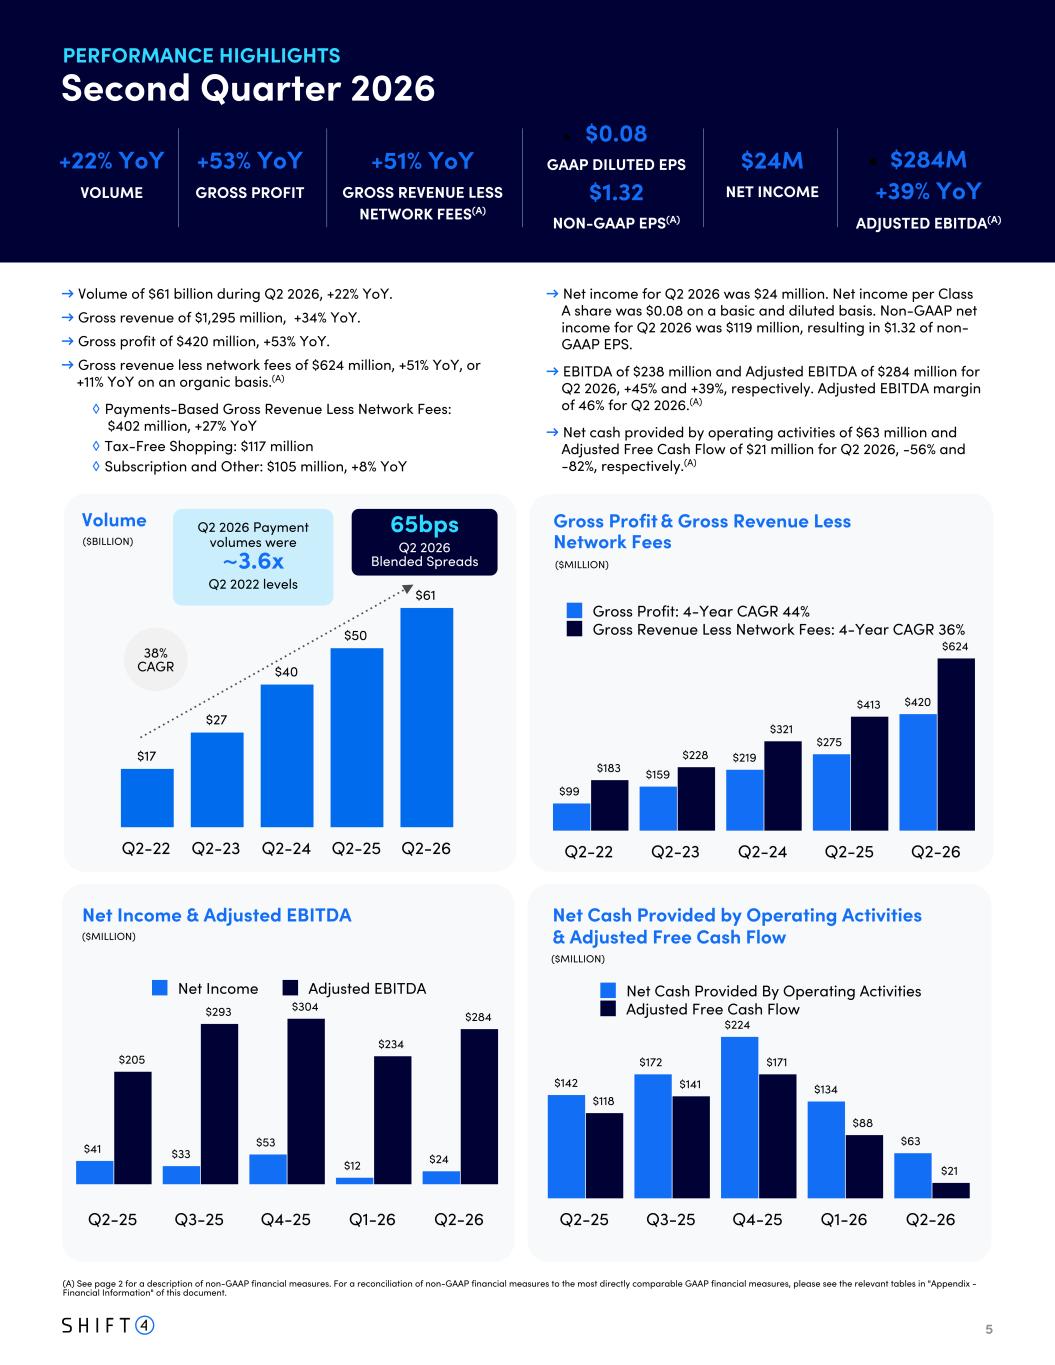
5 $142 $172 $224 $134 $63 $118 $141 $171 $88 $21 Net Cash Provided By Operating Activities Adjusted Free Cash Flow Q2-25 Q3-25 Q4-25 Q1-26 Q2-26 Q2 2026 Payment volumes were ~3.6x Q2 2022 levels $17 $27 $40 $50 $61 Q2-22 Q2-23 Q2-24 Q2-25 Q2-26 Volume Gross Profit & Gross Revenue Less Network Fees($BILLION) +22% YoY VOLUME 38% CAGR Net Income & Adjusted EBITDA Net Cash Provided by Operating Activities & Adjusted Free Cash Flow($MILLION) ($MILLION) ($MILLION) +53% YoY GROSS PROFIT • $0.08 GAAP DILUTED EPS $1.32 NON-GAAP EPS(A) • $284M +39% YoY ADJUSTED EBITDA(A) → Volume of $61 billion during Q2 2026, +22% YoY. → Gross revenue of $1,295 million, +34% YoY. → Gross profit of $420 million, +53% YoY. → Gross revenue less network fees of $624 million, +51% YoY, or +11% YoY on an organic basis.(A) ◊ Payments-Based Gross Revenue Less Network Fees: $402 million, +27% YoY ◊ Tax-Free Shopping: $117 million ◊ Subscription and Other: $105 million, +8% YoY → Net income for Q2 2026 was $24 million. Net income per Class A share was $0.08 on a basic and diluted basis. Non-GAAP net income for Q2 2026 was $119 million, resulting in $1.32 of non- GAAP EPS. → EBITDA of $238 million and Adjusted EBITDA of $284 million for Q2 2026, +45% and +39%, respectively. Adjusted EBITDA margin of 46% for Q2 2026.(A) → Net cash provided by operating activities of $63 million and Adjusted Free Cash Flow of $21 million for Q2 2026, -56% and -82%, respectively.(A) $41 $33 $53 $12 $24 $205 $293 $304 $234 $284 Net Income Adjusted EBITDA Q2-25 Q3-25 Q4-25 Q1-26 Q2-26 $99 $159 $219 $275 $420 $183 $228 $321 $413 $624 Gross Profit: 4-Year CAGR 44% Gross Revenue Less Network Fees: 4-Year CAGR 36% Q2-22 Q2-23 Q2-24 Q2-25 Q2-26 +51% YoY GROSS REVENUE LESS NETWORK FEES(A) $24M NET INCOME 65bps Q2 2026 Blended Spreads GRLNF Organic Growth of 11% PERFORMANCE HIGHLIGHTS Second Quarter 2026 (A) See page 2 for a description of non-GAAP financial measures. For a reconciliation of non-GAAP financial measures to the most directly comparable GAAP financial measures, please see the relevant tables in "Appendix - Financial Information" of this document.
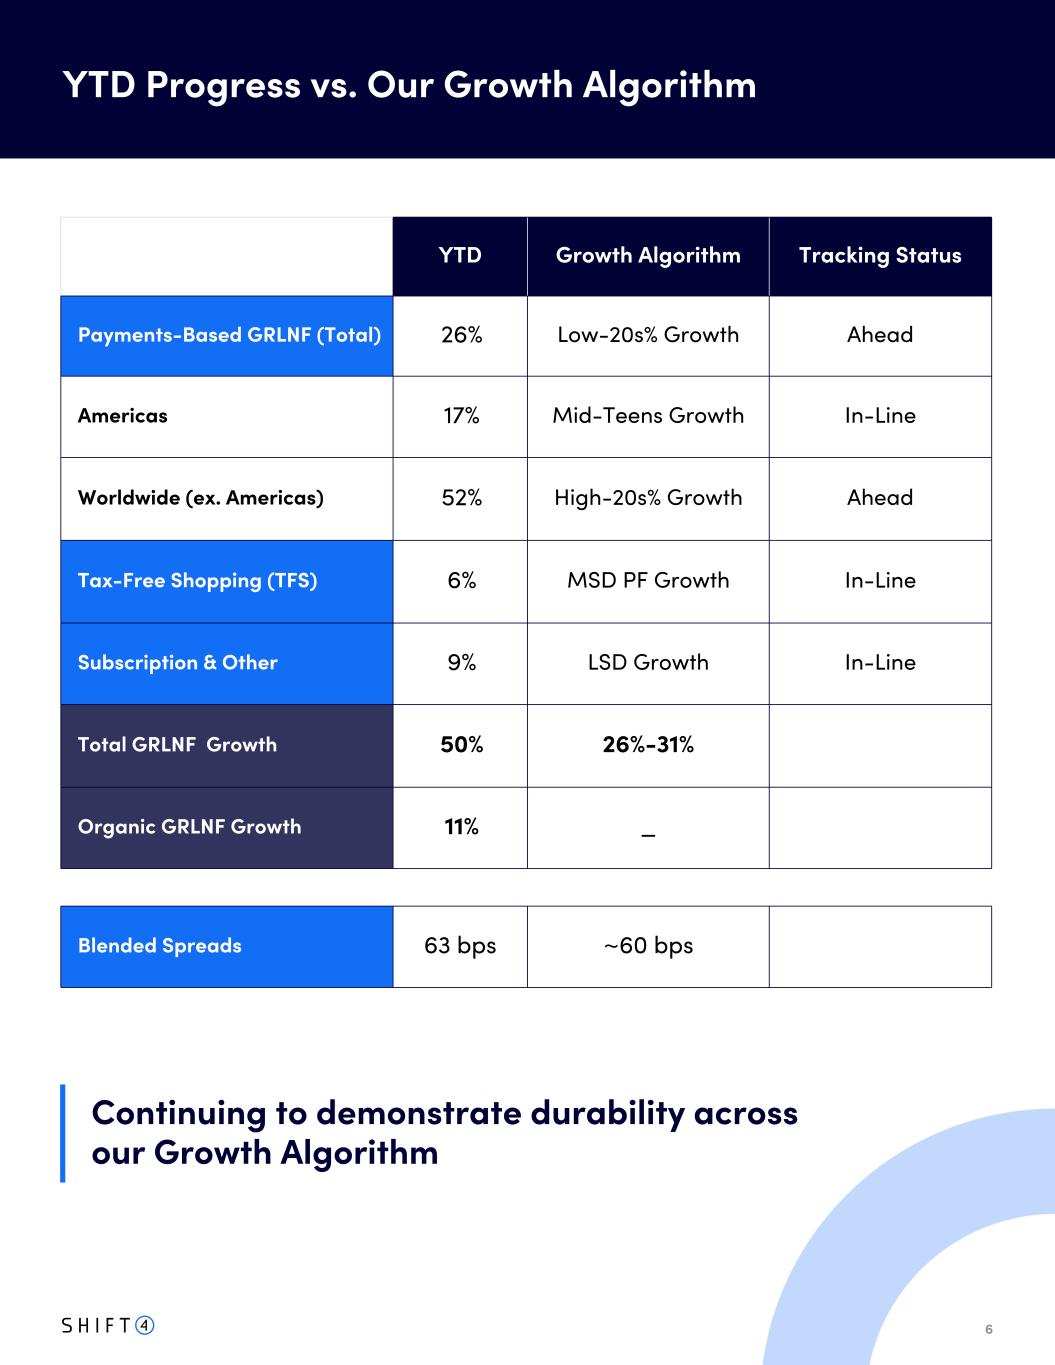
6 (1) The Global Blue acquisition closed on July 3, 2025. YTD Progress vs. Our Growth Algorithm Continuing to demonstrate durability across our Growth Algorithm YTD Growth Algorithm Tracking Status Payments-Based GRLNF (Total) 26% Low-20s% Growth Ahead Americas 17% Mid-Teens Growth In-Line Worldwide (ex. Americas) 52% High-20s% Growth Ahead Tax-Free Shopping (TFS) 6% MSD PF Growth In-Line Subscription & Other 9% LSD Growth In-Line Total GRLNF Growth 50% 26%-31% Organic GRLNF Growth 11% _ Blended Spreads 63 bps ~60 bps Our increasingly diversified business continues to deliver durable and resilient growth 3 columns only: YTD, algo, and "Tracking Status" for 3rd column: ahead, in-line, ahead, in-line, in-line, debate changing sub & other to flat (note: ripples through to guidance)

7 #2 in Restaurants in U.S. World class technology, sophisticated distribution, and an overall lower cost of ownership #1 in Hospitality in U.S. One Hand to Shake: the only hospitality platform to deliver the entire payments value chain under one roof #1 in Luxury Retail Globally Global leading digital payments network powering the most recognized luxury brands and serving affluent shopping customers for regulated tax-free shopping countries Earned brand trust with the most influential brands in the global Experience Economy Increasingly differentiated platform with capabilities enhanced through each challenge solved Unmatched software integration library in our leading verticals, that grows through network effect Value proposition continuously enhanced by consumer and merchant insights from our proprietary data assets An unparalleled capital allocation model with a proven track record, which accelerates everything we do #1 in Sports & Entertainment in U.S. The most comprehensive owned solution in the sector - everything from concessions to merchandise to ticketing WIP (re-format) should we change anything here? We Power the Experience Economy Across all of our verticals, we enable businesses to deliver the Moments that Matter #2 in Restaurants in U.S. World class technology, sophisticated distribution, and an overall lower cost of ownership Delivering in-person payments in the most demanding experience environments 1 2 3 4 5 How do we win?
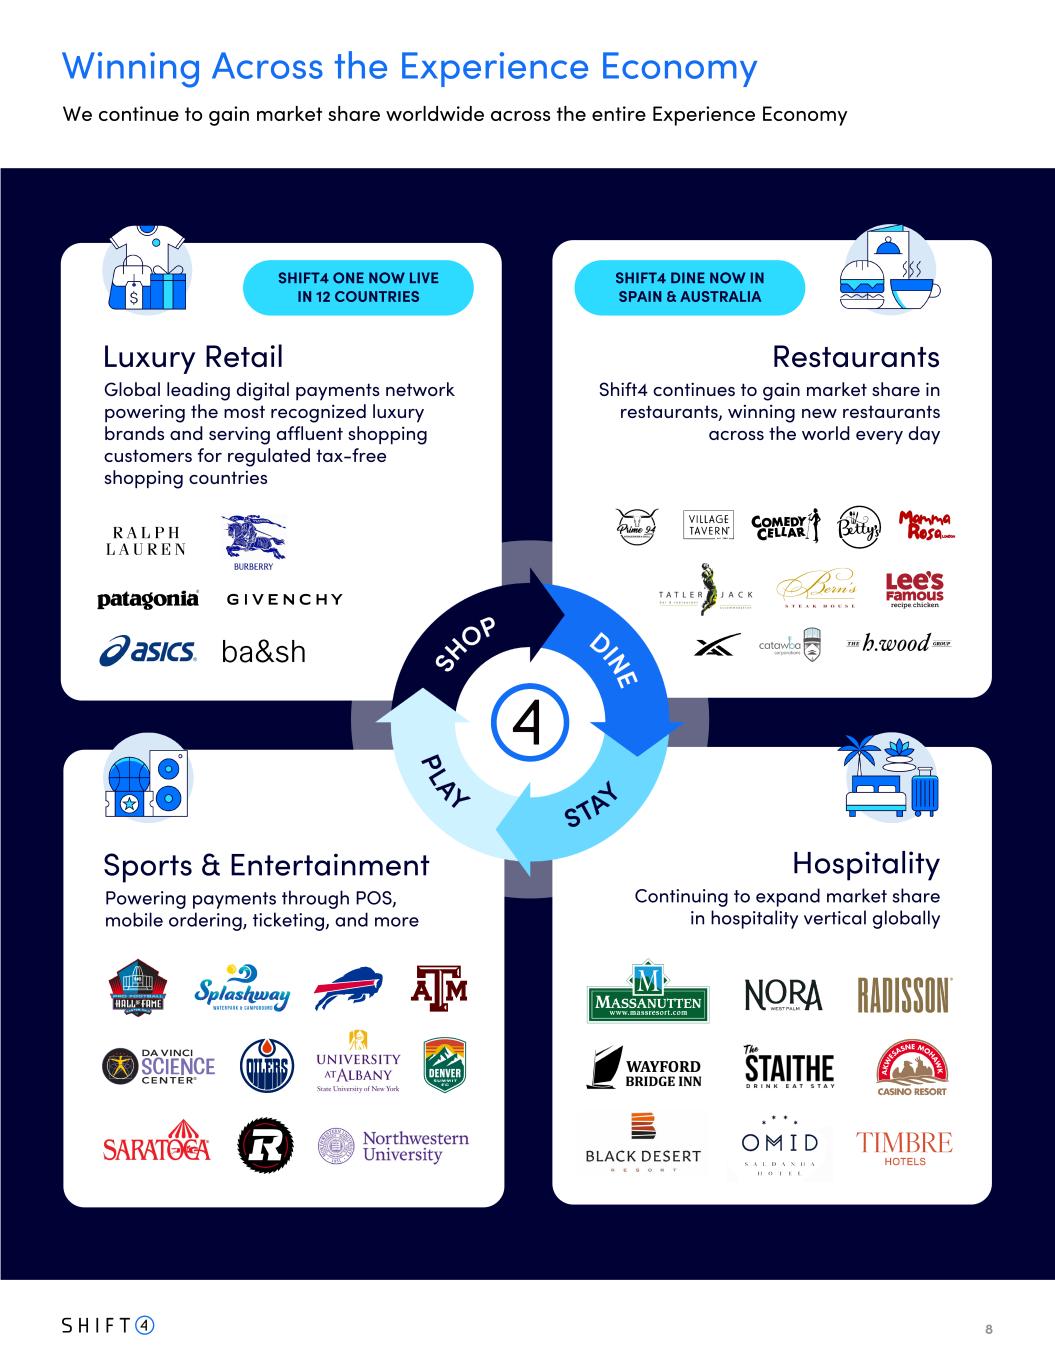
8 Restaurants Shift4 continues to gain market share in restaurants, winning new restaurants across the world every day Luxury Retail Global leading digital payments network powering the most recognized luxury brands and serving affluent shopping customers for regulated tax-free shopping countries Sports & Entertainment Powering payments through POS, mobile ordering, ticketing, and more SHIFT4 DINE NOW IN SPAIN & AUSTRALIA Winning Across the Experience Economy We continue to gain market share worldwide across the entire Experience Economy DINE PLAY SHOP STAY Hospitality Continuing to expand market share in hospitality vertical globally SHIFT4 ONE NOW LIVE IN 12 COUNTRIES
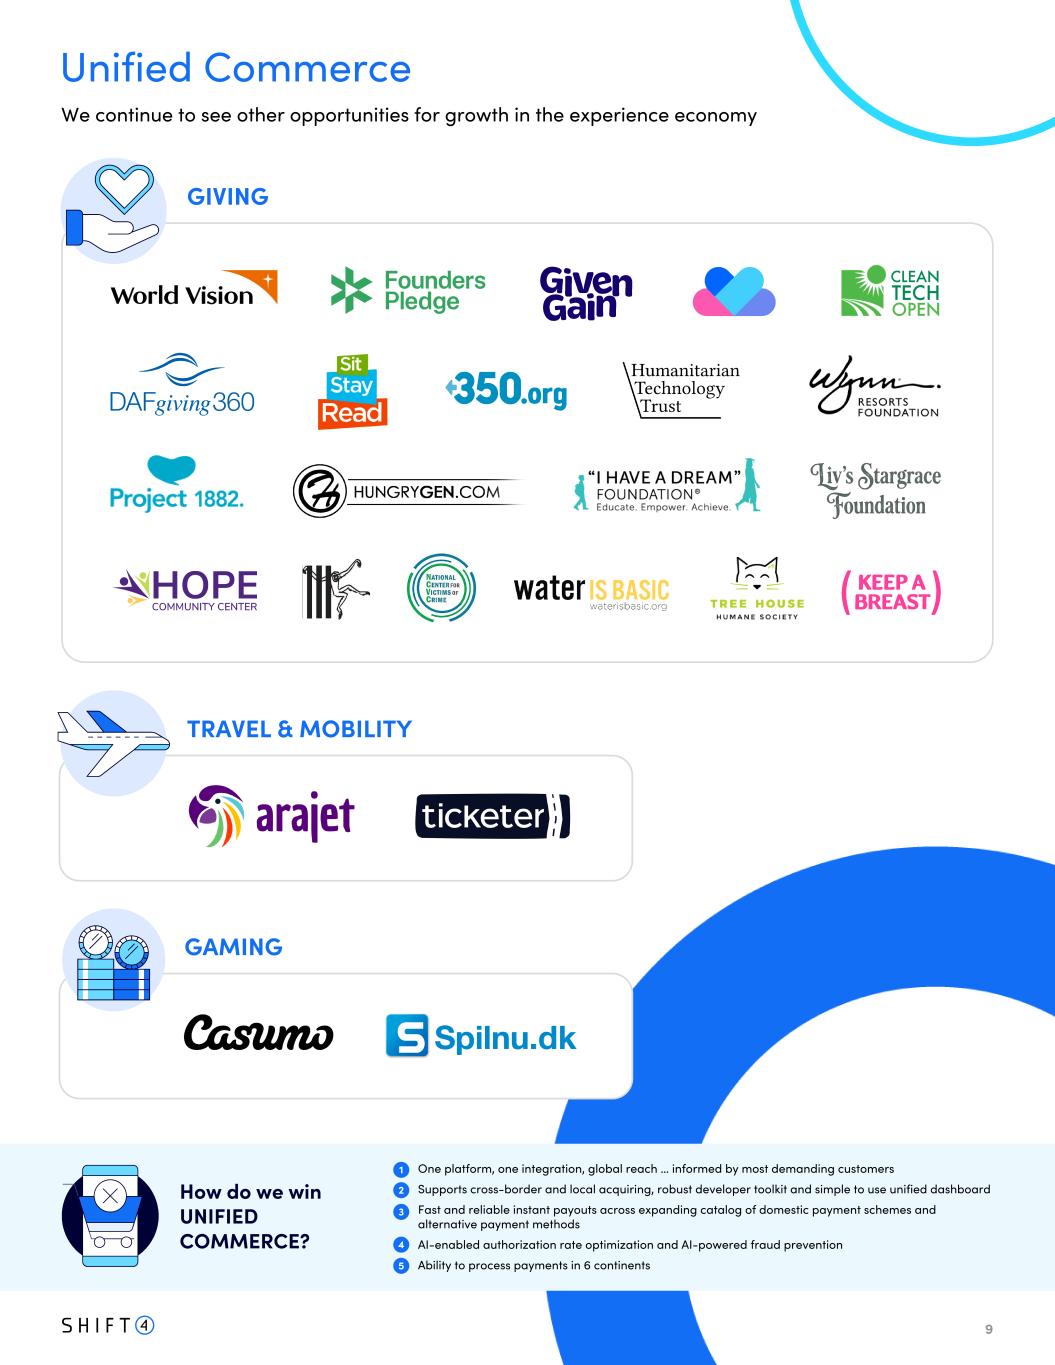
9 Unified Commerce We continue to see other opportunities for growth in the experience economy GIVING TRAVEL & MOBILITY One platform, one integration, global reach … informed by most demanding customers Supports cross-border and local acquiring, robust developer toolkit and simple to use unified dashboard Fast and reliable instant payouts across expanding catalog of domestic payment schemes and alternative payment methods AI-enabled authorization rate optimization and AI-powered fraud prevention Ability to process payments in 6 continents 1 2 3 4 5 How do we win UNIFIED COMMERCE? GAMING
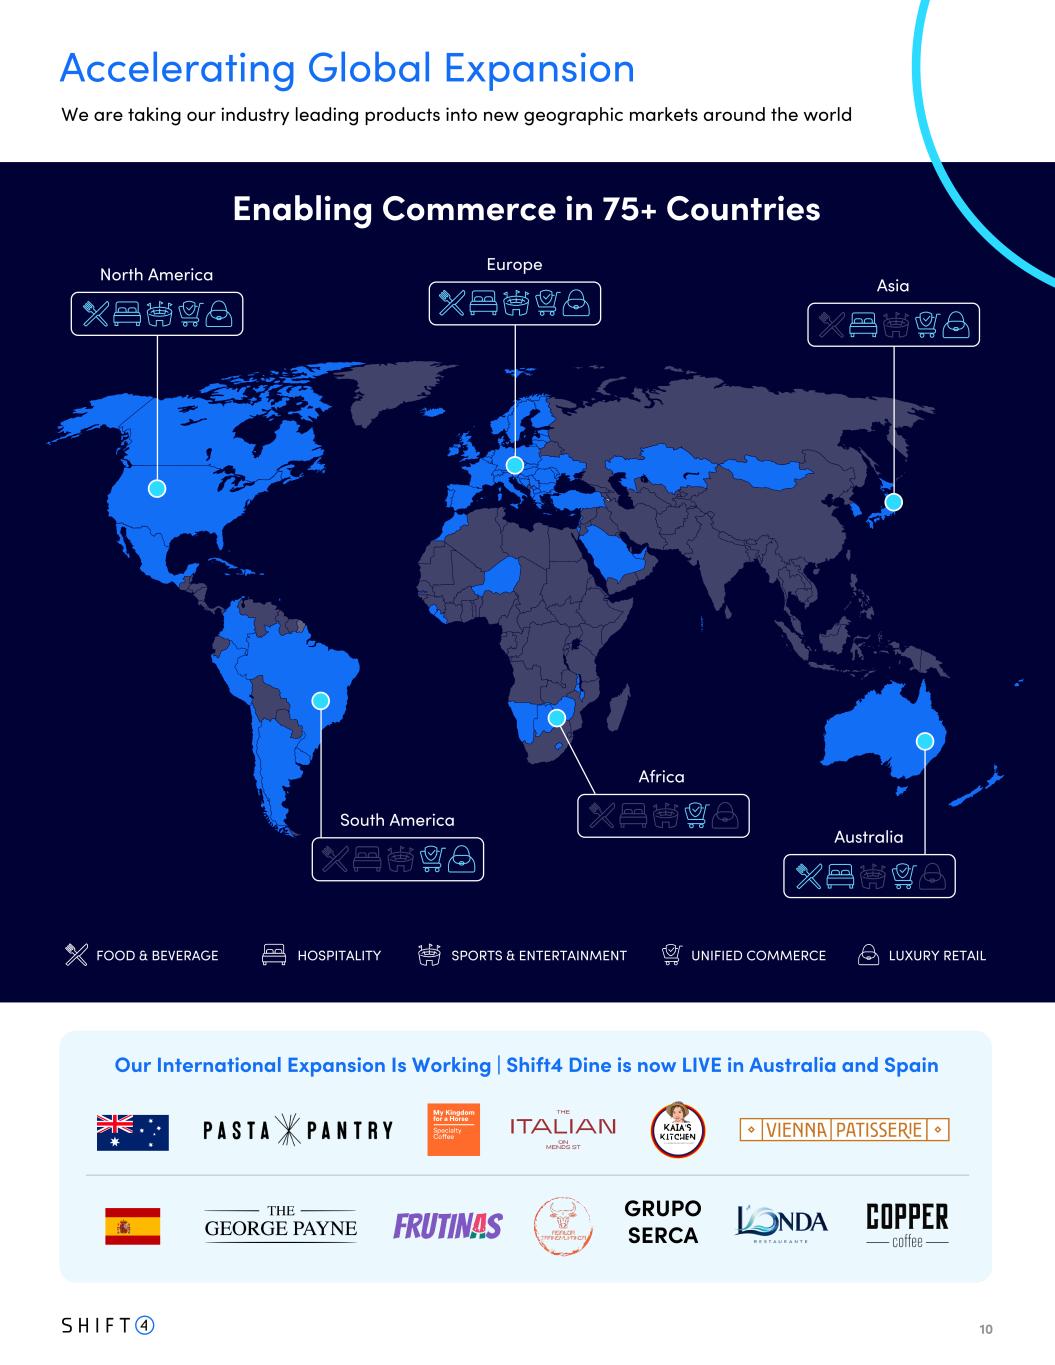
10 North America Americas Worldwide (ex-Americas) GRLNF Geographic Diversification Q1 2025 Q1 2026 Accelerating Global Expansion We are taking our industry leading products into new geographic markets around the world LUXURY RETAILHOSPITALITY SPORTS & ENTERTAINMENT UNIFIED COMMERCE Products Enabling commerce in 75+ countries TBU Europe Asia South America Africa Australia TBD logos for this area Enabling Commerce in 75+ Countries FOOD & BEVERAGE GRUPO SERCA Our International Expansion Is Working | Shift4 Dine is now LIVE in Australia and Spain
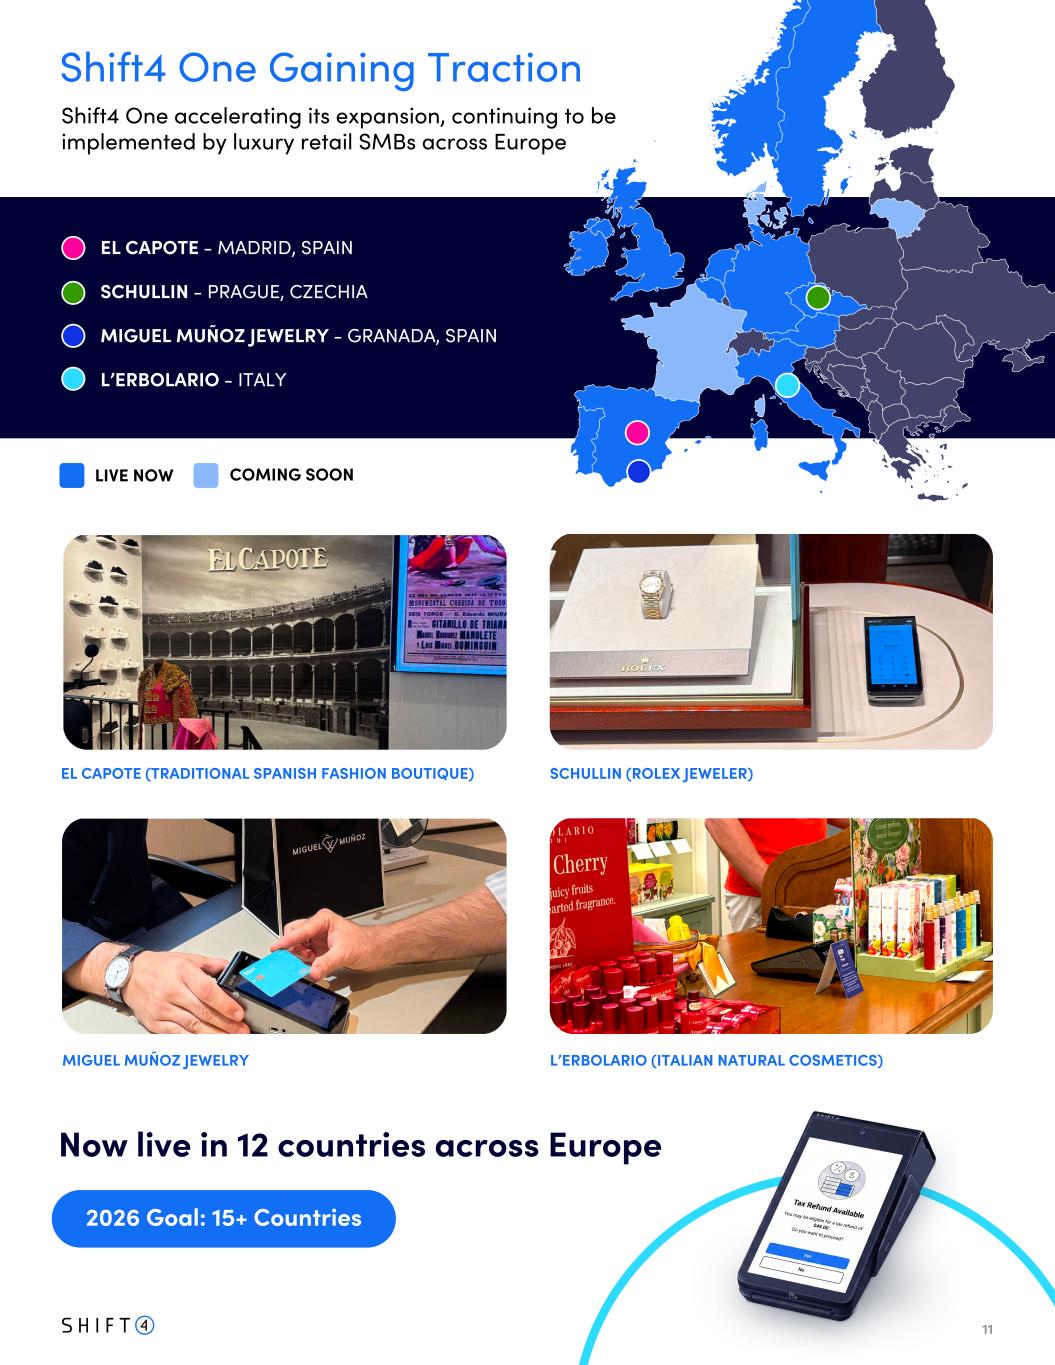
11 EL CAPOTE - MADRID, SPAIN SCHULLIN - PRAGUE, CZECHIA MIGUEL MUÑOZ JEWELRY - GRANADA, SPAIN L’ERBOLARIO - ITALY EL CAPOTE (TRADITIONAL SPANISH FASHION BOUTIQUE) SCHULLIN (ROLEX JEWELER) MIGUEL MUÑOZ JEWELRY L’ERBOLARIO (ITALIAN NATURAL COSMETICS) Now live in 12 countries across Europe LIVE NOW COMING SOON 2026 Goal: 15+ Countries NOTE: will add quotes from merchants here 2026 Goal: 15+ Countries LIVE NOW COMING SOON Shift4 One Gaining Traction Shift4 One accelerating its expansion, continuing to be implemented by luxury retail SMBs across Europe
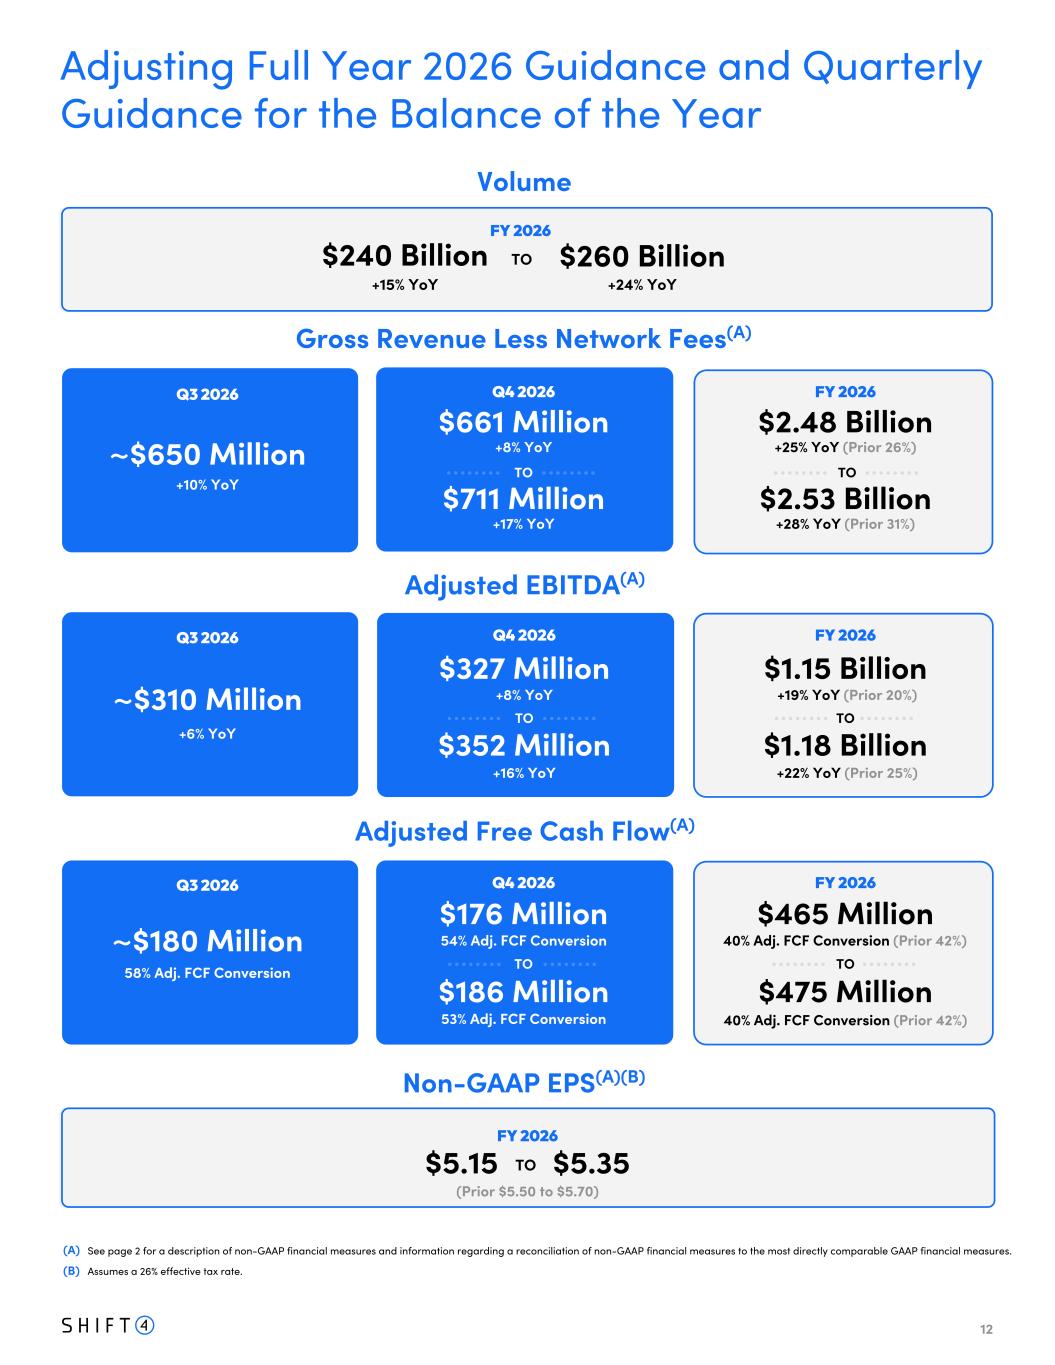
12 Volume $240 Billion $260 BillionTO FY 2026 +15% YoY +24% YoY Gross Revenue Less Network Fees(A) $2.48 Billion $2.53 Billion TO FY 2026 +25% YoY (Prior 26%) +28% YoY (Prior 31%) Adjusted EBITDA(A) $1.15 Billion $1.18 Billion TO FY 2026 +19% YoY (Prior 20%) +22% YoY (Prior 25%) from $965 Million to $990 Million Non-GAAP EPS(A)(B) $5.15 $5.35 Q2 2026 ~$615 Million +49% YoY Q2 2026 ~$278 Million +36% YoY Adjusted Free Cash Flow(A) $465 Million $475 Million TO FY 2026 40% Adj. FCF Conversion (Prior 42%) 40% Adj. FCF Conversion (Prior 42%) Q2 2026 ~$10 Million TO FY 2026 Adjusting Full Year 2026 Guidance and Quarterly Guidance for the Balance of the Year 4% Adj. FCF Conversion ~XXX Million +XXX YoY Q3 2026 Q3 2026 Q4 2026 Q4 2026 Q4 2026 See page 2 for a description of non-GAAP financial measures and information regarding a reconciliation of non-GAAP financial measures to the most directly comparable GAAP financial measures. (A) Assumes a 26% effective tax rate.(B) ~$650 Million +10% YoY ~$310 Million +6% YoY ~$180 Million 58% Adj. FCF Conversion $176 Million $186 Million TO 54% Adj. FCF Conversion 53% Adj. FCF Conversion $327 Million $352 Million TO +8% YoY +16% YoY $661 Million $711 Million TO +8% YoY +17% YoY Q3 2026 Q3 2026 Q3 2026 $665 Million $715 Million TO +13% YoY +21% YoY $322 Million $347 Million TO +10% YoY +19% YoY $185 Million $195 Million TO 57% Adj. FCF Conversion 56% Adj. FCF Conversion Q3 2026 (Prior $5.50 to $5.70)
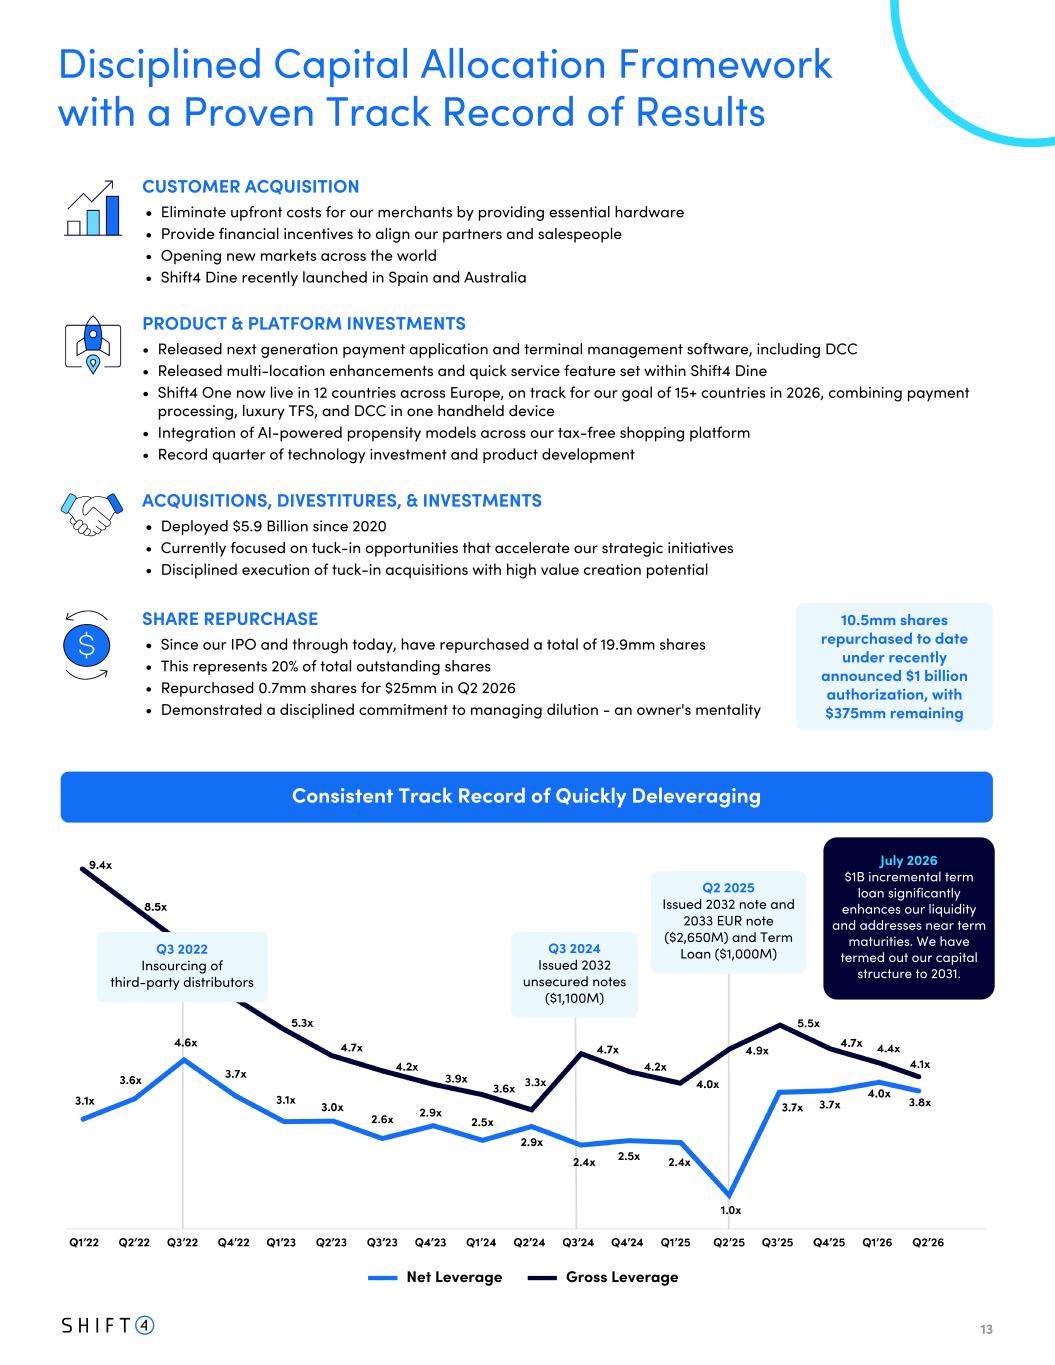
13 CUSTOMER ACQUISITION • Eliminate upfront costs for our merchants by providing essential hardware • Provide financial incentives to align our partners and salespeople • Opening new markets across the world • Shift4 Dine recently launched in Spain and Australia PRODUCT & PLATFORM INVESTMENTS • Released next generation payment application and terminal management software, including DCC • Released multi-location enhancements and quick service feature set within Shift4 Dine • Shift4 One now live in 12 countries across Europe, on track for our goal of 15+ countries in 2026, combining payment processing, luxury TFS, and DCC in one handheld device • Integration of AI-powered propensity models across our tax-free shopping platform • Record quarter of technology investment and product development ACQUISITIONS, DIVESTITURES, & INVESTMENTS • Deployed $5.9 Billion since 2020 • Currently focused on tuck-in opportunities that accelerate our strategic initiatives • Disciplined execution of tuck-in acquisitions with high value creation potential SHARE REPURCHASE • Since our IPO and through today, have repurchased a total of 19.9mm shares • This represents 20% of total outstanding shares • Repurchased 0.7mm shares for $25mm in Q2 2026 • Demonstrated a disciplined commitment to managing dilution - an owner's mentality Disciplined Capital Allocation Framework with a Proven Track Record of Results Consistent Track Record of Quickly Deleveraging Net Leverage Gross Leverage TBU for Q2 + note new TL-B and revolver 10.5mm shares repurchased to date under recently announced $1 billion authorization, with $375mm remaining Q3 2022 Insourcing of third-party distributors Q3 2024 Issued 2032 unsecured notes ($1,100M) Q2 2025 Issued 2032 note and 2033 EUR note ($2,650M) and Term Loan ($1,000M) July 2026 $1B incremental term loan significantly enhances our liquidity and addresses near term maturities. We have termed out our capital structure to 2031.
14 APPENDIX Financial Information
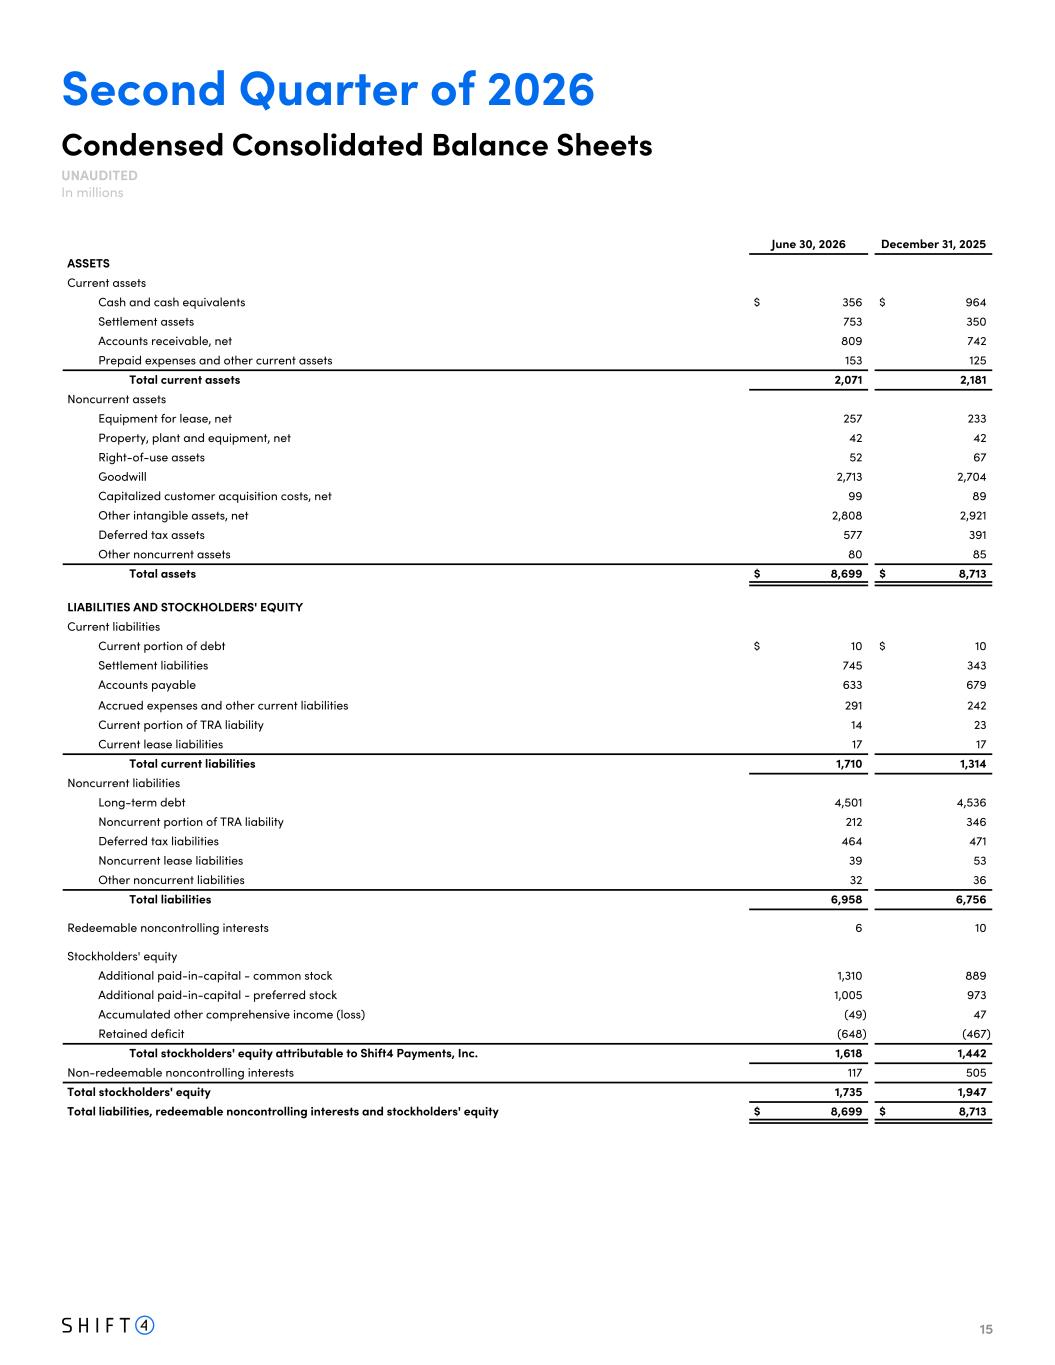
15 Second Quarter of 2026 Condensed Consolidated Balance Sheets UNAUDITED In millions June 30, 2026 December 31, 2025 ASSETS Current assets Cash and cash equivalents $ 356 $ 964 Settlement assets 753 350 Accounts receivable, net 809 742 Prepaid expenses and other current assets 153 125 Total current assets 2,071 2,181 Noncurrent assets Equipment for lease, net 257 233 Property, plant and equipment, net 42 42 Right-of-use assets 52 67 Goodwill 2,713 2,704 Capitalized customer acquisition costs, net 99 89 Other intangible assets, net 2,808 2,921 Deferred tax assets 577 391 Other noncurrent assets 80 85 Total assets $ 8,699 $ 8,713 LIABILITIES AND STOCKHOLDERS' EQUITY Current liabilities Current portion of debt $ 10 $ 10 Settlement liabilities 745 343 Accounts payable 633 679 Accrued expenses and other current liabilities 291 242 Current portion of TRA liability 14 23 Current lease liabilities 17 17 Total current liabilities 1,710 1,314 Noncurrent liabilities Long-term debt 4,501 4,536 Noncurrent portion of TRA liability 212 346 Deferred tax liabilities 464 471 Noncurrent lease liabilities 39 53 Other noncurrent liabilities 32 36 Total liabilities 6,958 6,756 Redeemable noncontrolling interests 6 10 Stockholders' equity Additional paid-in-capital - common stock 1,310 889 Additional paid-in-capital - preferred stock 1,005 973 Accumulated other comprehensive income (loss) (49) 47 Retained deficit (648) (467) Total stockholders' equity attributable to Shift4 Payments, Inc. 1,618 1,442 Non-redeemable noncontrolling interests 117 505 Total stockholders' equity 1,735 1,947 Total liabilities, redeemable noncontrolling interests and stockholders' equity $ 8,699 $ 8,713
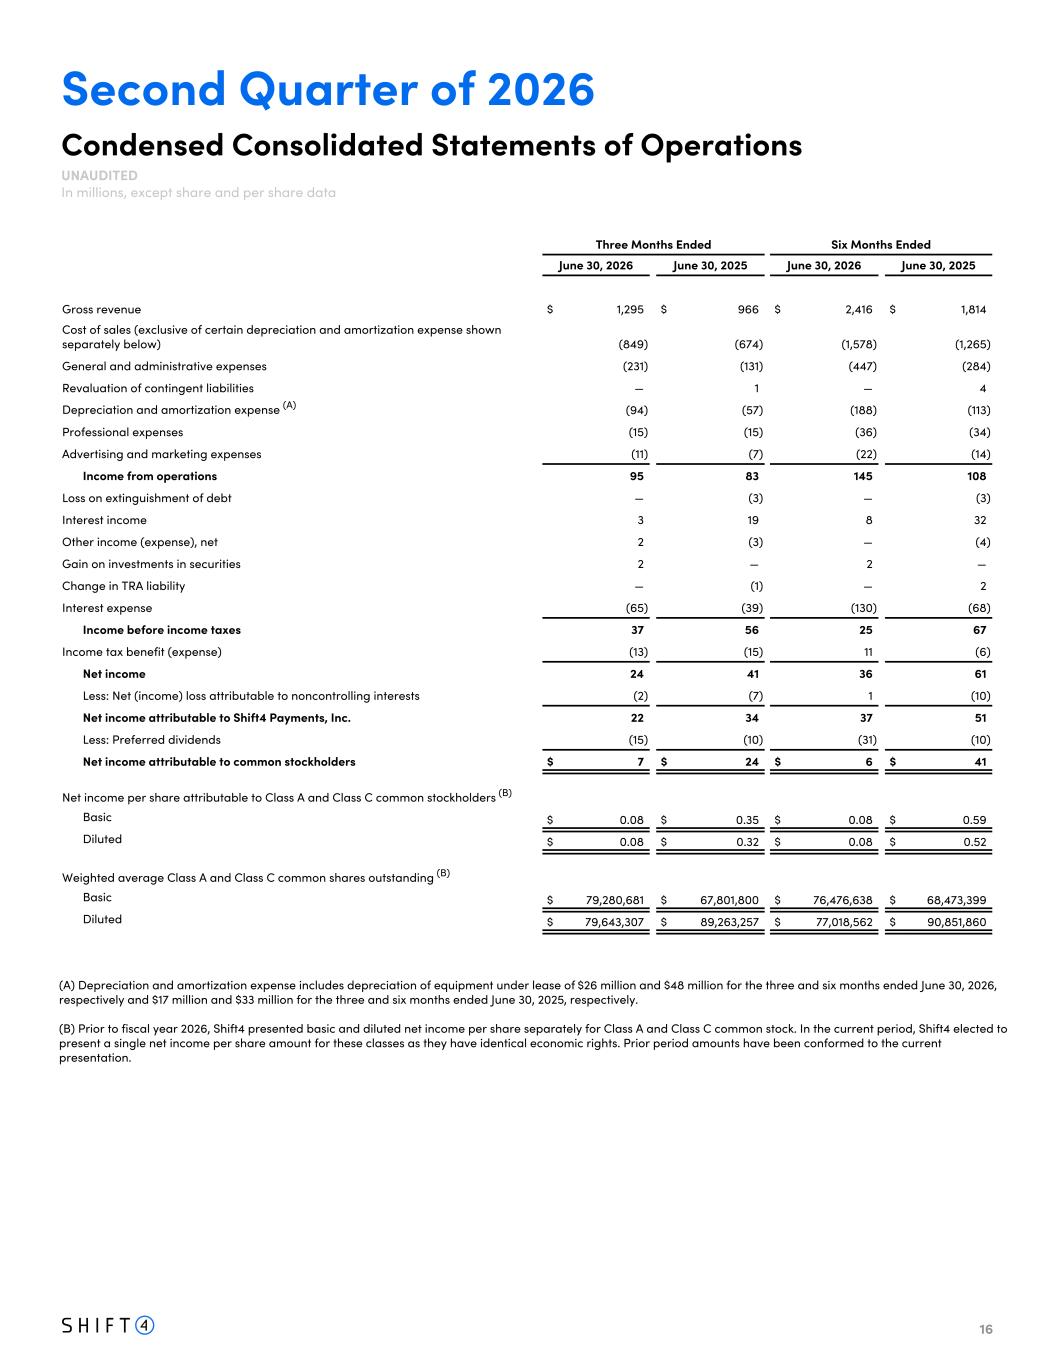
16 Second Quarter of 2026 Condensed Consolidated Statements of Operations UNAUDITED In millions, except share and per share data Three Months Ended Six Months Ended June 30, 2026 June 30, 2025 June 30, 2026 June 30, 2025 Gross revenue $ 1,295 $ 966 $ 2,416 $ 1,814 Cost of sales (exclusive of certain depreciation and amortization expense shown separately below) (849) (674) (1,578) (1,265) General and administrative expenses (231) (131) (447) (284) Revaluation of contingent liabilities — 1 — 4 Depreciation and amortization expense (A) (94) (57) (188) (113) Professional expenses (15) (15) (36) (34) Advertising and marketing expenses (11) (7) (22) (14) Income from operations 95 83 145 108 Loss on extinguishment of debt — (3) — (3) Interest income 3 19 8 32 Other income (expense), net 2 (3) — (4) Gain on investments in securities 2 — 2 — Change in TRA liability — (1) — 2 Interest expense (65) (39) (130) (68) Income before income taxes 37 56 25 67 Income tax benefit (expense) (13) (15) 11 (6) Net income 24 41 36 61 Less: Net (income) loss attributable to noncontrolling interests (2) (7) 1 (10) Net income attributable to Shift4 Payments, Inc. 22 34 37 51 Less: Preferred dividends (15) (10) (31) (10) Net income attributable to common stockholders $ 7 $ 24 $ 6 $ 41 Net income per share attributable to Class A and Class C common stockholders (B) Basic $ 0.08 $ 0.35 $ 0.08 $ 0.59 Diluted $ 0.08 $ 0.32 $ 0.08 $ 0.52 Weighted average Class A and Class C common shares outstanding (B) Basic $ 79,280,681 $ 67,801,800 $ 76,476,638 $ 68,473,399 Diluted $ 79,643,307 $ 89,263,257 $ 77,018,562 $ 90,851,860 (A) Depreciation and amortization expense includes depreciation of equipment under lease of $26 million and $48 million for the three and six months ended June 30, 2026, respectively and $17 million and $33 million for the three and six months ended June 30, 2025, respectively. (B) Prior to fiscal year 2026, Shift4 presented basic and diluted net income per share separately for Class A and Class C common stock. In the current period, Shift4 elected to present a single net income per share amount for these classes as they have identical economic rights. Prior period amounts have been conformed to the current presentation.
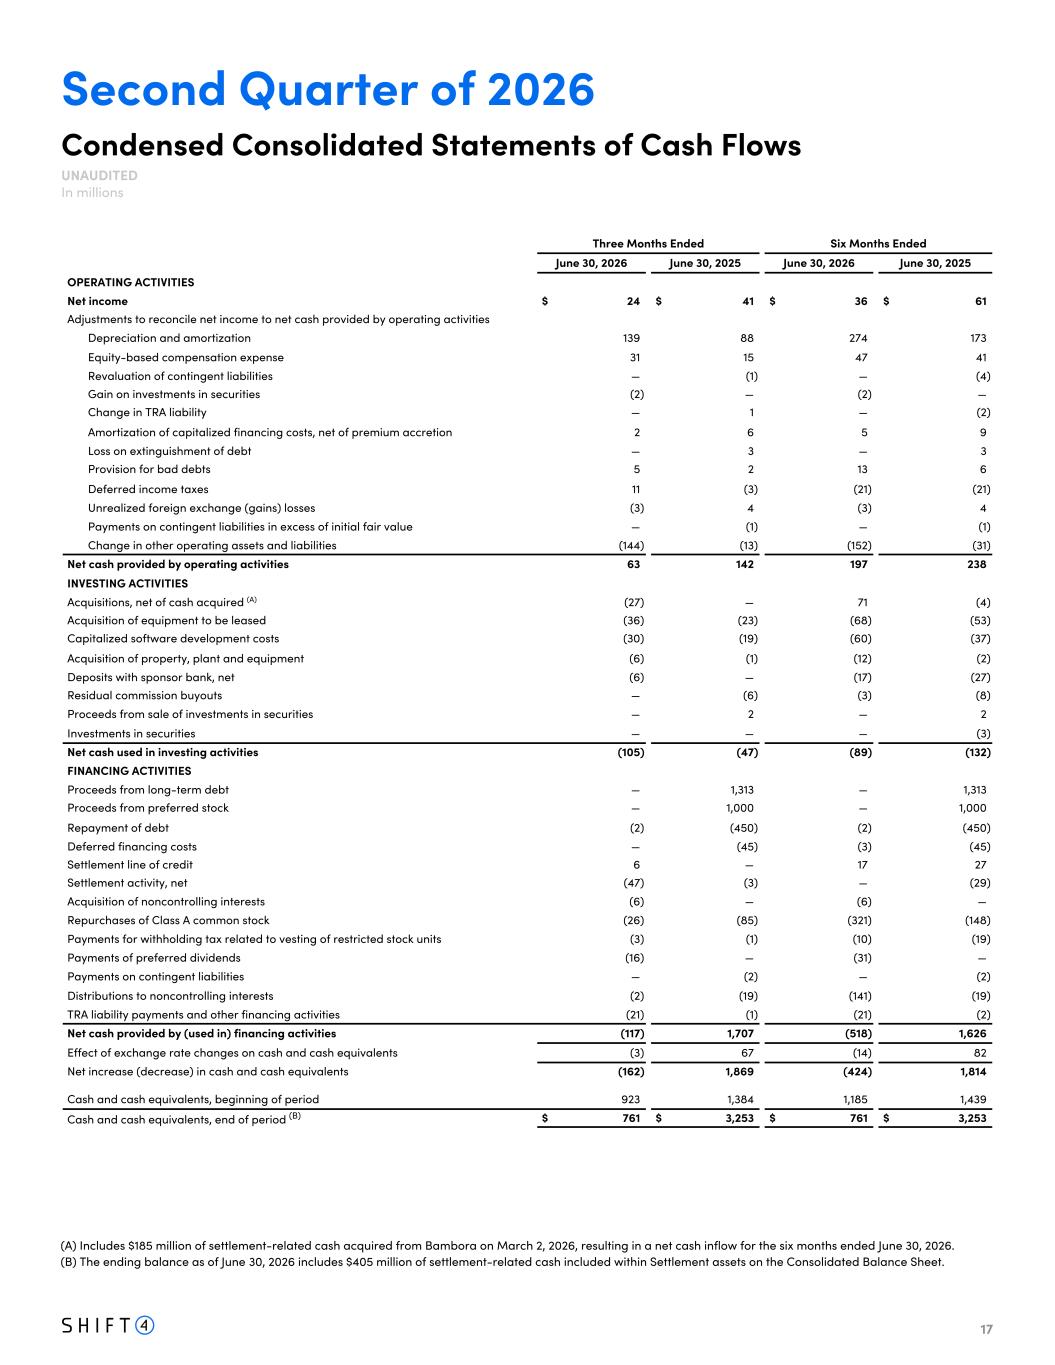
17 Second Quarter of 2026 Condensed Consolidated Statements of Cash Flows UNAUDITED In millions Three Months Ended Six Months Ended June 30, 2026 June 30, 2025 June 30, 2026 June 30, 2025 OPERATING ACTIVITIES Net income $ 24 $ 41 $ 36 $ 61 Adjustments to reconcile net income to net cash provided by operating activities Depreciation and amortization 139 88 274 173 Equity-based compensation expense 31 15 47 41 Revaluation of contingent liabilities — (1) — (4) Gain on investments in securities (2) — (2) — Change in TRA liability — 1 — (2) Amortization of capitalized financing costs, net of premium accretion 2 6 5 9 Loss on extinguishment of debt — 3 — 3 Provision for bad debts 5 2 13 6 Deferred income taxes 11 (3) (21) (21) Unrealized foreign exchange (gains) losses (3) 4 (3) 4 Payments on contingent liabilities in excess of initial fair value — (1) — (1) Change in other operating assets and liabilities (144) (13) (152) (31) Net cash provided by operating activities 63 142 197 238 INVESTING ACTIVITIES Acquisitions, net of cash acquired (A) (27) — 71 (4) Acquisition of equipment to be leased (36) (23) (68) (53) Capitalized software development costs (30) (19) (60) (37) Acquisition of property, plant and equipment (6) (1) (12) (2) Deposits with sponsor bank, net (6) — (17) (27) Residual commission buyouts — (6) (3) (8) Proceeds from sale of investments in securities — 2 — 2 Investments in securities — — — (3) Net cash used in investing activities (105) (47) (89) (132) FINANCING ACTIVITIES Proceeds from long-term debt — 1,313 — 1,313 Proceeds from preferred stock — 1,000 — 1,000 Repayment of debt (2) (450) (2) (450) Deferred financing costs — (45) (3) (45) Settlement line of credit 6 — 17 27 Settlement activity, net (47) (3) — (29) Acquisition of noncontrolling interests (6) — (6) — Repurchases of Class A common stock (26) (85) (321) (148) Payments for withholding tax related to vesting of restricted stock units (3) (1) (10) (19) Payments of preferred dividends (16) — (31) — Payments on contingent liabilities — (2) — (2) Distributions to noncontrolling interests (2) (19) (141) (19) TRA liability payments and other financing activities (21) (1) (21) (2) Net cash provided by (used in) financing activities (117) 1,707 (518) 1,626 Effect of exchange rate changes on cash and cash equivalents (3) 67 (14) 82 Net increase (decrease) in cash and cash equivalents (162) 1,869 (424) 1,814 Cash and cash equivalents, beginning of period 923 1,384 1,185 1,439 Cash and cash equivalents, end of period (B) $ 761 $ 3,253 $ 761 $ 3,253 (A) Includes $185 million of settlement-related cash acquired from Bambora on March 2, 2026, resulting in a net cash inflow for the six months ended June 30, 2026. (B) The ending balance as of June 30, 2026 includes $405 million of settlement-related cash included within Settlement assets on the Consolidated Balance Sheet.
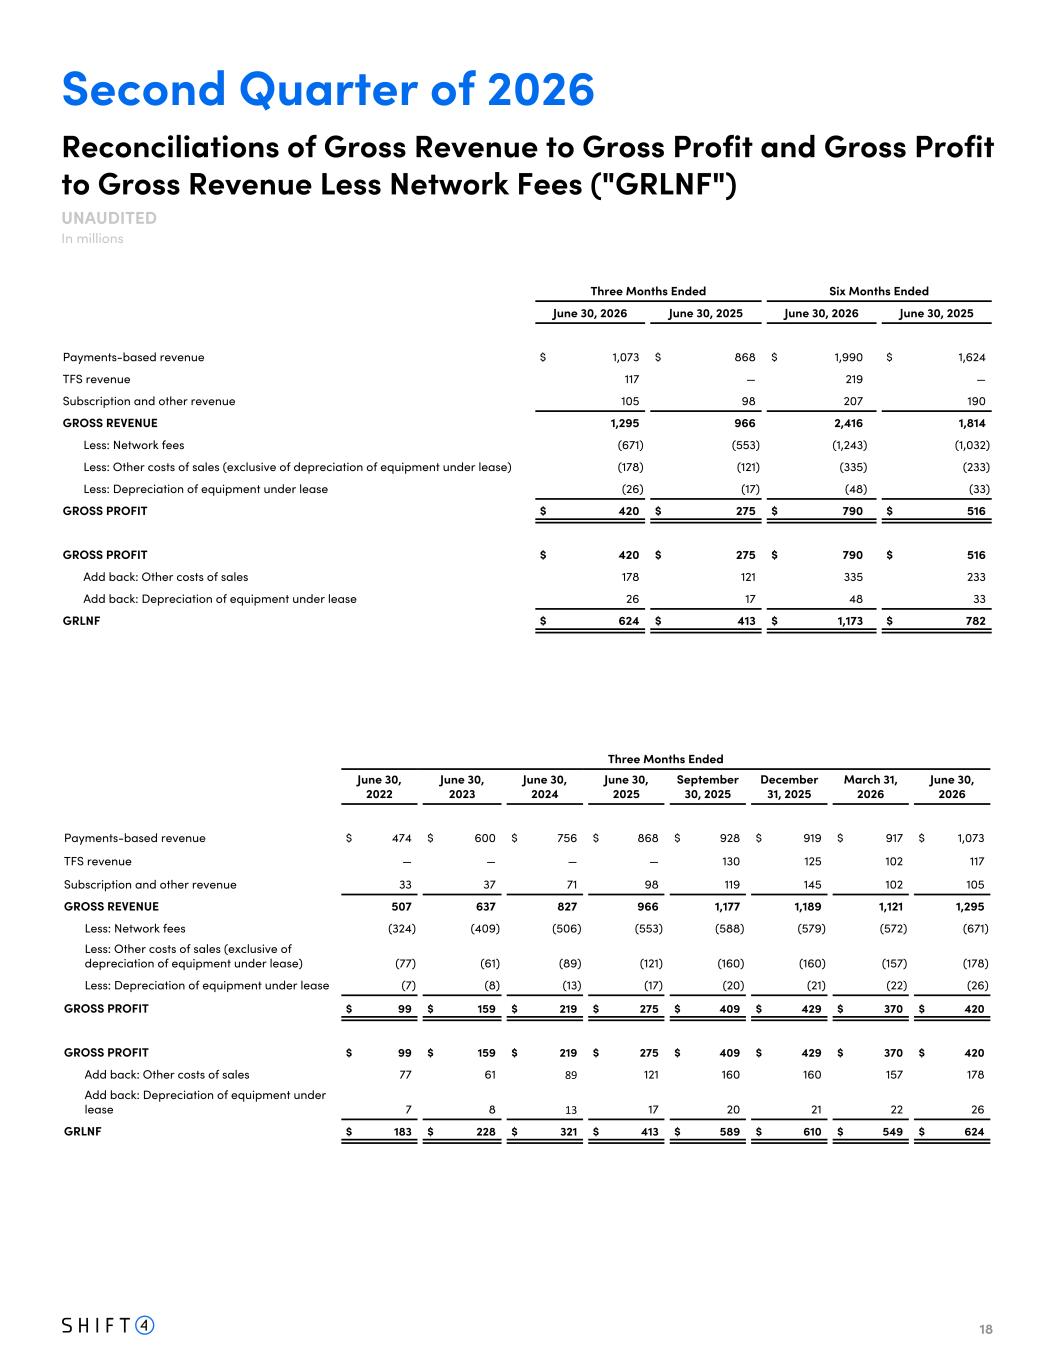
18 Second Quarter of 2026 Reconciliations of Gross Revenue to Gross Profit and Gross Profit to Gross Revenue Less Network Fees ("GRLNF") UNAUDITED In millions Three Months Ended Six Months Ended June 30, 2026 June 30, 2025 June 30, 2026 June 30, 2025 Payments-based revenue $ 1,073 $ 868 $ 1,990 $ 1,624 TFS revenue 117 — 219 — Subscription and other revenue 105 98 207 190 GROSS REVENUE 1,295 966 2,416 1,814 Less: Network fees (671) (553) (1,243) (1,032) Less: Other costs of sales (exclusive of depreciation of equipment under lease) (178) (121) (335) (233) Less: Depreciation of equipment under lease (26) (17) (48) (33) GROSS PROFIT $ 420 $ 275 $ 790 $ 516 GROSS PROFIT $ 420 $ 275 $ 790 $ 516 Add back: Other costs of sales 178 121 335 233 Add back: Depreciation of equipment under lease 26 17 48 33 GRLNF $ 624 $ 413 $ 1,173 $ 782 Three Months Ended June 30, 2022 June 30, 2023 June 30, 2024 June 30, 2025 September 30, 2025 December 31, 2025 March 31, 2026 June 30, 2026 Payments-based revenue $ 474 $ 600 $ 756 $ 868 $ 928 $ 919 $ 917 $ 1,073 TFS revenue — — — — 130 125 102 117 Subscription and other revenue 33 37 71 98 119 145 102 105 GROSS REVENUE 507 637 827 966 1,177 1,189 1,121 1,295 Less: Network fees (324) (409) (506) (553) (588) (579) (572) (671) Less: Other costs of sales (exclusive of depreciation of equipment under lease) (77) (61) (89) (121) (160) (160) (157) (178) Less: Depreciation of equipment under lease (7) (8) (13) (17) (20) (21) (22) (26) GROSS PROFIT $ 99 $ 159 $ 219 $ 275 $ 409 $ 429 $ 370 $ 420 GROSS PROFIT $ 99 $ 159 $ 219 $ 275 $ 409 $ 429 $ 370 $ 420 Add back: Other costs of sales 77 61 89 121 160 160 157 178 Add back: Depreciation of equipment under lease 7 8 13 17 20 21 22 26 GRLNF $ 183 $ 228 $ 321 $ 413 $ 589 $ 610 $ 549 $ 624
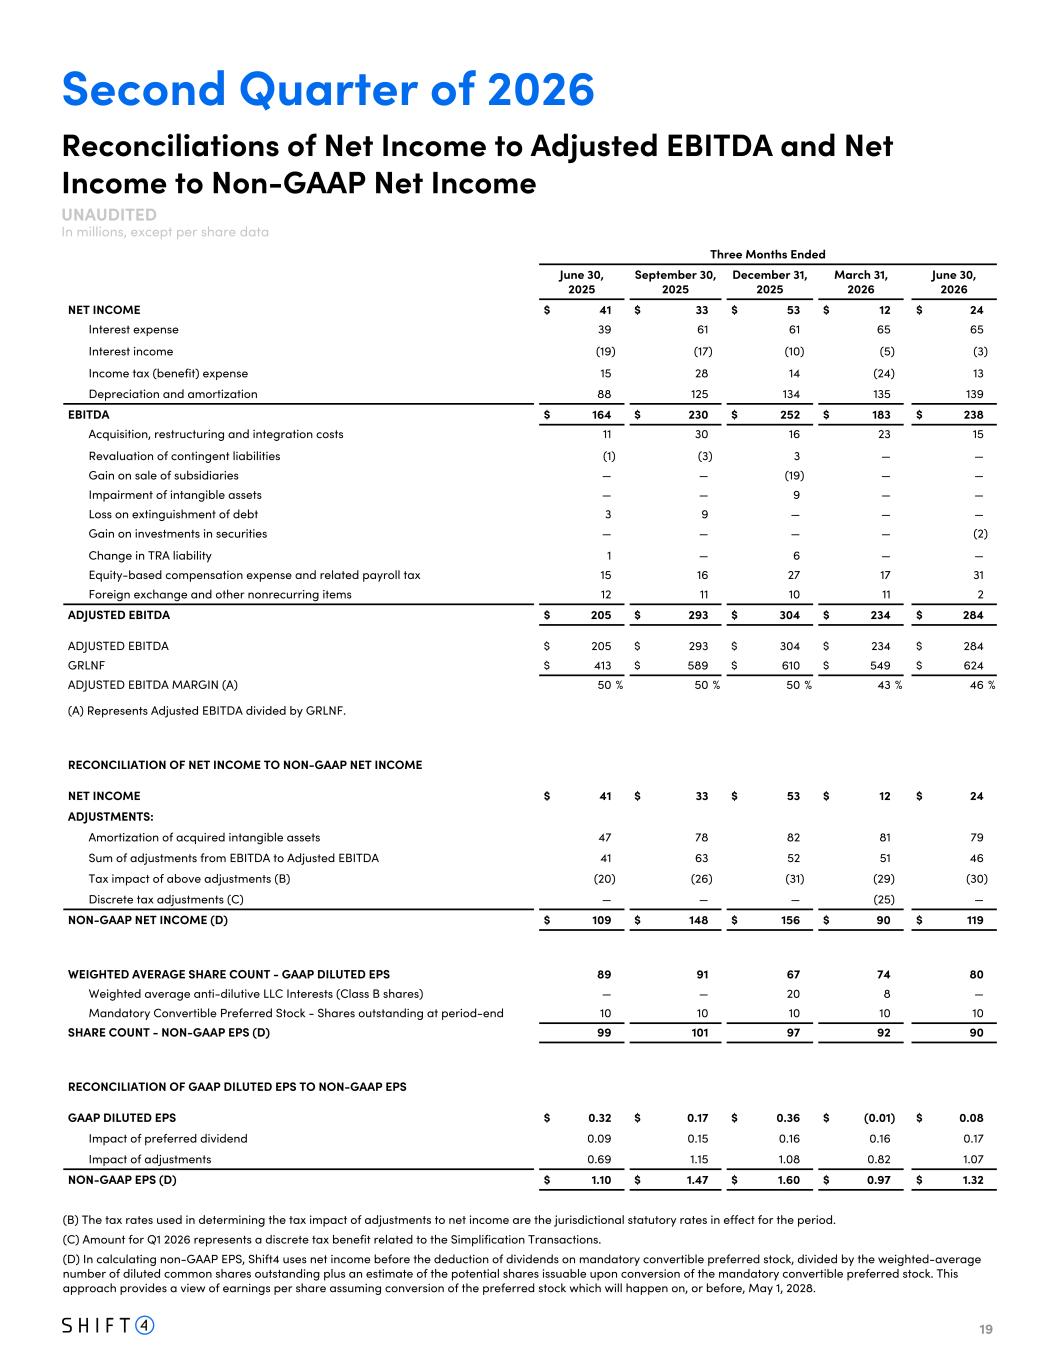
19 Second Quarter of 2026 Reconciliations of Net Income to Adjusted EBITDA and Net Income to Non-GAAP Net Income UNAUDITED In millions, except per share data Three Months Ended June 30, 2025 September 30, 2025 December 31, 2025 March 31, 2026 June 30, 2026 NET INCOME $ 41 $ 33 $ 53 $ 12 $ 24 Interest expense 39 61 61 65 65 Interest income (19) (17) (10) (5) (3) Income tax (benefit) expense 15 28 14 (24) 13 Depreciation and amortization 88 125 134 135 139 EBITDA $ 164 $ 230 $ 252 $ 183 $ 238 Acquisition, restructuring and integration costs 11 30 16 23 15 Revaluation of contingent liabilities (1) (3) 3 — — Gain on sale of subsidiaries — — (19) — — Impairment of intangible assets — — 9 — — Loss on extinguishment of debt 3 9 — — — Gain on investments in securities — — — — (2) Change in TRA liability 1 — 6 — — Equity-based compensation expense and related payroll tax 15 16 27 17 31 Foreign exchange and other nonrecurring items 12 11 10 11 2 ADJUSTED EBITDA $ 205 $ 293 $ 304 $ 234 $ 284 ADJUSTED EBITDA $ 205 $ 293 $ 304 $ 234 $ 284 GRLNF $ 413 $ 589 $ 610 $ 549 $ 624 ADJUSTED EBITDA MARGIN (A) 50 % 50 % 50 % 43 % 46 % (A) Represents Adjusted EBITDA divided by GRLNF. RECONCILIATION OF NET INCOME TO NON-GAAP NET INCOME NET INCOME $ 41 $ 33 $ 53 $ 12 $ 24 ADJUSTMENTS: Amortization of acquired intangible assets 47 78 82 81 79 Sum of adjustments from EBITDA to Adjusted EBITDA 41 63 52 51 46 Tax impact of above adjustments (B) (20) (26) (31) (29) (30) Discrete tax adjustments (C) — — — (25) — NON-GAAP NET INCOME (D) $ 109 $ 148 $ 156 $ 90 $ 119 WEIGHTED AVERAGE SHARE COUNT - GAAP DILUTED EPS 89 91 67 74 80 Weighted average anti-dilutive LLC Interests (Class B shares) — — 20 8 — Mandatory Convertible Preferred Stock - Shares outstanding at period-end 10 10 10 10 10 SHARE COUNT - NON-GAAP EPS (D) 99 101 97 92 90 RECONCILIATION OF GAAP DILUTED EPS TO NON-GAAP EPS GAAP DILUTED EPS $ 0.32 $ 0.17 $ 0.36 $ (0.01) $ 0.08 Impact of preferred dividend 0.09 0.15 0.16 0.16 0.17 Impact of adjustments 0.69 1.15 1.08 0.82 1.07 NON-GAAP EPS (D) $ 1.10 $ 1.47 $ 1.60 $ 0.97 $ 1.32 (B) The tax rates used in determining the tax impact of adjustments to net income are the jurisdictional statutory rates in effect for the period. (C) Amount for Q1 2026 represents a discrete tax benefit related to the Simplification Transactions. (D) In calculating non-GAAP EPS, Shift4 uses net income before the deduction of dividends on mandatory convertible preferred stock, divided by the weighted-average number of diluted common shares outstanding plus an estimate of the potential shares issuable upon conversion of the mandatory convertible preferred stock. This approach provides a view of earnings per share assuming conversion of the preferred stock which will happen on, or before, May 1, 2028.
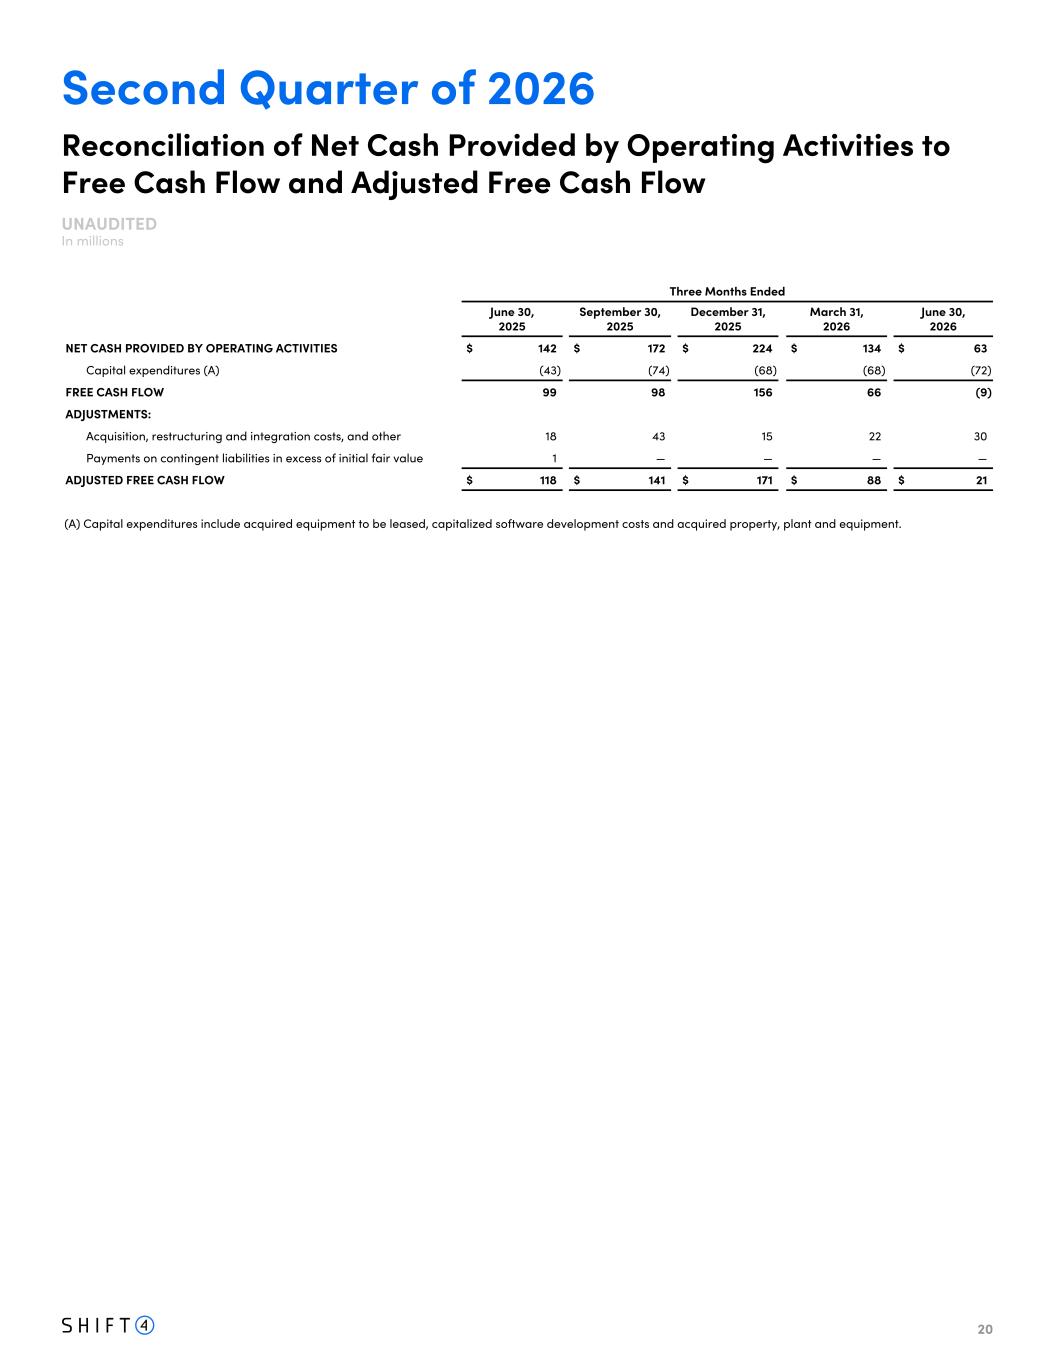
20 Three Months Ended June 30, 2025 September 30, 2025 December 31, 2025 March 31, 2026 June 30, 2026 NET CASH PROVIDED BY OPERATING ACTIVITIES $ 142 $ 172 $ 224 $ 134 $ 63 Capital expenditures (A) (43) (74) (68) (68) (72) FREE CASH FLOW 99 98 156 66 (9) ADJUSTMENTS: Acquisition, restructuring and integration costs, and other 18 43 15 22 30 Payments on contingent liabilities in excess of initial fair value 1 — — — — ADJUSTED FREE CASH FLOW $ 118 $ 141 $ 171 $ 88 $ 21 Reconciliation of Net Cash Provided by Operating Activities to Free Cash Flow and Adjusted Free Cash Flow UNAUDITED In millions Second Quarter of 2026 (A) Capital expenditures include acquired equipment to be leased, capitalized software development costs and acquired property, plant and equipment.
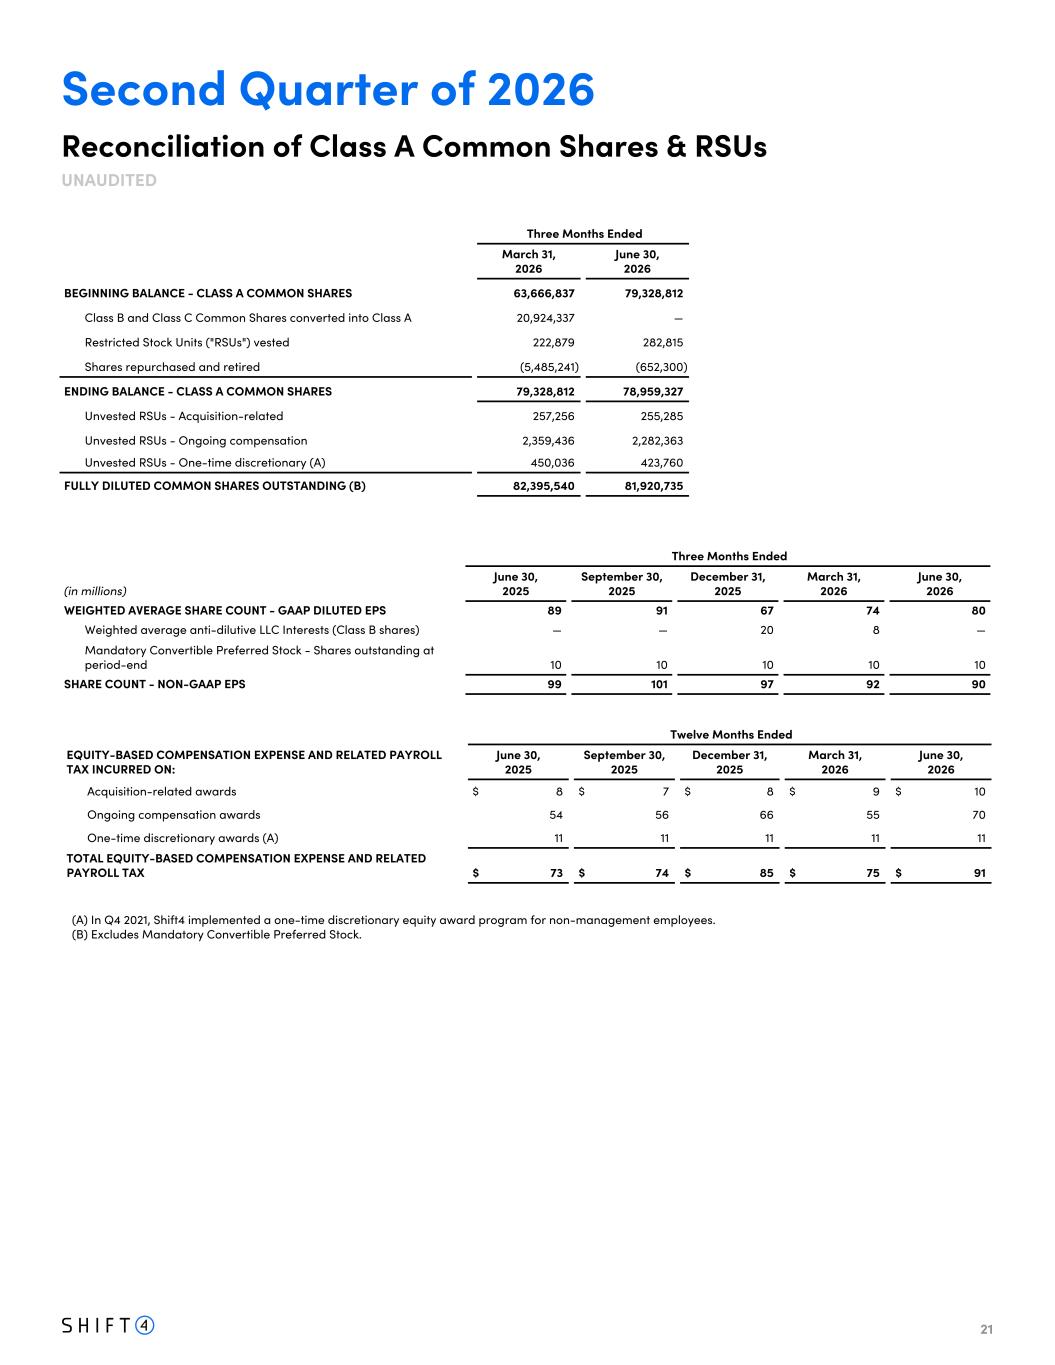
21 (A) In Q4 2021, Shift4 implemented a one-time discretionary equity award program for non-management employees. (B) Excludes Mandatory Convertible Preferred Stock. Second Quarter of 2026 Reconciliation of Class A Common Shares & RSUs UNAUDITED Three Months Ended March 31, 2026 June 30, 2026 BEGINNING BALANCE - CLASS A COMMON SHARES 63,666,837 79,328,812 Class B and Class C Common Shares converted into Class A 20,924,337 — Restricted Stock Units ("RSUs") vested 222,879 282,815 Shares repurchased and retired (5,485,241) (652,300) ENDING BALANCE - CLASS A COMMON SHARES 79,328,812 78,959,327 Unvested RSUs - Acquisition-related 257,256 255,285 Unvested RSUs - Ongoing compensation 2,359,436 2,282,363 Unvested RSUs - One-time discretionary (A) 450,036 423,760 FULLY DILUTED COMMON SHARES OUTSTANDING (B) 82,395,540 81,920,735 Twelve Months Ended EQUITY-BASED COMPENSATION EXPENSE AND RELATED PAYROLL TAX INCURRED ON: June 30, 2025 September 30, 2025 December 31, 2025 March 31, 2026 June 30, 2026 Acquisition-related awards $ 8 $ 7 $ 8 $ 9 $ 10 Ongoing compensation awards 54 56 66 55 70 One-time discretionary awards (A) 11 11 11 11 11 TOTAL EQUITY-BASED COMPENSATION EXPENSE AND RELATED PAYROLL TAX $ 73 $ 74 $ 85 $ 75 $ 91 Three Months Ended (in millions) June 30, 2025 September 30, 2025 December 31, 2025 March 31, 2026 June 30, 2026 WEIGHTED AVERAGE SHARE COUNT - GAAP DILUTED EPS 89 91 67 74 80 Weighted average anti-dilutive LLC Interests (Class B shares) — — 20 8 — Mandatory Convertible Preferred Stock - Shares outstanding at period-end 10 10 10 10 10 SHARE COUNT - NON-GAAP EPS 99 101 97 92 90
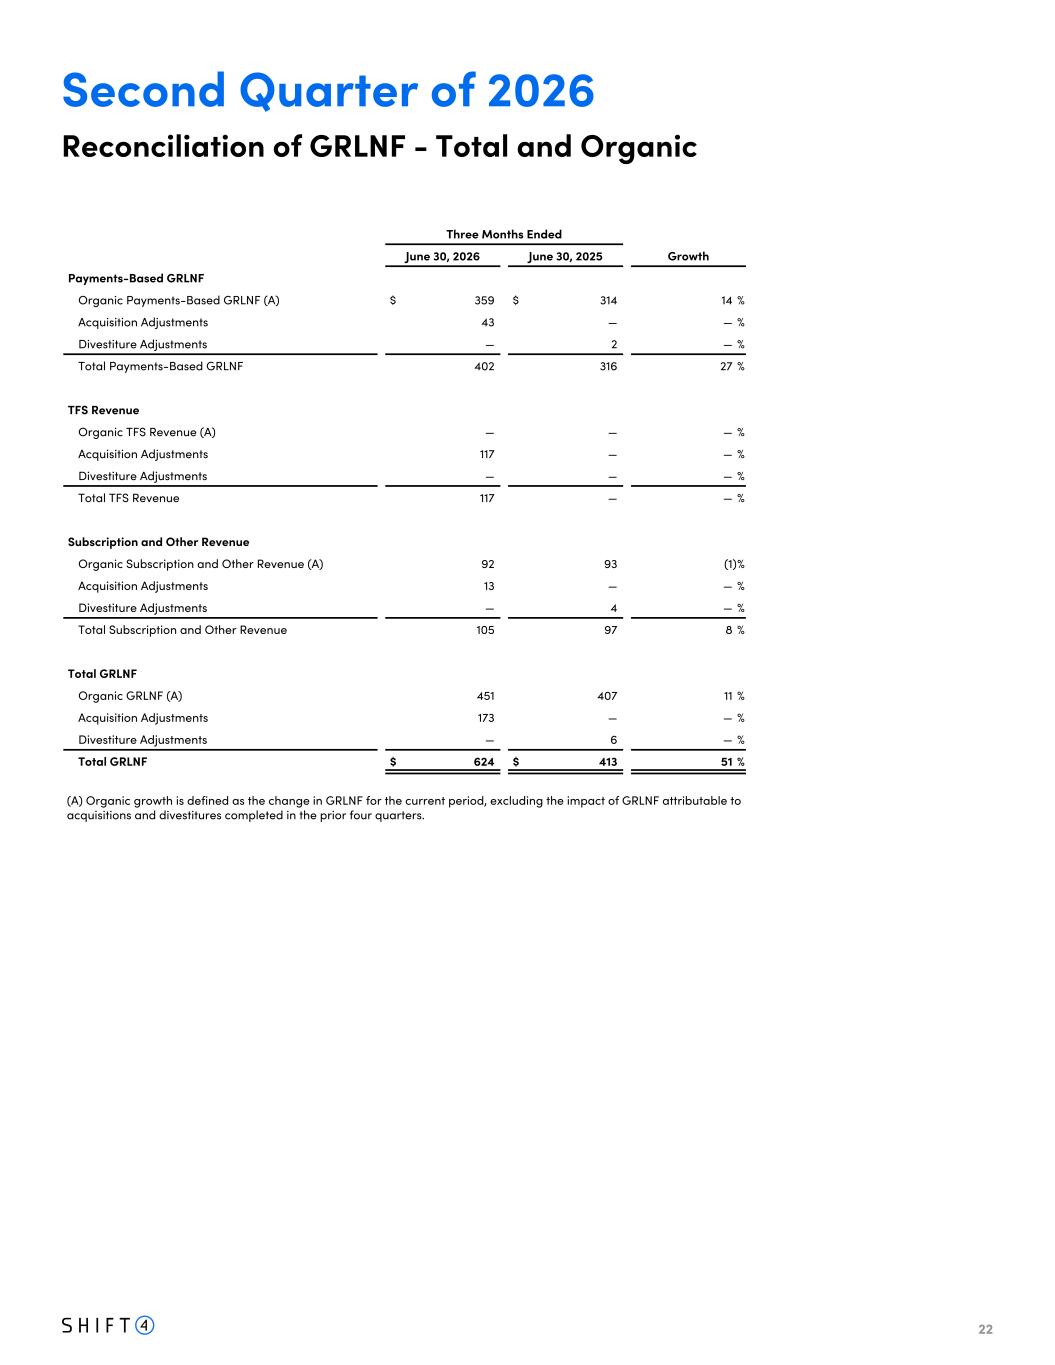
22 Second Quarter of 2026 Reconciliation of GRLNF - Total and Organic Three Months Ended June 30, 2026 June 30, 2025 Growth Payments-Based GRLNF Organic Payments-Based GRLNF (A) $ 359 $ 314 14 % Acquisition Adjustments 43 — — % Divestiture Adjustments — 2 — % Total Payments-Based GRLNF 402 316 27 % TFS Revenue Organic TFS Revenue (A) — — — % Acquisition Adjustments 117 — — % Divestiture Adjustments — — — % Total TFS Revenue 117 — — % Subscription and Other Revenue Organic Subscription and Other Revenue (A) 92 93 (1) % Acquisition Adjustments 13 — — % Divestiture Adjustments — 4 — % Total Subscription and Other Revenue 105 97 8 % Total GRLNF Organic GRLNF (A) 451 407 11 % Acquisition Adjustments 173 — — % Divestiture Adjustments — 6 — % Total GRLNF $ 624 $ 413 51 % (A) Organic growth is defined as the change in GRLNF for the current period, excluding the impact of GRLNF attributable to acquisitions and divestitures completed in the prior four quarters.