Loma Negra Reports 2Q26 results Buenos Aires, August 6, 2026 – Loma Negra, (NYSE: LOMA; BYMA: LOMA), (“Loma Negra” or the “Company”), the leading cement producer in Argentina, today announced results for the three-month period ended June 30, 2026 (our “2Q26 Results”). 2Q26 Key Highlights Net sales revenues stood at Ps. 238,053 million (US$ 166 million), and increased by 2.1% YoY, mainly explained by an increase of 2.2% in the top line of the Cement segment. Consolidated Adjusted EBITDA reached Ps. 48,175 million, decreasing by 2.5% YoY in pesos, while in dollars it reached US$ 38 million, up 12.5% from 2Q25. The Consolidated Adjusted EBITDA margin stood at 20.2%, decreasing by 97 basis points YoY from 21.2%. Net Profit of Ps. 7,043 million, compared to a net profit of Ps. 514 million in the same period of the previous year, mainly driven by lower total net financial cost. Net Debt stood at Ps. 273,650 million (US$ 185 million), representing a Net Debt/LTM Adjusted EBITDA ratio of 1.30x, compared to 1.47x in FY25 (and a slight improvement vs. 1.33x reported in 1Q26). The Company has presented certain financial figures, Table 1b and Table 11, in U.S. dollars and Pesos without giving effect to IAS 29. The Company has prepared all other financial information herein by applying IAS 29. Commenting on the financial and operating performance for the second quarter of 2026, Sergio Faifman, Loma Negra’s Chief Executive Officer, noted: “As we move through the second quarter, industry volumes have not yet fully regained the momentum we were expecting. Performance during the quarter was mainly affected by a weak April, impacted by heavy rains, while May and June trends were more in line with the levels registered a year ago. Regarding our second-quarter results, margins in pesos remained broadly in line year-over-year, while the sequential comparison was more affected by higher costs, some of them seasonal. Our top line continued to show a positive trend, although volumes are still lagging. In dollar terms, EBITDA per ton improved year-over-year and remains at healthy levels, underscoring the resilience of our operations even as demand recovery remains gradual. Looking ahead, we will continue to focus on preserving our efficiency gains as we await a stronger level of activity in the second half of the year.”
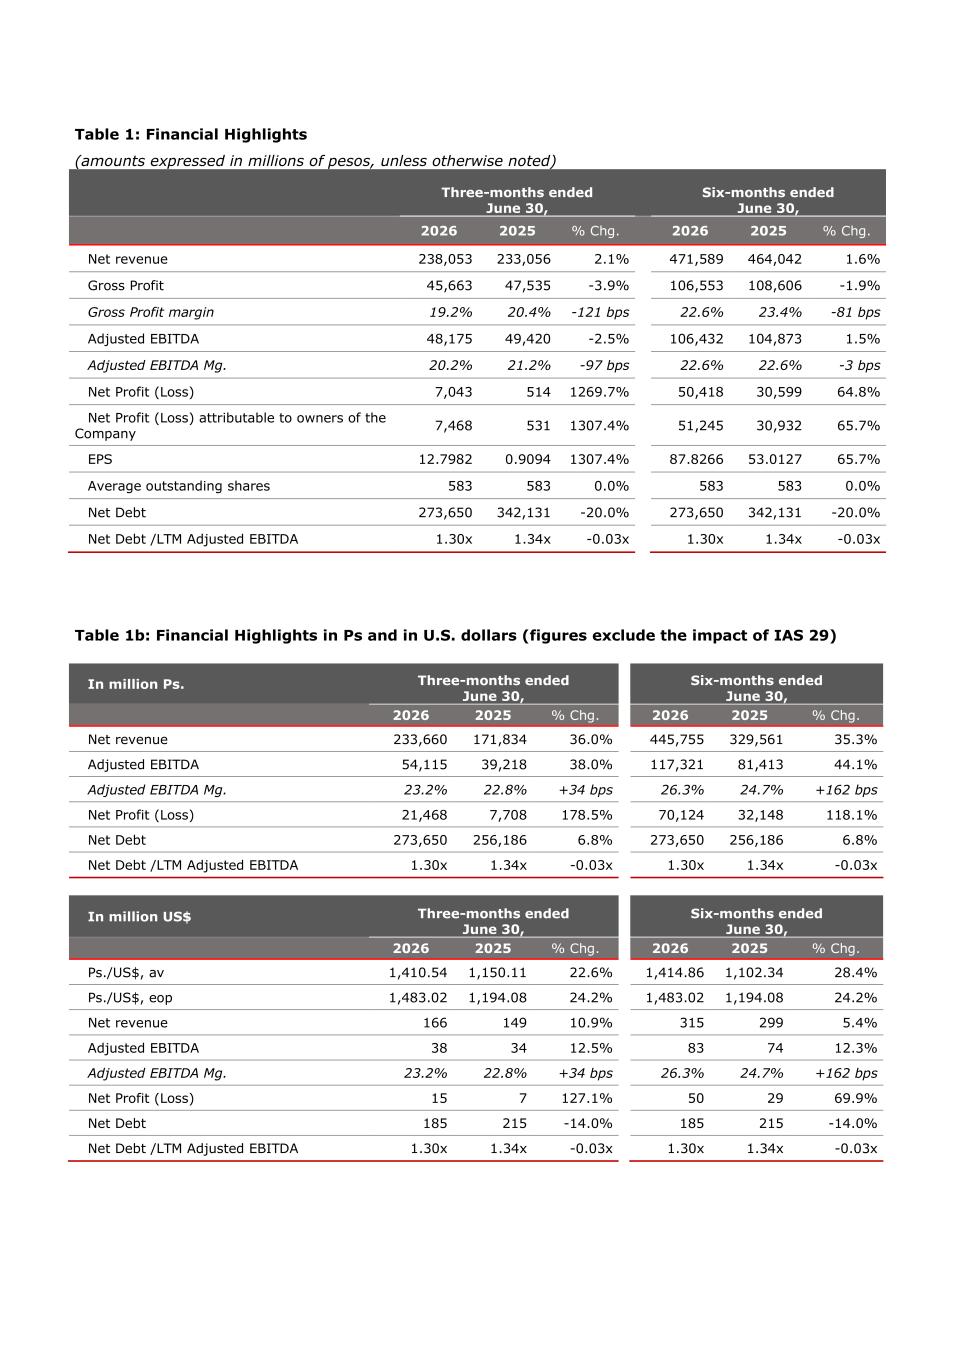
Table 1: Financial Highlights (amounts expressed in millions of pesos, unless otherwise noted) Three-months ended June 30, Six-months ended June 30, 2026 2025 % Chg. 2026 2025 % Chg. Net revenue 238,053 233,056 2.1% 471,589 464,042 1.6% Gross Profit 45,663 47,535 -3.9% 106,553 108,606 -1.9% Gross Profit margin 19.2% 20.4% -121 bps 22.6% 23.4% -81 bps Adjusted EBITDA 48,175 49,420 -2.5% 106,432 104,873 1.5% Adjusted EBITDA Mg. 20.2% 21.2% -97 bps 22.6% 22.6% -3 bps Net Profit (Loss) 7,043 514 1269.7% 50,418 30,599 64.8% Net Profit (Loss) attributable to owners of the Company 7,468 531 1307.4% 51,245 30,932 65.7% EPS 12.7982 0.9094 1307.4% 87.8266 53.0127 65.7% Average outstanding shares 583 583 0.0% 583 583 0.0% Net Debt 273,650 342,131 -20.0% 273,650 342,131 -20.0% Net Debt /LTM Adjusted EBITDA 1.30x 1.34x -0.03x 1.30x 1.34x -0.03x Table 1b: Financial Highlights in Ps and in U.S. dollars (figures exclude the impact of IAS 29) In million Ps. Three-months ended June 30, Six-months ended June 30, 2026 2025 % Chg. 2026 2025 % Chg. Net revenue 233,660 171,834 36.0% 445,755 329,561 35.3% Adjusted EBITDA 54,115 39,218 38.0% 117,321 81,413 44.1% Adjusted EBITDA Mg. 23.2% 22.8% +34 bps 26.3% 24.7% +162 bps Net Profit (Loss) 21,468 7,708 178.5% 70,124 32,148 118.1% Net Debt 273,650 256,186 6.8% 273,650 256,186 6.8% Net Debt /LTM Adjusted EBITDA 1.30x 1.34x -0.03x 1.30x 1.34x -0.03x In million US$ Three-months ended June 30, Six-months ended June 30, 2026 2025 % Chg. 2026 2025 % Chg. Ps./US$, av 1,410.54 1,150.11 22.6% 1,414.86 1,102.34 28.4% Ps./US$, eop 1,483.02 1,194.08 24.2% 1,483.02 1,194.08 24.2% Net revenue 166 149 10.9% 315 299 5.4% Adjusted EBITDA 38 34 12.5% 83 74 12.3% Adjusted EBITDA Mg. 23.2% 22.8% +34 bps 26.3% 24.7% +162 bps Net Profit (Loss) 15 7 127.1% 50 29 69.9% Net Debt 185 215 -14.0% 185 215 -14.0% Net Debt /LTM Adjusted EBITDA 1.30x 1.34x -0.03x 1.30x 1.34x -0.03x
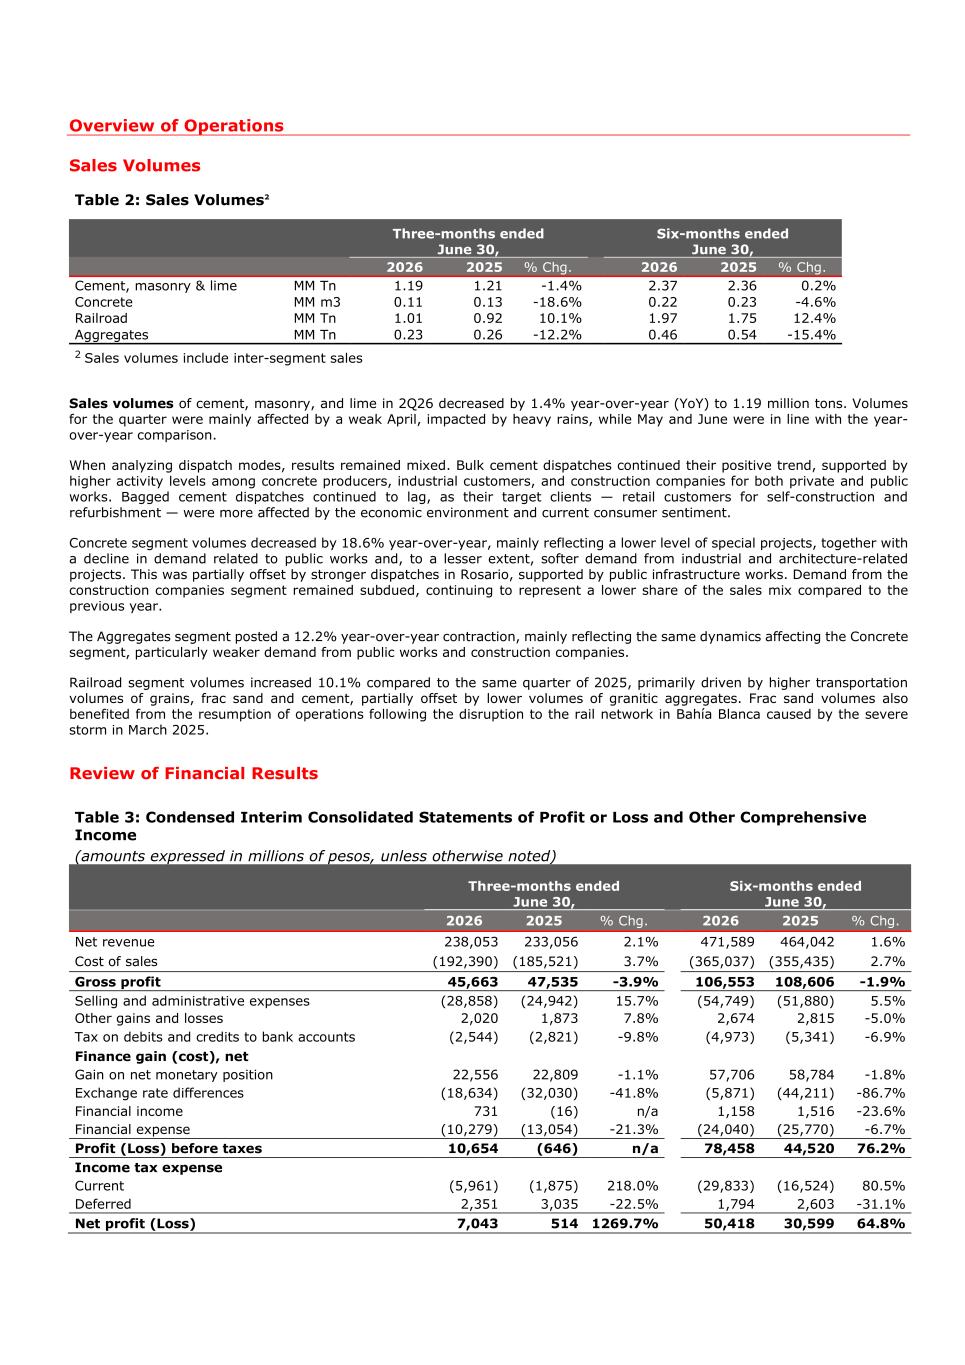
Overview of Operations Sales Volumes Table 2: Sales Volumes2 Three-months ended June 30, Six-months ended June 30, 2026 2025 % Chg. 2026 2025 % Chg. Cement, masonry & lime MM Tn 1.19 1.21 -1.4% 2.37 2.36 0.2% Concrete MM m3 0.11 0.13 -18.6% 0.22 0.23 -4.6% Railroad MM Tn 1.01 0.92 10.1% 1.97 1.75 12.4% Aggregates MM Tn 0.23 0.26 -12.2% 0.46 0.54 -15.4% 2 Sales volumes include inter-segment sales Sales volumes of cement, masonry, and lime in 2Q26 decreased by 1.4% year-over-year (YoY) to 1.19 million tons. Volumes for the quarter were mainly affected by a weak April, impacted by heavy rains, while May and June were in line with the year- over-year comparison. When analyzing dispatch modes, results remained mixed. Bulk cement dispatches continued their positive trend, supported by higher activity levels among concrete producers, industrial customers, and construction companies for both private and public works. Bagged cement dispatches continued to lag, as their target clients — retail customers for self-construction and refurbishment — were more affected by the economic environment and current consumer sentiment. Concrete segment volumes decreased by 18.6% year-over-year, mainly reflecting a lower level of special projects, together with a decline in demand related to public works and, to a lesser extent, softer demand from industrial and architecture-related projects. This was partially offset by stronger dispatches in Rosario, supported by public infrastructure works. Demand from the construction companies segment remained subdued, continuing to represent a lower share of the sales mix compared to the previous year. The Aggregates segment posted a 12.2% year-over-year contraction, mainly reflecting the same dynamics affecting the Concrete segment, particularly weaker demand from public works and construction companies. Railroad segment volumes increased 10.1% compared to the same quarter of 2025, primarily driven by higher transportation volumes of grains, frac sand and cement, partially offset by lower volumes of granitic aggregates. Frac sand volumes also benefited from the resumption of operations following the disruption to the rail network in Bahía Blanca caused by the severe storm in March 2025. Review of Financial Results Table 3: Condensed Interim Consolidated Statements of Profit or Loss and Other Comprehensive Income (amounts expressed in millions of pesos, unless otherwise noted) Three-months ended June 30, Six-months ended June 30, 2026 2025 % Chg. 2026 2025 % Chg. Net revenue 238,053 233,056 2.1% 471,589 464,042 1.6% Cost of sales (192,390) (185,521) 3.7% (365,037) (355,435) 2.7% Gross profit 45,663 47,535 -3.9% 106,553 108,606 -1.9% Selling and administrative expenses (28,858) (24,942) 15.7% (54,749) (51,880) 5.5% Other gains and losses 2,020 1,873 7.8% 2,674 2,815 -5.0% Tax on debits and credits to bank accounts (2,544) (2,821) -9.8% (4,973) (5,341) -6.9% Finance gain (cost), net Gain on net monetary position 22,556 22,809 -1.1% 57,706 58,784 -1.8% Exchange rate differences (18,634) (32,030) -41.8% (5,871) (44,211) -86.7% Financial income 731 (16) n/a 1,158 1,516 -23.6% Financial expense (10,279) (13,054) -21.3% (24,040) (25,770) -6.7% Profit (Loss) before taxes 10,654 (646) n/a 78,458 44,520 76.2% Income tax expense Current (5,961) (1,875) 218.0% (29,833) (16,524) 80.5% Deferred 2,351 3,035 -22.5% 1,794 2,603 -31.1% Net profit (Loss) 7,043 514 1269.7% 50,418 30,599 64.8%
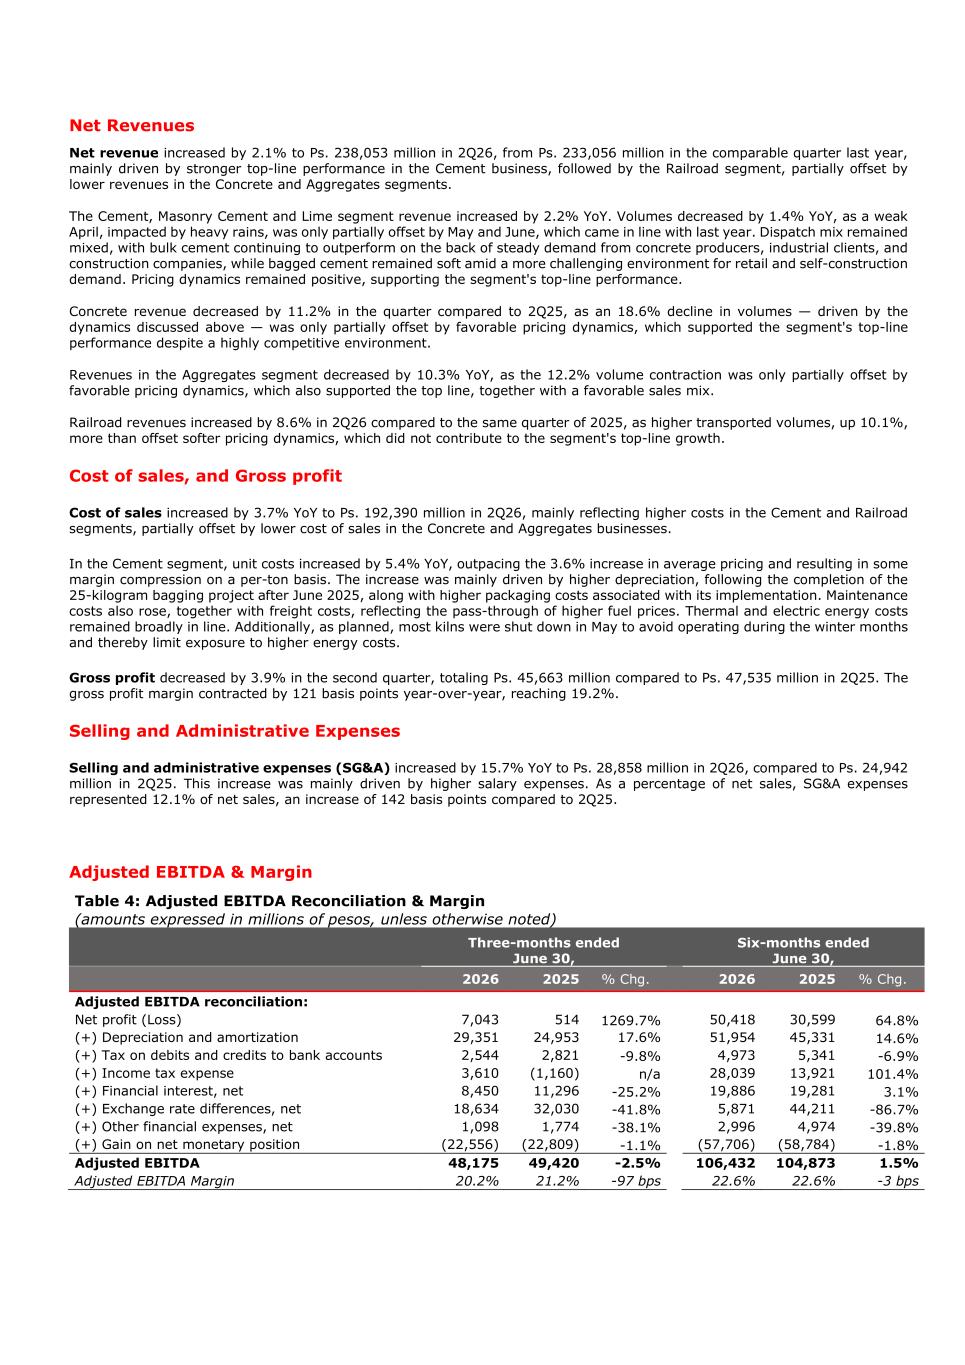
Net Revenues Net revenue increased by 2.1% to Ps. 238,053 million in 2Q26, from Ps. 233,056 million in the comparable quarter last year, mainly driven by stronger top-line performance in the Cement business, followed by the Railroad segment, partially offset by lower revenues in the Concrete and Aggregates segments. The Cement, Masonry Cement and Lime segment revenue increased by 2.2% YoY. Volumes decreased by 1.4% YoY, as a weak April, impacted by heavy rains, was only partially offset by May and June, which came in line with last year. Dispatch mix remained mixed, with bulk cement continuing to outperform on the back of steady demand from concrete producers, industrial clients, and construction companies, while bagged cement remained soft amid a more challenging environment for retail and self-construction demand. Pricing dynamics remained positive, supporting the segment's top-line performance. Concrete revenue decreased by 11.2% in the quarter compared to 2Q25, as an 18.6% decline in volumes — driven by the dynamics discussed above — was only partially offset by favorable pricing dynamics, which supported the segment's top-line performance despite a highly competitive environment. Revenues in the Aggregates segment decreased by 10.3% YoY, as the 12.2% volume contraction was only partially offset by favorable pricing dynamics, which also supported the top line, together with a favorable sales mix. Railroad revenues increased by 8.6% in 2Q26 compared to the same quarter of 2025, as higher transported volumes, up 10.1%, more than offset softer pricing dynamics, which did not contribute to the segment's top-line growth. Cost of sales, and Gross profit Cost of sales increased by 3.7% YoY to Ps. 192,390 million in 2Q26, mainly reflecting higher costs in the Cement and Railroad segments, partially offset by lower cost of sales in the Concrete and Aggregates businesses. In the Cement segment, unit costs increased by 5.4% YoY, outpacing the 3.6% increase in average pricing and resulting in some margin compression on a per-ton basis. The increase was mainly driven by higher depreciation, following the completion of the 25-kilogram bagging project after June 2025, along with higher packaging costs associated with its implementation. Maintenance costs also rose, together with freight costs, reflecting the pass-through of higher fuel prices. Thermal and electric energy costs remained broadly in line. Additionally, as planned, most kilns were shut down in May to avoid operating during the winter months and thereby limit exposure to higher energy costs. Gross profit decreased by 3.9% in the second quarter, totaling Ps. 45,663 million compared to Ps. 47,535 million in 2Q25. The gross profit margin contracted by 121 basis points year-over-year, reaching 19.2%. Selling and Administrative Expenses Selling and administrative expenses (SG&A) increased by 15.7% YoY to Ps. 28,858 million in 2Q26, compared to Ps. 24,942 million in 2Q25. This increase was mainly driven by higher salary expenses. As a percentage of net sales, SG&A expenses represented 12.1% of net sales, an increase of 142 basis points compared to 2Q25. Adjusted EBITDA & Margin Table 4: Adjusted EBITDA Reconciliation & Margin (amounts expressed in millions of pesos, unless otherwise noted) Three-months ended June 30, Six-months ended June 30, 2026 2025 % Chg. 2026 2025 % Chg. Adjusted EBITDA reconciliation: Net profit (Loss) 7,043 514 1269.7% 50,418 30,599 64.8% (+) Depreciation and amortization 29,351 24,953 17.6% 51,954 45,331 14.6% (+) Tax on debits and credits to bank accounts 2,544 2,821 -9.8% 4,973 5,341 -6.9% (+) Income tax expense 3,610 (1,160) n/a 28,039 13,921 101.4% (+) Financial interest, net 8,450 11,296 -25.2% 19,886 19,281 3.1% (+) Exchange rate differences, net 18,634 32,030 -41.8% 5,871 44,211 -86.7% (+) Other financial expenses, net 1,098 1,774 -38.1% 2,996 4,974 -39.8% (+) Gain on net monetary position (22,556) (22,809) -1.1% (57,706) (58,784) -1.8% Adjusted EBITDA 48,175 49,420 -2.5% 106,432 104,873 1.5% Adjusted EBITDA Margin 20.2% 21.2% -97 bps 22.6% 22.6% -3 bps
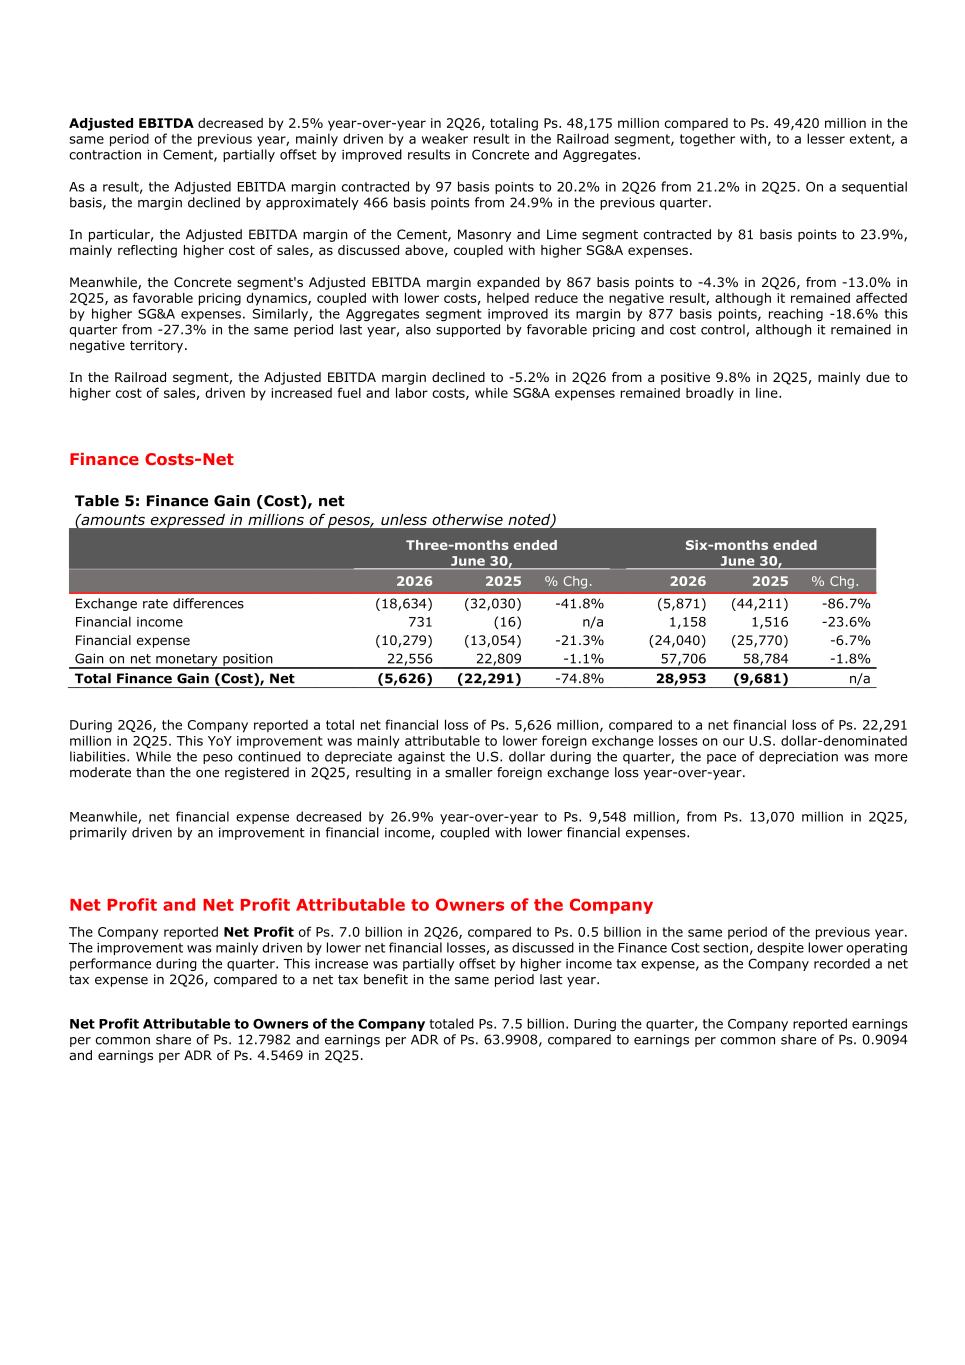
Adjusted EBITDA decreased by 2.5% year-over-year in 2Q26, totaling Ps. 48,175 million compared to Ps. 49,420 million in the same period of the previous year, mainly driven by a weaker result in the Railroad segment, together with, to a lesser extent, a contraction in Cement, partially offset by improved results in Concrete and Aggregates. As a result, the Adjusted EBITDA margin contracted by 97 basis points to 20.2% in 2Q26 from 21.2% in 2Q25. On a sequential basis, the margin declined by approximately 466 basis points from 24.9% in the previous quarter. In particular, the Adjusted EBITDA margin of the Cement, Masonry and Lime segment contracted by 81 basis points to 23.9%, mainly reflecting higher cost of sales, as discussed above, coupled with higher SG&A expenses. Meanwhile, the Concrete segment's Adjusted EBITDA margin expanded by 867 basis points to -4.3% in 2Q26, from -13.0% in 2Q25, as favorable pricing dynamics, coupled with lower costs, helped reduce the negative result, although it remained affected by higher SG&A expenses. Similarly, the Aggregates segment improved its margin by 877 basis points, reaching -18.6% this quarter from -27.3% in the same period last year, also supported by favorable pricing and cost control, although it remained in negative territory. In the Railroad segment, the Adjusted EBITDA margin declined to -5.2% in 2Q26 from a positive 9.8% in 2Q25, mainly due to higher cost of sales, driven by increased fuel and labor costs, while SG&A expenses remained broadly in line. Finance Costs-Net Table 5: Finance Gain (Cost), net (amounts expressed in millions of pesos, unless otherwise noted) Three-months ended June 30, Six-months ended June 30, 2026 2025 % Chg. 2026 2025 % Chg. Exchange rate differences (18,634) (32,030) -41.8% (5,871) (44,211) -86.7% Financial income 731 (16) n/a 1,158 1,516 -23.6% Financial expense (10,279) (13,054) -21.3% (24,040) (25,770) -6.7% Gain on net monetary position 22,556 22,809 -1.1% 57,706 58,784 -1.8% Total Finance Gain (Cost), Net (5,626) (22,291) -74.8% 28,953 (9,681) n/a During 2Q26, the Company reported a total net financial loss of Ps. 5,626 million, compared to a net financial loss of Ps. 22,291 million in 2Q25. This YoY improvement was mainly attributable to lower foreign exchange losses on our U.S. dollar-denominated liabilities. While the peso continued to depreciate against the U.S. dollar during the quarter, the pace of depreciation was more moderate than the one registered in 2Q25, resulting in a smaller foreign exchange loss year-over-year. Meanwhile, net financial expense decreased by 26.9% year-over-year to Ps. 9,548 million, from Ps. 13,070 million in 2Q25, primarily driven by an improvement in financial income, coupled with lower financial expenses. Net Profit and Net Profit Attributable to Owners of the Company The Company reported Net Profit of Ps. 7.0 billion in 2Q26, compared to Ps. 0.5 billion in the same period of the previous year. The improvement was mainly driven by lower net financial losses, as discussed in the Finance Cost section, despite lower operating performance during the quarter. This increase was partially offset by higher income tax expense, as the Company recorded a net tax expense in 2Q26, compared to a net tax benefit in the same period last year. Net Profit Attributable to Owners of the Company totaled Ps. 7.5 billion. During the quarter, the Company reported earnings per common share of Ps. 12.7982 and earnings per ADR of Ps. 63.9908, compared to earnings per common share of Ps. 0.9094 and earnings per ADR of Ps. 4.5469 in 2Q25.
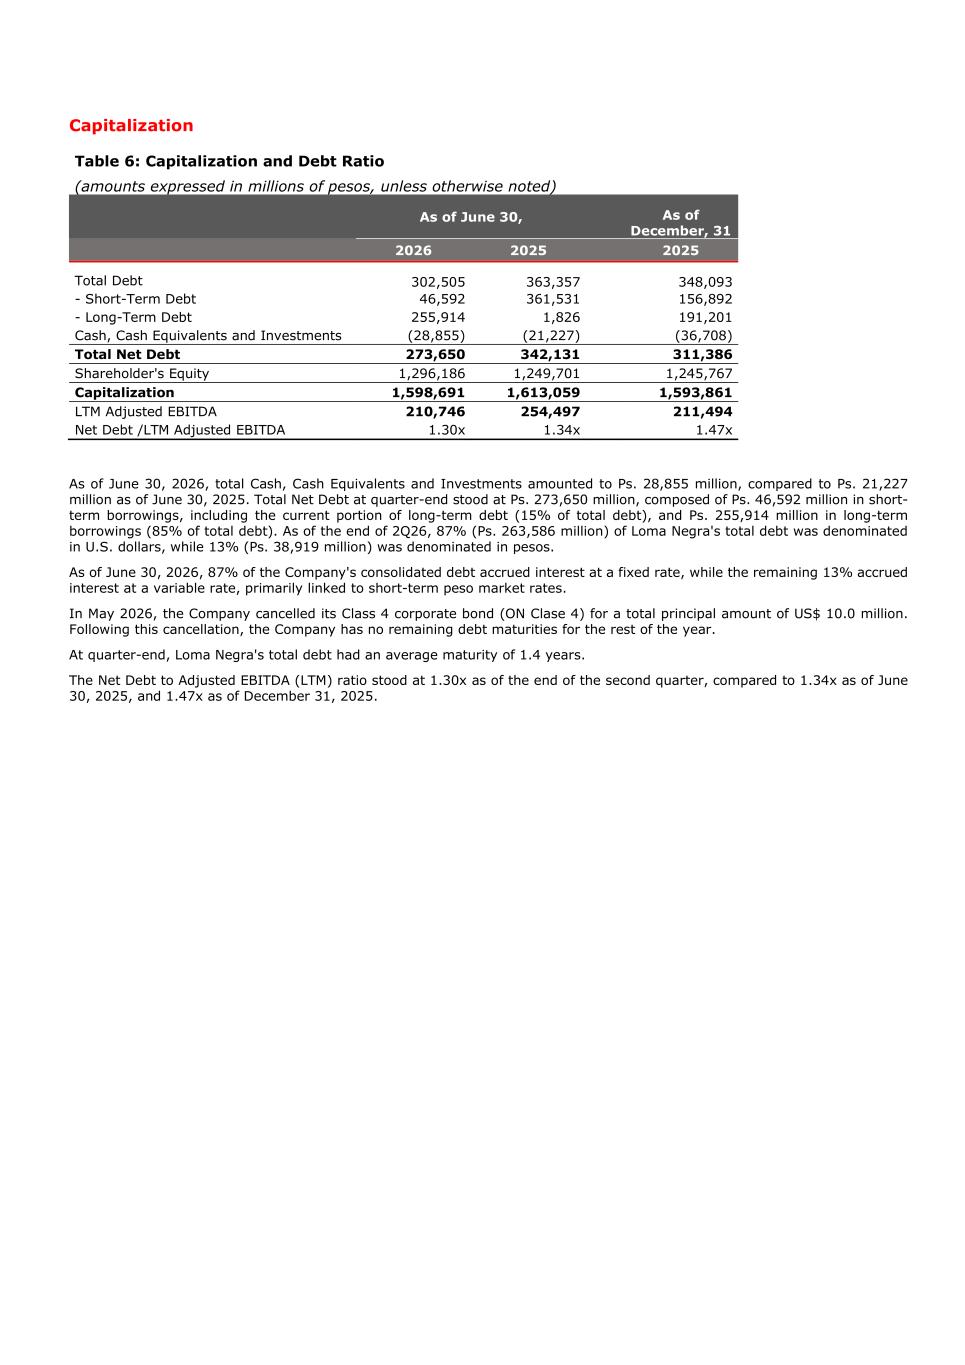
Capitalization Table 6: Capitalization and Debt Ratio (amounts expressed in millions of pesos, unless otherwise noted) As of June 30, As of December, 31 2026 2025 2025 Total Debt 302,505 363,357 348,093 - Short-Term Debt 46,592 361,531 156,892 - Long-Term Debt 255,914 1,826 191,201 Cash, Cash Equivalents and Investments (28,855) (21,227) (36,708) Total Net Debt 273,650 342,131 311,386 Shareholder's Equity 1,296,186 1,249,701 1,245,767 Capitalization 1,598,691 1,613,059 1,593,861 LTM Adjusted EBITDA 210,746 254,497 211,494 Net Debt /LTM Adjusted EBITDA 1.30x 1.34x 1.47x As of June 30, 2026, total Cash, Cash Equivalents and Investments amounted to Ps. 28,855 million, compared to Ps. 21,227 million as of June 30, 2025. Total Net Debt at quarter-end stood at Ps. 273,650 million, composed of Ps. 46,592 million in short- term borrowings, including the current portion of long-term debt (15% of total debt), and Ps. 255,914 million in long-term borrowings (85% of total debt). As of the end of 2Q26, 87% (Ps. 263,586 million) of Loma Negra's total debt was denominated in U.S. dollars, while 13% (Ps. 38,919 million) was denominated in pesos. As of June 30, 2026, 87% of the Company's consolidated debt accrued interest at a fixed rate, while the remaining 13% accrued interest at a variable rate, primarily linked to short-term peso market rates. In May 2026, the Company cancelled its Class 4 corporate bond (ON Clase 4) for a total principal amount of US$ 10.0 million. Following this cancellation, the Company has no remaining debt maturities for the rest of the year. At quarter-end, Loma Negra's total debt had an average maturity of 1.4 years. The Net Debt to Adjusted EBITDA (LTM) ratio stood at 1.30x as of the end of the second quarter, compared to 1.34x as of June 30, 2025, and 1.47x as of December 31, 2025.
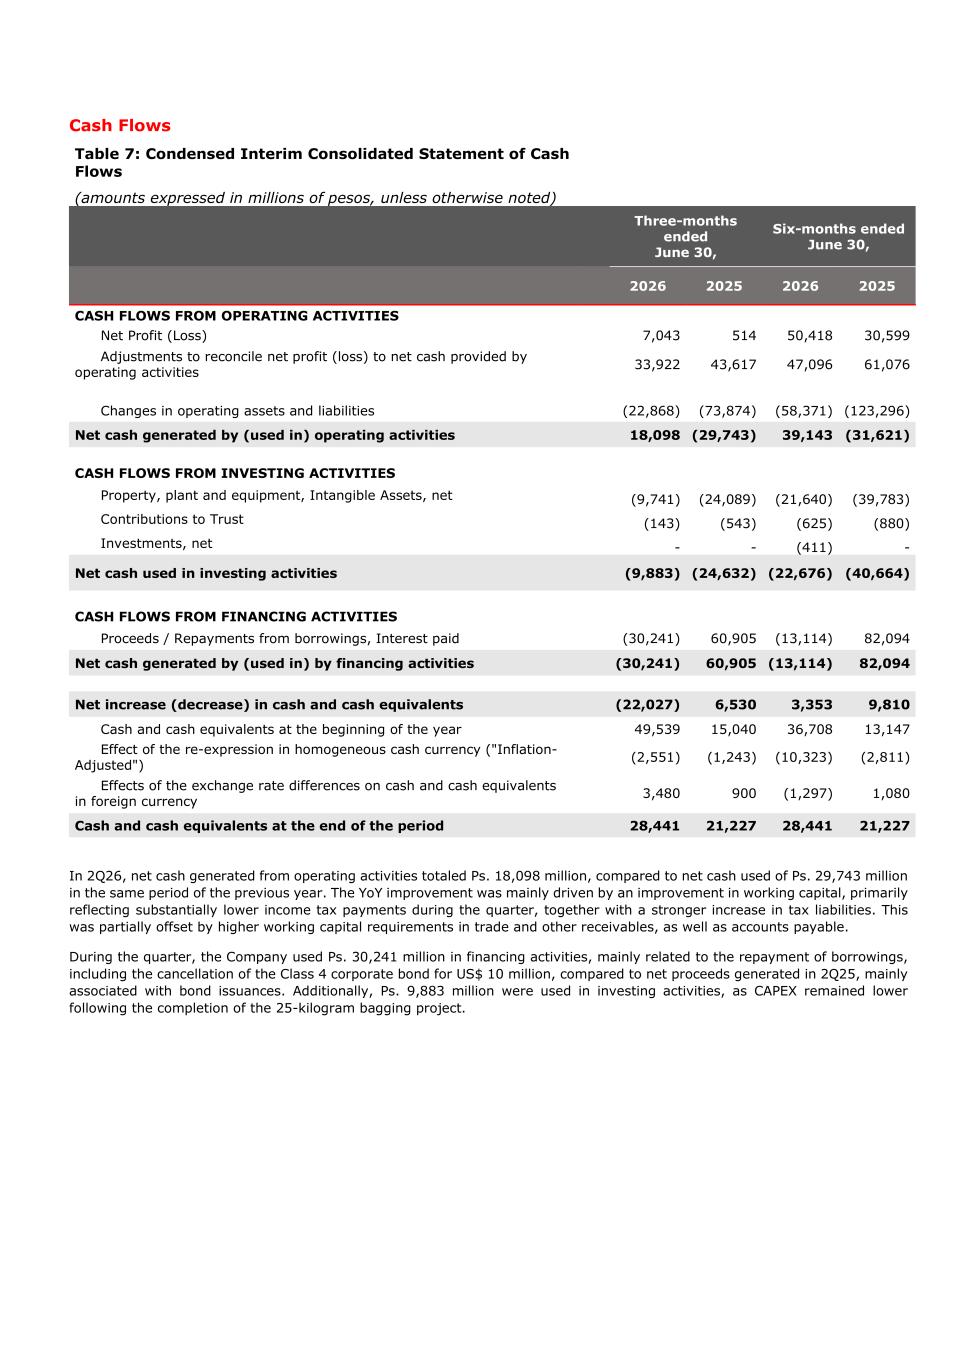
Cash Flows Table 7: Condensed Interim Consolidated Statement of Cash Flows (amounts expressed in millions of pesos, unless otherwise noted) Three-months ended June 30, Six-months ended June 30, 2026 2025 2026 2025 CASH FLOWS FROM OPERATING ACTIVITIES Net Profit (Loss) 7,043 514 50,418 30,599 Adjustments to reconcile net profit (loss) to net cash provided by operating activities 33,922 43,617 47,096 61,076 Changes in operating assets and liabilities (22,868) (73,874) (58,371) (123,296) Net cash generated by (used in) operating activities 18,098 (29,743) 39,143 (31,621) CASH FLOWS FROM INVESTING ACTIVITIES Property, plant and equipment, Intangible Assets, net (9,741) (24,089) (21,640) (39,783) Contributions to Trust (143) (543) (625) (880) Investments, net - - (411) - Net cash used in investing activities (9,883) (24,632) (22,676) (40,664) CASH FLOWS FROM FINANCING ACTIVITIES Proceeds / Repayments from borrowings, Interest paid (30,241) 60,905 (13,114) 82,094 Net cash generated by (used in) by financing activities (30,241) 60,905 (13,114) 82,094 Net increase (decrease) in cash and cash equivalents (22,027) 6,530 3,353 9,810 Cash and cash equivalents at the beginning of the year 49,539 15,040 36,708 13,147 Effect of the re-expression in homogeneous cash currency ("Inflation- Adjusted") (2,551) (1,243) (10,323) (2,811) Effects of the exchange rate differences on cash and cash equivalents in foreign currency 3,480 900 (1,297) 1,080 Cash and cash equivalents at the end of the period 28,441 21,227 28,441 21,227 In 2Q26, net cash generated from operating activities totaled Ps. 18,098 million, compared to net cash used of Ps. 29,743 million in the same period of the previous year. The YoY improvement was mainly driven by an improvement in working capital, primarily reflecting substantially lower income tax payments during the quarter, together with a stronger increase in tax liabilities. This was partially offset by higher working capital requirements in trade and other receivables, as well as accounts payable. During the quarter, the Company used Ps. 30,241 million in financing activities, mainly related to the repayment of borrowings, including the cancellation of the Class 4 corporate bond for US$ 10 million, compared to net proceeds generated in 2Q25, mainly associated with bond issuances. Additionally, Ps. 9,883 million were used in investing activities, as CAPEX remained lower following the completion of the 25-kilogram bagging project.
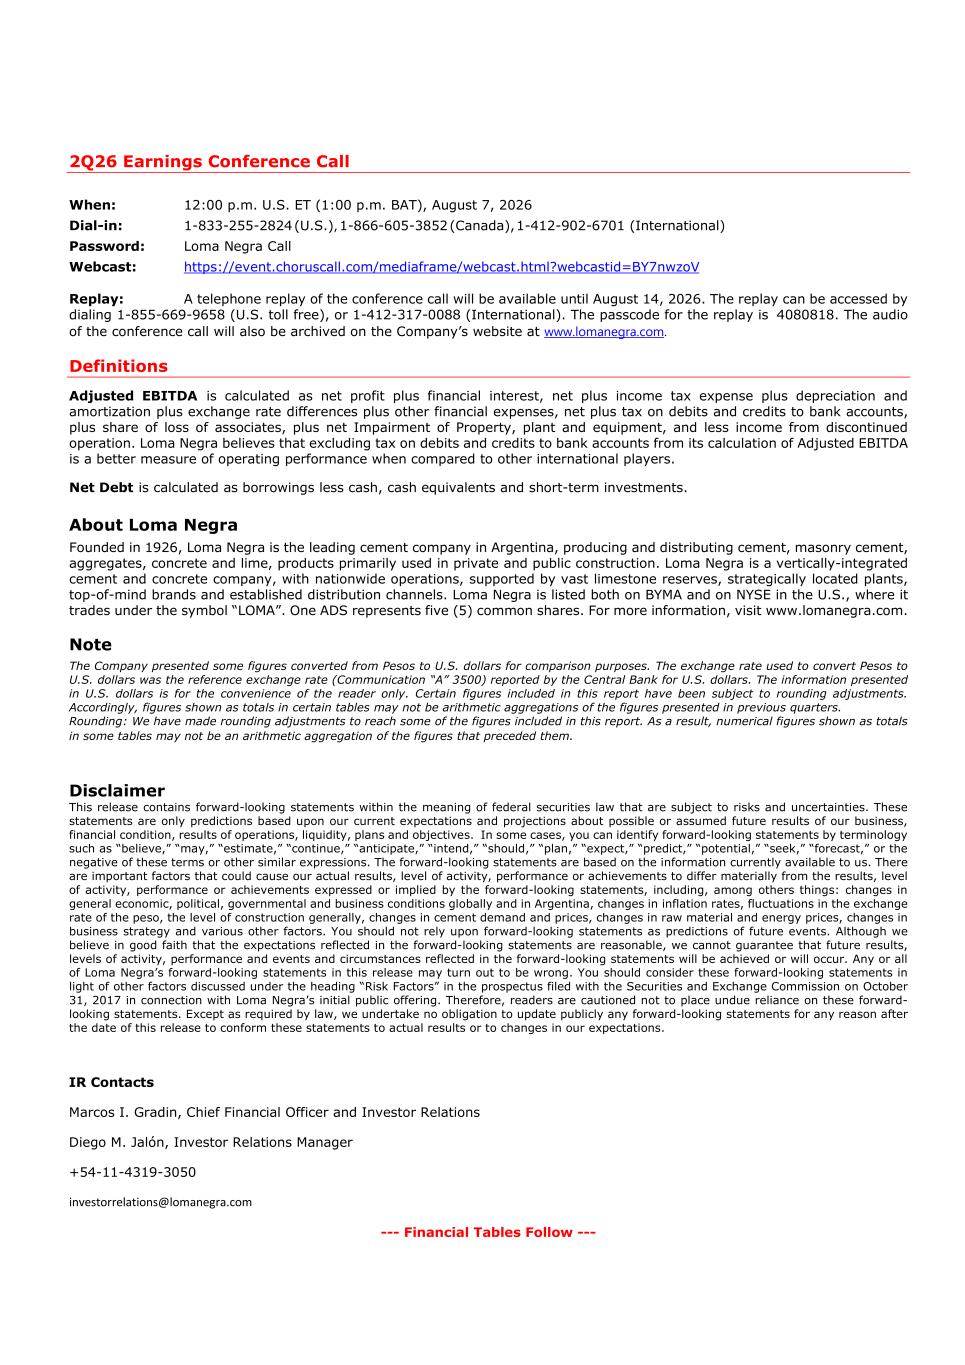
2Q26 Earnings Conference Call When: 12:00 p.m. U.S. ET (1:00 p.m. BAT), August 7, 2026 Dial-in: 1-833-255-2824 (U.S.), 1-866-605-3852 (Canada), 1-412-902-6701 (International) Password: Loma Negra Call Webcast: https://event.choruscall.com/mediaframe/webcast.html?webcastid=BY7nwzoV Replay: A telephone replay of the conference call will be available until August 14, 2026. The replay can be accessed by dialing 1-855-669-9658 (U.S. toll free), or 1-412-317-0088 (International). The passcode for the replay is 4080818. The audio of the conference call will also be archived on the Company’s website at www.lomanegra.com. Definitions Adjusted EBITDA is calculated as net profit plus financial interest, net plus income tax expense plus depreciation and amortization plus exchange rate differences plus other financial expenses, net plus tax on debits and credits to bank accounts, plus share of loss of associates, plus net Impairment of Property, plant and equipment, and less income from discontinued operation. Loma Negra believes that excluding tax on debits and credits to bank accounts from its calculation of Adjusted EBITDA is a better measure of operating performance when compared to other international players. Net Debt is calculated as borrowings less cash, cash equivalents and short-term investments. About Loma Negra Founded in 1926, Loma Negra is the leading cement company in Argentina, producing and distributing cement, masonry cement, aggregates, concrete and lime, products primarily used in private and public construction. Loma Negra is a vertically-integrated cement and concrete company, with nationwide operations, supported by vast limestone reserves, strategically located plants, top-of-mind brands and established distribution channels. Loma Negra is listed both on BYMA and on NYSE in the U.S., where it trades under the symbol “LOMA”. One ADS represents five (5) common shares. For more information, visit www.lomanegra.com. Note The Company presented some figures converted from Pesos to U.S. dollars for comparison purposes. The exchange rate used to convert Pesos to U.S. dollars was the reference exchange rate (Communication “A” 3500) reported by the Central Bank for U.S. dollars. The information presented in U.S. dollars is for the convenience of the reader only. Certain figures included in this report have been subject to rounding adjustments. Accordingly, figures shown as totals in certain tables may not be arithmetic aggregations of the figures presented in previous quarters. Rounding: We have made rounding adjustments to reach some of the figures included in this report. As a result, numerical figures shown as totals in some tables may not be an arithmetic aggregation of the figures that preceded them. Disclaimer This release contains forward-looking statements within the meaning of federal securities law that are subject to risks and uncertainties. These statements are only predictions based upon our current expectations and projections about possible or assumed future results of our business, financial condition, results of operations, liquidity, plans and objectives. In some cases, you can identify forward-looking statements by terminology such as “believe,” “may,” “estimate,” “continue,” “anticipate,” “intend,” “should,” “plan,” “expect,” “predict,” “potential,” “seek,” “forecast,” or the negative of these terms or other similar expressions. The forward-looking statements are based on the information currently available to us. There are important factors that could cause our actual results, level of activity, performance or achievements to differ materially from the results, level of activity, performance or achievements expressed or implied by the forward-looking statements, including, among others things: changes in general economic, political, governmental and business conditions globally and in Argentina, changes in inflation rates, fluctuations in the exchange rate of the peso, the level of construction generally, changes in cement demand and prices, changes in raw material and energy prices, changes in business strategy and various other factors. You should not rely upon forward-looking statements as predictions of future events. Although we believe in good faith that the expectations reflected in the forward-looking statements are reasonable, we cannot guarantee that future results, levels of activity, performance and events and circumstances reflected in the forward-looking statements will be achieved or will occur. Any or all of Loma Negra’s forward-looking statements in this release may turn out to be wrong. You should consider these forward-looking statements in light of other factors discussed under the heading “Risk Factors” in the prospectus filed with the Securities and Exchange Commission on October 31, 2017 in connection with Loma Negra’s initial public offering. Therefore, readers are cautioned not to place undue reliance on these forward- looking statements. Except as required by law, we undertake no obligation to update publicly any forward-looking statements for any reason after the date of this release to conform these statements to actual results or to changes in our expectations. IR Contacts Marcos I. Gradin, Chief Financial Officer and Investor Relations Diego M. Jalón, Investor Relations Manager +54-11-4319-3050 investorrelations@lomanegra.com --- Financial Tables Follow ---
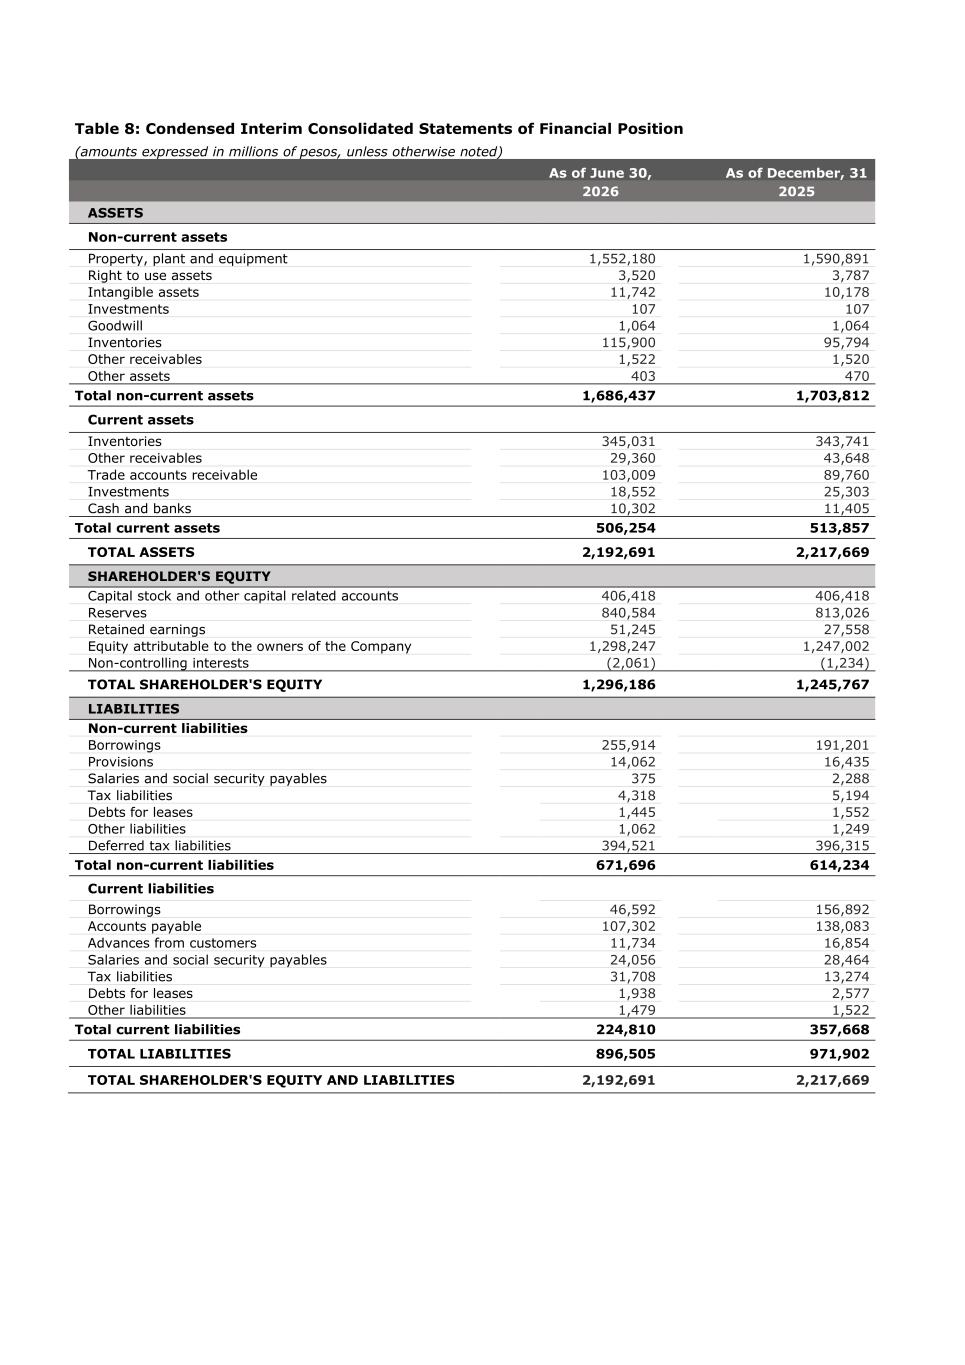
Table 8: Condensed Interim Consolidated Statements of Financial Position (amounts expressed in millions of pesos, unless otherwise noted) As of June 30, As of December, 31 2026 2025 ASSETS Non-current assets Property, plant and equipment 1,552,180 1,590,891 Right to use assets 3,520 3,787 Intangible assets 11,742 10,178 Investments 107 107 Goodwill 1,064 1,064 Inventories 115,900 95,794 Other receivables 1,522 1,520 Other assets 403 470 Total non-current assets 1,686,437 1,703,812 Current assets Inventories 345,031 343,741 Other receivables 29,360 43,648 Trade accounts receivable 103,009 89,760 Investments 18,552 25,303 Cash and banks 10,302 11,405 Total current assets 506,254 513,857 TOTAL ASSETS 2,192,691 2,217,669 SHAREHOLDER'S EQUITY Capital stock and other capital related accounts 406,418 406,418 Reserves 840,584 813,026 Retained earnings 51,245 27,558 Equity attributable to the owners of the Company 1,298,247 1,247,002 Non-controlling interests (2,061) (1,234) TOTAL SHAREHOLDER'S EQUITY 1,296,186 1,245,767 LIABILITIES Non-current liabilities Borrowings 255,914 191,201 Provisions 14,062 16,435 Salaries and social security payables 375 2,288 Tax liabilities 4,318 5,194 Debts for leases 1,445 1,552 Other liabilities 1,062 1,249 Deferred tax liabilities 394,521 396,315 Total non-current liabilities 671,696 614,234 Current liabilities Borrowings 46,592 156,892 Accounts payable 107,302 138,083 Advances from customers 11,734 16,854 Salaries and social security payables 24,056 28,464 Tax liabilities 31,708 13,274 Debts for leases 1,938 2,577 Other liabilities 1,479 1,522 Total current liabilities 224,810 357,668 TOTAL LIABILITIES 896,505 971,902 TOTAL SHAREHOLDER'S EQUITY AND LIABILITIES 2,192,691 2,217,669
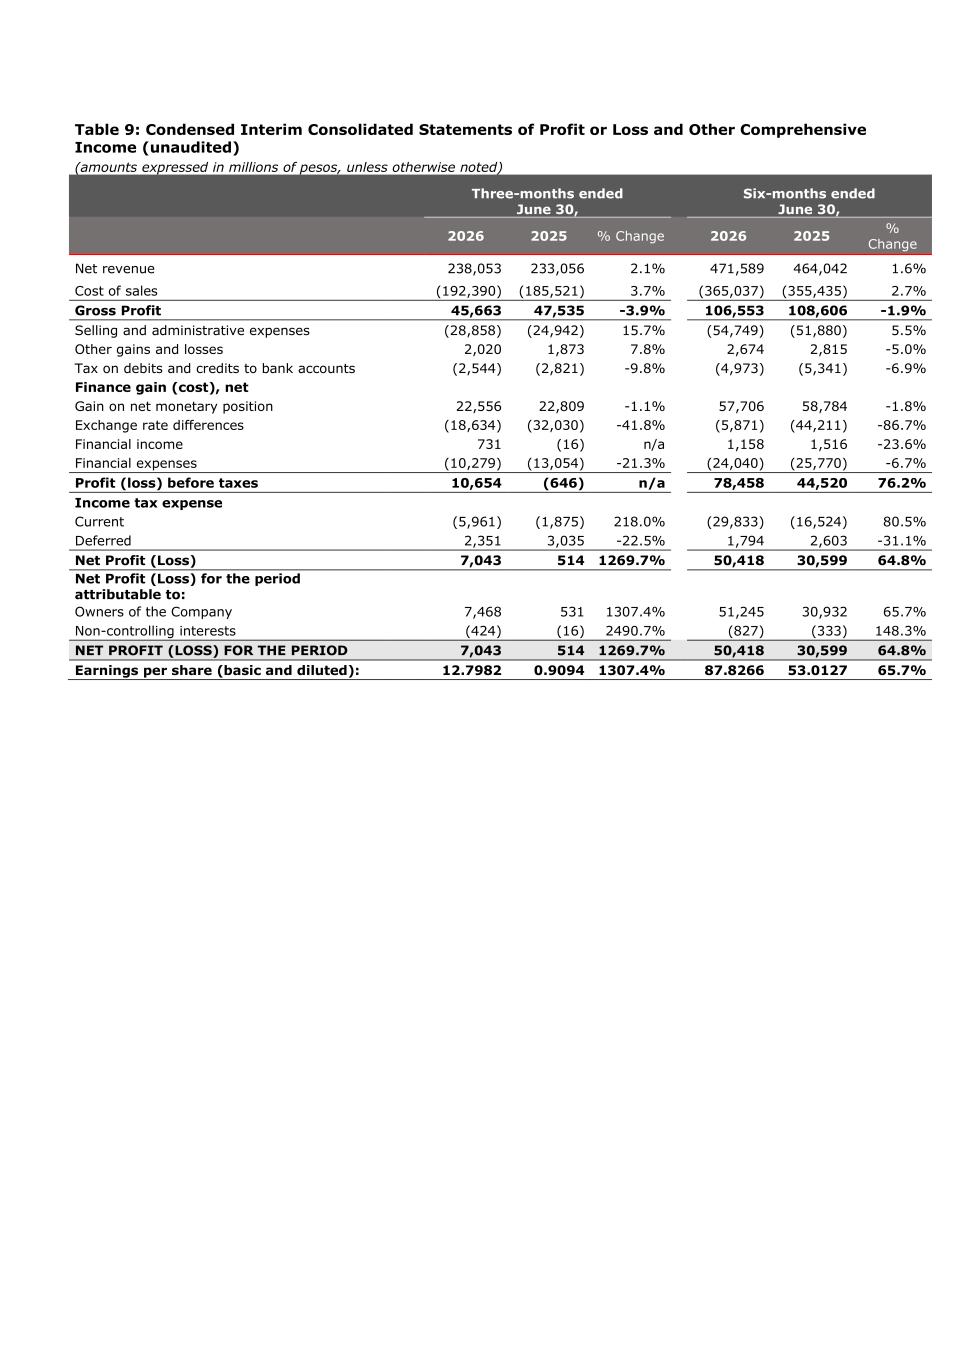
Table 9: Condensed Interim Consolidated Statements of Profit or Loss and Other Comprehensive Income (unaudited) (amounts expressed in millions of pesos, unless otherwise noted) Three-months ended June 30, Six-months ended June 30, 2026 2025 % Change 2026 2025 % Change Net revenue 238,053 233,056 2.1% 471,589 464,042 1.6% Cost of sales (192,390) (185,521) 3.7% (365,037) (355,435) 2.7% Gross Profit 45,663 47,535 -3.9% 106,553 108,606 -1.9% Selling and administrative expenses (28,858) (24,942) 15.7% (54,749) (51,880) 5.5% Other gains and losses 2,020 1,873 7.8% 2,674 2,815 -5.0% Tax on debits and credits to bank accounts (2,544) (2,821) -9.8% (4,973) (5,341) -6.9% Finance gain (cost), net Gain on net monetary position 22,556 22,809 -1.1% 57,706 58,784 -1.8% Exchange rate differences (18,634) (32,030) -41.8% (5,871) (44,211) -86.7% Financial income 731 (16) n/a 1,158 1,516 -23.6% Financial expenses (10,279) (13,054) -21.3% (24,040) (25,770) -6.7% Profit (loss) before taxes 10,654 (646) n/a 78,458 44,520 76.2% Income tax expense Current (5,961) (1,875) 218.0% (29,833) (16,524) 80.5% Deferred 2,351 3,035 -22.5% 1,794 2,603 -31.1% Net Profit (Loss) 7,043 514 1269.7% 50,418 30,599 64.8% Net Profit (Loss) for the period attributable to: Owners of the Company 7,468 531 1307.4% 51,245 30,932 65.7% Non-controlling interests (424) (16) 2490.7% (827) (333) 148.3% NET PROFIT (LOSS) FOR THE PERIOD 7,043 514 1269.7% 50,418 30,599 64.8% Earnings per share (basic and diluted): 12.7982 0.9094 1307.4% 87.8266 53.0127 65.7%
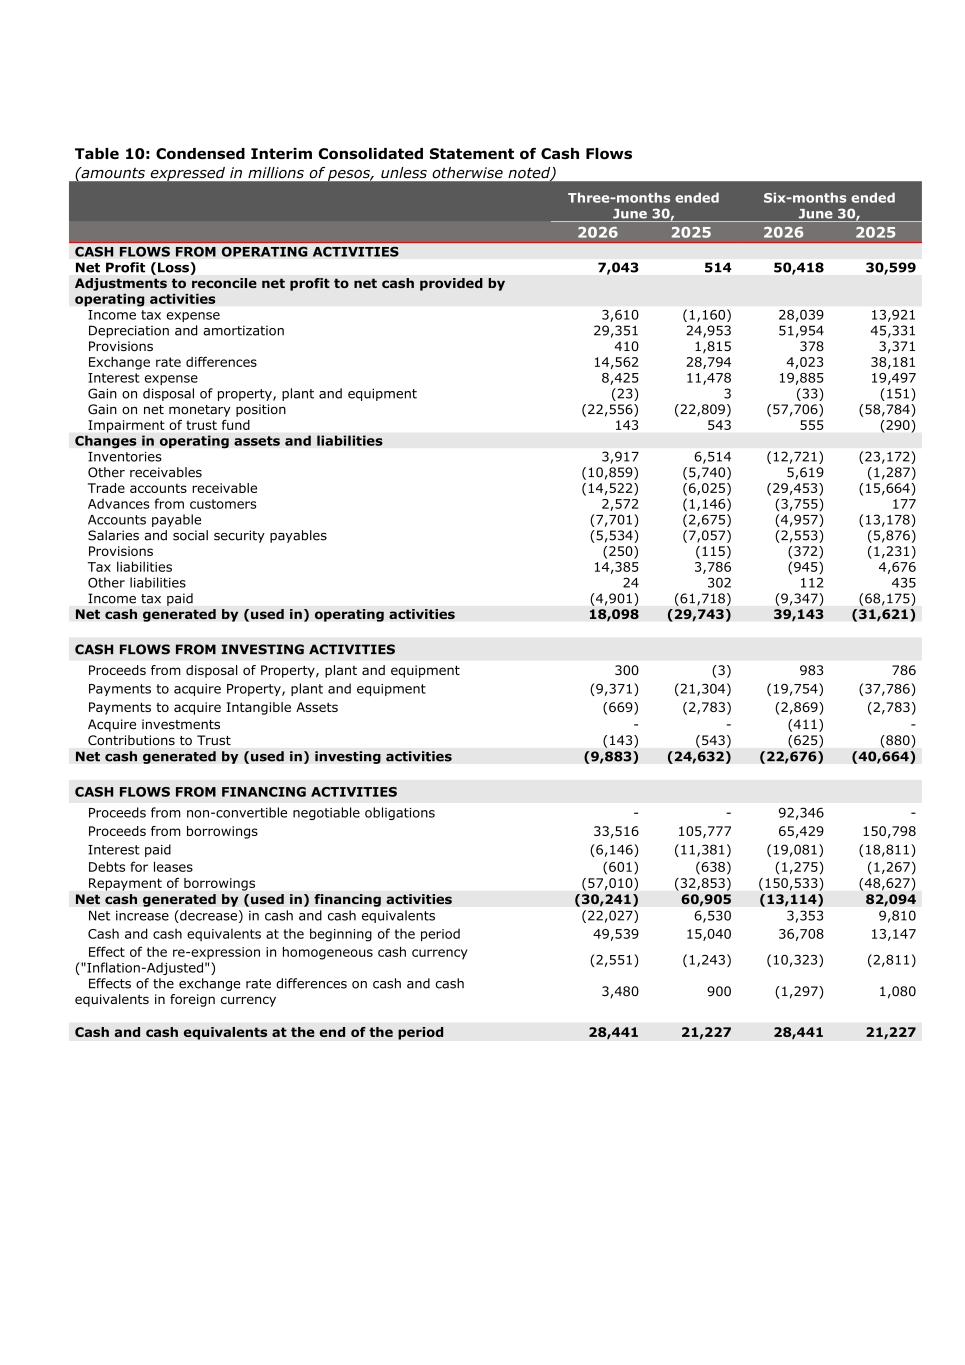
Table 10: Condensed Interim Consolidated Statement of Cash Flows (amounts expressed in millions of pesos, unless otherwise noted) Three-months ended June 30, Six-months ended June 30, 2026 2025 2026 2025 CASH FLOWS FROM OPERATING ACTIVITIES Net Profit (Loss) 7,043 514 50,418 30,599 Adjustments to reconcile net profit to net cash provided by operating activities Income tax expense 3,610 (1,160) 28,039 13,921 Depreciation and amortization 29,351 24,953 51,954 45,331 Provisions 410 1,815 378 3,371 Exchange rate differences 14,562 28,794 4,023 38,181 Interest expense 8,425 11,478 19,885 19,497 Gain on disposal of property, plant and equipment (23) 3 (33) (151) Gain on net monetary position (22,556) (22,809) (57,706) (58,784) Impairment of trust fund 143 543 555 (290) Changes in operating assets and liabilities Inventories 3,917 6,514 (12,721) (23,172) Other receivables (10,859) (5,740) 5,619 (1,287) Trade accounts receivable (14,522) (6,025) (29,453) (15,664) Advances from customers 2,572 (1,146) (3,755) 177 Accounts payable (7,701) (2,675) (4,957) (13,178) Salaries and social security payables (5,534) (7,057) (2,553) (5,876) Provisions (250) (115) (372) (1,231) Tax liabilities 14,385 3,786 (945) 4,676 Other liabilities 24 302 112 435 Income tax paid (4,901) (61,718) (9,347) (68,175) Net cash generated by (used in) operating activities 18,098 (29,743) 39,143 (31,621) CASH FLOWS FROM INVESTING ACTIVITIES Proceeds from disposal of Property, plant and equipment 300 (3) 983 786 Payments to acquire Property, plant and equipment (9,371) (21,304) (19,754) (37,786) Payments to acquire Intangible Assets (669) (2,783) (2,869) (2,783) Acquire investments - - (411) - Contributions to Trust (143) (543) (625) (880) Net cash generated by (used in) investing activities (9,883) (24,632) (22,676) (40,664) CASH FLOWS FROM FINANCING ACTIVITIES Proceeds from non-convertible negotiable obligations - - 92,346 - Proceeds from borrowings 33,516 105,777 65,429 150,798 Interest paid (6,146) (11,381) (19,081) (18,811) Debts for leases (601) (638) (1,275) (1,267) Repayment of borrowings (57,010) (32,853) (150,533) (48,627) Net cash generated by (used in) financing activities (30,241) 60,905 (13,114) 82,094 Net increase (decrease) in cash and cash equivalents (22,027) 6,530 3,353 9,810 Cash and cash equivalents at the beginning of the period 49,539 15,040 36,708 13,147 Effect of the re-expression in homogeneous cash currency ("Inflation-Adjusted") (2,551) (1,243) (10,323) (2,811) Effects of the exchange rate differences on cash and cash equivalents in foreign currency 3,480 900 (1,297) 1,080 Cash and cash equivalents at the end of the period 28,441 21,227 28,441 21,227
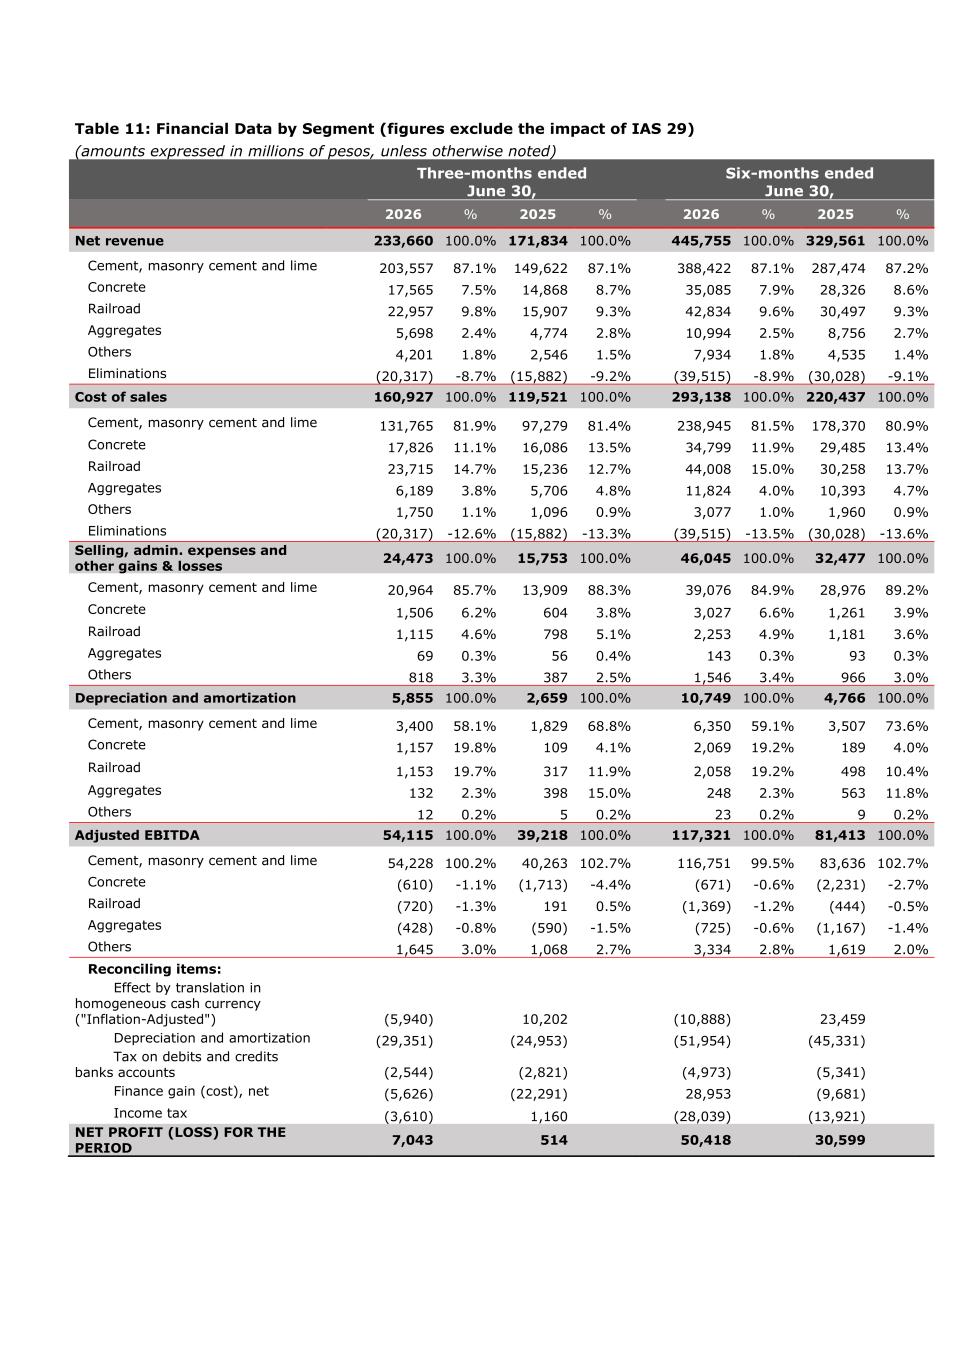
Table 11: Financial Data by Segment (figures exclude the impact of IAS 29) (amounts expressed in millions of pesos, unless otherwise noted) Three-months ended June 30, Six-months ended June 30, 2026 % 2025 % 2026 % 2025 % Net revenue 233,660 100.0% 171,834 100.0% 445,755 100.0% 329,561 100.0% Cement, masonry cement and lime 203,557 87.1% 149,622 87.1% 388,422 87.1% 287,474 87.2% Concrete 17,565 7.5% 14,868 8.7% 35,085 7.9% 28,326 8.6% Railroad 22,957 9.8% 15,907 9.3% 42,834 9.6% 30,497 9.3% Aggregates 5,698 2.4% 4,774 2.8% 10,994 2.5% 8,756 2.7% Others 4,201 1.8% 2,546 1.5% 7,934 1.8% 4,535 1.4% Eliminations (20,317) -8.7% (15,882) -9.2% (39,515) -8.9% (30,028) -9.1% Cost of sales 160,927 100.0% 119,521 100.0% 293,138 100.0% 220,437 100.0% Cement, masonry cement and lime 131,765 81.9% 97,279 81.4% 238,945 81.5% 178,370 80.9% Concrete 17,826 11.1% 16,086 13.5% 34,799 11.9% 29,485 13.4% Railroad 23,715 14.7% 15,236 12.7% 44,008 15.0% 30,258 13.7% Aggregates 6,189 3.8% 5,706 4.8% 11,824 4.0% 10,393 4.7% Others 1,750 1.1% 1,096 0.9% 3,077 1.0% 1,960 0.9% Eliminations (20,317) -12.6% (15,882) -13.3% (39,515) -13.5% (30,028) -13.6% Selling, admin. expenses and other gains & losses 24,473 100.0% 15,753 100.0% 46,045 100.0% 32,477 100.0% Cement, masonry cement and lime 20,964 85.7% 13,909 88.3% 39,076 84.9% 28,976 89.2% Concrete 1,506 6.2% 604 3.8% 3,027 6.6% 1,261 3.9% Railroad 1,115 4.6% 798 5.1% 2,253 4.9% 1,181 3.6% Aggregates 69 0.3% 56 0.4% 143 0.3% 93 0.3% Others 818 3.3% 387 2.5% 1,546 3.4% 966 3.0% Depreciation and amortization 5,855 100.0% 2,659 100.0% 10,749 100.0% 4,766 100.0% Cement, masonry cement and lime 3,400 58.1% 1,829 68.8% 6,350 59.1% 3,507 73.6% Concrete 1,157 19.8% 109 4.1% 2,069 19.2% 189 4.0% Railroad 1,153 19.7% 317 11.9% 2,058 19.2% 498 10.4% Aggregates 132 2.3% 398 15.0% 248 2.3% 563 11.8% Others 12 0.2% 5 0.2% 23 0.2% 9 0.2% Adjusted EBITDA 54,115 100.0% 39,218 100.0% 117,321 100.0% 81,413 100.0% Cement, masonry cement and lime 54,228 100.2% 40,263 102.7% 116,751 99.5% 83,636 102.7% Concrete (610) -1.1% (1,713) -4.4% (671) -0.6% (2,231) -2.7% Railroad (720) -1.3% 191 0.5% (1,369) -1.2% (444) -0.5% Aggregates (428) -0.8% (590) -1.5% (725) -0.6% (1,167) -1.4% Others 1,645 3.0% 1,068 2.7% 3,334 2.8% 1,619 2.0% Reconciling items: Effect by translation in homogeneous cash currency ("Inflation-Adjusted") (5,940) 10,202 (10,888) 23,459 Depreciation and amortization (29,351) (24,953) (51,954) (45,331) Tax on debits and credits banks accounts (2,544) (2,821) (4,973) (5,341) Finance gain (cost), net (5,626) (22,291) 28,953 (9,681) Income tax (3,610) 1,160 (28,039) (13,921) NET PROFIT (LOSS) FOR THE PERIOD 7,043 514 50,418 30,599