
Second Quarter 2026 Results August 6, 2026
2 Non-GAAP financial measures and forward-looking statements Non-GAAP financial measures We provide reconciliations of the non-GAAP financial measures contained in this presentation to the most directly comparable measure under GAAP, which are set forth in the financial tables attached to this presentation. The non-GAAP financial measures in this presentation include: adjusted earnings before interest, taxes, depreciation and amortization (“adjusted EBITDA”); adjusted EBITDA margin; bank-adjusted EBITDA; free cash flow and free cash flow as a percentage of adjusted EBITDA (“free cash flow conversion”); adjusted free cash flow and adjusted free cash flow as a percentage of adjusted EBITDA (“adjusted free cash flow conversion”); net debt, gross leverage and net leverage; and adjusted net income (loss) and adjusted diluted income (loss) per share (“adjusted diluted EPS”). We believe that these adjusted financial measures facilitate analysis of our ongoing business operations because they exclude items that may not reflect, or are unrelated to, RXO’s core operating performance, and may assist investors with comparisons to prior periods and assessing trends in our underlying businesses. Other companies may calculate these non-GAAP financial measures differently, and therefore our measures may not be comparable to similarly titled measures of other companies. These non-GAAP financial measures should only be used as supplemental measures of our operating performance. Adjusted EBITDA, adjusted EBITDA margin, bank-adjusted EBITDA, adjusted net income (loss) and adjusted diluted EPS include adjustments for transaction and integration costs, as well as restructuring costs and other adjustments as set forth in the attached tables. Management uses these non-GAAP financial measures in making financial, operating and planning decisions and evaluating RXO’s ongoing performance. We believe that adjusted EBITDA, adjusted EBITDA margin and bank-adjusted EBITDA improve comparability from period to period by removing the impact of our capital structure (interest and financing expenses), asset base (depreciation and amortization), tax impacts and other adjustments that management has determined do not reflect our core operating activities and thereby assist investors with assessing trends in our underlying business. We believe that adjusted net income (loss) and adjusted diluted EPS improve the comparability of our operating results from period to period by removing the impact of certain costs that management has determined do not reflect our core operating activities, including amortization of acquisition-related intangible assets, transaction and integration costs, restructuring costs and other adjustments as set out in the attached tables, and thereby may assist investors with comparisons to prior periods and assessing trends in our underlying business. We believe that free cash flow, free cash flow conversion, adjusted free cash flow and adjusted free cash flow conversion are important measures of our ability to repay maturing debt or fund other uses of capital that we believe will enhance stockholder value, and may assist investors with assessing trends in our underlying business. We calculate free cash flow as net cash provided by operating activities less payment for purchases of property and equipment plus proceeds from sale of property and equipment. We define adjusted free cash flow as free cash flow less cash paid for transaction, integration, restructuring and other costs. We believe that net debt, gross leverage and net leverage are important measures of our overall liquidity position. Net debt is calculated by removing cash and cash equivalents from the principal balance of our total debt. Gross leverage is calculated as the principal balance of our total debt as a ratio of trailing twelve months bank-adjusted EBITDA. Net leverage is calculated as net debt as a ratio of trailing twelve months bank-adjusted EBITDA. With respect to our financial outlook for the third quarter of 2026 adjusted EBITDA, a reconciliation of this non-GAAP measure to the corresponding GAAP measure is not available without unreasonable effort due to the variability and complexity of the reconciling items described above that we exclude from this non-GAAP measure. The variability of these items may have a significant impact on our future GAAP financial results and, as a result, we are unable to prepare the forward-looking statement of income and statement of cash flows prepared in accordance with GAAP that would be required to produce such a reconciliation. Forward-looking statements This presentation includes forward-looking statements, including statements relating to our outlook, leverage and expectations regarding spot mix and gross profit for Q3. All statements other than statements of historical fact are, or may be deemed to be, forward-looking statements. In some cases, forward-looking statements can be identified by the use of forward-looking terms such as "anticipate," "estimate," "believe," "continue," "could," "intend," "may," "plan,“ "predict," "should," "will," "expect," "project," "forecast," "goal," "outlook," "target,” or the negative of these terms or other comparable terms. However, the absence of these words does not mean that the statements are not forward-looking. These forward-looking statements are based on certain assumptions and analyses made by us in light of our experience and our perception of historical trends, current conditions and expected future developments, as well as other factors we believe are appropriate in the circumstances. These forward-looking statements are subject to known and unknown risks, uncertainties and assumptions that may cause actual results, levels of activity, performance, or achievements to be materially different from any future results, levels of activity, performance or achievements expressed or implied by such forward-looking statements. Factors that might cause or contribute to a material difference include the risks discussed in our filings with the SEC and the following: competition and pricing pressures; economic conditions generally; fluctuations in fuel prices; increased carrier prices; severe weather, natural disasters, terrorist attacks or similar incidents that cause material disruptions to our operations or the operations of the third-party carriers and independent contractors with which we contract; our dependence on third-party carriers and independent contractors; labor disputes or organizing efforts affecting our workforce and those of our third-party carriers; legal and regulatory challenges to the status of the third-party carriers with which we contract, and their delivery workers, as independent contractors, rather than employees; our ability to develop and implement suitable information technology systems and prevent failures in or breaches of such systems; the impact of potential cyber-attacks and information technology or data security breaches; our ability to integrate machine learning and artificial intelligence technologies to deliver our services and operate our business; issues related to our intellectual property rights; our ability to access the capital markets and generate sufficient cash flow to satisfy our debt obligations; litigation that may adversely affect our business or reputation; increasingly stringent laws protecting the environment, including transitional risks relating to climate change, that impact our third-party carriers; governmental regulation and political conditions; our ability to attract and retain qualified personnel; our ability to successfully implement our cost and revenue initiatives and other strategies; our ability to successfully manage our growth; our reliance on certain large customers for a significant portion of our revenue; damage to our reputation through unfavorable publicity; our failure to meet performance levels required by our contracts with our customers; the inability to achieve the level of revenue growth, cash generation, cost savings, improvement in profitability and margins, fiscal discipline, or strengthening of competitiveness and operations anticipated or targeted; and the impact of the separation on our businesses, operations and results. All forward-looking statements set forth in this presentation are qualified by these cautionary statements and there can be no assurance that the actual results or developments anticipated by us will be realized or, even if substantially realized, that they will have the expected consequences to or effects on us or our business or operations. Forward-looking statements set forth in this presentation speak only as of the date hereof, and we do not undertake any obligation to update forward-looking statements to reflect subsequent events or circumstances, changes in expectations or the occurrence of unanticipated events, except to the extent required by law.
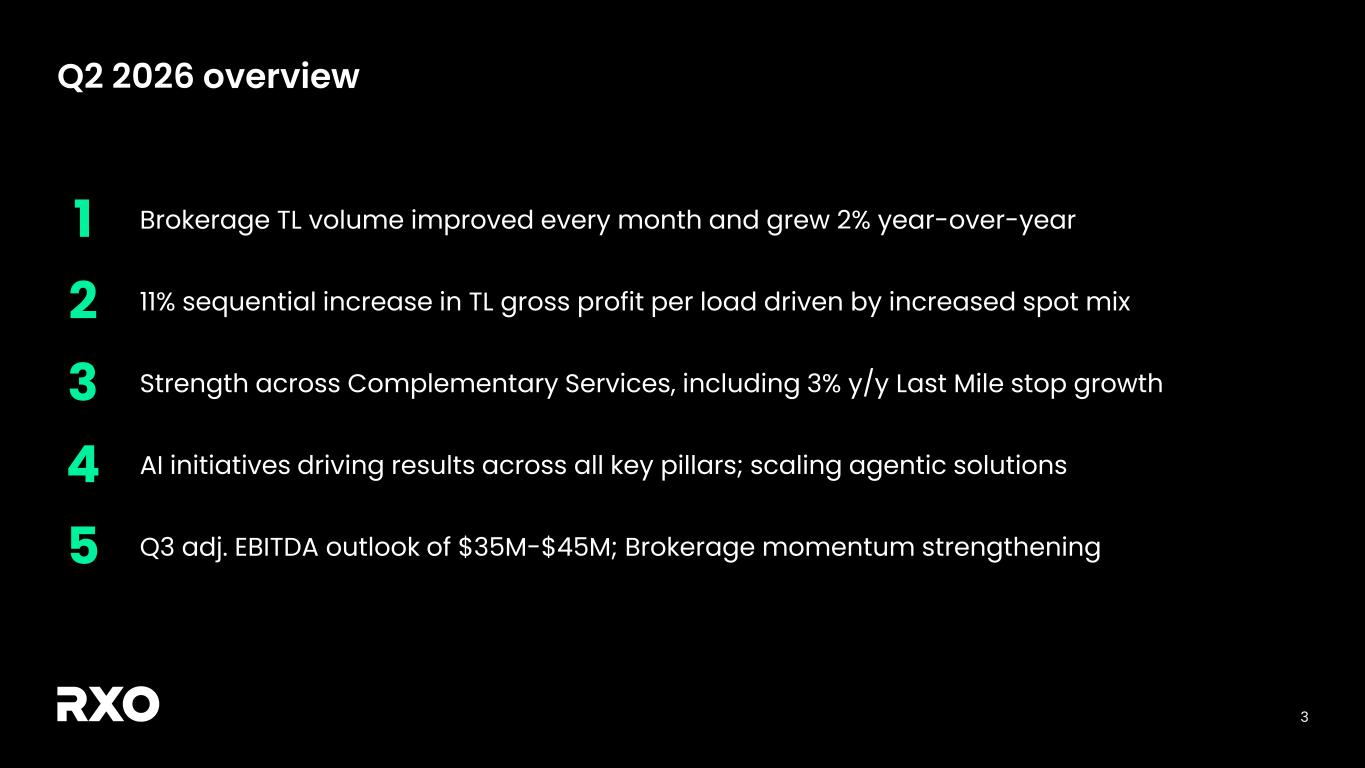
3 Q2 2026 overview 1 Brokerage TL volume improved every month and grew 2% year-over-year 2 11% sequential increase in TL gross profit per load driven by increased spot mix 3 Strength across Complementary Services, including 3% y/y Last Mile stop growth 4 AI initiatives driving results across all key pillars; scaling agentic solutions 5 Q3 adj. EBITDA outlook of $35M-$45M; Brokerage momentum strengthening
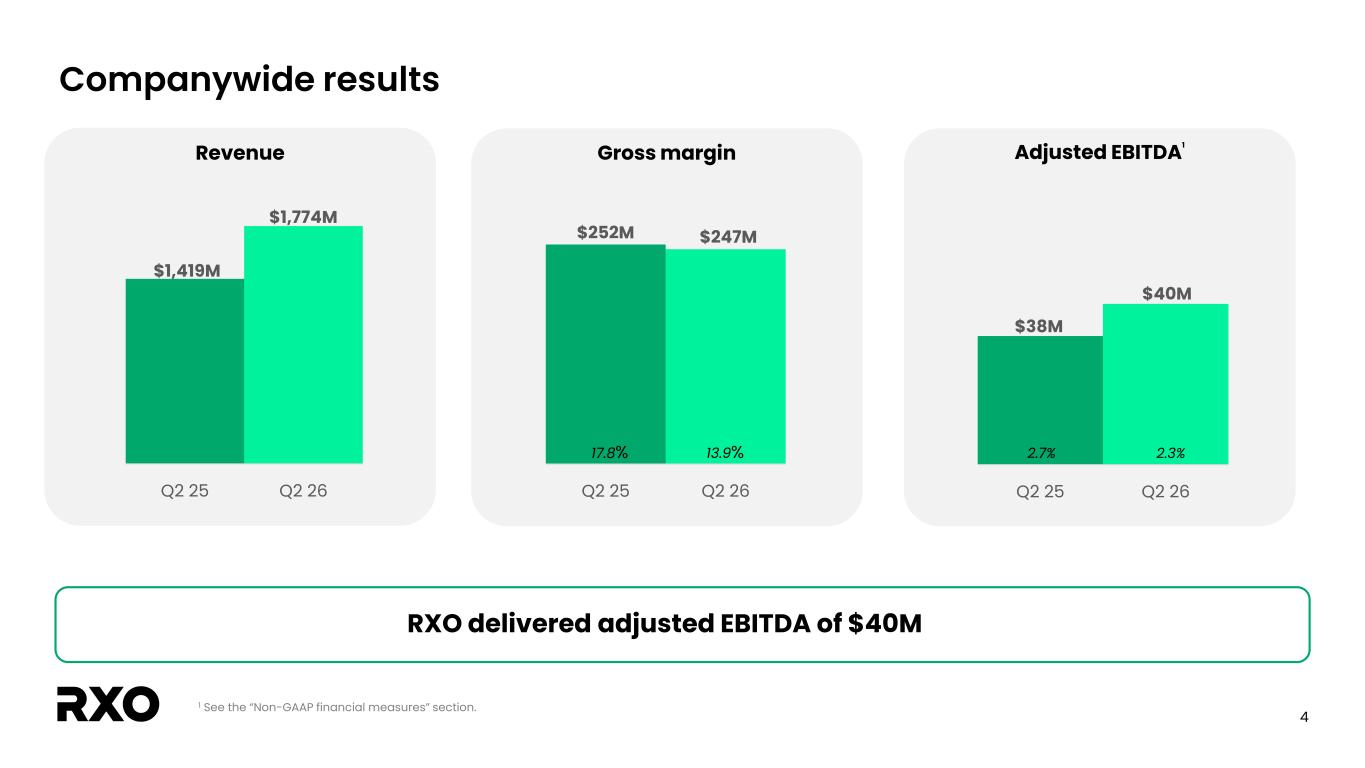
4 $252M $247M Q2 25 Q2 26 Companywide results RXO delivered adjusted EBITDA of $40M Adjusted EBITDA1Gross margin 1 See the “Non-GAAP financial measures” section. $38M $40M Q2 25 Q2 26 2.7% 2.3%17.8% Revenue $1,419M $1,774M Q2 25 Q2 26 13.9%
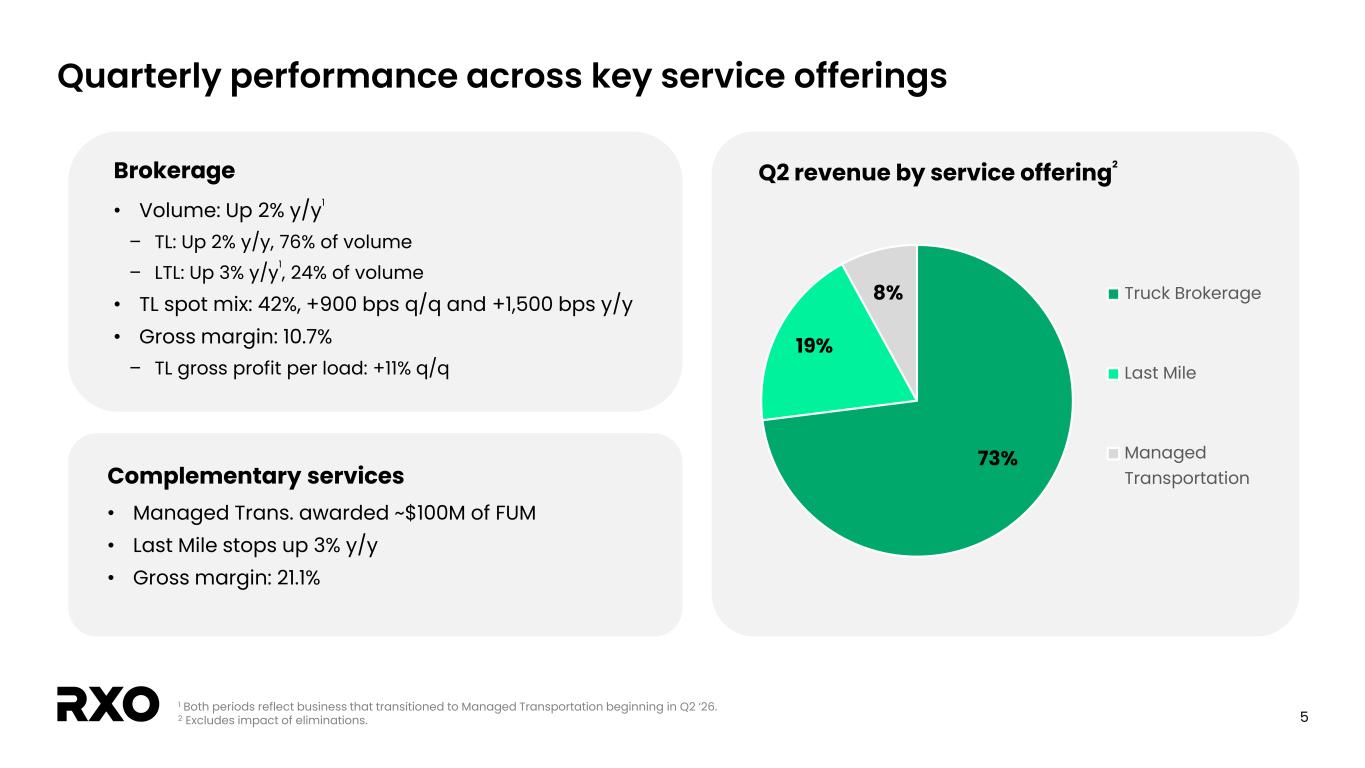
5 Quarterly performance across key service offerings Q2 revenue by service offering2 73% 19% 8% Truck Brokerage Last Mile Managed Transportation Brokerage • Volume: Up 2% y/y1 – TL: Up 2% y/y, 76% of volume – LTL: Up 3% y/y1, 24% of volume • TL spot mix: 42%, +900 bps q/q and +1,500 bps y/y • Gross margin: 10.7% – TL gross profit per load: +11% q/q Complementary services • Managed Trans. awarded ~$100M of FUM • Last Mile stops up 3% y/y • Gross margin: 21.1% 1 Both periods reflect business that transitioned to Managed Transportation beginning in Q2 ‘26. 2 Excludes impact of eliminations.
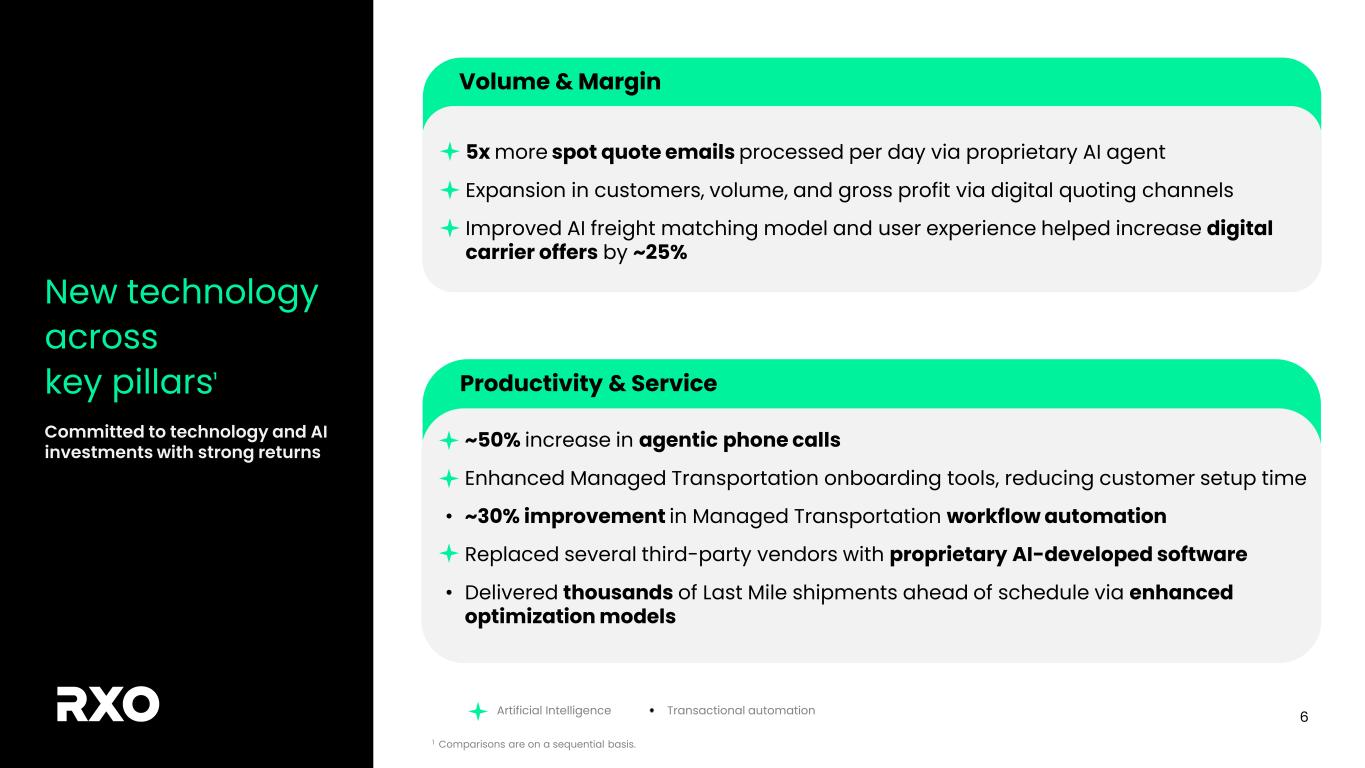
6 New technology across key pillars1 Committed to technology and AI investments with strong returns • ~50% increase in agentic phone calls • Enhanced Managed Transportation onboarding tools, reducing customer setup time • ~30% improvement in Managed Transportation workflow automation • Replaced several third-party vendors with proprietary AI-developed software • Delivered thousands of Last Mile shipments ahead of schedule via enhanced optimization models • 5x more spot quote emails processed per day via proprietary AI agent • Expansion in customers, volume, and gross profit via digital quoting channels • Improved AI freight matching model and user experience helped increase digital carrier offers by ~25% Volume & Margin Productivity & Service Artificial Intelligence Transactional automation 1 Comparisons are on a sequential basis.
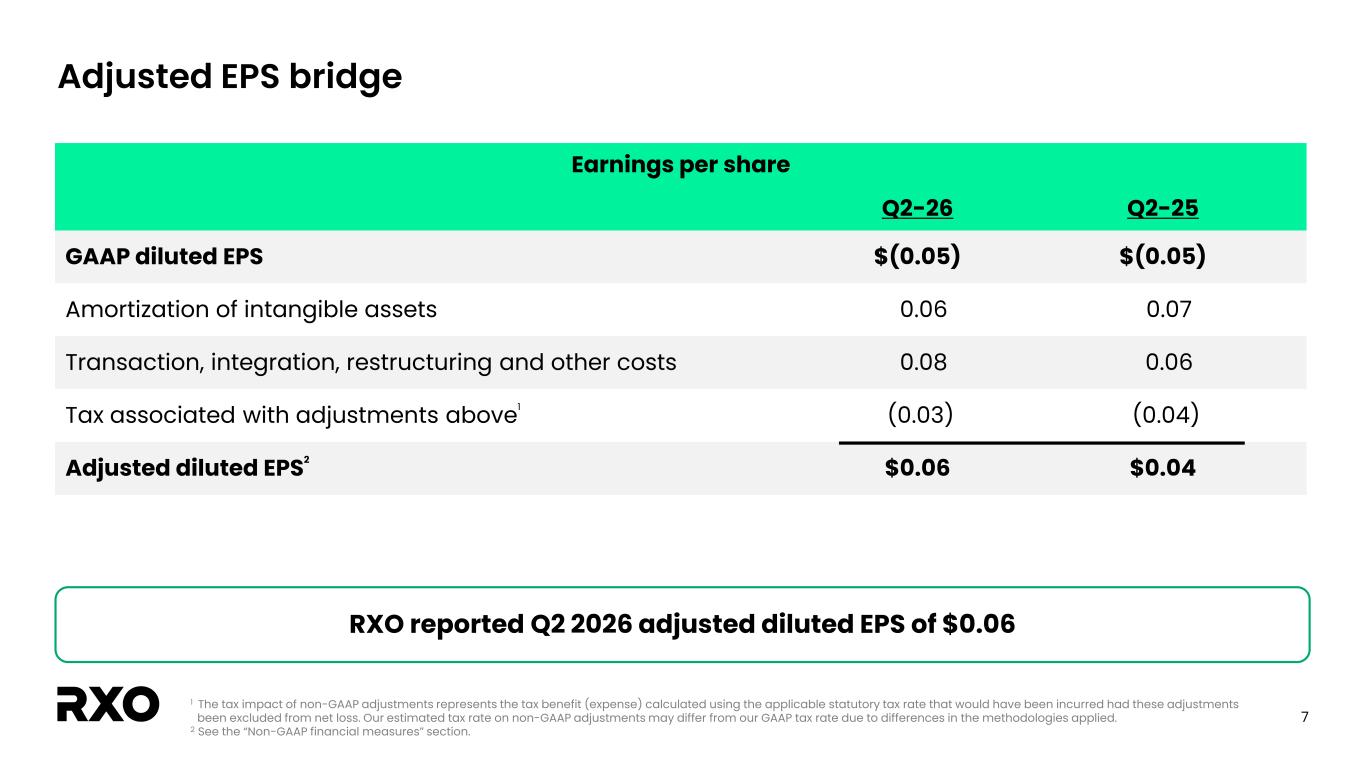
7 Adjusted EPS bridge Earnings per share Q2-26 Q2-25 GAAP diluted EPS $(0.05) $(0.05) Amortization of intangible assets 0.06 0.07 Transaction, integration, restructuring and other costs 0.08 0.06 Tax associated with adjustments above1 (0.03) (0.04) Adjusted diluted EPS2 $0.06 $0.04 RXO reported Q2 2026 adjusted diluted EPS of $0.06 1 The tax impact of non-GAAP adjustments represents the tax benefit (expense) calculated using the applicable statutory tax rate that would have been incurred had these adjustments been excluded from net loss. Our estimated tax rate on non-GAAP adjustments may differ from our GAAP tax rate due to differences in the methodologies applied. 2 See the “Non-GAAP financial measures” section.
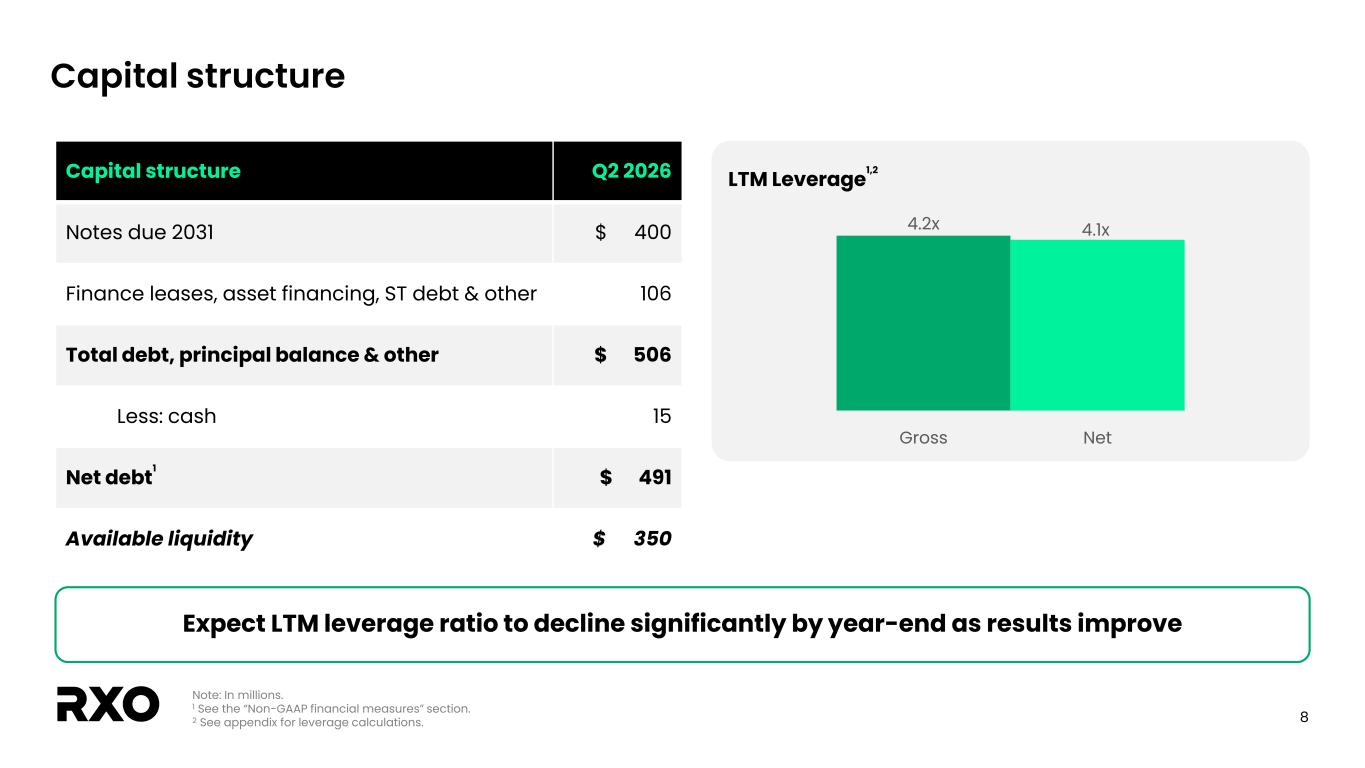
8 Capital structure Note: In millions. 1 See the “Non-GAAP financial measures” section. 2 See appendix for leverage calculations. Capital structure Q2 2026 Notes due 2031 $ 400 Finance leases, asset financing, ST debt & other 106 Total debt, principal balance & other $ 506 Less: cash 15 Net debt1 $ 491 Available liquidity $ 350 LTM Leverage1,2 4.2x 4.1x Gross Net Expect LTM leverage ratio to decline significantly by year-end as results improve
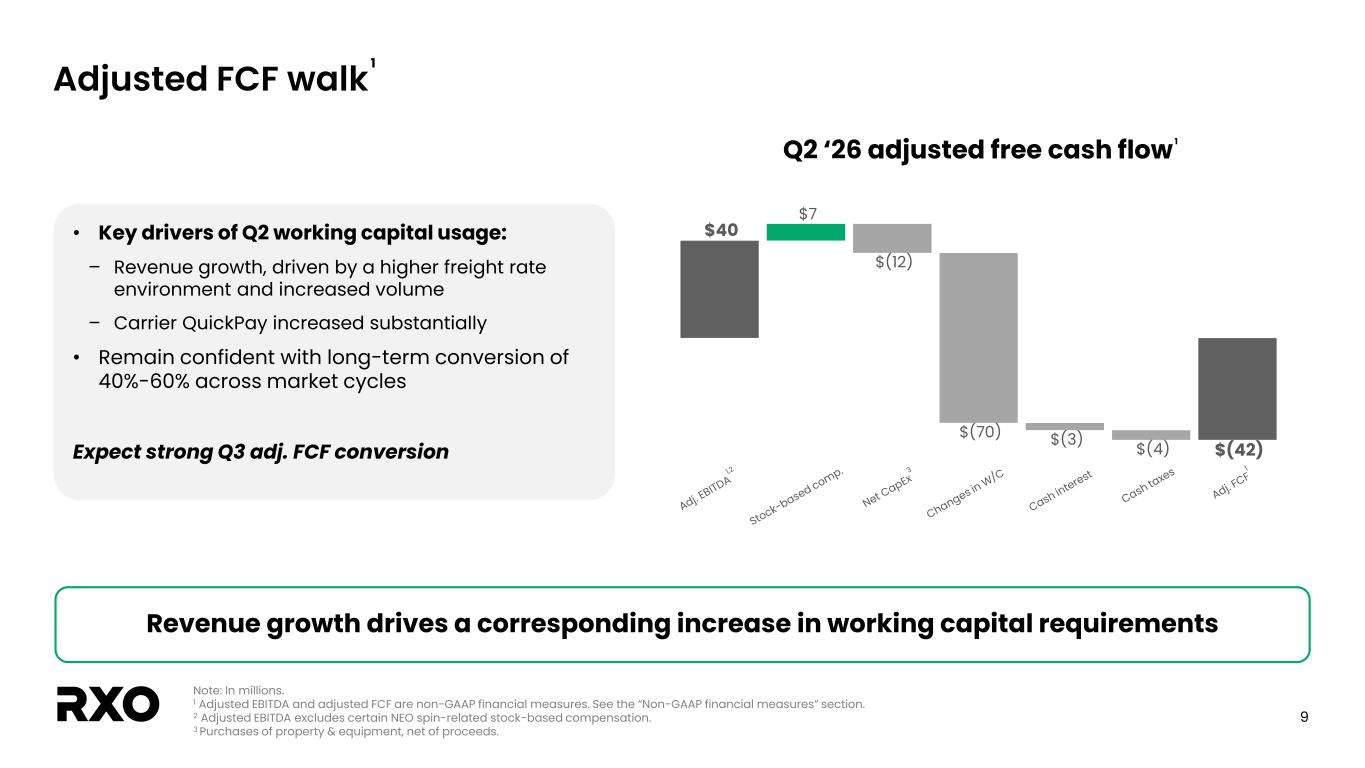
9 $7 $(12) $(70) $(3) $40 $(4) $(42) Adj. EBITDA Stock-based … Net CapEx Changes in W/C Cash interest Cash taxes RXO Adj. FCF Adjusted FCF walk Note: In millions. 1 Adjusted EBITDA and adjusted FCF are non-GAAP financial measures. See the “Non-GAAP financial measures” section. 2 Adjusted EBITDA excludes certain NEO spin-related stock-based compensation. 3 Purchases of property & equipment, net of proceeds. Revenue growth drives a corresponding increase in working capital requirements Q2 ‘26 adjusted free cash flow1 1 • Key drivers of Q2 working capital usage: – Revenue growth, driven by a higher freight rate environment and increased volume – Carrier QuickPay increased substantially • Remain confident with long-term conversion of 40%-60% across market cycles Expect strong Q3 adj. FCF conversion
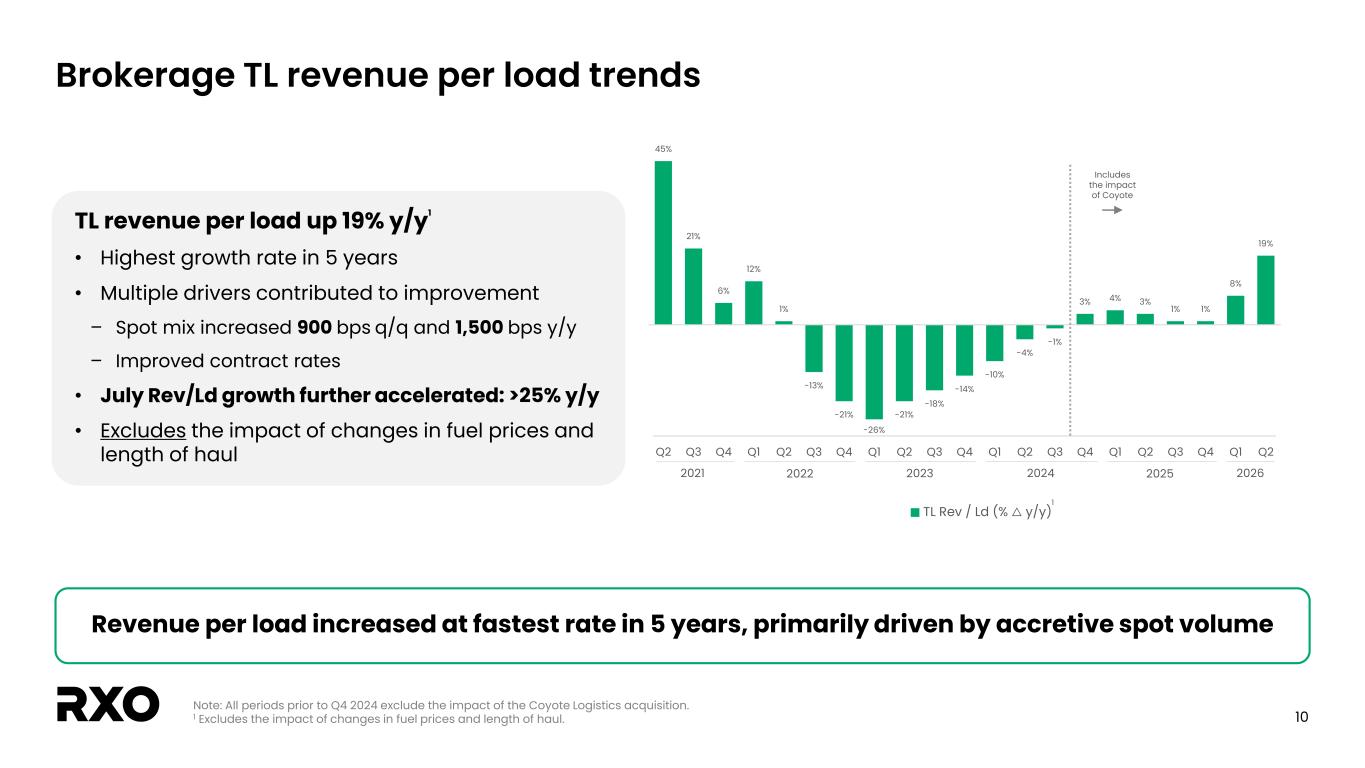
10 45% 21% 6% 12% 1% -13% -21% -26% -21% -18% -14% -10% -4% -1% 3% 4% 3% 1% 1% 8% 19% Q2 Q3 Q4 Q1 Q2 Q3 Q4 Q1 Q2 Q3 Q4 Q1 Q2 Q3 Q4 Q1 Q2 Q3 Q4 Q1 Q2 TL Rev / Ld (% △ y/y) Brokerage TL revenue per load trends Revenue per load increased at fastest rate in 5 years, primarily driven by accretive spot volume 20252021 2023 20242022 1 Includes the impact of Coyote TL revenue per load up 19% y/y1 • Highest growth rate in 5 years • Multiple drivers contributed to improvement – Spot mix increased 900 bps q/q and 1,500 bps y/y – Improved contract rates • July Rev/Ld growth further accelerated: >25% y/y • Excludes the impact of changes in fuel prices and length of haul Note: All periods prior to Q4 2024 exclude the impact of the Coyote Logistics acquisition. 1 Excludes the impact of changes in fuel prices and length of haul. 2026
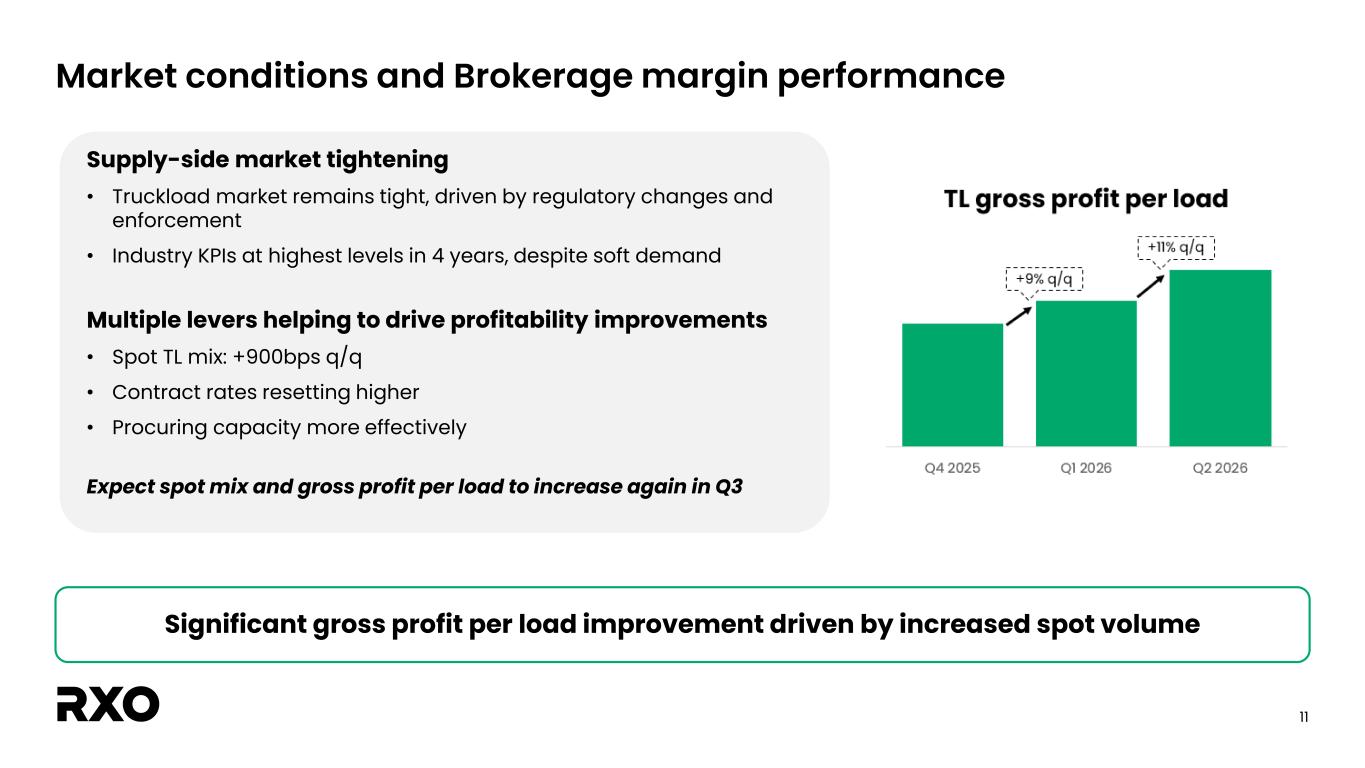
11 Market conditions and Brokerage margin performance Significant gross profit per load improvement driven by increased spot volume Supply-side market tightening • Truckload market remains tight, driven by regulatory changes and enforcement • Industry KPIs at highest levels in 4 years, despite soft demand Multiple levers helping to drive profitability improvements • Spot TL mix: +900bps q/q • Contract rates resetting higher • Procuring capacity more effectively Expect spot mix and gross profit per load to increase again in Q3
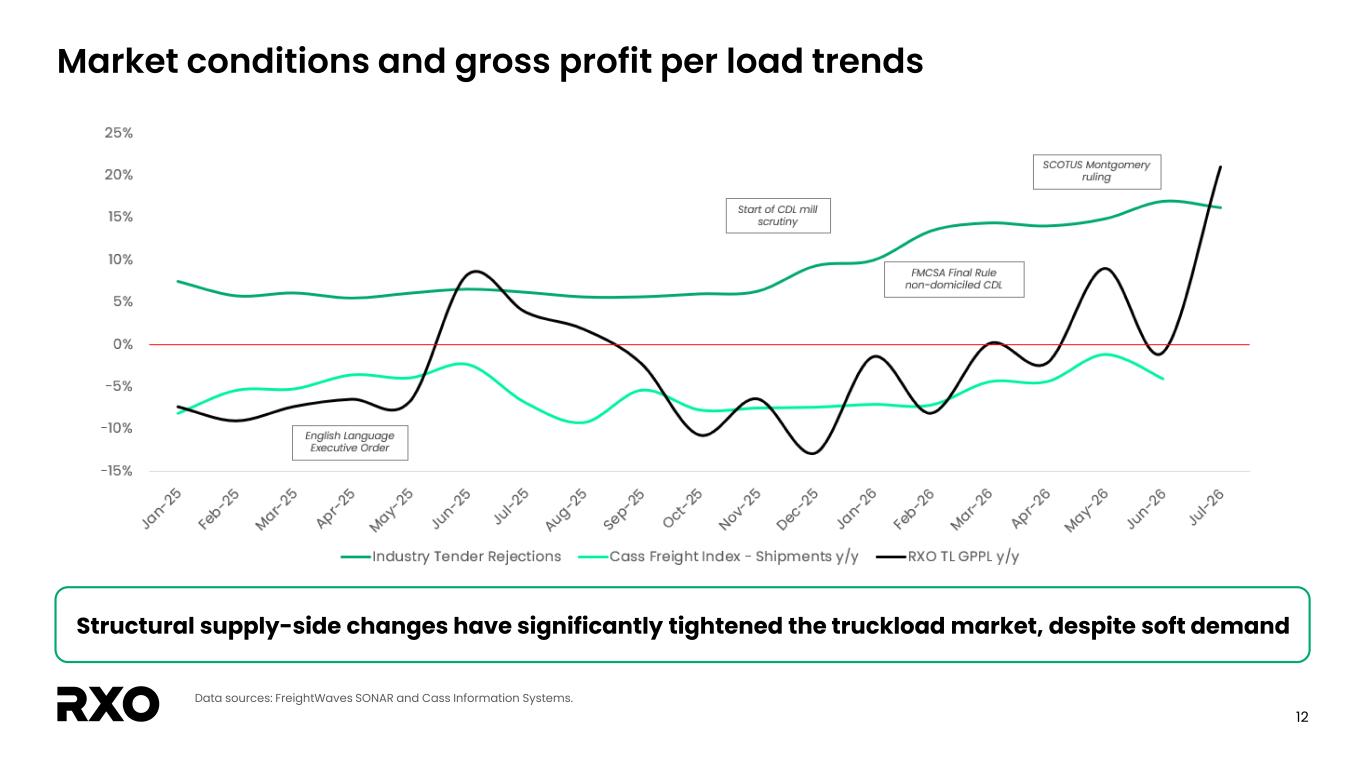
12 Market conditions and gross profit per load trends Structural supply-side changes have significantly tightened the truckload market, despite soft demand Data sources: FreightWaves SONAR and Cass Information Systems.
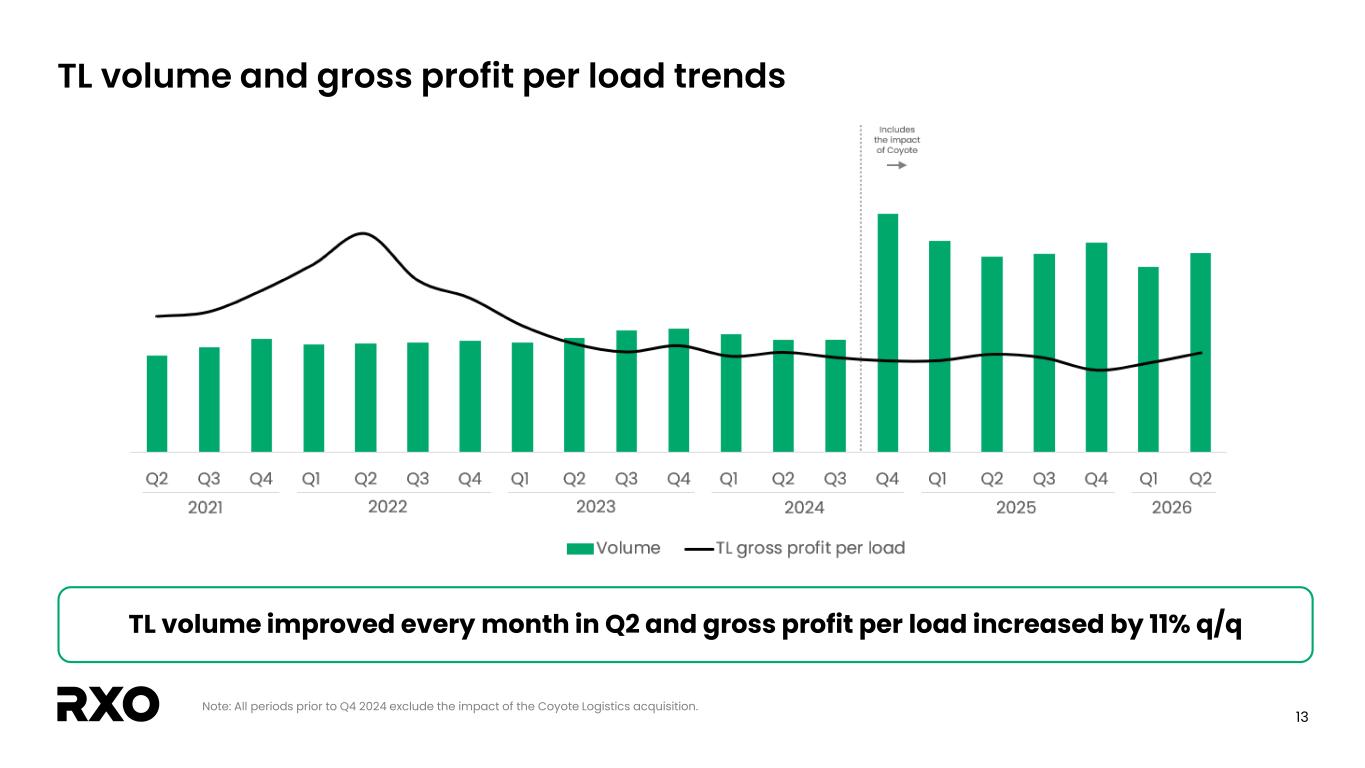
13 TL volume and gross profit per load trends Note: All periods prior to Q4 2024 exclude the impact of the Coyote Logistics acquisition. TL volume improved every month in Q2 and gross profit per load increased by 11% q/q
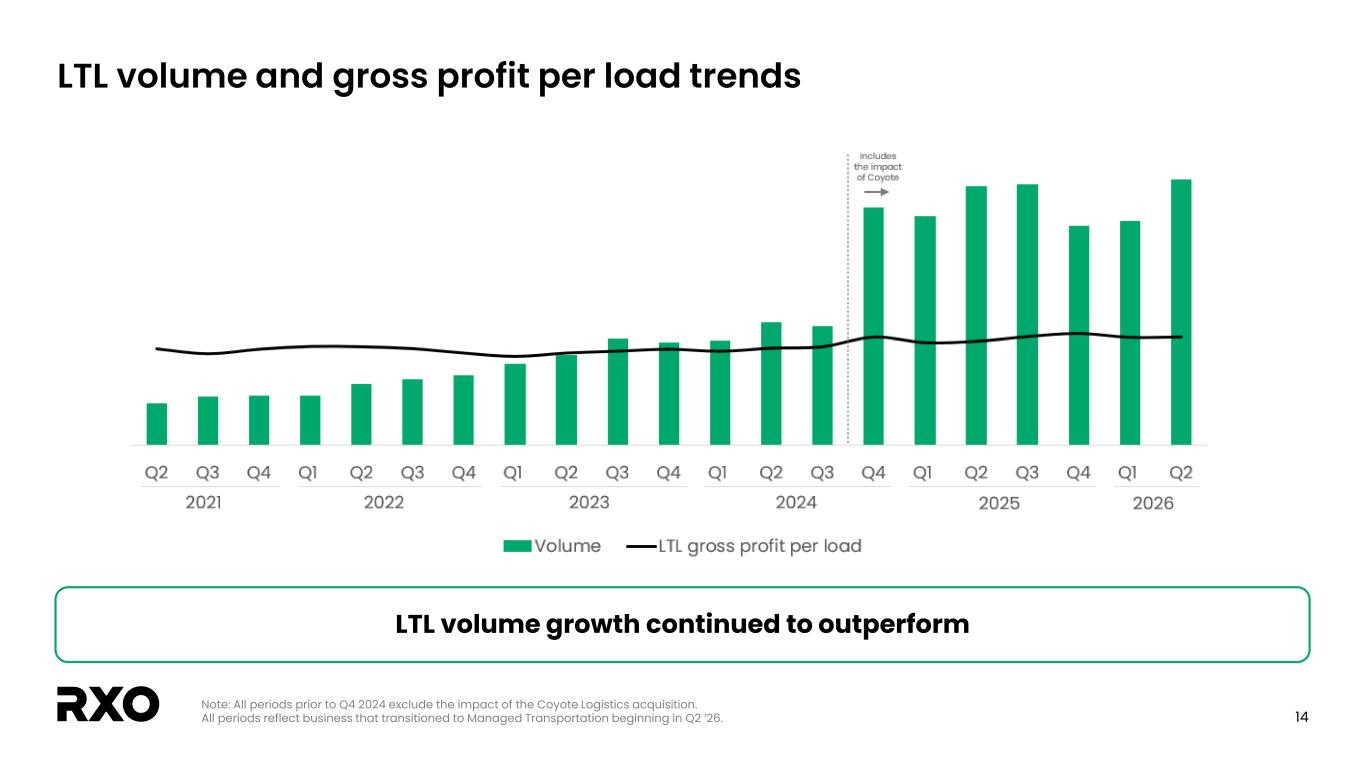
14 LTL volume and gross profit per load trends LTL volume growth continued to outperform Note: All periods prior to Q4 2024 exclude the impact of the Coyote Logistics acquisition. All periods reflect business that transitioned to Managed Transportation beginning in Q2 ‘26.
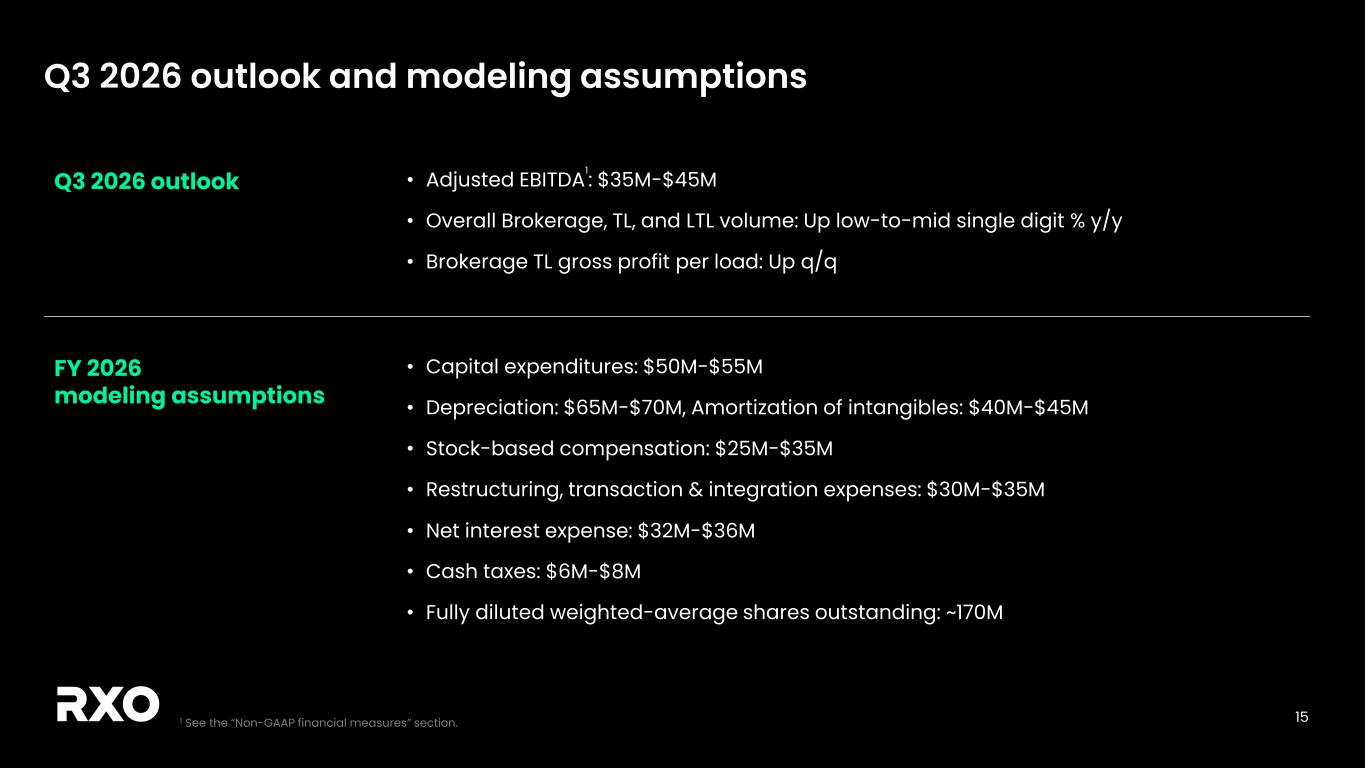
15 Q3 2026 outlook and modeling assumptions • Adjusted EBITDA1: $35M-$45M • Overall Brokerage, TL, and LTL volume: Up low-to-mid single digit % y/y • Brokerage TL gross profit per load: Up q/q Q3 2026 outlook FY 2026 modeling assumptions • Capital expenditures: $50M-$55M • Depreciation: $65M-$70M, Amortization of intangibles: $40M-$45M • Stock-based compensation: $25M-$35M • Restructuring, transaction & integration expenses: $30M-$35M • Net interest expense: $32M-$36M • Cash taxes: $6M-$8M • Fully diluted weighted-average shares outstanding: ~170M 1 See the “Non-GAAP financial measures” section.
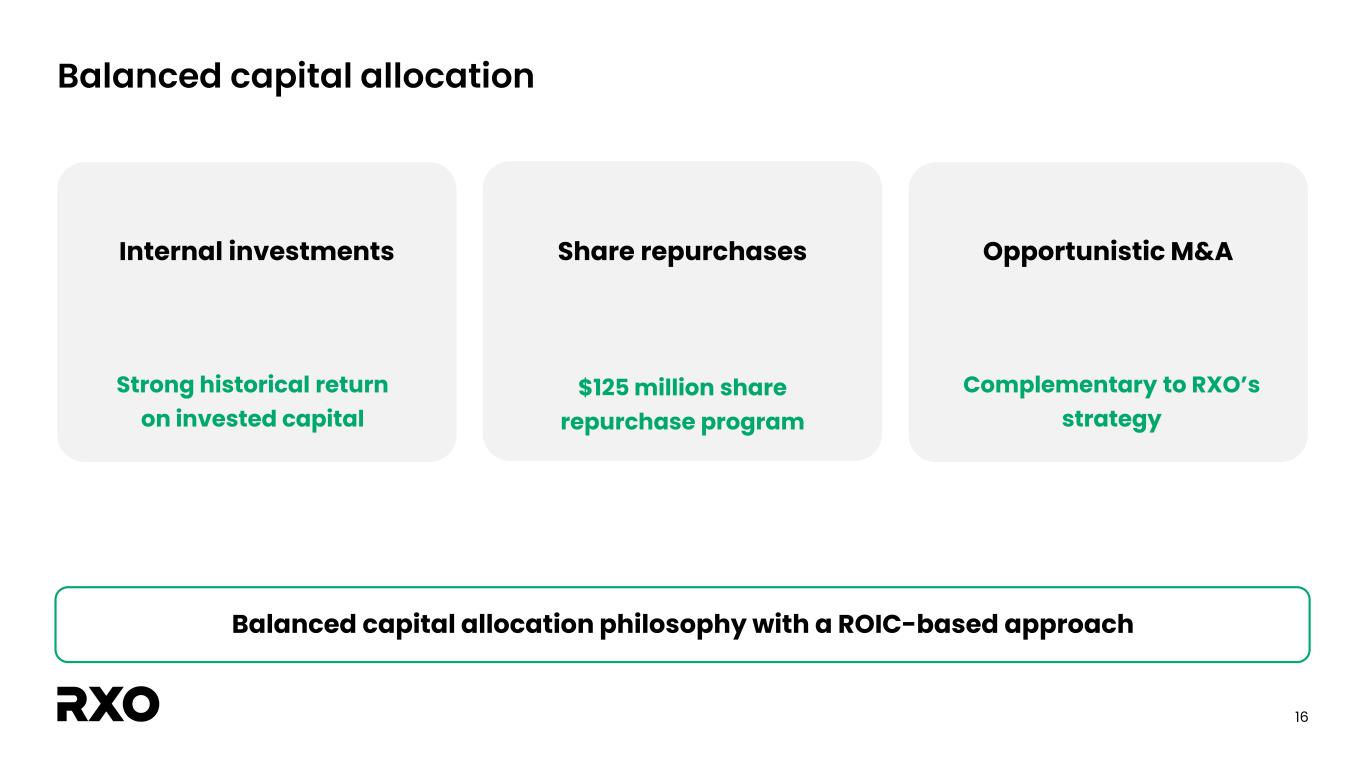
16 Balanced capital allocation Internal investments Strong historical return on invested capital Share repurchases Opportunistic M&A Complementary to RXO’s strategy Balanced capital allocation philosophy with a ROIC-based approach $125 million share repurchase program
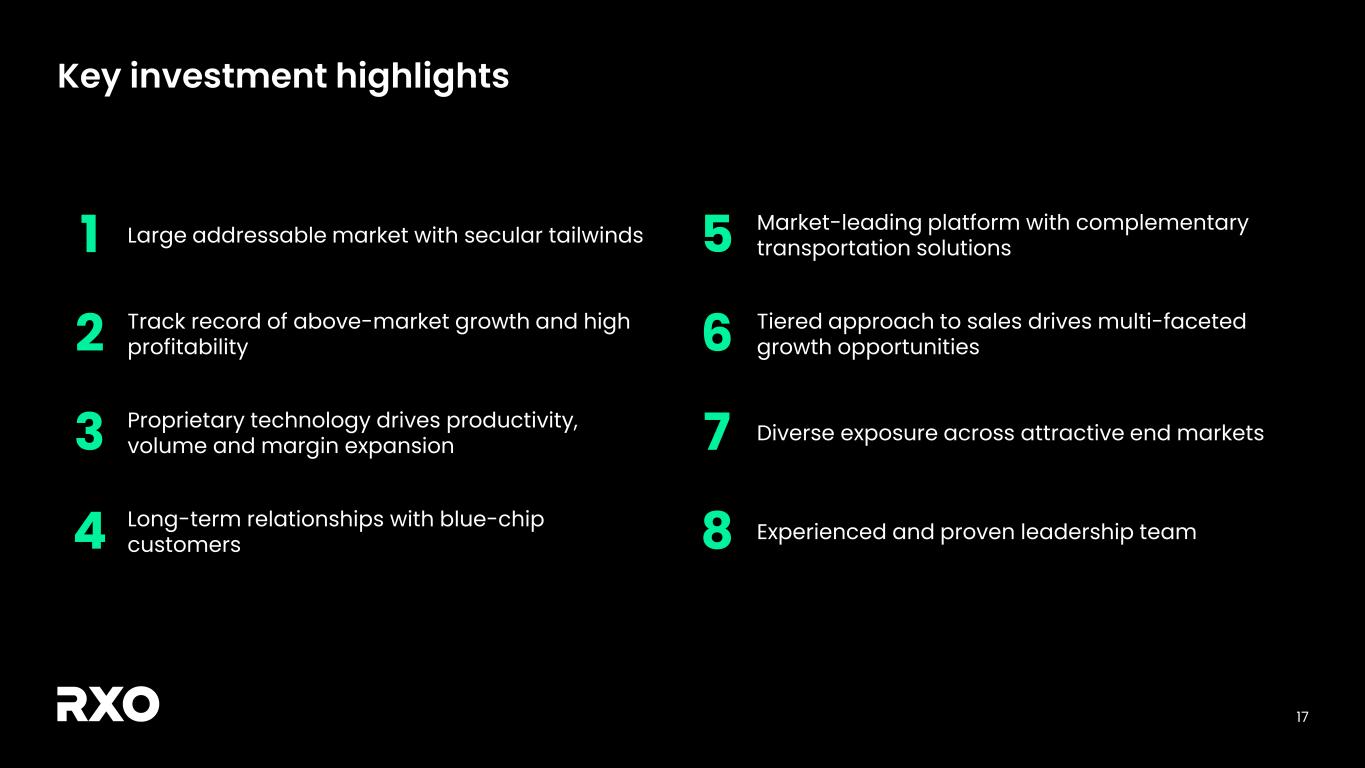
17 Key investment highlights 1 Large addressable market with secular tailwinds 2 Track record of above-market growth and high profitability 3 Proprietary technology drives productivity, volume and margin expansion 4 Long-term relationships with blue-chip customers 5 Market-leading platform with complementary transportation solutions 6 Tiered approach to sales drives multi-faceted growth opportunities 7 Diverse exposure across attractive end markets 8 Experienced and proven leadership team

18 Appendix
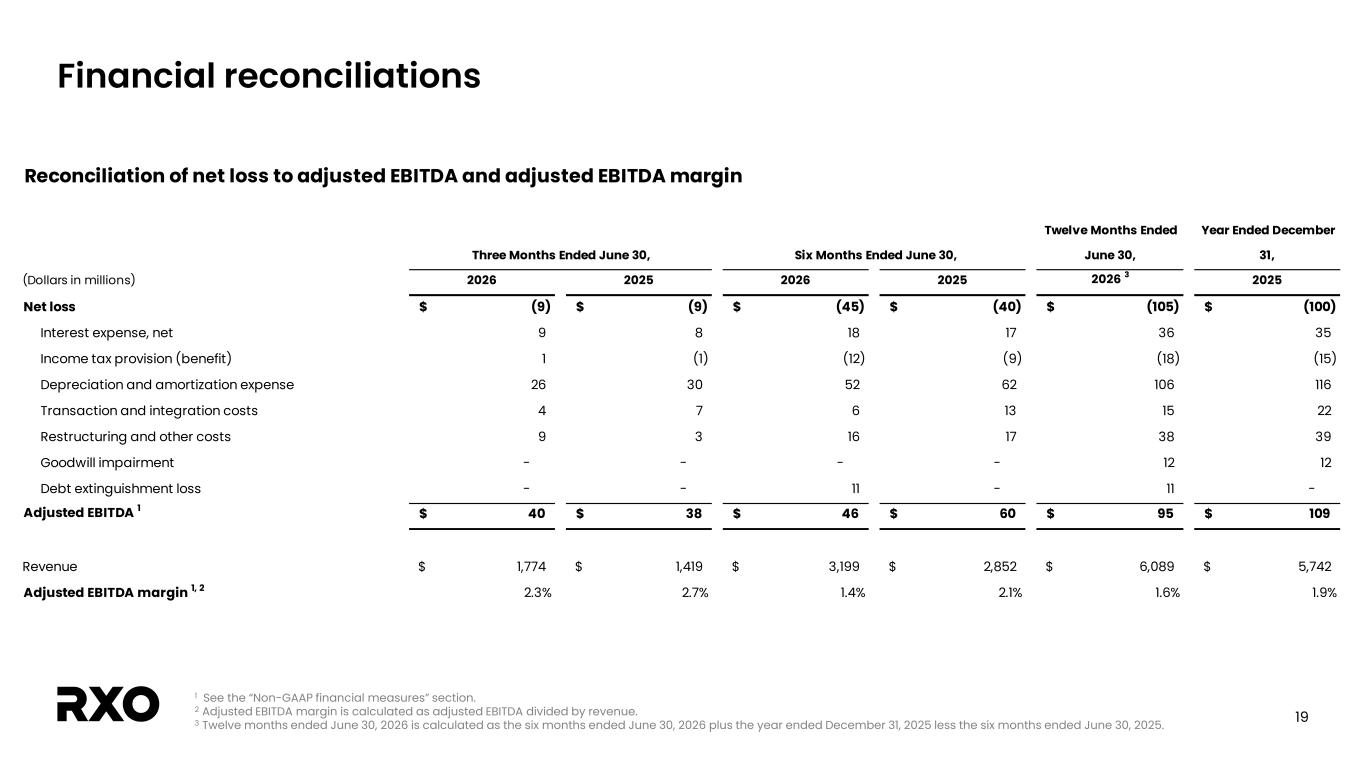
19 Financial reconciliations 1 See the “Non-GAAP financial measures” section. 2 Adjusted EBITDA margin is calculated as adjusted EBITDA divided by revenue. 3 Twelve months ended June 30, 2026 is calculated as the six months ended June 30, 2026 plus the year ended December 31, 2025 less the six months ended June 30, 2025. Reconciliation of net loss to adjusted EBITDA and adjusted EBITDA margin Twelve Months Ended June 30, Year Ended December 31, (Dollars in millions) 2026 2025 2026 2025 2026 3 2025 Net loss (9)$ (9)$ (45)$ (40)$ (105)$ (100)$ Interest expense, net 9 8 18 17 36 35 Income tax provision (benefit) 1 (1) (12) (9) (18) (15) Depreciation and amortization expense 26 30 52 62 106 116 Transaction and integration costs 4 7 6 13 15 22 Restructuring and other costs 9 3 16 17 38 39 Goodwill impairment - - - - 12 12 Debt extinguishment loss - - 11 - 11 - Adjusted EBITDA 1 40$ 38$ 46$ 60$ 95$ 109$ Revenue 1,774$ 1,419$ 3,199$ 2,852$ 6,089$ 5,742$ Adjusted EBITDA margin 1, 2 2.3% 2.7% 1.4% 2.1% 1.6% 1.9% Three Months Ended June 30, Six Months Ended June 30,
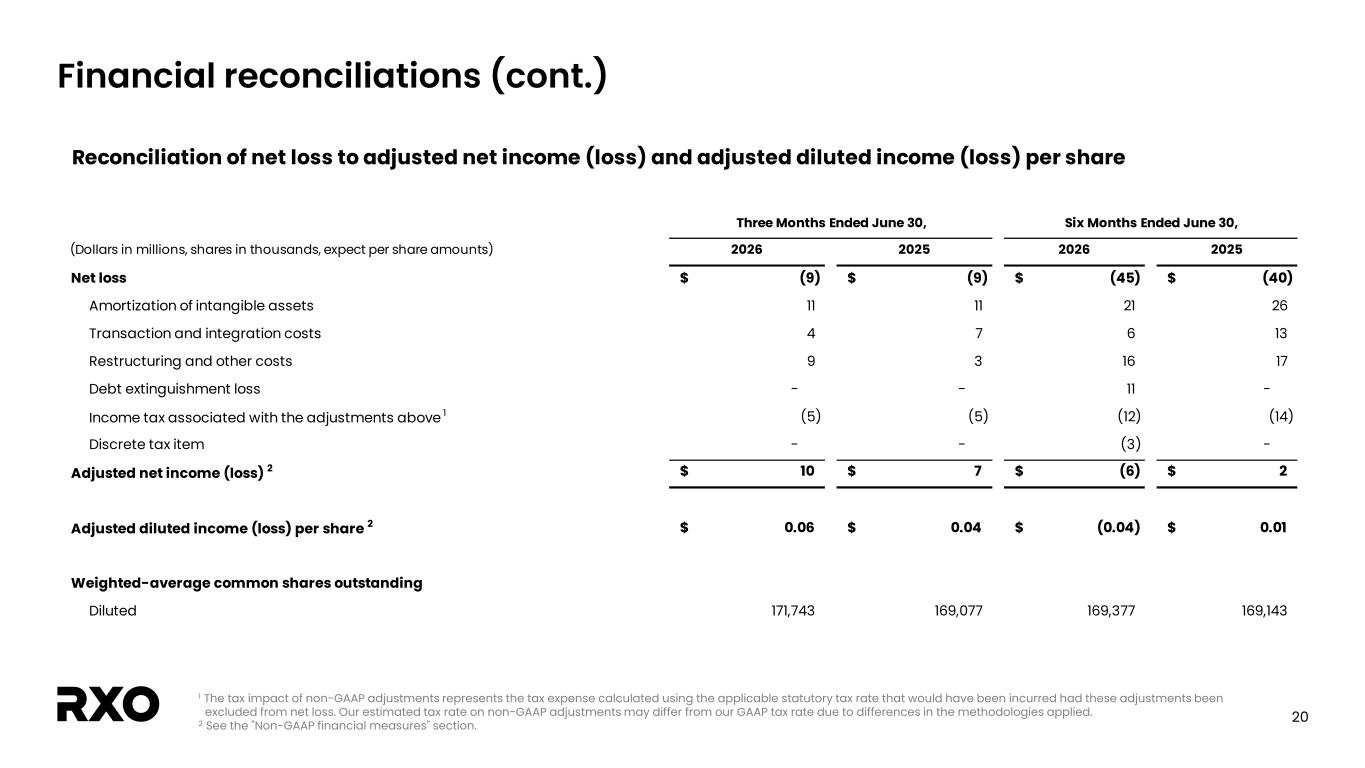
20 Financial reconciliations (cont.) 1 The tax impact of non-GAAP adjustments represents the tax expense calculated using the applicable statutory tax rate that would have been incurred had these adjustments been excluded from net loss. Our estimated tax rate on non-GAAP adjustments may differ from our GAAP tax rate due to differences in the methodologies applied. 2 See the "Non-GAAP financial measures" section. (Dollars in millions, shares in thousands, expect per share amounts) 2026 2025 2026 2025 Net loss (9)$ (9)$ (45)$ (40)$ Amortization of intangible assets 11 11 21 26 Transaction and integration costs 4 7 6 13 Restructuring and other costs 9 3 16 17 Debt extinguishment loss - - 11 - Income tax associated with the adjustments above 1 (5) (5) (12) (14) Discrete tax item - - (3) - Adjusted net income (loss) 2 10$ 7$ (6)$ 2$ Adjusted diluted income (loss) per share 2 0.06$ 0.04$ (0.04)$ 0.01$ Weighted-average common shares outstanding Diluted 171,743 169,077 169,377 169,143 Three Months Ended June 30, Six Months Ended June 30, Reconciliation of net loss to adjusted net income (loss) and adjusted diluted income (loss) per share
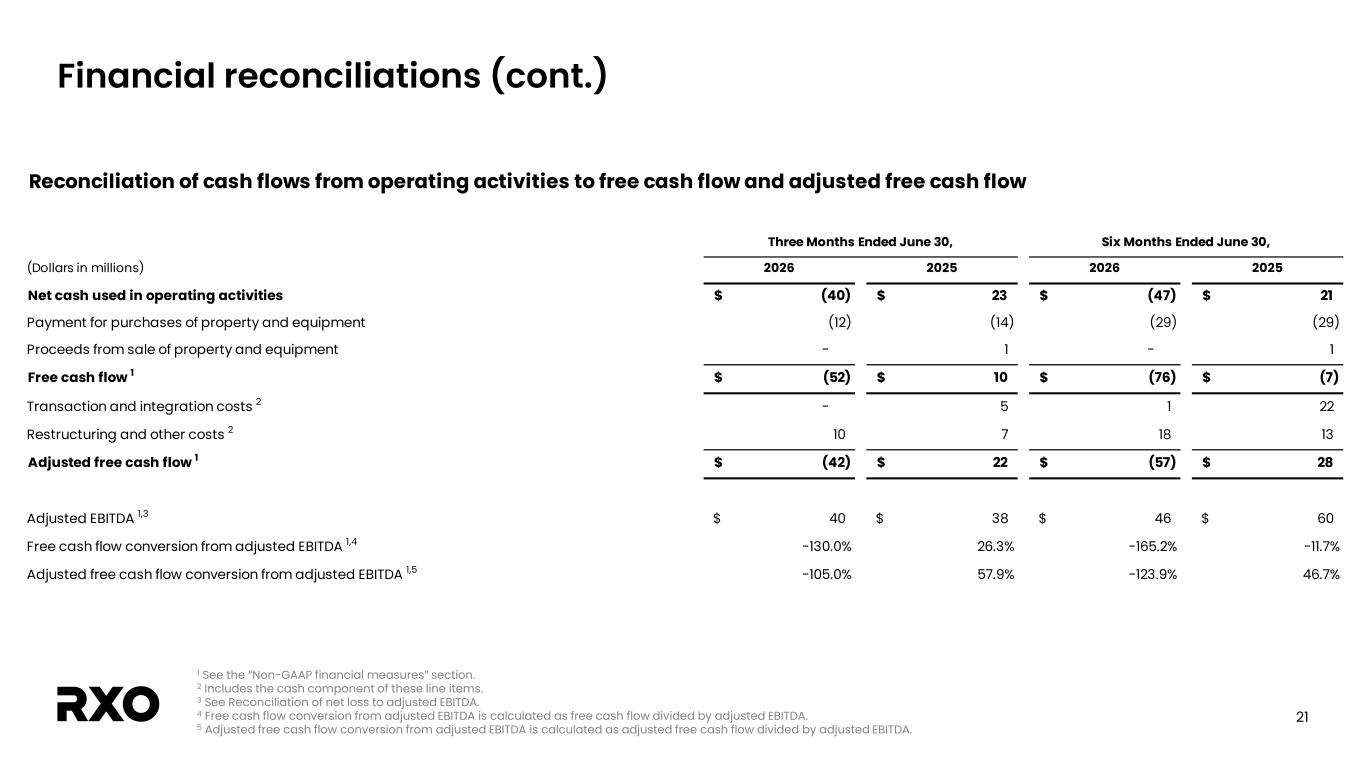
21 1 See the “Non-GAAP financial measures” section. 2 Includes the cash component of these line items. 3 See Reconciliation of net loss to adjusted EBITDA. 4 Free cash flow conversion from adjusted EBITDA is calculated as free cash flow divided by adjusted EBITDA. 5 Adjusted free cash flow conversion from adjusted EBITDA is calculated as adjusted free cash flow divided by adjusted EBITDA. Financial reconciliations (cont.) (Dollars in millions) 2026 2025 2026 2025 Net cash used in operating activities (40)$ 23$ (47)$ 21$ Payment for purchases of property and equipment (12) (14) (29) (29) Proceeds from sale of property and equipment - 1 - 1 Free cash flow 1 (52)$ 10$ (76)$ (7)$ Transaction and integration costs 2 - 5 1 22 Restructuring and other costs 2 10 7 18 13 Adjusted free cash flow 1 (42)$ 22$ (57)$ 28$ Adjusted EBITDA 1,3 40$ 38$ 46$ 60$ Free cash flow conversion from adjusted EBITDA 1,4 -130.0% 26.3% -165.2% -11.7% Adjusted free cash flow conversion from adjusted EBITDA 1,5 -105.0% 57.9% -123.9% 46.7% Six Months Ended June 30,Three Months Ended June 30, Reconciliation of cash flows from operating activities to free cash flow and adjusted free cash flow
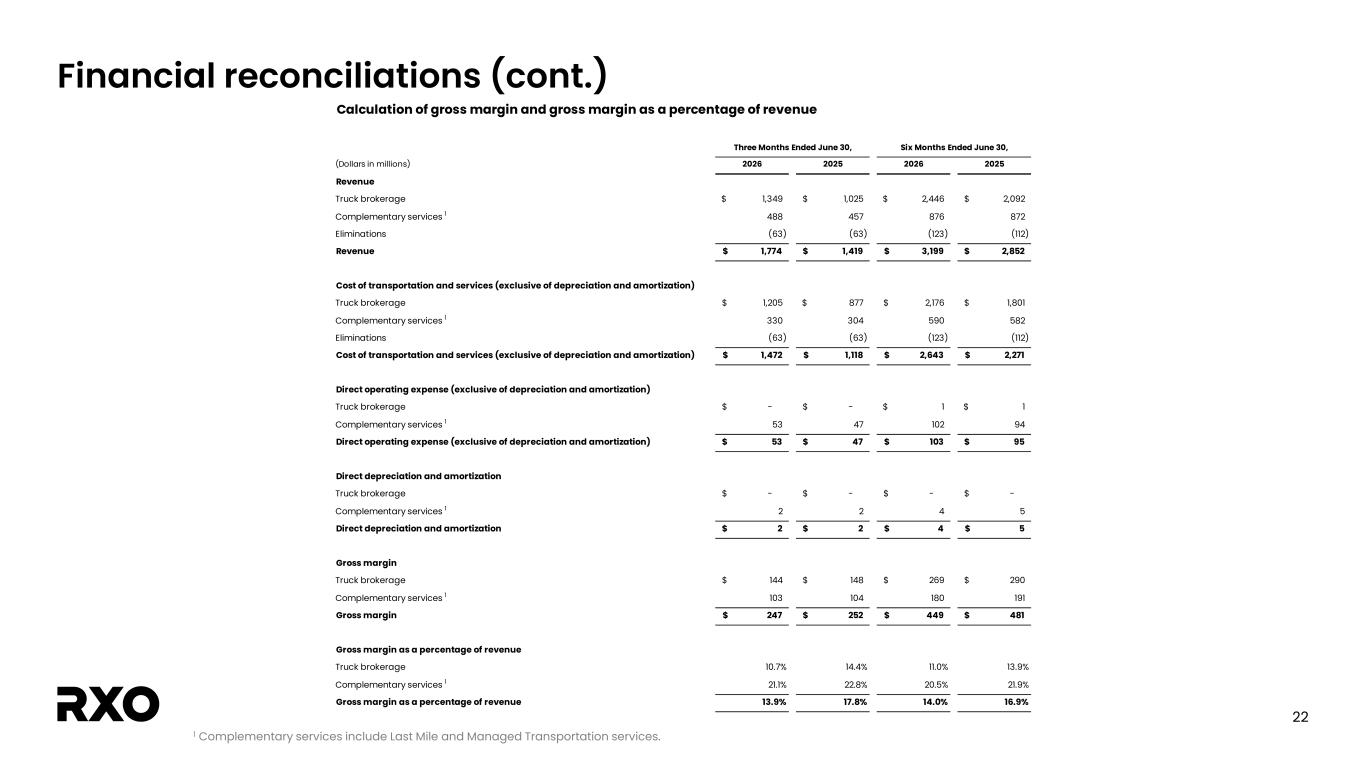
22 Financial reconciliations (cont.) 1 Complementary services include Last Mile and Managed Transportation services. Calculation of gross margin and gross margin as a percentage of revenue (Dollars in millions) 2026 2025 2026 2025 Revenue Truck brokerage 1,349$ 1,025$ 2,446$ 2,092$ Complementary services 1 488 457 876 872 Eliminations (63) (63) (123) (112) Revenue 1,774$ 1,419$ 3,199$ 2,852$ Cost of transportation and services (exclusive of depreciation and amortization) Truck brokerage 1,205$ 877$ 2,176$ 1,801$ Complementary services 1 330 304 590 582 Eliminations (63) (63) (123) (112) Cost of transportation and services (exclusive of depreciation and amortization) 1,472$ 1,118$ 2,643$ 2,271$ Direct operating expense (exclusive of depreciation and amortization) Truck brokerage -$ -$ 1$ 1$ Complementary services 1 53 47 102 94 Direct operating expense (exclusive of depreciation and amortization) 53$ 47$ 103$ 95$ Direct depreciation and amortization Truck brokerage -$ -$ -$ -$ Complementary services 1 2 2 4 5 Direct depreciation and amortization 2$ 2$ 4$ 5$ Gross margin Truck brokerage 144$ 148$ 269$ 290$ Complementary services 1 103 104 180 191 Gross margin 247$ 252$ 449$ 481$ Gross margin as a percentage of revenue Truck brokerage 10.7% 14.4% 11.0% 13.9% Complementary services 1 21.1% 22.8% 20.5% 21.9% Gross margin as a percentage of revenue 13.9% 17.8% 14.0% 16.9% Three Months Ended June 30, Six Months Ended June 30,
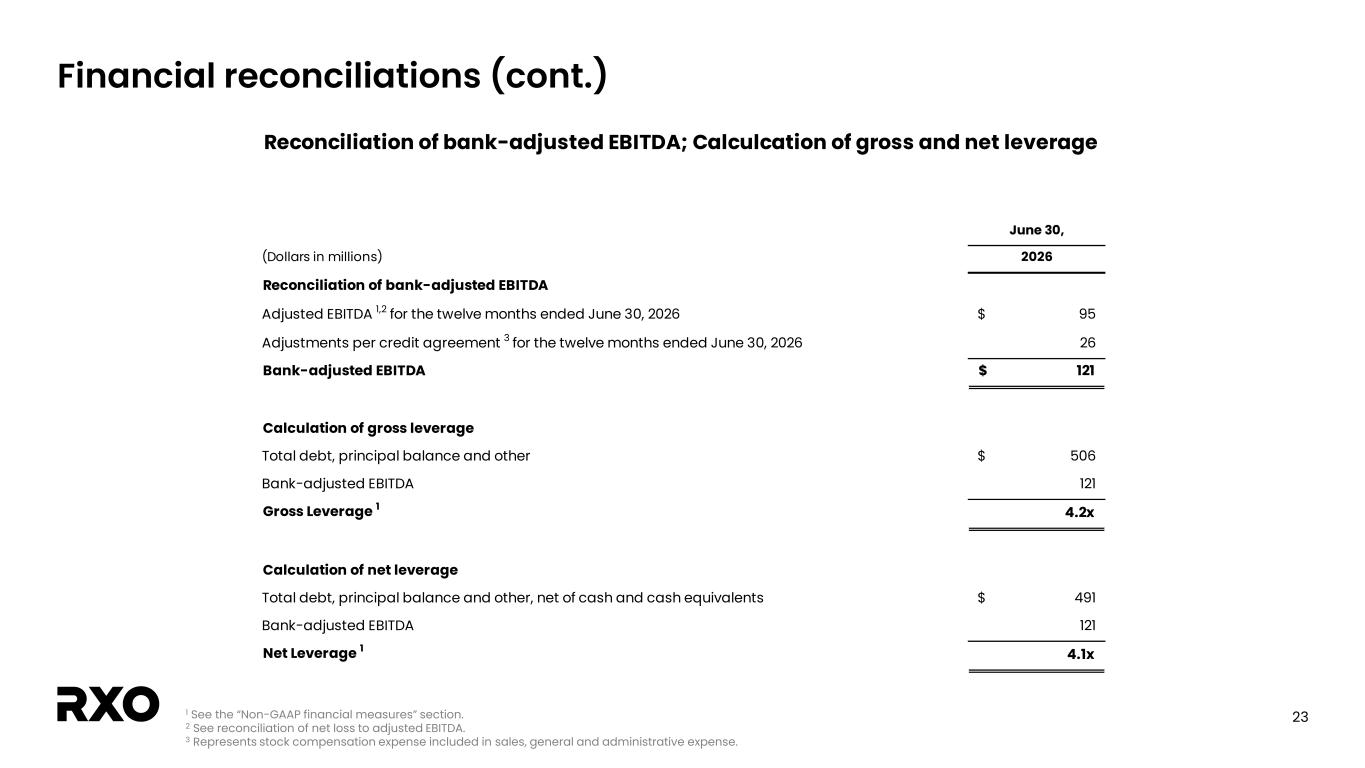
23 Financial reconciliations (cont.) 1 See the “Non-GAAP financial measures” section. 2 See reconciliation of net loss to adjusted EBITDA. 3 Represents stock compensation expense included in sales, general and administrative expense. June 30, (Dollars in millions) 2026 Reconciliation of bank-adjusted EBITDA Adjusted EBITDA 1,2 for the twelve months ended June 30, 2026 95$ Adjustments per credit agreement 3 for the twelve months ended June 30, 2026 26 Bank-adjusted EBITDA 121$ Calculation of gross leverage Total debt, principal balance and other 506$ Bank-adjusted EBITDA 121 Gross Leverage 1 4.2x Calculation of net leverage Total debt, principal balance and other, net of cash and cash equivalents 491$ Bank-adjusted EBITDA 121 Net Leverage 1 4.1x Reconciliation of bank-adjusted EBITDA; Calculcation of gross and net leverage