
First Quarter FY 2027 Results August 6th, 2026 Exhibit 99.2
F I R S T Q U A R T E R F Y 2 7 R E S U L T S Safe Harbor Disclosure This presentation contains certain “forward-looking” statements within the meaning of the Private Securities Litigation Reform Act of 1995, such as statements regarding the Company’s expected financial performance, including revenues, organic revenue growth, adjusted diluted EPS, gross margin and adjusted free cash flow; the Company’s ability to expand its Clear Eyes® supply and restore the Company’s Eye Care leadership position; the Company’s ability to execute on its brand-building strategy to grow Breathe Right®; the impact of the Company’s announced acquisitions on its financial performance and the tax benefits from the acquisition of Breathe Right®. Words such as “anticipate,” “expect,” “outlook,” “focus,” “plan,” “can,” “will,” “may,” “should,” “could,” “would,” and similar expressions identify forward-looking statements. Such forward-looking statements represent the Company’s expectations and beliefs and involve a number of known and unknown risks, uncertainties and other factors that may cause actual results to differ materially from those expressed or implied by such forward-looking statements. These factors include, among others, the ability to and timing of any increase in the supply of Clear Eyes® from Pillar5 and other suppliers; the ability of the Company’s manufacturing operat ions and third party manufacturers and logistics providers and suppliers to meet demand for its other products and to avoid inflationary cost increases and supply disruption; the impact of economic and business conditions; consumer trends; competitive pressures; the impact of the Company’s advertising and promotional and new product development initiatives; customer inventory management initiatives; the ability to pass along rising costs to customers without impacting sales; fluctuating foreign exchange rates; evolving U.S. and international tariffs and trade actions; geopolitical instability; and other risks set forth in Part I, Item 1A. Risk Factors in the Company’s Annual Report on Form 10-K for the year ended March 31, 2026. You are cautioned not to place undue reliance on these forward- looking statements, which speak only as of the date this presentation. Except to the extent required by applicable law, the Company undertakes no obligation to update any forward-looking statement contained in this presentation, whether as a result of new information, future events, or otherwise. All non-GAAP numbers presented are footnoted and reconciled to their closest GAAP measurement in the attached reconciliation schedule and in our August 6, 2026 earnings release in the “About Non-GAAP Financial Measures” section. Footnotes Reference footnotes on certain pages are detailed in the appendix on page 17.

F I R S T Q U A R T E R F Y 2 7 R E S U L T S I. Performance Highlights
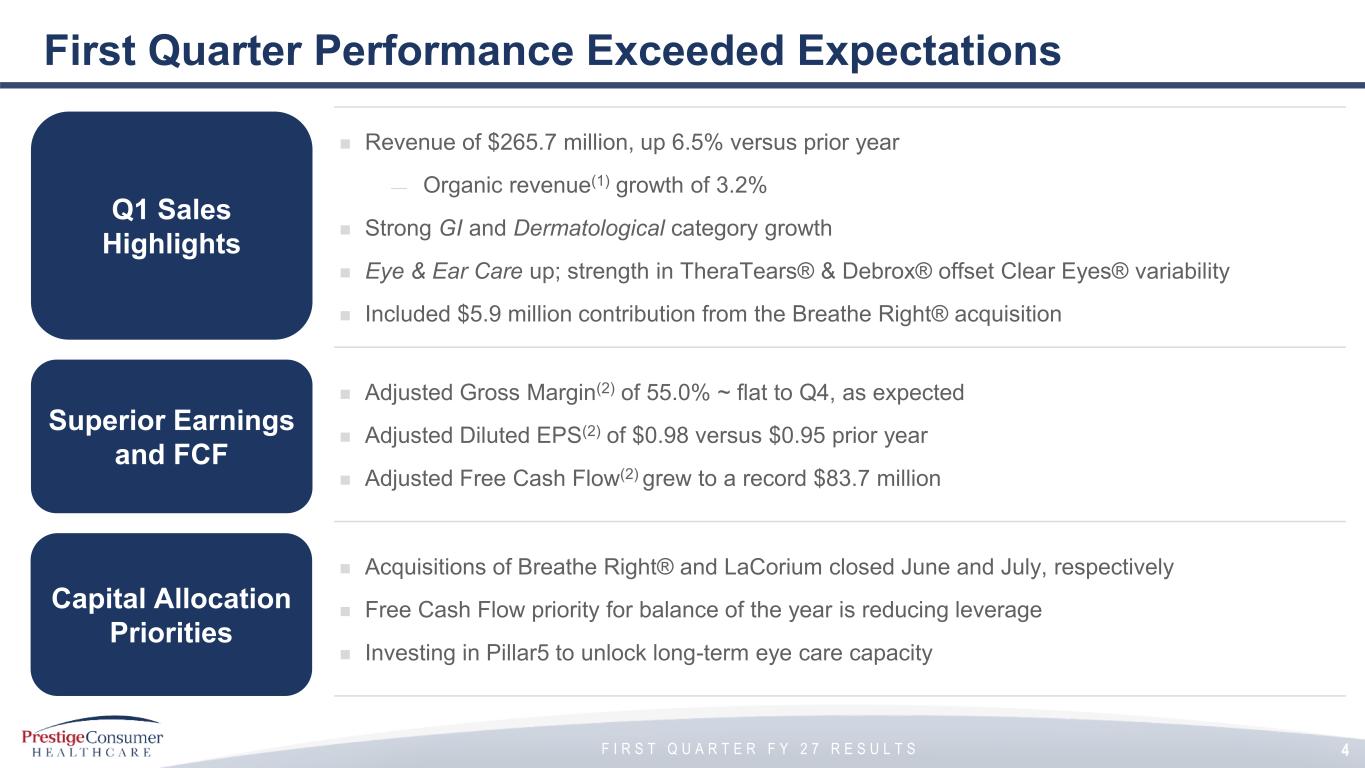
F I R S T Q U A R T E R F Y 2 7 R E S U L T S First Quarter Performance Exceeded Expectations ◼ Revenue of $265.7 million, up 6.5% versus prior year — Organic revenue(1) growth of 3.2% ◼ Strong GI and Dermatological category growth ◼ Eye & Ear Care up; strength in TheraTears® & Debrox® offset Clear Eyes® variability ◼ Included $5.9 million contribution from the Breathe Right® acquisition ◼ Adjusted Gross Margin(2) of 55.0% ~ flat to Q4, as expected ◼ Adjusted Diluted EPS(2) of $0.98 versus $0.95 prior year ◼ Adjusted Free Cash Flow(2) grew to a record $83.7 million ◼ Acquisitions of Breathe Right® and LaCorium closed June and July, respectively ◼ Free Cash Flow priority for balance of the year is reducing leverage ◼ Investing in Pillar5 to unlock long-term eye care capacity Q1 Sales Highlights Capital Allocation Priorities Superior Earnings and FCF 4
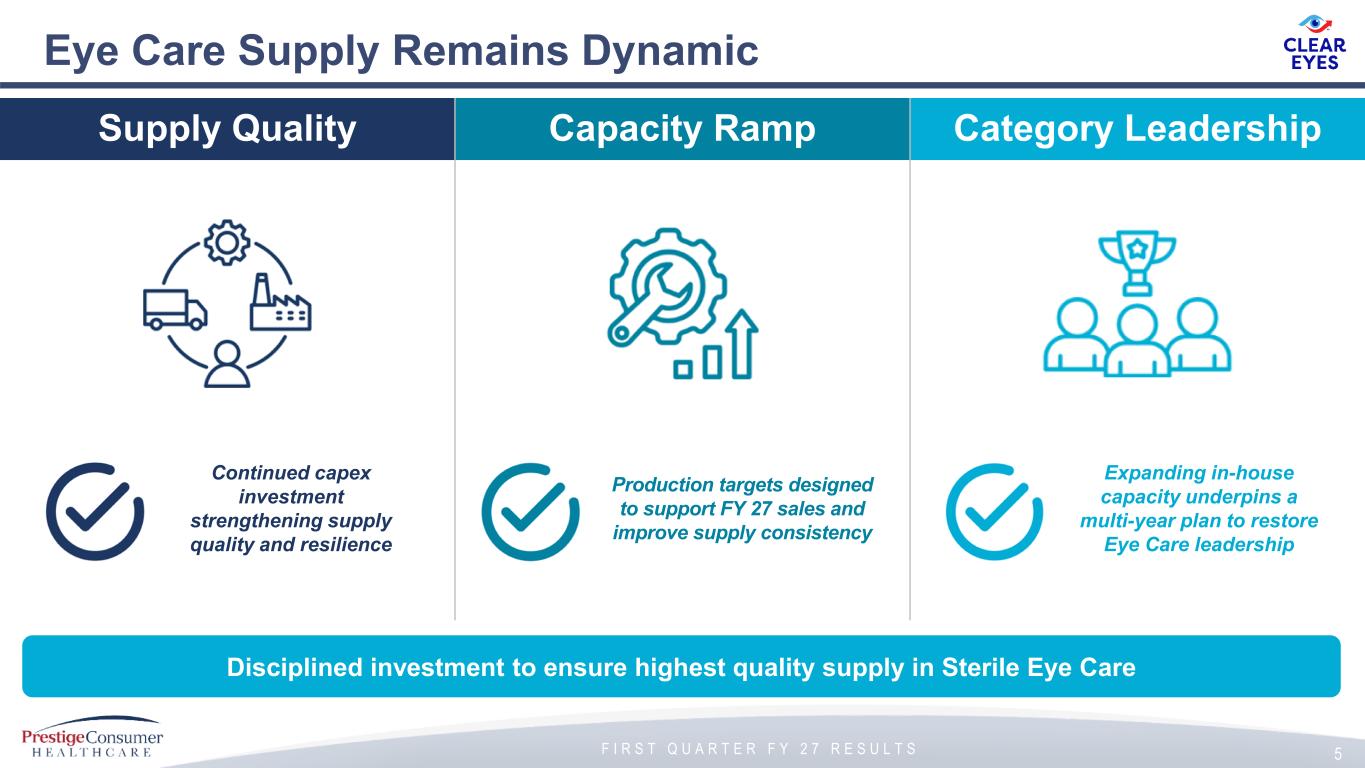
F I R S T Q U A R T E R F Y 2 7 R E S U L T S Eye Care Supply Remains Dynamic 5 Supply Quality Capacity Ramp Category Leadership Disciplined investment to ensure highest quality supply in Sterile Eye Care Continued capex investment strengthening supply quality and resilience Production targets designed to support FY 27 sales and improve supply consistency Expanding in-house capacity underpins a multi-year plan to restore Eye Care leadership

F I R S T Q U A R T E R F Y 2 7 R E S U L T S II. M&A Update
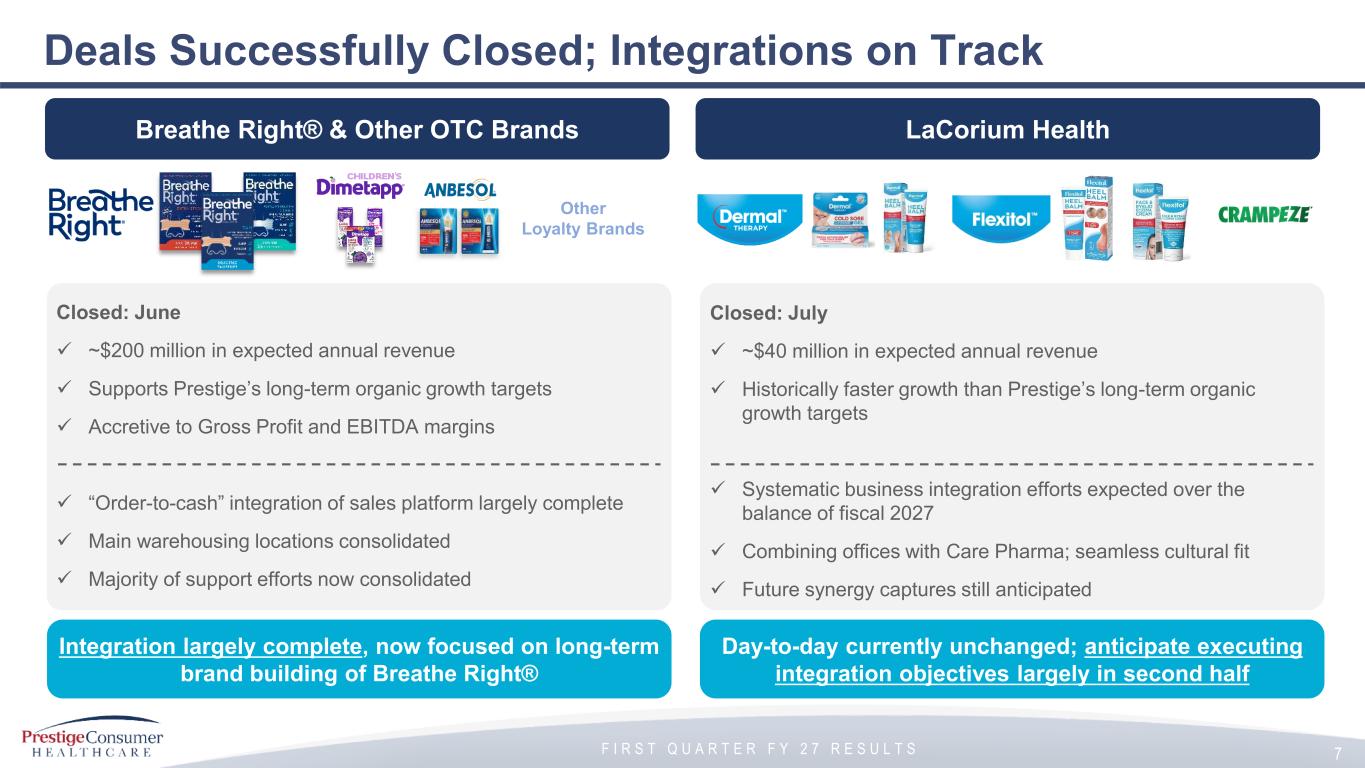
F I R S T Q U A R T E R F Y 2 7 R E S U L T S Deals Successfully Closed; Integrations on Track 7 Breathe Right® & Other OTC Brands LaCorium Health Other Loyalty Brands Integration largely complete, now focused on long-term brand building of Breathe Right® Day-to-day currently unchanged; anticipate executing integration objectives largely in second half Closed: June ✓ ~$200 million in expected annual revenue ✓ Supports Prestige’s long-term organic growth targets ✓ Accretive to Gross Profit and EBITDA margins ✓ “Order-to-cash” integration of sales platform largely complete ✓ Main warehousing locations consolidated ✓ Majority of support efforts now consolidated Closed: July ✓ ~$40 million in expected annual revenue ✓ Historically faster growth than Prestige’s long-term organic growth targets ✓ Systematic business integration efforts expected over the balance of fiscal 2027 ✓ Combining offices with Care Pharma; seamless cultural fit ✓ Future synergy captures still anticipated
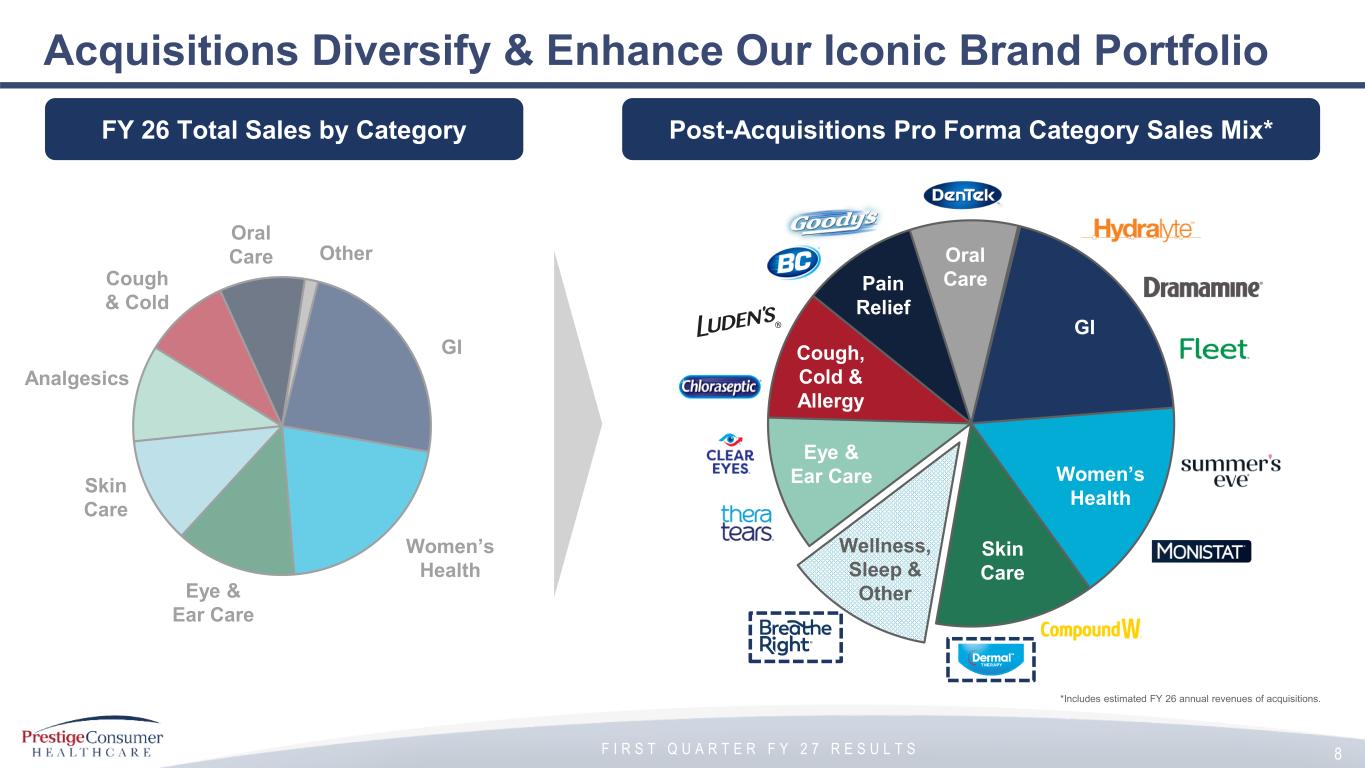
F I R S T Q U A R T E R F Y 2 7 R E S U L T S Acquisitions Diversify & Enhance Our Iconic Brand Portfolio 8 GI Skin Care Analgesics Oral Care Cough & Cold Women’s Health Eye & Ear Care Other ~12% GI Skin Care Pain Relief Oral Care Cough, Cold & Allergy Women’s Health Wellness, Sleep & Other Eye & Ear Care *Includes estimated FY 26 annual revenues of acquisitions. Post-Acquisitions Pro Forma Category Sales Mix*FY 26 Total Sales by Category
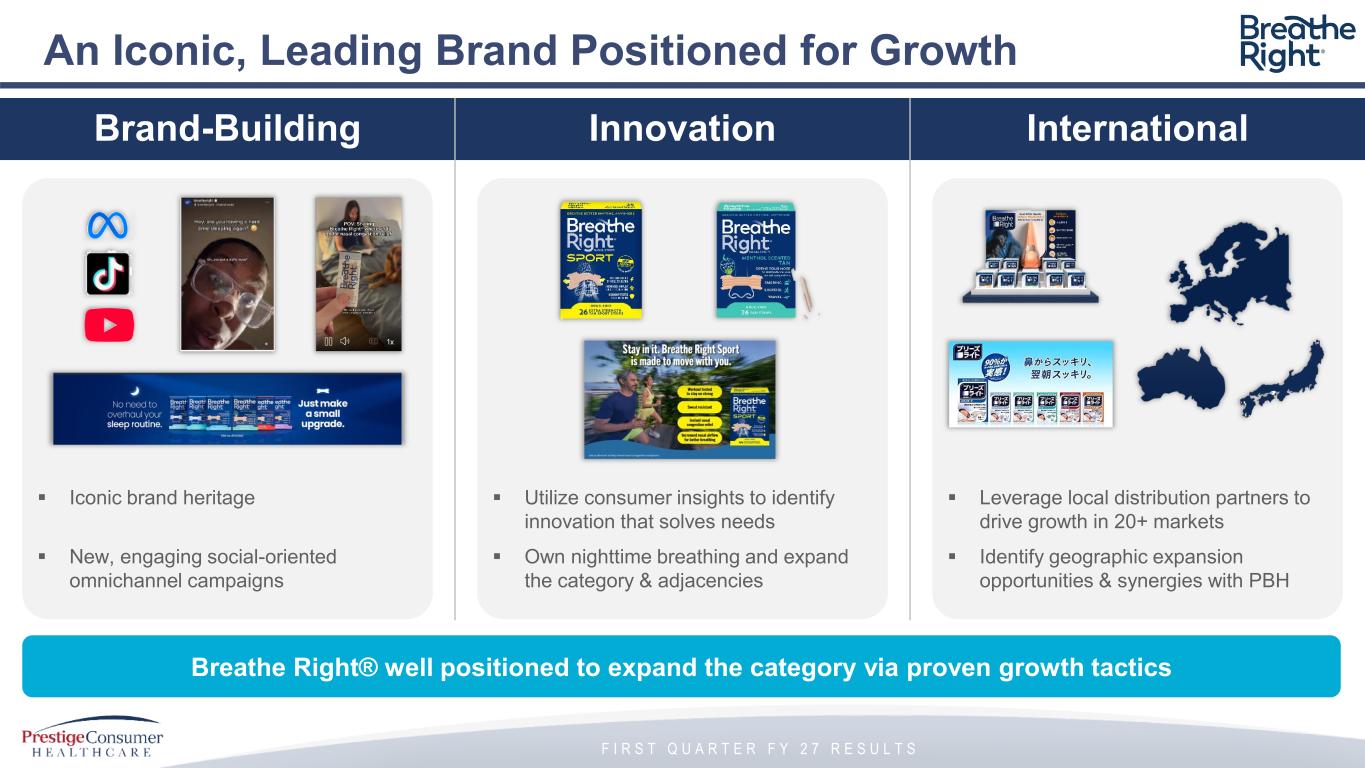
F I R S T Q U A R T E R F Y 2 7 R E S U L T S An Iconic, Leading Brand Positioned for Growth Brand-Building Innovation International Breathe Right® well positioned to expand the category via proven growth tactics ▪ Iconic brand heritage ▪ New, engaging social-oriented omnichannel campaigns ▪ Utilize consumer insights to identify innovation that solves needs ▪ Own nighttime breathing and expand the category & adjacencies ▪ Leverage local distribution partners to drive growth in 20+ markets ▪ Identify geographic expansion opportunities & synergies with PBH

F I R S T Q U A R T E R F Y 2 7 R E S U L T S III. Financial Overview
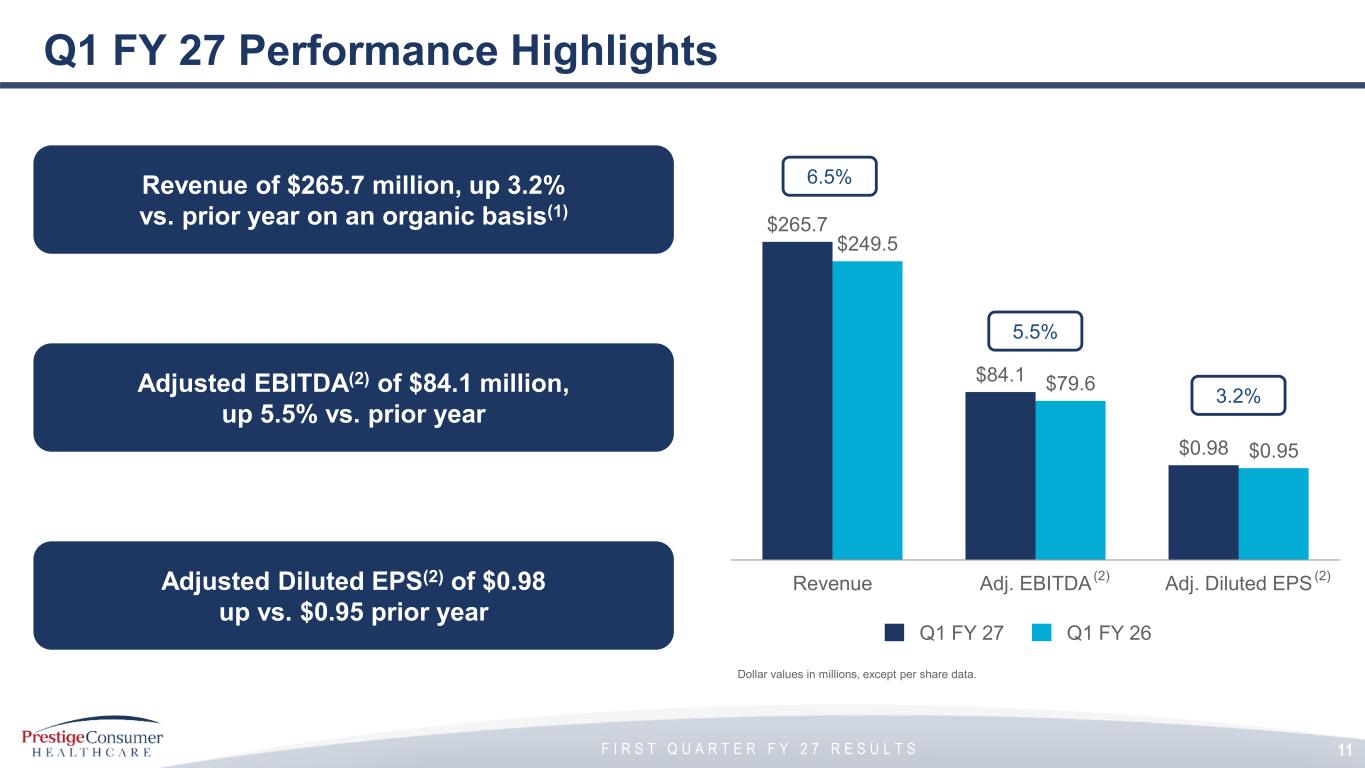
F I R S T Q U A R T E R F Y 2 7 R E S U L T S Q1 FY 27 Performance Highlights Q1 FY 27 Q1 FY 26 Dollar values in millions, except per share data. $265.7 $84.1 $0.98 $249.5 $79.6 $0.95 Revenue Adj. EBITDA Adj. Diluted EPS 6.5% 5.5% 3.2% Revenue of $265.7 million, up 3.2% vs. prior year on an organic basis(1) Adjusted Diluted EPS(2) of $0.98 up vs. $0.95 prior year Adjusted EBITDA(2) of $84.1 million, up 5.5% vs. prior year 11 (2) (2)
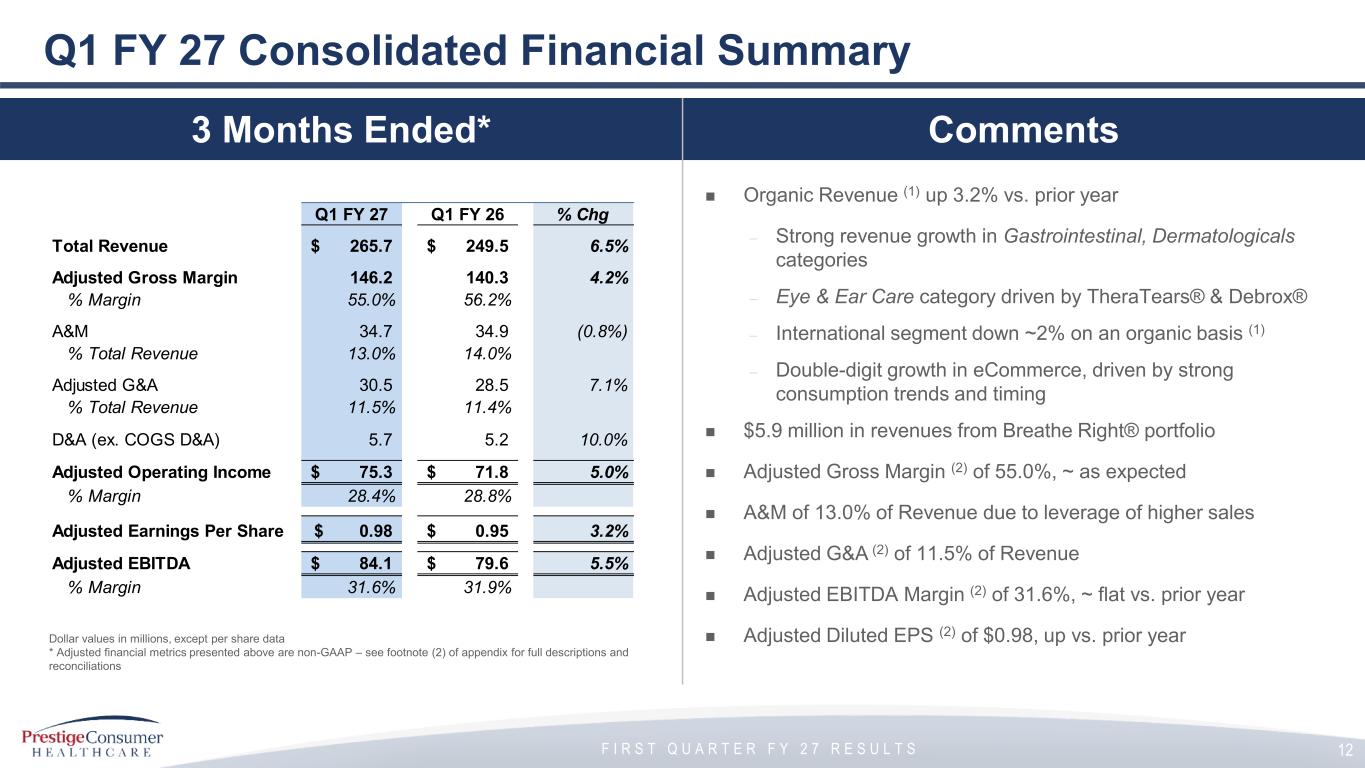
F I R S T Q U A R T E R F Y 2 7 R E S U L T S ◼ Organic Revenue (1) up 3.2% vs. prior year – Strong revenue growth in Gastrointestinal, Dermatologicals categories – Eye & Ear Care category driven by TheraTears® & Debrox® – International segment down ~2% on an organic basis (1) – Double-digit growth in eCommerce, driven by strong consumption trends and timing ◼ $5.9 million in revenues from Breathe Right® portfolio ◼ Adjusted Gross Margin (2) of 55.0%, ~ as expected ◼ A&M of 13.0% of Revenue due to leverage of higher sales ◼ Adjusted G&A (2) of 11.5% of Revenue ◼ Adjusted EBITDA Margin (2) of 31.6%, ~ flat vs. prior year ◼ Adjusted Diluted EPS (2) of $0.98, up vs. prior year Q1 FY 27 Consolidated Financial Summary Dollar values in millions, except per share data * Adjusted financial metrics presented above are non-GAAP – see footnote (2) of appendix for full descriptions and reconciliations 12 Q1 FY 27 Q1 FY 26 % Chg Total Revenue 265.7$ 249.5$ 6.5% Adjusted Gross Margin 146.2 140.3 4.2% % Margin 55.0% 56.2% A&M 34.7 34.9 (0.8%) % Total Revenue 13.0% 14.0% Adjusted G&A 30.5 28.5 7.1% % Total Revenue 11.5% 11.4% D&A (ex. COGS D&A) 5.7 5.2 10.0% Adjusted Operating Income 75.3$ 71.8$ 5.0% % Margin 28.4% 28.8% Adjusted Earnings Per Share 0.98$ 0.95$ 3.2% Adjusted EBITDA 84.1$ 79.6$ 5.5% % Margin 31.6% 31.9% 3 Months Ended* Comments
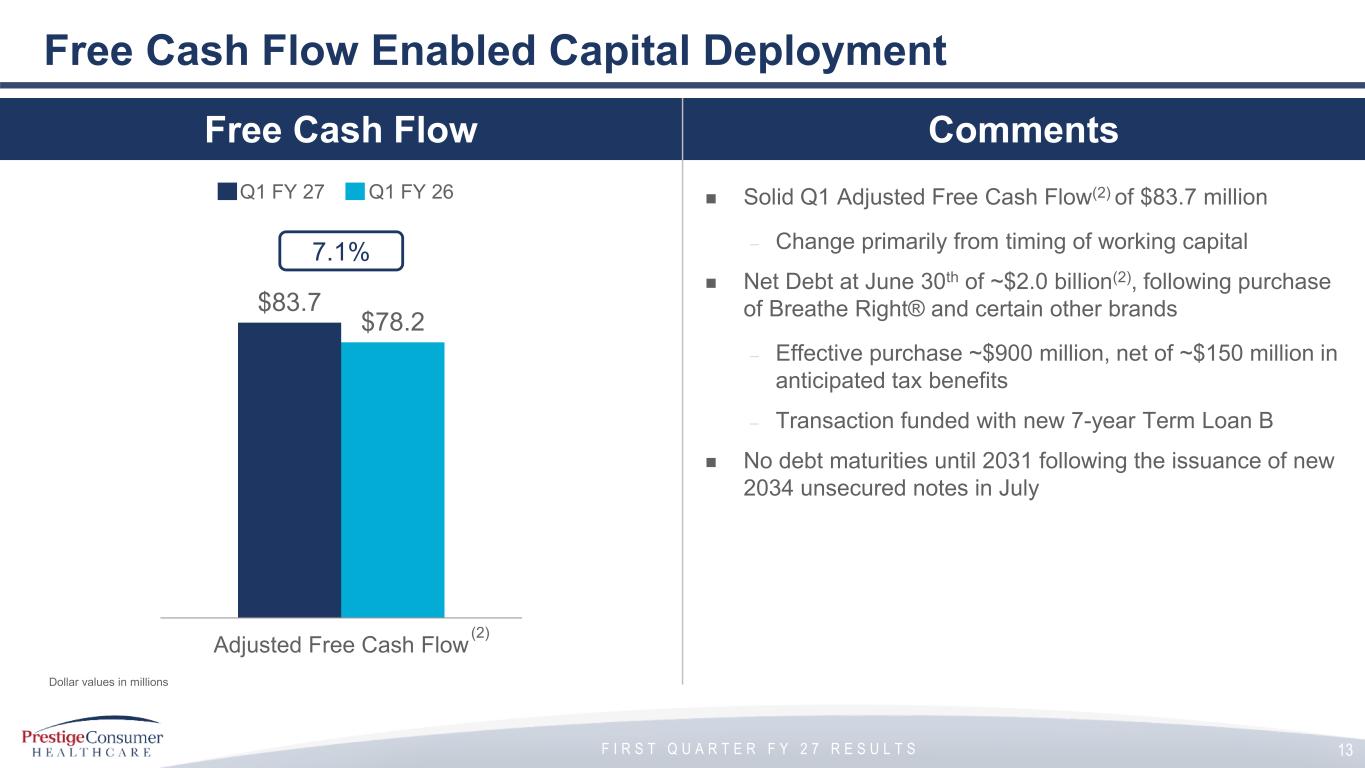
F I R S T Q U A R T E R F Y 2 7 R E S U L T S Free Cash Flow Comments ◼ Solid Q1 Adjusted Free Cash Flow(2) of $83.7 million – Change primarily from timing of working capital ◼ Net Debt at June 30th of ~$2.0 billion(2), following purchase of Breathe Right® and certain other brands – Effective purchase ~$900 million, net of ~$150 million in anticipated tax benefits – Transaction funded with new 7-year Term Loan B ◼ No debt maturities until 2031 following the issuance of new 2034 unsecured notes in July Free Cash Flow Enabled Capital Deployment $83.7 $78.2 Adjusted Free Cash Flow Q1 FY 27 Q1 FY 26 7.1% (2) Dollar values in millions 13

F I R S T Q U A R T E R F Y 2 7 R E S U L T S IV. FY 27 Outlook
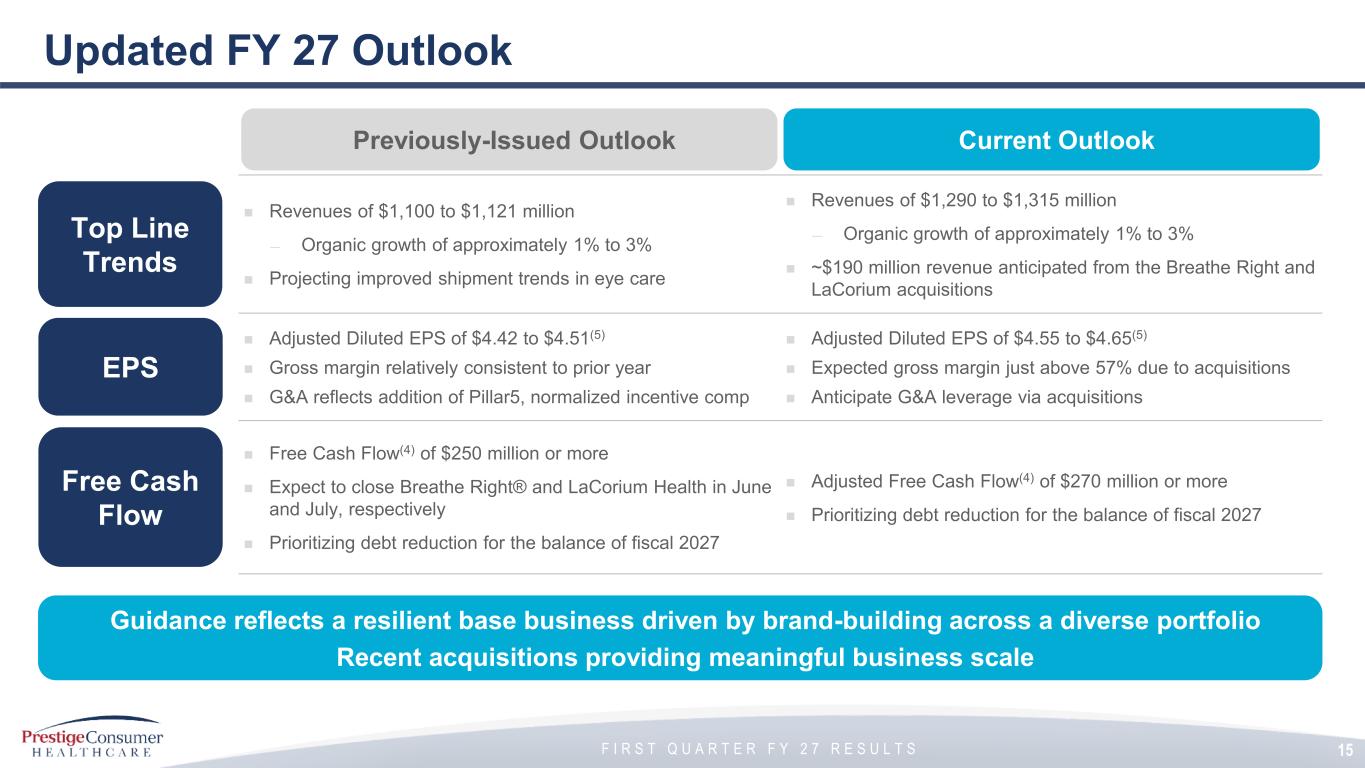
F I R S T Q U A R T E R F Y 2 7 R E S U L T S Updated FY 27 Outlook ◼ Revenues of $1,100 to $1,121 million — Organic growth of approximately 1% to 3% ◼ Projecting improved shipment trends in eye care ◼ Revenues of $1,290 to $1,315 million — Organic growth of approximately 1% to 3% ◼ ~$190 million revenue anticipated from the Breathe Right and LaCorium acquisitions ◼ Adjusted Diluted EPS of $4.42 to $4.51(5) ◼ Gross margin relatively consistent to prior year ◼ G&A reflects addition of Pillar5, normalized incentive comp ◼ Adjusted Diluted EPS of $4.55 to $4.65(5) ◼ Expected gross margin just above 57% due to acquisitions ◼ Anticipate G&A leverage via acquisitions ◼ Free Cash Flow(4) of $250 million or more ◼ Expect to close Breathe Right® and LaCorium Health in June and July, respectively ◼ Prioritizing debt reduction for the balance of fiscal 2027 ◼ Adjusted Free Cash Flow(4) of $270 million or more ◼ Prioritizing debt reduction for the balance of fiscal 2027 Top Line Trends Free Cash Flow EPS 15 Previously-Issued Outlook Current Outlook Guidance reflects a resilient base business driven by brand-building across a diverse portfolio Recent acquisitions providing meaningful business scale

F I R S T Q U A R T E R F Y 2 7 R E S U L T S Appendix
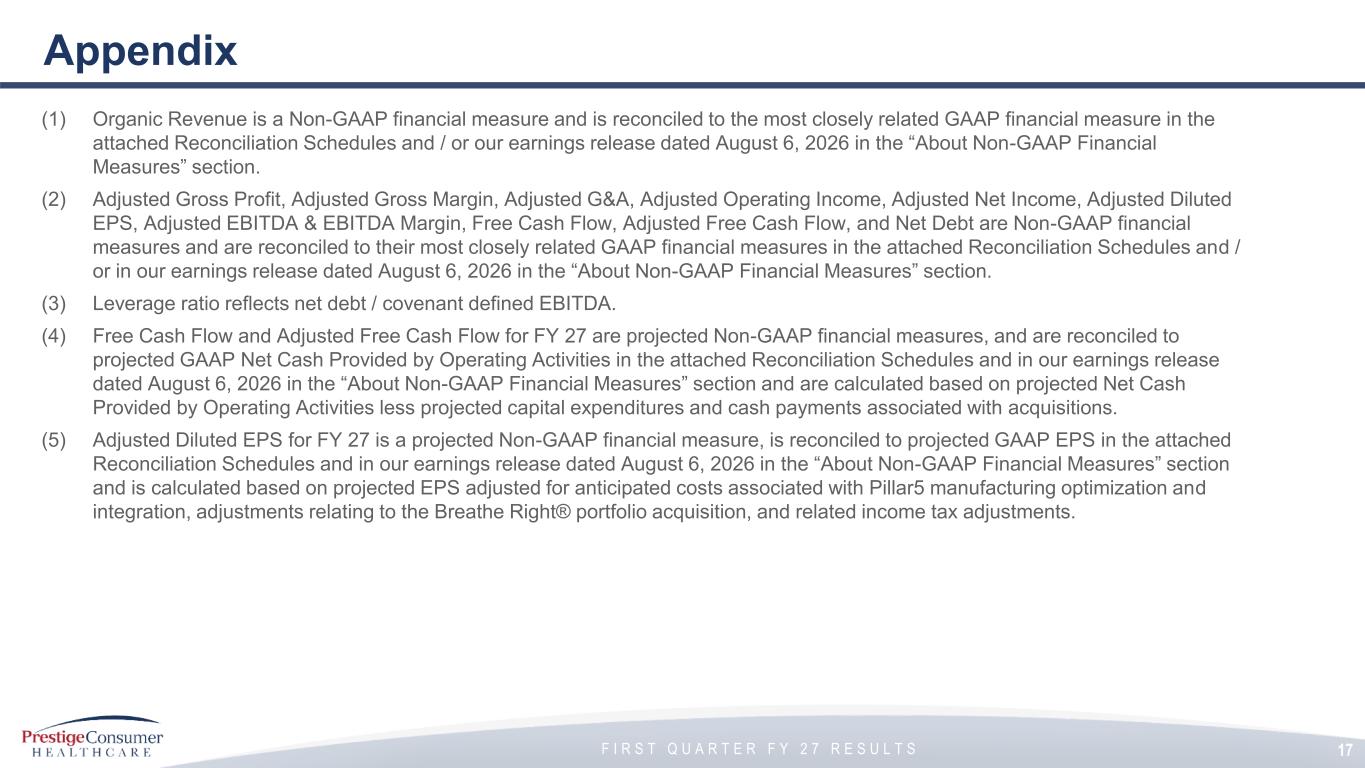
F I R S T Q U A R T E R F Y 2 7 R E S U L T S Appendix (1) Organic Revenue is a Non-GAAP financial measure and is reconciled to the most closely related GAAP financial measure in the attached Reconciliation Schedules and / or our earnings release dated August 6, 2026 in the “About Non-GAAP Financial Measures” section. (2) Adjusted Gross Profit, Adjusted Gross Margin, Adjusted G&A, Adjusted Operating Income, Adjusted Net Income, Adjusted Diluted EPS, Adjusted EBITDA & EBITDA Margin, Free Cash Flow, Adjusted Free Cash Flow, and Net Debt are Non-GAAP financial measures and are reconciled to their most closely related GAAP financial measures in the attached Reconciliation Schedules and / or in our earnings release dated August 6, 2026 in the “About Non-GAAP Financial Measures” section. (3) Leverage ratio reflects net debt / covenant defined EBITDA. (4) Free Cash Flow and Adjusted Free Cash Flow for FY 27 are projected Non-GAAP financial measures, and are reconciled to projected GAAP Net Cash Provided by Operating Activities in the attached Reconciliation Schedules and in our earnings release dated August 6, 2026 in the “About Non-GAAP Financial Measures” section and are calculated based on projected Net Cash Provided by Operating Activities less projected capital expenditures and cash payments associated with acquisitions. (5) Adjusted Diluted EPS for FY 27 is a projected Non-GAAP financial measure, is reconciled to projected GAAP EPS in the attached Reconciliation Schedules and in our earnings release dated August 6, 2026 in the “About Non-GAAP Financial Measures” section and is calculated based on projected EPS adjusted for anticipated costs associated with Pillar5 manufacturing optimization and integration, adjustments relating to the Breathe Right® portfolio acquisition, and related income tax adjustments. 17
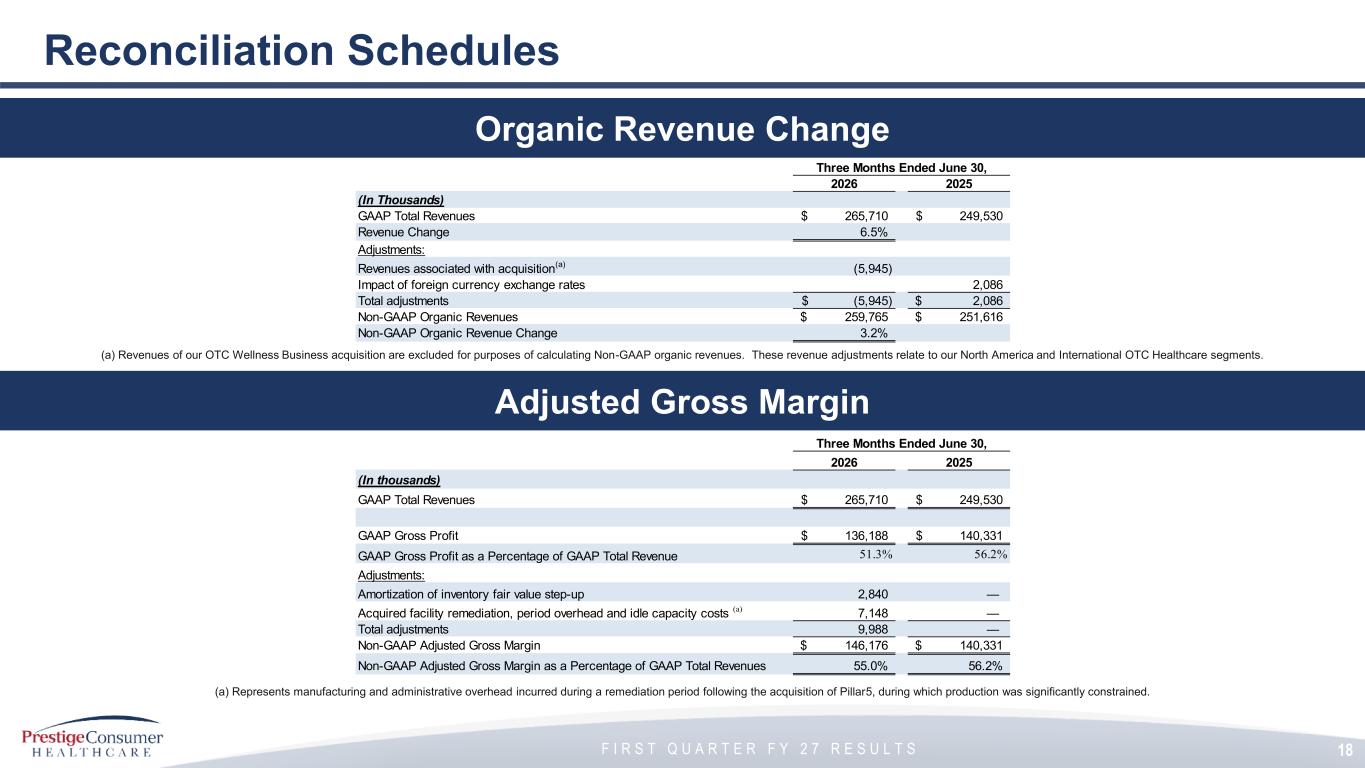
F I R S T Q U A R T E R F Y 2 7 R E S U L T S 18 Reconciliation Schedules Adjusted Gross Margin Organic Revenue Change (a) Represents manufacturing and administrative overhead incurred during a remediation period following the acquisition of Pillar5, during which production was significantly constrained. Three Months Ended June 30, 2026 2025 (In thousands) GAAP Total Revenues 265,710$ 249,530$ GAAP Gross Profit 136,188$ 140,331$ GAAP Gross Profit as a Percentage of GAAP Total Revenue 51.3% 56.2% Adjustments: Amortization of inventory fair value step-up 2,840 — Acquired facility remediation, period overhead and idle capacity costs (a) 7,148 — Total adjustments 9,988 — Non-GAAP Adjusted Gross Margin 146,176$ 140,331$ Non-GAAP Adjusted Gross Margin as a Percentage of GAAP Total Revenues 55.0% 56.2% (a) Revenues of our OTC Wellness Business acquisition are excluded for purposes of calculating Non-GAAP organic revenues. These revenue adjustments relate to our North America and International OTC Healthcare segments. Three Months Ended June 30, 2026 2025 (In Thousands) GAAP Total Revenues 265,710$ 249,530$ Revenue Change 6.5% Adjustments: Revenues associated with acquisition (a) (5,945) Impact of foreign currency exchange rates 2,086 Total adjustments (5,945)$ 2,086$ Non-GAAP Organic Revenues 259,765$ 251,616$ Non-GAAP Organic Revenue Change 3.2%
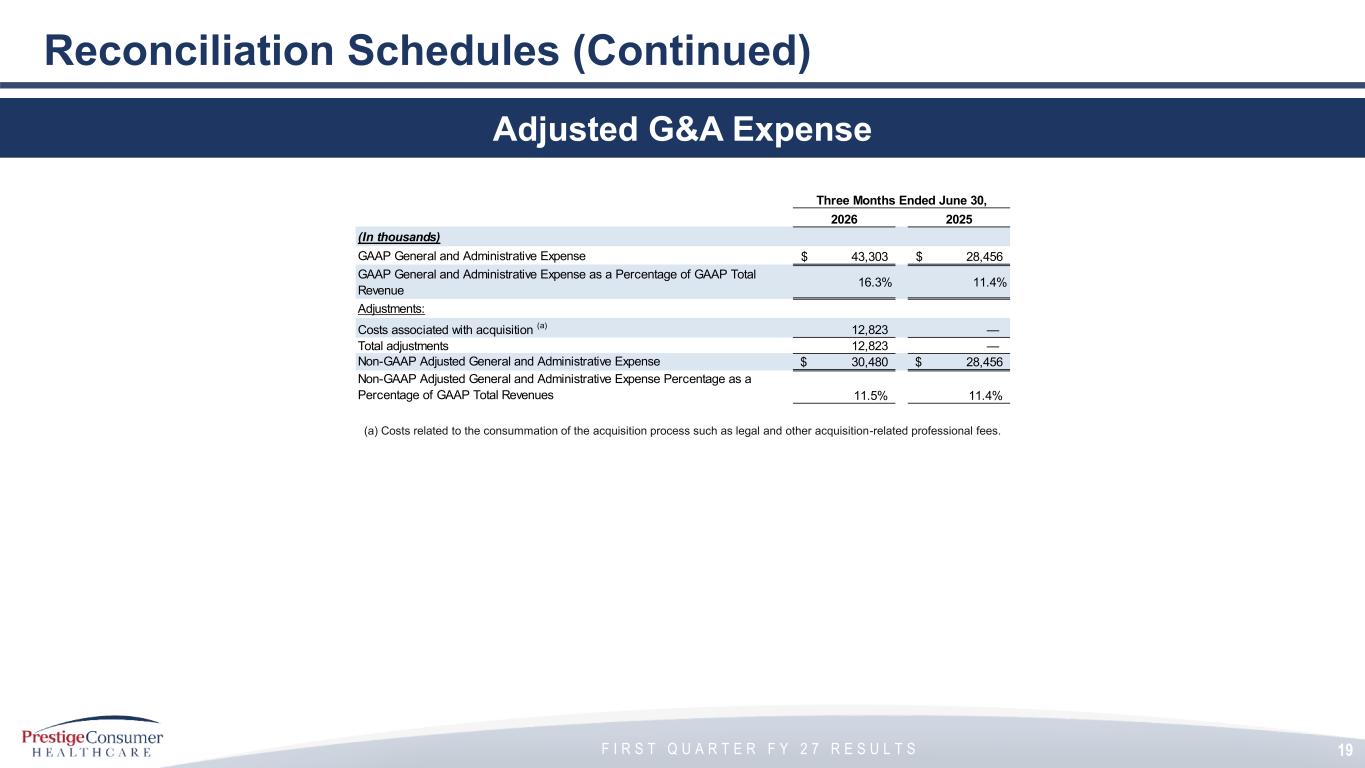
F I R S T Q U A R T E R F Y 2 7 R E S U L T S 19 Reconciliation Schedules (Continued) Adjusted G&A Expense (a) Costs related to the consummation of the acquisition process such as legal and other acquisition-related professional fees. Three Months Ended June 30, 2026 2025 (In thousands) GAAP General and Administrative Expense 43,303$ 28,456$ GAAP General and Administrative Expense as a Percentage of GAAP Total Revenue 16.3% 11.4% Adjustments: Costs associated with acquisition (a) 12,823 — Total adjustments 12,823 — Non-GAAP Adjusted General and Administrative Expense 30,480$ 28,456$ Non-GAAP Adjusted General and Administrative Expense Percentage as a Percentage of GAAP Total Revenues 11.5% 11.4%
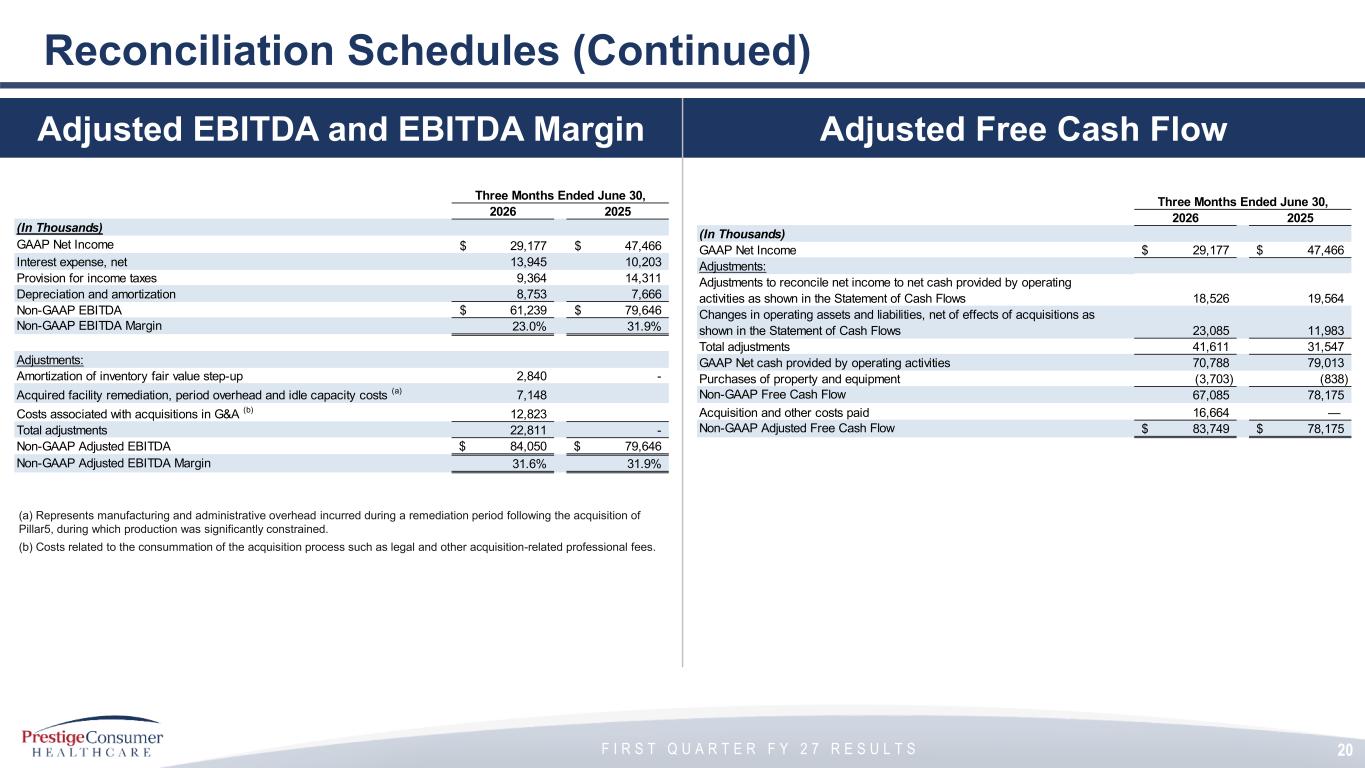
F I R S T Q U A R T E R F Y 2 7 R E S U L T S 20 Reconciliation Schedules (Continued) Adjusted EBITDA and EBITDA Margin (a) Represents manufacturing and administrative overhead incurred during a remediation period following the acquisition of Pillar5, during which production was significantly constrained. (b) Costs related to the consummation of the acquisition process such as legal and other acquisition-related professional fees. Three Months Ended June 30, 2026 2025 (In Thousands) GAAP Net Income 29,177$ 47,466$ Interest expense, net 13,945 10,203 Provision for income taxes 9,364 14,311 Depreciation and amortization 8,753 7,666 Non-GAAP EBITDA 61,239$ 79,646$ Non-GAAP EBITDA Margin 23.0% 31.9% Adjustments: Amortization of inventory fair value step-up 2,840 - Acquired facility remediation, period overhead and idle capacity costs (a) 7,148 Costs associated with acquisitions in G&A (b) 12,823 Total adjustments 22,811 - Non-GAAP Adjusted EBITDA 84,050$ 79,646$ Non-GAAP Adjusted EBITDA Margin 31.6% 31.9% Adjusted Free Cash Flow Three Months Ended June 30, 2026 2025 (In Thousands) GAAP Net Income 29,177$ 47,466$ Adjustments: Adjustments to reconcile net income to net cash provided by operating activities as shown in the Statement of Cash Flows 18,526 19,564 Changes in operating assets and liabilities, net of effects of acquisitions as shown in the Statement of Cash Flows 23,085 11,983 Total adjustments 41,611 31,547 GAAP Net cash provided by operating activities 70,788 79,013 Purchases of property and equipment (3,703) (838) Non-GAAP Free Cash Flow 67,085 78,175 Acquisition and other costs paid 16,664 — Non-GAAP Adjusted Free Cash Flow 83,749$ 78,175$
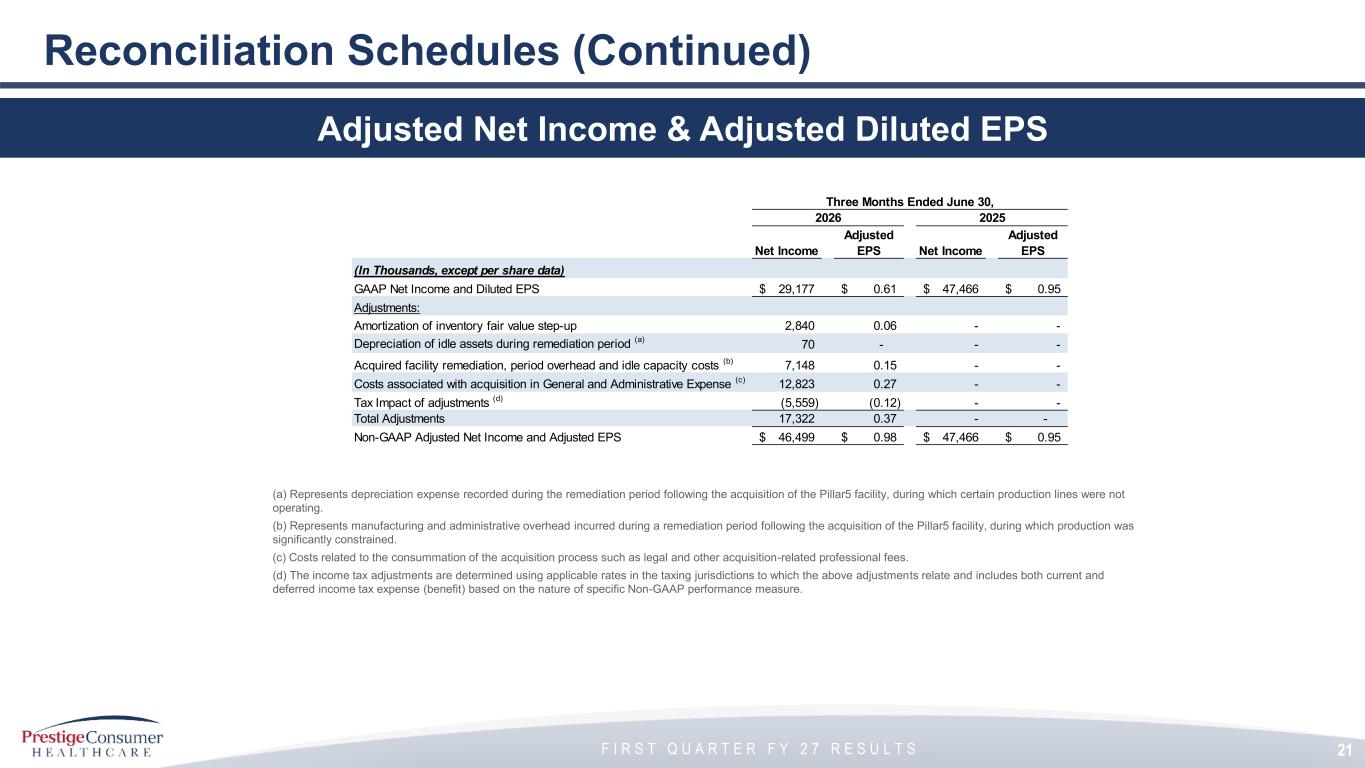
F I R S T Q U A R T E R F Y 2 7 R E S U L T S 21 Reconciliation Schedules (Continued) Adjusted Net Income & Adjusted Diluted EPS (a) Represents depreciation expense recorded during the remediation period following the acquisition of the Pillar5 facility, during which certain production lines were not operating. (b) Represents manufacturing and administrative overhead incurred during a remediation period following the acquisition of the Pillar5 facility, during which production was significantly constrained. (c) Costs related to the consummation of the acquisition process such as legal and other acquisition-related professional fees. (d) The income tax adjustments are determined using applicable rates in the taxing jurisdictions to which the above adjustments relate and includes both current and deferred income tax expense (benefit) based on the nature of specific Non-GAAP performance measure. Three Months Ended June 30, Nine Months Ended December 31, 2026 2025 Net Income Adjusted EPS Net Income Adjusted EPS (In Thousands, except per share data) GAAP Net Income and Diluted EPS 29,177$ 0.61$ 47,466$ 0.95$ Adjustments: Amortization of inventory fair value step-up 2,840 0.06 - - Depreciation of idle assets during remediation period (a) 70 - - - Acquired facility remediation, period overhead and idle capacity costs (b) 7,148 0.15 - - Costs associated with acquisition in General and Administrative Expense (c) 12,823 0.27 - - Tax Impact of adjustments (d) (5,559) (0.12) - - Total Adjustments 17,322 0.37 - - Non-GAAP Adjusted Net Income and Adjusted EPS 46,499$ 0.98$ 47,466$ 0.95$
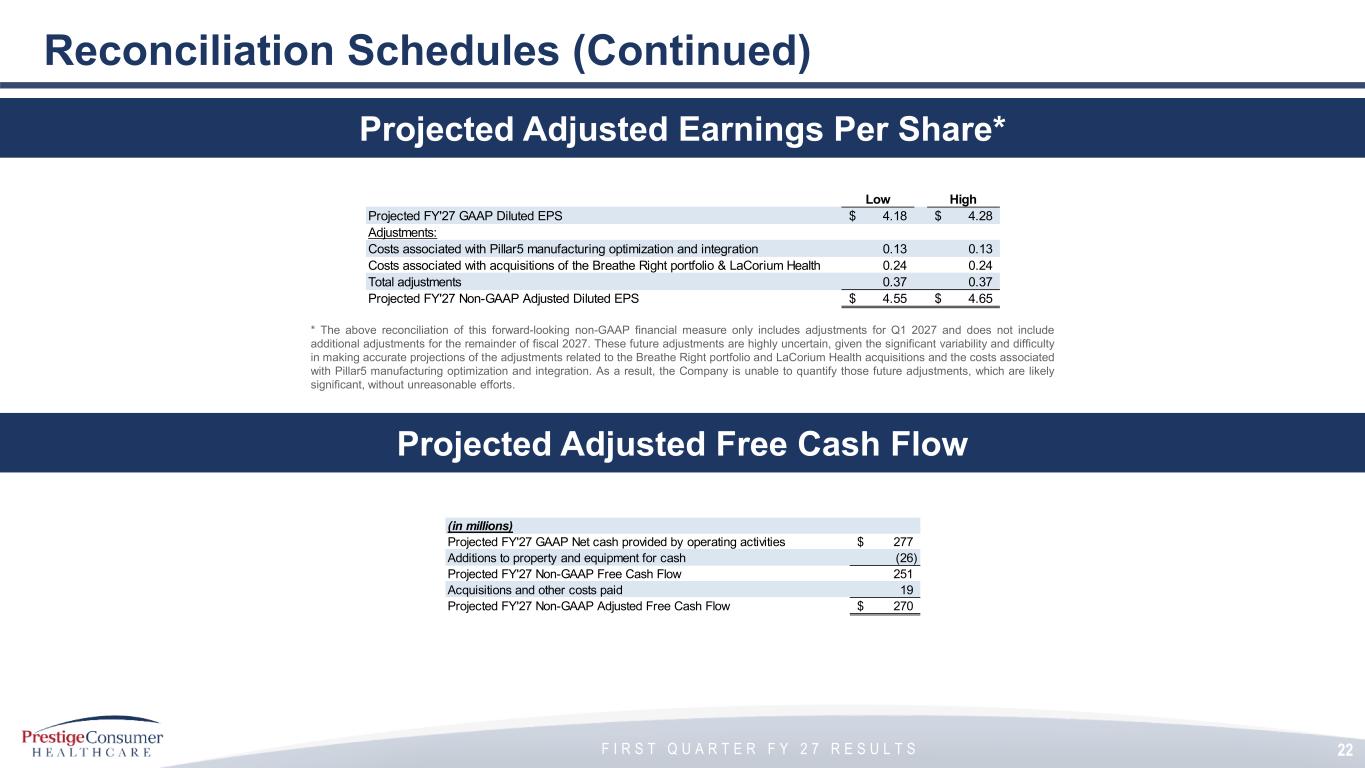
F I R S T Q U A R T E R F Y 2 7 R E S U L T S 22 Reconciliation Schedules (Continued) Projected Adjusted Free Cash Flow Projected Adjusted Earnings Per Share* Low High Projected FY'27 GAAP Diluted EPS 4.18$ 4.28$ Adjustments: Costs associated with Pillar5 manufacturing optimization and integration 0.13 0.13 Costs associated with acquisitions of the Breathe Right portfolio & LaCorium Health 0.24 0.24 Total adjustments 0.37 0.37 Projected FY'27 Non-GAAP Adjusted Diluted EPS 4.55$ 4.65$ * The above reconciliation of this forward-looking non-GAAP financial measure only includes adjustments for Q1 2027 and does not include additional adjustments for the remainder of fiscal 2027. These future adjustments are highly uncertain, given the significant variability and difficulty in making accurate projections of the adjustments related to the Breathe Right portfolio and LaCorium Health acquisitions and the costs associated with Pillar5 manufacturing optimization and integration. As a result, the Company is unable to quantify those future adjustments, which are likely significant, without unreasonable efforts. (in millions) Projected FY'27 GAAP Net cash provided by operating activities 277$ Additions to property and equipment for cash (26) Projected FY'27 Non-GAAP Free Cash Flow 251 Acquisitions and other costs paid 19 Projected FY'27 Non-GAAP Adjusted Free Cash Flow 270$
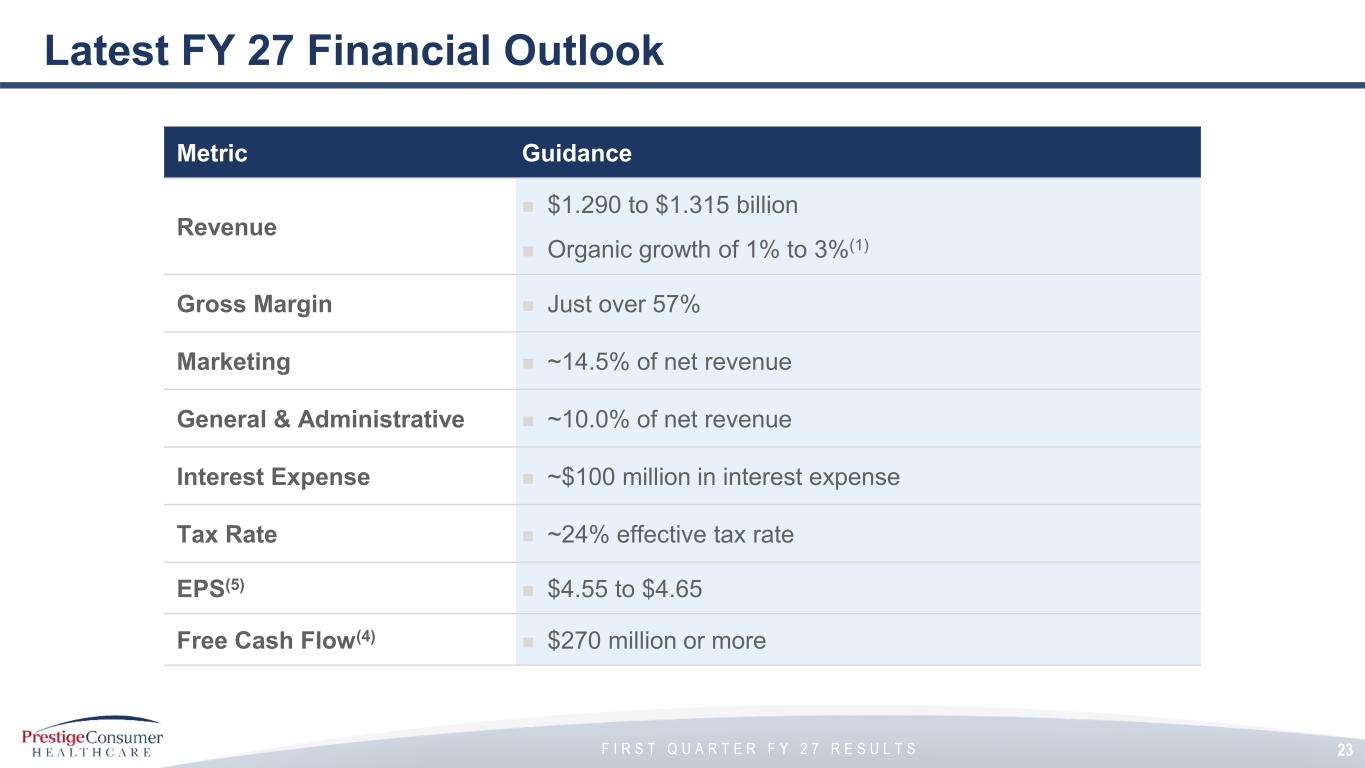
F I R S T Q U A R T E R F Y 2 7 R E S U L T S Latest FY 27 Financial Outlook Metric Guidance Revenue ◼ $1.290 to $1.315 billion ◼ Organic growth of 1% to 3%(1) Gross Margin ◼ Just over 57% Marketing ◼ ~14.5% of net revenue General & Administrative ◼ ~10.0% of net revenue Interest Expense ◼ ~$100 million in interest expense Tax Rate ◼ ~24% effective tax rate EPS(5) ◼ $4.55 to $4.65 Free Cash Flow(4) ◼ $270 million or more 23