Shareholder Report
May 31, 2026
USD ($)
Holding
This report describes changes to the Fund that occurred during the reporting period.
What were the Fund costs for the last year? (based on a hypothetical $10,000 investment)
| Cost of a $10,000 investment |
Costs paid as a percentage of $10,000 investment* | |||
| Class I Shares |
$66 |
0.64% | ||
| * | Annualized for period less than one year. |
How did the Fund perform last year? What affected the Fund’s performance?
| Performance Highlights The Nuveen Arizona Municipal Bond Fund returned 7.27% for Class I Shares at net asset value (NAV) for the 12 months ended May 31, 2026. The Fund outperformed the S&P Municipal Bond Arizona Index, which returned 6.51%. Top contributors to relative performance • Duration positioning, especially an overweight to bonds with durations of six years and longer. • Credit quality positioning, especially an overweight to non‑rated bonds, an underweight to AAA‑rated bonds, and exposure to long-duration A‑rated bonds. • Long-duration tax‑supported bonds, particularly dedicated‑tax bonds. Top detractors from relative performance • Security selection. |
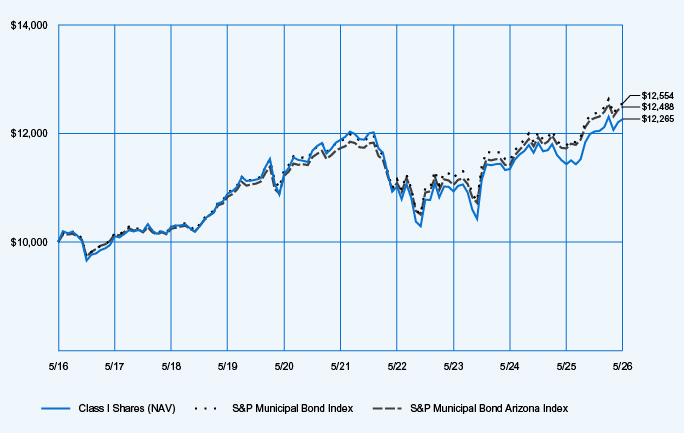
Average Annual Total Returns
| 1‑Year | 5‑Year | 10‑Year | ||||||||||
| Class I Shares at NAV |
7.27 | % | 0.63 | % | 2.06 | % | ||||||
| S&P Municipal Bond Index |
6.57 | % | 1.14 | % | 2.30 | % | ||||||
| S&P Municipal Bond Arizona Index |
6.51 | % | 1.26 | % | 2.25 | % | ||||||
| Lipper Other States Municipal Debt Funds Classification Average |
7.08 | % | 0.43 | % | 1.54 | % | ||||||
Fund Statistics (as of May 31, 2026)
| Fund net assets |
$ | 179,219,566 | ||
| Total number of portfolio holdings |
191 | |||
| Portfolio turnover (%) |
8% | |||
| Total management fees paid for the year |
$ | 852,266 | ||
 |
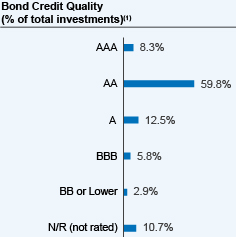 |
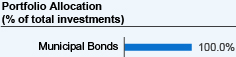
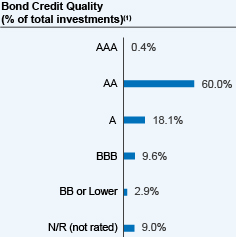
| (1) | The ratings disclosed are the highest rating given by one of the following national rating agencies: Standard & Poor’s (S&P), Moody’s Investors Service, Inc. (Moody’s) or Fitch, Inc (Fitch). This treatment of split-rated securities may differ from that used for other purposes, such as for Fund investment policies. Credit ratings are subject to change. AAA, AA, A, and BBB are investment grade ratings; BB, B, CCC, CC, C and D are below-investment grade ratings. Holdings designated N/R are not rated by these national ratings agencies. |
How has the Fund changed?
For more complete information, you may review the Fund’s next prospectus, which is expected to be available by September 30, 2026 at https://www.nuveen.com/en‑us/mutual‑funds/prospectuses or upon request at (800) 257‑8787.
For more complete information, you may review the Fund’s next prospectus, which is expected to be available by September 30, 2026 at https://www.nuveen.com/en‑us/mutual‑funds/prospectuses or upon request at (800) 257‑8787.
This report describes changes to the Fund that occurred during the reporting period.
What were the Fund costs for the last year? (based on a hypothetical $10,000 investment)
| Cost of a $10,000 investment |
Costs paid as a percentage of $10,000 investment* | |||
| Class C Shares |
$169 |
1.64% | ||
| * | Annualized for period less than one year. |
How did the Fund perform last year? What affected the Fund’s performance?
| Performance Highlights The Nuveen Arizona Municipal Bond Fund returned 6.31% for Class C Shares at net asset value (NAV) for the 12 months ended May 31, 2026. The Fund performed in line with the S&P Municipal Bond Arizona Index, which returned 6.51%. Top contributors to relative performance • Duration positioning, especially an overweight to bonds with durations of six years and longer. • Credit quality positioning, especially an overweight to non‑rated bonds, an underweight to AAA‑rated bonds, and exposure to long-duration A‑rated bonds. • Long-duration tax‑supported bonds, particularly dedicated‑tax bonds. Top detractors from relative performance • Security selection. |
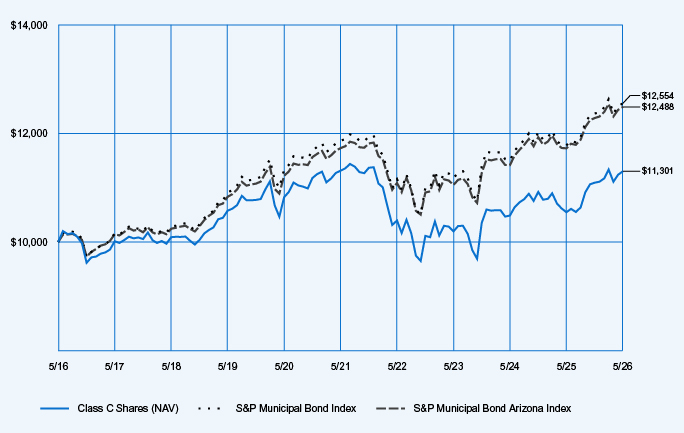
Average Annual Total Returns
| 1‑Year | 5‑Year | 10‑Year | ||||||||||
| Class C Shares at NAV (excluding maximum sales charge) |
6.31 | % | (0.36 | )% | 1.23 | % | ||||||
| S&P Municipal Bond Index |
6.57 | % | 1.14 | % | 2.30 | % | ||||||
| S&P Municipal Bond Arizona Index |
6.51 | % | 1.26 | % | 2.25 | % | ||||||
| Lipper Other States Municipal Debt Funds Classification Average |
7.08 | % | 0.43 | % | 1.54 | % | ||||||
Fund Statistics (as of May 31, 2026)
| Fund net assets |
$ | 179,219,566 | ||
| Total number of portfolio holdings |
191 | |||
| Portfolio turnover (%) |
8% | |||
| Total management fees paid for the year |
$ | 852,266 | ||
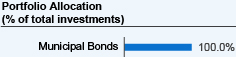 |
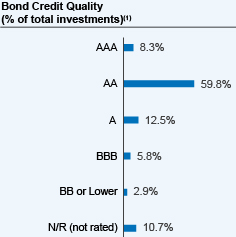 |
| (1) | The ratings disclosed are the highest rating given by one of the following national rating agencies: Standard & Poor’s (S&P), Moody’s Investors Service, Inc. (Moody’s) or Fitch, Inc (Fitch). This treatment of split-rated securities may differ from that used for other purposes, such as for Fund investment policies. Credit ratings are subject to change. AAA, AA, A, and BBB are investment grade ratings; BB, B, CCC, CC, C and D are below-investment grade ratings. Holdings designated N/R are not rated by these national ratings agencies. |
How has the Fund changed?
For more complete information, you may review the Fund’s next prospectus, which is expected to be available by September 30, 2026 at https://www.nuveen.com/en‑us/mutual‑funds/prospectuses or upon request at (800) 257‑8787.
For more complete information, you may review the Fund’s next prospectus, which is expected to be available by September 30, 2026 at https://www.nuveen.com/en‑us/mutual‑funds/prospectuses or upon request at (800) 257‑8787.
This report describes changes to the Fund that occurred during the reporting period.
What were the Fund costs for the last year? (based on a hypothetical $10,000 investment)
| Cost of a $10,000 investment |
Costs paid as a percentage of $10,000 investment* | |||
| Class A Shares |
$87 |
0.84% | ||
| * | Annualized for period less than one year. |
How did the Fund perform last year? What affected the Fund’s performance?
| Performance Highlights The Nuveen Arizona Municipal Bond Fund returned 7.13% for Class A Shares at net asset value (NAV) for the 12 months ended May 31, 2026. The Fund outperformed the S&P Municipal Bond Arizona Index, which returned 6.51%. Top contributors to relative performance • Duration positioning, especially an overweight to bonds with durations of six years and longer. • Credit quality positioning, especially an overweight to non‑rated bonds, an underweight to AAA‑rated bonds, and exposure to long-duration A‑rated bonds. • Long-duration tax‑supported bonds, particularly dedicated‑tax bonds. Top detractors from relative performance • Security selection. |
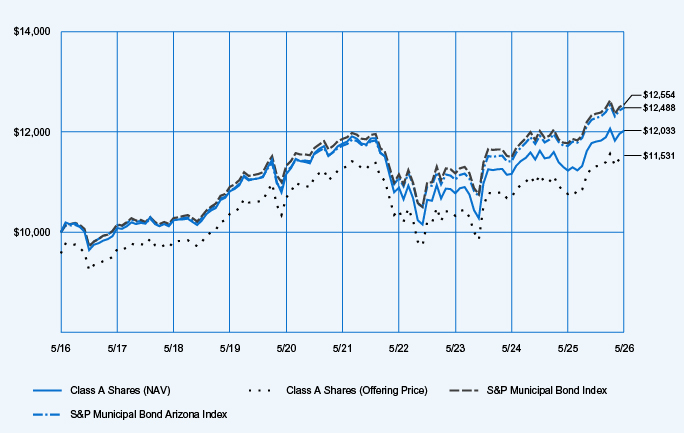
Average Annual Total Returns
| 1‑Year | 5‑Year | 10‑Year | ||||||||||
| Class A Shares at NAV (excluding maximum sales charge) |
7.13 | % | 0.44 | % | 1.87 | % | ||||||
| Class A Shares at maximum sales charge (Offering Price) |
2.61 | % | (0.42 | )% | 1.43 | % | ||||||
| S&P Municipal Bond Index |
6.57 | % | 1.14 | % | 2.30 | % | ||||||
| S&P Municipal Bond Arizona Index |
6.51 | % | 1.26 | % | 2.25 | % | ||||||
| Lipper Other States Municipal Debt Funds Classification Average |
7.08 | % | 0.43 | % | 1.54 | % | ||||||
Fund Statistics (as of May 31, 2026)
| Fund net assets |
$ | 179,219,566 | ||
| Total number of portfolio holdings |
191 | |||
| Portfolio turnover (%) |
8% | |||
| Total management fees paid for the year |
$ | 852,266 | ||
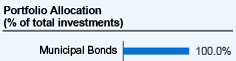 |
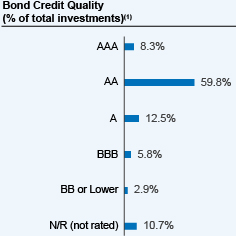 |
| (1) | The ratings disclosed are the highest rating given by one of the following national rating agencies: Standard & Poor’s (S&P), Moody’s Investors Service, Inc. (Moody’s) or Fitch, Inc (Fitch). This treatment of split-rated securities may differ from that used for other purposes, such as for Fund investment policies. Credit ratings are subject to change. AAA, AA, A, and BBB are investment grade ratings; BB, B, CCC, CC, C and D are below-investment grade ratings. Holdings designated N/R are not rated by these national ratings agencies. |
How has the Fund changed?
For more complete information, you may review the Fund’s next prospectus, which is expected to be available by September 30, 2026 at https://www.nuveen.com/en‑us/mutual‑funds/prospectuses or upon request at (800) 257‑8787.
For more complete information, you may review the Fund’s next prospectus, which is expected to be available by September 30, 2026 at https://www.nuveen.com/en‑us/mutual‑funds/prospectuses or upon request at (800) 257‑8787.
This report describes changes to the Fund that occurred during the reporting period.
What were the Fund costs for the last year? (based on a hypothetical $10,000 investment)
| Cost of a $10,000 investment |
Costs paid as a percentage of $10,000 investment* | |||
| Class A Shares |
$81 |
0.78% | ||
| * | Annualized for period less than one year. |
How did the Fund perform last year? What affected the Fund’s performance?
| Performance Highlights The Nuveen Colorado Municipal Bond Fund returned 6.58% for Class A Shares at net asset value (NAV) for the 12 months ended May 31, 2026. The Fund underperformed the S&P Municipal Bond Colorado Index, which returned 7.30%. Top contributors to relative performance • Duration positioning, especially an overweight to longer-duration bonds and an underweight to shorter-duration bonds. • Sector positioning, especially an overweight to incremental-tax bonds. • Credit quality positioning, especially an overweight to lower-rated bonds. Top detractors from relative performance • Overweights to the health care and utility bond sectors and an underweight to the industrial development revenue bond sector. • Underweight to AAA-rated and non-rated bonds and an overweight to AA-rated bonds. • Security selection in the health care, housing and transportation bond sectors. |
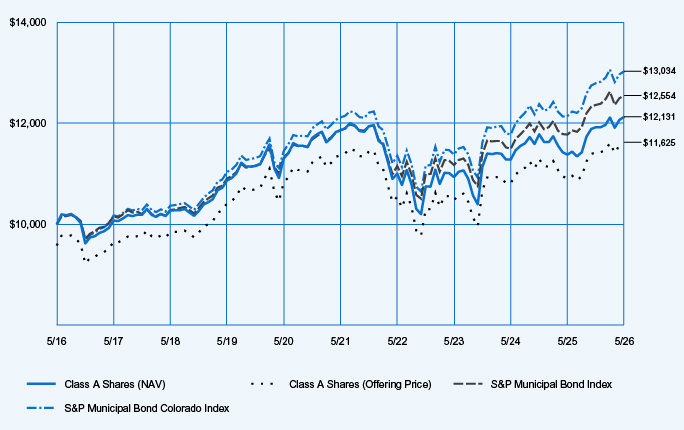
Average Annual Total Returns
| 1‑Year | 5‑Year | 10‑Year | ||||||||||
| Class A Shares at NAV (excluding maximum sales charge) |
6.58 | % | 0.44 | % | 1.95 | % | ||||||
| Class A Shares at maximum sales charge (Offering Price) |
2.06 | % | (0.42 | )% | 1.52 | % | ||||||
| S&P Municipal Bond Index |
6.57 | % | 1.14 | % | 2.30 | % | ||||||
| S&P Municipal Bond Colorado Index |
7.30 | % | 1.47 | % | 2.69 | % | ||||||
| Lipper Other States Municipal Debt Funds Classification Average |
7.08 | % | 0.43 | % | 1.54 | % | ||||||
Fund Statistics (as of May 31, 2026)
| Fund net assets |
$ | 481,804,907 | ||
| Total number of portfolio holdings |
257 | |||
| Portfolio turnover (%) |
12% | |||
| Total management fees paid for the year |
$ | 2,292,454 | ||
 |
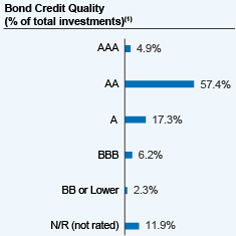 |
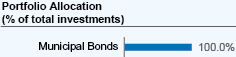
| (1) | The ratings disclosed are the highest rating given by one of the following national rating agencies: Standard & Poor’s (S&P), Moody’s Investors Service, Inc. (Moody’s) or Fitch, Inc (Fitch). This treatment of split-rated securities may differ from that used for other purposes, such as for Fund investment policies. Credit ratings are subject to change. AAA, AA, A, and BBB are investment grade ratings; BB, B, CCC, CC, C and D are below-investment grade ratings. Holdings designated N/R are not rated by these national ratings agencies. |
How has the Fund changed?
For more complete information, you may review the Fund’s next prospectus, which is expected to be available by September 30, 2026 at https://www.nuveen.com/en‑us/mutual‑funds/prospectuses or upon request at (800) 257‑8787.
For more complete information, you may review the Fund’s next prospectus, which is expected to be available by September 30, 2026 at https://www.nuveen.com/en‑us/mutual‑funds/prospectuses or upon request at (800) 257‑8787.
This report describes changes to the Fund that occurred during the reporting period.
What were the Fund costs for the last year? (based on a hypothetical $10,000 investment)
| Cost of a $10,000 investment |
Costs paid as a percentage of $10,000 investment* | |||
| Class C Shares |
$163 |
1.58% | ||
| * | Annualized for period less than one year. |
How did the Fund perform last year? What affected the Fund’s performance?
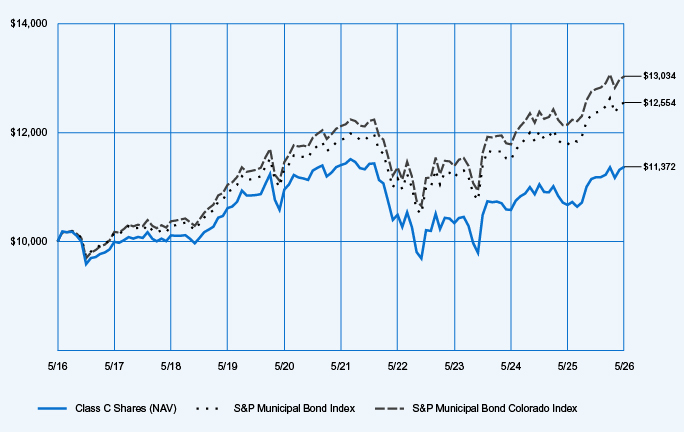
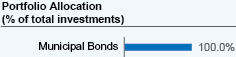
| Performance Highlights The Nuveen Colorado Municipal Bond Fund returned 5.76% for Class C Shares at net asset value (NAV) for the 12 months ended May 31, 2026. The Fund underperformed the S&P Municipal Bond Colorado Index, which returned 7.30%. Top contributors to relative performance • Duration positioning, especially an overweight to longer-duration bonds and an underweight to shorter-duration bonds. • Sector positioning, especially an overweight to incremental-tax bonds. • Credit quality positioning, especially an overweight to lower-rated bonds. Top detractors from relative performance • Overweights to the health care and utility bond sectors and an underweight to the industrial development revenue bond sector. • Underweight to AAA-rated and non-rated bonds and an overweight to AA-rated bonds. • Security selection in the health care, housing and transportation bond sectors. |
Average Annual Total Returns
| 1‑Year | 5‑Year | 10‑Year | ||||||||||
| Class C Shares at NAV (excluding maximum sales charge) |
5.76 | % | (0.37 | )% | 1.29 | % | ||||||
| S&P Municipal Bond Index |
6.57 | % | 1.14 | % | 2.30 | % | ||||||
| S&P Municipal Bond Colorado Index |
7.30 | % | 1.47 | % | 2.69 | % | ||||||
| Lipper Other States Municipal Debt Funds Classification Average |
7.08 | % | 0.43 | % | 1.54 | % | ||||||
Fund Statistics (as of May 31, 2026)
| Fund net assets |
$ | 481,804,907 | ||
| Total number of portfolio holdings |
257 | |||
| Portfolio turnover (%) |
12% | |||
| Total management fees paid for the year |
$ | 2,292,454 | ||
 |
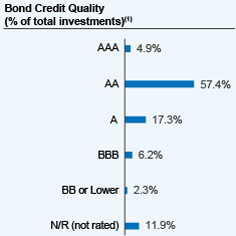 |
| (1) | The ratings disclosed are the highest rating given by one of the following national rating agencies: Standard & Poor’s (S&P), Moody’s Investors Service, Inc. (Moody’s) or Fitch, Inc (Fitch). This treatment of split-rated securities may differ from that used for other purposes, such as for Fund investment policies. Credit ratings are subject to change. AAA, AA, A, and BBB are investment grade ratings; BB, B, CCC, CC, C and D are below-investment grade ratings. Holdings designated N/R are not rated by these national ratings agencies. |
How has the Fund changed?
For more complete information, you may review the Fund’s next prospectus, which is expected to be available by September 30, 2026 at https://www.nuveen.com/en‑us/mutual‑funds/prospectuses or upon request at (800) 257‑8787.
For more complete information, you may review the Fund’s next prospectus, which is expected to be available by September 30, 2026 at https://www.nuveen.com/en‑us/mutual‑funds/prospectuses or upon request at (800) 257‑8787.
This report describes changes to the Fund that occurred during the reporting period.
What were the Fund costs for the last year? (based on a hypothetical $10,000 investment)
| Cost of a $10,000 investment |
Costs paid as a percentage of $10,000 investment* | |||
| Class I Shares |
$60 |
0.58% | ||
| * | Annualized for period less than one year. |
How did the Fund perform last year? What affected the Fund’s performance?
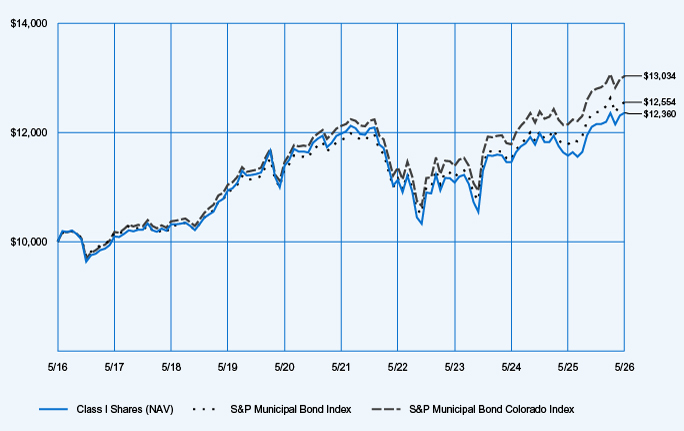
| Performance Highlights The Nuveen Colorado Municipal Bond Fund returned 6.78% for Class I Shares at net asset value (NAV) for the 12 months ended May 31, 2026. The Fund underperformed the S&P Municipal Bond Colorado Index, which returned 7.30%. Top contributors to relative performance • Duration positioning, especially an overweight to longer-duration bonds and an underweight to shorter-duration bonds. • Sector positioning, especially an overweight to incremental-tax bonds. • Credit quality positioning, especially an overweight to lower-rated bonds. Top detractors from relative performance • Overweights to the health care and utility bond sectors and an underweight to the industrial development revenue bond sector. • Underweight to AAA-rated and non-rated bonds and an overweight to AA-rated bonds. • Security selection in the health care, housing and transportation bond sectors. |
Average Annual Total Returns
| 1‑Year | 5‑Year | 10‑Year | ||||||||||
| Class I Shares at NAV |
6.78 | % | 0.63 | % | 2.14 | % | ||||||
| S&P Municipal Bond Index |
6.57 | % | 1.14 | % | 2.30 | % | ||||||
| S&P Municipal Bond Colorado Index |
7.30 | % | 1.47 | % | 2.69 | % | ||||||
| Lipper Other States Municipal Debt Funds Classification Average |
7.08 | % | 0.43 | % | 1.54 | % | ||||||
Fund Statistics (as of May 31, 2026)
| Fund net assets |
$ | 481,804,907 | ||
| Total number of portfolio holdings |
257 | |||
| Portfolio turnover (%) |
12% | |||
| Total management fees paid for the year |
$ | 2,292,454 | ||
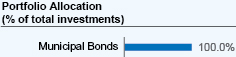 |
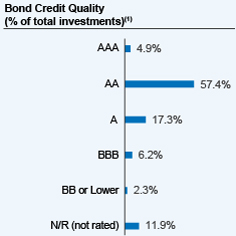 |
| (1) | The ratings disclosed are the highest rating given by one of the following national rating agencies: Standard & Poor’s (S&P), Moody’s Investors Service, Inc. (Moody’s) or Fitch, Inc (Fitch). This treatment of split-rated securities may differ from that used for other purposes, such as for Fund investment policies. Credit ratings are subject to change. AAA, AA, A, and BBB are investment grade ratings; BB, B, CCC, CC, C and D are below-investment grade ratings. Holdings designated N/R are not rated by these national ratings agencies. |
How has the Fund changed?
For more complete information, you may review the Fund’s next prospectus, which is expected to be available by September 30, 2026 at https://www.nuveen.com/en-us/mutual-funds/prospectuses or upon request at (800) 257-8787.
For more complete information, you may review the Fund’s next prospectus, which is expected to be available by September 30, 2026 at https://www.nuveen.com/en-us/mutual-funds/prospectuses or upon request at (800) 257-8787.
This report describes changes to the Fund that occurred during the reporting period.
What were the Fund costs for the last year? (based on a hypothetical $10,000 investment)
| Cost of a $10,000 investment |
Costs paid as a percentage of $10,000 investment* | |||
| Class I Shares |
$58 |
0.56% | ||
| * | Annualized for period less than one year. |
How did the Fund perform last year? What affected the Fund’s performance?
| Performance Highlights The Nuveen Maryland Municipal Bond Fund returned 7.75% for Class I Shares at net asset value (NAV) for the 12 months ended May 31, 2026. The Fund outperformed the S&P Municipal Bond Maryland Index, which returned 6.10%. Top contributors to relative performance • Duration positioning, especially an overweight to bonds with durations of 10 years and longer and an underweight to bonds with durations under four years. • Credit quality positioning, especially overweights to non‑rated, A‑rated and BBB‑rated bonds. Top detractors from relative performance • An underweight to bonds with durations between six and eight years. |
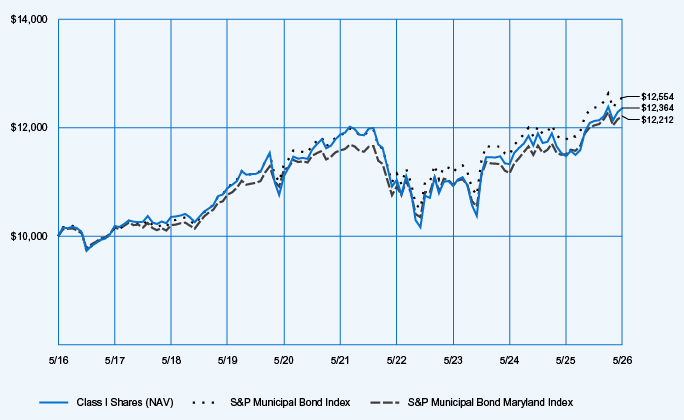
Average Annual Total Returns
| 1‑Year | 5‑Year | 10‑Year | ||||||||||
| Class I Shares at NAV |
7.75 | % | 0.81 | % | 2.14 | % | ||||||
| S&P Municipal Bond Index |
6.57 | % | 1.14 | % | 2.30 | % | ||||||
| S&P Municipal Bond Maryland Index |
6.10 | % | 1.06 | % | 2.02 | % | ||||||
| Lipper Maryland Municipal Debt Funds Classification Average |
7.16 | % | 0.69 | % | 1.74 | % | ||||||
Fund Statistics (as of May 31, 2026)
| Fund net assets |
$ | 268,408,054 | ||
| Total number of portfolio holdings |
200 | |||
| Portfolio turnover (%) |
11% | |||
| Total management fees paid for the year |
$ | 1,242,934 | ||
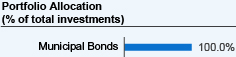 |
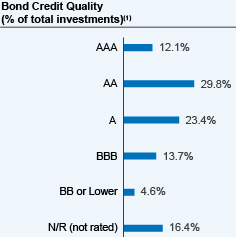 |
| (1) | The ratings disclosed are the highest rating given by one of the following national rating agencies: Standard & Poor’s (S&P), Moody’s Investors Service, Inc. (Moody’s) or Fitch, Inc (Fitch). This treatment of split-rated securities may differ from that used for other purposes, such as for Fund investment policies. Credit ratings are subject to change. AAA, AA, A, and BBB are investment grade ratings; BB, B, CCC, CC, C and D are below-investment grade ratings. Holdings designated N/R are not rated by these national ratings agencies. |
How has the Fund changed?
For more complete information, you may review the Fund’s next prospectus, which is expected to be available by September 30, 2026 at https://www.nuveen.com/en‑us/mutual‑funds/prospectuses or upon request at (800) 257‑8787.
For more complete information, you may review the Fund’s next prospectus, which is expected to be available by September 30, 2026 at https://www.nuveen.com/en‑us/mutual‑funds/prospectuses or upon request at (800) 257‑8787.
This report describes changes to the Fund that occurred during the reporting period.
What were the Fund costs for the last year? (based on a hypothetical $10,000 investment)
| Cost of a $10,000 investment |
Costs paid as a percentage of $10,000 investment* | |||
| Class C Shares |
$161 |
1.56% | ||
| * | Annualized for period less than one year. |
How did the Fund perform last year? What affected the Fund’s performance?
| Performance Highlights The Nuveen Maryland Municipal Bond Fund returned 6.72% for Class C Shares at net asset value (NAV) for the 12 months ended May 31, 2026. The Fund outperformed the S&P Municipal Bond Maryland Index, which returned 6.10%. Top contributors to relative performance • Duration positioning, especially an overweight to bonds with durations of 10 years and longer and an underweight to bonds with durations under four years. • Credit quality positioning, especially overweights to non‑rated, A‑rated and BBB‑rated bonds. Top detractors from relative performance • An underweight to bonds with durations between six and eight years. |
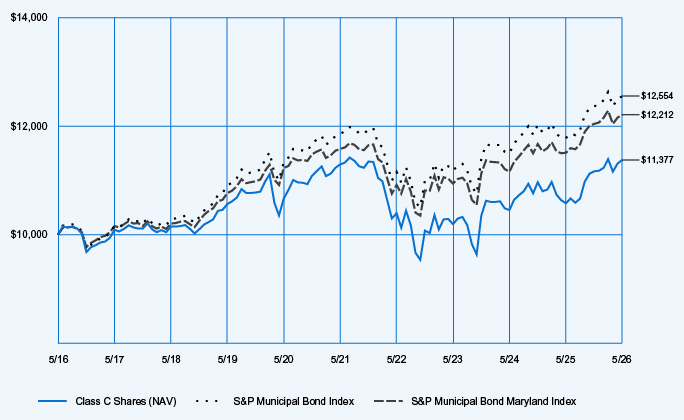
Average Annual Total Returns
| 1‑Year | 5‑Year | 10‑Year | ||||||||||
| Class C Shares at NAV (excluding maximum sales charge) |
6.72 | % | (0.17 | )% | 1.30 | % | ||||||
| S&P Municipal Bond Index |
6.57 | % | 1.14 | % | 2.30 | % | ||||||
| S&P Municipal Bond Maryland Index |
6.10 | % | 1.06 | % | 2.02 | % | ||||||
| Lipper Maryland Municipal Debt Funds Classification Average |
7.16 | % | 0.69 | % | 1.74 | % | ||||||
Fund Statistics (as of May 31, 2026)
| Fund net assets |
$ | 268,408,054 | ||
| Total number of portfolio holdings |
200 | |||
| Portfolio turnover (%) |
11% | |||
| Total management fees paid for the year |
$ | 1,242,934 | ||
 |
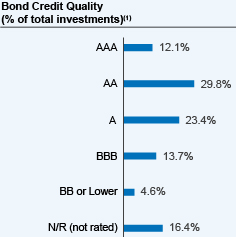 |
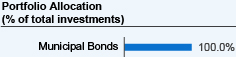
| (1) | The ratings disclosed are the highest rating given by one of the following national rating agencies: Standard & Poor’s (S&P), Moody’s Investors Service, Inc. (Moody’s) or Fitch, Inc (Fitch). This treatment of split-rated securities may differ from that used for other purposes, such as for Fund investment policies. Credit ratings are subject to change. AAA, AA, A, and BBB are investment grade ratings; BB, B, CCC, CC, C and D are below-investment grade ratings. Holdings designated N/R are not rated by these national ratings agencies. |
How has the Fund changed?
For more complete information, you may review the Fund’s next prospectus, which is expected to be available by September 30, 2026 at https://www.nuveen.com/en-us/mutual-funds/prospectuses or upon request at (800) 257-8787.
For more complete information, you may review the Fund’s next prospectus, which is expected to be available by September 30, 2026 at https://www.nuveen.com/en-us/mutual-funds/prospectuses or upon request at (800) 257-8787.
This report describes changes to the Fund that occurred during the reporting period.
What were the Fund costs for the last year? (based on a hypothetical $10,000 investment)
| Cost of a $10,000 investment |
Costs paid as a percentage of $10,000 investment* | |||
| Class A Shares |
$79 |
0.76% | ||
| * | Annualized for period less than one year. |
How did the Fund perform last year? What affected the Fund’s performance?
| Performance Highlights The Nuveen Maryland Municipal Bond Fund returned 7.55% for Class A Shares at net asset value (NAV) for the 12 months ended May 31, 2026. The Fund outperformed the S&P Municipal Bond Maryland Index, which returned 6.10%. Top contributors to relative performance • Duration positioning, especially an overweight to bonds with durations of 10 years and longer and an underweight to bonds with durations under four years. • Credit quality positioning, especially overweights to non-rated, A-rated and BBB-rated bonds. Top detractors from relative performance • An underweight to bonds with durations between six and eight years. |
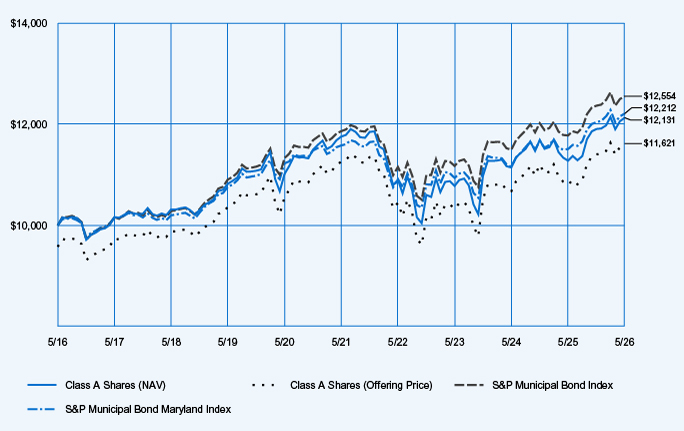
Average Annual Total Returns
| 1‑Year | 5‑Year | 10‑Year | ||||||||||
| Class A Shares at NAV (excluding maximum sales charge) |
7.55 | % | 0.63 | % | 1.95 | % | ||||||
| Class A Shares at maximum sales charge (Offering Price) |
3.00 | % | (0.24 | )% | 1.51 | % | ||||||
| S&P Municipal Bond Index |
6.57 | % | 1.14 | % | 2.30 | % | ||||||
| S&P Municipal Bond Maryland Index |
6.10 | % | 1.06 | % | 2.02 | % | ||||||
| Lipper Maryland Municipal Debt Funds Classification Average |
7.16 | % | 0.69 | % | 1.74 | % | ||||||
Fund Statistics (as of May 31, 2026)
| Fund net assets |
$ | 268,408,054 | ||
| Total number of portfolio holdings |
200 | |||
| Portfolio turnover (%) |
11% | |||
| Total management fees paid for the year |
$ | 1,242,934 | ||
 |
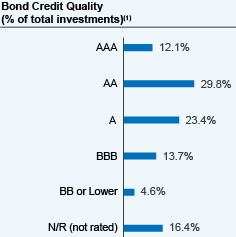 |
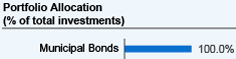
| (1) | The ratings disclosed are the highest rating given by one of the following national rating agencies: Standard & Poor’s (S&P), Moody’s Investors Service, Inc. (Moody’s) or Fitch, Inc (Fitch). This treatment of split-rated securities may differ from that used for other purposes, such as for Fund investment policies. Credit ratings are subject to change. AAA, AA, A, and BBB are investment grade ratings; BB, B, CCC, CC, C and D are below-investment grade ratings. Holdings designated N/R are not rated by these national ratings agencies. |
How has the Fund changed?
For more complete information, you may review the Fund’s next prospectus, which is expected to be available by September 30, 2026 at https://www.nuveen.com/en-us/mutual-funds/prospectuses or upon request at (800) 257-8787.
For more complete information, you may review the Fund’s next prospectus, which is expected to be available by September 30, 2026 at https://www.nuveen.com/en-us/mutual-funds/prospectuses or upon request at (800) 257-8787.
This report describes changes to the Fund that occurred during the reporting period.
What were the Fund costs for the last year? (based on a hypothetical $10,000 investment)
| Cost of a $10,000 investment |
Costs paid as a percentage of $10,000 investment* | |||
| Class A Shares |
$86 |
0.83% | ||
| * | Annualized for period less than one year. |
How did the Fund perform last year? What affected the Fund’s performance?
| Performance Highlights The Nuveen New Mexico Municipal Bond Fund returned 7.36% for Class A Shares at net asset value (NAV) for the 12 months ended May 31, 2026. The Fund outperformed the S&P Municipal Bond New Mexico Index, which returned 5.64%. Top contributors to relative performance • Duration positioning, especially an overweight to bonds with durations of 10 years and longer and an underweight to bonds with durations of eight years and shorter. • Credit quality positioning, especially an overweight to non‑rated bonds, an underweight to AA‑rated bonds, and exposure to long-duration A‑rated bonds. Top detractors from relative performance • Sector positioning, especially an underweight to the housing bond sector. |
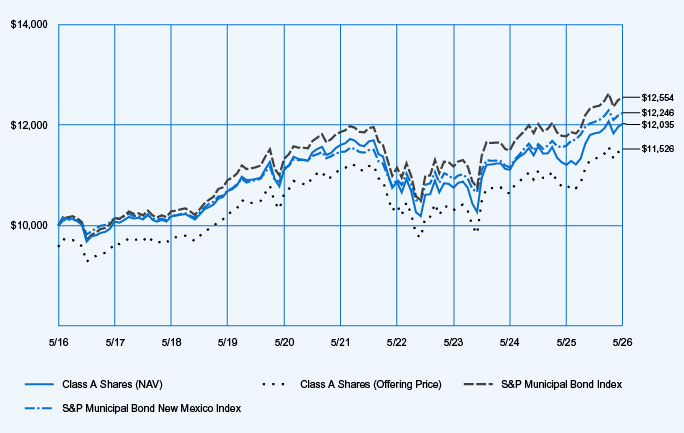
Average Annual Total Returns
| 1‑Year | 5‑Year | 10‑Year | ||||||||||
| Class A Shares at NAV (excluding maximum sales charge) |
7.36 | % | 0.72 | % | 1.87 | % | ||||||
| Class A Shares at maximum sales charge (Offering Price) |
2.83 | % | (0.14 | )% | 1.43 | % | ||||||
| S&P Municipal Bond Index |
6.57 | % | 1.14 | % | 2.30 | % | ||||||
| S&P Municipal Bond New Mexico Index |
5.64 | % | 1.33 | % | 2.05 | % | ||||||
| Lipper Other States Municipal Debt Funds Classification Average |
7.08 | % | 0.43 | % | 1.54 | % | ||||||
Fund Statistics (as of May 31, 2026)
| Fund net assets |
$ | 71,005,360 | ||
| Total number of portfolio holdings |
80 | |||
| Portfolio turnover (%) |
16% | |||
| Total management fees paid for the year |
$ | 345,805 | ||
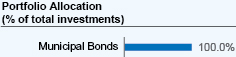 |
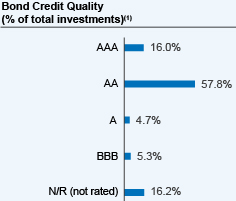 |
| (1) | The ratings disclosed are the highest rating given by one of the following national rating agencies: Standard & Poor’s (S&P), Moody’s Investors Service, Inc. (Moody’s) or Fitch, Inc (Fitch). This treatment of split-rated securities may differ from that used for other purposes, such as for Fund investment policies. Credit ratings are subject to change. AAA, AA, A, and BBB are investment grade ratings; BB, B, CCC, CC, C and D are below-investment grade ratings. Holdings designated N/R are not rated by these national ratings agencies. |
How has the Fund changed?
For more complete information, you may review the Fund’s next prospectus, which is expected to be available by September 30, 2026 at https://www.nuveen.com/en‑us/mutual‑funds/prospectuses or upon request at (800) 257‑8787.
For more complete information, you may review the Fund’s next prospectus, which is expected to be available by September 30, 2026 at https://www.nuveen.com/en‑us/mutual‑funds/prospectuses or upon request at (800) 257‑8787.
This report describes changes to the Fund that occurred during the reporting period.
What were the Fund costs for the last year? (based on a hypothetical $10,000 investment)
| Cost of a $10,000 investment |
Costs paid as a percentage of $10,000 investment* | |||
| Class C Shares |
$168 |
1.63% | ||
| * | Annualized for period less than one year. |
How did the Fund perform last year? What affected the Fund’s performance?
| Performance Highlights The Nuveen New Mexico Municipal Bond Fund returned 6.55% for Class C Shares at net asset value (NAV) for the 12 months ended May 31, 2026. The Fund outperformed the S&P Municipal Bond New Mexico Index, which returned 5.64%. Top contributors to relative performance • Duration positioning, especially an overweight to bonds with durations of 10 years and longer and an underweight to bonds with durations of eight years and shorter. • Credit quality positioning, especially an overweight to non‑rated bonds, an underweight to AA‑rated bonds, and exposure to long-duration A‑rated bonds. Top detractors from relative performance • Sector positioning, especially an underweight to the housing bond sector. |
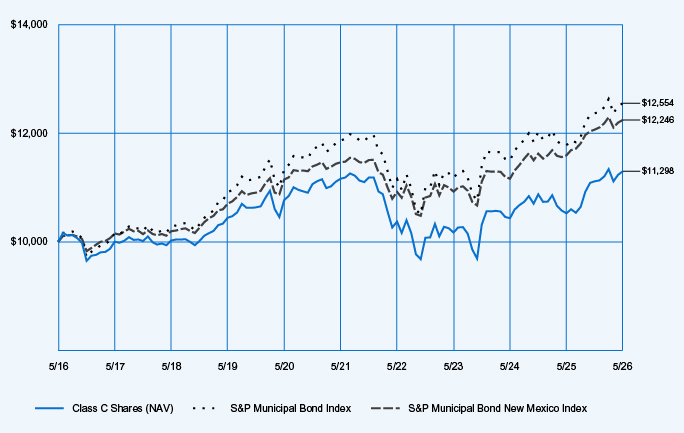
Average Annual Total Returns
| 1‑Year | 5‑Year | 10‑Year | ||||||||||
| Class C Shares at NAV (excluding maximum sales charge) |
6.55 | % | (0.06 | )% | 1.23 | % | ||||||
| S&P Municipal Bond Index |
6.57 | % | 1.14 | % | 2.30 | % | ||||||
| S&P Municipal Bond New Mexico Index |
5.64 | % | 1.33 | % | 2.05 | % | ||||||
| Lipper Other States Municipal Debt Funds Classification Average |
7.08 | % | 0.43 | % | 1.54 | % | ||||||
Fund Statistics (as of May 31, 2026)
| Fund net assets |
$ | 71,005,360 | ||
| Total number of portfolio holdings |
80 | |||
| Portfolio turnover (%) |
16% | |||
| Total management fees paid for the year |
$ | 345,805 | ||
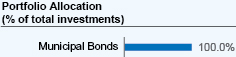 |
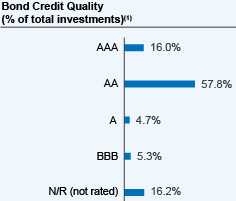 |
| (1) | The ratings disclosed are the highest rating given by one of the following national rating agencies: Standard & Poor’s (S&P), Moody’s Investors Service, Inc. (Moody’s) or Fitch, Inc (Fitch). This treatment of split-rated securities may differ from that used for other purposes, such as for Fund investment policies. Credit ratings are subject to change. AAA, AA, A, and BBB are investment grade ratings; BB, B, CCC, CC, C and D are below-investment grade ratings. Holdings designated N/R are not rated by these national ratings agencies. |
How has the Fund changed?
For more complete information, you may review the Fund’s next prospectus, which is expected to be available by September 30, 2026 at https://www.nuveen.com/en‑us/mutual‑funds/prospectuses or upon request at (800) 257‑8787.
For more complete information, you may review the Fund’s next prospectus, which is expected to be available by September 30, 2026 at https://www.nuveen.com/en‑us/mutual‑funds/prospectuses or upon request at (800) 257‑8787.
This report describes changes to the Fund that occurred during the reporting period.
What were the Fund costs for the last year? (based on a hypothetical $10,000 investment)
| Cost of a $10,000 investment |
Costs paid as a percentage of $10,000 investment* | |||
| Class I Shares |
$65 |
0.63% | ||
| * | Annualized for period less than one year. |
How did the Fund perform last year? What affected the Fund’s performance?
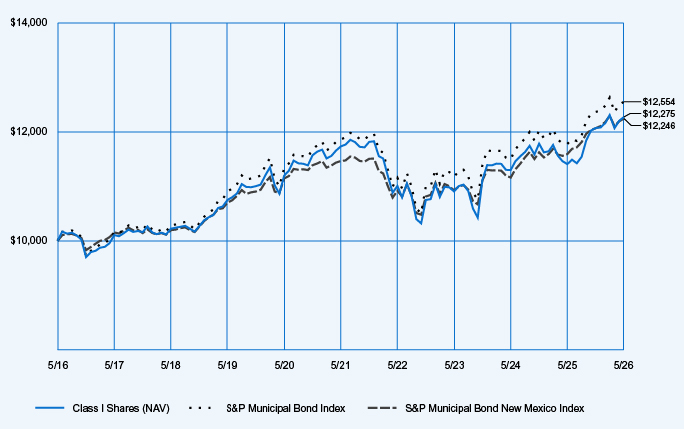
| Performance Highlights The Nuveen New Mexico Municipal Bond Fund returned 7.60% for Class I Shares at net asset value (NAV) for the 12 months ended May 31, 2026. The Fund outperformed the S&P Municipal Bond New Mexico Index, which returned 5.64%. Top contributors to relative performance • Duration positioning, especially an overweight to bonds with durations of 10 years and longer and an underweight to bonds with durations of eight years and shorter. • Credit quality positioning, especially an overweight to non‑rated bonds, an underweight to AA‑rated bonds, and exposure to long-duration A‑rated bonds. Top detractors from relative performance • Sector positioning, especially an underweight to the housing bond sector. |
Average Annual Total Returns
| 1‑Year | 5‑Year | 10‑Year | ||||||||||
| Class I Shares at NAV |
7.60 | % | 0.91 | % | 2.07 | % | ||||||
| S&P Municipal Bond Index |
6.57 | % | 1.14 | % | 2.30 | % | ||||||
| S&P Municipal Bond New Mexico Index |
5.64 | % | 1.33 | % | 2.05 | % | ||||||
| Lipper Other States Municipal Debt Funds Classification Average |
7.08 | % | 0.43 | % | 1.54 | % | ||||||
Fund Statistics (as of May 31, 2026)
| Fund net assets |
$ | 71,005,360 | ||
| Total number of portfolio holdings |
80 | |||
| Portfolio turnover (%) |
16% | |||
| Total management fees paid for the year |
$ | 345,805 | ||
 |
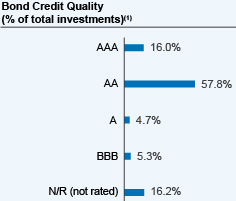 |
| (1) | The ratings disclosed are the highest rating given by one of the following national rating agencies: Standard & Poor’s (S&P), Moody’s Investors Service, Inc. (Moody’s) or Fitch, Inc (Fitch). This treatment of split-rated securities may differ from that used for other purposes, such as for Fund investment policies. Credit ratings are subject to change. AAA, AA, A, and BBB are investment grade ratings; BB, B, CCC, CC, C and D are below-investment grade ratings. Holdings designated N/R are not rated by these national ratings agencies. |
How has the Fund changed?
For more complete information, you may review the Fund’s next prospectus, which is expected to be available by September 30, 2026 at https://www.nuveen.com/en‑us/mutual‑funds/prospectuses or upon request at (800) 257‑8787.
For more complete information, you may review the Fund’s next prospectus, which is expected to be available by September 30, 2026 at https://www.nuveen.com/en‑us/mutual‑funds/prospectuses or upon request at (800) 257‑8787.
This report describes changes to the Fund that occurred during the reporting period.
What were the Fund costs for the last year? (based on a hypothetical $10,000 investment)
| Cost of a $10,000 investment |
Costs paid as a percentage of $10,000 investment* | |||
| Class I Shares |
$63 |
0.60% | ||
| * | Annualized for period less than one year. |
How did the Fund perform last year? What affected the Fund’s performance?
| Performance Highlights The Nuveen Pennsylvania Municipal Bond Fund returned 8.33% for Class I Shares at net asset value (NAV) for the 12 months ended May 31, 2026. The Fund outperformed the S&P Municipal Bond Pennsylvania Index, which returned 6.74%. Top contributors to relative performance • Duration positioning, especially an overweight to longer-duration bonds and an underweight to shorter-duration bonds. • Credit quality positioning, especially an overweight to non-rated bonds. • Sector positioning, especially an overweight to health care bonds. Top detractors from relative performance • An overweight to pre-refunded bonds. |
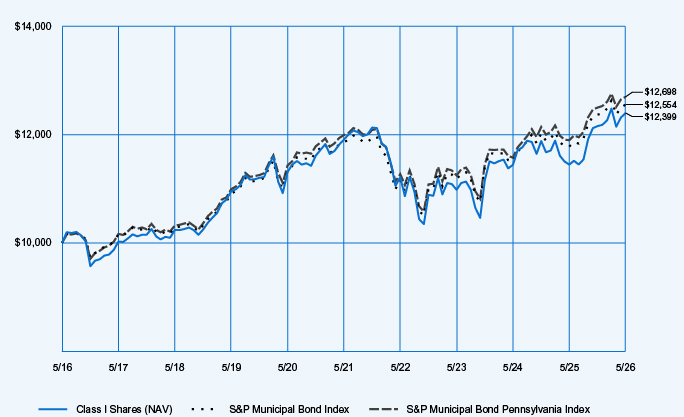
Average Annual Total Returns
| 1‑Year | 5‑Year | 10‑Year | ||||||||||
| Class I Shares at NAV |
8.33 | % | 0.81 | % | 2.17 | % | ||||||
| S&P Municipal Bond Index |
6.57 | % | 1.14 | % | 2.30 | % | ||||||
| S&P Municipal Bond Pennsylvania Index |
6.74 | % | 1.15 | % | 2.42 | % | ||||||
| Lipper Pennsylvania Municipal Debt Funds Classification Average |
7.19 | % | 0.56 | % | 1.93 | % | ||||||
Fund Statistics (as of May 31, 2026)
| Fund net assets |
$ | 363,803,196 | ||
| Total number of portfolio holdings |
251 | |||
| Portfolio turnover (%) |
16% | |||
| Total management fees paid for the year |
$ | 1,744,427 | ||
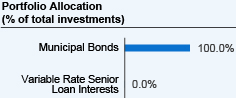 |
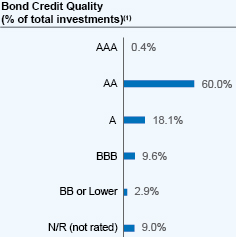 |
| (1) | The ratings disclosed are the highest rating given by one of the following national rating agencies: Standard & Poor’s (S&P), Moody’s Investors Service, Inc. (Moody’s) or Fitch, Inc (Fitch). This treatment of split-rated securities may differ from that used for other purposes, such as for Fund investment policies. Credit ratings are subject to change. AAA, AA, A, and BBB are investment grade ratings; BB, B, CCC, CC, C and D are below-investment grade ratings. Holdings designated N/R are not rated by these national ratings agencies. |
How has the Fund changed?
For more complete information, you may review the Fund’s next prospectus, which is expected to be available by September 30, 2026 at https://www.nuveen.com/en‑us/mutual‑funds/prospectuses or upon request at (800) 257‑8787.
For more complete information, you may review the Fund’s next prospectus, which is expected to be available by September 30, 2026 at https://www.nuveen.com/en‑us/mutual‑funds/prospectuses or upon request at (800) 257‑8787.
This report describes changes to the Fund that occurred during the reporting period.
What were the Fund costs for the last year? (based on a hypothetical $10,000 investment)
| Cost of a $10,000 investment |
Costs paid as a percentage of $10,000 investment* | |||
| Class C Shares |
$166 |
1.60% | ||
| * | Annualized for period less than one year. |
How did the Fund perform last year? What affected the Fund’s performance?
| Performance Highlights The Nuveen Pennsylvania Municipal Bond Fund returned 7.26% for Class C Shares at net asset value (NAV) for the 12 months ended May 31, 2026. The Fund outperformed the S&P Municipal Bond Pennsylvania Index, which returned 6.74%. Top contributors to relative performance • Duration positioning, especially an overweight to longer-duration bonds and an underweight to shorter-duration bonds. • Credit quality positioning, especially an overweight to non-rated bonds. • Sector positioning, especially an overweight to health care bonds. Top detractors from relative performance • An overweight to pre-refunded bonds. |
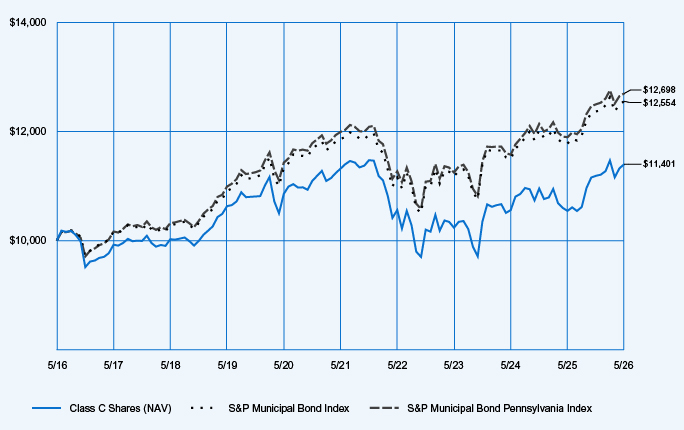
Average Annual Total Returns
| 1-Year | 5-Year | 10-Year | ||||||||||
| Class C Shares at NAV (excluding maximum sales charge) |
7.26 | % | (0.18 | )% | 1.32 | % | ||||||
| S&P Municipal Bond Index |
6.57 | % | 1.14 | % | 2.30 | % | ||||||
| S&P Municipal Bond Pennsylvania Index |
6.74 | % | 1.15 | % | 2.42 | % | ||||||
| Lipper Pennsylvania Municipal Debt Funds Classification Average |
7.19 | % | 0.56 | % | 1.93 | % | ||||||
Fund Statistics (as of May 31, 2026)
| Fund net assets |
$ | 363,803,196 | ||
| Total number of portfolio holdings |
251 | |||
| Portfolio turnover (%) |
16% | |||
| Total management fees paid for the year |
$ | 1,744,427 | ||
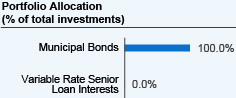 |
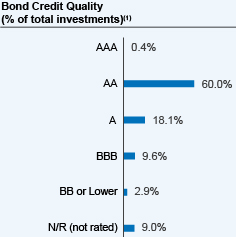 |
| (1) | The ratings disclosed are the highest rating given by one of the following national rating agencies: Standard & Poor’s (S&P), Moody’s Investors Service, Inc. (Moody’s) or Fitch, Inc (Fitch). This treatment of split-rated securities may differ from that used for other purposes, such as for Fund investment policies. Credit ratings are subject to change. AAA, AA, A, and BBB are investment grade ratings; BB, B, CCC, CC, C and D are below-investment grade ratings. Holdings designated N/R are not rated by these national ratings agencies. |
How has the Fund changed?
For more complete information, you may review the Fund’s next prospectus, which is expected to be available by September 30, 2026 at https://www.nuveen.com/en-us/mutual-funds/prospectuses or upon request at (800) 257-8787.
For more complete information, you may review the Fund’s next prospectus, which is expected to be available by September 30, 2026 at https://www.nuveen.com/en-us/mutual-funds/prospectuses or upon request at (800) 257-8787.
This report describes changes to the Fund that occurred during the reporting period.
What were the Fund costs for the last year? (based on a hypothetical $10,000 investment)
| Cost of a $10,000 investment |
Costs paid as a percentage of $10,000 investment* | |||
| Class A Shares |
$83 |
0.80% | ||
| * | Annualized for period less than one year. |
How did the Fund perform last year? What affected the Fund’s performance?
| Performance Highlights The Nuveen Pennsylvania Municipal Bond Fund returned 8.12% for Class A Shares at net asset value (NAV) for the 12 months ended May 31, 2026. The Fund outperformed the S&P Municipal Bond Pennsylvania Index, which returned 6.74%. Top contributors to relative performance • Duration positioning, especially an overweight to longer-duration bonds and an underweight to shorter-duration bonds. • Credit quality positioning, especially an overweight to non-rated bonds. • Sector positioning, especially an overweight to health care bonds. Top detractors from relative performance • An overweight to pre-refunded bonds. |
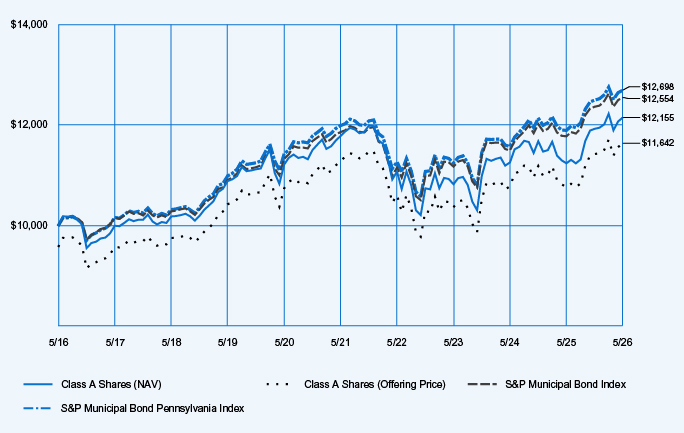
Average Annual Total Returns
| 1-Year | 5-Year | 10-Year | ||||||||||
| Class A Shares at NAV (excluding maximum sales charge) |
8.12 | % | 0.62 | % | 1.97 | % | ||||||
| Class A Shares at maximum sales charge (Offering Price) |
3.59 | % | (0.24 | )% | 1.53 | % | ||||||
| S&P Municipal Bond Index |
6.57 | % | 1.14 | % | 2.30 | % | ||||||
| S&P Municipal Bond Pennsylvania Index |
6.74 | % | 1.15 | % | 2.42 | % | ||||||
| Lipper Pennsylvania Municipal Debt Funds Classification Average |
7.19 | % | 0.56 | % | 1.93 | % | ||||||
Fund Statistics (as of May 31, 2026)
| Fund net assets |
$ | 363,803,196 | ||
| Total number of portfolio holdings |
251 | |||
| Portfolio turnover (%) |
16% | |||
| Total management fees paid for the year |
$ | 1,744,427 | ||
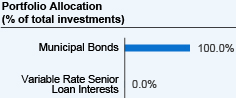 |
 |
| (1) | The ratings disclosed are the highest rating given by one of the following national rating agencies: Standard & Poor’s (S&P), Moody’s Investors Service, Inc. (Moody’s) or Fitch, Inc (Fitch). This treatment of split-rated securities may differ from that used for other purposes, such as for Fund investment policies. Credit ratings are subject to change. AAA, AA, A, and BBB are investment grade ratings; BB, B, CCC, CC, C and D are below-investment grade ratings. Holdings designated N/R are not rated by these national ratings agencies. |
How has the Fund changed?
For more complete information, you may review the Fund’s next prospectus, which is expected to be available by September 30, 2026 at https://www.nuveen.com/en-us/mutual-funds/prospectuses or upon request at (800) 257-8787.
For more complete information, you may review the Fund’s next prospectus, which is expected to be available by September 30, 2026 at https://www.nuveen.com/en-us/mutual-funds/prospectuses or upon request at (800) 257-8787.
This report describes changes to the Fund that occurred during the reporting period.
What were the Fund costs for the last year? (based on a hypothetical $10,000 investment)
| Cost of a $10,000 investment |
Costs paid as a percentage of $10,000 investment* | |||
| Class A Shares |
$75 |
0.72% | ||
| * | Annualized for period less than one year. |
How did the Fund perform last year? What affected the Fund’s performance?
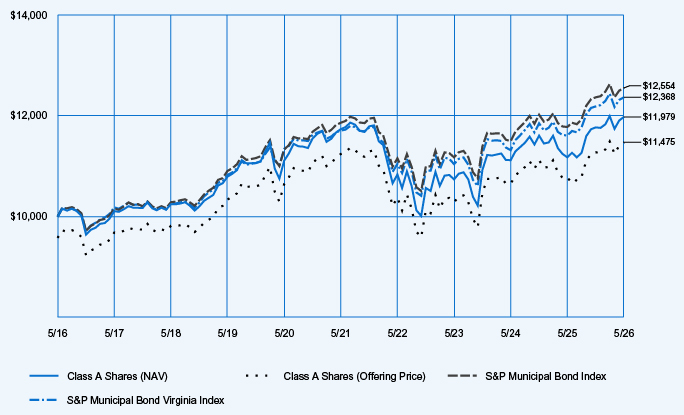
| Performance Highlights The Nuveen Virginia Municipal Bond Fund returned 7.18% for Class A Shares at net asset value (NAV) for the 12 months ended May 31, 2026. The Fund outperformed the S&P Municipal Bond Virginia Index, which returned 6.53%. Top contributors to relative performance • Duration positioning, especially an overweight to bonds with durations of eight years and longer and an underweight to bonds with durations of four years and shorter. • Credit quality positioning, especially overweights to non-rated, A-rated and BBB-rated bonds. • An underweight to the tax-backed bond sector and overweights to the transportation and hospital bond sectors. Top detractors from relative performance • Tobacco bonds. |
Average Annual Total Returns
| 1‑Year | 5‑Year | 10‑Year | ||||||||||
| Class A Shares at NAV (excluding maximum sales charge) |
7.18 | % | 0.41 | % | 1.82 | % | ||||||
| Class A Shares at maximum sales charge (Offering Price) |
2.71 | % | (0.45 | )% | 1.39 | % | ||||||
| S&P Municipal Bond Index |
6.57 | % | 1.14 | % | 2.30 | % | ||||||
| S&P Municipal Bond Virginia Index |
6.53 | % | 1.10 | % | 2.15 | % | ||||||
| Lipper Virginia Municipal Debt Funds Classification Average |
7.18 | % | 0.39 | % | 1.52 | % | ||||||
Fund Statistics (as of May 31, 2026)
| Fund net assets |
$ | 573,126,989 | ||
| Total number of portfolio holdings |
254 | |||
| Portfolio turnover (%) |
10% | |||
| Total management fees paid for the year |
$ | 2,663,673 | ||
 |
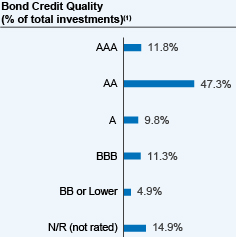 |
| (1) | The ratings disclosed are the highest rating given by one of the following national rating agencies: Standard & Poor’s (S&P), Moody’s Investors Service, Inc. (Moody’s) or Fitch, Inc (Fitch). This treatment of split-rated securities may differ from that used for other purposes, such as for Fund investment policies. Credit ratings are subject to change. AAA, AA, A, and BBB are investment grade ratings; BB, B, CCC, CC, C and D are below-investment grade ratings. Holdings designated N/R are not rated by these national ratings agencies. |
How has the Fund changed?
For more complete information, you may review the Fund’s next prospectus, which is expected to be available by September 30, 2026 at https://www.nuveen.com/en-us/mutual-funds/prospectuses or upon request at (800) 257-8787.
For more complete information, you may review the Fund’s next prospectus, which is expected to be available by September 30, 2026 at https://www.nuveen.com/en-us/mutual-funds/prospectuses or upon request at (800) 257-8787.
This report describes changes to the Fund that occurred during the reporting period.
What were the Fund costs for the last year? (based on a hypothetical $10,000 investment)
| Cost of a $10,000 investment |
Costs paid as a percentage of $10,000 investment* | |||
| Class C Shares |
$157 |
1.52% | ||
| * | Annualized for period less than one year. |
How did the Fund perform last year? What affected the Fund’s performance?
| Performance Highlights The Nuveen Virginia Municipal Bond Fund returned 6.33% for Class C Shares at net asset value (NAV) for the 12 months ended May 31, 2026. The Fund performed in line with the S&P Municipal Bond Virginia Index, which returned 6.53%. Top contributors to relative performance • Duration positioning, especially an overweight to bonds with durations of eight years and longer and an underweight to bonds with durations of four years and shorter. • Credit quality positioning, especially overweights to non‑rated, A‑rated and BBB‑rated bonds. • An underweight to the tax‑backed bond sector and overweights to the transportation and hospital bond sectors. Top detractors from relative performance • Tobacco bonds. |
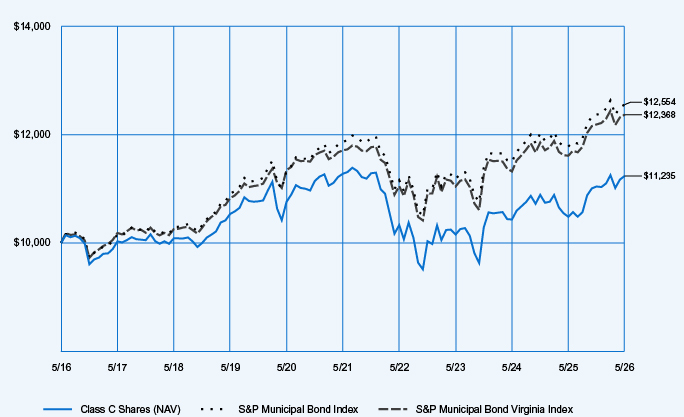
Average Annual Total Returns
| 1‑Year | 5‑Year | 10‑Year | ||||||||||
| Class C Shares at NAV (excluding maximum sales charge) |
6.33 | % | (0.39 | )% | 1.17 | % | ||||||
| S&P Municipal Bond Index |
6.57 | % | 1.14 | % | 2.30 | % | ||||||
| S&P Municipal Bond Virginia Index |
6.53 | % | 1.10 | % | 2.15 | % | ||||||
| Lipper Virginia Municipal Debt Funds Classification Average |
7.18 | % | 0.39 | % | 1.52 | % | ||||||
Fund Statistics (as of May 31, 2026)
| Fund net assets |
$ | 573,126,989 | ||
| Total number of portfolio holdings |
254 | |||
| Portfolio turnover (%) |
10% | |||
| Total management fees paid for the year |
$ | 2,663,673 | ||
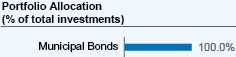 |
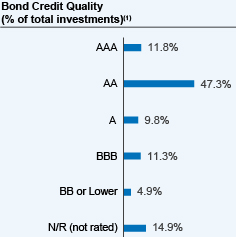 |
| (1) | The ratings disclosed are the highest rating given by one of the following national rating agencies: Standard & Poor’s (S&P), Moody’s Investors Service, Inc. (Moody’s) or Fitch, Inc (Fitch). This treatment of split-rated securities may differ from that used for other purposes, such as for Fund investment policies. Credit ratings are subject to change. AAA, AA, A, and BBB are investment grade ratings; BB, B, CCC, CC, C and D are below-investment grade ratings. Holdings designated N/R are not rated by these national ratings agencies. |
How has the Fund changed?
For more complete information, you may review the Fund’s next prospectus, which is expected to be available by September 30, 2026 at https://www.nuveen.com/en-us/mutual-funds/prospectuses or upon request at (800) 257-8787.
For more complete information, you may review the Fund’s next prospectus, which is expected to be available by September 30, 2026 at https://www.nuveen.com/en-us/mutual-funds/prospectuses or upon request at (800) 257-8787.
This report describes changes to the Fund that occurred during the reporting period.
What were the Fund costs for the last year? (based on a hypothetical $10,000 investment)
| Cost of a $10,000 investment |
Costs paid as a percentage of $10,000 investment* | |||
| Class I Shares |
$54 |
0.52% | ||
| * | Annualized for period less than one year. |
How did the Fund perform last year? What affected the Fund’s performance?
| Performance Highlights The Nuveen Virginia Municipal Bond Fund returned 7.49% for Class I Shares at net asset value (NAV) for the 12 months ended May 31, 2026. The Fund outperformed the S&P Municipal Bond Virginia Index, which returned 6.53%. Top contributors to relative performance • Duration positioning, especially an overweight to bonds with durations of eight years and longer and an underweight to bonds with durations of four years and shorter. • Credit quality positioning, especially overweights to non‑rated, A‑rated and BBB‑rated bonds. • An underweight to the tax‑backed bond sector and overweights to the transportation and hospital bond sectors. Top detractors from relative performance • Tobacco bonds. |
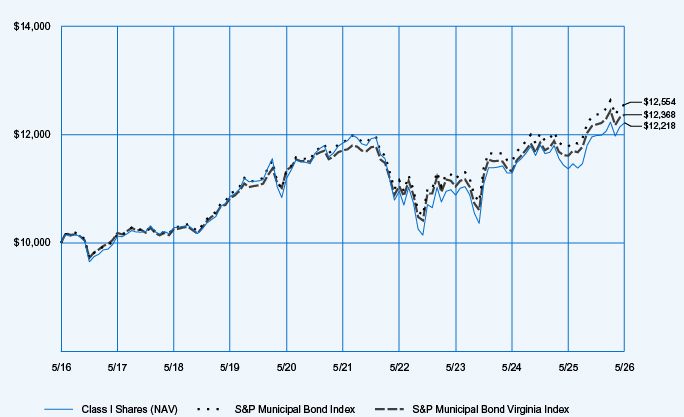
Average Annual Total Returns
| 1‑Year | 5‑Year | 10‑Year | ||||||||||
| Class I Shares at NAV |
7.49 | % | 0.62 | % | 2.02 | % | ||||||
| S&P Municipal Bond Index |
6.57 | % | 1.14 | % | 2.30 | % | ||||||
| S&P Municipal Bond Virginia Index |
6.53 | % | 1.10 | % | 2.15 | % | ||||||
| Lipper Virginia Municipal Debt Funds Classification Average |
7.18 | % | 0.39 | % | 1.52 | % | ||||||
Fund Statistics (as of May 31, 2026)
| Fund net assets |
$ | 573,126,989 | ||
| Total number of portfolio holdings |
254 | |||
| Portfolio turnover (%) |
10% | |||
| Total management fees paid for the year |
$ | 2,663,673 | ||
 |
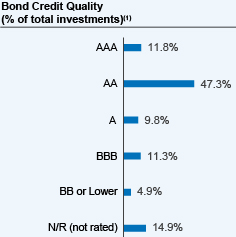 |
| (1) | The ratings disclosed are the highest rating given by one of the following national rating agencies: Standard & Poor’s (S&P), Moody’s Investors Service, Inc. (Moody’s) or Fitch, Inc (Fitch). This treatment of split-rated securities may differ from that used for other purposes, such as for Fund investment policies. Credit ratings are subject to change. AAA, AA, A, and BBB are investment grade ratings; BB, B, CCC, CC, C and D are below-investment grade ratings. Holdings designated N/R are not rated by these national ratings agencies. |
How has the Fund changed?
For more complete information, you may review the Fund’s next prospectus, which is expected to be available by September 30, 2026 at https://www.nuveen.com/en‑us/mutual‑funds/prospectuses or upon request at (800) 257‑8787.
For more complete information, you may review the Fund’s next prospectus, which is expected to be available by September 30, 2026 at https://www.nuveen.com/en‑us/mutual‑funds/prospectuses or upon request at (800) 257‑8787.
| [1] | Annualized for period less than one year. |
| [2] | Annualized for period less than one year. |
| [3] | Annualized for period less than one year. |
| [4] | Annualized for period less than one year. |
| [5] | Annualized for period less than one year. |
| [6] | Annualized for period less than one year. |
| [7] | Annualized for period less than one year. |
| [8] | Annualized for period less than one year. |
| [9] | Annualized for period less than one year. |
| [10] | Annualized for period less than one year. |
| [11] | Annualized for period less than one year. |
| [12] | Annualized for period less than one year. |
| [13] | Annualized for period less than one year. |
| [14] | Annualized for period less than one year. |
| [15] | Annualized for period less than one year. |
| [16] | Annualized for period less than one year. |
| [17] | Annualized for period less than one year. |
| [18] | Annualized for period less than one year. |