Pay vs Performance Disclosure
Dec. 31, 2025
Nov. 30, 2025
Dec. 31, 2025
USD ($)
$ / shares
Dec. 31, 2024
USD ($)
$ / shares
Dec. 31, 2023
USD ($)
$ / shares
Dec. 31, 2022
USD ($)
$ / shares
Pay Versus Performance
The following table provides information regarding “Compensation Actually Paid” (“CAP”) to our NEOs as determined and defined under SEC rules and does not reflect compensation actually earned, realized or received by them. The Corebridge Compensation and Management Development Committee did not consider this information in making its pay decisions for 2025.
Year | Summary Compensation Table Total for Kevin Hogan(1) ($) | Summary Compensation Table Total for Marc Costantini(1) ($) | Compensation Actually Paid to Kevin Hogan(1) ($) | Compensation Actually Paid to Marc Costantini(1) ($) | Average Summary Compensation Table Total for Other NEOs(1) ($) | Average Compensation Actually Paid to Other NEOs(1) ($) | Value of Initial Fixed $100 Investment based on:(2) | Net Income(3) ($ Millions) | Normalized Operating EPS(4) | |||||||||||||||||||||||
TSR ($) | Peer Group TSR ($) | |||||||||||||||||||||||||||||||
2025 | 13,116,836 | 16,142,230 | 13,325,246 | 16,102,000 | 5,701,374 | 5,451,305 | 183.27 | 157.38 | (390) | $5.40 | ||||||||||||||||||||||
2024 | 7,810,797 | — | 12,903,410 | — | 3,274,727 | 4,482,113 | 176.40 | 151.20 | 2,203 | $4.99 | ||||||||||||||||||||||
2023 | 8,632,097 | — | 12,115,440 | — | 3,981,082 | 4,248,724 | 123.50 | 119.23 | 1,036 | $3.59 | ||||||||||||||||||||||
2022 | 8,881,597 | — | 14,151,089 | — | 4,261,914 | 4,107,460 | 99.03 | 109.12 | 8,479 | $2.94 | ||||||||||||||||||||||
(1) | This table presents pay versus performance information for 2022 for Kevin Hogan (“CEO 1”) and Elias Habayeb, Terri Fiedler, Sabra Purtill, Todd Solash, Robert Scheinerman and Geoffrey Cornell (the “Other NEOs”), and 2023 for Kevin Hogan (“CEO 1”) and Elias Habayeb, Lisa Longino, Terri Fiedler, Jonathan Novak and Constance Hunter (the “Other NEOs”), and 2024 for Kevin Hogan (“CEO 1”) and Elias Habayeb, Lisa Longino, Terri Fiedler, and Jonathan Novak (the “Other NEOs”), and 2025 for Kevin Hogan (“CEO 1”), Marc Costantini (“CEO 2”), and Elias Habayeb, Lisa Longino, Jonathan Novak, and Polly Klane (the “Other NEOs”). CAP for 2022 was calculated based on the change in value from AIG equity pre-IPO on 12/31/2021 for Corebridge awards through 12/31/2022. AIG equity remained valued using AIG share prices on both dates. CAP for 2023 was calculated based on the change in value from AIG equity pre-IPO on 12/31/2022 for Corebridge awards through 12/31/2023. Corebridge equity awards remained valued using Corebridge prices on both dates. AIG equity awards remained valued using AIG share prices on both dates. CAP for 2024 was calculated based on the change in value from Corebridge equity awards on 12/31/2023 through 12/31/2024. AIG equity awards remained valued using AIG share prices on both dates. CAP for 2025 reflects the following adjustments to the applicable amounts in the Summary Compensation Table (“SCT”): |
Mr. Hogan ($) | Mr. Costantini ($) | Average of Other NEOs ($) | |||||||||
2025 Total Reported in SCT | 13,116,836 | 16,142,230 | 5,701,374 | ||||||||
Less value of stock and option awards reported in SCT | (8,385,037) | (10,301,468) | (3,180,929) | ||||||||
Less change in Pension Value in 2025 | (128,218) | — | (14,898) | ||||||||
Plus year-end value of awards granted in 2025 that were unvested and outstanding as of 12/31/2025(a) | 6,318,255 | 10,261,238 | 2,764,369 | ||||||||
Plus change in fair value of prior year awards that were unvested and outstanding as of 12/31/2025(b) | 1,976,078 | — | 22,400 | ||||||||
Plus change in fair value of prior year awards that vested in 2025(c) | 427,332 | — | 158,989 | ||||||||
Plus value of awards granted in 2025 that vested in 2025 | — | — | — | ||||||||
Compensation Actually Paid for 2025 | 13,325,246 | 16,102,000 | 5,451,305 | ||||||||
(a) | December 31, 2025 fair value of Corebridge RSUs, Corebridge PSUs and Corebridge Options was calculated based on the closing Corebridge stock price on that date. |
(b) | December 31, 2025 fair value of Corebridge RSUs and Corebridge Options was calculated based on the closing stock price on that date. December 31, 2025 fair value of AIG PSUs was calculated based on the closing AIG stock price on that date. |
(c) | Change in fair value for awards that vested in 2025 was calculated based on the closing price on the applicable vesting date. |
(2) | The Peer Group TSR uses the S&P 500 Insurance Index, which we also use in the stock performance graph included in our 2025 Annual Report. The comparison assumes $100 was invested for the period starting September 15, 2022, the IPO date, through the end of the listed year for purposes of calculating the cumulative TSR of the Company and the S&P 500 Insurance Index over the measurement period. Historical stock performance is not necessarily indicative of future stock performance. |
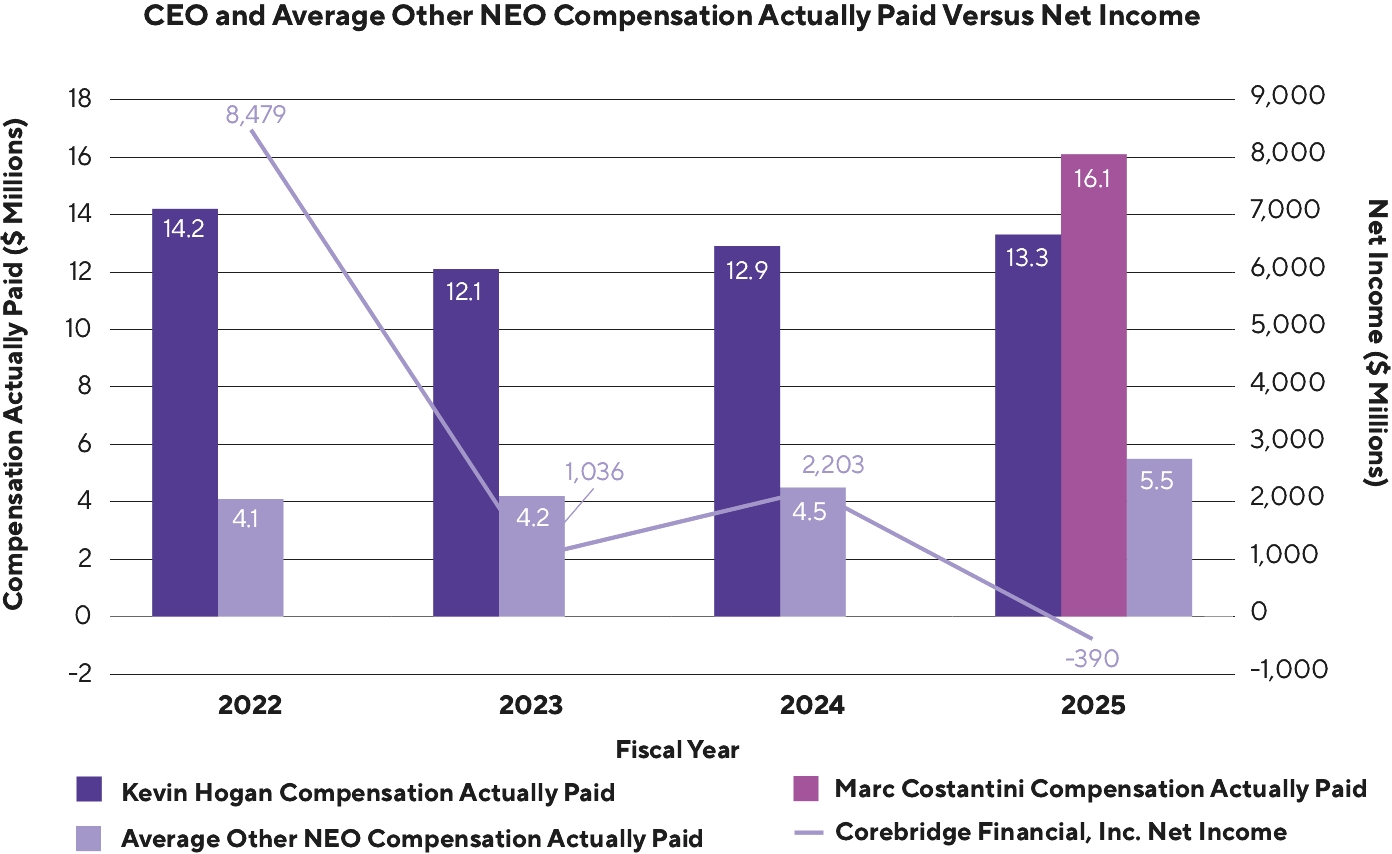
(3) | Net Income is derived from our Audited Consolidated Financial Statements. |
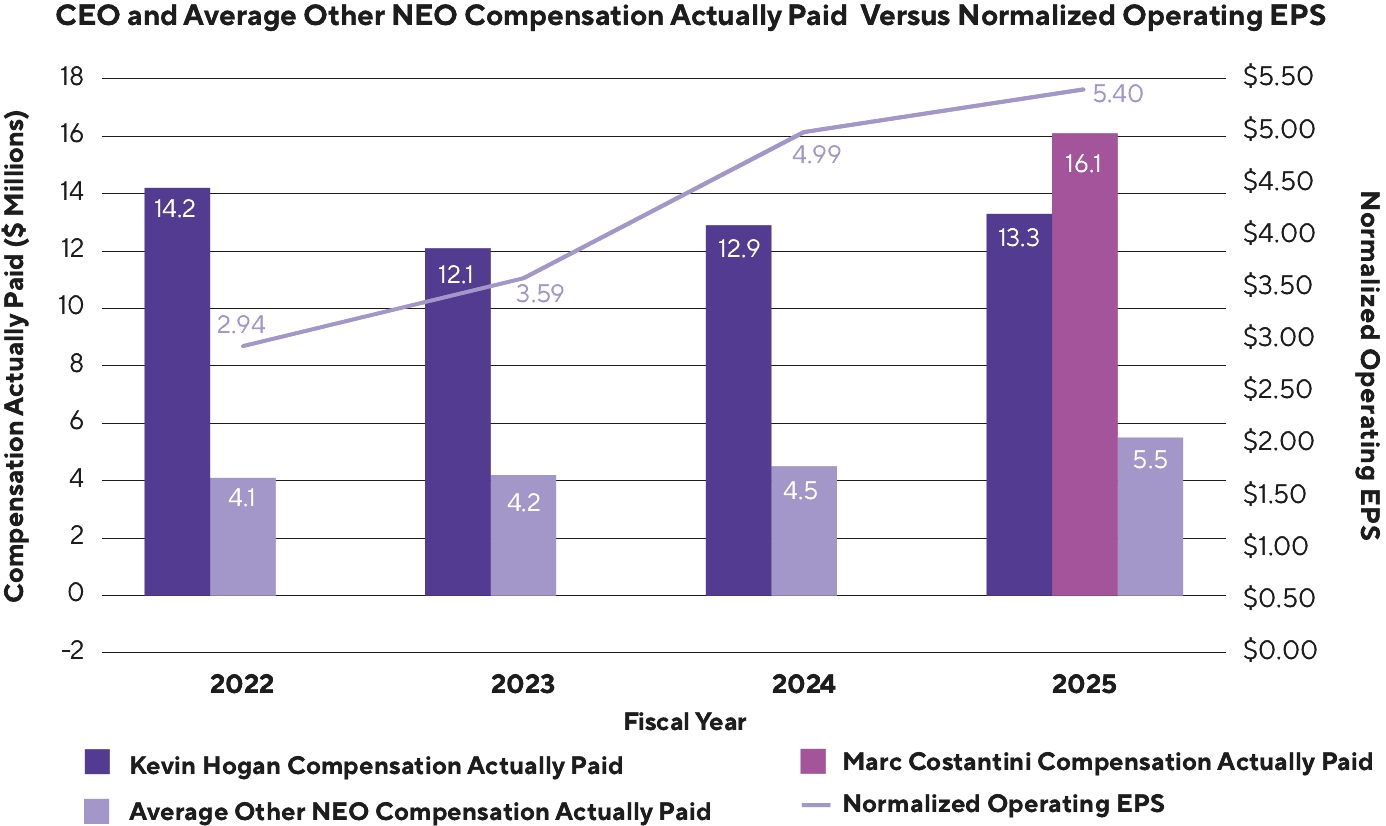
(4) | We determined Normalized Operating EPS to be the most important financial performance measure used to link Company performance to CAP in 2025. Normalized Operating EPS is a non-GAAP financial measure. For more information on this measure and how it is calculated, including certain adjustments that were made to reflect the Venerable transaction, see “Compensation Discussion and Analysis—Business Performance Score” on page 54 and Appendix A. Normalized Operating EPS was not included as a metric in the Company’s STI plan in 2022 or 2023 and Normalized Operating EPS figures for 2022 and 2023 represent Operating EPS as recast following the Venerable transaction, without any additional adjustments or normalizations. |
(1) | This table presents pay versus performance information for 2022 for Kevin Hogan (“CEO 1”) and Elias Habayeb, Terri Fiedler, Sabra Purtill, Todd Solash, Robert Scheinerman and Geoffrey Cornell (the “Other NEOs”), and 2023 for Kevin Hogan (“CEO 1”) and Elias Habayeb, Lisa Longino, Terri Fiedler, Jonathan Novak and Constance Hunter (the “Other NEOs”), and 2024 for Kevin Hogan (“CEO 1”) and Elias Habayeb, Lisa Longino, Terri Fiedler, and Jonathan Novak (the “Other NEOs”), and 2025 for Kevin Hogan (“CEO 1”), Marc Costantini (“CEO 2”), and Elias Habayeb, Lisa Longino, Jonathan Novak, and Polly Klane (the “Other NEOs”). CAP for 2022 was calculated based on the change in value from AIG equity pre-IPO on 12/31/2021 for Corebridge awards through 12/31/2022. AIG equity remained valued using AIG share prices on both dates. CAP for 2023 was calculated based on the change in value from AIG equity pre-IPO on 12/31/2022 for Corebridge awards through 12/31/2023. Corebridge equity awards remained valued using Corebridge prices on both dates. AIG equity awards remained valued using AIG share prices on both dates. CAP for 2024 was calculated based on the change in value from Corebridge equity awards on 12/31/2023 through 12/31/2024. AIG equity awards remained valued using AIG share prices on both dates. CAP for 2025 reflects the following adjustments to the applicable amounts in the Summary Compensation Table (“SCT”): |
(2) | The Peer Group TSR uses the S&P 500 Insurance Index, which we also use in the stock performance graph included in our 2025 Annual Report. The comparison assumes $100 was invested for the period starting September 15, 2022, the IPO date, through the end of the listed year for purposes of calculating the cumulative TSR of the Company and the S&P 500 Insurance Index over the measurement period. Historical stock performance is not necessarily indicative of future stock performance. |
(1) | This table presents pay versus performance information for 2022 for Kevin Hogan (“CEO 1”) and Elias Habayeb, Terri Fiedler, Sabra Purtill, Todd Solash, Robert Scheinerman and Geoffrey Cornell (the “Other NEOs”), and 2023 for Kevin Hogan (“CEO 1”) and Elias Habayeb, Lisa Longino, Terri Fiedler, Jonathan Novak and Constance Hunter (the “Other NEOs”), and 2024 for Kevin Hogan (“CEO 1”) and Elias Habayeb, Lisa Longino, Terri Fiedler, and Jonathan Novak (the “Other NEOs”), and 2025 for Kevin Hogan (“CEO 1”), Marc Costantini (“CEO 2”), and Elias Habayeb, Lisa Longino, Jonathan Novak, and Polly Klane (the “Other NEOs”). CAP for 2022 was calculated based on the change in value from AIG equity pre-IPO on 12/31/2021 for Corebridge awards through 12/31/2022. AIG equity remained valued using AIG share prices on both dates. CAP for 2023 was calculated based on the change in value from AIG equity pre-IPO on 12/31/2022 for Corebridge awards through 12/31/2023. Corebridge equity awards remained valued using Corebridge prices on both dates. AIG equity awards remained valued using AIG share prices on both dates. CAP for 2024 was calculated based on the change in value from Corebridge equity awards on 12/31/2023 through 12/31/2024. AIG equity awards remained valued using AIG share prices on both dates. CAP for 2025 reflects the following adjustments to the applicable amounts in the Summary Compensation Table (“SCT”): |
Mr. Hogan ($) | Mr. Costantini ($) | Average of Other NEOs ($) | |||||||||
2025 Total Reported in SCT | 13,116,836 | 16,142,230 | 5,701,374 | ||||||||
Less value of stock and option awards reported in SCT | (8,385,037) | (10,301,468) | (3,180,929) | ||||||||
Less change in Pension Value in 2025 | (128,218) | — | (14,898) | ||||||||
Plus year-end value of awards granted in 2025 that were unvested and outstanding as of 12/31/2025(a) | 6,318,255 | 10,261,238 | 2,764,369 | ||||||||
Plus change in fair value of prior year awards that were unvested and outstanding as of 12/31/2025(b) | 1,976,078 | — | 22,400 | ||||||||
Plus change in fair value of prior year awards that vested in 2025(c) | 427,332 | — | 158,989 | ||||||||
Plus value of awards granted in 2025 that vested in 2025 | — | — | — | ||||||||
Compensation Actually Paid for 2025 | 13,325,246 | 16,102,000 | 5,451,305 | ||||||||
(a) | December 31, 2025 fair value of Corebridge RSUs, Corebridge PSUs and Corebridge Options was calculated based on the closing Corebridge stock price on that date. |
(b) | December 31, 2025 fair value of Corebridge RSUs and Corebridge Options was calculated based on the closing stock price on that date. December 31, 2025 fair value of AIG PSUs was calculated based on the closing AIG stock price on that date. |
(c) | Change in fair value for awards that vested in 2025 was calculated based on the closing price on the applicable vesting date. |
(1) | This table presents pay versus performance information for 2022 for Kevin Hogan (“CEO 1”) and Elias Habayeb, Terri Fiedler, Sabra Purtill, Todd Solash, Robert Scheinerman and Geoffrey Cornell (the “Other NEOs”), and 2023 for Kevin Hogan (“CEO 1”) and Elias Habayeb, Lisa Longino, Terri Fiedler, Jonathan Novak and Constance Hunter (the “Other NEOs”), and 2024 for Kevin Hogan (“CEO 1”) and Elias Habayeb, Lisa Longino, Terri Fiedler, and Jonathan Novak (the “Other NEOs”), and 2025 for Kevin Hogan (“CEO 1”), Marc Costantini (“CEO 2”), and Elias Habayeb, Lisa Longino, Jonathan Novak, and Polly Klane (the “Other NEOs”). CAP for 2022 was calculated based on the change in value from AIG equity pre-IPO on 12/31/2021 for Corebridge awards through 12/31/2022. AIG equity remained valued using AIG share prices on both dates. CAP for 2023 was calculated based on the change in value from AIG equity pre-IPO on 12/31/2022 for Corebridge awards through 12/31/2023. Corebridge equity awards remained valued using Corebridge prices on both dates. AIG equity awards remained valued using AIG share prices on both dates. CAP for 2024 was calculated based on the change in value from Corebridge equity awards on 12/31/2023 through 12/31/2024. AIG equity awards remained valued using AIG share prices on both dates. CAP for 2025 reflects the following adjustments to the applicable amounts in the Summary Compensation Table (“SCT”): |
Mr. Hogan ($) | Mr. Costantini ($) | Average of Other NEOs ($) | |||||||||
2025 Total Reported in SCT | 13,116,836 | 16,142,230 | 5,701,374 | ||||||||
Less value of stock and option awards reported in SCT | (8,385,037) | (10,301,468) | (3,180,929) | ||||||||
Less change in Pension Value in 2025 | (128,218) | — | (14,898) | ||||||||
Plus year-end value of awards granted in 2025 that were unvested and outstanding as of 12/31/2025(a) | 6,318,255 | 10,261,238 | 2,764,369 | ||||||||
Plus change in fair value of prior year awards that were unvested and outstanding as of 12/31/2025(b) | 1,976,078 | — | 22,400 | ||||||||
Plus change in fair value of prior year awards that vested in 2025(c) | 427,332 | — | 158,989 | ||||||||
Plus value of awards granted in 2025 that vested in 2025 | — | — | — | ||||||||
Compensation Actually Paid for 2025 | 13,325,246 | 16,102,000 | 5,451,305 | ||||||||
(a) | December 31, 2025 fair value of Corebridge RSUs, Corebridge PSUs and Corebridge Options was calculated based on the closing Corebridge stock price on that date. |
(b) | December 31, 2025 fair value of Corebridge RSUs and Corebridge Options was calculated based on the closing stock price on that date. December 31, 2025 fair value of AIG PSUs was calculated based on the closing AIG stock price on that date. |
(c) | Change in fair value for awards that vested in 2025 was calculated based on the closing price on the applicable vesting date. |
Relationship Between Compensation Actually Paid and TSR(1)
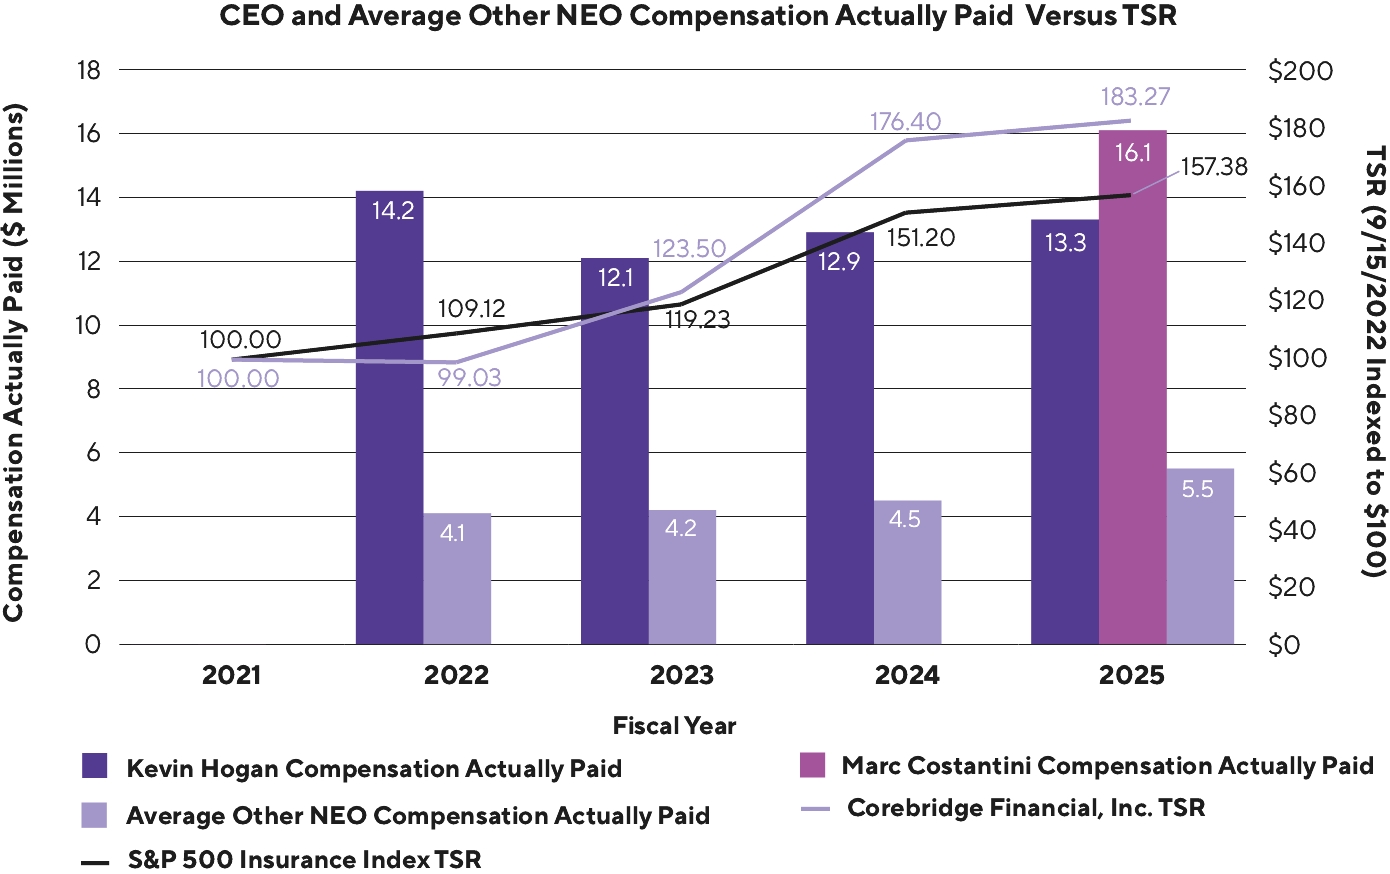
(1) | TSR on the graph begins on Corebridge’s IPO date whereas CAP begins as of the prior fiscal year end. |
Relationship Between Compensation Actually Paid and Net Income
Relationship Between Compensation Actually Paid and Normalized Operating EPS
Relationship Between Compensation Actually Paid and TSR(1)
(1) | TSR on the graph begins on Corebridge’s IPO date whereas CAP begins as of the prior fiscal year end. |
Most Important Financial Performance Measures
The following table presents the financial performance measures that the Company considers to be the most important in linking CAP to our NEOs for 2025 to Company performance. The measures in these tables are not ranked.
All of these measures are non-GAAP financial measures. For more information on non-GAAP measures and how they are calculated, including certain adjustments that were made to reflect the Venerable transaction, see “Compensation Discussion and Analysis—Business Performance Score” on page 54 and Appendix A.
• | Normalized Operating EPS |
• | Free Cash Flow |
• | General Operating Expense as part of the Strategic Performance metrics |
• | Adjusted ROAE |
• | Relative TSR |
(4) | We determined Normalized Operating EPS to be the most important financial performance measure used to link Company performance to CAP in 2025. Normalized Operating EPS is a non-GAAP financial measure. For more information on this measure and how it is calculated, including certain adjustments that were made to reflect the Venerable transaction, see “Compensation Discussion and Analysis—Business Performance Score” on page 54 and Appendix A. Normalized Operating EPS was not included as a metric in the Company’s STI plan in 2022 or 2023 and Normalized Operating EPS figures for 2022 and 2023 represent Operating EPS as recast following the Venerable transaction, without any additional adjustments or normalizations. |