Shareholder Report
May 31, 2026
USD ($)
Holding
This report describes changes to the Fund that occurred during the reporting period.
What were the Fund costs for the last year?
(based on a hypothetical $10,000 investment)
| Class name | Costs of a $10,000 investment |
Costs paid as a percentage of a $10,000 investment |
| $71 | 0.62% |
How did the Fund perform last year?
- For the reporting period ended May 31, 2026, the Fund's Class K Shares returned 29.06%.
- For the same period, the Fund’s benchmark, the Russell 1000 Index returned 28.85% and the Russell 1000 Growth Index returned 28.66%.
What contributed to performance?
Positive contributions to the Fund’s performance over the period were led by stock selection in the information technology and consumer discretionary sectors, along with positioning in communication services. Within information technology, exposure to the semiconductors & semiconductor equipment industry contributed significantly to performance, most notably positions in Nvidia Corp. and Broadcom Inc., along with an off-benchmark position in Intel Corp. In consumer discretionary, Amazon.com Inc. within the broadline retail industry was a notable contributor as the company benefited from continued strength in its e-commerce and cloud computing businesses. Lastly, within communication services, exposure to Google parent Alphabet Inc. in the interactive media & services industry added to return, supported by resilient advertising demand, continued growth in cloud services and increasing investor enthusiasm around the company’s AI initiatives.
What detracted from performance?
The largest detractors from performance over the period included stock selection in the financials sector, along with positioning in the materials and real estate sectors. Within financials, positions in Capital One Financial Corp. within the consumer finance industry and Visa Inc. within the financial services industry detracted as investor concerns regarding consumer credit trends, regulatory developments and slowing growth expectations weighed on both stocks. Within materials, positions in Newmont Corp. and Wheaton Precious Metals Corp., both in the metals & mining industry, weighed on performance as fluctuations in commodity prices and an investor rotation toward higher-growth sectors pressured both stocks. Lastly, within real estate, holdings of CoStar Group Inc. within the real estate management & development industry detracted from performance.
The views expressed reflect the opinions of BlackRock as of the date of this report and are subject to change based on changes in market, economic or other conditions. These views are not intended to be a forecast of future events and are no guarantee of future results.
Fund performance
Cumulative performance: June 1, 2016 through May 31, 2026
Initial investment of $10,000
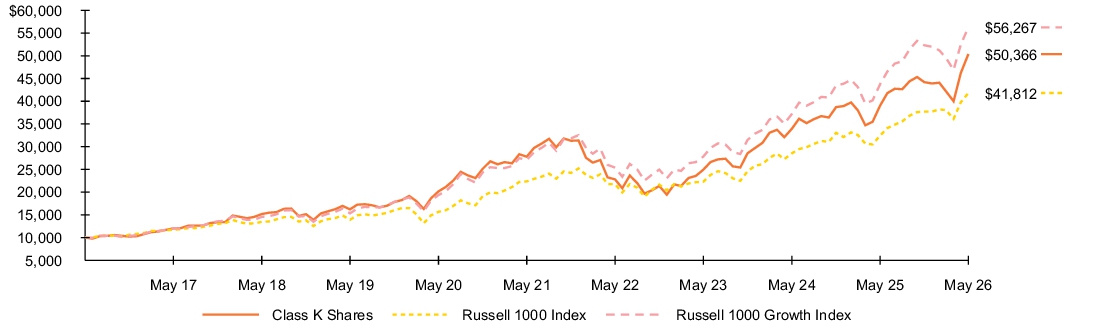
See “Average annual total returns” for additional information on fund performance.
Average annual total returns
| 1 Year | 5 Years | 10 Years | |||
| 29.06 | % | 12.62 | % | 17.55 | % |
| 28.85 | 13.33 | 15.38 | |||
| 28.66 | 15.73 | 18.86 |
Key Fund statistics
| $1,859,957,825 |
| 36 |
| $8,328,776 |
| 99% |
What did the Fund invest in?
(as of May 31, 2026)
Sector allocation
| Sector(a) | Percent of Net Assets |
|
| 55.7 | % | |
| 13.3 | ||
| 11.0 | ||
| 8.9 | ||
| 3.9 | ||
| 2.8 | ||
| 2.1 | ||
| 0.8 | ||
| 0.7 | ||
| 0.9 | ||
| (0.1 | ) |
Ten largest holdings
| Security(b) | Percent of Net Assets |
|
| 13.5 | % | |
| 8.0 | ||
| 5.7 | ||
| 5.7 | ||
| 5.3 | ||
| 5.1 | ||
| 4.1 | ||
| 3.8 | ||
| 2.8 | ||
| 2.8 |
| For purposes of this report, sector sub-classifications may differ from those utilized by the Fund for compliance purposes. |
| Excludes short-term securities. |
Ten largest holdings
| Security(b) | Percent of Net Assets |
|
| 13.5 | % | |
| 8.0 | ||
| 5.7 | ||
| 5.7 | ||
| 5.3 | ||
| 5.1 | ||
| 4.1 | ||
| 3.8 | ||
| 2.8 | ||
| 2.8 |
Material fund changes
This is a summary of certain changes to the Fund since May 31, 2025. For more complete information, you may review the Fund’s next prospectus, which we expect to be available approximately 120 days after May 31, 2026 at blackrock.com/fundreports or upon request by contacting us at (800) 441-7762.
The Fund’s Board approved changes to the Fund’s investment strategy and investment process to, under normal circumstances, invest at least 80% of its net assets, plus the amount of any borrowings for investment purposes, in large cap growth equity securities and derivatives that provide investment exposure to such securities or to one or more market risk factors associated with such securities. These changes became effective on September 26, 2025.
The Fund’s Board approved changes to the Fund’s investment strategy and investment process to, under normal circumstances, invest at least 80% of its net assets, plus the amount of any borrowings for investment purposes, in large cap growth equity securities and derivatives that provide investment exposure to such securities or to one or more market risk factors associated with such securities. These changes became effective on September 26, 2025.
This is a summary of certain changes to the Fund since May 31, 2025. For more complete information, you may review the Fund’s next prospectus, which we expect to be available approximately 120 days after May 31, 2026 at blackrock.com/fundreports or upon request by contacting us at (800) 441-7762.
This report describes changes to the Fund that occurred during the reporting period.
What were the Fund costs for the last year?
(based on a hypothetical $10,000 investment)
| Class name | Costs of a $10,000 investment |
Costs paid as a percentage of a $10,000 investment |
| $190 | 1.67% |
How did the Fund perform last year?
- For the reporting period ended May 31, 2026, the Fund's Investor C Shares returned 27.76%.
- For the same period, the Fund’s benchmark, the Russell 1000 Index returned 28.85% and the Russell 1000 Growth Index returned 28.66%.
What contributed to performance?
Positive contributions to the Fund’s performance over the period were led by stock selection in the information technology and consumer discretionary sectors, along with positioning in communication services. Within information technology, exposure to the semiconductors & semiconductor equipment industry contributed significantly to performance, most notably positions in Nvidia Corp. and Broadcom Inc., along with an off-benchmark position in Intel Corp. In consumer discretionary, Amazon.com Inc. within the broadline retail industry was a notable contributor as the company benefited from continued strength in its e-commerce and cloud computing businesses. Lastly, within communication services, exposure to Google parent Alphabet Inc. in the interactive media & services industry added to return, supported by resilient advertising demand, continued growth in cloud services and increasing investor enthusiasm around the company’s AI initiatives.
What detracted from performance?
The largest detractors from performance over the period included stock selection in the financials sector, along with positioning in the materials and real estate sectors. Within financials, positions in Capital One Financial Corp. within the consumer finance industry and Visa Inc. within the financial services industry detracted as investor concerns regarding consumer credit trends, regulatory developments and slowing growth expectations weighed on both stocks. Within materials, positions in Newmont Corp. and Wheaton Precious Metals Corp., both in the metals & mining industry, weighed on performance as fluctuations in commodity prices and an investor rotation toward higher-growth sectors pressured both stocks. Lastly, within real estate, holdings of CoStar Group Inc. within the real estate management & development industry detracted from performance.
The views expressed reflect the opinions of BlackRock as of the date of this report and are subject to change based on changes in market, economic or other conditions. These views are not intended to be a forecast of future events and are no guarantee of future results.
Fund performance
Cumulative performance: June 1, 2016 through May 31, 2026
Initial investment of $10,000
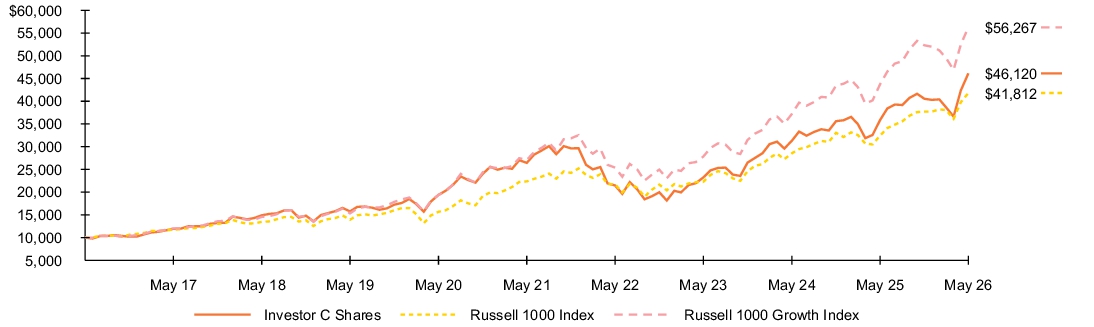
See “Average annual total returns” for additional information on fund performance.
Average annual total returns
| 1 Year | 5 Years | 10 Years | |||
| 27.76 | % | 11.45 | % | 16.52 | % |
| 26.77 | 11.45 | 16.52 | |||
| 28.85 | 13.33 | 15.38 | |||
| 28.66 | 15.73 | 18.86 |
Key Fund statistics
| $1,859,957,825 |
| 36 |
| $8,328,776 |
| 99% |
What did the Fund invest in?
(as of May 31, 2026)
Sector allocation
| Sector(a) | Percent of Net Assets |
|
| 55.7 | % | |
| 13.3 | ||
| 11.0 | ||
| 8.9 | ||
| 3.9 | ||
| 2.8 | ||
| 2.1 | ||
| 0.8 | ||
| 0.7 | ||
| 0.9 | ||
| (0.1 | ) |
Ten largest holdings
| Security(b) | Percent of Net Assets |
|
| 13.5 | % | |
| 8.0 | ||
| 5.7 | ||
| 5.7 | ||
| 5.3 | ||
| 5.1 | ||
| 4.1 | ||
| 3.8 | ||
| 2.8 | ||
| 2.8 |
| For purposes of this report, sector sub-classifications may differ from those utilized by the Fund for compliance purposes. |
| Excludes short-term securities. |
Ten largest holdings
| Security(b) | Percent of Net Assets |
|
| 13.5 | % | |
| 8.0 | ||
| 5.7 | ||
| 5.7 | ||
| 5.3 | ||
| 5.1 | ||
| 4.1 | ||
| 3.8 | ||
| 2.8 | ||
| 2.8 |
Material fund changes
This is a summary of certain changes to the Fund since May 31, 2025. For more complete information, you may review the Fund’s next prospectus, which we expect to be available approximately 120 days after May 31, 2026 at blackrock.com/fundreports or upon request by contacting us at (800) 441-7762.
The Fund’s Board approved changes to the Fund’s investment strategy and investment process to, under normal circumstances, invest at least 80% of its net assets, plus the amount of any borrowings for investment purposes, in large cap growth equity securities and derivatives that provide investment exposure to such securities or to one or more market risk factors associated with such securities. These changes became effective on September 26, 2025.
The Fund’s Board approved changes to the Fund’s investment strategy and investment process to, under normal circumstances, invest at least 80% of its net assets, plus the amount of any borrowings for investment purposes, in large cap growth equity securities and derivatives that provide investment exposure to such securities or to one or more market risk factors associated with such securities. These changes became effective on September 26, 2025.
This is a summary of certain changes to the Fund since May 31, 2025. For more complete information, you may review the Fund’s next prospectus, which we expect to be available approximately 120 days after May 31, 2026 at blackrock.com/fundreports or upon request by contacting us at (800) 441-7762.
This report describes changes to the Fund that occurred during the reporting period.
What were the Fund costs for the last year?
(based on a hypothetical $10,000 investment)
| Class name | Costs of a $10,000 investment |
Costs paid as a percentage of a $10,000 investment |
| $105 | 0.92% |
How did the Fund perform last year?
- For the reporting period ended May 31, 2026, the Fund's Investor A Shares returned 28.76%.
- For the same period, the Fund’s benchmark, the Russell 1000 Index returned 28.85% and the Russell 1000 Growth Index returned 28.66%.
What contributed to performance?
Positive contributions to the Fund’s performance over the period were led by stock selection in the information technology and consumer discretionary sectors, along with positioning in communication services. Within information technology, exposure to the semiconductors & semiconductor equipment industry contributed significantly to performance, most notably positions in Nvidia Corp. and Broadcom Inc., along with an off-benchmark position in Intel Corp. In consumer discretionary, Amazon.com Inc. within the broadline retail industry was a notable contributor as the company benefited from continued strength in its e-commerce and cloud computing businesses. Lastly, within communication services, exposure to Google parent Alphabet Inc. in the interactive media & services industry added to return, supported by resilient advertising demand, continued growth in cloud services and increasing investor enthusiasm around the company’s AI initiatives.
What detracted from performance?
The largest detractors from performance over the period included stock selection in the financials sector, along with positioning in the materials and real estate sectors. Within financials, positions in Capital One Financial Corp. within the consumer finance industry and Visa Inc. within the financial services industry detracted as investor concerns regarding consumer credit trends, regulatory developments and slowing growth expectations weighed on both stocks. Within materials, positions in Newmont Corp. and Wheaton Precious Metals Corp., both in the metals & mining industry, weighed on performance as fluctuations in commodity prices and an investor rotation toward higher-growth sectors pressured both stocks. Lastly, within real estate, holdings of CoStar Group Inc. within the real estate management & development industry detracted from performance.
The views expressed reflect the opinions of BlackRock as of the date of this report and are subject to change based on changes in market, economic or other conditions. These views are not intended to be a forecast of future events and are no guarantee of future results.
Fund performance
Cumulative performance: June 1, 2016 through May 31, 2026
Initial investment of $10,000
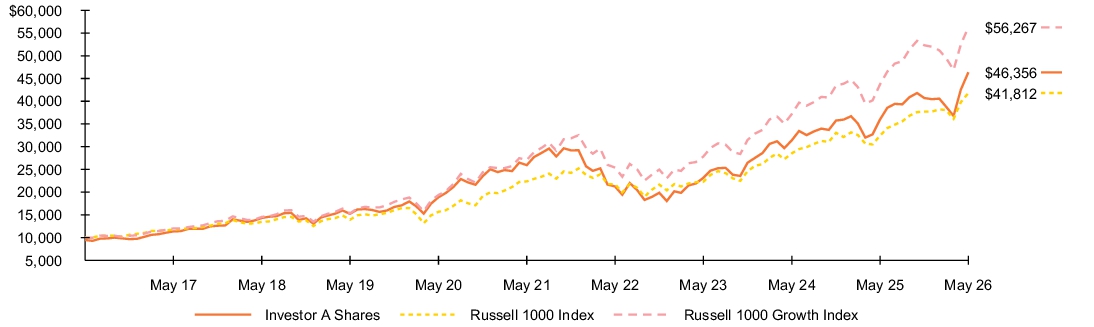
See “Average annual total returns” for additional information on fund performance.
Average annual total returns
| 1 Year | 5 Years | 10 Years | |||
| 28.76 | % | 12.31 | % | 17.21 | % |
| 22.00 | 11.11 | 16.58 | |||
| 28.85 | 13.33 | 15.38 | |||
| 28.66 | 15.73 | 18.86 |
Key Fund statistics
| $1,859,957,825 |
| 36 |
| $8,328,776 |
| 99% |
What did the Fund invest in?
(as of May 31, 2026)
Sector allocation
| Sector(a) | Percent of Net Assets |
|
| 55.7 | % | |
| 13.3 | ||
| 11.0 | ||
| 8.9 | ||
| 3.9 | ||
| 2.8 | ||
| 2.1 | ||
| 0.8 | ||
| 0.7 | ||
| 0.9 | ||
| (0.1 | ) |
Ten largest holdings
| Security(b) | Percent of Net Assets |
|
| 13.5 | % | |
| 8.0 | ||
| 5.7 | ||
| 5.7 | ||
| 5.3 | ||
| 5.1 | ||
| 4.1 | ||
| 3.8 | ||
| 2.8 | ||
| 2.8 |
| For purposes of this report, sector sub-classifications may differ from those utilized by the Fund for compliance purposes. |
| Excludes short-term securities. |
Ten largest holdings
| Security(b) | Percent of Net Assets |
|
| 13.5 | % | |
| 8.0 | ||
| 5.7 | ||
| 5.7 | ||
| 5.3 | ||
| 5.1 | ||
| 4.1 | ||
| 3.8 | ||
| 2.8 | ||
| 2.8 |
Material fund changes
This is a summary of certain changes to the Fund since May 31, 2025. For more complete information, you may review the Fund’s next prospectus, which we expect to be available approximately 120 days after May 31, 2026 at blackrock.com/fundreports or upon request by contacting us at (800) 441-7762.
The Fund’s Board approved changes to the Fund’s investment strategy and investment process to, under normal circumstances, invest at least 80% of its net assets, plus the amount of any borrowings for investment purposes, in large cap growth equity securities and derivatives that provide investment exposure to such securities or to one or more market risk factors associated with such securities. These changes became effective on September 26, 2025.
The Fund’s Board approved changes to the Fund’s investment strategy and investment process to, under normal circumstances, invest at least 80% of its net assets, plus the amount of any borrowings for investment purposes, in large cap growth equity securities and derivatives that provide investment exposure to such securities or to one or more market risk factors associated with such securities. These changes became effective on September 26, 2025.
This is a summary of certain changes to the Fund since May 31, 2025. For more complete information, you may review the Fund’s next prospectus, which we expect to be available approximately 120 days after May 31, 2026 at blackrock.com/fundreports or upon request by contacting us at (800) 441-7762.
This report describes changes to the Fund that occurred during the reporting period.
What were the Fund costs for the last year?
(based on a hypothetical $10,000 investment)
| Class name | Costs of a $10,000 investment |
Costs paid as a percentage of a $10,000 investment |
| $77 | 0.67% |
How did the Fund perform last year?
- For the reporting period ended May 31, 2026, the Fund's Institutional Shares returned 29.03%.
- For the same period, the Fund’s benchmark, the Russell 1000 Index returned 28.85% and the Russell 1000 Growth Index returned 28.66%.
What contributed to performance?
Positive contributions to the Fund’s performance over the period were led by stock selection in the information technology and consumer discretionary sectors, along with positioning in communication services. Within information technology, exposure to the semiconductors & semiconductor equipment industry contributed significantly to performance, most notably positions in Nvidia Corp. and Broadcom Inc., along with an off-benchmark position in Intel Corp. In consumer discretionary, Amazon.com Inc. within the broadline retail industry was a notable contributor as the company benefited from continued strength in its e-commerce and cloud computing businesses. Lastly, within communication services, exposure to Google parent Alphabet Inc. in the interactive media & services industry added to return, supported by resilient advertising demand, continued growth in cloud services and increasing investor enthusiasm around the company’s AI initiatives.
What detracted from performance?
The largest detractors from performance over the period included stock selection in the financials sector, along with positioning in the materials and real estate sectors. Within financials, positions in Capital One Financial Corp. within the consumer finance industry and Visa Inc. within the financial services industry detracted as investor concerns regarding consumer credit trends, regulatory developments and slowing growth expectations weighed on both stocks. Within materials, positions in Newmont Corp. and Wheaton Precious Metals Corp., both in the metals & mining industry, weighed on performance as fluctuations in commodity prices and an investor rotation toward higher-growth sectors pressured both stocks. Lastly, within real estate, holdings of CoStar Group Inc. within the real estate management & development industry detracted from performance.
The views expressed reflect the opinions of BlackRock as of the date of this report and are subject to change based on changes in market, economic or other conditions. These views are not intended to be a forecast of future events and are no guarantee of future results.
Fund performance
Cumulative performance: June 1, 2016 through May 31, 2026
Initial investment of $10,000
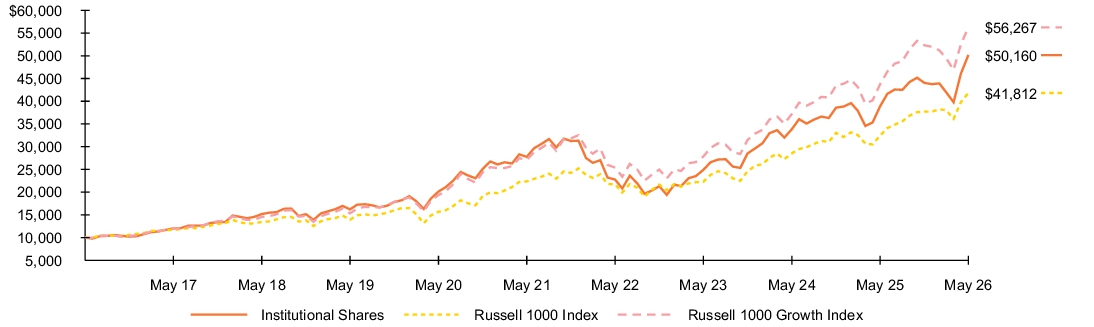
See “Average annual total returns” for additional information on fund performance.
Average annual total returns
| 1 Year | 5 Years | 10 Years | |||
| 29.03 | % | 12.56 | % | 17.50 | % |
| 28.85 | 13.33 | 15.38 | |||
| 28.66 | 15.73 | 18.86 |
Key Fund statistics
| $1,859,957,825 |
| 36 |
| $8,328,776 |
| 99% |
What did the Fund invest in?
(as of May 31, 2026)
Sector allocation
| Sector(a) | Percent of Net Assets |
|
| 55.7 | % | |
| 13.3 | ||
| 11.0 | ||
| 8.9 | ||
| 3.9 | ||
| 2.8 | ||
| 2.1 | ||
| 0.8 | ||
| 0.7 | ||
| 0.9 | ||
| (0.1 | ) |
Ten largest holdings
| Security(b) | Percent of Net Assets |
|
| 13.5 | % | |
| 8.0 | ||
| 5.7 | ||
| 5.7 | ||
| 5.3 | ||
| 5.1 | ||
| 4.1 | ||
| 3.8 | ||
| 2.8 | ||
| 2.8 |
| For purposes of this report, sector sub-classifications may differ from those utilized by the Fund for compliance purposes. |
| Excludes short-term securities. |
Ten largest holdings
| Security(b) | Percent of Net Assets |
|
| 13.5 | % | |
| 8.0 | ||
| 5.7 | ||
| 5.7 | ||
| 5.3 | ||
| 5.1 | ||
| 4.1 | ||
| 3.8 | ||
| 2.8 | ||
| 2.8 |
Material fund changes
This is a summary of certain changes to the Fund since May 31, 2025. For more complete information, you may review the Fund’s next prospectus, which we expect to be available approximately 120 days after May 31, 2026 at blackrock.com/fundreports or upon request by contacting us at (800) 441-7762.
The Fund’s Board approved changes to the Fund’s investment strategy and investment process to, under normal circumstances, invest at least 80% of its net assets, plus the amount of any borrowings for investment purposes, in large cap growth equity securities and derivatives that provide investment exposure to such securities or to one or more market risk factors associated with such securities. These changes became effective on September 26, 2025.
The Fund’s Board approved changes to the Fund’s investment strategy and investment process to, under normal circumstances, invest at least 80% of its net assets, plus the amount of any borrowings for investment purposes, in large cap growth equity securities and derivatives that provide investment exposure to such securities or to one or more market risk factors associated with such securities. These changes became effective on September 26, 2025.
This is a summary of certain changes to the Fund since May 31, 2025. For more complete information, you may review the Fund’s next prospectus, which we expect to be available approximately 120 days after May 31, 2026 at blackrock.com/fundreports or upon request by contacting us at (800) 441-7762.