Shareholder Report
May 31, 2026
USD ($)
Holding
This report describes changes to the Fund that occurred during the reporting period.
What were the Fund costs for the last year?
(based on a hypothetical $10,000 investment)
| Class name | Costs of a $10,000 investment |
Costs paid as a percentage of a $10,000 investment |
| $136 | 1.30% |
How did the Fund perform last year?
- For the reporting period ended May 31, 2026, the Fund's Class R Shares returned 9.99%.
- For the same period, the Fund’s benchmark, the Russell 1000 Index returned 28.85% and the Russell Midcap Growth Index returned 7.88%.
What contributed to performance?
Positive contributions to the Fund’s performance were led by stock selection in the information technology, industrials and financials sectors. Within information technology, positions in Monolithic Power Systems Inc. and Tower Semiconductor Ltd. within the semiconductors & semiconductor equipment industry and Lumentum Holdings Inc. within the communications equipment industry were notable contributors. All three stocks benefited from investor demand for businesses exposed to artificial intelligence ("AI")-related infrastructure, data center investment and next-generation networking technologies. In industrials, Vertiv Holdings Co. was a notable contributor as the company benefited from growing demand for power and thermal management solutions supporting data center and AI infrastructure buildouts. In financials, Robinhood Markets Inc. within the capital markets industry added to performance, as results for the trading platform were supported by strong user engagement, increased trading activity and improving business fundamentals.
What detracted from performance?
The largest detractors from performance included stock selection in the consumer discretionary, communication services and healthcare sectors. Within consumer discretionary, detractors included Planet Fitness Inc. within the hotels, restaurants & leisure industry and Duolingo Inc. within the diversified consumer services industry. Planet Fitness was impacted by concerns regarding membership growth and consumer spending trends, while language learning app provider Duolingo faced valuation pressure despite continued user growth and product innovation. Within communication services, positions in gaming platform Roblox Corp. within the entertainment industry and marketing automation company The Trade Desk Inc. within the media industry weighed on performance amid concerns regarding growth sustainability and increasing competition. Lastly, diabetes management technology provider Dexcom, Inc. within the health care equipment & supplies industry detracted from performance.
The views expressed reflect the opinions of BlackRock as of the date of this report and are subject to change based on changes in market, economic or other conditions. These views are not intended to be a forecast of future events and are no guarantee of future results.
Fund performance
Cumulative performance: June 1, 2016 through May 31, 2026
Initial investment of $10,000
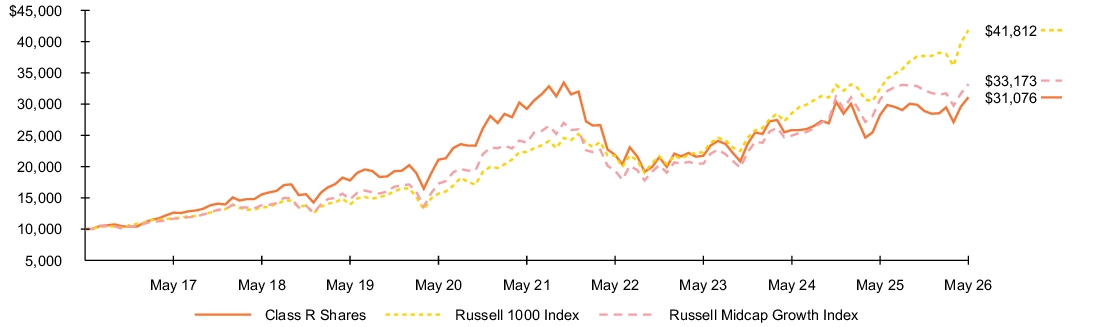
See “Average annual total returns” for additional information on fund performance.
Average annual total returns
| 1 Year | 5 Years | 10 Years | |||
| 9.99 | % | 1.23 | % | 12.01 | % |
| 28.85 | 13.33 | 15.38 | |||
| 7.88 | 6.86 | 12.74 |
Key Fund statistics
| $5,600,813,412 |
| 59 |
| $44,088,985 |
| 122% |
What did the Fund invest in?
(as of May 31, 2026)
Sector allocation
| Sector(a) | Percent of Net Assets |
|
| 29.7 | % | |
| 23.6 | ||
| 14.0 | ||
| 8.4 | ||
| 7.5 | ||
| 5.9 | ||
| 5.3 | ||
| 4.8 | ||
| 0.1 | ||
| 2.2 | ||
| (1.5 | ) |
Ten largest holdings
| Security(b) | Percent of Net Assets |
|
| 4.7 | % | |
| 4.3 | ||
| 4.3 | ||
| 3.8 | ||
| 3.8 | ||
| 3.6 | ||
| 3.6 | ||
| 3.6 | ||
| 3.0 | ||
| 3.0 |
| For purposes of this report, sector sub-classifications may differ from those utilized by the Fund for compliance purposes. |
| Excludes short-term securities. |
Ten largest holdings
| Security(b) | Percent of Net Assets |
|
| 4.7 | % | |
| 4.3 | ||
| 4.3 | ||
| 3.8 | ||
| 3.8 | ||
| 3.6 | ||
| 3.6 | ||
| 3.6 | ||
| 3.0 | ||
| 3.0 |
Material fund changes
This is a summary of certain changes to the Fund since May 31, 2025. For more complete information, you may review the Fund’s next prospectus, which we expect to be available approximately 120 days after May 31, 2026 at blackrock.com/fundreports or upon request by contacting us at (800) 441-7762.
The Fund’s Board approved changes to the Fund’s investment strategy to under normal circumstances, invest at least 80% of its net assets in growth equity securities issued by U.S. mid-capitalization companies and derivatives that provide investment exposure to such assets or to one or more market risk factors associated with such assets. These changes became effective on September 26, 2025.
The Fund’s Board approved changes to the Fund’s investment strategy to under normal circumstances, invest at least 80% of its net assets in growth equity securities issued by U.S. mid-capitalization companies and derivatives that provide investment exposure to such assets or to one or more market risk factors associated with such assets. These changes became effective on September 26, 2025.
This is a summary of certain changes to the Fund since May 31, 2025. For more complete information, you may review the Fund’s next prospectus, which we expect to be available approximately 120 days after May 31, 2026 at blackrock.com/fundreports or upon request by contacting us at (800) 441-7762.
This report describes changes to the Fund that occurred during the reporting period.
What were the Fund costs for the last year?
(based on a hypothetical $10,000 investment)
| Class name | Costs of a $10,000 investment |
Costs paid as a percentage of a $10,000 investment |
| $77 | 0.73% |
How did the Fund perform last year?
- For the reporting period ended May 31, 2026, the Fund's Class K Shares returned 10.64%.
- For the same period, the Fund’s benchmark, the Russell 1000 Index returned 28.85% and the Russell Midcap Growth Index returned 7.88%.
What contributed to performance?
Positive contributions to the Fund’s performance were led by stock selection in the information technology, industrials and financials sectors. Within information technology, positions in Monolithic Power Systems Inc. and Tower Semiconductor Ltd. within the semiconductors & semiconductor equipment industry and Lumentum Holdings Inc. within the communications equipment industry were notable contributors. All three stocks benefited from investor demand for businesses exposed to artificial intelligence ("AI")-related infrastructure, data center investment and next-generation networking technologies. In industrials, Vertiv Holdings Co. was a notable contributor as the company benefited from growing demand for power and thermal management solutions supporting data center and AI infrastructure buildouts. In financials, Robinhood Markets Inc. within the capital markets industry added to performance, as results for the trading platform were supported by strong user engagement, increased trading activity and improving business fundamentals.
What detracted from performance?
The largest detractors from performance included stock selection in the consumer discretionary, communication services and healthcare sectors. Within consumer discretionary, detractors included Planet Fitness Inc. within the hotels, restaurants & leisure industry and Duolingo Inc. within the diversified consumer services industry. Planet Fitness was impacted by concerns regarding membership growth and consumer spending trends, while language learning app provider Duolingo faced valuation pressure despite continued user growth and product innovation. Within communication services, positions in gaming platform Roblox Corp. within the entertainment industry and marketing automation company The Trade Desk Inc. within the media industry weighed on performance amid concerns regarding growth sustainability and increasing competition. Lastly, diabetes management technology provider Dexcom, Inc. within the health care equipment & supplies industry detracted from performance.
The views expressed reflect the opinions of BlackRock as of the date of this report and are subject to change based on changes in market, economic or other conditions. These views are not intended to be a forecast of future events and are no guarantee of future results.
Fund performance
Cumulative performance: June 1, 2016 through May 31, 2026
Initial investment of $10,000
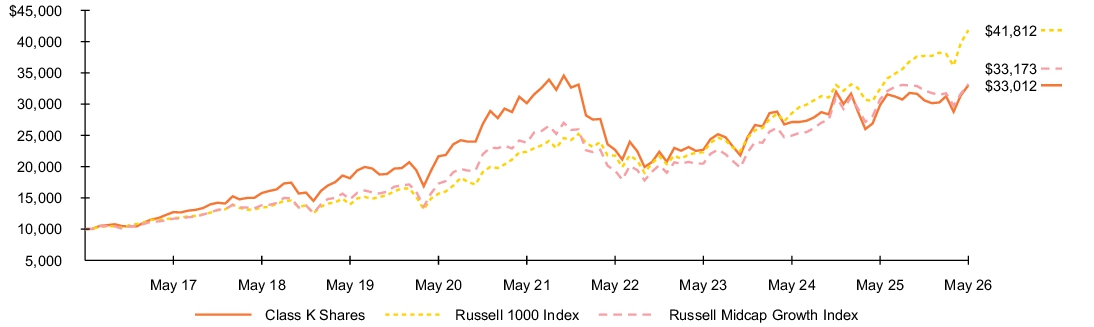
See “Average annual total returns” for additional information on fund performance.
Average annual total returns
| 1 Year | 5 Years | 10 Years | |||
| 10.64 | % | 1.84 | % | 12.69 | % |
| 28.85 | 13.33 | 15.38 | |||
| 7.88 | 6.86 | 12.74 |
Key Fund statistics
| $5,600,813,412 |
| 59 |
| $44,088,985 |
| 122% |
What did the Fund invest in?
(as of May 31, 2026)
Sector allocation
| Sector(a) | Percent of Net Assets |
|
| 29.7 | % | |
| 23.6 | ||
| 14.0 | ||
| 8.4 | ||
| 7.5 | ||
| 5.9 | ||
| 5.3 | ||
| 4.8 | ||
| 0.1 | ||
| 2.2 | ||
| (1.5 | ) |
Ten largest holdings
| Security(b) | Percent of Net Assets |
|
| 4.7 | % | |
| 4.3 | ||
| 4.3 | ||
| 3.8 | ||
| 3.8 | ||
| 3.6 | ||
| 3.6 | ||
| 3.6 | ||
| 3.0 | ||
| 3.0 |
| For purposes of this report, sector sub-classifications may differ from those utilized by the Fund for compliance purposes. |
| Excludes short-term securities. |
Ten largest holdings
| Security(b) | Percent of Net Assets |
|
| 4.7 | % | |
| 4.3 | ||
| 4.3 | ||
| 3.8 | ||
| 3.8 | ||
| 3.6 | ||
| 3.6 | ||
| 3.6 | ||
| 3.0 | ||
| 3.0 |
Material fund changes
This is a summary of certain changes to the Fund since May 31, 2025. For more complete information, you may review the Fund’s next prospectus, which we expect to be available approximately 120 days after May 31, 2026 at blackrock.com/fundreports or upon request by contacting us at (800) 441-7762.
The Fund’s Board approved changes to the Fund’s investment strategy to under normal circumstances, invest at least 80% of its net assets in growth equity securities issued by U.S. mid-capitalization companies and derivatives that provide investment exposure to such assets or to one or more market risk factors associated with such assets. These changes became effective on September 26, 2025.
The Fund’s Board approved changes to the Fund’s investment strategy to under normal circumstances, invest at least 80% of its net assets in growth equity securities issued by U.S. mid-capitalization companies and derivatives that provide investment exposure to such assets or to one or more market risk factors associated with such assets. These changes became effective on September 26, 2025.
This is a summary of certain changes to the Fund since May 31, 2025. For more complete information, you may review the Fund’s next prospectus, which we expect to be available approximately 120 days after May 31, 2026 at blackrock.com/fundreports or upon request by contacting us at (800) 441-7762.
This report describes changes to the Fund that occurred during the reporting period.
What were the Fund costs for the last year?
(based on a hypothetical $10,000 investment)
| Class name | Costs of a $10,000 investment |
Costs paid as a percentage of a $10,000 investment |
| $188 | 1.80% |
How did the Fund perform last year?
- For the reporting period ended May 31, 2026, the Fund's Investor C Shares returned 9.42%.
- For the same period, the Fund’s benchmark, the Russell 1000 Index returned 28.85% and the Russell Midcap Growth Index returned 7.88%.
What contributed to performance?
Positive contributions to the Fund’s performance were led by stock selection in the information technology, industrials and financials sectors. Within information technology, positions in Monolithic Power Systems Inc. and Tower Semiconductor Ltd. within the semiconductors & semiconductor equipment industry and Lumentum Holdings Inc. within the communications equipment industry were notable contributors. All three stocks benefited from investor demand for businesses exposed to artificial intelligence ("AI")-related infrastructure, data center investment and next-generation networking technologies. In industrials, Vertiv Holdings Co. was a notable contributor as the company benefited from growing demand for power and thermal management solutions supporting data center and AI infrastructure buildouts. In financials, Robinhood Markets Inc. within the capital markets industry added to performance, as results for the trading platform were supported by strong user engagement, increased trading activity and improving business fundamentals.
What detracted from performance?
The largest detractors from performance included stock selection in the consumer discretionary, communication services and healthcare sectors. Within consumer discretionary, detractors included Planet Fitness Inc. within the hotels, restaurants & leisure industry and Duolingo Inc. within the diversified consumer services industry. Planet Fitness was impacted by concerns regarding membership growth and consumer spending trends, while language learning app provider Duolingo faced valuation pressure despite continued user growth and product innovation. Within communication services, positions in gaming platform Roblox Corp. within the entertainment industry and marketing automation company The Trade Desk Inc. within the media industry weighed on performance amid concerns regarding growth sustainability and increasing competition. Lastly, diabetes management technology provider Dexcom, Inc. within the health care equipment & supplies industry detracted from performance.
The views expressed reflect the opinions of BlackRock as of the date of this report and are subject to change based on changes in market, economic or other conditions. These views are not intended to be a forecast of future events and are no guarantee of future results.
Fund performance
Cumulative performance: June 1, 2016 through May 31, 2026
Initial investment of $10,000
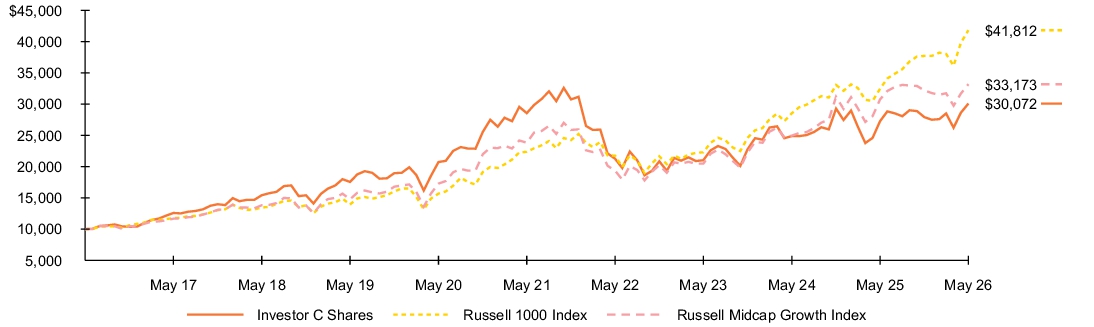
See “Average annual total returns” for additional information on fund performance.
Average annual total returns
| 1 Year | 5 Years | 10 Years | |||
| 9.42 | % | 0.73 | % | 11.64 | % |
| 8.63 | 0.73 | 11.64 | |||
| 28.85 | 13.33 | 15.38 | |||
| 7.88 | 6.86 | 12.74 |
Key Fund statistics
| $5,600,813,412 |
| 59 |
| $44,088,985 |
| 122% |
What did the Fund invest in?
(as of May 31, 2026)
Sector allocation
| Sector(a) | Percent of Net Assets |
|
| 29.7 | % | |
| 23.6 | ||
| 14.0 | ||
| 8.4 | ||
| 7.5 | ||
| 5.9 | ||
| 5.3 | ||
| 4.8 | ||
| 0.1 | ||
| 2.2 | ||
| (1.5 | ) |
Ten largest holdings
| Security(b) | Percent of Net Assets |
|
| 4.7 | % | |
| 4.3 | ||
| 4.3 | ||
| 3.8 | ||
| 3.8 | ||
| 3.6 | ||
| 3.6 | ||
| 3.6 | ||
| 3.0 | ||
| 3.0 |
| For purposes of this report, sector sub-classifications may differ from those utilized by the Fund for compliance purposes. |
| Excludes short-term securities. |
Ten largest holdings
| Security(b) | Percent of Net Assets |
|
| 4.7 | % | |
| 4.3 | ||
| 4.3 | ||
| 3.8 | ||
| 3.8 | ||
| 3.6 | ||
| 3.6 | ||
| 3.6 | ||
| 3.0 | ||
| 3.0 |
Material fund changes
This is a summary of certain changes to the Fund since May 31, 2025. For more complete information, you may review the Fund’s next prospectus, which we expect to be available approximately 120 days after May 31, 2026 at blackrock.com/fundreports or upon request by contacting us at (800) 441-7762.
The Fund’s Board approved changes to the Fund’s investment strategy to under normal circumstances, invest at least 80% of its net assets in growth equity securities issued by U.S. mid-capitalization companies and derivatives that provide investment exposure to such assets or to one or more market risk factors associated with such assets. These changes became effective on September 26, 2025.
The Fund’s Board approved changes to the Fund’s investment strategy to under normal circumstances, invest at least 80% of its net assets in growth equity securities issued by U.S. mid-capitalization companies and derivatives that provide investment exposure to such assets or to one or more market risk factors associated with such assets. These changes became effective on September 26, 2025.
This is a summary of certain changes to the Fund since May 31, 2025. For more complete information, you may review the Fund’s next prospectus, which we expect to be available approximately 120 days after May 31, 2026 at blackrock.com/fundreports or upon request by contacting us at (800) 441-7762.
This report describes changes to the Fund that occurred during the reporting period.
What were the Fund costs for the last year?
(based on a hypothetical $10,000 investment)
| Class name | Costs of a $10,000 investment |
Costs paid as a percentage of a $10,000 investment |
| $110 | 1.05% |
How did the Fund perform last year?
- For the reporting period ended May 31, 2026, the Fund's Investor A Shares returned 10.29%.
- For the same period, the Fund’s benchmark, the Russell 1000 Index returned 28.85% and the Russell Midcap Growth Index returned 7.88%.
What contributed to performance?
Positive contributions to the Fund’s performance were led by stock selection in the information technology, industrials and financials sectors. Within information technology, positions in Monolithic Power Systems Inc. and Tower Semiconductor Ltd. within the semiconductors & semiconductor equipment industry and Lumentum Holdings Inc. within the communications equipment industry were notable contributors. All three stocks benefited from investor demand for businesses exposed to artificial intelligence ("AI")-related infrastructure, data center investment and next-generation networking technologies. In industrials, Vertiv Holdings Co. was a notable contributor as the company benefited from growing demand for power and thermal management solutions supporting data center and AI infrastructure buildouts. In financials, Robinhood Markets Inc. within the capital markets industry added to performance, as results for the trading platform were supported by strong user engagement, increased trading activity and improving business fundamentals.
What detracted from performance?
The largest detractors from performance included stock selection in the consumer discretionary, communication services and healthcare sectors. Within consumer discretionary, detractors included Planet Fitness Inc. within the hotels, restaurants & leisure industry and Duolingo Inc. within the diversified consumer services industry. Planet Fitness was impacted by concerns regarding membership growth and consumer spending trends, while language learning app provider Duolingo faced valuation pressure despite continued user growth and product innovation. Within communication services, positions in gaming platform Roblox Corp. within the entertainment industry and marketing automation company The Trade Desk Inc. within the media industry weighed on performance amid concerns regarding growth sustainability and increasing competition. Lastly, diabetes management technology provider Dexcom, Inc. within the health care equipment & supplies industry detracted from performance.
The views expressed reflect the opinions of BlackRock as of the date of this report and are subject to change based on changes in market, economic or other conditions. These views are not intended to be a forecast of future events and are no guarantee of future results.
Fund performance
Cumulative performance: June 1, 2016 through May 31, 2026
Initial investment of $10,000
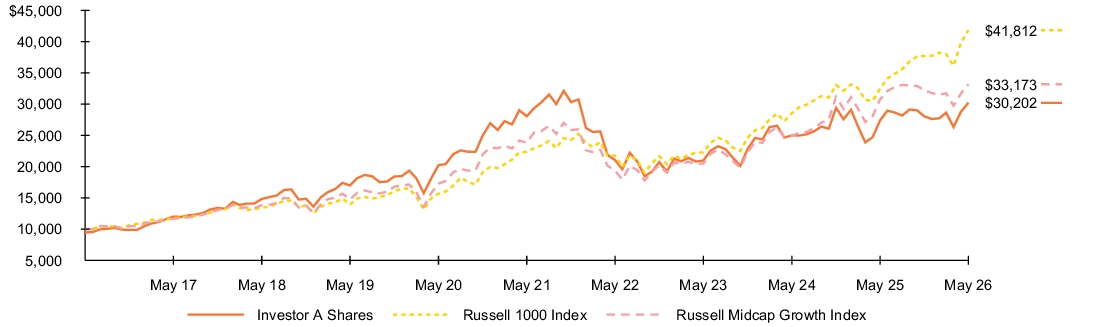
See “Average annual total returns” for additional information on fund performance.
Average annual total returns
| 1 Year | 5 Years | 10 Years | |||
| 10.29 | % | 1.49 | % | 12.29 | % |
| 4.50 | 0.40 | 11.69 | |||
| 28.85 | 13.33 | 15.38 | |||
| 7.88 | 6.86 | 12.74 |
Key Fund statistics
| $5,600,813,412 |
| 59 |
| $44,088,985 |
| 122% |
What did the Fund invest in?
(as of May 31, 2026)
Sector allocation
| Sector(a) | Percent of Net Assets |
|
| 29.7 | % | |
| 23.6 | ||
| 14.0 | ||
| 8.4 | ||
| 7.5 | ||
| 5.9 | ||
| 5.3 | ||
| 4.8 | ||
| 0.1 | ||
| 2.2 | ||
| (1.5 | ) |
Ten largest holdings
| Security(b) | Percent of Net Assets |
|
| 4.7 | % | |
| 4.3 | ||
| 4.3 | ||
| 3.8 | ||
| 3.8 | ||
| 3.6 | ||
| 3.6 | ||
| 3.6 | ||
| 3.0 | ||
| 3.0 |
| For purposes of this report, sector sub-classifications may differ from those utilized by the Fund for compliance purposes. |
| Excludes short-term securities. |
Ten largest holdings
| Security(b) | Percent of Net Assets |
|
| 4.7 | % | |
| 4.3 | ||
| 4.3 | ||
| 3.8 | ||
| 3.8 | ||
| 3.6 | ||
| 3.6 | ||
| 3.6 | ||
| 3.0 | ||
| 3.0 |
Material fund changes
This is a summary of certain changes to the Fund since May 31, 2025. For more complete information, you may review the Fund’s next prospectus, which we expect to be available approximately 120 days after May 31, 2026 at blackrock.com/fundreports or upon request by contacting us at (800) 441-7762.
The Fund’s Board approved changes to the Fund’s investment strategy to under normal circumstances, invest at least 80% of its net assets in growth equity securities issued by U.S. mid-capitalization companies and derivatives that provide investment exposure to such assets or to one or more market risk factors associated with such assets. These changes became effective on September 26, 2025.
The Fund’s Board approved changes to the Fund’s investment strategy to under normal circumstances, invest at least 80% of its net assets in growth equity securities issued by U.S. mid-capitalization companies and derivatives that provide investment exposure to such assets or to one or more market risk factors associated with such assets. These changes became effective on September 26, 2025.
This is a summary of certain changes to the Fund since May 31, 2025. For more complete information, you may review the Fund’s next prospectus, which we expect to be available approximately 120 days after May 31, 2026 at blackrock.com/fundreports or upon request by contacting us at (800) 441-7762.
This report describes changes to the Fund that occurred during the reporting period.
What were the Fund costs for the last year?
(based on a hypothetical $10,000 investment)
| Class name | Costs of a $10,000 investment |
Costs paid as a percentage of a $10,000 investment |
| $110 | 1.05% |
How did the Fund perform last year?
- For the reporting period ended May 31, 2026, the Fund's Service Shares returned 10.29%.
- For the same period, the Fund’s benchmark, the Russell 1000 Index returned 28.85% and the Russell Midcap Growth Index returned 7.88%.
What contributed to performance?
Positive contributions to the Fund’s performance were led by stock selection in the information technology, industrials and financials sectors. Within information technology, positions in Monolithic Power Systems Inc. and Tower Semiconductor Ltd. within the semiconductors & semiconductor equipment industry and Lumentum Holdings Inc. within the communications equipment industry were notable contributors. All three stocks benefited from investor demand for businesses exposed to artificial intelligence ("AI")-related infrastructure, data center investment and next-generation networking technologies. In industrials, Vertiv Holdings Co. was a notable contributor as the company benefited from growing demand for power and thermal management solutions supporting data center and AI infrastructure buildouts. In financials, Robinhood Markets Inc. within the capital markets industry added to performance, as results for the trading platform were supported by strong user engagement, increased trading activity and improving business fundamentals.
What detracted from performance?
The largest detractors from performance included stock selection in the consumer discretionary, communication services and healthcare sectors. Within consumer discretionary, detractors included Planet Fitness Inc. within the hotels, restaurants & leisure industry and Duolingo Inc. within the diversified consumer services industry. Planet Fitness was impacted by concerns regarding membership growth and consumer spending trends, while language learning app provider Duolingo faced valuation pressure despite continued user growth and product innovation. Within communication services, positions in gaming platform Roblox Corp. within the entertainment industry and marketing automation company The Trade Desk Inc. within the media industry weighed on performance amid concerns regarding growth sustainability and increasing competition. Lastly, diabetes management technology provider Dexcom, Inc. within the health care equipment & supplies industry detracted from performance.
The views expressed reflect the opinions of BlackRock as of the date of this report and are subject to change based on changes in market, economic or other conditions. These views are not intended to be a forecast of future events and are no guarantee of future results.
Fund performance
Cumulative performance: June 1, 2016 through May 31, 2026
Initial investment of $10,000
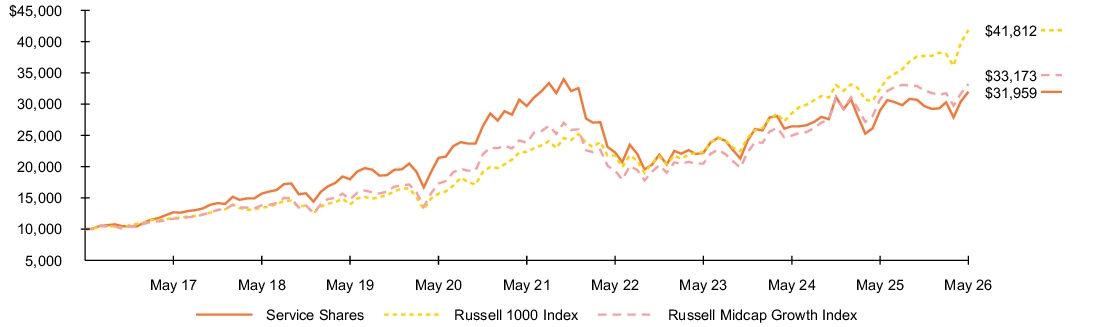
See “Average annual total returns” for additional information on fund performance.
Average annual total returns
| 1 Year | 5 Years | 10 Years | |||
| 10.29 | % | 1.49 | % | 12.32 | % |
| 28.85 | 13.33 | 15.38 | |||
| 7.88 | 6.86 | 12.74 |
Key Fund statistics
| $5,600,813,412 |
| 59 |
| $44,088,985 |
| 122% |
What did the Fund invest in?
(as of May 31, 2026)
Sector allocation
| Sector(a) | Percent of Net Assets |
|
| 29.7 | % | |
| 23.6 | ||
| 14.0 | ||
| 8.4 | ||
| 7.5 | ||
| 5.9 | ||
| 5.3 | ||
| 4.8 | ||
| 0.1 | ||
| 2.2 | ||
| (1.5 | ) |
Ten largest holdings
| Security(b) | Percent of Net Assets |
|
| 4.7 | % | |
| 4.3 | ||
| 4.3 | ||
| 3.8 | ||
| 3.8 | ||
| 3.6 | ||
| 3.6 | ||
| 3.6 | ||
| 3.0 | ||
| 3.0 |
| For purposes of this report, sector sub-classifications may differ from those utilized by the Fund for compliance purposes. |
| Excludes short-term securities. |
Ten largest holdings
| Security(b) | Percent of Net Assets |
|
| 4.7 | % | |
| 4.3 | ||
| 4.3 | ||
| 3.8 | ||
| 3.8 | ||
| 3.6 | ||
| 3.6 | ||
| 3.6 | ||
| 3.0 | ||
| 3.0 |
Material fund changes
This is a summary of certain changes to the Fund since May 31, 2025. For more complete information, you may review the Fund’s next prospectus, which we expect to be available approximately 120 days after May 31, 2026 at blackrock.com/fundreports or upon request by contacting us at (800) 441-7762.
The Fund’s Board approved changes to the Fund’s investment strategy to under normal circumstances, invest at least 80% of its net assets in growth equity securities issued by U.S. mid-capitalization companies and derivatives that provide investment exposure to such assets or to one or more market risk factors associated with such assets. These changes became effective on September 26, 2025.
The Fund’s Board approved changes to the Fund’s investment strategy to under normal circumstances, invest at least 80% of its net assets in growth equity securities issued by U.S. mid-capitalization companies and derivatives that provide investment exposure to such assets or to one or more market risk factors associated with such assets. These changes became effective on September 26, 2025.
This is a summary of certain changes to the Fund since May 31, 2025. For more complete information, you may review the Fund’s next prospectus, which we expect to be available approximately 120 days after May 31, 2026 at blackrock.com/fundreports or upon request by contacting us at (800) 441-7762.
This report describes changes to the Fund that occurred during the reporting period.
What were the Fund costs for the last year?
(based on a hypothetical $10,000 investment)
| Class name | Costs of a $10,000 investment |
Costs paid as a percentage of a $10,000 investment |
| $84 | 0.80% |
How did the Fund perform last year?
- For the reporting period ended May 31, 2026, the Fund's Institutional Shares returned 10.53%.
- For the same period, the Fund’s benchmark, the Russell 1000 Index returned 28.85% and the Russell Midcap Growth Index returned 7.88%.
What contributed to performance?
Positive contributions to the Fund’s performance were led by stock selection in the information technology, industrials and financials sectors. Within information technology, positions in Monolithic Power Systems Inc. and Tower Semiconductor Ltd. within the semiconductors & semiconductor equipment industry and Lumentum Holdings Inc. within the communications equipment industry were notable contributors. All three stocks benefited from investor demand for businesses exposed to artificial intelligence ("AI")-related infrastructure, data center investment and next-generation networking technologies. In industrials, Vertiv Holdings Co. was a notable contributor as the company benefited from growing demand for power and thermal management solutions supporting data center and AI infrastructure buildouts. In financials, Robinhood Markets Inc. within the capital markets industry added to performance, as results for the trading platform were supported by strong user engagement, increased trading activity and improving business fundamentals.
What detracted from performance?
The largest detractors from performance included stock selection in the consumer discretionary, communication services and healthcare sectors. Within consumer discretionary, detractors included Planet Fitness Inc. within the hotels, restaurants & leisure industry and Duolingo Inc. within the diversified consumer services industry. Planet Fitness was impacted by concerns regarding membership growth and consumer spending trends, while language learning app provider Duolingo faced valuation pressure despite continued user growth and product innovation. Within communication services, positions in gaming platform Roblox Corp. within the entertainment industry and marketing automation company The Trade Desk Inc. within the media industry weighed on performance amid concerns regarding growth sustainability and increasing competition. Lastly, diabetes management technology provider Dexcom, Inc. within the health care equipment & supplies industry detracted from performance.
The views expressed reflect the opinions of BlackRock as of the date of this report and are subject to change based on changes in market, economic or other conditions. These views are not intended to be a forecast of future events and are no guarantee of future results.
Fund performance
Cumulative performance: June 1, 2016 through May 31, 2026
Initial investment of $10,000
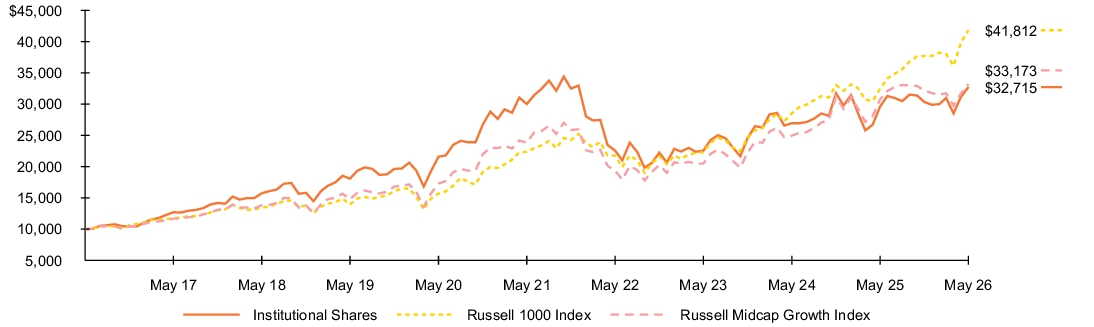
See “Average annual total returns” for additional information on fund performance.
Average annual total returns
| 1 Year | 5 Years | 10 Years | |||
| 10.53 | % | 1.74 | % | 12.58 | % |
| 28.85 | 13.33 | 15.38 | |||
| 7.88 | 6.86 | 12.74 |
Key Fund statistics
| $5,600,813,412 |
| 59 |
| $44,088,985 |
| 122% |
What did the Fund invest in?
(as of May 31, 2026)
Sector allocation
| Sector(a) | Percent of Net Assets |
|
| 29.7 | % | |
| 23.6 | ||
| 14.0 | ||
| 8.4 | ||
| 7.5 | ||
| 5.9 | ||
| 5.3 | ||
| 4.8 | ||
| 0.1 | ||
| 2.2 | ||
| (1.5 | ) |
Ten largest holdings
| Security(b) | Percent of Net Assets |
|
| 4.7 | % | |
| 4.3 | ||
| 4.3 | ||
| 3.8 | ||
| 3.8 | ||
| 3.6 | ||
| 3.6 | ||
| 3.6 | ||
| 3.0 | ||
| 3.0 |
| For purposes of this report, sector sub-classifications may differ from those utilized by the Fund for compliance purposes. |
| Excludes short-term securities. |
Ten largest holdings
| Security(b) | Percent of Net Assets |
|
| 4.7 | % | |
| 4.3 | ||
| 4.3 | ||
| 3.8 | ||
| 3.8 | ||
| 3.6 | ||
| 3.6 | ||
| 3.6 | ||
| 3.0 | ||
| 3.0 |
Material fund changes
This is a summary of certain changes to the Fund since May 31, 2025. For more complete information, you may review the Fund’s next prospectus, which we expect to be available approximately 120 days after May 31, 2026 at blackrock.com/fundreports or upon request by contacting us at (800) 441-7762.
The Fund’s Board approved changes to the Fund’s investment strategy to under normal circumstances, invest at least 80% of its net assets in growth equity securities issued by U.S. mid-capitalization companies and derivatives that provide investment exposure to such assets or to one or more market risk factors associated with such assets. These changes became effective on September 26, 2025.
The Fund’s Board approved changes to the Fund’s investment strategy to under normal circumstances, invest at least 80% of its net assets in growth equity securities issued by U.S. mid-capitalization companies and derivatives that provide investment exposure to such assets or to one or more market risk factors associated with such assets. These changes became effective on September 26, 2025.
This is a summary of certain changes to the Fund since May 31, 2025. For more complete information, you may review the Fund’s next prospectus, which we expect to be available approximately 120 days after May 31, 2026 at blackrock.com/fundreports or upon request by contacting us at (800) 441-7762.
What were the Fund costs for the last year?
(based on a hypothetical $10,000 investment)
| Class name | Costs of a $10,000 investment |
Costs paid as a percentage of a $10,000 investment |
| $94 | 0.85% |
How did the Fund perform last year?
- For the reporting period ended May 31, 2026, the Fund's Institutional Shares returned 21.49%.
- For the same period, the Fund’s benchmark, the Russell 1000 Index returned 28.85% and the Russell 1000 Value Index returned 28.55%.
What contributed to performance?
The Fund utilizes an actively managed large-cap value approach that seeks to generate enhanced yield by combining dividend-paying equities with a single-stock covered call overlay. In doing so, the Fund utilizes derivatives known as equity-linked notes, debt instruments with the potential for additional payouts tied to the return of a specific stock. The Fund’s primary objective is high current income while maintaining prospects for capital appreciation by investing in high-quality, attractively valued companies with a consistent dividend history.
Over the period, the information technology sector had the most significant positive impact on performance, most notably within the technology hardware, storage & peripherals industry. The Fund’s industrials exposure also contributed positively, led by holdings within the trading companies & distributors industry. Finally, exposure to the consumer discretionary sector proved beneficial.
What detracted from performance?
None of the sectors detracted during this period, however, at a industry level, exposures within media, financial services and health care equipment & supplies detracted.
The views expressed reflect the opinions of BlackRock as of the date of this report and are subject to change based on changes in market, economic or other conditions. These views are not intended to be a forecast of future events and are no guarantee of future results.
Fund performance
Cumulative performance: June 1, 2016 through May 31, 2026
Initial investment of $10,000
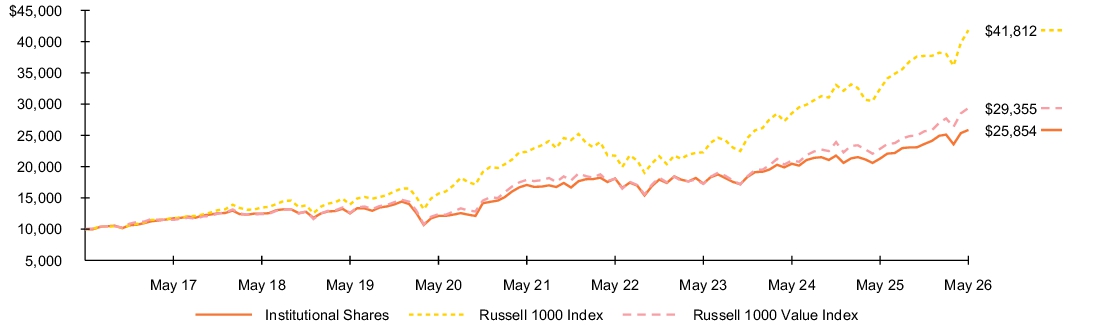
See “Average annual total returns” for additional information on fund performance.
Average annual total returns
| 1 Year | 5 Years | 10 Years | |||
| 21.49 | % | 8.67 | % | 9.96 | % |
| 28.85 | 13.33 | 15.38 | |||
| 28.55 | 10.42 | 11.37 |
Key Fund statistics
| $2,103,864,551 |
| 171 |
| $14,225,758 |
| 153% |
What did the Fund invest in?
(as of May 31, 2026)
Sector allocation
| Sector(a) | Percent of Net Assets |
|
| 19.6 | % | |
| 15.6 | ||
| 15.5 | ||
| 12.4 | ||
| 7.9 | ||
| 7.7 | ||
| 5.5 | ||
| 5.5 | ||
| 4.7 | ||
| 4.5 | ||
| 3.1 | ||
| 3.3 | ||
| (5.3 | ) |
Ten largest holdings
| Security(b) | Percent of Net Assets |
|
| 3.4 | % | |
| 2.7 | ||
| 1.9 | ||
| 1.9 | ||
| 1.8 | ||
| 1.8 | ||
| 1.7 | ||
| 1.7 | ||
| 1.6 | ||
| 1.5 |
| For purposes of this report, sector sub-classifications may differ from those utilized by the Fund for compliance purposes. |
| Excludes short-term securities. |
Ten largest holdings
| Security(b) | Percent of Net Assets |
|
| 3.4 | % | |
| 2.7 | ||
| 1.9 | ||
| 1.9 | ||
| 1.8 | ||
| 1.8 | ||
| 1.7 | ||
| 1.7 | ||
| 1.6 | ||
| 1.5 |
What were the Fund costs for the last year?
(based on a hypothetical $10,000 investment)
| Class name | Costs of a $10,000 investment |
Costs paid as a percentage of a $10,000 investment |
| $122 | 1.10% |
How did the Fund perform last year?
- For the reporting period ended May 31, 2026, the Fund's Investor A Shares returned 21.19%.
- For the same period, the Fund’s benchmark, the Russell 1000 Index returned 28.85% and the Russell 1000 Value Index returned 28.55%.
What contributed to performance?
The Fund utilizes an actively managed large-cap value approach that seeks to generate enhanced yield by combining dividend-paying equities with a single-stock covered call overlay. In doing so, the Fund utilizes derivatives known as equity-linked notes, debt instruments with the potential for additional payouts tied to the return of a specific stock. The Fund’s primary objective is high current income while maintaining prospects for capital appreciation by investing in high-quality, attractively valued companies with a consistent dividend history.
Over the period, the information technology sector had the most significant positive impact on performance, most notably within the technology hardware, storage & peripherals industry. The Fund’s industrials exposure also contributed positively, led by holdings within the trading companies & distributors industry. Finally, exposure to the consumer discretionary sector proved beneficial.
What detracted from performance?
None of the sectors detracted during this period, however, at a industry level, exposures within media, financial services and health care equipment & supplies detracted.
The views expressed reflect the opinions of BlackRock as of the date of this report and are subject to change based on changes in market, economic or other conditions. These views are not intended to be a forecast of future events and are no guarantee of future results.
Fund performance
Cumulative performance: June 1, 2016 through May 31, 2026
Initial investment of $10,000
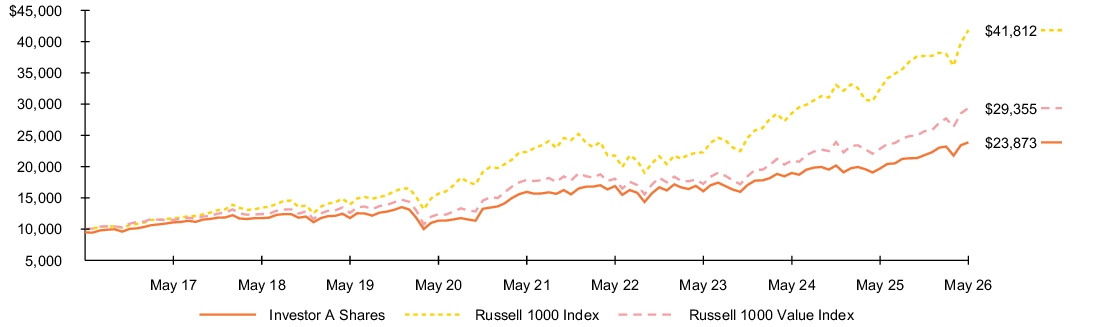
See “Average annual total returns” for additional information on fund performance.
Average annual total returns
| 1 Year | 5 Years | 10 Years | |||
| 21.19 | % | 8.40 | % | 9.68 | % |
| 14.83 | 7.23 | 9.09 | |||
| 28.85 | 13.33 | 15.38 | |||
| 28.55 | 10.42 | 11.37 |
Key Fund statistics
| $2,103,864,551 |
| 171 |
| $14,225,758 |
| 153% |
What did the Fund invest in?
(as of May 31, 2026)
Sector allocation
| Sector(a) | Percent of Net Assets |
|
| 19.6 | % | |
| 15.6 | ||
| 15.5 | ||
| 12.4 | ||
| 7.9 | ||
| 7.7 | ||
| 5.5 | ||
| 5.5 | ||
| 4.7 | ||
| 4.5 | ||
| 3.1 | ||
| 3.3 | ||
| (5.3 | ) |
Ten largest holdings
| Security(b) | Percent of Net Assets |
|
| 3.4 | % | |
| 2.7 | ||
| 1.9 | ||
| 1.9 | ||
| 1.8 | ||
| 1.8 | ||
| 1.7 | ||
| 1.7 | ||
| 1.6 | ||
| 1.5 |
| For purposes of this report, sector sub-classifications may differ from those utilized by the Fund for compliance purposes. |
| Excludes short-term securities. |
Ten largest holdings
| Security(b) | Percent of Net Assets |
|
| 3.4 | % | |
| 2.7 | ||
| 1.9 | ||
| 1.9 | ||
| 1.8 | ||
| 1.8 | ||
| 1.7 | ||
| 1.7 | ||
| 1.6 | ||
| 1.5 |
What were the Fund costs for the last year?
(based on a hypothetical $10,000 investment)
| Class name | Costs of a $10,000 investment |
Costs paid as a percentage of a $10,000 investment |
| $204 | 1.85% |
How did the Fund perform last year?
- For the reporting period ended May 31, 2026, the Fund's Investor C Shares returned 20.35%.
- For the same period, the Fund’s benchmark, the Russell 1000 Index returned 28.85% and the Russell 1000 Value Index returned 28.55%.
What contributed to performance?
The Fund utilizes an actively managed large-cap value approach that seeks to generate enhanced yield by combining dividend-paying equities with a single-stock covered call overlay. In doing so, the Fund utilizes derivatives known as equity-linked notes, debt instruments with the potential for additional payouts tied to the return of a specific stock. The Fund’s primary objective is high current income while maintaining prospects for capital appreciation by investing in high-quality, attractively valued companies with a consistent dividend history.
Over the period, the information technology sector had the most significant positive impact on performance, most notably within the technology hardware, storage & peripherals industry. The Fund’s industrials exposure also contributed positively, led by holdings within the trading companies & distributors industry. Finally, exposure to the consumer discretionary sector proved beneficial.
What detracted from performance?
None of the sectors detracted during this period, however, at a industry level, exposures within media, financial services and health care equipment & supplies detracted.
The views expressed reflect the opinions of BlackRock as of the date of this report and are subject to change based on changes in market, economic or other conditions. These views are not intended to be a forecast of future events and are no guarantee of future results.
Fund performance
Cumulative performance: June 1, 2016 through May 31, 2026
Initial investment of $10,000
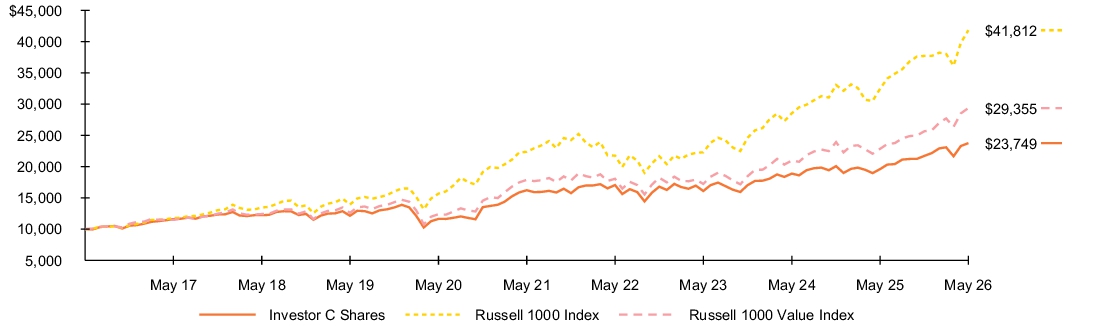
See “Average annual total returns” for additional information on fund performance.
Average annual total returns
| 1 Year | 5 Years | 10 Years | |||
| 20.35 | % | 7.60 | % | 9.03 | % |
| 19.35 | 7.60 | 9.03 | |||
| 28.85 | 13.33 | 15.38 | |||
| 28.55 | 10.42 | 11.37 |
Key Fund statistics
| $2,103,864,551 |
| 171 |
| $14,225,758 |
| 153% |
What did the Fund invest in?
(as of May 31, 2026)
Sector allocation
| Sector(a) | Percent of Net Assets |
|
| 19.6 | % | |
| 15.6 | ||
| 15.5 | ||
| 12.4 | ||
| 7.9 | ||
| 7.7 | ||
| 5.5 | ||
| 5.5 | ||
| 4.7 | ||
| 4.5 | ||
| 3.1 | ||
| 3.3 | ||
| (5.3 | ) |
Ten largest holdings
| Security(b) | Percent of Net Assets |
|
| 3.4 | % | |
| 2.7 | ||
| 1.9 | ||
| 1.9 | ||
| 1.8 | ||
| 1.8 | ||
| 1.7 | ||
| 1.7 | ||
| 1.6 | ||
| 1.5 |
| For purposes of this report, sector sub-classifications may differ from those utilized by the Fund for compliance purposes. |
| Excludes short-term securities. |
Ten largest holdings
| Security(b) | Percent of Net Assets |
|
| 3.4 | % | |
| 2.7 | ||
| 1.9 | ||
| 1.9 | ||
| 1.8 | ||
| 1.8 | ||
| 1.7 | ||
| 1.7 | ||
| 1.6 | ||
| 1.5 |
What were the Fund costs for the last year?
(based on a hypothetical $10,000 investment)
| Class name | Costs of a $10,000 investment |
Costs paid as a percentage of a $10,000 investment |
| $89 | 0.80% |
How did the Fund perform last year?
- For the reporting period ended May 31, 2026, the Fund's Class K Shares returned 21.57%.
- For the same period, the Fund’s benchmark, the Russell 1000 Index returned 28.85% and the Russell 1000 Value Index returned 28.55%.
What contributed to performance?
The Fund utilizes an actively managed large-cap value approach that seeks to generate enhanced yield by combining dividend-paying equities with a single-stock covered call overlay. In doing so, the Fund utilizes derivatives known as equity-linked notes, debt instruments with the potential for additional payouts tied to the return of a specific stock. The Fund’s primary objective is high current income while maintaining prospects for capital appreciation by investing in high-quality, attractively valued companies with a consistent dividend history.
Over the period, the information technology sector had the most significant positive impact on performance, most notably within the technology hardware, storage & peripherals industry. The Fund’s industrials exposure also contributed positively, led by holdings within the trading companies & distributors industry. Finally, exposure to the consumer discretionary sector proved beneficial.
What detracted from performance?
None of the sectors detracted during this period, however, at a industry level, exposures within media, financial services and health care equipment & supplies detracted.
The views expressed reflect the opinions of BlackRock as of the date of this report and are subject to change based on changes in market, economic or other conditions. These views are not intended to be a forecast of future events and are no guarantee of future results.
Fund performance
Cumulative performance: June 1, 2016 through May 31, 2026
Initial investment of $10,000
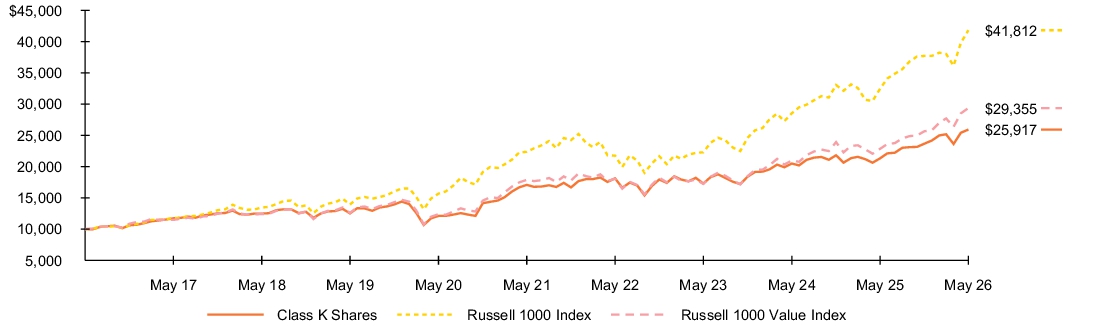
See “Average annual total returns” for additional information on fund performance.
Average annual total returns
| 1 Year | 5 Years | 10 Years | |||
| 21.57 | % | 8.71 | % | 9.99 | % |
| 28.85 | 13.33 | 15.38 | |||
| 28.55 | 10.42 | 11.37 |
Key Fund statistics
| $2,103,864,551 |
| 171 |
| $14,225,758 |
| 153% |
What did the Fund invest in?
(as of May 31, 2026)
Sector allocation
| Sector(a) | Percent of Net Assets |
|
| 19.6 | % | |
| 15.6 | ||
| 15.5 | ||
| 12.4 | ||
| 7.9 | ||
| 7.7 | ||
| 5.5 | ||
| 5.5 | ||
| 4.7 | ||
| 4.5 | ||
| 3.1 | ||
| 3.3 | ||
| (5.3 | ) |
Ten largest holdings
| Security(b) | Percent of Net Assets |
|
| 3.4 | % | |
| 2.7 | ||
| 1.9 | ||
| 1.9 | ||
| 1.8 | ||
| 1.8 | ||
| 1.7 | ||
| 1.7 | ||
| 1.6 | ||
| 1.5 |
| For purposes of this report, sector sub-classifications may differ from those utilized by the Fund for compliance purposes. |
| Excludes short-term securities. |
Ten largest holdings
| Security(b) | Percent of Net Assets |
|
| 3.4 | % | |
| 2.7 | ||
| 1.9 | ||
| 1.9 | ||
| 1.8 | ||
| 1.8 | ||
| 1.7 | ||
| 1.7 | ||
| 1.6 | ||
| 1.5 |
This report describes changes to the Fund that occurred during the reporting period.
What were the Fund costs for the last year?
(based on a hypothetical $10,000 investment)
| Class name | Costs of a $10,000 investment |
Costs paid as a percentage of a $10,000 investment |
| $188 | 1.42% |
How did the Fund perform last year?
- For the reporting period ended May 31, 2026, the Fund's Class R Shares returned 64.95%.
- For the same period, the Fund’s benchmark, the MSCI All Country World Index (Net) returned 30.27% and the MSCI All-Country World Information Technology 10/40 Index (Net) returned 78.75%.
What contributed to performance?
The South Korean memory stock SK Hynix Co., Ltd. was the largest contributor to absolute performance. The shares rallied on expectations that the company would benefit from rising demand and a scarcity of memory brought about by the growth of artificial intelligence ("AI"). SK Hynix posted record 2025 results and reported that its high-bandwidth memory revenue more than doubled year-over-year. NVIDIA Corp. was also a top contributor to performance. The chip designer rose as AI data center demand translated to significant revenue growth.
What detracted from performance?
The Latin American e-commerce company MercadoLibre, Inc., which experienced falling profit margins due in part to rising investment in new initiatives, was the largest detractor from returns. Rubrik, Inc., a cybersecurity company, also detracted. The firm’s earnings guidance disappointed investors, leading to a compression in the stock’s valuation.
The views expressed reflect the opinions of BlackRock as of the date of this report and are subject to change based on changes in market, economic or other conditions. These views are not intended to be a forecast of future events and are no guarantee of future results.
Fund performance
Cumulative performance: June 1, 2016 through May 31, 2026
Initial investment of $10,000
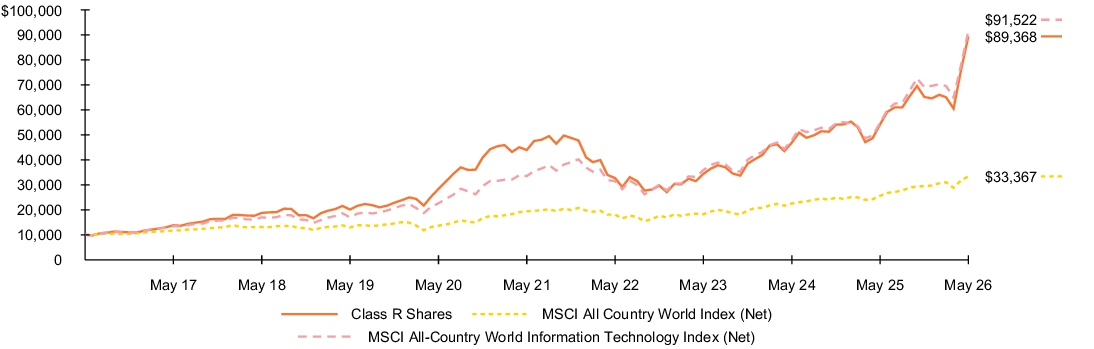
See “Average annual total returns” for additional information on fund performance.
Average annual total returns
| 1 Year | 5 Years | 10 Years | |||
| 64.95 | % | 15.26 | % | 24.49 | % |
| 30.27 | 11.45 | 12.81 | |||
| 78.75 | |||||
| 66.97 | 22.26 | 24.78 |
Key Fund statistics
| $8,655,718,230 |
| 70 |
| $51,368,651 |
| 57% |
What did the Fund invest in?
(as of May 31, 2026)
Industry allocation
| Industry(a) | Percent of Net Assets |
|
| 49.0 | % | |
| 13.5 | ||
| 13.5 | ||
| 6.0 | ||
| 4.1 | ||
| 3.3 | ||
| 2.1 | ||
| 2.0 | ||
| 1.8 | ||
| 1.8 | ||
| 3.3 | ||
| 0.7 | ||
| (1.1 | ) |
Ten largest holdings
| Security(b) | Percent of Net Assets |
|
| 9.7 | % | |
| 7.4 | ||
| 7.3 | ||
| 5.4 | ||
| 5.2 | ||
| 4.5 | ||
| 4.4 | ||
| 4.4 | ||
| 4.1 | ||
| 3.9 |
| For purposes of this report, industry sub-classifications may differ from those utilized by the Fund for compliance purposes. |
| Excludes short-term securities. |
| Ten largest industries are presented. Additional industries are found in Other. |
Ten largest holdings
| Security(b) | Percent of Net Assets |
|
| 9.7 | % | |
| 7.4 | ||
| 7.3 | ||
| 5.4 | ||
| 5.2 | ||
| 4.5 | ||
| 4.4 | ||
| 4.4 | ||
| 4.1 | ||
| 3.9 |
Material fund changes
This is a summary of planned changes to the Fund since May 31, 2025. For more complete information, you may review the Fund’s next prospectus, which we expect to be available approximately 120 days after May 31, 2026 at blackrock.com/fundreports or upon request by contacting us at (800) 441-7762.
Effective June 1, 2026, BlackRock Advisors, LLC has contractually agreed to cap the Fund’s total annual fund operating expenses after fee waiver to 1.39% as a percentage of the Fund’s average daily net assets through June 30, 2028.
Effective June 1, 2026, BlackRock Advisors, LLC has contractually agreed to cap the Fund’s total annual fund operating expenses after fee waiver to 1.39% as a percentage of the Fund’s average daily net assets through June 30, 2028.
This is a summary of planned changes to the Fund since May 31, 2025. For more complete information, you may review the Fund’s next prospectus, which we expect to be available approximately 120 days after May 31, 2026 at blackrock.com/fundreports or upon request by contacting us at (800) 441-7762.
This report describes changes to the Fund that occurred during the reporting period.
What were the Fund costs for the last year?
(based on a hypothetical $10,000 investment)
| Class name | Costs of a $10,000 investment |
Costs paid as a percentage of a $10,000 investment |
| $110 | 0.83% |
How did the Fund perform last year?
- For the reporting period ended May 31, 2026, the Fund's Class K Shares returned 65.88%.
- For the same period, the Fund’s benchmark, the MSCI All Country World Index (Net) returned 30.27% and the MSCI All-Country World Information Technology 10/40 Index (Net) returned 78.75%.
What contributed to performance?
The South Korean memory stock SK Hynix Co., Ltd. was the largest contributor to absolute performance. The shares rallied on expectations that the company would benefit from rising demand and a scarcity of memory brought about by the growth of artificial intelligence ("AI"). SK Hynix posted record 2025 results and reported that its high-bandwidth memory revenue more than doubled year-over-year. NVIDIA Corp. was also a top contributor to performance. The chip designer rose as AI data center demand translated to significant revenue growth.
What detracted from performance?
The Latin American e-commerce company MercadoLibre, Inc., which experienced falling profit margins due in part to rising investment in new initiatives, was the largest detractor from returns. Rubrik, Inc., a cybersecurity company, also detracted. The firm’s earnings guidance disappointed investors, leading to a compression in the stock’s valuation.
The views expressed reflect the opinions of BlackRock as of the date of this report and are subject to change based on changes in market, economic or other conditions. These views are not intended to be a forecast of future events and are no guarantee of future results.
Fund performance
Cumulative performance: June 1, 2016 through May 31, 2026
Initial investment of $10,000
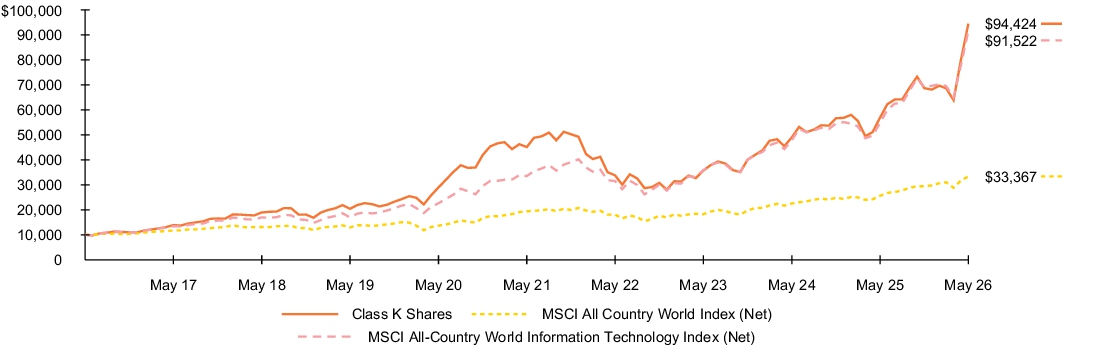
See “Average annual total returns” for additional information on fund performance.
Average annual total returns
| 1 Year | 5 Years | 10 Years | |||
| 65.88 | % | 15.92 | % | 25.17 | % |
| 30.27 | 11.45 | 12.81 | |||
| 78.75 | |||||
| 66.97 | 22.26 | 24.78 |
Key Fund statistics
| $8,655,718,230 |
| 70 |
| $51,368,651 |
| 57% |
What did the Fund invest in?
(as of May 31, 2026)
Industry allocation
| Industry(a) | Percent of Net Assets |
|
| 49.0 | % | |
| 13.5 | ||
| 13.5 | ||
| 6.0 | ||
| 4.1 | ||
| 3.3 | ||
| 2.1 | ||
| 2.0 | ||
| 1.8 | ||
| 1.8 | ||
| 3.3 | ||
| 0.7 | ||
| (1.1 | ) |
Ten largest holdings
| Security(b) | Percent of Net Assets |
|
| 9.7 | % | |
| 7.4 | ||
| 7.3 | ||
| 5.4 | ||
| 5.2 | ||
| 4.5 | ||
| 4.4 | ||
| 4.4 | ||
| 4.1 | ||
| 3.9 |
| For purposes of this report, industry sub-classifications may differ from those utilized by the Fund for compliance purposes. |
| Excludes short-term securities. |
| Ten largest industries are presented. Additional industries are found in Other. |
Ten largest holdings
| Security(b) | Percent of Net Assets |
|
| 9.7 | % | |
| 7.4 | ||
| 7.3 | ||
| 5.4 | ||
| 5.2 | ||
| 4.5 | ||
| 4.4 | ||
| 4.4 | ||
| 4.1 | ||
| 3.9 |
Material fund changes
This is a summary of planned changes to the Fund since May 31, 2025. For more complete information, you may review the Fund’s next prospectus, which we expect to be available approximately 120 days after May 31, 2026 at blackrock.com/fundreports or upon request by contacting us at (800) 441-7762.
Effective June 1, 2026, BlackRock Advisors, LLC has contractually agreed to cap the Fund’s total annual fund operating expenses after fee waiver to 0.84% as a percentage of the Fund’s average daily net assets through June 30, 2028.
Effective June 1, 2026, BlackRock Advisors, LLC has contractually agreed to cap the Fund’s total annual fund operating expenses after fee waiver to 0.84% as a percentage of the Fund’s average daily net assets through June 30, 2028.
This is a summary of planned changes to the Fund since May 31, 2025. For more complete information, you may review the Fund’s next prospectus, which we expect to be available approximately 120 days after May 31, 2026 at blackrock.com/fundreports or upon request by contacting us at (800) 441-7762.
This report describes changes to the Fund that occurred during the reporting period.
What were the Fund costs for the last year?
(based on a hypothetical $10,000 investment)
| Class name | Costs of a $10,000 investment |
Costs paid as a percentage of a $10,000 investment |
| $252 | 1.91% |
How did the Fund perform last year?
- For the reporting period ended May 31, 2026, the Fund's Investor C Shares returned 64.33%.
- For the same period, the Fund’s benchmark, the MSCI All Country World Index (Net) returned 30.27% and the MSCI All-Country World Information Technology 10/40 Index (Net) returned 78.75%.
What contributed to performance?
The South Korean memory stock SK Hynix Co., Ltd. was the largest contributor to absolute performance. The shares rallied on expectations that the company would benefit from rising demand and a scarcity of memory brought about by the growth of artificial intelligence ("AI"). SK Hynix posted record 2025 results and reported that its high-bandwidth memory revenue more than doubled year-over-year. NVIDIA Corp. was also a top contributor to performance. The chip designer rose as AI data center demand translated to significant revenue growth.
What detracted from performance?
The Latin American e-commerce company MercadoLibre, Inc., which experienced falling profit margins due in part to rising investment in new initiatives, was the largest detractor from returns. Rubrik, Inc., a cybersecurity company, also detracted. The firm’s earnings guidance disappointed investors, leading to a compression in the stock’s valuation.
The views expressed reflect the opinions of BlackRock as of the date of this report and are subject to change based on changes in market, economic or other conditions. These views are not intended to be a forecast of future events and are no guarantee of future results.
Fund performance
Cumulative performance: June 1, 2016 through May 31, 2026
Initial investment of $10,000
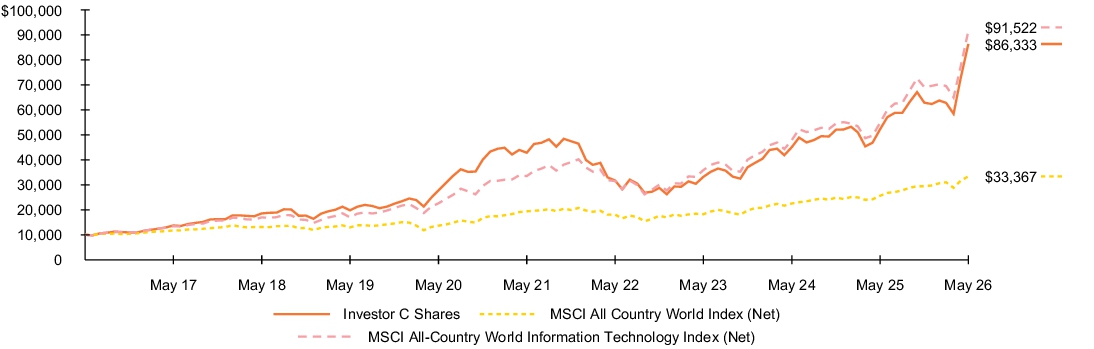
See “Average annual total returns” for additional information on fund performance.
Average annual total returns
| 1 Year | 5 Years | 10 Years | |||
| 64.33 | % | 14.73 | % | 24.06 | % |
| 63.33 | 14.73 | 24.06 | |||
| 30.27 | 11.45 | 12.81 | |||
| 78.75 | |||||
| 66.97 | 22.26 | 24.78 |
Key Fund statistics
| $8,655,718,230 |
| 70 |
| $51,368,651 |
| 57% |
What did the Fund invest in?
(as of May 31, 2026)
Industry allocation
| Industry(a) | Percent of Net Assets |
|
| 49.0 | % | |
| 13.5 | ||
| 13.5 | ||
| 6.0 | ||
| 4.1 | ||
| 3.3 | ||
| 2.1 | ||
| 2.0 | ||
| 1.8 | ||
| 1.8 | ||
| 3.3 | ||
| 0.7 | ||
| (1.1 | ) |
Ten largest holdings
| Security(b) | Percent of Net Assets |
|
| 9.7 | % | |
| 7.4 | ||
| 7.3 | ||
| 5.4 | ||
| 5.2 | ||
| 4.5 | ||
| 4.4 | ||
| 4.4 | ||
| 4.1 | ||
| 3.9 |
| For purposes of this report, industry sub-classifications may differ from those utilized by the Fund for compliance purposes. |
| Excludes short-term securities. |
| Ten largest industries are presented. Additional industries are found in Other. |
Ten largest holdings
| Security(b) | Percent of Net Assets |
|
| 9.7 | % | |
| 7.4 | ||
| 7.3 | ||
| 5.4 | ||
| 5.2 | ||
| 4.5 | ||
| 4.4 | ||
| 4.4 | ||
| 4.1 | ||
| 3.9 |
Material fund changes
This is a summary of planned changes to the Fund since May 31, 2025. For more complete information, you may review the Fund’s next prospectus, which we expect to be available approximately 120 days after May 31, 2026 at blackrock.com/fundreports or upon request by contacting us at (800) 441-7762.
Effective June 1, 2026, BlackRock Advisors, LLC has contractually agreed to cap the Fund’s total annual fund operating expenses after fee waiver to 1.89% as a percentage of the Fund’s average daily net assets through June 30, 2028.
Effective June 1, 2026, BlackRock Advisors, LLC has contractually agreed to cap the Fund’s total annual fund operating expenses after fee waiver to 1.89% as a percentage of the Fund’s average daily net assets through June 30, 2028.
This is a summary of planned changes to the Fund since May 31, 2025. For more complete information, you may review the Fund’s next prospectus, which we expect to be available approximately 120 days after May 31, 2026 at blackrock.com/fundreports or upon request by contacting us at (800) 441-7762.
This report describes changes to the Fund that occurred during the reporting period.
What were the Fund costs for the last year?
(based on a hypothetical $10,000 investment)
| Class name | Costs of a $10,000 investment |
Costs paid as a percentage of a $10,000 investment |
| $155 | 1.17% |
How did the Fund perform last year?
- For the reporting period ended May 31, 2026, the Fund's Investor A Shares returned 65.35%.
- For the same period, the Fund’s benchmark, the MSCI All Country World Index (Net) returned 30.27% and the MSCI All-Country World Information Technology 10/40 Index (Net) returned 78.75%.
What contributed to performance?
The South Korean memory stock SK Hynix Co., Ltd. was the largest contributor to absolute performance. The shares rallied on expectations that the company would benefit from rising demand and a scarcity of memory brought about by the growth of artificial intelligence ("AI"). SK Hynix posted record 2025 results and reported that its high-bandwidth memory revenue more than doubled year-over-year. NVIDIA Corp. was also a top contributor to performance. The chip designer rose as AI data center demand translated to significant revenue growth.
What detracted from performance?
The Latin American e-commerce company MercadoLibre, Inc., which experienced falling profit margins due in part to rising investment in new initiatives, was the largest detractor from returns. Rubrik, Inc., a cybersecurity company, also detracted. The firm’s earnings guidance disappointed investors, leading to a compression in the stock’s valuation.
The views expressed reflect the opinions of BlackRock as of the date of this report and are subject to change based on changes in market, economic or other conditions. These views are not intended to be a forecast of future events and are no guarantee of future results.
Fund performance
Cumulative performance: June 1, 2016 through May 31, 2026
Initial investment of $10,000
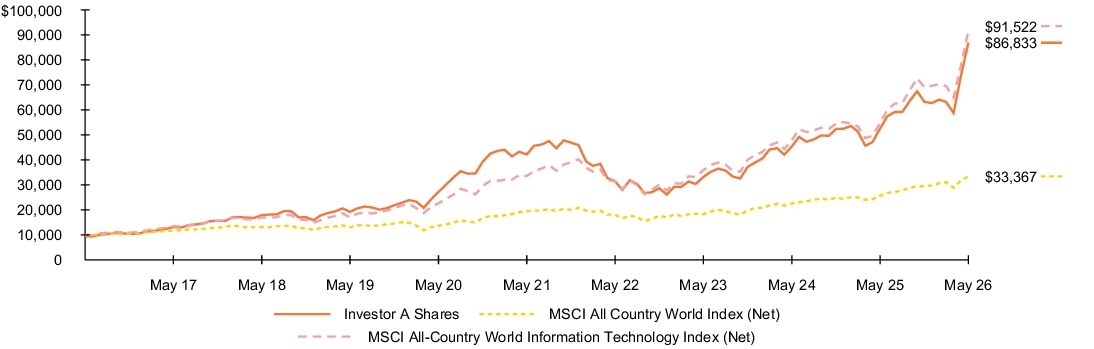
See “Average annual total returns” for additional information on fund performance.
Average annual total returns
| 1 Year | 5 Years | 10 Years | |||
| 65.35 | % | 15.55 | % | 24.80 | % |
| 56.66 | 14.31 | 24.13 | |||
| 30.27 | 11.45 | 12.81 | |||
| 78.75 | |||||
| 66.97 | 22.26 | 24.78 |
Key Fund statistics
| $8,655,718,230 |
| 70 |
| $51,368,651 |
| 57% |
What did the Fund invest in?
(as of May 31, 2026)
Industry allocation
| Industry(a) | Percent of Net Assets |
|
| 49.0 | % | |
| 13.5 | ||
| 13.5 | ||
| 6.0 | ||
| 4.1 | ||
| 3.3 | ||
| 2.1 | ||
| 2.0 | ||
| 1.8 | ||
| 1.8 | ||
| 3.3 | ||
| 0.7 | ||
| (1.1 | ) |
Ten largest holdings
| Security(b) | Percent of Net Assets |
|
| 9.7 | % | |
| 7.4 | ||
| 7.3 | ||
| 5.4 | ||
| 5.2 | ||
| 4.5 | ||
| 4.4 | ||
| 4.4 | ||
| 4.1 | ||
| 3.9 |
| For purposes of this report, industry sub-classifications may differ from those utilized by the Fund for compliance purposes. |
| Excludes short-term securities. |
| Ten largest industries are presented. Additional industries are found in Other. |
Ten largest holdings
| Security(b) | Percent of Net Assets |
|
| 9.7 | % | |
| 7.4 | ||
| 7.3 | ||
| 5.4 | ||
| 5.2 | ||
| 4.5 | ||
| 4.4 | ||
| 4.4 | ||
| 4.1 | ||
| 3.9 |
Material fund changes
This is a summary of planned changes to the Fund since May 31, 2025. For more complete information, you may review the Fund’s next prospectus, which we expect to be available approximately 120 days after May 31, 2026 at blackrock.com/fundreports or upon request by contacting us at (800) 441-7762.
Effective June 1, 2026, BlackRock Advisors, LLC has contractually agreed to cap the Fund’s total annual fund operating expenses after fee waiver to 1.14% as a percentage of the Fund’s average daily net assets through June 30, 2028.
Effective June 1, 2026, BlackRock Advisors, LLC has contractually agreed to cap the Fund’s total annual fund operating expenses after fee waiver to 1.14% as a percentage of the Fund’s average daily net assets through June 30, 2028.
This is a summary of planned changes to the Fund since May 31, 2025. For more complete information, you may review the Fund’s next prospectus, which we expect to be available approximately 120 days after May 31, 2026 at blackrock.com/fundreports or upon request by contacting us at (800) 441-7762.
This report describes changes to the Fund that occurred during the reporting period.
What were the Fund costs for the last year?
(based on a hypothetical $10,000 investment)
| Class name | Costs of a $10,000 investment |
Costs paid as a percentage of a $10,000 investment |
| $155 | 1.17% |
How did the Fund perform last year?
- For the reporting period ended May 31, 2026, the Fund's Service Shares returned 65.35%.
- For the same period, the Fund’s benchmark, the MSCI All Country World Index (Net) returned 30.27% and the MSCI All-Country World Information Technology 10/40 Index (Net) returned 78.75%.
What contributed to performance?
The South Korean memory stock SK Hynix Co., Ltd. was the largest contributor to absolute performance. The shares rallied on expectations that the company would benefit from rising demand and a scarcity of memory brought about by the growth of artificial intelligence ("AI"). SK Hynix posted record 2025 results and reported that its high-bandwidth memory revenue more than doubled year-over-year. NVIDIA Corp. was also a top contributor to performance. The chip designer rose as AI data center demand translated to significant revenue growth.
What detracted from performance?
The Latin American e-commerce company MercadoLibre, Inc., which experienced falling profit margins due in part to rising investment in new initiatives, was the largest detractor from returns. Rubrik, Inc., a cybersecurity company, also detracted. The firm’s earnings guidance disappointed investors, leading to a compression in the stock’s valuation.
The views expressed reflect the opinions of BlackRock as of the date of this report and are subject to change based on changes in market, economic or other conditions. These views are not intended to be a forecast of future events and are no guarantee of future results.
Fund performance
Cumulative performance: June 1, 2016 through May 31, 2026
Initial investment of $10,000
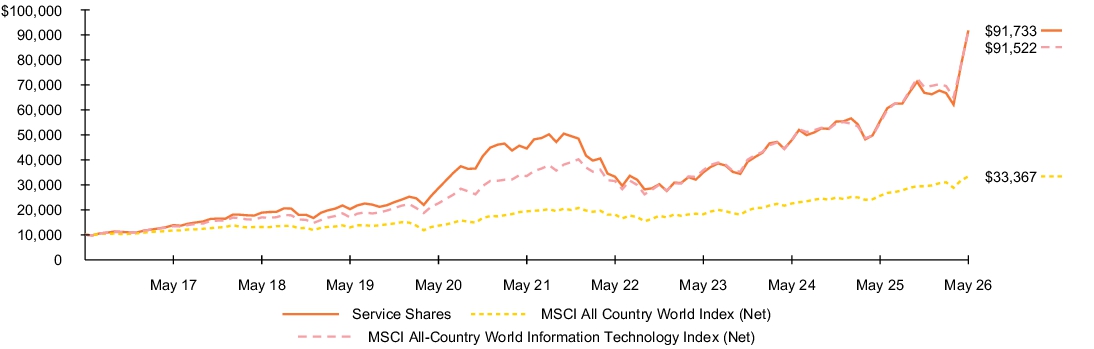
See “Average annual total returns” for additional information on fund performance.
Average annual total returns
| 1 Year | 5 Years | 10 Years | |||
| 65.35 | % | 15.55 | % | 24.81 | % |
| 30.27 | 11.45 | 12.81 | |||
| 78.75 | |||||
| 66.97 | 22.26 | 24.78 |
Key Fund statistics
| $8,655,718,230 |
| 70 |
| $51,368,651 |
| 57% |
What did the Fund invest in?
(as of May 31, 2026)
Industry allocation
| Industry(a) | Percent of Net Assets |
|
| 49.0 | % | |
| 13.5 | ||
| 13.5 | ||
| 6.0 | ||
| 4.1 | ||
| 3.3 | ||
| 2.1 | ||
| 2.0 | ||
| 1.8 | ||
| 1.8 | ||
| 3.3 | ||
| 0.7 | ||
| (1.1 | ) |
Ten largest holdings
| Security(b) | Percent of Net Assets |
|
| 9.7 | % | |
| 7.4 | ||
| 7.3 | ||
| 5.4 | ||
| 5.2 | ||
| 4.5 | ||
| 4.4 | ||
| 4.4 | ||
| 4.1 | ||
| 3.9 |
| For purposes of this report, industry sub-classifications may differ from those utilized by the Fund for compliance purposes. |
| Excludes short-term securities. |
| Ten largest industries are presented. Additional industries are found in Other. |
Ten largest holdings
| Security(b) | Percent of Net Assets |
|
| 9.7 | % | |
| 7.4 | ||
| 7.3 | ||
| 5.4 | ||
| 5.2 | ||
| 4.5 | ||
| 4.4 | ||
| 4.4 | ||
| 4.1 | ||
| 3.9 |
Material fund changes
This is a summary of planned changes to the Fund since May 31, 2025. For more complete information, you may review the Fund’s next prospectus, which we expect to be available approximately 120 days after May 31, 2026 at blackrock.com/fundreports or upon request by contacting us at (800) 441-7762.
Effective June 1, 2026, BlackRock Advisors, LLC has contractually agreed to cap the Fund’s total annual fund operating expenses after fee waiver to 1.14% as a percentage of the Fund’s average daily net assets through June 30, 2028.
Effective June 1, 2026, BlackRock Advisors, LLC has contractually agreed to cap the Fund’s total annual fund operating expenses after fee waiver to 1.14% as a percentage of the Fund’s average daily net assets through June 30, 2028.
This is a summary of planned changes to the Fund since May 31, 2025. For more complete information, you may review the Fund’s next prospectus, which we expect to be available approximately 120 days after May 31, 2026 at blackrock.com/fundreports or upon request by contacting us at (800) 441-7762.
This report describes changes to the Fund that occurred during the reporting period.
What were the Fund costs for the last year?
(based on a hypothetical $10,000 investment)
| Class name | Costs of a $10,000 investment |
Costs paid as a percentage of a $10,000 investment |
| $122 | 0.92% |
How did the Fund perform last year?
- For the reporting period ended May 31, 2026, the Fund's Institutional Shares returned 65.73%.
- For the same period, the Fund’s benchmark, the MSCI All Country World Index (Net) returned 30.27% and the MSCI All-Country World Information Technology 10/40 Index (Net) returned 78.75%.
What contributed to performance?
The South Korean memory stock SK Hynix Co., Ltd. was the largest contributor to absolute performance. The shares rallied on expectations that the company would benefit from rising demand and a scarcity of memory brought about by the growth of artificial intelligence ("AI"). SK Hynix posted record 2025 results and reported that its high-bandwidth memory revenue more than doubled year-over-year. NVIDIA Corp. was also a top contributor to performance. The chip designer rose as AI data center demand translated to significant revenue growth.
What detracted from performance?
The Latin American e-commerce company MercadoLibre, Inc., which experienced falling profit margins due in part to rising investment in new initiatives, was the largest detractor from returns. Rubrik, Inc., a cybersecurity company, also detracted. The firm’s earnings guidance disappointed investors, leading to a compression in the stock’s valuation.
The views expressed reflect the opinions of BlackRock as of the date of this report and are subject to change based on changes in market, economic or other conditions. These views are not intended to be a forecast of future events and are no guarantee of future results.
Fund performance
Cumulative performance: June 1, 2016 through May 31, 2026
Initial investment of $10,000
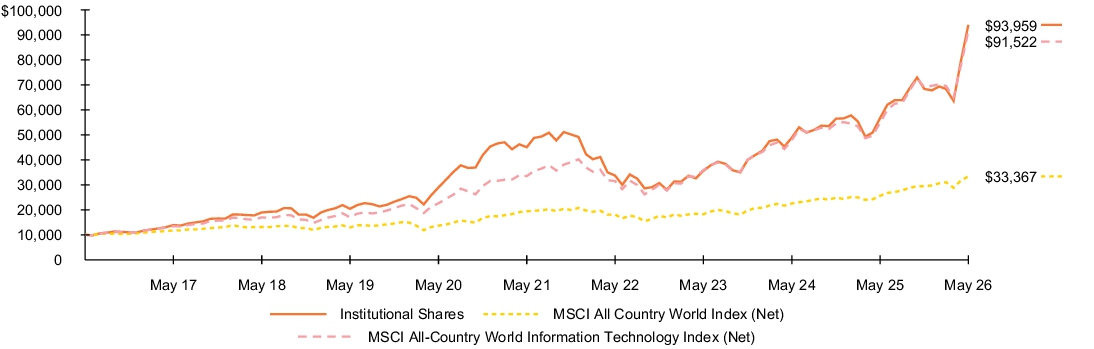
See “Average annual total returns” for additional information on fund performance.
Average annual total returns
| 1 Year | 5 Years | 10 Years | |||
| 65.73 | % | 15.83 | % | 25.11 | % |
| 30.27 | 11.45 | 12.81 | |||
| 78.75 | |||||
| 66.97 | 22.26 | 24.78 |
Key Fund statistics
| $8,655,718,230 |
| 70 |
| $51,368,651 |
| 57% |
What did the Fund invest in?
(as of May 31, 2026)
Industry allocation
| Industry(a) | Percent of Net Assets |
|
| 49.0 | % | |
| 13.5 | ||
| 13.5 | ||
| 6.0 | ||
| 4.1 | ||
| 3.3 | ||
| 2.1 | ||
| 2.0 | ||
| 1.8 | ||
| 1.8 | ||
| 3.3 | ||
| 0.7 | ||
| (1.1 | ) |
Ten largest holdings
| Security(b) | Percent of Net Assets |
|
| 9.7 | % | |
| 7.4 | ||
| 7.3 | ||
| 5.4 | ||
| 5.2 | ||
| 4.5 | ||
| 4.4 | ||
| 4.4 | ||
| 4.1 | ||
| 3.9 |
| For purposes of this report, industry sub-classifications may differ from those utilized by the Fund for compliance purposes. |
| Excludes short-term securities. |
| Ten largest industries are presented. Additional industries are found in Other. |
Ten largest holdings
| Security(b) | Percent of Net Assets |
|
| 9.7 | % | |
| 7.4 | ||
| 7.3 | ||
| 5.4 | ||
| 5.2 | ||
| 4.5 | ||
| 4.4 | ||
| 4.4 | ||
| 4.1 | ||
| 3.9 |
Material fund changes
This is a summary of planned changes to the Fund since May 31, 2025. For more complete information, you may review the Fund’s next prospectus, which we expect to be available approximately 120 days after May 31, 2026 at blackrock.com/fundreports or upon request by contacting us at (800) 441-7762.
Effective June 1, 2026, BlackRock Advisors, LLC has contractually agreed to cap the Fund’s total annual fund operating expenses after fee waiver to 0.89% as a percentage of the Fund’s average daily net assets through June 30, 2028.
This is a summary of planned changes to the Fund since May 31, 2025. For more complete information, you may review the Fund’s next prospectus, which we expect to be available approximately 120 days after May 31, 2026 at blackrock.com/fundreports or upon request by contacting us at (800) 441-7762.
What were the Fund costs for the last year?
(based on a hypothetical $10,000 investment)
| Class name | Costs of a $10,000 investment |
Costs paid as a percentage of a $10,000 investment |
| $111 | 0.92% |
How did the Fund perform last year?
- For the reporting period ended May 31, 2026, the Fund's Institutional Shares returned 41.23%.
- For the same period, the Fund’s benchmark, the MSCI All Country World Index (Net) returned 30.27% and the MSCI World Energy Index (Net) returned 43.63%.
What contributed to performance?
The Fund’s holdings in integrated oil companies were notable contributors to absolute performance, as higher oil prices underpinned rising cash flows and return of capital via dividends and share buybacks. The most notable contributors included the integrated oil companies Exxon Mobil Corp., Chevron Corp., TotalEnergies SE, and Shell PLC. Investors responded favorably to the companies’ strong operating cash flows and continued shareholder distributions, as well as their disciplined capital spending, balance sheet strength, and production growth from high-quality assets. Exxon Mobil was further supported by robust production growth and synergies from its purchase of Pioneer Natural Resources, while Chevron’s acquisition of Hess provided exposure to the highly attractive Guyana oil fields.
What detracted from performance?
The LNG distribution company Cheniere Energy, Inc. was the largest detractor from absolute performance. Cheniere lagged due to weaker LNG market sentiment in the second half of 2025, when significant expected increases in supply weighed on investor expectations for LNG pricing. Although LNG demand increased following the start of the war with Iran, the stock subsequently fell from its late March high due to certain elements of its earnings report. The E&P company ARC Resources, Ltd. also detracted, as weaker North American natural gas prices weighed on earnings expectations and investor sentiment. The Fund exited the position during the period. The integrated oil company Galp Energia, SGPS, S.A., whose shares came under pressure due to its sale of an asset at terms investors viewed unfavorably, was an additional detractor of note.
The views expressed reflect the opinions of BlackRock as of the date of this report and are subject to change based on changes in market, economic or other conditions. These views are not intended to be a forecast of future events and are no guarantee of future results.
Fund performance
Cumulative performance: June 1, 2016 through May 31, 2026
Initial investment of $10,000
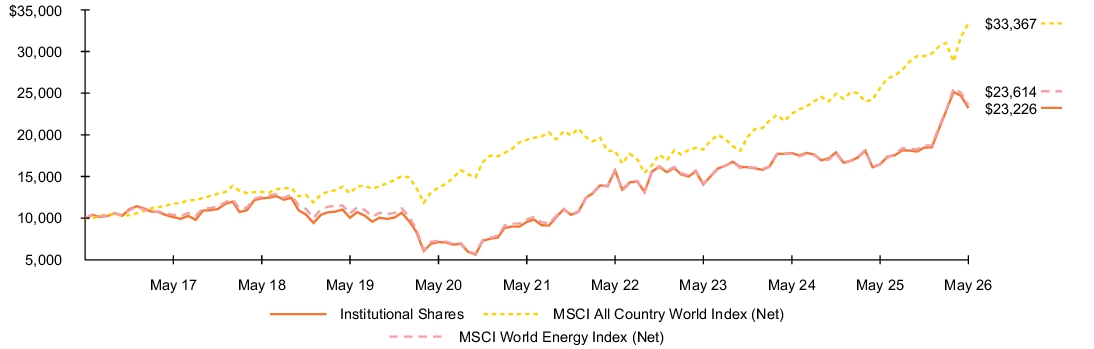
See “Average annual total returns” for additional information on fund performance.
Average annual total returns
| 1 Year | 5 Years | 10 Years | |||
| 41.23 | % | 19.49 | % | 8.79 | % |
| 30.27 | 11.45 | 12.81 | |||
| 43.63 | 19.12 | 8.97 |
Key Fund statistics
| $350,072,275 |
| 31 |
| $2,245,864 |
| 38% |
What did the Fund invest in?
(as of May 31, 2026)
Industry allocation
| Industry(a) | Percent of Net Assets |
|
| 90.6 | % | |
| 6.2 | ||
| 1.6 | ||
| 1.3 | ||
| 0.3 |
Ten largest holdings
| Security(b) | Percent of Net Assets |
|
| 18.7 | % | |
| 11.2 | ||
| 9.8 | ||
| 7.0 | ||
| 4.4 | ||
| 4.2 | ||
| 4.0 | ||
| 4.0 | ||
| 3.9 | ||
| 3.5 |
| For purposes of this report, industry sub-classifications may differ from those utilized by the Fund for compliance purposes. |
| Excludes short-term securities. |
Ten largest holdings
| Security(b) | Percent of Net Assets |
|
| 18.7 | % | |
| 11.2 | ||
| 9.8 | ||
| 7.0 | ||
| 4.4 | ||
| 4.2 | ||
| 4.0 | ||
| 4.0 | ||
| 3.9 | ||
| 3.5 |
What were the Fund costs for the last year?
(based on a hypothetical $10,000 investment)
| Class name | Costs of a $10,000 investment |
Costs paid as a percentage of a $10,000 investment |
| $159 | 1.32% |
How did the Fund perform last year?
- For the reporting period ended May 31, 2026, the Fund's Investor A Shares returned 40.67%.
- For the same period, the Fund’s benchmark, the MSCI All Country World Index (Net) returned 30.27% and the MSCI World Energy Index (Net) returned 43.63%.
What contributed to performance?
The Fund’s holdings in integrated oil companies were notable contributors to absolute performance, as higher oil prices underpinned rising cash flows and return of capital via dividends and share buybacks. The most notable contributors included the integrated oil companies Exxon Mobil Corp., Chevron Corp., TotalEnergies SE, and Shell PLC. Investors responded favorably to the companies’ strong operating cash flows and continued shareholder distributions, as well as their disciplined capital spending, balance sheet strength, and production growth from high-quality assets. Exxon Mobil was further supported by robust production growth and synergies from its purchase of Pioneer Natural Resources, while Chevron’s acquisition of Hess provided exposure to the highly attractive Guyana oil fields.
What detracted from performance?
The LNG distribution company Cheniere Energy, Inc. was the largest detractor from absolute performance. Cheniere lagged due to weaker LNG market sentiment in the second half of 2025, when significant expected increases in supply weighed on investor expectations for LNG pricing. Although LNG demand increased following the start of the war with Iran, the stock subsequently fell from its late March high due to certain elements of its earnings report. The E&P company ARC Resources, Ltd. also detracted, as weaker North American natural gas prices weighed on earnings expectations and investor sentiment. The Fund exited the position during the period. The integrated oil company Galp Energia, SGPS, S.A., whose shares came under pressure due to its sale of an asset at terms investors viewed unfavorably, was an additional detractor of note.
The views expressed reflect the opinions of BlackRock as of the date of this report and are subject to change based on changes in market, economic or other conditions. These views are not intended to be a forecast of future events and are no guarantee of future results.
Fund performance
Cumulative performance: June 1, 2016 through May 31, 2026
Initial investment of $10,000
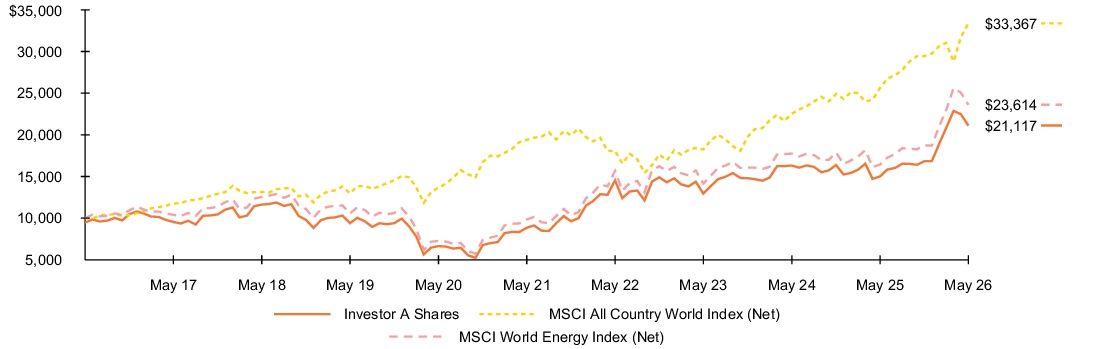
See “Average annual total returns” for additional information on fund performance.
Average annual total returns
| 1 Year | 5 Years | 10 Years | |||
| 40.67 | % | 19.00 | % | 8.34 | % |
| 33.28 | 17.73 | 7.76 | |||
| 30.27 | 11.45 | 12.81 | |||
| 43.63 | 19.12 | 8.97 |
Key Fund statistics
| $350,072,275 |
| 31 |
| $2,245,864 |
| 38% |
What did the Fund invest in?
(as of May 31, 2026)
Industry allocation
| Industry(a) | Percent of Net Assets |
|
| 90.6 | % | |
| 6.2 | ||
| 1.6 | ||
| 1.3 | ||
| 0.3 |
Ten largest holdings
| Security(b) | Percent of Net Assets |
|
| 18.7 | % | |
| 11.2 | ||
| 9.8 | ||
| 7.0 | ||
| 4.4 | ||
| 4.2 | ||
| 4.0 | ||
| 4.0 | ||
| 3.9 | ||
| 3.5 |
| For purposes of this report, industry sub-classifications may differ from those utilized by the Fund for compliance purposes. |
| Excludes short-term securities. |
Ten largest holdings
| Security(b) | Percent of Net Assets |
|
| 18.7 | % | |
| 11.2 | ||
| 9.8 | ||
| 7.0 | ||
| 4.4 | ||
| 4.2 | ||
| 4.0 | ||
| 4.0 | ||
| 3.9 | ||
| 3.5 |
What were the Fund costs for the last year?
(based on a hypothetical $10,000 investment)
| Class name | Costs of a $10,000 investment |
Costs paid as a percentage of a $10,000 investment |
| $246 | 2.05% |
How did the Fund perform last year?
- For the reporting period ended May 31, 2026, the Fund's Investor C Shares returned 39.72%.
- For the same period, the Fund’s benchmark, the MSCI All Country World Index (Net) returned 30.27% and the MSCI World Energy Index (Net) returned 43.63%.
What contributed to performance?
The Fund’s holdings in integrated oil companies were notable contributors to absolute performance, as higher oil prices underpinned rising cash flows and return of capital via dividends and share buybacks. The most notable contributors included the integrated oil companies Exxon Mobil Corp., Chevron Corp., TotalEnergies SE, and Shell PLC. Investors responded favorably to the companies’ strong operating cash flows and continued shareholder distributions, as well as their disciplined capital spending, balance sheet strength, and production growth from high-quality assets. Exxon Mobil was further supported by robust production growth and synergies from its purchase of Pioneer Natural Resources, while Chevron’s acquisition of Hess provided exposure to the highly attractive Guyana oil fields.
What detracted from performance?
The LNG distribution company Cheniere Energy, Inc. was the largest detractor from absolute performance. Cheniere lagged due to weaker LNG market sentiment in the second half of 2025, when significant expected increases in supply weighed on investor expectations for LNG pricing. Although LNG demand increased following the start of the war with Iran, the stock subsequently fell from its late March high due to certain elements of its earnings report. The E&P company ARC Resources, Ltd. also detracted, as weaker North American natural gas prices weighed on earnings expectations and investor sentiment. The Fund exited the position during the period. The integrated oil company Galp Energia, SGPS, S.A., whose shares came under pressure due to its sale of an asset at terms investors viewed unfavorably, was an additional detractor of note.
The views expressed reflect the opinions of BlackRock as of the date of this report and are subject to change based on changes in market, economic or other conditions. These views are not intended to be a forecast of future events and are no guarantee of future results.
Fund performance
Cumulative performance: June 1, 2016 through May 31, 2026
Initial investment of $10,000
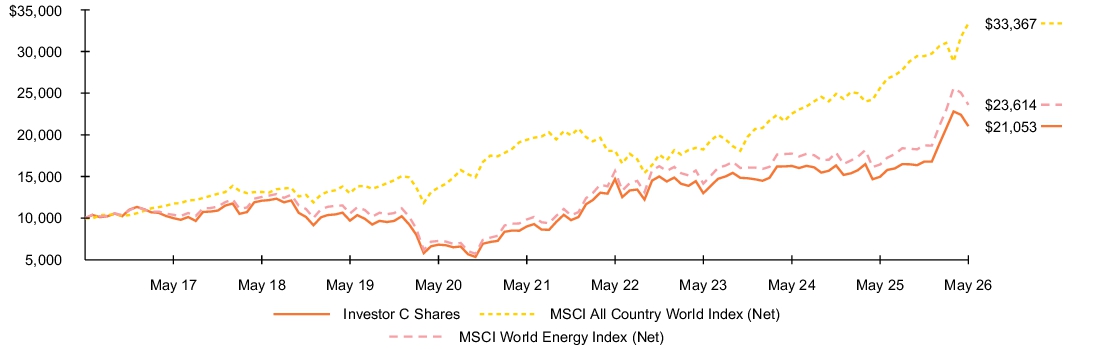
See “Average annual total returns” for additional information on fund performance.
Average annual total returns
| 1 Year | 5 Years | 10 Years | |||
| 39.72 | % | 18.18 | % | 7.73 | % |
| 38.72 | 18.18 | 7.73 | |||
| 30.27 | 11.45 | 12.81 | |||
| 43.63 | 19.12 | 8.97 |
Key Fund statistics
| $350,072,275 |
| 31 |
| $2,245,864 |
| 38% |
What did the Fund invest in?
(as of May 31, 2026)
Industry allocation
| Industry(a) | Percent of Net Assets |
|
| 90.6 | % | |
| 6.2 | ||
| 1.6 | ||
| 1.3 | ||
| 0.3 |
Ten largest holdings
| Security(b) | Percent of Net Assets |
|
| 18.7 | % | |
| 11.2 | ||
| 9.8 | ||
| 7.0 | ||
| 4.4 | ||
| 4.2 | ||
| 4.0 | ||
| 4.0 | ||
| 3.9 | ||
| 3.5 |
| For purposes of this report, industry sub-classifications may differ from those utilized by the Fund for compliance purposes. |
| Excludes short-term securities. |
Ten largest holdings
| Security(b) | Percent of Net Assets |
|
| 18.7 | % | |
| 11.2 | ||
| 9.8 | ||
| 7.0 | ||
| 4.4 | ||
| 4.2 | ||
| 4.0 | ||
| 4.0 | ||
| 3.9 | ||
| 3.5 |
This report describes changes to the Fund that occurred during the reporting period.
What were the Fund costs for the last year?
(based on a hypothetical $10,000 investment)
| Class name | Costs of a $10,000 investment |
Costs paid as a percentage of a $10,000 investment |
| $133 | 1.12% |
How did the Fund perform last year?
- For the reporting period ended May 31, 2026, the Fund's Class R Shares returned 36.62%.
- For the same period, the Fund’s benchmark, the Russell 1000 Index returned 28.85% and the Russell 1000 Growth Index returned 28.66%.
What contributed to performance?
Positioning in information technology was the largest contributor to Fund performance during the reporting period, driven primarily by successful stock selection in semiconductor and technology hardware companies that benefited from continued investment in artificial intelligence infrastructure and innovation-related spending. Industry and macroeconomic-based insights were particularly effective in identifying areas of the technology sector positioned to benefit from these favorable industry dynamics. Within communication services, consumer discretionary, industrials, healthcare and financials, holdings were supported by resilient earnings growth, favorable business trends and strong operating performance. Sentiment, fundamental, and theme-based insights further contributed by identifying companies with attractive growth prospects, research investment, profitability and earnings quality.
What detracted from performance?
While the Fund generated strong returns during the reporting period, several signals modestly offset otherwise positive performance. In particular, measures tied to growth expectations and consumer behavior trends underperformed. In addition, certain thematic and market-timing signals struggled as market leadership evolved differently than anticipated.
The views expressed reflect the opinions of BlackRock as of the date of this report and are subject to change based on changes in market, economic or other conditions. These views are not intended to be a forecast of future events and are no guarantee of future results.
Fund performance
Cumulative performance: June 1, 2016 through May 31, 2026
Initial investment of $10,000
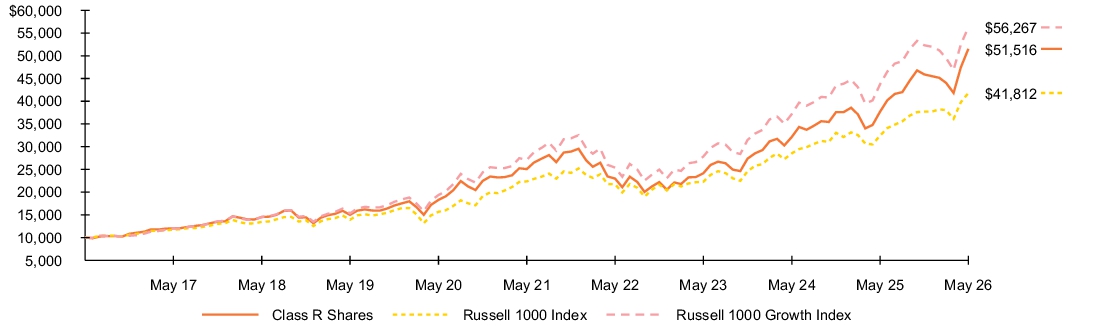
See “Average annual total returns” for additional information on fund performance.
Average annual total returns
| 1 Year | 5 Years | 10 Years | |||
| 36.62 | % | 15.49 | % | 17.81 | % |
| 28.85 | 13.33 | 15.38 | |||
| 28.66 | 15.73 | 18.86 |
Key Fund statistics
| $1,933,605,456 |
| 160 |
| $7,978,953 |
| 98% |
What did the Fund invest in?
(as of May 31, 2026)
Sector allocation
| Sector(a) | Percent of Net Assets |
|
| 51.4 | % | |
| 13.5 | ||
| 10.9 | ||
| 7.0 | ||
| 6.7 | ||
| 5.5 | ||
| 2.7 | ||
| 0.4 | ||
| 0.1 | ||
| 1.1 | ||
| 0.7 |
Ten largest holdings
| Security(b) | Percent of Net Assets |
|
| 9.1 | % | |
| 7.2 | ||
| 6.5 | ||
| 5.8 | ||
| 4.8 | ||
| 3.9 | ||
| 3.9 | ||
| 3.1 | ||
| 2.9 | ||
| 2.9 |
| For purposes of this report, sector sub-classifications may differ from those utilized by the Fund for compliance purposes. |
| Excludes short-term securities. |
Ten largest holdings
| Security(b) | Percent of Net Assets |
|
| 9.1 | % | |
| 7.2 | ||
| 6.5 | ||
| 5.8 | ||
| 4.8 | ||
| 3.9 | ||
| 3.9 | ||
| 3.1 | ||
| 2.9 | ||
| 2.9 |
Material fund changes
This is a summary of certain changes to the Fund since May 31, 2025. For more complete information, you may review the Fund’s next prospectus, which we expect to be available approximately 120 days after May 31, 2026 at blackrock.com/fundreports or upon request by contacting us at (800) 441-7762.
The Fund’s Board approved changes to the Fund’s investment strategies and investment process to under normal circumstances, invest at least 80% of its net assets, plus the amount of any borrowings for investment purposes, in large cap growth equity securities of U.S. issuers and derivatives that provide investment exposure to such securities or to one or more market risk factors associated with such securities. These changes became effective on September 26, 2025.
The Fund’s Board approved changes to the Fund’s investment strategies and investment process to under normal circumstances, invest at least 80% of its net assets, plus the amount of any borrowings for investment purposes, in large cap growth equity securities of U.S. issuers and derivatives that provide investment exposure to such securities or to one or more market risk factors associated with such securities. These changes became effective on September 26, 2025.
This is a summary of certain changes to the Fund since May 31, 2025. For more complete information, you may review the Fund’s next prospectus, which we expect to be available approximately 120 days after May 31, 2026 at blackrock.com/fundreports or upon request by contacting us at (800) 441-7762.
This report describes changes to the Fund that occurred during the reporting period.
What were the Fund costs for the last year?
(based on a hypothetical $10,000 investment)
| Class name | Costs of a $10,000 investment |
Costs paid as a percentage of a $10,000 investment |
| $68 | 0.57% |
How did the Fund perform last year?
- For the reporting period ended May 31, 2026, the Fund's Class K Shares returned 37.40%.
- For the same period, the Fund’s benchmark, the Russell 1000 Index returned 28.85% and the Russell 1000 Growth Index returned 28.66%.
What contributed to performance?
Positioning in information technology was the largest contributor to Fund performance during the reporting period, driven primarily by successful stock selection in semiconductor and technology hardware companies that benefited from continued investment in artificial intelligence infrastructure and innovation-related spending. Industry and macroeconomic-based insights were particularly effective in identifying areas of the technology sector positioned to benefit from these favorable industry dynamics. Within communication services, consumer discretionary, industrials, healthcare and financials, holdings were supported by resilient earnings growth, favorable business trends and strong operating performance. Sentiment, fundamental, and theme-based insights further contributed by identifying companies with attractive growth prospects, research investment, profitability and earnings quality.
What detracted from performance?
While the Fund generated strong returns during the reporting period, several signals modestly offset otherwise positive performance. In particular, measures tied to growth expectations and consumer behavior trends underperformed. In addition, certain thematic and market-timing signals struggled as market leadership evolved differently than anticipated.
The views expressed reflect the opinions of BlackRock as of the date of this report and are subject to change based on changes in market, economic or other conditions. These views are not intended to be a forecast of future events and are no guarantee of future results.
Fund performance
Cumulative performance: June 1, 2016 through May 31, 2026
Initial investment of $10,000
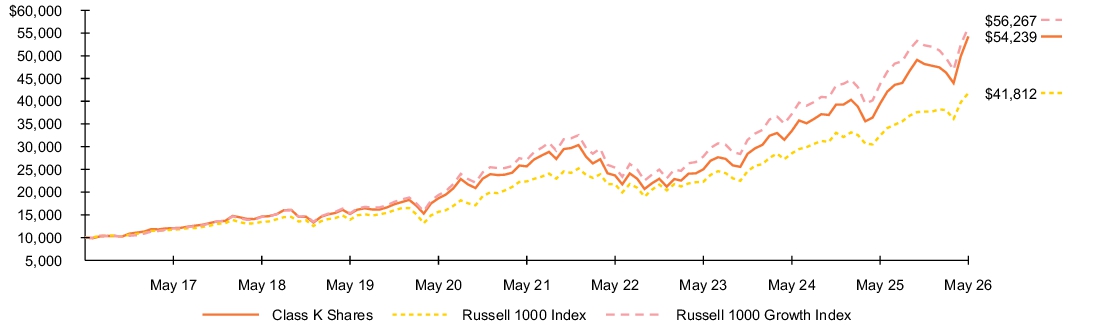
See “Average annual total returns” for additional information on fund performance.
Average annual total returns
| 1 Year | 5 Years | 10 Years | |||
| 37.40 | % | 16.14 | % | 18.42 | % |
| 28.85 | 13.33 | 15.38 | |||
| 28.66 | 15.73 | 18.86 |
Key Fund statistics
| $1,933,605,456 |
| 160 |
| $7,978,953 |
| 98% |
What did the Fund invest in?
(as of May 31, 2026)
Sector allocation
| Sector(a) | Percent of Net Assets |
|
| 51.4 | % | |
| 13.5 | ||
| 10.9 | ||
| 7.0 | ||
| 6.7 | ||
| 5.5 | ||
| 2.7 | ||
| 0.4 | ||
| 0.1 | ||
| 1.1 | ||
| 0.7 |
Ten largest holdings
| Security(b) | Percent of Net Assets |
|
| 9.1 | % | |
| 7.2 | ||
| 6.5 | ||
| 5.8 | ||
| 4.8 | ||
| 3.9 | ||
| 3.9 | ||
| 3.1 | ||
| 2.9 | ||
| 2.9 |
| For purposes of this report, sector sub-classifications may differ from those utilized by the Fund for compliance purposes. |
| Excludes short-term securities. |
Ten largest holdings
| Security(b) | Percent of Net Assets |
|
| 9.1 | % | |
| 7.2 | ||
| 6.5 | ||
| 5.8 | ||
| 4.8 | ||
| 3.9 | ||
| 3.9 | ||
| 3.1 | ||
| 2.9 | ||
| 2.9 |
Material fund changes
This is a summary of certain changes to the Fund since May 31, 2025. For more complete information, you may review the Fund’s next prospectus, which we expect to be available approximately 120 days after May 31, 2026 at blackrock.com/fundreports or upon request by contacting us at (800) 441-7762.
The Fund’s Board approved changes to the Fund’s investment strategies and investment process to under normal circumstances, invest at least 80% of its net assets, plus the amount of any borrowings for investment purposes, in large cap growth equity securities of U.S. issuers and derivatives that provide investment exposure to such securities or to one or more market risk factors associated with such securities. These changes became effective on September 26, 2025.
The Fund’s Board approved changes to the Fund’s investment strategies and investment process to under normal circumstances, invest at least 80% of its net assets, plus the amount of any borrowings for investment purposes, in large cap growth equity securities of U.S. issuers and derivatives that provide investment exposure to such securities or to one or more market risk factors associated with such securities. These changes became effective on September 26, 2025.
This is a summary of certain changes to the Fund since May 31, 2025. For more complete information, you may review the Fund’s next prospectus, which we expect to be available approximately 120 days after May 31, 2026 at blackrock.com/fundreports or upon request by contacting us at (800) 441-7762.
This report describes changes to the Fund that occurred during the reporting period.
What were the Fund costs for the last year?
(based on a hypothetical $10,000 investment)
| Class name | Costs of a $10,000 investment |
Costs paid as a percentage of a $10,000 investment |
| $191 | 1.62% |
How did the Fund perform last year?
- For the reporting period ended May 31, 2026, the Fund's Investor C Shares returned 35.93%.
- For the same period, the Fund’s benchmark, the Russell 1000 Index returned 28.85% and the Russell 1000 Growth Index returned 28.66%.
What contributed to performance?
Positioning in information technology was the largest contributor to Fund performance during the reporting period, driven primarily by successful stock selection in semiconductor and technology hardware companies that benefited from continued investment in artificial intelligence infrastructure and innovation-related spending. Industry and macroeconomic-based insights were particularly effective in identifying areas of the technology sector positioned to benefit from these favorable industry dynamics. Within communication services, consumer discretionary, industrials, healthcare and financials, holdings were supported by resilient earnings growth, favorable business trends and strong operating performance. Sentiment, fundamental, and theme-based insights further contributed by identifying companies with attractive growth prospects, research investment, profitability and earnings quality.
What detracted from performance?
While the Fund generated strong returns during the reporting period, several signals modestly offset otherwise positive performance. In particular, measures tied to growth expectations and consumer behavior trends underperformed. In addition, certain thematic and market-timing signals struggled as market leadership evolved differently than anticipated.
The views expressed reflect the opinions of BlackRock as of the date of this report and are subject to change based on changes in market, economic or other conditions. These views are not intended to be a forecast of future events and are no guarantee of future results.
Fund performance
Cumulative performance: June 1, 2016 through May 31, 2026
Initial investment of $10,000
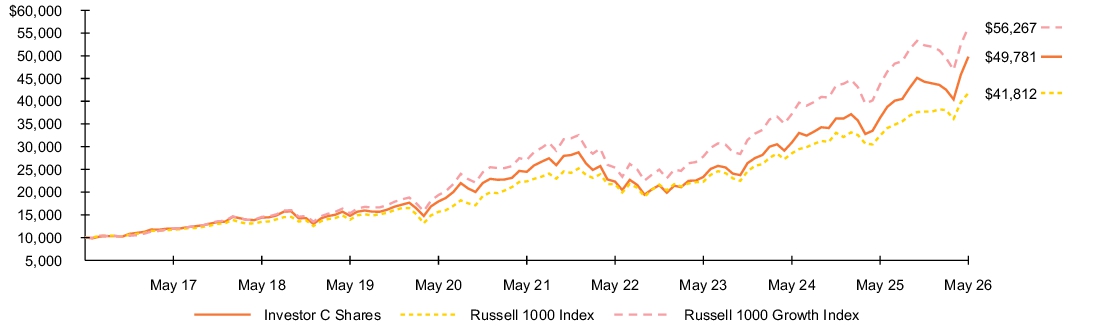
See “Average annual total returns” for additional information on fund performance.
Average annual total returns
| 1 Year | 5 Years | 10 Years | |||
| 35.93 | % | 14.92 | % | 17.41 | % |
| 34.93 | 14.92 | 17.41 | |||
| 28.85 | 13.33 | 15.38 | |||
| 28.66 | 15.73 | 18.86 |
Key Fund statistics
| $1,933,605,456 |
| 160 |
| $7,978,953 |
| 98% |
What did the Fund invest in?
(as of May 31, 2026)
Sector allocation
| Sector(a) | Percent of Net Assets |
|
| 51.4 | % | |
| 13.5 | ||
| 10.9 | ||
| 7.0 | ||
| 6.7 | ||
| 5.5 | ||
| 2.7 | ||
| 0.4 | ||
| 0.1 | ||
| 1.1 | ||
| 0.7 |
Ten largest holdings
| Security(b) | Percent of Net Assets |
|
| 9.1 | % | |
| 7.2 | ||
| 6.5 | ||
| 5.8 | ||
| 4.8 | ||
| 3.9 | ||
| 3.9 | ||
| 3.1 | ||
| 2.9 | ||
| 2.9 |
| For purposes of this report, sector sub-classifications may differ from those utilized by the Fund for compliance purposes. |
| Excludes short-term securities. |
Ten largest holdings
| Security(b) | Percent of Net Assets |
|
| 9.1 | % | |
| 7.2 | ||
| 6.5 | ||
| 5.8 | ||
| 4.8 | ||
| 3.9 | ||
| 3.9 | ||
| 3.1 | ||
| 2.9 | ||
| 2.9 |
Material fund changes
This is a summary of certain changes to the Fund since May 31, 2025. For more complete information, you may review the Fund’s next prospectus, which we expect to be available approximately 120 days after May 31, 2026 at blackrock.com/fundreports or upon request by contacting us at (800) 441-7762.
The Fund’s Board approved changes to the Fund’s investment strategies and investment process to under normal circumstances, invest at least 80% of its net assets, plus the amount of any borrowings for investment purposes, in large cap growth equity securities of U.S. issuers and derivatives that provide investment exposure to such securities or to one or more market risk factors associated with such securities. These changes became effective on September 26, 2025.
The Fund’s Board approved changes to the Fund’s investment strategies and investment process to under normal circumstances, invest at least 80% of its net assets, plus the amount of any borrowings for investment purposes, in large cap growth equity securities of U.S. issuers and derivatives that provide investment exposure to such securities or to one or more market risk factors associated with such securities. These changes became effective on September 26, 2025.
This is a summary of certain changes to the Fund since May 31, 2025. For more complete information, you may review the Fund’s next prospectus, which we expect to be available approximately 120 days after May 31, 2026 at blackrock.com/fundreports or upon request by contacting us at (800) 441-7762.
This report describes changes to the Fund that occurred during the reporting period.
What were the Fund costs for the last year?
(based on a hypothetical $10,000 investment)
| Class name | Costs of a $10,000 investment |
Costs paid as a percentage of a $10,000 investment |
| $103 | 0.87% |
How did the Fund perform last year?
- For the reporting period ended May 31, 2026, the Fund's Investor A Shares returned 36.97%.
- For the same period, the Fund’s benchmark, the Russell 1000 Index returned 28.85% and the Russell 1000 Growth Index returned 28.66%.
What contributed to performance?
Positioning in information technology was the largest contributor to Fund performance during the reporting period, driven primarily by successful stock selection in semiconductor and technology hardware companies that benefited from continued investment in artificial intelligence infrastructure and innovation-related spending. Industry and macroeconomic-based insights were particularly effective in identifying areas of the technology sector positioned to benefit from these favorable industry dynamics. Within communication services, consumer discretionary, industrials, healthcare and financials, holdings were supported by resilient earnings growth, favorable business trends and strong operating performance. Sentiment, fundamental, and theme-based insights further contributed by identifying companies with attractive growth prospects, research investment, profitability and earnings quality.
What detracted from performance?
While the Fund generated strong returns during the reporting period, several signals modestly offset otherwise positive performance. In particular, measures tied to growth expectations and consumer behavior trends underperformed. In addition, certain thematic and market-timing signals struggled as market leadership evolved differently than anticipated.
The views expressed reflect the opinions of BlackRock as of the date of this report and are subject to change based on changes in market, economic or other conditions. These views are not intended to be a forecast of future events and are no guarantee of future results.
Fund performance
Cumulative performance: June 1, 2016 through May 31, 2026
Initial investment of $10,000
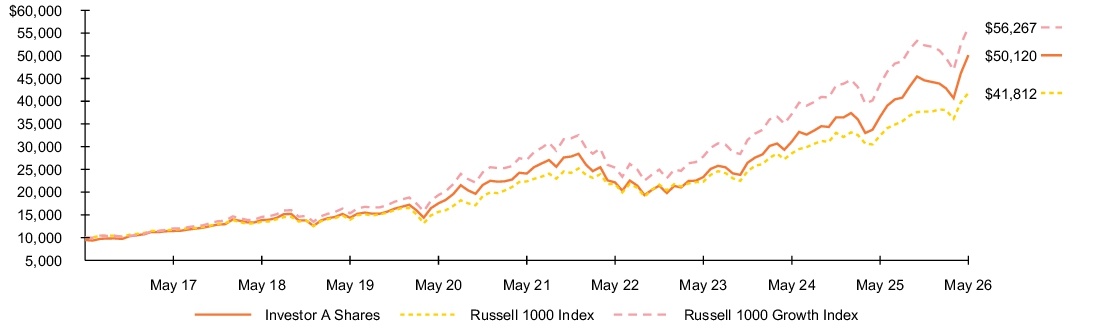
See “Average annual total returns” for additional information on fund performance.
Average annual total returns
| 1 Year | 5 Years | 10 Years | |||
| 36.97 | % | 15.78 | % | 18.13 | % |
| 29.78 | 14.54 | 17.49 | |||
| 28.85 | 13.33 | 15.38 | |||
| 28.66 | 15.73 | 18.86 |
Key Fund statistics
| $1,933,605,456 |
| 160 |
| $7,978,953 |
| 98% |
What did the Fund invest in?
(as of May 31, 2026)
Sector allocation
| Sector(a) | Percent of Net Assets |
|
| 51.4 | % | |
| 13.5 | ||
| 10.9 | ||
| 7.0 | ||
| 6.7 | ||
| 5.5 | ||
| 2.7 | ||
| 0.4 | ||
| 0.1 | ||
| 1.1 | ||
| 0.7 |
Ten largest holdings
| Security(b) | Percent of Net Assets |
|
| 9.1 | % | |
| 7.2 | ||
| 6.5 | ||
| 5.8 | ||
| 4.8 | ||
| 3.9 | ||
| 3.9 | ||
| 3.1 | ||
| 2.9 | ||
| 2.9 |
| For purposes of this report, sector sub-classifications may differ from those utilized by the Fund for compliance purposes. |
| Excludes short-term securities. |
Ten largest holdings
| Security(b) | Percent of Net Assets |
|
| 9.1 | % | |
| 7.2 | ||
| 6.5 | ||
| 5.8 | ||
| 4.8 | ||
| 3.9 | ||
| 3.9 | ||
| 3.1 | ||
| 2.9 | ||
| 2.9 |
Material fund changes
This is a summary of certain changes to the Fund since May 31, 2025. For more complete information, you may review the Fund’s next prospectus, which we expect to be available approximately 120 days after May 31, 2026 at blackrock.com/fundreports or upon request by contacting us at (800) 441-7762.
The Fund’s Board approved changes to the Fund’s investment strategies and investment process to under normal circumstances, invest at least 80% of its net assets, plus the amount of any borrowings for investment purposes, in large cap growth equity securities of U.S. issuers and derivatives that provide investment exposure to such securities or to one or more market risk factors associated with such securities. These changes became effective on September 26, 2025.
The Fund’s Board approved changes to the Fund’s investment strategies and investment process to under normal circumstances, invest at least 80% of its net assets, plus the amount of any borrowings for investment purposes, in large cap growth equity securities of U.S. issuers and derivatives that provide investment exposure to such securities or to one or more market risk factors associated with such securities. These changes became effective on September 26, 2025.
This is a summary of certain changes to the Fund since May 31, 2025. For more complete information, you may review the Fund’s next prospectus, which we expect to be available approximately 120 days after May 31, 2026 at blackrock.com/fundreports or upon request by contacting us at (800) 441-7762.
This report describes changes to the Fund that occurred during the reporting period.
What were the Fund costs for the last year?
(based on a hypothetical $10,000 investment)
| Class name | Costs of a $10,000 investment |
Costs paid as a percentage of a $10,000 investment |
| $74 | 0.62% |
How did the Fund perform last year?
- For the reporting period ended May 31, 2026, the Fund's Institutional Shares returned 37.34%.
- For the same period, the Fund’s benchmark, the Russell 1000 Index returned 28.85% and the Russell 1000 Growth Index returned 28.66%.
What contributed to performance?
Positioning in information technology was the largest contributor to Fund performance during the reporting period, driven primarily by successful stock selection in semiconductor and technology hardware companies that benefited from continued investment in artificial intelligence infrastructure and innovation-related spending. Industry and macroeconomic-based insights were particularly effective in identifying areas of the technology sector positioned to benefit from these favorable industry dynamics. Within communication services, consumer discretionary, industrials, healthcare and financials, holdings were supported by resilient earnings growth, favorable business trends and strong operating performance. Sentiment, fundamental, and theme-based insights further contributed by identifying companies with attractive growth prospects, research investment, profitability and earnings quality.
What detracted from performance?
While the Fund generated strong returns during the reporting period, several signals modestly offset otherwise positive performance. In particular, measures tied to growth expectations and consumer behavior trends underperformed. In addition, certain thematic and market-timing signals struggled as market leadership evolved differently than anticipated.
The views expressed reflect the opinions of BlackRock as of the date of this report and are subject to change based on changes in market, economic or other conditions. These views are not intended to be a forecast of future events and are no guarantee of future results.
Fund performance
Cumulative performance: June 1, 2016 through May 31, 2026
Initial investment of $10,000
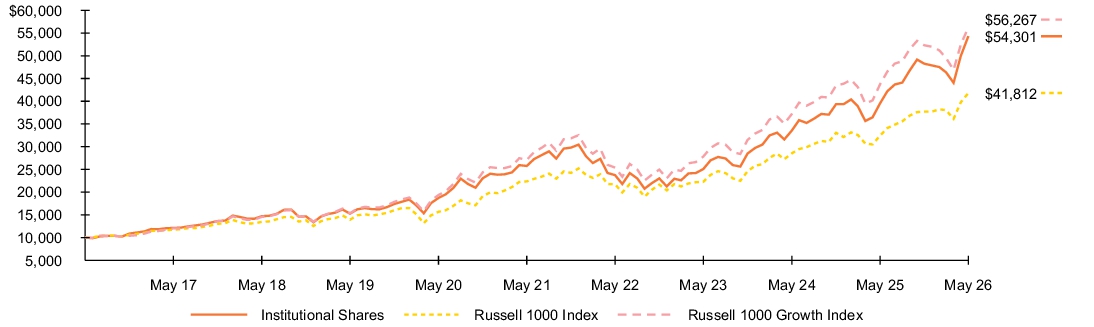
See “Average annual total returns” for additional information on fund performance.
Average annual total returns
| 1 Year | 5 Years | 10 Years | |||
| 37.34 | % | 16.09 | % | 18.44 | % |
| 28.85 | 13.33 | 15.38 | |||
| 28.66 | 15.73 | 18.86 |
Key Fund statistics
| $1,933,605,456 |
| 160 |
| $7,978,953 |
| 98% |
What did the Fund invest in?
(as of May 31, 2026)
Sector allocation
| Sector(a) | Percent of Net Assets |
|
| 51.4 | % | |
| 13.5 | ||
| 10.9 | ||
| 7.0 | ||
| 6.7 | ||
| 5.5 | ||
| 2.7 | ||
| 0.4 | ||
| 0.1 | ||
| 1.1 | ||
| 0.7 |
Ten largest holdings
| Security(b) | Percent of Net Assets |
|
| 9.1 | % | |
| 7.2 | ||
| 6.5 | ||
| 5.8 | ||
| 4.8 | ||
| 3.9 | ||
| 3.9 | ||
| 3.1 | ||
| 2.9 | ||
| 2.9 |
| For purposes of this report, sector sub-classifications may differ from those utilized by the Fund for compliance purposes. |
| Excludes short-term securities. |
Ten largest holdings
| Security(b) | Percent of Net Assets |
|
| 9.1 | % | |
| 7.2 | ||
| 6.5 | ||
| 5.8 | ||
| 4.8 | ||
| 3.9 | ||
| 3.9 | ||
| 3.1 | ||
| 2.9 | ||
| 2.9 |
Material fund changes
This is a summary of certain changes to the Fund since May 31, 2025. For more complete information, you may review the Fund’s next prospectus, which we expect to be available approximately 120 days after May 31, 2026 at blackrock.com/fundreports or upon request by contacting us at (800) 441-7762.
The Fund’s Board approved changes to the Fund’s investment strategies and investment process to under normal circumstances, invest at least 80% of its net assets, plus the amount of any borrowings for investment purposes, in large cap growth equity securities of U.S. issuers and derivatives that provide investment exposure to such securities or to one or more market risk factors associated with such securities. These changes became effective on September 26, 2025.
The Fund’s Board approved changes to the Fund’s investment strategies and investment process to under normal circumstances, invest at least 80% of its net assets, plus the amount of any borrowings for investment purposes, in large cap growth equity securities of U.S. issuers and derivatives that provide investment exposure to such securities or to one or more market risk factors associated with such securities. These changes became effective on September 26, 2025.
This is a summary of certain changes to the Fund since May 31, 2025. For more complete information, you may review the Fund’s next prospectus, which we expect to be available approximately 120 days after May 31, 2026 at blackrock.com/fundreports or upon request by contacting us at (800) 441-7762.
What were the Fund costs for the last year?
(based on a hypothetical $10,000 investment)
| Class name | Costs of a $10,000 investment |
Costs paid as a percentage of a $10,000 investment |
| $93 | 0.86% |
How did the Fund perform last year?
- For the reporting period ended May 31, 2026, the Fund's Institutional Shares returned 17.12%.
- For the same period, the Fund’s benchmark, the Russell 3000 Index returned 29.45% and the Russell 3000 Health Care Index returned 17.64%.
What contributed to performance?
Eli Lilly & Co. was the largest contributor to absolute performance. The company’s share price was driven by continued strength in the market for obesity treatments, progress on its oral GLP-1 pipeline, and robust financial performance. Johnson & Johnson was another contributor. The pharmaceutical stock rose on the back of strong financial performance and waning policy headwinds. UnitedHealth Group, Inc., Merck & Co., Inc., and Teva Pharmaceutical Industries, Ltd. were leading contributors, as well.
What detracted from performance?
The health care equipment firm Boston Scientific Corp., which lost ground after reporting slower-than-expected growth in key areas, was the largest detractor. Abbott Laboratories also detracted from returns. The stock faced pressure due to disappointing financial results, overhangs from large acquisitions, and weaker trends in key products. Intuitive Surgical, Inc., Stryker Corp., and Veeva Systems, Inc. were notable detractors, as well.
The views expressed reflect the opinions of BlackRock as of the date of this report and are subject to change based on changes in market, economic or other conditions. These views are not intended to be a forecast of future events and are no guarantee of future results.
Fund performance
Cumulative performance: June 1, 2016 through May 31, 2026
Initial investment of $10,000
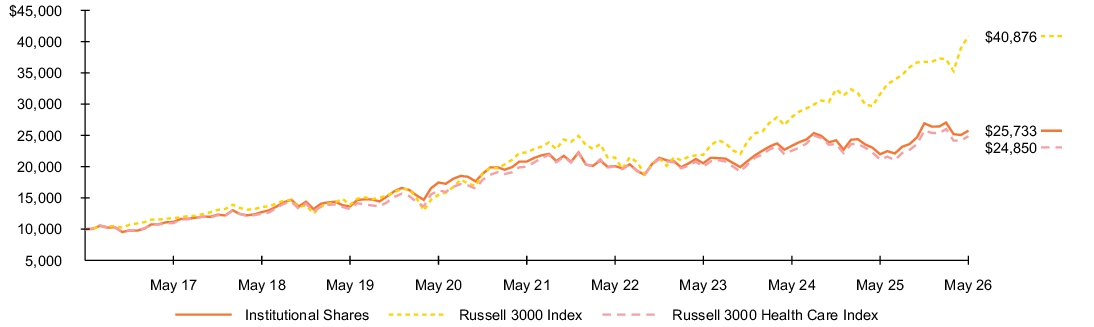
See “Average annual total returns” for additional information on fund performance.
Average annual total returns
| 1 Year | 5 Years | 10 Years | |||
| 17.12 | % | 4.34 | % | 9.91 | % |
| 29.45 | 12.92 | 15.12 | |||
| 17.64 | 4.47 | 9.53 |
Key Fund statistics
| $5,899,853,298 |
| 155 |
| $42,543,553 |
| 49% |
What did the Fund invest in?
(as of May 31, 2026)
Industry allocation
| Industry(a) | Percent of Net Assets |
|
| 34.8 | % | |
| 32.8 | ||
| 12.2 | ||
| 11.4 | ||
| 8.4 | ||
| 0.8 | ||
| (0.4 | ) |
Ten largest holdings
| Security(b) | Percent of Net Assets |
|
| 12.3 | % | |
| 8.0 | ||
| 6.1 | ||
| 4.9 | ||
| 4.2 | ||
| 3.9 | ||
| 3.4 | ||
| 3.0 | ||
| 2.7 | ||
| 2.6 |
| For purposes of this report, industry sub-classifications may differ from those utilized by the Fund for compliance purposes. |
| Excludes short-term securities. |
Ten largest holdings
| Security(b) | Percent of Net Assets |
|
| 12.3 | % | |
| 8.0 | ||
| 6.1 | ||
| 4.9 | ||
| 4.2 | ||
| 3.9 | ||
| 3.4 | ||
| 3.0 | ||
| 2.7 | ||
| 2.6 |
What were the Fund costs for the last year?
(based on a hypothetical $10,000 investment)
| Class name | Costs of a $10,000 investment |
Costs paid as a percentage of a $10,000 investment |
| $126 | 1.16% |
How did the Fund perform last year?
- For the reporting period ended May 31, 2026, the Fund's Service Shares returned 16.76%.
- For the same period, the Fund’s benchmark, the Russell 3000 Index returned 29.45% and the Russell 3000 Health Care Index returned 17.64%.
What contributed to performance?
Eli Lilly & Co. was the largest contributor to absolute performance. The company’s share price was driven by continued strength in the market for obesity treatments, progress on its oral GLP-1 pipeline, and robust financial performance. Johnson & Johnson was another contributor. The pharmaceutical stock rose on the back of strong financial performance and waning policy headwinds. UnitedHealth Group, Inc., Merck & Co., Inc., and Teva Pharmaceutical Industries, Ltd. were leading contributors, as well.
What detracted from performance?
The health care equipment firm Boston Scientific Corp., which lost ground after reporting slower-than-expected growth in key areas, was the largest detractor. Abbott Laboratories also detracted from returns. The stock faced pressure due to disappointing financial results, overhangs from large acquisitions, and weaker trends in key products. Intuitive Surgical, Inc., Stryker Corp., and Veeva Systems, Inc. were notable detractors, as well.
The views expressed reflect the opinions of BlackRock as of the date of this report and are subject to change based on changes in market, economic or other conditions. These views are not intended to be a forecast of future events and are no guarantee of future results.
Fund performance
Cumulative performance: June 1, 2016 through May 31, 2026
Initial investment of $10,000
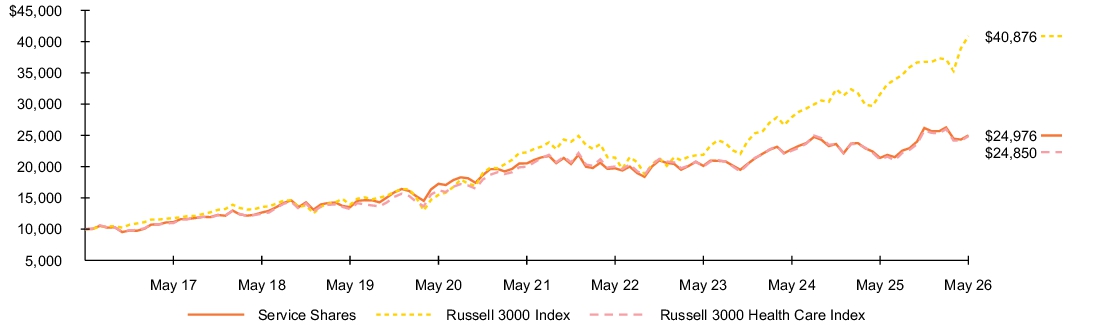
See “Average annual total returns” for additional information on fund performance.
Average annual total returns
| 1 Year | 5 Years | 10 Years | |||
| 16.76 | % | 4.02 | % | 9.59 | % |
| 29.45 | 12.92 | 15.12 | |||
| 17.64 | 4.47 | 9.53 |
Key Fund statistics
| $5,899,853,298 |
| 155 |
| $42,543,553 |
| 49% |
What did the Fund invest in?
(as of May 31, 2026)
Industry allocation
| Industry(a) | Percent of Net Assets |
|
| 34.8 | % | |
| 32.8 | ||
| 12.2 | ||
| 11.4 | ||
| 8.4 | ||
| 0.8 | ||
| (0.4 | ) |
Ten largest holdings
| Security(b) | Percent of Net Assets |
|
| 12.3 | % | |
| 8.0 | ||
| 6.1 | ||
| 4.9 | ||
| 4.2 | ||
| 3.9 | ||
| 3.4 | ||
| 3.0 | ||
| 2.7 | ||
| 2.6 |
| For purposes of this report, industry sub-classifications may differ from those utilized by the Fund for compliance purposes. |
| Excludes short-term securities. |
Ten largest holdings
| Security(b) | Percent of Net Assets |
|
| 12.3 | % | |
| 8.0 | ||
| 6.1 | ||
| 4.9 | ||
| 4.2 | ||
| 3.9 | ||
| 3.4 | ||
| 3.0 | ||
| 2.7 | ||
| 2.6 |
What were the Fund costs for the last year?
(based on a hypothetical $10,000 investment)
| Class name | Costs of a $10,000 investment |
Costs paid as a percentage of a $10,000 investment |
| $119 | 1.10% |
How did the Fund perform last year?
- For the reporting period ended May 31, 2026, the Fund's Investor A Shares returned 16.86%.
- For the same period, the Fund’s benchmark, the Russell 3000 Index returned 29.45% and the Russell 3000 Health Care Index returned 17.64%.
What contributed to performance?
Eli Lilly & Co. was the largest contributor to absolute performance. The company’s share price was driven by continued strength in the market for obesity treatments, progress on its oral GLP-1 pipeline, and robust financial performance. Johnson & Johnson was another contributor. The pharmaceutical stock rose on the back of strong financial performance and waning policy headwinds. UnitedHealth Group, Inc., Merck & Co., Inc., and Teva Pharmaceutical Industries, Ltd. were leading contributors, as well.
What detracted from performance?
The health care equipment firm Boston Scientific Corp., which lost ground after reporting slower-than-expected growth in key areas, was the largest detractor. Abbott Laboratories also detracted from returns. The stock faced pressure due to disappointing financial results, overhangs from large acquisitions, and weaker trends in key products. Intuitive Surgical, Inc., Stryker Corp., and Veeva Systems, Inc. were notable detractors, as well.
The views expressed reflect the opinions of BlackRock as of the date of this report and are subject to change based on changes in market, economic or other conditions. These views are not intended to be a forecast of future events and are no guarantee of future results.
Fund performance
Cumulative performance: June 1, 2016 through May 31, 2026
Initial investment of $10,000
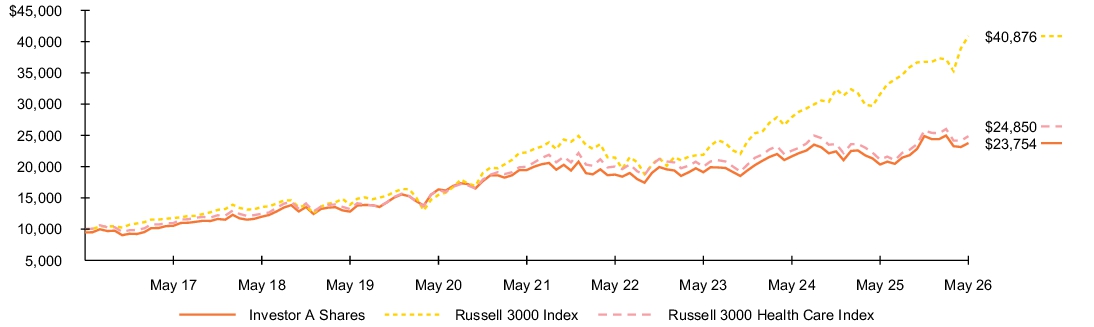
See “Average annual total returns” for additional information on fund performance.
Average annual total returns
| 1 Year | 5 Years | 10 Years | |||
| 16.86 | % | 4.08 | % | 9.63 | % |
| 10.71 | 2.96 | 9.04 | |||
| 29.45 | 12.92 | 15.12 | |||
| 17.64 | 4.47 | 9.53 |
Key Fund statistics
| $5,899,853,298 |
| 155 |
| $42,543,553 |
| 49% |
What did the Fund invest in?
(as of May 31, 2026)
Industry allocation
| Industry(a) | Percent of Net Assets |
|
| 34.8 | % | |
| 32.8 | ||
| 12.2 | ||
| 11.4 | ||
| 8.4 | ||
| 0.8 | ||
| (0.4 | ) |
Ten largest holdings
| Security(b) | Percent of Net Assets |
|
| 12.3 | % | |
| 8.0 | ||
| 6.1 | ||
| 4.9 | ||
| 4.2 | ||
| 3.9 | ||
| 3.4 | ||
| 3.0 | ||
| 2.7 | ||
| 2.6 |
| For purposes of this report, industry sub-classifications may differ from those utilized by the Fund for compliance purposes. |
| Excludes short-term securities. |
Ten largest holdings
| Security(b) | Percent of Net Assets |
|
| 12.3 | % | |
| 8.0 | ||
| 6.1 | ||
| 4.9 | ||
| 4.2 | ||
| 3.9 | ||
| 3.4 | ||
| 3.0 | ||
| 2.7 | ||
| 2.6 |
What were the Fund costs for the last year?
(based on a hypothetical $10,000 investment)
| Class name | Costs of a $10,000 investment |
Costs paid as a percentage of a $10,000 investment |
| $204 | 1.89% |
How did the Fund perform last year?
- For the reporting period ended May 31, 2026, the Fund's Investor C Shares returned 15.92%.
- For the same period, the Fund’s benchmark, the Russell 3000 Index returned 29.45% and the Russell 3000 Health Care Index returned 17.64%.
What contributed to performance?
Eli Lilly & Co. was the largest contributor to absolute performance. The company’s share price was driven by continued strength in the market for obesity treatments, progress on its oral GLP-1 pipeline, and robust financial performance. Johnson & Johnson was another contributor. The pharmaceutical stock rose on the back of strong financial performance and waning policy headwinds. UnitedHealth Group, Inc., Merck & Co., Inc., and Teva Pharmaceutical Industries, Ltd. were leading contributors, as well.
What detracted from performance?
The health care equipment firm Boston Scientific Corp., which lost ground after reporting slower-than-expected growth in key areas, was the largest detractor. Abbott Laboratories also detracted from returns. The stock faced pressure due to disappointing financial results, overhangs from large acquisitions, and weaker trends in key products. Intuitive Surgical, Inc., Stryker Corp., and Veeva Systems, Inc. were notable detractors, as well.
The views expressed reflect the opinions of BlackRock as of the date of this report and are subject to change based on changes in market, economic or other conditions. These views are not intended to be a forecast of future events and are no guarantee of future results.
Fund performance
Cumulative performance: June 1, 2016 through May 31, 2026
Initial investment of $10,000
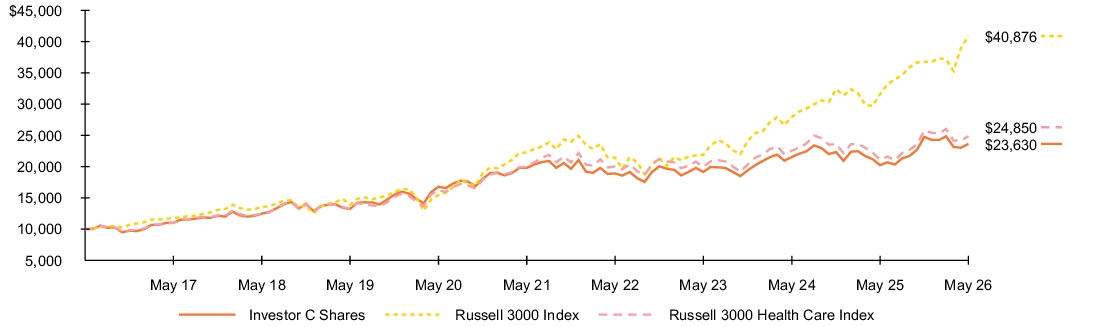
See “Average annual total returns” for additional information on fund performance.
Average annual total returns
| 1 Year | 5 Years | 10 Years | |||
| 15.92 | % | 3.29 | % | 8.98 | % |
| 14.92 | 3.29 | 8.98 | |||
| 29.45 | 12.92 | 15.12 | |||
| 17.64 | 4.47 | 9.53 |
Key Fund statistics
| $5,899,853,298 |
| 155 |
| $42,543,553 |
| 49% |
What did the Fund invest in?
(as of May 31, 2026)
Industry allocation
| Industry(a) | Percent of Net Assets |
|
| 34.8 | % | |
| 32.8 | ||
| 12.2 | ||
| 11.4 | ||
| 8.4 | ||
| 0.8 | ||
| (0.4 | ) |
Ten largest holdings
| Security(b) | Percent of Net Assets |
|
| 12.3 | % | |
| 8.0 | ||
| 6.1 | ||
| 4.9 | ||
| 4.2 | ||
| 3.9 | ||
| 3.4 | ||
| 3.0 | ||
| 2.7 | ||
| 2.6 |
| For purposes of this report, industry sub-classifications may differ from those utilized by the Fund for compliance purposes. |
| Excludes short-term securities. |
Ten largest holdings
| Security(b) | Percent of Net Assets |
|
| 12.3 | % | |
| 8.0 | ||
| 6.1 | ||
| 4.9 | ||
| 4.2 | ||
| 3.9 | ||
| 3.4 | ||
| 3.0 | ||
| 2.7 | ||
| 2.6 |
What were the Fund costs for the last year?
(based on a hypothetical $10,000 investment)
| Class name | Costs of a $10,000 investment |
Costs paid as a percentage of a $10,000 investment |
| $81 | 0.75% |
How did the Fund perform last year?
- For the reporting period ended May 31, 2026, the Fund's Class K Shares returned 17.25%.
- For the same period, the Fund’s benchmark, the Russell 3000 Index returned 29.45% and the Russell 3000 Health Care Index returned 17.64%.
What contributed to performance?
Eli Lilly & Co. was the largest contributor to absolute performance. The company’s share price was driven by continued strength in the market for obesity treatments, progress on its oral GLP-1 pipeline, and robust financial performance. Johnson & Johnson was another contributor. The pharmaceutical stock rose on the back of strong financial performance and waning policy headwinds. UnitedHealth Group, Inc., Merck & Co., Inc., and Teva Pharmaceutical Industries, Ltd. were leading contributors, as well.
What detracted from performance?
The health care equipment firm Boston Scientific Corp., which lost ground after reporting slower-than-expected growth in key areas, was the largest detractor. Abbott Laboratories also detracted from returns. The stock faced pressure due to disappointing financial results, overhangs from large acquisitions, and weaker trends in key products. Intuitive Surgical, Inc., Stryker Corp., and Veeva Systems, Inc. were notable detractors, as well.
The views expressed reflect the opinions of BlackRock as of the date of this report and are subject to change based on changes in market, economic or other conditions. These views are not intended to be a forecast of future events and are no guarantee of future results.
Fund performance
Cumulative performance: June 1, 2016 through May 31, 2026
Initial investment of $10,000
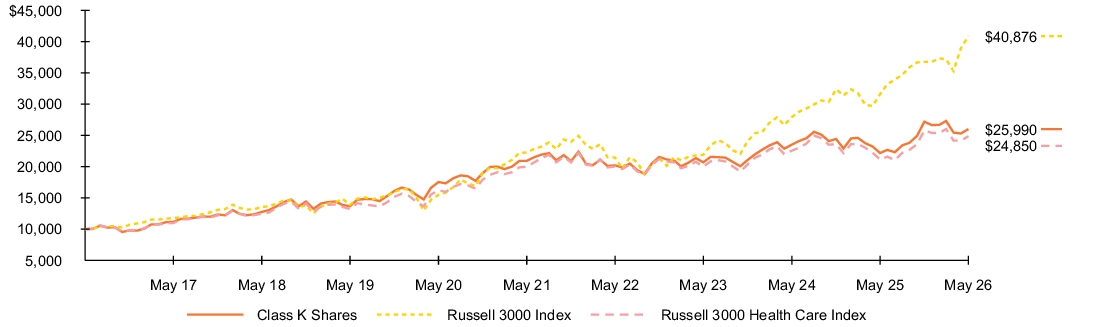
See “Average annual total returns” for additional information on fund performance.
Average annual total returns
| 1 Year | 5 Years | 10 Years | |||
| 17.25 | % | 4.44 | % | 10.02 | % |
| 29.45 | 12.92 | 15.12 | |||
| 17.64 | 4.47 | 9.53 |
Key Fund statistics
| $5,899,853,298 |
| 155 |
| $42,543,553 |
| 49% |
What did the Fund invest in?
(as of May 31, 2026)
Industry allocation
| Industry(a) | Percent of Net Assets |
|
| 34.8 | % | |
| 32.8 | ||
| 12.2 | ||
| 11.4 | ||
| 8.4 | ||
| 0.8 | ||
| (0.4 | ) |
Ten largest holdings
| Security(b) | Percent of Net Assets |
|
| 12.3 | % | |
| 8.0 | ||
| 6.1 | ||
| 4.9 | ||
| 4.2 | ||
| 3.9 | ||
| 3.4 | ||
| 3.0 | ||
| 2.7 | ||
| 2.6 |
| For purposes of this report, industry sub-classifications may differ from those utilized by the Fund for compliance purposes. |
| Excludes short-term securities. |
Ten largest holdings
| Security(b) | Percent of Net Assets |
|
| 12.3 | % | |
| 8.0 | ||
| 6.1 | ||
| 4.9 | ||
| 4.2 | ||
| 3.9 | ||
| 3.4 | ||
| 3.0 | ||
| 2.7 | ||
| 2.6 |
What were the Fund costs for the last year?
(based on a hypothetical $10,000 investment)
| Class name | Costs of a $10,000 investment |
Costs paid as a percentage of a $10,000 investment |
| $158 | 1.46% |
How did the Fund perform last year?
- For the reporting period ended May 31, 2026, the Fund's Class R Shares returned 16.43%.
- For the same period, the Fund’s benchmark, the Russell 3000 Index returned 29.45% and the Russell 3000 Health Care Index returned 17.64%.
What contributed to performance?
Eli Lilly & Co. was the largest contributor to absolute performance. The company’s share price was driven by continued strength in the market for obesity treatments, progress on its oral GLP-1 pipeline, and robust financial performance. Johnson & Johnson was another contributor. The pharmaceutical stock rose on the back of strong financial performance and waning policy headwinds. UnitedHealth Group, Inc., Merck & Co., Inc., and Teva Pharmaceutical Industries, Ltd. were leading contributors, as well.
What detracted from performance?
The health care equipment firm Boston Scientific Corp., which lost ground after reporting slower-than-expected growth in key areas, was the largest detractor. Abbott Laboratories also detracted from returns. The stock faced pressure due to disappointing financial results, overhangs from large acquisitions, and weaker trends in key products. Intuitive Surgical, Inc., Stryker Corp., and Veeva Systems, Inc. were notable detractors, as well.
The views expressed reflect the opinions of BlackRock as of the date of this report and are subject to change based on changes in market, economic or other conditions. These views are not intended to be a forecast of future events and are no guarantee of future results.
Fund performance
Cumulative performance: June 1, 2016 through May 31, 2026
Initial investment of $10,000
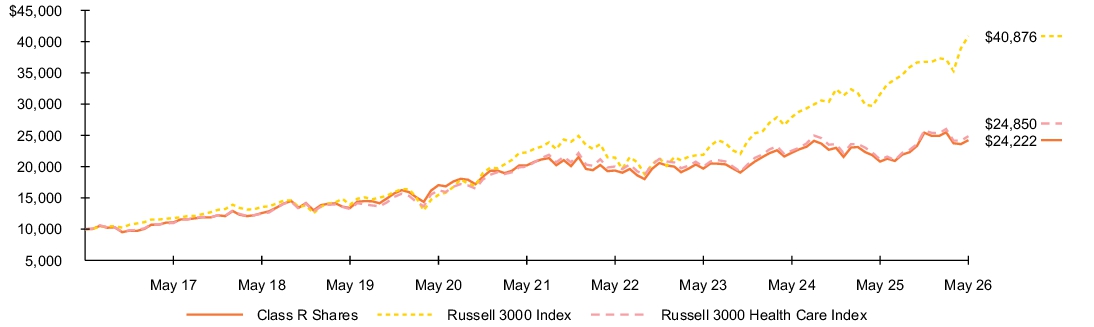
See “Average annual total returns” for additional information on fund performance.
Average annual total returns
| 1 Year | 5 Years | 10 Years | |||
| 16.43 | % | 3.71 | % | 9.25 | % |
| 29.45 | 12.92 | 15.12 | |||
| 17.64 | 4.47 | 9.53 |
Key Fund statistics
| $5,899,853,298 |
| 155 |
| $42,543,553 |
| 49% |
What did the Fund invest in?
(as of May 31, 2026)
Industry allocation
| Industry(a) | Percent of Net Assets |
|
| 34.8 | % | |
| 32.8 | ||
| 12.2 | ||
| 11.4 | ||
| 8.4 | ||
| 0.8 | ||
| (0.4 | ) |
Ten largest holdings
| Security(b) | Percent of Net Assets |
|
| 12.3 | % | |
| 8.0 | ||
| 6.1 | ||
| 4.9 | ||
| 4.2 | ||
| 3.9 | ||
| 3.4 | ||
| 3.0 | ||
| 2.7 | ||
| 2.6 |
| For purposes of this report, industry sub-classifications may differ from those utilized by the Fund for compliance purposes. |
| Excludes short-term securities. |
Ten largest holdings
| Security(b) | Percent of Net Assets |
|
| 12.3 | % | |
| 8.0 | ||
| 6.1 | ||
| 4.9 | ||
| 4.2 | ||
| 3.9 | ||
| 3.4 | ||
| 3.0 | ||
| 2.7 | ||
| 2.6 |
What were the Fund costs for the last year?
(based on a hypothetical $10,000 investment)
| Class name | Costs of a $10,000 investment |
Costs paid as a percentage of a $10,000 investment |
| $111 | 1.00% |
How did the Fund perform last year?
- For the reporting period ended May 31, 2026, the Fund's Class R Shares returned 22.86%.
- For the same period, the Fund’s benchmark, the MSCI EAFE Index (Net) returned 22.80%.
What contributed to performance?
Financial stocks were the largest contributors to the Fund’s absolute performance, supported by healthy profitability for European banks, insurers, and U.K. financial services companies amid a higher-for-longer interest rate environment. This aspect of the Fund’s positioning was driven by sentiment measures that assess improving investor expectations, as well as trending insights looking at emerging themes in broker reports.
Traditional valuation measures successfully positioned the portfolio in the industrials sector, further contributing to results. Companies with businesses related to factory automation, electrical equipment, and infrastructure benefited from sustained corporate spending and supply-chain modernization efforts.
Macro-related measures focused on emerging themes such as digitalization, infrastructure investment, and technology adoption also contributed, led by Japanese information technology companies.
What detracted from performance?
While the Fund generated strong returns during the reporting period, some aspects of its positioning detracted. Holdings in certain consumer discretionary stocks, which were driven by non-traditional quality-related measures and a preference for lower volatility companies, detracted given the “risk on” tone in the market. Positioning in Denmark-based companies also detracted slightly.
The views expressed reflect the opinions of BlackRock as of the date of this report and are subject to change based on changes in market, economic or other conditions. These views are not intended to be a forecast of future events and are no guarantee of future results.
Fund performance
Cumulative performance: June 1, 2016 through May 31, 2026
Initial investment of $10,000
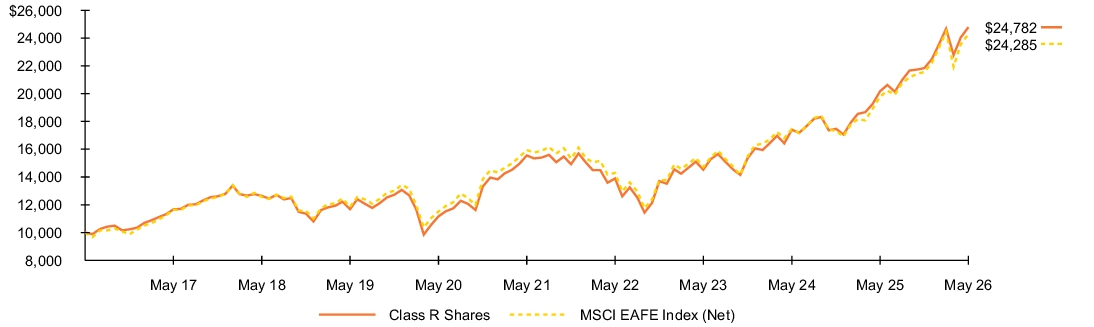
See “Average annual total returns” for additional information on fund performance.
Average annual total returns
| 1 Year | 5 Years | 10 Years | |||
| 22.86 | % | 9.77 | % | 9.50 | % |
| 22.80 | 8.79 | 9.28 |
Key Fund statistics
| $8,660,018,292 |
| 499 |
| $25,465,344 |
| 99% |
What did the Fund invest in?
(as of May 31, 2026)
Geographic allocation
| Country | Percent of Net Assets |
|
| 24.0 | % | |
| 11.8 | ||
| 9.3 | ||
| 9.0 | ||
| 7.2 | ||
| 6.3 | ||
| 6.2 | ||
| 5.4 | ||
| 4.9 | ||
| 4.1 | ||
| 11.1 | ||
| 0.8 | ||
| (0.1 | ) |
Ten largest holdings
| Security(a) | Percent of Net Assets |
|
| 3.9 | % | |
| 1.7 | ||
| 1.5 | ||
| 1.4 | ||
| 1.4 | ||
| 1.4 | ||
| 1.4 | ||
| 1.4 | ||
| 1.3 | ||
| 1.3 |
| Excludes short-term securities. |
| Ten largest countries are presented. Additional countries are found in Other. |
Ten largest holdings
| Security(a) | Percent of Net Assets |
|
| 3.9 | % | |
| 1.7 | ||
| 1.5 | ||
| 1.4 | ||
| 1.4 | ||
| 1.4 | ||
| 1.4 | ||
| 1.4 | ||
| 1.3 | ||
| 1.3 |
What were the Fund costs for the last year?
(based on a hypothetical $10,000 investment)
| Class name | Costs of a $10,000 investment |
Costs paid as a percentage of a $10,000 investment |
| $50 | 0.45% |
How did the Fund perform last year?
- For the reporting period ended May 31, 2026, the Fund's Class K Shares returned 23.49%.
- For the same period, the Fund’s benchmark, the MSCI EAFE Index (Net) returned 22.80%.
What contributed to performance?
Financial stocks were the largest contributors to the Fund’s absolute performance, supported by healthy profitability for European banks, insurers, and U.K. financial services companies amid a higher-for-longer interest rate environment. This aspect of the Fund’s positioning was driven by sentiment measures that assess improving investor expectations, as well as trending insights looking at emerging themes in broker reports.
Traditional valuation measures successfully positioned the portfolio in the industrials sector, further contributing to results. Companies with businesses related to factory automation, electrical equipment, and infrastructure benefited from sustained corporate spending and supply-chain modernization efforts.
Macro-related measures focused on emerging themes such as digitalization, infrastructure investment, and technology adoption also contributed, led by Japanese information technology companies.
What detracted from performance?
While the Fund generated strong returns during the reporting period, some aspects of its positioning detracted. Holdings in certain consumer discretionary stocks, which were driven by non-traditional quality-related measures and a preference for lower volatility companies, detracted given the “risk on” tone in the market. Positioning in Denmark-based companies also detracted slightly.
The views expressed reflect the opinions of BlackRock as of the date of this report and are subject to change based on changes in market, economic or other conditions. These views are not intended to be a forecast of future events and are no guarantee of future results.
Fund performance
Cumulative performance: June 1, 2016 through May 31, 2026
Initial investment of $10,000
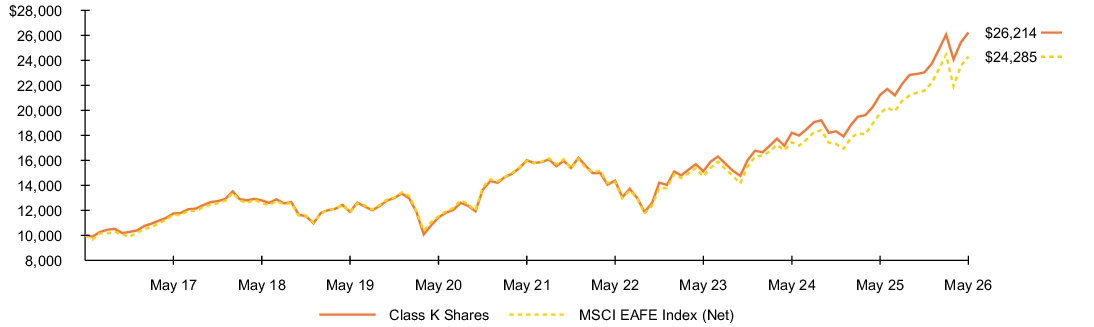
See “Average annual total returns” for additional information on fund performance.
Average annual total returns
| 1 Year | 5 Years | 10 Years | |||
| 23.49 | % | 10.37 | % | 10.12 | % |
| 22.80 | 8.79 | 9.28 |
Key Fund statistics
| $8,660,018,292 |
| 499 |
| $25,465,344 |
| 99% |
What did the Fund invest in?
(as of May 31, 2026)
Geographic allocation
| Country | Percent of Net Assets |
|
| 24.0 | % | |
| 11.8 | ||
| 9.3 | ||
| 9.0 | ||
| 7.2 | ||
| 6.3 | ||
| 6.2 | ||
| 5.4 | ||
| 4.9 | ||
| 4.1 | ||
| 11.1 | ||
| 0.8 | ||
| (0.1 | ) |
Ten largest holdings
| Security(a) | Percent of Net Assets |
|
| 3.9 | % | |
| 1.7 | ||
| 1.5 | ||
| 1.4 | ||
| 1.4 | ||
| 1.4 | ||
| 1.4 | ||
| 1.4 | ||
| 1.3 | ||
| 1.3 |
| Excludes short-term securities. |
| Ten largest countries are presented. Additional countries are found in Other. |
Ten largest holdings
| Security(a) | Percent of Net Assets |
|
| 3.9 | % | |
| 1.7 | ||
| 1.5 | ||
| 1.4 | ||
| 1.4 | ||
| 1.4 | ||
| 1.4 | ||
| 1.4 | ||
| 1.3 | ||
| 1.3 |
What were the Fund costs for the last year?
(based on a hypothetical $10,000 investment)
| Class name | Costs of a $10,000 investment |
Costs paid as a percentage of a $10,000 investment |
| $167 | 1.50% |
How did the Fund perform last year?
- For the reporting period ended May 31, 2026, the Fund's Investor C Shares returned 22.18%.
- For the same period, the Fund’s benchmark, the MSCI EAFE Index (Net) returned 22.80%.
What contributed to performance?
Financial stocks were the largest contributors to the Fund’s absolute performance, supported by healthy profitability for European banks, insurers, and U.K. financial services companies amid a higher-for-longer interest rate environment. This aspect of the Fund’s positioning was driven by sentiment measures that assess improving investor expectations, as well as trending insights looking at emerging themes in broker reports.
Traditional valuation measures successfully positioned the portfolio in the industrials sector, further contributing to results. Companies with businesses related to factory automation, electrical equipment, and infrastructure benefited from sustained corporate spending and supply-chain modernization efforts.
Macro-related measures focused on emerging themes such as digitalization, infrastructure investment, and technology adoption also contributed, led by Japanese information technology companies.
What detracted from performance?
While the Fund generated strong returns during the reporting period, some aspects of its positioning detracted. Holdings in certain consumer discretionary stocks, which were driven by non-traditional quality-related measures and a preference for lower volatility companies, detracted given the “risk on” tone in the market. Positioning in Denmark-based companies also detracted slightly.
The views expressed reflect the opinions of BlackRock as of the date of this report and are subject to change based on changes in market, economic or other conditions. These views are not intended to be a forecast of future events and are no guarantee of future results.
Fund performance
Cumulative performance: June 1, 2016 through May 31, 2026
Initial investment of $10,000
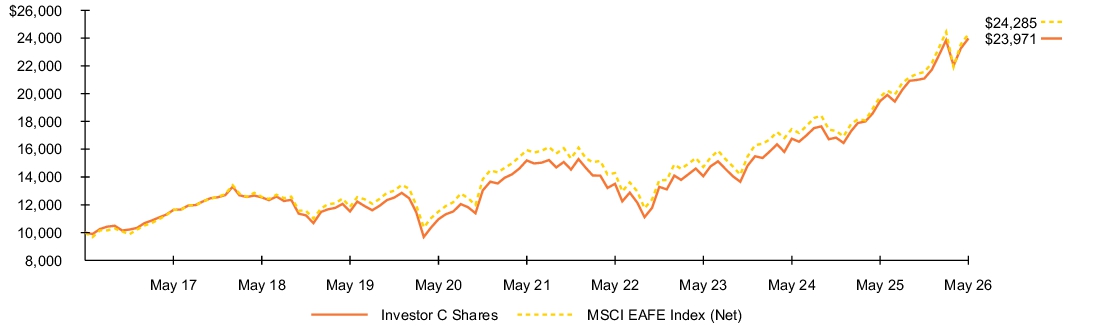
See “Average annual total returns” for additional information on fund performance.
Average annual total returns
| 1 Year | 5 Years | 10 Years | |||
| 22.18 | % | 9.22 | % | 9.14 | % |
| 21.18 | 9.22 | 9.14 | |||
| 22.80 | 8.79 | 9.28 |
Key Fund statistics
| $8,660,018,292 |
| 499 |
| $25,465,344 |
| 99% |
What did the Fund invest in?
(as of May 31, 2026)
Geographic allocation
| Country | Percent of Net Assets |
|
| 24.0 | % | |
| 11.8 | ||
| 9.3 | ||
| 9.0 | ||
| 7.2 | ||
| 6.3 | ||
| 6.2 | ||
| 5.4 | ||
| 4.9 | ||
| 4.1 | ||
| 11.1 | ||
| 0.8 | ||
| (0.1 | ) |
Ten largest holdings
| Security(a) | Percent of Net Assets |
|
| 3.9 | % | |
| 1.7 | ||
| 1.5 | ||
| 1.4 | ||
| 1.4 | ||
| 1.4 | ||
| 1.4 | ||
| 1.4 | ||
| 1.3 | ||
| 1.3 |
| Excludes short-term securities. |
| Ten largest countries are presented. Additional countries are found in Other. |
Ten largest holdings
| Security(a) | Percent of Net Assets |
|
| 3.9 | % | |
| 1.7 | ||
| 1.5 | ||
| 1.4 | ||
| 1.4 | ||
| 1.4 | ||
| 1.4 | ||
| 1.4 | ||
| 1.3 | ||
| 1.3 |
What were the Fund costs for the last year?
(based on a hypothetical $10,000 investment)
| Class name | Costs of a $10,000 investment |
Costs paid as a percentage of a $10,000 investment |
| $84 | 0.75% |
How did the Fund perform last year?
- For the reporting period ended May 31, 2026, the Fund's Investor A Shares returned 23.17%.
- For the same period, the Fund’s benchmark, the MSCI EAFE Index (Net) returned 22.80%.
What contributed to performance?
Financial stocks were the largest contributors to the Fund’s absolute performance, supported by healthy profitability for European banks, insurers, and U.K. financial services companies amid a higher-for-longer interest rate environment. This aspect of the Fund’s positioning was driven by sentiment measures that assess improving investor expectations, as well as trending insights looking at emerging themes in broker reports.
Traditional valuation measures successfully positioned the portfolio in the industrials sector, further contributing to results. Companies with businesses related to factory automation, electrical equipment, and infrastructure benefited from sustained corporate spending and supply-chain modernization efforts.
Macro-related measures focused on emerging themes such as digitalization, infrastructure investment, and technology adoption also contributed, led by Japanese information technology companies.
What detracted from performance?
While the Fund generated strong returns during the reporting period, some aspects of its positioning detracted. Holdings in certain consumer discretionary stocks, which were driven by non-traditional quality-related measures and a preference for lower volatility companies, detracted given the “risk on” tone in the market. Positioning in Denmark-based companies also detracted slightly.
The views expressed reflect the opinions of BlackRock as of the date of this report and are subject to change based on changes in market, economic or other conditions. These views are not intended to be a forecast of future events and are no guarantee of future results.
Fund performance
Cumulative performance: June 1, 2016 through May 31, 2026
Initial investment of $10,000
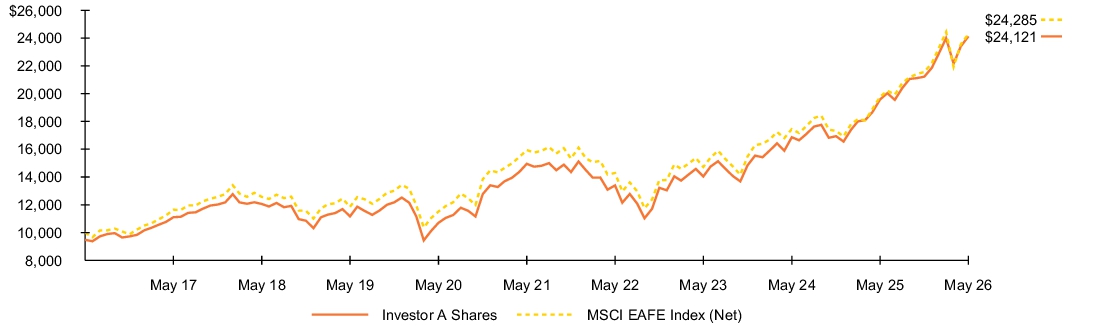
See “Average annual total returns” for additional information on fund performance.
Average annual total returns
| 1 Year | 5 Years | 10 Years | |||
| 23.17 | % | 10.04 | % | 9.79 | % |
| 16.70 | 8.86 | 9.20 | |||
| 22.80 | 8.79 | 9.28 |
Key Fund statistics
| $8,660,018,292 |
| 499 |
| $25,465,344 |
| 99% |
What did the Fund invest in?
(as of May 31, 2026)
Geographic allocation
| Country | Percent of Net Assets |
|
| 24.0 | % | |
| 11.8 | ||
| 9.3 | ||
| 9.0 | ||
| 7.2 | ||
| 6.3 | ||
| 6.2 | ||
| 5.4 | ||
| 4.9 | ||
| 4.1 | ||
| 11.1 | ||
| 0.8 | ||
| (0.1 | ) |
Ten largest holdings
| Security(a) | Percent of Net Assets |
|
| 3.9 | % | |
| 1.7 | ||
| 1.5 | ||
| 1.4 | ||
| 1.4 | ||
| 1.4 | ||
| 1.4 | ||
| 1.4 | ||
| 1.3 | ||
| 1.3 |
| Excludes short-term securities. |
| Ten largest countries are presented. Additional countries are found in Other. |
Ten largest holdings
| Security(a) | Percent of Net Assets |
|
| 3.9 | % | |
| 1.7 | ||
| 1.5 | ||
| 1.4 | ||
| 1.4 | ||
| 1.4 | ||
| 1.4 | ||
| 1.4 | ||
| 1.3 | ||
| 1.3 |
What were the Fund costs for the last year?
(based on a hypothetical $10,000 investment)
| Class name | Costs of a $10,000 investment |
Costs paid as a percentage of a $10,000 investment |
| $56 | 0.50% |
How did the Fund perform last year?
- For the reporting period ended May 31, 2026, the Fund's Institutional Shares returned 23.40%.
- For the same period, the Fund’s benchmark, the MSCI EAFE Index (Net) returned 22.80%.
What contributed to performance?
Financial stocks were the largest contributors to the Fund’s absolute performance, supported by healthy profitability for European banks, insurers, and U.K. financial services companies amid a higher-for-longer interest rate environment. This aspect of the Fund’s positioning was driven by sentiment measures that assess improving investor expectations, as well as trending insights looking at emerging themes in broker reports.
Traditional valuation measures successfully positioned the portfolio in the industrials sector, further contributing to results. Companies with businesses related to factory automation, electrical equipment, and infrastructure benefited from sustained corporate spending and supply-chain modernization efforts.
Macro-related measures focused on emerging themes such as digitalization, infrastructure investment, and technology adoption also contributed, led by Japanese information technology companies.
What detracted from performance?
While the Fund generated strong returns during the reporting period, some aspects of its positioning detracted. Holdings in certain consumer discretionary stocks, which were driven by non-traditional quality-related measures and a preference for lower volatility companies, detracted given the “risk on” tone in the market. Positioning in Denmark-based companies also detracted slightly.
The views expressed reflect the opinions of BlackRock as of the date of this report and are subject to change based on changes in market, economic or other conditions. These views are not intended to be a forecast of future events and are no guarantee of future results.
Fund performance
Cumulative performance: June 1, 2016 through May 31, 2026
Initial investment of $10,000
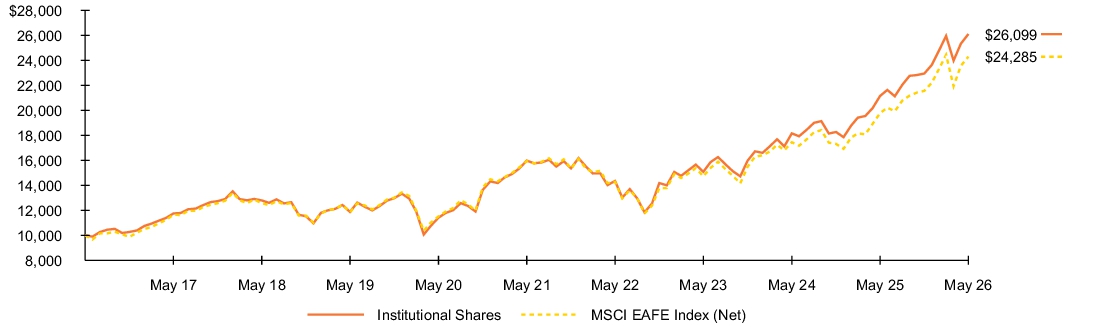
See “Average annual total returns” for additional information on fund performance.
Average annual total returns
| 1 Year | 5 Years | 10 Years | |||
| 23.40 | % | 10.31 | % | 10.07 | % |
| 22.80 | 8.79 | 9.28 |
Key Fund statistics
| $8,660,018,292 |
| 499 |
| $25,465,344 |
| 99% |
What did the Fund invest in?
(as of May 31, 2026)
Geographic allocation
| Country | Percent of Net Assets |
|
| 24.0 | % | |
| 11.8 | ||
| 9.3 | ||
| 9.0 | ||
| 7.2 | ||
| 6.3 | ||
| 6.2 | ||
| 5.4 | ||
| 4.9 | ||
| 4.1 | ||
| 11.1 | ||
| 0.8 | ||
| (0.1 | ) |
Ten largest holdings
| Security(a) | Percent of Net Assets |
|
| 3.9 | % | |
| 1.7 | ||
| 1.5 | ||
| 1.4 | ||
| 1.4 | ||
| 1.4 | ||
| 1.4 | ||
| 1.4 | ||
| 1.3 | ||
| 1.3 |
| Excludes short-term securities. |
| Ten largest countries are presented. Additional countries are found in Other. |
Ten largest holdings
| Security(a) | Percent of Net Assets |
|
| 3.9 | % | |
| 1.7 | ||
| 1.5 | ||
| 1.4 | ||
| 1.4 | ||
| 1.4 | ||
| 1.4 | ||
| 1.4 | ||
| 1.3 | ||
| 1.3 |
What were the Fund costs for the last year?
(based on a hypothetical $10,000 investment)
| Class name | Costs of a $10,000 investment |
Costs paid as a percentage of a $10,000 investment |
| $90 | 0.75% |
How did the Fund perform last year?
- For the reporting period ended May 31, 2026, the Fund's Institutional Shares returned 40.65%.
- For the same period, the Fund’s benchmark, the MSCI All Country World Index (Net) returned 30.27% and the Bloomberg Commodity Index returned 40.47%.
What contributed to performance?
The Fund’s holdings in commodity derivatives—which it uses to gain exposure to physical commodities—contributed to absolute performance. Its positions in the gold mining stocks Newmont Corp., Barrick Mining Corp., and Kinross Gold Corp., which benefited from rising gold prices and strong operating results, were among the top contributors at the individual stock level. Exxon Mobil Corp. also contributed to returns. The shares benefited from the rise in oil prices that followed the effective closure of the Strait of Hormuz and corresponding reduction in oil supply. The Fund's cash position had no material impact on performance. The use of derivatives did not have a material impact on results.
What detracted from performance?
The Fund’s positions in Mosaic Co., Mondi PLC, and Novonesis A/S were among the leading detractors from absolute performance. Mosaic’s underperformance reflected weakness in fertilizer prices in the first half of the period, as well as investor concerns about production volumes and profit margins in the company’s potash business. Mondi was impacted by continued softness in global packaging and paper market volumes, while the Danish biosolutions company Novonesis lagged due to earnings growth that fell short of consensus expectations.
The views expressed reflect the opinions of BlackRock as of the date of this report and are subject to change based on changes in market, economic or other conditions. These views are not intended to be a forecast of future events and are no guarantee of future results.
Fund performance
Cumulative performance: June 1, 2016 through May 31, 2026
Initial investment of $10,000
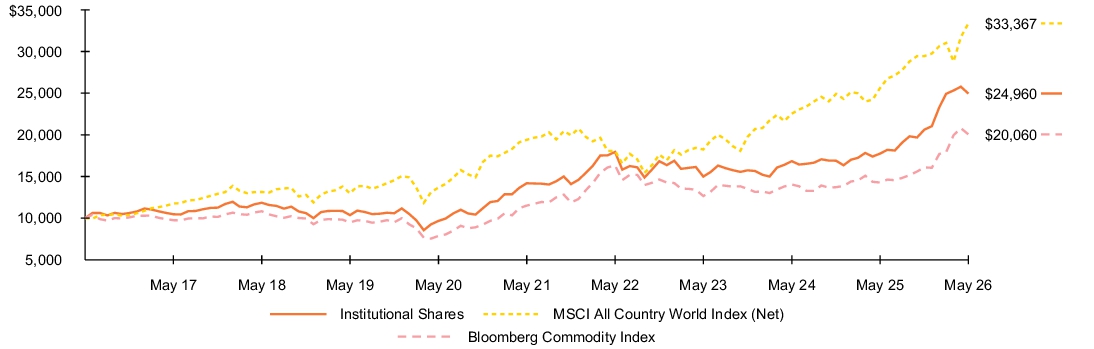
See “Average annual total returns” for additional information on fund performance.
Average annual total returns
| 1 Year | 5 Years | 10 Years | |||
| 40.65 | % | 11.95 | % | 9.58 | % |
| 30.27 | 11.45 | 12.81 | |||
| 40.47 | 11.75 | 7.21 |
Key Fund statistics
| $1,274,258,104 |
| 375 |
| $5,072,036 |
| 88% |
What did the Fund invest in?
(as of May 31, 2026)
Industry allocation
| Industry(a) | Percent of Net Assets |
|
| 20.9 | % | |
| 11.0 | ||
| 7.7 | ||
| 3.3 | ||
| 2.3 | ||
| 1.4 | ||
| 1.3 | ||
| 1.3 | ||
| 49.0 | ||
| 1.8 |
Ten largest holdings
| Security(b) | Percent of Net Assets |
|
| 4.5 | % | |
| 3.1 | ||
| 2.6 | ||
| 2.5 | ||
| 2.4 | ||
| 2.3 | ||
| 2.0 | ||
| 1.7 | ||
| 1.4 | ||
| 1.3 |
| For purposes of this report, industry sub-classifications may differ from those utilized by the Fund for compliance purposes. |
| Excludes short-term securities. |
Ten largest holdings
| Security(b) | Percent of Net Assets |
|
| 4.5 | % | |
| 3.1 | ||
| 2.6 | ||
| 2.5 | ||
| 2.4 | ||
| 2.3 | ||
| 2.0 | ||
| 1.7 | ||
| 1.4 | ||
| 1.3 |
What were the Fund costs for the last year?
(based on a hypothetical $10,000 investment)
| Class name | Costs of a $10,000 investment |
Costs paid as a percentage of a $10,000 investment |
| $120 | 1.00% |
How did the Fund perform last year?
- For the reporting period ended May 31, 2026, the Fund's Investor A Shares returned 40.45%.
- For the same period, the Fund’s benchmark, the MSCI All Country World Index (Net) returned 30.27% and the Bloomberg Commodity Index returned 40.47%.
What contributed to performance?
The Fund’s holdings in commodity derivatives—which it uses to gain exposure to physical commodities—contributed to absolute performance. Its positions in the gold mining stocks Newmont Corp., Barrick Mining Corp., and Kinross Gold Corp., which benefited from rising gold prices and strong operating results, were among the top contributors at the individual stock level. Exxon Mobil Corp. also contributed to returns. The shares benefited from the rise in oil prices that followed the effective closure of the Strait of Hormuz and corresponding reduction in oil supply. The Fund's cash position had no material impact on performance. The use of derivatives did not have a material impact on results.
What detracted from performance?
The Fund’s positions in Mosaic Co., Mondi PLC, and Novonesis A/S were among the leading detractors from absolute performance. Mosaic’s underperformance reflected weakness in fertilizer prices in the first half of the period, as well as investor concerns about production volumes and profit margins in the company’s potash business. Mondi was impacted by continued softness in global packaging and paper market volumes, while the Danish biosolutions company Novonesis lagged due to earnings growth that fell short of consensus expectations.
The views expressed reflect the opinions of BlackRock as of the date of this report and are subject to change based on changes in market, economic or other conditions. These views are not intended to be a forecast of future events and are no guarantee of future results.
Fund performance
Cumulative performance: June 1, 2016 through May 31, 2026
Initial investment of $10,000
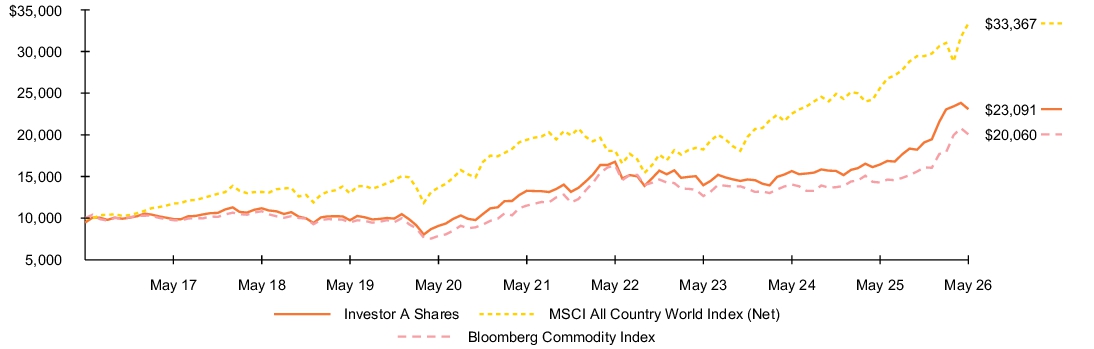
See “Average annual total returns” for additional information on fund performance.
Average annual total returns
| 1 Year | 5 Years | 10 Years | |||
| 40.45 | % | 11.69 | % | 9.32 | % |
| 33.07 | 10.49 | 8.73 | |||
| 30.27 | 11.45 | 12.81 | |||
| 40.47 | 11.75 | 7.21 |
Key Fund statistics
| $1,274,258,104 |
| 375 |
| $5,072,036 |
| 88% |
What did the Fund invest in?
(as of May 31, 2026)
Industry allocation
| Industry(a) | Percent of Net Assets |
|
| 20.9 | % | |
| 11.0 | ||
| 7.7 | ||
| 3.3 | ||
| 2.3 | ||
| 1.4 | ||
| 1.3 | ||
| 1.3 | ||
| 49.0 | ||
| 1.8 |
Ten largest holdings
| Security(b) | Percent of Net Assets |
|
| 4.5 | % | |
| 3.1 | ||
| 2.6 | ||
| 2.5 | ||
| 2.4 | ||
| 2.3 | ||
| 2.0 | ||
| 1.7 | ||
| 1.4 | ||
| 1.3 |
| For purposes of this report, industry sub-classifications may differ from those utilized by the Fund for compliance purposes. |
| Excludes short-term securities. |
Ten largest holdings
| Security(b) | Percent of Net Assets |
|
| 4.5 | % | |
| 3.1 | ||
| 2.6 | ||
| 2.5 | ||
| 2.4 | ||
| 2.3 | ||
| 2.0 | ||
| 1.7 | ||
| 1.4 | ||
| 1.3 |
What were the Fund costs for the last year?
(based on a hypothetical $10,000 investment)
| Class name | Costs of a $10,000 investment |
Costs paid as a percentage of a $10,000 investment |
| $210 | 1.75% |
How did the Fund perform last year?
- For the reporting period ended May 31, 2026, the Fund's Investor C Shares returned 39.43%.
- For the same period, the Fund’s benchmark, the MSCI All Country World Index (Net) returned 30.27% and the Bloomberg Commodity Index returned 40.47%.
What contributed to performance?
The Fund’s holdings in commodity derivatives—which it uses to gain exposure to physical commodities—contributed to absolute performance. Its positions in the gold mining stocks Newmont Corp., Barrick Mining Corp., and Kinross Gold Corp., which benefited from rising gold prices and strong operating results, were among the top contributors at the individual stock level. Exxon Mobil Corp. also contributed to returns. The shares benefited from the rise in oil prices that followed the effective closure of the Strait of Hormuz and corresponding reduction in oil supply. The Fund's cash position had no material impact on performance. The use of derivatives did not have a material impact on results.
What detracted from performance?
The Fund’s positions in Mosaic Co., Mondi PLC, and Novonesis A/S were among the leading detractors from absolute performance. Mosaic’s underperformance reflected weakness in fertilizer prices in the first half of the period, as well as investor concerns about production volumes and profit margins in the company’s potash business. Mondi was impacted by continued softness in global packaging and paper market volumes, while the Danish biosolutions company Novonesis lagged due to earnings growth that fell short of consensus expectations.
The views expressed reflect the opinions of BlackRock as of the date of this report and are subject to change based on changes in market, economic or other conditions. These views are not intended to be a forecast of future events and are no guarantee of future results.
Fund performance
Cumulative performance: June 1, 2016 through May 31, 2026
Initial investment of $10,000
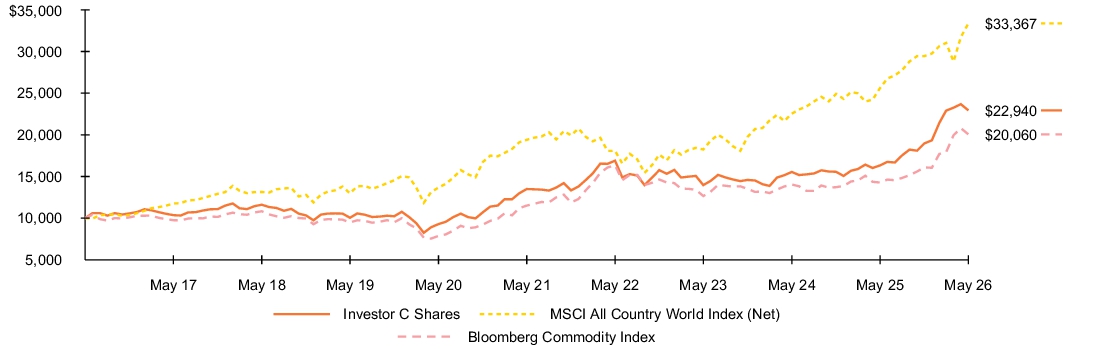
See “Average annual total returns” for additional information on fund performance.
Average annual total returns
| 1 Year | 5 Years | 10 Years | |||
| 39.43 | % | 10.86 | % | 8.66 | % |
| 38.43 | 10.86 | 8.66 | |||
| 30.27 | 11.45 | 12.81 | |||
| 40.47 | 11.75 | 7.21 |
Key Fund statistics
| $1,274,258,104 |
| 375 |
| $5,072,036 |
| 88% |
What did the Fund invest in?
(as of May 31, 2026)
Industry allocation
| Industry(a) | Percent of Net Assets |
|
| 20.9 | % | |
| 11.0 | ||
| 7.7 | ||
| 3.3 | ||
| 2.3 | ||
| 1.4 | ||
| 1.3 | ||
| 1.3 | ||
| 49.0 | ||
| 1.8 |
Ten largest holdings
| Security(b) | Percent of Net Assets |
|
| 4.5 | % | |
| 3.1 | ||
| 2.6 | ||
| 2.5 | ||
| 2.4 | ||
| 2.3 | ||
| 2.0 | ||
| 1.7 | ||
| 1.4 | ||
| 1.3 |
| For purposes of this report, industry sub-classifications may differ from those utilized by the Fund for compliance purposes. |
| Excludes short-term securities. |
Ten largest holdings
| Security(b) | Percent of Net Assets |
|
| 4.5 | % | |
| 3.1 | ||
| 2.6 | ||
| 2.5 | ||
| 2.4 | ||
| 2.3 | ||
| 2.0 | ||
| 1.7 | ||
| 1.4 | ||
| 1.3 |
What were the Fund costs for the last year?
(based on a hypothetical $10,000 investment)
| Class name | Costs of a $10,000 investment |
Costs paid as a percentage of a $10,000 investment |
| $84 | 0.70% |
How did the Fund perform last year?
- For the reporting period ended May 31, 2026, the Fund's Class K Shares returned 40.78%.
- For the same period, the Fund’s benchmark, the MSCI All Country World Index (Net) returned 30.27% and the Bloomberg Commodity Index returned 40.47%.
What contributed to performance?
The Fund’s holdings in commodity derivatives—which it uses to gain exposure to physical commodities—contributed to absolute performance. Its positions in the gold mining stocks Newmont Corp., Barrick Mining Corp., and Kinross Gold Corp., which benefited from rising gold prices and strong operating results, were among the top contributors at the individual stock level. Exxon Mobil Corp. also contributed to returns. The shares benefited from the rise in oil prices that followed the effective closure of the Strait of Hormuz and corresponding reduction in oil supply. The Fund's cash position had no material impact on performance. The use of derivatives did not have a material impact on results.
What detracted from performance?
The Fund’s positions in Mosaic Co., Mondi PLC, and Novonesis A/S were among the leading detractors from absolute performance. Mosaic’s underperformance reflected weakness in fertilizer prices in the first half of the period, as well as investor concerns about production volumes and profit margins in the company’s potash business. Mondi was impacted by continued softness in global packaging and paper market volumes, while the Danish biosolutions company Novonesis lagged due to earnings growth that fell short of consensus expectations.
The views expressed reflect the opinions of BlackRock as of the date of this report and are subject to change based on changes in market, economic or other conditions. These views are not intended to be a forecast of future events and are no guarantee of future results.
Fund performance
Cumulative performance: June 1, 2016 through May 31, 2026
Initial investment of $10,000
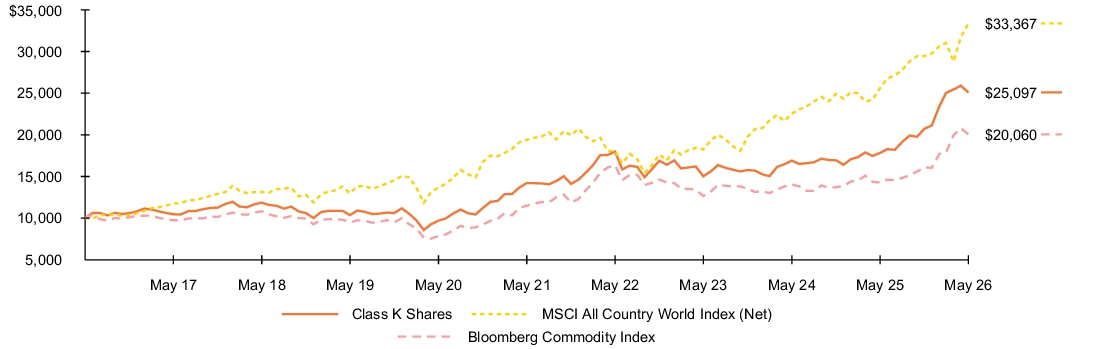
See “Average annual total returns” for additional information on fund performance.
Average annual total returns
| 1 Year | 5 Years | 10 Years | |||
| 40.78 | % | 12.04 | % | 9.64 | % |
| 30.27 | 11.45 | 12.81 | |||
| 40.47 | 11.75 | 7.21 |
Key Fund statistics
| $1,274,258,104 |
| 375 |
| $5,072,036 |
| 88% |
What did the Fund invest in?
(as of May 31, 2026)
Industry allocation
| Industry(a) | Percent of Net Assets |
|
| 20.9 | % | |
| 11.0 | ||
| 7.7 | ||
| 3.3 | ||
| 2.3 | ||
| 1.4 | ||
| 1.3 | ||
| 1.3 | ||
| 49.0 | ||
| 1.8 |
Ten largest holdings
| Security(b) | Percent of Net Assets |
|
| 4.5 | % | |
| 3.1 | ||
| 2.6 | ||
| 2.5 | ||
| 2.4 | ||
| 2.3 | ||
| 2.0 | ||
| 1.7 | ||
| 1.4 | ||
| 1.3 |
| For purposes of this report, industry sub-classifications may differ from those utilized by the Fund for compliance purposes. |
| Excludes short-term securities. |
Ten largest holdings
| Security(b) | Percent of Net Assets |
|
| 4.5 | % | |
| 3.1 | ||
| 2.6 | ||
| 2.5 | ||
| 2.4 | ||
| 2.3 | ||
| 2.0 | ||
| 1.7 | ||
| 1.4 | ||
| 1.3 |
What were the Fund costs for the last year?
(based on a hypothetical $10,000 investment)
| Class name | Costs of a $10,000 investment |
Costs paid as a percentage of a $10,000 investment |
| $55 | 0.45% |
How did the Fund perform last year?
- For the reporting period ended May 31, 2026, the Fund's Class K Shares returned 44.87%.
- For the same period, the Fund’s benchmark, the Russell 3000 Index returned 29.45% and the Russell 2000 Index returned 43.08%.
What contributed to performance?
Holdings in the information technology sector made the largest contribution to the Fund’s absolute performance, driven primarily by successful positioning in the computer electronics, commercial equipment, and semiconductor industries. Stocks expected to benefit from the growth of AI were notable contributors in these areas. Macroeconomic and industry-based insights that assess external financing discipline and revenue generation were particularly effective in identifying areas of the technology sector positioned to benefit from favorable industry dynamics.
Industrials also contributed meaningfully as improving manufacturing expectations led to strong returns for construction & engineering companies. This positioning was supported by text-based insights analyzing trending topics across company conference calls and broker reports, as well as certain sentiment measures that identify linkages between companies.
What detracted from performance?
While the Fund generated strong returns during the reporting period, some aspects of its positioning detracted. Insights that evaluate input cost sensitivity by looking at imports incorrectly positioned the portfolio in the consumer staples sector, slightly detracting from performance. Food retailers and apparel companies were notable detractors in this area, reflecting weaker retail spending caused by tariff uncertainty and fuel-cost pressures. Additionally, certain quality insights with a preference for lower-volatility stocks underperformed.
The views expressed reflect the opinions of BlackRock as of the date of this report and are subject to change based on changes in market, economic or other conditions. These views are not intended to be a forecast of future events and are no guarantee of future results.
Fund performance
Cumulative performance: June 1, 2016 through May 31, 2026
Initial investment of $10,000
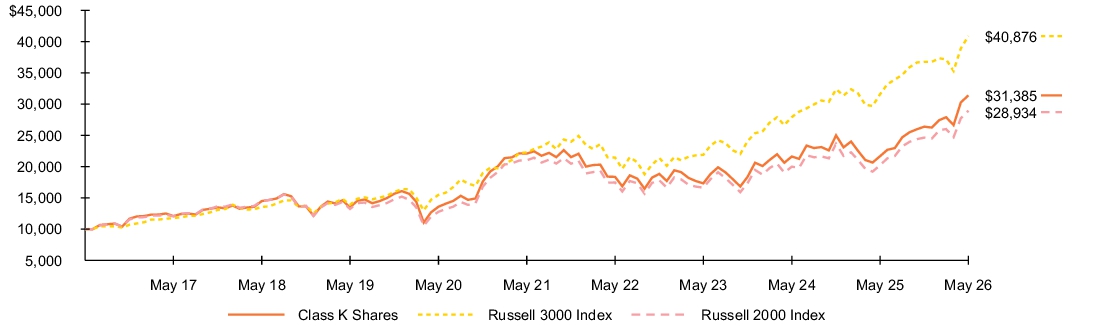
See “Average annual total returns” for additional information on fund performance.
Average annual total returns
| 1 Year | 5 Years | 10 Years | |||
| 44.87 | % | 7.28 | % | 12.12 | % |
| 29.45 | 12.92 | 15.12 | |||
| 43.08 | 6.61 | 11.21 |
Key Fund statistics
| $5,267,477,128 |
| 809 |
| $17,202,296 |
| 92% |
What did the Fund invest in?
(as of May 31, 2026)
Sector allocation
| Sector(a) | Percent of Net Assets |
|
| 20.5 | % | |
| 19.3 | ||
| 15.3 | ||
| 15.3 | ||
| 7.7 | ||
| 6.0 | ||
| 4.4 | ||
| 3.5 | ||
| 2.9 | ||
| 2.2 | ||
| 1.6 | ||
| 4.5 | ||
| (3.2 | ) |
Ten largest holdings
| Security(b) | Percent of Net Assets |
|
| 2.0 | % | |
| 1.3 | ||
| 0.8 | ||
| 0.8 | ||
| 0.8 | ||
| 0.7 | ||
| 0.7 | ||
| 0.7 | ||
| 0.7 | ||
| 0.7 |
| For purposes of this report, sector sub-classifications may differ from those utilized by the Fund for compliance purposes. |
| Excludes short-term securities. |
Ten largest holdings
| Security(b) | Percent of Net Assets |
|
| 2.0 | % | |
| 1.3 | ||
| 0.8 | ||
| 0.8 | ||
| 0.8 | ||
| 0.7 | ||
| 0.7 | ||
| 0.7 | ||
| 0.7 | ||
| 0.7 |
What were the Fund costs for the last year?
(based on a hypothetical $10,000 investment)
| Class name | Costs of a $10,000 investment |
Costs paid as a percentage of a $10,000 investment |
| $182 | 1.50% |
How did the Fund perform last year?
- For the reporting period ended May 31, 2026, the Fund's Investor C Shares returned 43.32%.
- For the same period, the Fund’s benchmark, the Russell 3000 Index returned 29.45% and the Russell 2000 Index returned 43.08%.
What contributed to performance?
Holdings in the information technology sector made the largest contribution to the Fund’s absolute performance, driven primarily by successful positioning in the computer electronics, commercial equipment, and semiconductor industries. Stocks expected to benefit from the growth of AI were notable contributors in these areas. Macroeconomic and industry-based insights that assess external financing discipline and revenue generation were particularly effective in identifying areas of the technology sector positioned to benefit from favorable industry dynamics.
Industrials also contributed meaningfully as improving manufacturing expectations led to strong returns for construction & engineering companies. This positioning was supported by text-based insights analyzing trending topics across company conference calls and broker reports, as well as certain sentiment measures that identify linkages between companies.
What detracted from performance?
While the Fund generated strong returns during the reporting period, some aspects of its positioning detracted. Insights that evaluate input cost sensitivity by looking at imports incorrectly positioned the portfolio in the consumer staples sector, slightly detracting from performance. Food retailers and apparel companies were notable detractors in this area, reflecting weaker retail spending caused by tariff uncertainty and fuel-cost pressures. Additionally, certain quality insights with a preference for lower-volatility stocks underperformed.
The views expressed reflect the opinions of BlackRock as of the date of this report and are subject to change based on changes in market, economic or other conditions. These views are not intended to be a forecast of future events and are no guarantee of future results.
Fund performance
Cumulative performance: June 1, 2016 through May 31, 2026
Initial investment of $10,000
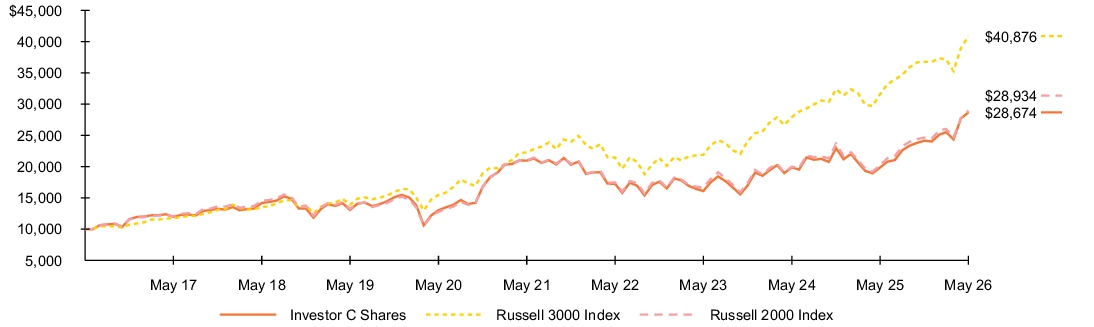
See “Average annual total returns” for additional information on fund performance.
Average annual total returns
| 1 Year | 5 Years | 10 Years | |||
| 43.32 | % | 6.15 | % | 11.11 | % |
| 42.32 | 6.15 | 11.11 | |||
| 29.45 | 12.92 | 15.12 | |||
| 43.08 | 6.61 | 11.21 |
Key Fund statistics
| $5,267,477,128 |
| 809 |
| $17,202,296 |
| 92% |
What did the Fund invest in?
(as of May 31, 2026)
Sector allocation
| Sector(a) | Percent of Net Assets |
|
| 20.5 | % | |
| 19.3 | ||
| 15.3 | ||
| 15.3 | ||
| 7.7 | ||
| 6.0 | ||
| 4.4 | ||
| 3.5 | ||
| 2.9 | ||
| 2.2 | ||
| 1.6 | ||
| 4.5 | ||
| (3.2 | ) |
Ten largest holdings
| Security(b) | Percent of Net Assets |
|
| 2.0 | % | |
| 1.3 | ||
| 0.8 | ||
| 0.8 | ||
| 0.8 | ||
| 0.7 | ||
| 0.7 | ||
| 0.7 | ||
| 0.7 | ||
| 0.7 |
| For purposes of this report, sector sub-classifications may differ from those utilized by the Fund for compliance purposes. |
| Excludes short-term securities. |
Ten largest holdings
| Security(b) | Percent of Net Assets |
|
| 2.0 | % | |
| 1.3 | ||
| 0.8 | ||
| 0.8 | ||
| 0.8 | ||
| 0.7 | ||
| 0.7 | ||
| 0.7 | ||
| 0.7 | ||
| 0.7 |
What were the Fund costs for the last year?
(based on a hypothetical $10,000 investment)
| Class name | Costs of a $10,000 investment |
Costs paid as a percentage of a $10,000 investment |
| $92 | 0.75% |
How did the Fund perform last year?
- For the reporting period ended May 31, 2026, the Fund's Investor A Shares returned 44.41%.
- For the same period, the Fund’s benchmark, the Russell 3000 Index returned 29.45% and the Russell 2000 Index returned 43.08%.
What contributed to performance?
Holdings in the information technology sector made the largest contribution to the Fund’s absolute performance, driven primarily by successful positioning in the computer electronics, commercial equipment, and semiconductor industries. Stocks expected to benefit from the growth of AI were notable contributors in these areas. Macroeconomic and industry-based insights that assess external financing discipline and revenue generation were particularly effective in identifying areas of the technology sector positioned to benefit from favorable industry dynamics.
Industrials also contributed meaningfully as improving manufacturing expectations led to strong returns for construction & engineering companies. This positioning was supported by text-based insights analyzing trending topics across company conference calls and broker reports, as well as certain sentiment measures that identify linkages between companies.
What detracted from performance?
While the Fund generated strong returns during the reporting period, some aspects of its positioning detracted. Insights that evaluate input cost sensitivity by looking at imports incorrectly positioned the portfolio in the consumer staples sector, slightly detracting from performance. Food retailers and apparel companies were notable detractors in this area, reflecting weaker retail spending caused by tariff uncertainty and fuel-cost pressures. Additionally, certain quality insights with a preference for lower-volatility stocks underperformed.
The views expressed reflect the opinions of BlackRock as of the date of this report and are subject to change based on changes in market, economic or other conditions. These views are not intended to be a forecast of future events and are no guarantee of future results.
Fund performance
Cumulative performance: June 1, 2016 through May 31, 2026
Initial investment of $10,000
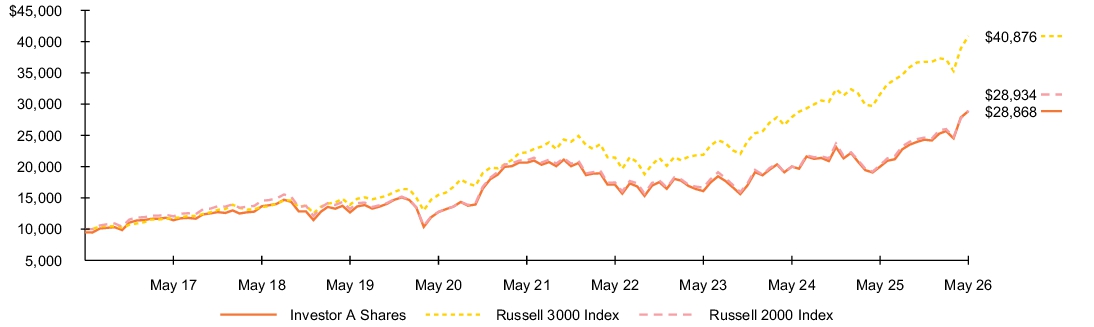
See “Average annual total returns” for additional information on fund performance.
Average annual total returns
| 1 Year | 5 Years | 10 Years | |||
| 44.41 | % | 6.96 | % | 11.79 | % |
| 36.82 | 5.81 | 11.18 | |||
| 29.45 | 12.92 | 15.12 | |||
| 43.08 | 6.61 | 11.21 |
Key Fund statistics
| $5,267,477,128 |
| 809 |
| $17,202,296 |
| 92% |
What did the Fund invest in?
(as of May 31, 2026)
Sector allocation
| Sector(a) | Percent of Net Assets |
|
| 20.5 | % | |
| 19.3 | ||
| 15.3 | ||
| 15.3 | ||
| 7.7 | ||
| 6.0 | ||
| 4.4 | ||
| 3.5 | ||
| 2.9 | ||
| 2.2 | ||
| 1.6 | ||
| 4.5 | ||
| (3.2 | ) |
Ten largest holdings
| Security(b) | Percent of Net Assets |
|
| 2.0 | % | |
| 1.3 | ||
| 0.8 | ||
| 0.8 | ||
| 0.8 | ||
| 0.7 | ||
| 0.7 | ||
| 0.7 | ||
| 0.7 | ||
| 0.7 |
| For purposes of this report, sector sub-classifications may differ from those utilized by the Fund for compliance purposes. |
| Excludes short-term securities. |
Ten largest holdings
| Security(b) | Percent of Net Assets |
|
| 2.0 | % | |
| 1.3 | ||
| 0.8 | ||
| 0.8 | ||
| 0.8 | ||
| 0.7 | ||
| 0.7 | ||
| 0.7 | ||
| 0.7 | ||
| 0.7 |
What were the Fund costs for the last year?
(based on a hypothetical $10,000 investment)
| Class name | Costs of a $10,000 investment |
Costs paid as a percentage of a $10,000 investment |
| $61 | 0.50% |
How did the Fund perform last year?
- For the reporting period ended May 31, 2026, the Fund's Institutional Shares returned 44.80%.
- For the same period, the Fund’s benchmark, the Russell 3000 Index returned 29.45% and the Russell 2000 Index returned 43.08%.
What contributed to performance?
Holdings in the information technology sector made the largest contribution to the Fund’s absolute performance, driven primarily by successful positioning in the computer electronics, commercial equipment, and semiconductor industries. Stocks expected to benefit from the growth of AI were notable contributors in these areas. Macroeconomic and industry-based insights that assess external financing discipline and revenue generation were particularly effective in identifying areas of the technology sector positioned to benefit from favorable industry dynamics.
Industrials also contributed meaningfully as improving manufacturing expectations led to strong returns for construction & engineering companies. This positioning was supported by text-based insights analyzing trending topics across company conference calls and broker reports, as well as certain sentiment measures that identify linkages between companies.
What detracted from performance?
While the Fund generated strong returns during the reporting period, some aspects of its positioning detracted. Insights that evaluate input cost sensitivity by looking at imports incorrectly positioned the portfolio in the consumer staples sector, slightly detracting from performance. Food retailers and apparel companies were notable detractors in this area, reflecting weaker retail spending caused by tariff uncertainty and fuel-cost pressures. Additionally, certain quality insights with a preference for lower-volatility stocks underperformed.
The views expressed reflect the opinions of BlackRock as of the date of this report and are subject to change based on changes in market, economic or other conditions. These views are not intended to be a forecast of future events and are no guarantee of future results.
Fund performance
Cumulative performance: June 1, 2016 through May 31, 2026
Initial investment of $10,000
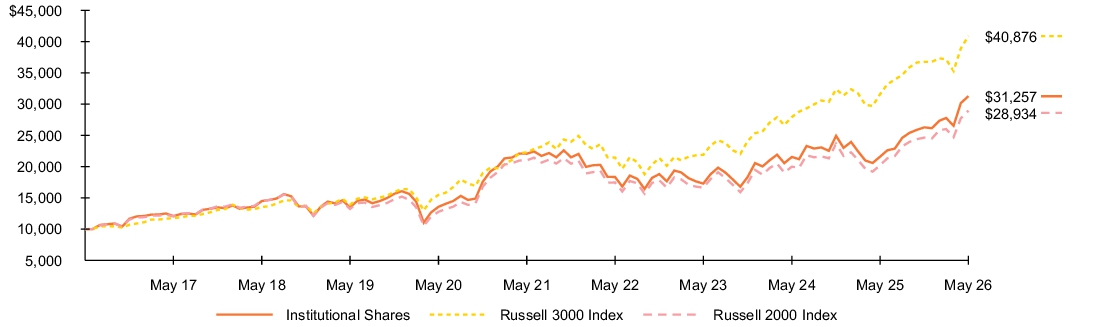
See “Average annual total returns” for additional information on fund performance.
Average annual total returns
| 1 Year | 5 Years | 10 Years | |||
| 44.80 | % | 7.22 | % | 12.07 | % |
| 29.45 | 12.92 | 15.12 | |||
| 43.08 | 6.61 | 11.21 |
Key Fund statistics
| $5,267,477,128 |
| 809 |
| $17,202,296 |
| 92% |
What did the Fund invest in?
(as of May 31, 2026)
Sector allocation
| Sector(a) | Percent of Net Assets |
|
| 20.5 | % | |
| 19.3 | ||
| 15.3 | ||
| 15.3 | ||
| 7.7 | ||
| 6.0 | ||
| 4.4 | ||
| 3.5 | ||
| 2.9 | ||
| 2.2 | ||
| 1.6 | ||
| 4.5 | ||
| (3.2 | ) |
Ten largest holdings
| Security(b) | Percent of Net Assets |
|
| 2.0 | % | |
| 1.3 | ||
| 0.8 | ||
| 0.8 | ||
| 0.8 | ||
| 0.7 | ||
| 0.7 | ||
| 0.7 | ||
| 0.7 | ||
| 0.7 |
| For purposes of this report, sector sub-classifications may differ from those utilized by the Fund for compliance purposes. |
| Excludes short-term securities. |
Ten largest holdings
| Security(b) | Percent of Net Assets |
|
| 2.0 | % | |
| 1.3 | ||
| 0.8 | ||
| 0.8 | ||
| 0.8 | ||
| 0.7 | ||
| 0.7 | ||
| 0.7 | ||
| 0.7 | ||
| 0.7 |