Exhibit 99.1
Management's
Discussion and Analysis
Basis of Presentation
The following management's discussion and analysis ("MD&A") was prepared as of August 5, 2026 and is a review of the results of operations and the liquidity and capital resources of South Bow Corporation and its subsidiaries (collectively, "South Bow" or the "Company"). This MD&A should be read in conjunction with the accompanying unaudited consolidated interim financial statements and notes thereto (the "accompanying financial statements") of South Bow as at and for the three and six months ended June 30, 2026, the annual audited consolidated financial statements of South Bow as at and for the years ended December 31, 2025 and 2024 and notes thereto (the "annual financial statements") and the accompanying MD&A for the year ended December 31, 2025, as well as South Bow's annual information form ("AIF") for the year ended December 31, 2025, each of which are available on South Bow's website at www.southbow.com, under South Bow's electronic profile on SEDAR+ at www.sedarplus.ca, and in South Bow's filings with the U.S. Securities and Exchange Commission ("SEC") at www.sec.gov.
Unless otherwise noted, all financial figures in this MD&A are in United States ("U.S.") dollars.
This MD&A contains non-GAAP financial measures and forward-looking statements. Refer to the Specified Financial Measures and Forward-looking Information sections of this MD&A for additional details. Refer to the Glossary section for abbreviations and capitalized terms commonly used in this MD&A.
Corporate Profile
South Bow Overview
South Bow is an energy infrastructure company that owns and operates critical liquids pipelines and facilities extending across Canada and the U.S., safely and reliably connecting robust crude oil supplies to key refining and demand markets in the U.S. Midwest and U.S. Gulf Coast. South Bow seeks to optimize its assets, invest strategically to sustainably grow its cash flows, and pay a meaningful dividend, if, as, and when declared by South Bow's board of directors (the "Board"). The majority of South Bow's revenues are generated through long-term committed transportation arrangements, whereby customers receive liquids transportation or storage services in exchange for a committed monthly payment.
South Bow takes a disciplined approach to capital allocation to preserve optionality and maximize total shareholder returns over the long term. The Company's capital allocation priorities are built on a foundation of financial strength and are supported by South Bow's stable, predictable cash flows. South Bow's capital allocation priorities include: paying a sustainable base dividend; strengthening the Company's investment-grade financial position; and leveraging existing infrastructure within South Bow's strategic corridor to offer customers competitive connections, enhanced optionality, and value chain extensions.
South Bow has three reportable segments: Keystone Pipeline System, Marketing, and Intra-Alberta & Other.
In 2024, the Company completed the spinoff from TC Energy Corporation ("Former Parent") to form South Bow as a publicly traded company (the "Spinoff").
South Bow Corporation Second Quarter 2026 Management's Discussion and Analysis | 1
Financial Highlights
| | | | | | | | | | | | | | | | | |
| U.S.$ millions, except per-share amounts, ratios, and where noted | Three Months Ended June 30, | | Six Months Ended June 30, |
| 2026 | 2025 | | 2026 | 2025 |
Financial Results | | | | | |
| Revenue | 546 | | 524 | | | 1,037 | | 1,022 | |
| Income from equity investments | 14 | | 13 | | | 27 | | 26 | |
| | | | | |
| Income before income taxes | 174 | | 126 | | | 274 | | 240 | |
Normalized earnings before interest, income taxes, depreciation, and amortization ("normalized EBITDA") 1 | 280 | | 250 | | | 537 | | 516 | |
Distributable cash flow 1 | 175 | | 167 | | | 343 | | 324 | |
Total capital expenditures 2 | 13 | | 43 | | | 21 | | 107 | |
| | | | | |
| Net income | 134 | | 96 | | | 211 | | 184 | |
Weighted average common shares outstanding - diluted (millions) | 208.8 | | 208.8 | | | 208.7 | | 208.7 | |
Net income per share - diluted | 0.64 | | 0.46 | | | 1.01 | | 0.88 | |
Normalized net income 1 | 104 | | 87 | | | 196 | | 185 | |
Normalized net income per share - diluted 1 | 0.50 | | 0.42 | | | 0.94 | | 0.89 | |
| | | | | |
| Dividends declared | 104 | | 104 | | | 208 | | 208 | |
| Dividends declared per share | 0.50 | | 0.50 | | | 1.00 | | 1.00 | |
| | | | | |
Total long-term debt 3 | 5,734 | | 5,774 | | | 5,734 | | 5,774 | |
Net debt 1 | 4,594 | | 4,903 | | | 4,594 | | 4,903 | |
Net debt-to-normalized EBITDA (ratio) 1 | 4.4 | 4.6 | | 4.4 | 4.6 |
| | | | | |
Operational Results | | | | | |
Keystone Pipeline System Operating Factor ("SOF") (%) 4 | 93 | | 93 | | | 94 | | 95 | |
| Keystone Pipeline throughput (Mbbl/d) | 596 | | 544 | | | 606 | | 578 | |
U.S. Gulf Coast segment of Keystone Pipeline System throughput (Mbbl/d) 5 | 800 | | 760 | | | 755 | | 744 | |
| Marketlink throughput (Mbbl/d) | 642 | | 625 | | | 590 | | 588 | |
| | | | | |
1. Non-GAAP financial measure or ratio, which do not have standard meanings under generally accepted accounting principles ("GAAP") and may not be comparable to similar measures presented by other entities. Refer to the Specified Financial Measures section of this MD&A for additional details.
2. Total capital expenditures is a supplementary measure. Refer to the Specified Financial Measures section of this MD&A for additional details.
3. Total long-term debt includes the Company's senior unsecured notes ("Senior Notes") and junior subordinated notes ("Junior Notes") per the consolidated balance sheets of the accompanying financial statements. Refer to the Long-term Debt, including Credit Facilities section of this MD&A for additional details.
4. SOF measures South Bow's ability to deliver crude oil at the planned maximum rate of the Keystone Pipeline System.
5. Comprises throughput originating in Hardisty, Alberta transported on the Keystone Pipeline System, and throughput originating in Cushing, Oklahoma transported on Marketlink for destination in the U.S. Gulf Coast.
South Bow Corporation Second Quarter 2026 Management's Discussion and Analysis | 2
Change in Income before Income Taxes and Normalized EBITDA
(Three Months Ended June 30, 2026)
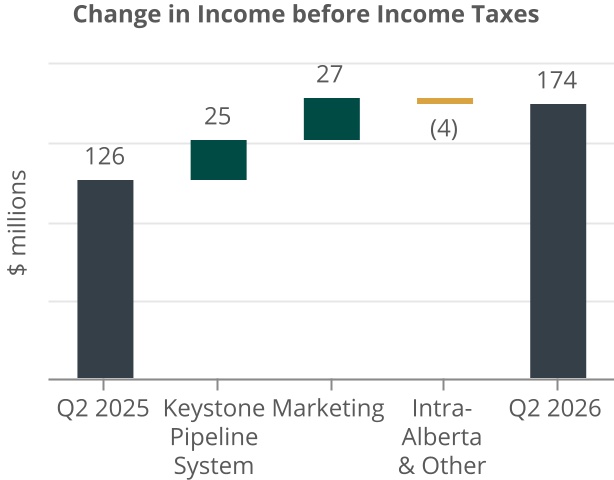
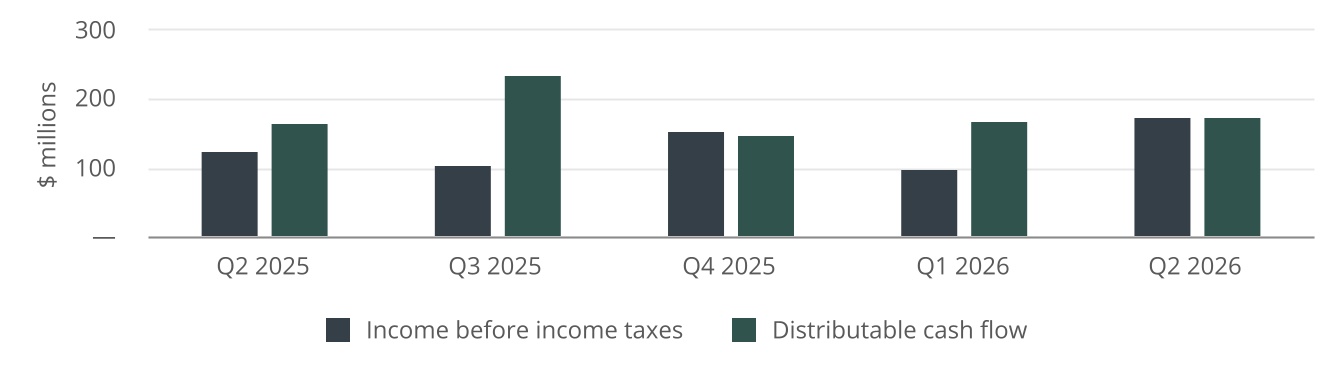
Income before income taxes for the three months ended June 30, 2026 increased to $174 million from $126 million in the same period of 2025, attributable to higher contributions from the Keystone Pipeline System and Marketing segments.
Income before income taxes for the Keystone Pipeline System segment increased during the three months ended June 30, 2026, compared to the same period of 2025, driven primarily by increased throughput associated with increased customer demand to move heavy crude oil towards the U.S. Gulf Coast and increased uncommitted volumes. Additionally, lower operating costs attributable to optimization initiatives and lower power prices contributed to higher income before income taxes during the three months ended June 30, 2026. During the second quarter of 2025, revenues were impacted by the Milepost 171 ("MP-171") incident which resulted in lower throughput on the Keystone Pipeline.
Higher income before income taxes for the Marketing segment in the second quarter of 2026 relative to the second quarter of 2025, was attributable to higher unrealized gains on risk management instruments, and higher physical volumes and average sales prices resulting in expanded physical margins. This was partially offset by realized losses on risk management contracts in the second quarter of 2026 compared to realized gains in the comparative period.
Income before income taxes for the Intra-Alberta & Other segment decreased in the second quarter of 2026 compared to the same period of 2025, primarily attributable to unrealized foreign exchange movements and lower capitalized interest costs partially offset by revenues from the Blackrod Connection Project, interest income on its sales-type lease arrangement and no separation costs in the 2026 period.
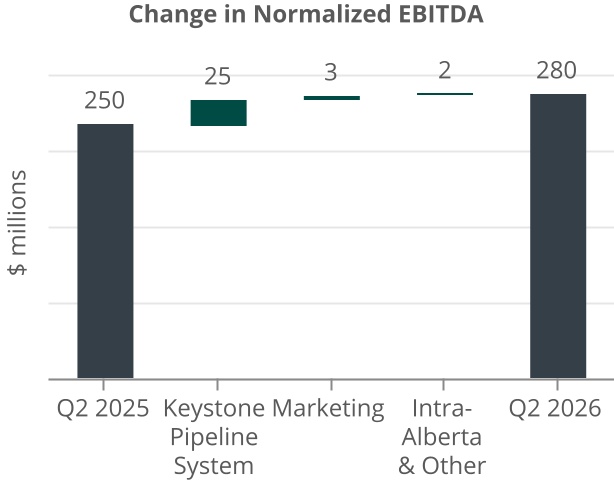
South Bow's normalized EBITDA for the three months ended June 30, 2026 increased to $280 million from $250 million in the same period of 2025, primarily driven by increased income before income taxes in the Keystone Pipeline System as discussed above.
South Bow Corporation Second Quarter 2026 Management's Discussion and Analysis | 3
Change in Income before Income Taxes and Normalized EBITDA
(Six Months Ended June 30, 2026)
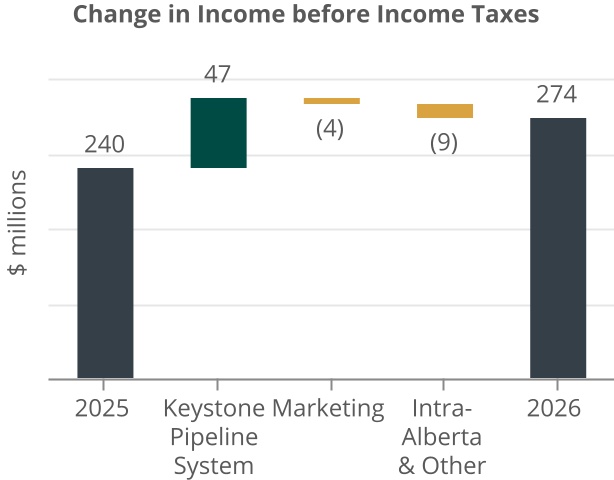
Income before income taxes for the six months ended June 30, 2026 increased to $274 million from $240 million in the same period of 2025, due to an increased contribution from the Keystone Pipeline System, partially offset by decreases in income before income taxes for the Marketing and Intra-Alberta & Other segments.
The increase in the Keystone Pipeline System's income before income taxes during the six months ended June 30, 2026 compared to 2025 was primarily driven by higher throughput due to increased customer demand to move heavy crude oil towards the U.S. Gulf Coast, compared to the 2025 period which was impacted by pressure restrictions as a result of the MP-171 incident. Additionally, the Company recognized $18 million of revenue related to historical variable toll adjustments during the first quarter of 2026 which have been normalized within the Company’s Non-GAAP Financial Measures. Refer to Specified Financial Measures section of this MD&A for additional details.
The Marketing segment's income before income taxes decreased during the six months ended June 30, 2026 from the 2025 period due to realized losses recognized on risk management contracts compared to realized gains recognized in the comparative period, and a lower unrealized gain on risk management contracts. These decreases were partially offset by higher physical margins.
The Company's Intra-Alberta & Other segment income before income taxes decreased during the six months ended June 30, 2026 due to unrealized foreign exchange movements and lower capitalized interest costs, partially offset by interest income earned on its sales-type lease arrangement and revenue from the Blackrod Connection Project.
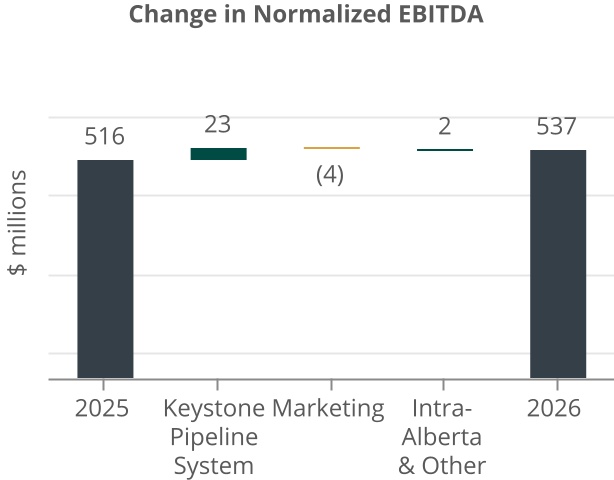
Normalized EBITDA of $537 million for the six months ended June 30, 2026 increased from normalized EBITDA of $516 million for the comparative 2025 period due to increases in the Keystone Pipeline System and Intra-Alberta & Other segments, partially offset by lower normalized EBITDA for the Marketing segment.
The increase in the Keystone Pipeline System segment's normalized EBITDA was a result of higher revenues primarily associated with higher throughput during the six months ended June 30, 2026 compared to 2025.
Lower normalized EBITDA for the Marketing segment was driven by realized losses recognized on risk management contracts in the 2026 period compared to realized gains recognized in the 2025 period.
The increase in normalized EBITDA for the Intra-Alberta & Other segments was a result of lower corporate costs in the 2026 period compared to the 2025 period.
South Bow Corporation Second Quarter 2026 Management's Discussion and Analysis | 4
Revenue and Income from Equity Investments
| | | | | | | | | | | | | | | | | | | | | | | |
| | Three Months Ended June 30, | Six Months Ended June 30, |
U.S.$ millions, except where noted | | | | 2026 | 2025 | Change | 2026 | 2025 | Change |
| | | | | | | | | |
| | | | | | | | | |
| | | | | | | | | |
| Revenues | | | | 546 | 524 | 4 | % | 1,037 | 1,022 | | 1 | % |
| Income from equity investments | | | | 14 | 13 | | 8 | % | 27 | 26 | | 4 | % |
South Bow generated revenue of $546 million during the three months ended June 30, 2026 compared to $524 million in the same period of 2025, driven primarily by the Marketing and Keystone Pipeline System segments.
The Keystone Pipeline System segment generated higher revenues in the second quarter of 2026 compared to the second quarter of 2025 attributable to increased customer demand to move heavy crude oil towards the U.S. Gulf Coast and the pressure restrictions associated with the MP-171 incident that occurred in April 2025, which reduced revenue during the comparative quarter.
The Company's Marketing segment generated higher revenues during the three months ended June 30, 2026 as a result of higher unrealized gains on risk management contracts, and greater volumes sold at a higher price. This was partially offset by realized losses recognized on risk management contracts in the 2026 period compared to realized gains in the 2025 period.
During the six months ended June 30, 2026, the Company generated revenue of $1,037 million compared to $1,022 million in the same period of 2025, driven by higher revenues in the Keystone Pipeline System segment, partially offset by lower revenues in the Marketing segment.
The Company's Keystone Pipeline System generated higher revenues during the six months ended June 30, 2026 relative to the comparative period in 2025 due to increased customer demand to move heavy crude oil towards the U.S. Gulf Coast, as well as the pressure restrictions associated with the MP-171 incident that occurred in the second quarter of 2025, which reduced revenue during the quarter. The Company also recognized $18 million of revenue related to historical variable toll adjustments during the three months ended March 31, 2026 which have been normalized within the Company’s Non-GAAP Financial Measures. Refer to the Specified Financial Measures section of this MD&A for additional details. This was partially offset by a decrease in the 2026 estimated variable toll.
Higher Keystone Pipeline System segment revenues were partially offset by decreased Marketing segment revenues during the six months ended June 30, 2026 compared to the same period in 2025, attributable to realized losses on risk management contracts in the 2026 period compared to realized gains in the comparative period, and a lower unrealized gain on risk management contracts in the 2026 period. These decreases were partially offset by higher average sales prices on oil contracts.
Income from equity investments was comparable during the three and six months ended June 30, 2026 relative to the comparable periods in 2025 due to the long-term nature of the committed contracts associated with the Company's equity investments.
Operating and Other Expenses
| | | | | | | | | | | | | | | | | | | | | | | |
| | Three Months Ended June 30, | Six Months Ended June 30, |
U.S.$ millions, except where noted | | | | 2026 | 2025 | Change | 2026 | 2025 | Change |
| Plant operating costs and other | | | | 181 | | 196 | | (8) | % | 374 | | 367 | | 2 | % |
| Commodity purchases resold | | | | 61 | | 79 | | (23) | % | 135 | | 163 | | (17) | % |
| Depreciation and amortization | | | | 65 | | 63 | | 3 | % | 129 | | 125 | | 3 | % |
| Other | | | | — | | — | | — | % | — | | 3 | | (100) | % |
Total | | | | 307 | | 338 | | (9) | % | 638 | | 658 | | (3) | % |
Plant operating costs and other decreased during the three months ended June 30, 2026 compared to the 2025 period, primarily driven by lower Keystone Pipeline System operating costs due to optimization initiatives and lower power prices. This was partially offset by higher corporate costs incurred by the Intra-Alberta & Other segment and higher costs in the Marketing segment.
South Bow Corporation Second Quarter 2026 Management's Discussion and Analysis | 5
Plant operating costs and other increased during the six months ended June 30, 2026 as a result of pressure restrictions imposed on the Keystone Pipeline and increased integrity-related activities in connection with MP-171, as well as higher corporate costs in the Intra-Alberta & Other segment. Additionally, the Company incurred costs during the six months ended June 30, 2026 associated with initial business development activities related to the proposed Prairie Connector project. Refer to the Recent Developments section of this MD&A for additional details.
Expenses related to commodity purchases resold decreased during the three and six months ended June 30, 2026 due to lower quantities purchased relative to the comparative periods in 2025, partially offset by higher commodity prices.
Depreciation and amortization slightly increased in the 2026 period as South Bow had additional assets in-service in the 2026 period compared to 2025.
Net Income and Normalized Net Income
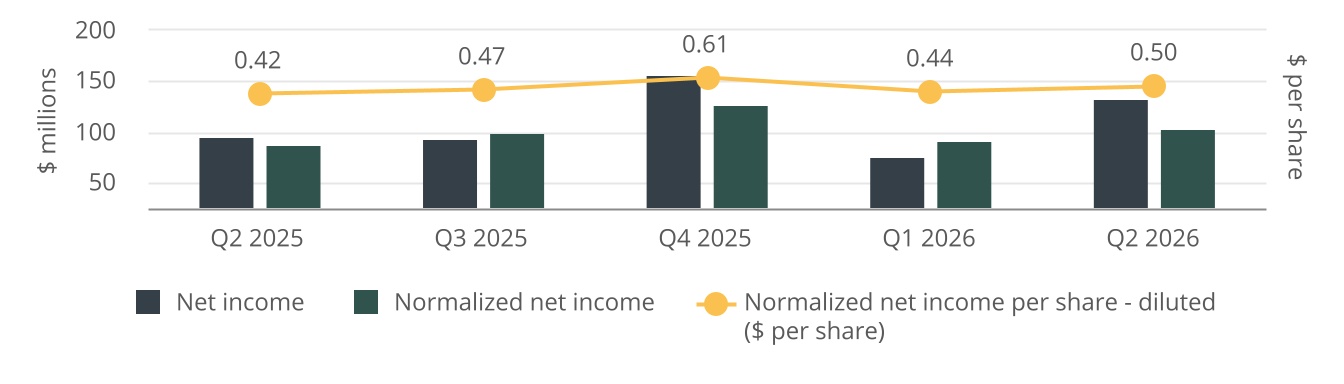
South Bow recognized net income and normalized net income of $134 million and $104 million, respectively, during the three months ended June 30, 2026, compared to net income and normalized net income of $96 million and $87 million, respectively, during the comparative period of 2025. During the six months ended June 30, 2026, the Company recognized net income and normalized net income of $211 million and $196 million, respectively, compared to net income and normalized net income of $184 million and $185 million during the six months ended June 30, 2025.
The increase in net income during the three and six months ended June 30, 2026 compared to the same periods in 2025 was primarily attributable to increases in income before income taxes discussed above, partially offset by an increase in income tax expense. The increase during the three and six months ended June 30, 2026 in normalized net income compared to the same periods in 2025 was primarily attributable to higher normalized EBITDA, partially offset by an increase in income tax expense.
Normalized net income was $0.50 per share (diluted) in the second quarter of 2026 compared to $0.42 per share (diluted) in the second quarter of 2025.
South Bow Corporation Second Quarter 2026 Management's Discussion and Analysis | 6
Distributable Cash Flow
Distributable cash flow generated during the three and six months ended June 30, 2026 increased to $175 million and $343 million, respectively, from $167 million and $324 million generated during the three and six months ended June 30, 2025. The increase in distributable cash flow was primarily driven by increased income before income taxes as discussed above, partially offset by higher current income tax expense and lower distributions from equity investments due to timing of working capital commitments in the second quarter of 2026.
Total Long-term Debt and Net Debt
1. Total long-term debt at June 30, 2026 and December 31, 2025 includes the Company's Senior Notes and Junior Notes. Refer to the Long-term Debt, including Credit Facilities section of this MD&A for additional details.
2. Net debt at June 30, 2026 and December 31, 2025 includes 50 per cent equity treatment of the Company's Junior Notes. Refer to the Specified Financial Measures section of this MD&A for additional details on composition of net debt.
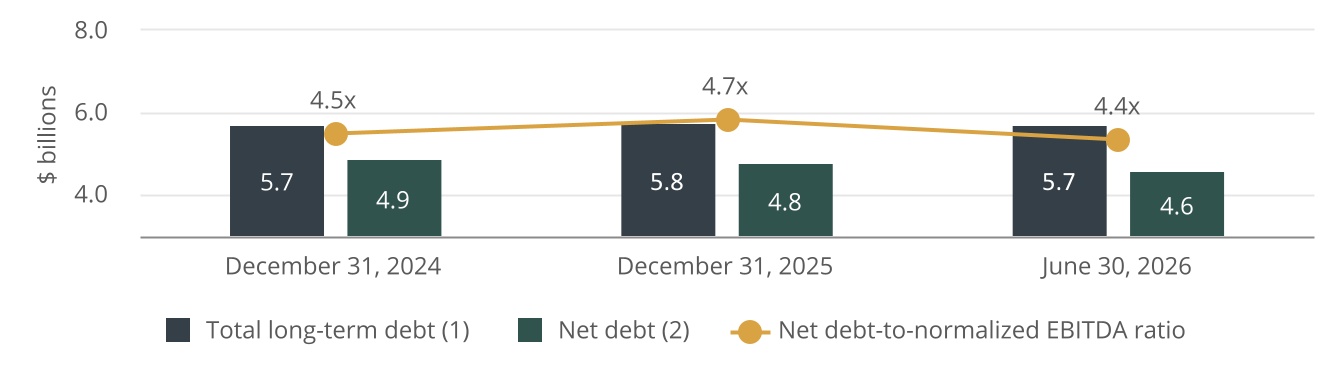
The Company's total long-term debt of $5.7 billion was relatively unchanged at June 30, 2026 from December 31, 2025, with no debt issuances or repayments occurring during the first half of 2026. Net debt at June 30, 2026 was $4.6 billion, a slight decrease from December 31, 2025 driven by higher cash balances at June 30, 2026 relative to December 31, 2025. The Company's nearest-term debt maturity is in September 2027. Refer to the Liquidity, Capital Resources, and Share Capital section of this MD&A for additional details on the Company's debt and capital structure.
The Company's net debt-to-normalized EBITDA ratio decreased from 4.7 times at December 31, 2025 to 4.4 times at June 30, 2026, due to higher cash balances and higher trailing-four quarter normalized EBITDA relative to the comparative period.
South Bow Corporation Second Quarter 2026 Management's Discussion and Analysis | 7
Segment Results
Keystone Pipeline System
| | | | | | | | | | | | | | | | | | | | |
| Three Months Ended June 30, | Six Months Ended June 30, |
| U.S.$ millions, except where noted | 2026 | 2025 | Change | 2026 | 2025 | Change |
| Revenue | 420 | 414 | 1 | % | 837 | 794 | 5 | % |
| | | | | | |
| Income before income taxes | 202 | 177 | 14 | % | 399 | 352 | 13 | % |
| Normalized EBITDA | 259 | 234 | 11 | % | 492 | 469 | 5 | % |
Total capital expenditures 1 | 7 | 6 | 17 | % | 11 | 13 | (15) | % |
| Keystone Pipeline throughput (Mbbl/d) | 596 | 544 | 10 | % | 606 | 578 | 5 | % |
| U.S. Gulf Coast segment of Keystone Pipeline System throughput (Mbbl/d) | 800 | 760 | 5 | % | 755 | 744 | 1 | % |
| Marketlink throughput (Mbbl/d) | 642 | 625 | 3 | % | 590 | 588 | — | % |
| Keystone SOF (%) | 93 | 93 | — | % | 94 | 95 | (1) | % |
1. Refer to the Capital Program section of this MD&A for additional details.
Keystone Pipeline System revenues increased during the three months ended June 30, 2026, driven by higher throughput due to increased customer demand to move heavy crude oil towards the U.S. Gulf Coast and higher uncommitted volumes on the Keystone and Marketlink pipelines compared to the same period in 2025, partially offset by lower contracted throughput on the Marketlink pipeline. Keystone Pipeline throughput was lower during the second quarter of 2025 as a result of the MP-171 incident which occurred in April 2025.
During the six months ended June 30, 2026, the Keystone Pipeline System recognized higher revenues than in the comparative period, primarily due to increased customer demand to move heavy crude oil towards the U.S. Gulf Coast and increased demand for uncommitted capacity, partially offset by lower contracted throughput on Marketlink. Additionally, the Company recognized $18 million of revenue related to historical variable toll adjustments during the first quarter of 2026, contributing to higher revenue generated during the six months ended June 30, 2026.
Income before income taxes increased during the three and six months ended June 30, 2026 from the prior year primarily due to lower operating costs in the second quarter of 2026 and higher revenue associated with increased throughput. During the second quarter of 2025, South Bow recorded a non-recurring charge of $3 million related to Keystone XL contractual recoveries.
Normalized EBITDA increased for the three and six months ended June 30, 2026, driven by lower operating costs in the second quarter of 2026 and higher revenue contributions compared to 2025.
Total capital expenditures invested for the Keystone Pipeline System segment during the three and six months ended June 30, 2026 were relatively unchanged from 2025. Investments during the 2026 periods include $5 million in land purchases and lower planned maintenance capital expenditures following an active maintenance and integrity program in 2025. Refer to the Capital Program and Outlook and Guidance section of this MD&A for additional details on South Bow's capital expenditures and outlook for 2026.
The Keystone Pipeline System SOF was unchanged during the three months ended June 30, 2026 and 2025. The Keystone Pipeline System SOF in the six months ended June 30, 2026 was slightly lower from the comparative period in 2025 as a result of an increase in scheduled maintenance activities.
South Bow Corporation Second Quarter 2026 Management's Discussion and Analysis | 8
Marketing
| | | | | | | | | | | | | | | | | | | | |
| Three Months Ended June 30, | Six Months Ended June 30, |
| U.S.$ millions | 2026 | 2025 | Change | 2026 | 2025 | Change |
| Revenue | 119 | | 106 | | 12 | % | 187 | | 219 | | (15) | % |
| | | | | | |
| | | | | | |
| Income before income taxes | 41 | | 14 | | 193 | % | 19 | | 23 | | (17) | % |
| Normalized EBITDA | 2 | | (1) | | 300 | % | 11 | | 15 | | (27) | % |
| | | | | | |
Revenue for the Marketing segment increased during the second quarter of 2026 compared to the same period of 2025. The increase was attributable to larger unrealized gains recognized on risk management contracts and higher physical volumes sold at higher average sales prices. These increases were partially offset by realized losses on risk management contracts in 2026 compared to realized gains in the comparative period. During the six months ended June 30, 2026, revenue decreased compared to the same period in 2025 as a result of realized losses on risk management contracts in 2026 compared to realized gains in 2025 due to tightened pricing differentials. The decrease was also attributable to lower unrealized gains on risk management contracts relative to the comparative period.
The increase in the Marketing segment's income before income taxes during the three months ended June 30, 2026, compared to the same period of 2025, was primarily driven by higher physical margins. The decrease in the Marketing segment's income before income taxes during the six months ended June 30, 2026 compared to the same period in 2025, was due to lower revenues discussed above, partially offset by lower costs to purchase and market crude oil.
The increase in normalized EBITDA for the Marketing segment during the three months ended June 30, 2026, compared to 2025 was a result of higher physical volumes sold and higher average sales prices. Normalized EBITDA for the Marketing segment for the six months ended June 30, 2026 decreased compared to 2025, driven by realized losses on risk management contracts compared to realized gains in the 2025 period.
Intra-Alberta & Other
| | | | | | | | | | | | | | | | | | | | |
| Three Months Ended June 30, | Six Months Ended June 30, |
| U.S.$ millions | 2026 | 2025 | Change | 2026 | 2025 | Change |
| Revenue | 7 | | 4 | | 75 | % | 13 | | 9 | | 44 | % |
| Income from equity investments | 11 | | 11 | | — | % | 21 | | 21 | | — | % |
| Interest expense | 84 | | 81 | | 4 | % | 168 | | 164 | | 2 | % |
| Loss before income taxes | (69) | | (65) | | 6 | % | (144) | | (135) | | 7 | % |
| Normalized EBITDA | 19 | | 17 | | 12 | % | 34 | | 32 | | 6 | % |
Total capital expenditures 1 | 6 | | 37 | | (84) | % | 10 | | 94 | | (89) | % |
| | | | | | |
| | | | | | |
1. Refer to the Capital Program section of this MD&A for additional details.
The Intra-Alberta & Other segment's loss before income taxes increased during the three months ended June 30, 2026 compared to the same period in 2025, primarily due to unrealized foreign exchange movements, partially offset by lower capitalized interest. This was partially offset by revenue contributions from the Blackrod Connection Project which was placed into commercial service on March 1, 2026. During the six months ended June 30, 2026, the Intra-Alberta & Other segment's loss before income taxes increased due to unrealized foreign exchange movements, and lower capitalized interest.
Normalized EBITDA for the Intra-Alberta & Other segment increased during the three and six months ended June 30, 2026, primarily as a result of revenues from the Blackrod Connection Project discussed above.
During the three and six months ended June 30, 2026, total capital expenditures include investments for the Blackrod Connection Project and the Prairie Connector project (refer to Recent Developments section of this MD&A). During the three and six months ended June 30, 2025, South Bow invested $27 million and $73 million, respectively, into the construction of the Blackrod Connection Project, in addition to infrastructure investments to support the Spinoff. Refer to the Outlook and Guidance and Capital Program section of this MD&A for information on the Company's capital expenditures and 2026 outlook.
South Bow Corporation Second Quarter 2026 Management's Discussion and Analysis | 9
Recent Developments
Growth Initiatives
South Bow continues to advance its growth initiatives with its proposed Prairie Connector project and the joint development of the proposed Liberty Bridge Pipeline project with Bridger Pipeline LLC ("Bridger").
In the second quarter of 2026, South Bow announced the successful outcome of its open season, securing 20-year binding commitments for firm transportation service from Hardisty, Alberta to U.S. delivery points, for a total of 465,000 barrels per day from nine customers. The successful open season represents a significant commercial milestone and supports the continued advancement of the project toward a targeted final investment decision ("FID") in mid-2027. Key activities underway include advancing permitting and regulatory approvals, pursuing government assurances related to permit durability, progressing execution planning, refining cost estimates, engaging with communities, landowners, Indigenous and Tribal Nations, and other stakeholders, and evaluating financing alternatives. The timing and magnitude of future expenditures will depend on the achievement of project milestones, regulatory approvals, commercial arrangements, and other factors. To support pre-FID spending associated with these projects, the Company has entered into development cost-sharing agreements with its open season customers.
The proposed Prairie Connector project would extend from Hardisty, Alberta, to the Canada-U.S. border, where it would connect to Bridger Pipeline LLC's ("Bridger") downstream facilities. The 530-kilometre Prairie Connector project includes the construction of approximately 380 kilometres of new 36-inch pipeline and associated facilities, as well as leveraging approximately 150 kilometres of previously installed and preserved 36-inch pipeline and two pump stations.
The proposed Liberty Bridge Pipeline project is being jointly advanced by South Bow and Bridger, which if sanctioned, would extend from Guernsey, Wyoming to Cushing, Oklahoma where it would connect to the U.S. Gulf Coast segment of the Keystone Pipeline System and other downstream facilities.
During the six months ended June 30, 2026, the Company incurred $8 million related to the Prairie Connector project, of which $3 million have been capitalized and included in plant, property and equipment, and $5 million for preliminary project costs recognized in the first quarter of 2026. Capitalized costs primarily relate to engineering, regulatory, commercial, and other development activities that Management determined were directly attributable to the development and construction of the proposed project. Refer to the Outlook and Guidance section of this MD&A for details on South Bow's revised growth capital expenditures for 2026.
Withdrawal of Keystone Variable Toll Disputes
Effective September 30, 2025, South Bow and associated parties agreed to withdraw all complaints and protests associated with the variable toll disputes previously filed with the Canada Energy Regulator ("CER"), Federal Energy Regulatory Commission ("FERC"), Court of King's Bench of Alberta, and D.C. Circuit Court (collectively, the "Withdrawal of Keystone Variable Toll Disputes"). Pursuant to an associated partial release of indemnification agreement and the Separation Agreement, the Former Parent was obligated to indemnify South Bow for certain amounts agreed to under the Withdrawal of Keystone Variable Toll Disputes.
At June 30, 2026, the Company had gross liabilities of $124 million, with $90 million of partially offsetting receivables representing indemnification payments from its Former Parent relating to the Withdrawal of Variable Toll Disputes. The gross liabilities include amounts subject to indemnification under the partial release of the indemnification agreement with the Former Parent, as well as additional liabilities that are not subject to indemnification terms, to be paid over the next five years.
CER Ruling
During the fourth quarter of 2025, the CER approved the Company's application for collection of the final adjusted variable tolls for the 2020 to 2024 period. As a result of the approval of the final tolls, South Bow is no longer subject to interim tolling and, as of March 31, 2026, had collected the final adjusted variable tolls for the 2020 to 2024 period from its Keystone Pipeline Canada customers. During the three months ended March 31, 2026, the Company recorded $1 million of interest income relating to the final tolls.
South Bow Corporation Second Quarter 2026 Management's Discussion and Analysis | 10
Milepost 171 Incident
On April 8, 2025, the Company responded to an oil release of approximately 3,500 barrels at MP-171, near Fort Ransom, North Dakota. On April 11, 2025, the Pipeline and Hazardous Materials Safety Administration ("PHMSA") issued a Corrective Action Order ("CAO"), requiring South Bow to undertake certain corrective actions in response to the MP-171 incident, including the completion of an independent third-party root cause analysis ("RCA") along with mechanical and metallurgical testing. On April 15, 2025, South Bow safely restarted the Keystone Pipeline under certain operating pressure restrictions after receiving regulatory approval from PHMSA. In early June 2025, South Bow completed the cleanup and reclamation of the incident site.
Findings and recommendations from the independent third-party RCA were released by PHMSA on February 11, 2026 and have been incorporated into South Bow's remedial work plan. The Company continues to advance remedial actions through its operations programs and continues to be able to meet all contractual transportation services while operating under the CAO.
Milepost 14 Incident
In December 2022, the MP-14 incident occurred on the Keystone Pipeline in Washington County, Kansas. As a result of the incident, the Company was subject to an Amended Corrective Action Order ("ACAO") issued by PHMSA. By June 2023, the recovery of all released volumes was completed, and by October 2023, creek restoration was finished, returning natural flows to Mill Creek. In January 2025, the Company received PHMSA's approval of its remedial work plan. This approval culminated the completion of 2,145 miles of in-line inspections across the Keystone Pipeline System and 68 investigative digs over a two-year period. In March 2025, South Bow received approval from PHMSA to lift the pressure restriction on the affected segment to 72 per cent of the specified minimum yield strength of the pipeline.
The remaining balance related to ongoing long-term monitoring reflected in accounts payable and other and other long-term liabilities on the consolidated balance sheets was $2 million and $7 million, respectively, at June 30, 2026 (December 31, 2025 – $3 million and $7 million, respectively).
On July 10, 2026, the U.S. Department of Justice, on behalf of the U.S. Environmental Protection Agency and the State of Kansas, announced a Clean Water Act consent decree with South Bow related to the MP-14 incident. Under the proposed consent decree, South Bow agreed to pay a total of $30 million in fines and penalties and perform pipeline integrity and other preventative measures on the Keystone Pipeline. The Company had previously recorded $30 million in expected costs during the fourth quarter of 2024, as well as a receivable for 86 per cent of this amount ($26 million), representing its Former Parent's share of the anticipated incremental cost pursuant to the indemnity clauses in the Separation Agreement.
Outlook and Guidance
Market Outlook
Recent geopolitical events have caused significant market volatility, underscoring the importance of a secure and reliable North American energy supply. In this environment, South Bow's strategically positioned infrastructure continues to play an important role in connecting growing Western Canadian crude oil supply to key refining and export markets.
South Bow continues to expect modest growth in Western Canadian Sedimentary Basin ("WCSB") crude oil supply through 2026, with production remaining below total pipeline egress capacity. As a result, demand for uncommitted capacity on the Keystone Pipeline is anticipated to remain tempered in the near term.
Following strong demand for capacity on the U.S. Gulf Coast segment of the Keystone Pipeline System in the second quarter of 2026, declining crude oil inventories in Cushing, Oklahoma, have caused pricing differentials to tighten, and as a result, demand for capacity on the U.S. Gulf Coast segment of the Keystone Pipeline System is expected to moderate in the second half of 2026.
South Bow Corporation Second Quarter 2026 Management's Discussion and Analysis | 11
2026 Guidance
South Bow's annual guidance aims to inform readers about Management's expectations for 2026 financial and operational results. Readers are cautioned that these estimates may not be suitable for any other purpose. Refer to the Forward-Looking Information section of this MD&A for additional information regarding the material factors or assumptions used to develop South Bow's guidance and the material factors that could cause actual events and results to be significantly different from those anticipated.
South Bow is increasing its 2026 normalized EBITDA guidance to $1,040 million, with a range of two per cent at the upper end and one per cent at the lower end, driven by stronger-than-expected first-half 2026 results, including strong operational performance and elevated demand for capacity on the U.S. Gulf Coast segment of the Keystone Pipeline System.
South Bow expects third-quarter 2026 normalized EBITDA to be approximately 10 per cent lower than second-quarter 2026 normalized EBITDA of $280 million as demand for capacity on the U.S. Gulf Coast segment of the Keystone Pipeline System moderates.
South Bow is increasing its 2026 distributable cash flow guidance to $665 million, within a range of two per cent, driven by higher normalized EBITDA, partially offset by increased current income taxes.
South Bow is increasing its 2026 growth capital expenditures guidance to approximately $80 million, within a range of $10 million, which includes $65 million of anticipated pre-FID development costs associated with the proposed Prairie Connector and Liberty Bridge Pipeline projects. The remaining growth capital expenditures include approximately $10 million for completion of the Blackrod Connection Project and $5 million for land purchases.
The Company continues to expect its net debt-to-normalized EBITDA ratio to decline modestly through 2026 relative to year-end 2025.
South Bow's updated 2026 annual guidance is outlined below:
| | | | | | | | |
| $ millions, except percentages | 2026 Guidance 1 2 (November 2025) | 2026 Guidance 2 (August 2026) |
Normalized EBITDA 7 | 1,030 +/- 2% | 1,040 +2% / -1% |
Financial charges 3 | 315 +/- 2% | 315 +/- 2% |
| Effective tax rate (%) | 22% - 23% | 22% - 23% |
Distributable cash flow 7 | 655 +/- 2% | 665 +/- 2% |
| Capital expenditures | | |
Growth 4, 5 | 10 | | 80 +/- 10 |
Maintenance 4, 6 | 25 +/- 10 | 25 +/- 10 |
1. See South Bow's November 13, 2025 news release "South Bow Reports Third-quarter 2025 Results, Provides 2026 Outlook, and Declares Dividend", available on South Bow's website at www.southbow.com, under South Bow's SEDAR+ profile at www.sedarplus.ca, and in South Bow's filings with the SEC at www.sec.gov.
2. Assumes average foreign exchange rate of C$/U.S.$1.39.
3. Comprised of interest expense and interest income and other.
4. Supplementary financial measure. See the Specified Financial Measures section of this MD&A for additional details.
5. Includes approximately $65 million of anticipated pre-FID development costs associated with the proposed Prairie Connector and Liberty Bridge Pipeline projects, subject to development cost-sharing agreements with open season customers.
6. Maintenance capital expenditures are generally recoverable through South Bow's tolling arrangements.
7. Normalized EBITDA and distributable cash flow for the year ended December 31, 2025 were $1,022 million and $709 million, respectively.
South Bow Corporation Second Quarter 2026 Management's Discussion and Analysis | 12
Capital Program
| | | | | | | | | | | | | | | | | |
| | Three Months Ended June 30, | Six Months Ended June 30, |
| U.S.$ millions | | | | 2026 | 2025 | 2026 | 2025 |
Growth capital expenditures 1 | | | | 9 | | 27 | | 14 | | 75 | |
Maintenance capital expenditures 1, 2 | | | | 4 | | 8 | | 8 | | 21 | |
Separation capital expenditures 1 | | | | — | | 8 | | (1) | | 11 | |
Total Capital Expenditures 1 | | | | 13 | | 43 | | 21 | | 107 | |
| | | | | | | |
| | | | | | | |
1. Supplementary financial measure to assist the reader in understanding the Company's capital investments and capital allocation decisions. Refer to the Supplementary Financial Measures section of this MD&A for additional details.
2. Maintenance capital expenditures are generally recoverable through South Bow's tolling arrangements.
Total capital expenditures were $13 million and $21 million, respectively, for the three and six months ended June 30, 2026, compared to $43 million and $107 million in the respective 2025 periods.
Growth capital expenditures were lower during the three and six months ended June 30, 2026 compared to the same periods in 2025, attributable to designating the Blackrod Connection Project commercially in-service on March 1, 2026. Growth capital investments made during the 2026 period include investments made for the Blackrod Connection Project, land purchases, and the Prairie Connector Project (refer to Recent Developments section of this MD&A for details).
Maintenance capital expenditures include investments made to support the Company's operations as well as spending for key infrastructure used by the Company. Lower maintenance capital expenditures during the three and six months ended June 30, 2026 compared to the 2025 periods was primarily attributable to reduced one-time capital investments to support the Spinoff, including information systems and leasehold improvements, and higher maintenance capital investments on the Keystone Pipeline System.
Separation capital expenditures during the three and six months ended June 30, 2025 represent the development of one-time capital investments to support the Spinoff transition, including information system infrastructure.
Blackrod Connection Project
Supported by long-term committed contracts, South Bow's first major growth initiative, the Blackrod Connection Project, consists of a 25-km (16-mi) crude oil pipeline and a 25-km (16-mi) natural gas lateral, as well as associated facilities, providing crude oil transportation from International Petroleum Corporation's Blackrod Project to South Bow's Grand Rapids Pipeline in intra-Alberta.
The project was designated commercially in-service on March 1, 2026, completed on time and on budget, with zero safety incidents. Associated cash flows from the project are expected to increase throughout the second half of 2026 and into 2027.
South Bow Corporation Second Quarter 2026 Management's Discussion and Analysis | 13
Liquidity, Capital Resources, and Share Capital
Liquidity
The following table summarizes the Company's sources and uses of cash for the periods ended June 30, 2026 and 2025:
| | | | | | | | | | | | | | |
| Three Months Ended June 30, | Six Months Ended June 30, |
| U.S.$ millions | 2026 | 2025 | 2026 | 2025 |
Cash from (Used in): | | | | |
| Operating activities | 255 | | 194 | | 441 | | 319 | |
| Investing activities | (18) | | (31) | | (44) | | (63) | |
| Financing activities | (104) | | (104) | | (201) | | (204) | |
| Effect of foreign exchange rate changes on cash and cash equivalents | (6) | | 3 | | (19) | | 3 | |
Net Increase in Cash and Cash Equivalents | 127 | | 62 | | 177 | | 55 | |
At June 30, 2026, cash and cash equivalents were $726 million (June 30, 2025 - $452 million).
Operating Activities
Cash from operating activities is primarily impacted by changes in operations, fluctuations in demand for uncommitted capacity, commodity prices, changes in cost environment, and timing of cash receipts and payments made. The increase in cash from operating activities for the three and six months ended June 30, 2026 compared to the same periods in 2025 was primarily attributable to higher net income and an increase in non-cash working capital.
Investing Activities
Cash used in investing activities is primarily related to maintenance and growth capital expenditures. Cash used in investing activities during the three and six months ended June 30, 2026 was attributable to the Company's cash capital expenditures of $18 million and $45 million, respectively, compared to cash capital expenditures of $34 million and $66 million in the comparative period of 2025. The decreases were primarily driven by the Company investing in its Blackrod Connection Project in 2025 which was designated as commercially in-service on March 1, 2026.
Financing Activities
Cash used in financing activities primarily relates to dividends paid and share capital transactions. During the six months ended June 30, 2026 the Company allocated $208 million for dividends, partially offset by $7 million in cash received from option exercises compared to $4 million in cash received from option exercises during the six months ended June 30, 2025.
Long-term Debt, including Credit Facilities
Long-term Debt
South Bow completed its initial debt offerings on August 28, 2024, comprised of U.S. and Canadian dollar-denominated Senior Notes and U.S. dollar-denominated Junior Notes. Interest rates are fixed on the Senior Notes and Junior Notes, subject to reset at regular intervals for the Junior Notes, and interest is paid semi-annually.
South Bow Corporation Second Quarter 2026 Management's Discussion and Analysis | 14
The table below summarizes the Senior Notes and Junior Notes issued and outstanding as at June 30, 2026:
| | | | | | | | | | | | | | | | | | | | | | | |
| U.S.$ millions, except where noted | Principal Repayments 1 |
| Debt Instrument | Total | 2026 | 2027 | 2028 | 2029 | 2030 | After 2030 |
Senior Unsecured Notes | | | | | | | |
U.S. Dollar-denominated Debt | | | | | | | |
| Due September 2027 ($700 million, 4.91%) | 700 | | — | | 700 | | — | | — | | — | | — | |
| Due October 2029 ($1,000 million, 5.03%) | 1,000 | | — | | — | | — | | 1,000 | | — | | — | |
| Due October 2034 ($1,250 million, 5.58%) | 1,250 | | — | | — | | — | | — | | — | | 1,250 | |
| Due October 2054 ($700 million, 6.18%) | 700 | | — | | — | | — | | — | | — | | 700 | |
| 3,650 | | — | | 700 | | — | | 1,000 | | — | | 1,950 | |
| | | | | | | |
Canadian Dollar-denominated Debt | | | | | | | |
| Due February 2030 (C$450 million, 4.32%) | 317 | | — | | — | | — | | — | | 317 | | — | |
| Due February 2032 (C$500 million, 4.62%) | 352 | | — | | — | | — | | — | | — | | 352 | |
| Due February 2035 (C$500 million, 4.93%) | 352 | | — | | — | | — | | — | | — | | 352 | |
| 1,021 | | — | | — | | — | | — | | 317 | | 704 | |
Less: Unamortized Debt Issue Costs | (23) | | | | | | | |
Total Senior Unsecured Notes | 4,648 | | — | | 700 | | — | | 1,000 | | 317 | | 2,654 | |
| | | | | | | |
| | | | | | | |
Junior Subordinated Notes | | | | | | | |
U.S. Dollar-denominated Debt | | | | | | | |
Due March 2055 ($450 million, 7.63%) 2 | 450 | | — | | — | | — | | — | | — | | 450 | |
Due March 2055 ($650 million, 7.50%) 3 | 650 | | — | | — | | — | | — | | — | | 650 | |
Junior Subordinated Notes | 1,100 | | — | | — | | — | | — | | — | | 1,100 | |
Less: Unamortized Debt Issue Costs | (14) | | | | | | | |
Total Junior Subordinated Notes | 1,086 | | — | | — | | — | | — | | — | | 1,100 | |
| | | | | | | |
Total Long-term Debt | 5,734 | | — | | 700 | | — | | 1,000 | | 317 | | 3,754 | |
1. Represents principal amount to be repaid on maturity.
2. Subject to first rate reset on March 1, 2030 and every fifth year after 2030.
3. Subject to first rate reset on March 1, 2035 and every fifth year after 2035.
South Bow Corporation Second Quarter 2026 Management's Discussion and Analysis | 15
Credit Facilities
At June 30, 2026, $1.4 billion (C$2.0 billion) was available and nil was drawn on the Company's four-year, senior unsecured revolving credit facility (the "Facility"), which matures on October 1, 2029. The Company is required to maintain approximately $352 million (C$500 million) of availability under the Facility for financial resource commitments under the Canadian Energy Regulator Act.
South Bow is subject to certain financial covenants on its Facility and was in compliance with its covenants as at June 30, 2026.
Interest Expense
| | | | | | | | | | | | | | |
| Three Months Ended June 30, | Six Months Ended June 30, |
| U.S.$ millions | 2026 | 2025 | 2026 | 2025 |
| Interest on Senior Notes | 60 | | 62 | | 121 | | 122 | |
Interest on Junior Notes | 21 | | 20 | | 41 | | 41 | |
Amortization and other financial charges 1 | 3 | | — | | 7 | | 4 | |
| Capitalized interest | — | | (1) | | (1) | | (3) | |
| 84 | | 81 | | 168 | | 164 | |
1. Includes amortization of debt issuance, premium, and discount costs associated with the Senior Notes and Junior Notes. Other financial charges include bank service charges and carrying charges.
Interest expense was relatively unchanged for the three and six months ended June 30, 2026, compared to the same periods in 2025, reflecting unchanged debt levels, with differences attributable to foreign exchange movements.
Interest Income and Other
| | | | | | | | | | | | | | |
| Three Months Ended June 30, | Six Months Ended June 30, |
| U.S.$ millions | 2026 | 2025 | 2026 | 2025 |
Interest income | 7 | | 4 | | 17 | | 9 | |
Foreign exchange gain (loss) | (2) | | 4 | | (1) | | 5 | |
| 5 | | 8 | | 16 | | 14 | |
Interest income and other decreased during the three months ended June 30, 2026, relative to the comparable period in 2025 due to foreign exchange losses in the 2026 period, partially offset by interest income earned on the Company's sales-type lease arrangement. Interest income and other increased during the six months ended June 30, 2026, relative to the comparative period in 2025 due to interest income generated on the Company's variable tolls and interest income earned on the Company's sales-type lease arrangement, partially offset by foreign exchange losses in the 2026 period.
South Bow Corporation Second Quarter 2026 Management's Discussion and Analysis | 16
Capital Management
| | | | | | | | |
| June 30, | December 31, |
| U.S.$ millions, except where noted | 2026 | 2025 |
| Cash and cash equivalents | 726 | 549 |
Senior Notes | 4,648 | 4,682 |
Junior Notes | 1,086 | 1,086 |
| Net debt | 4,594 | 4,806 |
Net debt-to-normalized EBITDA Ratio 1 | 4.4 | | 4.7 | |
1. For purposes of calculating the Net debt-to-normalized EBITDA ratio, normalized EBITDA is calculated using the trailing four quarters of normalized EBITDA from the relevant period end.
A significant portion of South Bow's revenues are from long-term committed contracts. The Company has no material restrictions on its cash and cash equivalents and has no amounts drawn on the Facility, with its nearest long-term debt maturity in 2027. South Bow is well positioned to meet its operating obligations, including quarterly dividend payments, if, as, and when declared by the Board, by utilizing its cash flow from operating activities and available borrowing capacity if, and as, required.
Maintaining a strong balance sheet and financial flexibility is fundamental to South Bow's strategy. At June 30, 2026, the Company's net debt-to-normalized EBITDA ratio was 4.4 times. The Company is committed to prudently managing leverage and expects to enhance its financial resilience, reduce debt service charges, and create additional capacity to fund future growth initiatives and potentially grow shareholder returns.
Share Capital
The Company is authorized to issue an unlimited number of common shares and a number of first and second preferred shares, up to 20 per cent of the number of issued common shares outstanding. As at the date of this MD&A, no first or second preferred shares have been issued.
The following table summarizes South Bow's share capital at June 30, 2026:
| | | | | | | | |
| U.S.$ millions, except where noted | Common Shares | Common Shares ($) |
| | |
| | |
| | |
| Balance at December 31, 2024 | 208,041,109 | 2,196 | |
| | |
| Issued on exercise of stock options | 209,403 | 5 | |
Balance at December 31, 2025 | 208,250,512 | 2,201 | |
Issued on exercise of stock options | 337,615 | 7 | |
Balance at June 30, 2026 | 208,588,127 | 2,208 | |
| | |
As of the date of this MD&A, the Company has 208,588,127 common shares outstanding and 234,232 stock options outstanding. All outstanding stock options are fully vested and exercisable for one common share.
Dividends
Dividends become payable, if, as, and when declared by the Board. Dividends are declared at the discretion of the Board and subject to various factors, including but not limited to, the Company's distributable cash flow and overall financial performance. The Company’s dividends are designated as eligible dividends for Canadian tax purposes.
On May 7, 2026, the Board approved a quarterly dividend of $0.50 per share, which was paid on July 15, 2026 to shareholders of record at the close of business on June 30, 2026.
On August 5, 2026, the Board approved a quarterly dividend of $0.50 per share, payable on October 15, 2026 to shareholders of record at the close of business on September 29, 2026.
South Bow Corporation Second Quarter 2026 Management's Discussion and Analysis | 17
Contractual Obligations and Off-balance Sheet Arrangements
Contractual Obligations
South Bow's contractual obligations include operating leases, purchase obligations, and other liabilities incurred within the business.
| | | | | | | | | | | | | | | | | | | | | | | |
| U.S.$ millions | Total | 2026 | 2027 | 2028 | 2029 | 2030 | After 2030 |
| | | | | | | |
| | | | | | | |
| | | | | | | |
Operating commitments 1 | 122 | | 21 | | 8 | | 24 | | 14 | | 15 | | 40 | |
| | | | | | | |
Capital expenditures 2 | 17 | | 8 | | 9 | | — | | — | | — | | — | |
| | | | | | | |
| Total | 139 | | 29 | | 17 | | 24 | | 14 | | 15 | | 40 | |
1. Includes commitments for in-line inspection runs and power.
2. Capital expenditures relate to the remaining Blackrod Connection Project expenditures, in addition to other capital commitments by the Company. Amounts are estimates and subject to variability based on timing of construction and project requirements. Expenditures include obligations for growth projects and are presented based on projects proceeding as currently planned. Any changes to projects, including timing or possible cancellation, could change these estimates.
Guarantees
The Company has guaranteed the Senior Notes and Junior Notes issued by certain subsidiaries. Refer to the Parental Guarantees of Debt section of this MD&A for additional details.
South Bow and its partners in certain jointly owned entities have guaranteed the financial performance of these jointly owned entities to a maximum term to 2043. At June 30, 2026, the Company's share of maximum potential exposure under the guarantees is C$56 million (December 31, 2025 - C$56 million). Under these guarantees, if the Company makes a payment that exceeds its share of ownership interest, the additional amount must be reimbursed by the partners of such jointly owned entities.
Off-balance Sheet Arrangements
Except for the guarantees discussed above, as at June 30, 2026, South Bow does not have any off-balance sheet arrangements that have, or are reasonably likely to have, a current or future effect on the Company's financial performance or financial condition.
Specified Financial Measures
Non-GAAP Financial Measures
Throughout this MD&A, South Bow references certain non-GAAP financial measures and non-GAAP ratios which do not have any standardized meaning as prescribed by GAAP and therefore may not be comparable to similar measures presented by other entities. These non-GAAP financial measures and non-GAAP ratios include adjustments to the composition of the most directly comparable GAAP measures. Management considers these non-GAAP financial measures and non-GAAP ratios to be important in evaluating and understanding the operating performance and liquidity of South Bow. These non-GAAP financial measures should not be considered in isolation or as a substitute for financial information or measures of performance presented in accordance with GAAP.
South Bow's non-GAAP financial measures presented in this MD&A include normalized EBITDA, segment normalized EBITDA, normalized net income, distributable cash flow, and net debt. Non-GAAP ratios include normalized net income per share and net debt-to-normalized EBITDA. These non-GAAP financial measures and non-GAAP ratios are further described with a reconciliation to their most directly comparable GAAP measure below.
South Bow Corporation Second Quarter 2026 Management's Discussion and Analysis | 18
Normalizing Items
Normalized measures are (or include) non-GAAP financial measures and include normalized EBITDA, segment normalized EBITDA, normalized net income, normalized net income per share, distributable cash flow, and net debt-to-normalized EBITDA. Management uses these normalized measures as a way to assess the financial performance of South Bow's operations and compare period-over-period results. During certain reporting periods, the Company may incur costs which are not indicative of core operations or results. These normalized measures represent income (loss) adjusted for specific normalizing items that are believed to be significant; however, are not reflective of South Bow's underlying operations in the period.
These specific normalizing items include gains or losses on sales of assets or assets held for sale, unrealized fair value adjustments related to risk management activities, tariff charges, separation, acquisition, integration, and restructuring costs, and other charges, including but not limited to, impairment, contractual costs, preliminary costs associated with major business development projects, and settlements.
South Bow excludes the unrealized fair value adjustments related to risk management activities as these represent the changes in the fair value of derivatives, but do not accurately reflect the gains and losses that will be realized at settlement and impact income. Therefore, the Company does not consider these items reflective of its underlying operations, despite providing effective economic hedges. Realized gains and losses on grade financial contracts are adjusted to improve comparability as they settle in a subsequent period to the underlying transaction they are hedged against.
South Bow excludes tariff charges as they are not reflective of ongoing business conducted by the Company and are subject to uncertainty.
Separation costs relate to internal costs and external fees incurred specific to the Spinoff. These items have been excluded from normalized measures as Management does not consider them reflective of ongoing operations and they are non-recurring in nature.
Business development projects represent initial expenditures incurred by the Company for the evaluation of future growth projects. These costs have been excluded from normalized measures, as Management does not consider them reflective of ongoing operations conducted by the Company.
Normalized EBITDA and Segment Normalized EBITDA
Normalized EBITDA is a measure indicative of earnings from ongoing operations. Management uses this measure to monitor and evaluate the financial performance of the Company's operations and to identify and evaluate trends. This measure is useful for investors as Management believes it allows for a more accurate comparison of financial performance of the Company across periods for ongoing operations. Normalized EBITDA represents income (loss) before income taxes adjusted for the normalizing items including gains or losses on sales of assets or assets held for sale, unrealized fair value adjustments related to risk management activities, tariff charges, separation, acquisition, integration, and restructuring costs, and other charges, including but not limited to, impairment, contractual costs, preliminary costs associated with major business development projects, and settlements, in addition to excluding charges for depreciation and amortization, interest expense, interest income and other, and other income.
Normalized EBITDA guidance is a forward-looking non-GAAP financial measure. South Bow does not provide a reconciliation of such forward-looking measure to the most directly comparable financial measure calculated and presented in accordance with GAAP due to unknown variables and the uncertainty related to future results. These unknown variables may be inherently difficult to determine without unreasonable efforts. Guidance for normalized EBITDA is calculated in the same manner as described above for historical normalized EBITDA, as applicable.
South Bow Corporation Second Quarter 2026 Management's Discussion and Analysis | 19
The following table reconciles income (loss) before income taxes to normalized EBITDA for the three and six months ended June 30, 2026 and 2025 and three months ended March 31, 2026:
| | | | | | | | | | | | | | | | | |
| Three Months Ended | Six Months Ended |
| U.S.$ millions | March 31, 2026 | June 30, 2026 | June 30, 2025 | June 30, 2026 | June 30, 2025 |
Income before income taxes 1 | 100 | | 174 | | 126 | | 274 | | 240 | |
| Adjusted for specific items: | | | | | |
Depreciation and amortization 1 | 64 | | 65 | | 63 | | 129 | | 125 | |
Interest expense 1 | 84 | | 84 | | 81 | | 168 | | 164 | |
Interest income and other 1 | (11) | | (5) | | (8) | | (16) | | (14) | |
| | | | | |
Risk management instruments 2 | 32 | | (37) | | (15) | | (5) | | (9) | |
Keystone variable toll disputes 3 | (18) | | — | | — | | (18) | | — | |
Separation costs 4 | 1 | | — | | 3 | | 1 | | 6 | |
Business development projects 5 | 5 | | — | | — | | 5 | | — | |
Tariff charges 6 | — | | — | | — | | — | | 1 | |
Keystone XL costs and other 7 | — | | (1) | | — | | (1) | | 3 | |
Normalized EBITDA | 257 | | 280 | | 250 | | 537 | | 516 | |
1. Per the consolidated statements of income.
2. Unrealized (gains) losses on risk management instruments incurred by the Marketing segment.
3. Adjustments recorded to revenue in the consolidated statements of income related to historical variable toll disputes. Refer to the Recent Developments section of this MD&A for additional details.
4. Expenses recorded within plant operating costs and other in the consolidated statements of income in relation to non-recurring separation-related activities incurred to establish South Bow as an independent company.
5. Expenses recorded within plant operating costs and other in the consolidated statements of income relating to preliminary stages of the Prairie Connector project.
6. Tariff charges incurred on the Company's Marketing activities recorded within plant operating costs and other in the consolidated statements of income.
7. Adjustments and charges recorded in other expenses in the consolidated statements of income relating to Keystone XL termination activities.
The following tables reconcile income (loss) before income tax to normalized EBITDA by operating segment for the three and six months ended June 30, 2026 and 2025:
| | | | | | | | | | | | | | |
| Three Months Ended June 30, 2026 |
| U.S.$ millions | Keystone Pipeline System | Marketing | Intra-Alberta & Other | Total |
| Income (loss) before income taxes | 202 | | 41 | | (69) | | 174 | |
| Adjusted for specific items: | | | | |
| Depreciation and amortization | 60 | | — | | 5 | | 65 | |
| Interest expense | — | | — | | 84 | | 84 | |
| Interest income and other | (2) | | (2) | | (1) | | (5) | |
| | | | |
| Risk management instruments | — | | (37) | | — | | (37) | |
| Keystone variable toll disputes | — | | — | | — | | — | |
| Separation costs | — | | — | | — | | — | |
| Business development projects | — | | — | | — | | — | |
Tariff charges | — | | — | | — | | — | |
| Keystone XL costs and other | (1) | | — | | — | | (1) | |
Segment Normalized EBITDA | 259 | | 2 | | 19 | | 280 | |
South Bow Corporation Second Quarter 2026 Management's Discussion and Analysis | 20
| | | | | | | | | | | | | | |
| Three Months Ended June 30, 2025 |
| U.S.$ millions | Keystone Pipeline System | Marketing | Intra-Alberta & Other | Total |
| Income (loss) before income taxes | 177 | | 14 | | (65) | | 126 | |
| Adjusted for specific items: | | | | |
| Depreciation and amortization | 59 | | — | | 4 | | 63 | |
| Interest expense | — | | — | | 81 | | 81 | |
| Interest income and other | (2) | | — | | (6) | | (8) | |
| | | | |
| Risk management instruments | — | | (15) | | — | | (15) | |
| Keystone variable toll disputes | — | | — | | — | | — | |
| | | | |
| Separation costs | — | | — | | 3 | | 3 | |
| Business development projects | — | | — | | — | | — | |
| Tariff charges | — | | — | | — | | — | |
| Keystone XL costs and other | — | | — | | — | | — | |
| | | | |
Segment Normalized EBITDA | 234 | | (1) | | 17 | | 250 | |
| | | | | | | | | | | | | | |
| Six Months Ended June 30, 2026 |
| U.S.$ millions | Keystone Pipeline System | Marketing | Intra-Alberta & Other | Total |
| Income (loss) before income taxes | 399 | | 19 | | (144) | | 274 | |
| Adjusted for specific items: | | | | |
| Depreciation and amortization | 120 | | — | | 9 | | 129 | |
| Interest expense | — | | — | | 168 | | 168 | |
| Interest income and other | (8) | | (3) | | (5) | | (16) | |
| | | | |
| Risk management instruments | — | | (5) | | — | | (5) | |
| Keystone variable toll disputes | (18) | | — | | — | | (18) | |
| Separation costs | — | | — | | 1 | | 1 | |
| Business development projects | — | | — | | 5 | | 5 | |
Tariff charges | — | | — | | — | | — | |
| Keystone XL costs and other | (1) | | — | | — | | (1) | |
| | | | |
Segment Normalized EBITDA | 492 | | 11 | | 34 | | 537 | |
South Bow Corporation Second Quarter 2026 Management's Discussion and Analysis | 21
| | | | | | | | | | | | | | |
| Six Months Ended June 30, 2025 |
| U.S.$ millions | Keystone Pipeline System | Marketing | Intra-Alberta & Other | Total |
| Income (loss) before income taxes | 352 | | 23 | | (135) | | 240 | |
| Adjusted for specific items: | | | | |
| Depreciation and amortization | 118 | | — | | 7 | | 125 | |
| Interest expense | — | | — | | 164 | | 164 | |
| Interest income and other | (4) | | — | | (10) | | (14) | |
| Risk management instruments | — | | (9) | | — | | (9) | |
| Keystone variable toll disputes | — | | — | | — | | — | |
| | | | |
| Separation costs | — | | — | | 6 | | 6 | |
| Business development projects | — | | — | | — | | — | |
| Tariff charges | — | | 1 | | — | | 1 | |
| Keystone XL costs and other | 3 | | — | | — | | 3 | |
Segment Normalized EBITDA | 469 | | 15 | | 32 | | 516 | |
Normalized Net Income and Normalized Net Income per Share
Normalized net income represents net income adjusted for the normalizing items described above and is used by Management to assess the earnings that it believes are representative of South Bow's operations. By adjusting for non-recurring items and other factors that do not reflect the Company's ongoing performance, the Company believes that normalized net income provides a clearer picture of its continuing operations. These specific normalizing items include gains or losses on sales of assets or assets held for sale, unrealized fair value adjustments related to risk management activities, tariff charges, separation, acquisition, integration, and restructuring costs, and other charges, including but not limited to, impairment, contractual costs, preliminary costs associated with major business development projects, and settlements. This measure is particularly useful for investors as it allows for a more accurate comparison of financial performance and trends across different periods. On a per-share basis, normalized net income is derived by dividing the normalized net income by the weighted average common shares outstanding at the end of the period. Management believe this per-share measure is valuable to investors as it provides insight into the Company's profitability on a per-share basis, making it easier to evaluate the Company's performance.
South Bow Corporation Second Quarter 2026 Management's Discussion and Analysis | 22
The following table reconciles net income to normalized net income for the three and six months ended June 30, 2026 and 2025:
| | | | | | | | | | | | | | |
| Three Months Ended June 30, | Six Months Ended June 30, |
| U.S.$ millions, except share and per share amounts | 2026 | 2025 | 2026 | 2025 |
Net income | 134 | | 96 | | 211 | | 184 | |
| Adjusted for specific items: | | | | |
| | | | |
Risk management instruments 1 | (37) | | (15) | | (5) | | (9) | |
Keystone variable toll disputes 2 | — | | — | | (19) | | — | |
| | | | |
Separation costs 3 | — | | 3 | | 1 | | 6 | |
Business development projects 4 | — | | — | | 5 | | — | |
Tariff charges 5 | — | | — | | — | | 1 | |
Keystone XL costs and other 6 | (1) | | — | | (1) | | 3 | |
Tax effect of the above adjustments 7 | 8 | | 3 | | 4 | | — | |
Normalized Net Income | 104 | | 87 | | 196 | | 185 | |
| Weighted average common shares outstanding - diluted (millions) | 208.8 | | 208.8 | | 208.7 | | 208.7 | |
Normalized Net Income per Share - Diluted | 0.50 | 0.42 | 0.94 | 0.89 |
1. Unrealized (gains) losses on risk management instruments incurred by the Marketing segment. Recorded within revenue in the consolidated statements of income.
2. Adjustments recorded to revenue and interest income and other in the consolidated statements of income related to historical variable toll disputes and the Withdrawal of Keystone Variable Toll Disputes. Refer to the Recent Developments section of this MD&A for additional details.
3. Expenses recorded within plant operating costs and other as adjusted in normalized EBITDA, in addition to interest expense and interest income and other, and other income in the consolidated statements of income. Amounts relate to non-recurring separation-related costs incurred to establish South Bow as an independent company.
4. Expenses incurred within plant operating costs and other relating to preliminary stages of potential growth projects.
5. Tariff charges incurred on the Company's Marketing business activities recorded within plant operating costs and other in the consolidated statements of income.
6. Adjustments and charges recorded in other expenses in the consolidated statements of income relating to Keystone XL termination activities and other non-recurring charges.
7. Tax effect of the adjustments added to, and deducted from, net income.
Distributable Cash Flow
Distributable cash flow is used to assess the cash generated through business operations that can be used for South Bow's capital allocation decisions, helping investors understand the Company's cash-generating capabilities and its potential for returning value to shareholders. Distributable cash flow is based on income (loss) before income taxes, adjusted for depreciation and amortization, the normalizing items discussed above, and further adjusted for specific items, including income and distributions from the Company's equity investments, maintenance capital expenditures, which are capitalized and generally recoverable through South Bow's tolling arrangements, and current income taxes.
Distributable cash flow guidance is a forward-looking non-GAAP financial measure. South Bow does not provide a reconciliation of such forward-looking measure to the most directly comparable financial measure calculated and presented in accordance with GAAP due to unknown variables and the uncertainty related to future results. These unknown variables may be inherently difficult to determine without unreasonable efforts.
In the second quarter of 2025, South Bow modified the definition of distributable cash flow to no longer adjust income (loss) before income taxes for interest income and other. Management believes that this modified definition of distributable cash flow more accurately reflects the amount of cash generated through business operations that can be used for South Bow's capital allocation decisions. Comparative measures have been restated to reflect these changes.
South Bow Corporation Second Quarter 2026 Management's Discussion and Analysis | 23
The following table reconciles income before income taxes to distributable cash flow for the three and six months ended June 30, 2026 and 2025:
| | | | | | | | | | | | | | |
| Three Months Ended June 30, | Six Months Ended June 30, |
U.S.$ millions, except where noted | 2026 | 2025 | 2026 | 2025 |
Income before income taxes 1 | 174 | 126 | 274 | 240 |
| Adjusted for specific items: | | | | |
Depreciation and amortization 1 | 65 | 63 | 129 | 125 |
Income from equity investments 2 | (14) | (13) | (27) | (26) |
Distributions from equity investments 2 | 3 | 18 | 21 | 37 |
Maintenance capital expenditures 3 | (4) | (8) | (8) | (21) |
Current income tax expense 1 | (19) | (10) | (31) | (32) |
Normalizing items, net of tax 4 | (30) | (9) | (15) | 1 |
Distributable Cash Flow | 175 | 167 | 343 | 324 |
1. Per the consolidated statements of income.
2. Per the consolidated statements of cash flows.
3. Maintenance capital expenditures are generally recoverable from customers through South Bow's tolling arrangements and are capitalized for GAAP purposes. Refer to the Capital Program section of this MD&A for additional details on maintenance capital expenditures.
4. Refers to the adjustments made to normalized net income, net of tax, and includes risk management instruments, Keystone variable toll disputes, separation costs, business development projects, tariff charges, and Keystone XL costs and other.
Net Debt and Net Debt-to-normalized EBITDA Ratio
Net debt is used as a key leverage measure to assess and monitor South Bow's financing structure. It provides an overview of the Company's long-term debt obligations, net of cash and cash equivalents. This measure is useful for investors as South Bow believes it offers insights into the Company's financial health and its ability to manage and service its debt obligations. Net debt is defined as the sum of total long-term debt and 50 per cent equity treatment of Junior Notes, operating lease liabilities, and dividends payable, less cash and cash equivalents.
Net debt-to-normalized EBITDA ratio is used to monitor the Company's leverage position relative to its normalized EBITDA for the trailing four quarters. This ratio provides investors with insight into the Company's ability to service its long-term debt obligations relative to its operational performance. A lower ratio indicates stronger financial health and greater capacity to meet its debt obligations.
South Bow Corporation Second Quarter 2026 Management's Discussion and Analysis | 24
The following table reconciles total long-term debt to net debt at June 30, 2026, December 31, 2025, and June 30, 2025:
| | | | | | | | | | | |
| June 30, | December 31, | June 30, |
| U.S.$ millions, except where noted | 2026 | 2025 | 2025 |
Senior Notes 1 | 4,648 | | 4,682 | | 4,688 | |
Junior Notes 1 | 1,086 | | 1,086 | | 1,086 | |
| | | |
| Total long-term debt | 5,734 | | 5,768 | | 5,774 | |
| Adjusted for: | | | |
Hybrid treatment for Junior Notes 2 | (543) | | (543) | | (543) | |
Operating lease liabilities 3 | 25 | | 26 | | 20 | |
Dividends payable 1 | 104 | | 104 | | 104 | |
Cash and cash equivalents 1 | (726) | | (549) | | (452) | |
| | | |
Net debt | 4,594 | | 4,806 | | 4,903 | |
Normalized EBITDA for trailing four quarters 4 | 1,043 | | 1,022 | | 1,068 | |
Net debt-to-normalized EBITDA Ratio | 4.4 | 4.7 | 4.6 |
1. Per the consolidated balance sheets.
2. The Company's Junior Notes receive 50 per cent equity treatment from credit rating agencies. This treatment is captured in the Company's net debt calculation above.
3. Represents the current and long-term operating lease liabilities recorded on the consolidated balance sheets. Current operating lease liabilities are recorded within accounts payable and other and long-term lease liabilities are recorded in other long-term lease liabilities.
4. Calculated as the normalized EBITDA for the trailing four quarters from the applicable period end.
Supplementary Financial Measures
South Bow uses certain supplementary financial measures that are not defined under U.S. GAAP but are commonly used in the energy infrastructure industry to evaluate capital allocation and operational performance. These measures include growth capital expenditures, maintenance capital expenditures, separation capital expenditures, and total capital expenditures.
Growth capital expenditures represent capital investments attributable to new projects or expansions that are intended to enhance the Company's capacity or service offerings. Maintenance capital expenditures refer to routine capital investments required to sustain the Company's existing operations and asset base and are generally recoverable through South Bow's tolling arrangements. Separation capital expenditures represent non-recurring capital investments in connection with the Spinoff and are not expected to be recovered through the Company's tolling arrangements. Total capital expenditures represents the sum of the Company's growth capital expenditures, maintenance capital expenditures, and separation capital expenditures.
Accounting Matters
Disclosure Controls and Procedures
Management is responsible for establishing and maintaining adequate disclosure controls and procedures ("DC&P"), which are designed to provide reasonable assurance that the material information relating to the Company is made known to the Chief Executive Officer ("CEO") and Chief Financial Officer ("CFO") by others, particularly during the period in which annual and interim filings are prepared, and that information required to be disclosed by the Company in its annual, interim filings, or other reports filed or submitted by the Company under Canadian and U.S. securities laws is recorded, processed, summarized, and reported within the time periods specified under those laws and the related rules.
South Bow Corporation Second Quarter 2026 Management's Discussion and Analysis | 25
South Bow's Management, including the CEO and CFO, concluded, as a result of the general information technology ("IT") control deficiencies described below, that the Company's DC&P as defined in Rules 13a-15(e) and 15d-15(e) under the U.S. Securities Exchange Act of 1934, as amended (the "Exchange Act"), were not effective as at June 30, 2026, to ensure that information required to be disclosed by the Company in reports that are filed or submitted to Canadian and U.S. securities authorities is recorded, processed, summarized, and reported within the time periods specified in applicable Canadian and U.S. securities laws.
Management's Report on Internal Control over Financial Reporting
Management is also responsible for establishing and maintaining adequate internal control over financial reporting ("ICFR") as defined in Rules 13a-15(f) and 15d-15(f) of the Exchange Act. South Bow's financial reporting process and associated internal controls, including operational controls and procedures for non-financial disclosures, were all designed to provide reasonable assurance regarding the reliability of financial reporting and the preparation of the Company's accompanying financial statements for external reporting in accordance with GAAP. This design included certain compensating controls and procedures. As previously disclosed, in connection with the audit of the Company’s annual consolidated financial statements for the year ended December 31, 2025, Management, with the participation of the CEO and CFO, assessed the effectiveness of the Company's ICFR as of December 31, 2025. Management based its assessment on criteria established in the Internal Control–Integrated Framework issued by the Committee of Sponsoring Organizations of the Treadway Commission ("2013 Framework"). Based on this assessment and the existence of the material weakness described below, Management concluded that the Company did not maintain effective ICFR as of December 31, 2025.
In April 2025, the Company implemented a new enterprise resource planning ("ERP") system and ancillary applications across the entire organization in conjunction with the termination of the use of its Former Parent's ERP system under the Transition Services Agreement. As a result, the Company modified a number of internal controls to accommodate related changes to its information systems and business processes. These changes introduced increased complexity and transition risks within the control environment, resulting in control deficiencies related to general IT controls. Management identified a material weakness related to the design and operating effectiveness of certain general IT controls that are relevant to the preparation of the Company's consolidated financial statements. The Company did not (i) maintain certain change management controls to ensure configuration changes affecting certain IT applications were appropriate; (ii) design and maintain certain program development controls to ensure the data migration, program testing, and approval of a new software development is aligned with business and IT requirements; and (iii) maintain user access controls in all instances to ensure segregation of duties in the Company's financial applications. As a result of these control deficiencies, process-level automated controls that are dependent on configuration in the affected IT environment and manual controls that rely on system-generated data or reports from the affected IT environments were ineffective because certain data derived from IT applications could have been adversely impacted.
A material weakness is a deficiency, or a combination of deficiencies, in ICFR, such that there is a reasonable possibility that a material misstatement of the annual or interim consolidated financial statements will not be prevented or detected on a timely basis.
Although Management has performed procedures to gain comfort that the consolidated financial statements are fairly stated in all material respects, the aggregation of these control deficiencies gives rise to the possibility that a material misstatement could occur that may not be prevented or detected in a timely manner. Accordingly, these control deficiencies aggregate within the risk assessment, the control activities, and the information and communication components of the 2013 Framework and constitute a material weakness. The material weakness did not result in any identified material misstatements to the accompanying financial statements, and no adjustments were made to previously issued consolidated financial statements. Management believes the accompanying financial statements as at and for the three and six months ended June 30, 2026 fairly present, in all material respects, the Company's financial position, results of operations, and cash flows.
South Bow Corporation Second Quarter 2026 Management's Discussion and Analysis | 26
Changes in Internal Control over Financial Reporting
Other than with respect to the material weakness and remediation efforts described herein, there were no other changes in the ICFR, as defined in Exchange Act Rules 13a-15(f) and 15d-15(f), that occurred during the quarter ended June 30, 2026, that have materially affected, or are reasonably likely to materially affect, the Company's ICFR. Management will continue to periodically evaluate the Company's DC&P and ICFR, and will make any modifications from time to time, as deemed necessary.
The Company continues to monitor and maintain appropriate internal controls during the post-implementation period following the new ERP system implementation, including performance and modification of controls, verifications, and testing to ensure data integrity and completeness.
Based on their inherent limitations, DC&P and ICFR may not prevent or detect misstatements, and even those controls determined to be effective can provide only reasonable assurance with respect to financial statement preparation and presentation.
Remedial Measures
Management, under the oversight of the Audit Committee, has substantially completed the design and implementation of most remedial measures aimed at addressing the control deficiencies that contributed to the previously identified material weakness in ICFR. Most of the remediation activities were completed during 2025 and the first two quarters of 2026, with the remaining remediation activities to be completed in the third quarter of 2026 and designed to ensure that the relevant controls are appropriately designed and implemented.
The Company engaged third-party advisors to assist Management in the execution of its remediation plan. Remediation actions implemented to date include the following:
•enhancing the Company's risk assessment and control identification procedures for system and application changes;
•strengthening IT general controls related to new system implementations and application change-management; and
•enhancing the training program for IT general controls and related policies, to educate control owners on the principles and requirements of each control and to reinforce expectations for control documentation and evidence of performance, focusing on user access, change management, and segregation of duties over IT systems impacting financial reporting.
While Management believes that the remediation actions described above address the underlying control deficiencies, the material weakness will not be considered remediated (and cannot be deemed fully remediated) until the controls have operated for a sufficient period of time and Management has concluded, through testing, that such controls are operating effectively. In addition, the effectiveness of these controls is subject to independent evaluation by the Company's external auditor. Management will continue to monitor the effectiveness of the remediation efforts as part of its ongoing evaluation of ICFR. If necessary, Management may implement additional measures or modifications to further strengthen the control environment.
Critical Accounting Estimates
In preparing the accompanying financial statements in accordance with U.S. GAAP, Management is required to make estimates and assumptions that impact the reported amounts of assets, liabilities, revenues, and expenses, as well as the disclosure of contingent assets and liabilities. Critical accounting estimates may significantly impact South Bow's financial position, changes in financial position, and financial performance. There were no critical accounting estimates and judgments during the six months ended June 30, 2026.
Changes in Accounting Policies
The Company has not adopted any new accounting standards during the six months ended June 30, 2026. Refer to Note 2, Accounting Policy Changes of the Company's accompanying financial statements for details on new and amended standards issued but not yet adopted by the Company.
South Bow Corporation Second Quarter 2026 Management's Discussion and Analysis | 27
Select Quarterly Financial & Operational Information
The following table presents select quarterly financial and operational information over the last eight quarters:
| | | | | | | | | | | | | | | | | | | | | | | | | | |
| U.S.$ millions, except per-share, ratios, and operational data, and where noted | 2026 | 2025 | 2024 1 |
| Q2 | Q1 | Q4 | Q3 | Q2 | Q1 | Q4 | Q3 |
| Revenue | 546 | 491 | 503 | 461 | 524 | 498 | 488 | 534 |
| Income from equity investments | 14 | 13 | 14 | 12 | 13 | 13 | 12 | 12 |
| Income before income taxes | 174 | 100 | 153 | 104 | 126 | 114 | 72 | 90 |
Normalized EBITDA 2 | 280 | 257 | 252 | 254 | 250 | 266 | 290 | 262 |
Distributable cash flow 2 | 175 | 168 | 149 | 236 | 167 | 157 | 155 | 190 |
Total capital expenditures 3 | 13 | | 8 | 42 | 39 | 43 | 64 | 39 | 62 |
| | | | | | | | |
| Net income | 134 | 77 | 156 | 93 | 96 | 88 | 55 | 61 |
Weighted average common shares outstanding - diluted (millions) 4 | 208.8 | 208.5 | 208.8 | 208.8 | 208.8 | 208.7 | 208.4 | 207.6 |
Net income per share - diluted 4 | 0.64 | 0.37 | 0.75 | 0.45 | 0.46 | 0.42 | 0.26 | 0.29 |
Normalized net income 2 | 104 | 92 | 127 | 99 | 87 | 98 | 112 | 86 |
Normalized net income per share - diluted 2, 4 | 0.50 | 0.44 | 0.61 | 0.47 | 0.42 | 0.47 | 0.54 | 0.41 |
| | | | | | | | |
| Dividends declared | 104 | 104 | 104 | 104 | 104 | 104 | 104 | |
Dividends declared per share 4 | 0.50 | 0.50 | 0.50 | 0.50 | 0.50 | 0.50 | 0.50 | |
| | | | | | | | |
Total long-term debt 5 | 5,734 | 5,751 | 5,768 | 5,751 | 5,774 | 5,719 | 5,716 | 10,452 |
Net debt 2 | 4,594 | 4,738 | 4,806 | 4,836 | 4,903 | 4,910 | 4,901 | 4,827 |
Net debt-to-normalized EBITDA ratio 2 | 4.4 | 4.7 | 4.7 | 4.6 | 4.6 | 4.6 | 4.5 | 4.5 |
| | | | | | | | |
Operational Information | | | | | | | | |
Keystone Pipeline SOF (%) 6 | 93 | 95 | 94 | 92 | 93 | 98 | 96 | 95 |
| Keystone Pipeline throughput (Mbbl/d) | 596 | 616 | 594 | 584 | 544 | 613 | 621 | 616 |
U.S. Gulf Coast segment of Keystone Pipeline System throughput (Mbbl/d) 7 | 800 | 709 | 680 | 703 | 760 | 726 | 784 | 815 |
| Marketlink throughput (Mbbl/d) | 642 | 537 | 531 | 547 | 625 | 549 | 615 | 636 |
1. Figures presented prior to October 1, 2024 are based on the Company's carve-out financial statements prepared prior to the Spinoff and have been presented based on information from the carve-out financial statements. Figures not presented were not included within the carve-out financial statements. Figures prior to the Spinoff were previously disclosed in Canadian dollars.
2. Non-GAAP financial measure or ratio that does not have a standard meaning under GAAP. Refer to the Specified Financial Measures section of this MD&A for additional details.
3. Total capital expenditures is a supplementary measure. Refer to the Specified Financial Measures section of this MD&A for additional details.
4. Effective October 1, 2024, the Company completed the Spinoff into an independent, publicly traded entity. Per-share figures for comparative periods have been calculated using the outstanding shares at October 1, 2024.
5. Total long-term debt subsequent to October 1, 2024 includes the Company's Senior Notes and Junior Notes per the consolidated balance sheets of the accompanying financial statements. For periods prior to October 1, 2024, the Company had long-term debt to affiliates of its Former Parent.
6. SOF measures South Bow's ability to deliver crude oil at the planned maximum rate of the Keystone Pipeline System.
7. Comprises throughput originating in Hardisty, Alberta transported on the Keystone Pipeline System, and throughput originating in Cushing, Oklahoma transported on Marketlink for destination in the U.S. Gulf Coast.
South Bow Corporation Second Quarter 2026 Management's Discussion and Analysis | 28
Fluctuations in quarterly revenues and earnings are and can be impacted by regulatory decisions, timing of newly constructed assets being placed into service, acquisitions and divestitures, demand for uncommitted transportation services, marketing activities and commodity prices, developments outside of the normal course of operations, certain fair value adjustments, and foreign exchange rates. Over the last eight quarters, the Company's results have been impacted primarily by the following:
•Charges as a result of the Withdrawal of the Keystone Variable Toll Disputes with the CER and FERC that were recorded in the third quarter of 2025. Refer to the Recent Developments section of this MD&A for additional details.
•Separation expenses related to the planning, execution, and completion of the Spinoff. The associated costs were primarily recorded beginning in 2024.
•Changes in market demand and opportunity for shipping uncommitted volumes, which can impact revenue recorded between quarters. During the first quarter of 2024, the Company shipped high uncommitted volumes at favourable rates due to high market demand.
•Impacts on throughput volumes and revenues associated with the MP-171 incident, which occurred in the second quarter of 2025. Refer to the Recent Developments section of this MD&A for additional details.
Second-quarter 2026 Review
The second quarter of 2026 was highlighted by the following events:
•Generated revenue of $546 million and income from equity investments of $14 million compared to revenues of $491 million and income from equity investments of $13 million during the first quarter of 2026. The increase in revenue was primarily attributable to higher unrealized gains on the Marketing segment's risk management instruments and increased customer demand to move heavy crude oil towards the U.S. Gulf Coast.
•Delivered normalized EBITDA of $280 million, compared to $257 million in the first quarter of 2026.
•South Bow declared its quarterly dividend of $0.50 per share on May 7, 2026, which was paid on July 15, 2026 to shareholders of record on June 30, 2026.
•Total Keystone Pipeline System throughput was approximately 596,000 bbl/d, a decrease of approximately 20,000 bbl/d from the first quarter of 2026, primarily due to market volatility and planned system integrity and maintenance work that reduced system availability. Throughput on the U.S. Gulf Coast segment was approximately 800,000 bbl/d, an increase of approximately 91,000 bbl/d from the first quarter of 2026.
•Exited the period with net debt of $4.6 billion and a net debt-to-normalized EBITDA ratio of 4.4 times compared to net debt of $4.8 billion and a net debt-to-normalized EBITDA ratio of 4.7 times at December 31, 2025.
Risk Management
South Bow is subject to various risks which could have a potential material impact on the Company's financial results and operations. These risks include, but are not limited to, financial risk, operational risk, regulatory risk, market risk, commodity price risk, liquidity risk, foreign exchange risk, and counterparty credit risk.
For details on the risk factors impacting South Bow, refer to the Company's AIF for the year ended December 31, 2025, which is available on South Bow's website at www.southbow.com, under South Bow's SEDAR+ profile at www.sedarplus.ca, and in South Bow's filings with the SEC at www.sec.gov.
Net Investment Hedge
A portion of the Company's entities generate all or most of their earnings in Canadian dollars and, since the Company reports its financial results in U.S. dollars, changes in the value of the Canadian dollar against the U.S. dollar can impact its comprehensive income. If the Company's Canadian dollar-denominated operations continue to grow, this exposure increases.
South Bow Corporation Second Quarter 2026 Management's Discussion and Analysis | 29
The Company is exposed to foreign exchange risk in its Canadian-dollar functional currency entity which holds U.S. dollar-denominated debt. This foreign exchange risk is offset by the designation of its U.S. dollar-denominated Junior Notes as a net investment hedge in foreign operations. The net investment hedge is perfectly effective and any foreign exchange gain or loss, as determined by the respective period-end rate, is reported as cumulative translation adjustment within accumulated other comprehensive income ("AOCI").
| | | | | | | | |
| June 30, | December 31, |
| U.S.$ millions | 2026 | 2025 |
Notional amount of U.S. dollar-denominated Junior Notes | 1,100 | | 1,100 | |
Fair value of U.S. dollar-denominated Junior Notes | 1,166 | | 1,165 | |
| Cumulative translation adjustment recognized in AOCI | (50) | | (12) | |
Counterparty Credit Risk
South Bow's exposure to counterparty credit risk includes its cash and cash equivalents, accounts receivable, environmental provision and certain contractual recoveries, available-for-sale assets, and the fair value of derivative assets.
The Company had no significant credit losses and no significant amounts impaired at June 30, 2026 and 2025 within normal trade accounts receivable. At June 30, 2026 and 2025, there were no significant credit risk concentrations.
Fair Value Hierarchy
The Company's financial assets and liabilities recorded at fair value have been categorized into three categories based on a fair value hierarchy.
| | | | | |
| Levels | How Fair Value Has Been Determined |
| Level I | Quoted prices in active markets for identical assets and liabilities that the Company has the ability to access at the measurement date. An active market is a market in which frequency and volume of transactions provides pricing information on an ongoing basis. |
| Level II | This category includes commodity derivatives where fair value is determined using the market approach. Inputs include yield curves and broker quotes from external data service providers. |
| Level III | This category includes long-dated transactions in certain markets where liquidity is low and the Company uses the most observable inputs available or, alternatively, long-term broker quotes or negotiated commodity prices that have been contracted for under similar terms in determining an appropriate estimate of these transactions. There is uncertainty caused by using unobservable market data which may not accurately reflect possible future changes in fair value. |
The fair value of the Company's derivative assets and liabilities measured on a recurring basis, including both current and non‑current portions, were categorized as follows:
| | | | | | | | | | | | | | |
| Quoted Prices in Active Markets
(Level I) | Significant Other Observable Inputs (Level II) 1 | Significant Unobservable Inputs
(Level III) 1 | Total |
| U.S.$ millions |
| Derivative instrument assets | 255 | | 23 | | — | | 278 | |
| Derivative instrument liabilities | (255) | | (13) | | — | | (268) | |
As at June 30, 2026 | — | | 10 | | — | | 10 | |
| | | | |
| Derivative instrument assets | 30 | | 4 | | — | | 34 | |
| Derivative instrument liabilities | (28) | | (1) | | — | | (29) | |
| As at December 31, 2025 | 2 | | 3 | | — | | 5 | |
1. There were no transfers from Level II to Level III for the periods presented.
South Bow Corporation Second Quarter 2026 Management's Discussion and Analysis | 30
Financial Instruments
Non-derivative Financial Instruments
Fair Value of Non-derivative Financial Instruments
Available-for-sale assets are recorded at fair value, which is calculated using quoted market prices where available. Certain non-derivative financial instruments included in cash and cash equivalents, accounts receivable, environmental provision recovery, contractual recoveries, other current assets, other long-term assets, accounts payable and other, and other long-term liabilities, have carrying amounts that approximate their fair value due to the nature of the item or the short time to maturity. Each of these instruments are classified in Level II of the fair value hierarchy.
Credit risk has been taken into consideration when calculating the fair value of non-derivative financial instruments.
Balance Sheet Presentation of Non-derivative Financial Instruments
The following table details the fair value of non-derivative financial instruments, excluding those where carrying amounts approximate fair value, and would be classified in Level II of the fair value hierarchy:
| | | | | | | | | | | | | | |
| June 30, 2026 | December 31, 2025 |
| | | | |
| U.S.$ millions | Carrying
Amount | Fair Value | Carrying Amount | Fair Value |
| | | | |
Senior Notes 1 | 4,648 | | 4,684 | | 4,682 | | 4,745 | |
Junior Notes 1 | 1,086 | | 1,166 | | 1,086 | | 1,165 | |
| | | | |
1. The carrying amount of the Senior Notes and Junior Notes include unamortized debt issuance costs of $23 million and $14 million, respectively (December 31, 2025 - $26 million and $14 million, respectively).
Available-for-sale Assets Summary
The following tables summarize additional information about the Company's Land Matters Consultation Initiative ("LMCI") restricted investments that were classified as available‑for‑sale assets:
| | | | | | | | | | | | |
| June 30, | | | December 31, | | |
| U.S.$ millions | 2026 | | | 2025 | | |
Fair Value of Fixed Income Securities 1, 2 | | | | | | |
| | | | | | |
| | | | | | |
Maturing within 5 to 10 years | 91 | | | | — | | | |
| Maturing after 10 years | — | | | | 88 | | | |
| | | | | | |
| 91 | | | | 88 | | | |
1. Available-for-sale assets are recorded at fair value and included in other long-term assets on the Company's consolidated balance sheets.
2. Classified in Level II of the fair value hierarchy.
| | | | | | | | | | | | | | |
| Three Months Ended June 30, | Six Months Ended June 30, |
| U.S.$ millions | 2026 | 2025 | 2026 | 2025 |
Net unrealized gains (losses) 1 | 12 | | (4) | | 14 | | (2) | |
Net realized losses 1, 2 | (11) | | — | | (13) | | (1) | |
1. Realized and unrealized gains (losses) arising from changes in the fair value of LMCI restricted investments impact the subsequent amounts to be collected through tolls to cover future pipeline abandonment costs. As a result, the Company records these gains and losses within other long-term assets and liabilities on the consolidated balance sheets.
2. Realized losses on the sale of LMCI restricted investments are determined using the average cost basis.
South Bow Corporation Second Quarter 2026 Management's Discussion and Analysis | 31
Derivative Instruments
Fair Value of Derivative Instruments
The fair value of commodity derivatives has been calculated using quoted market prices where available. In the absence of quoted market prices, third-party broker quotes or other valuation techniques have been used. The fair value of options has been calculated using the binomial pricing model. Credit risk has been taken into consideration when calculating the fair value of derivative instruments. Unrealized gains and losses on derivative instruments are not necessarily representative of the amounts that will be realized on settlement.
Even though the derivatives are considered to be effective economic hedges, they do not meet the specific criteria for hedge accounting treatment or are not designated as a hedge, and are accounted for at fair value with changes in fair value recorded in net income in the period of change. This may expose the Company to increased variability in reported earnings because the fair value of the derivative instruments can fluctuate significantly from period to period.
Balance Sheet Presentation of Derivative Instruments
The balance sheet classification of the fair value of held-for-trading, commodity derivative instruments was as follows:
| | | | | | | | | | | | | | |
| | | | | | | June 30, | December 31, |
| U.S.$ millions | 2026 | 2025 |
| | | | | | | | |
| | | | | | | | |
| | | | | | | | |
| | | | | | | | |
| | | | | | | | |
| | | | | | | | |
| | | | | | | | |
| | | | | | | | |
Total Derivative Assets (other current assets) | | | | | | | 278 | | 34 | |
| | | | | | | | |
| | | | | | | | |
| | | | | | | | |
| | | | | | | | |
| | | | | | | | |
| | | | | | | | |
| | | | | | | | |
| | | | | | | | |
Total Derivative Liabilities (accounts payable and other) | | | | | | | (268) | | (29) | |
Total Derivatives 1, 2 | | | | | | | 10 | | 5 | |
1. Fair value equals carrying value.
2. Includes purchases and sales of crude oil.
The majority of derivative instruments held for trading have been entered into for risk management purposes and all are subject to South Bow's risk management strategies, policies, and limits. These include derivatives that have not been designated as hedges or do not qualify for hedge accounting treatment but have been entered into as economic hedges to manage the Company's exposures to market risk.
Notional and Maturity Summary
The maturity and notional amount or quantity outstanding related to the Company's liquids commodity derivative instruments was as follows:
| | | | | | | | | | | | | | | | |
| | | | | June 30, | December 31, | | | | |
| | | | | 2026 | 2025 | | | | |
| | | | | | | | | | |
| Gross purchases volumes (millions of barrels) | | | | | (26) | | (33) | | | | | |
| | | | | | | | | | |
| Gross sales volumes (millions of barrels) | | | | | 20 | | 22 | | | | |
Net Purchases Volumes (millions of barrels) | | | | | (6) | | (11) | | | | | |
| Maturity dates (year) | | | | | 2026-2027 | 2026 | | | | |
Unrealized and Realized Gains on Commodity Derivative Instruments
| | | | | | | | | | | | | | |
| Three Months Ended June 30, | Six Months Ended June 30, |
| U.S.$ millions | 2026 | 2025 | 2026 | 2025 |
| | | | |
Derivative Instruments Held for Trading 1 | | | | |
| Unrealized gains | 37 | | 15 | | 5 | | 8 | |
| Realized gains | 82 | | 91 | | 182 | | 211 | |
| Gains on Derivatives | 119 | | 106 | | 187 | | 219 | |
1. Realized and unrealized gains on derivative instruments held for trading used to purchase and sell crude oil are included on a net basis in revenues on the consolidated statements of income.
South Bow Corporation Second Quarter 2026 Management's Discussion and Analysis | 32
Offsetting of Derivative Instruments
South Bow enters into commodity derivative contracts with the right to offset in the normal course of business as well as in the event of default. The Company has no master netting agreements; however, similar contracts are entered into containing rights to offset.
The Company has elected to present the fair value of derivative instruments with the right to offset on a gross basis on the consolidated balance sheets.
The following tables show the impact on the presentation of the fair value of derivative instrument assets and liabilities had the Company elected to present these contracts on a net basis:
| | | | | | | | | | | |
| As at June 30, 2026 | Gross Derivative Instruments | Amounts Available for Offset 1 | Net Amounts |
| U.S.$ millions |
| | | |
| Derivative instrument assets | 278 | | (264) | | 14 | |
| | | |
| | | |
| | | |
| | | |
| Derivative instrument liabilities | (268) | | 264 | | (4) | |
| | | |
| | | |
| | | |
| | | |
1. Amounts available for offset do not include cash collateral pledged or received.
| | | | | | | | | | | |
| As at December 31, 2025 | Gross Derivative Instruments | Amounts Available for Offset 1 | Net Amounts |
| U.S.$ millions |
| | | |
| Derivative instrument assets | 34 | | (28) | | 6 | |
| | | |
| | | |
| | | |
| | | |
| Derivative instrument liabilities | (29) | | 28 | | (1) | |
| | | |
| | | |
| | | |
| | | |
1. Amounts available for offset do not include cash collateral pledged or received.
With respect to the derivative instruments presented above, the Company provided cash collateral of $18 million and letters of credit of $11 million at June 30, 2026 (at December 31, 2025 – $26 million and $11 million, respectively) to its counterparties. At June 30, 2026, the Company held no cash collateral and $74 million in letters of credit (at December 31, 2025 – nil and $70 million, respectively) from counterparties on asset exposures.
Credit Risk-related Contingent Features of Derivative Instruments
Derivative contracts entered into to manage market risk often contain financial assurance provisions that allow parties to the contracts to manage credit risk. These provisions may require collateral to be provided if a credit risk-related contingent event occurs, such as a downgrade in South Bow's credit rating to non-investment grade. The Company may also need to provide collateral if the fair value of its derivative financial instruments exceeds pre-defined exposure limits. The Company has provided collateral for the derivative instruments with credit risk-related contingent features, recorded within other current assets on the consolidated balance sheets. At June 30, 2026 and December 31, 2025, there were no other derivative instruments that had credit risk-related features for which collateral was not provided.
South Bow Corporation Second Quarter 2026 Management's Discussion and Analysis | 33
Parental Guarantees of Debt
On August 28, 2024, the Company completed its initial debt offering which included U.S. and Canadian dollar-denominated Senior Notes and U.S. dollar-denominated Junior Notes issued by certain subsidiaries of South Bow Corporation. The guarantees are full and unconditional. The issuers and guarantors of the U.S. dollar-denominated Senior Notes and Junior Notes are summarized below:
| | | | | | |
| | Issuer and Guarantors ("Obligor Group") |
Senior Notes | |
| Due September 2027 ($700 million, 4.91%) | | Issued by South Bow USA Infrastructure Holdings LLC and guaranteed by South Bow Infrastructure Holdings Ltd., South Bow Canadian Infrastructure Holdings Ltd., and South Bow Corporation. |
| Due October 2029 ($1,000 million, 5.03%) | |
| Due October 2034 ($1,250 million, 5.58%) | |
| Due October 2054 ($700 million, 6.18%) | |
| | |
| Due February 2030 (C$450 million, 4.32%) | | Issued by South Bow Canadian Infrastructure Holdings Ltd. and guaranteed by South Bow Infrastructure Holdings Ltd., South Bow USA Infrastructure Holdings LLC, and South Bow Corporation. |
| Due February 2032 (C$500 million, 4.62%) | |
| Due February 2035 (C$500 million, 4.93%) | |
| | |
Junior Notes | | |
| Due March 2055 ($450 million, 7.63%) | | Issued by South Bow Canadian Infrastructure Holdings Ltd. and guaranteed by South Bow Infrastructure Holdings Ltd., South Bow USA Infrastructure Holdings LLC, and South Bow Corporation. |
| Due March 2055 ($650 million, 7.50%) | |
| |
| | |
| | |
| |
| |
The Senior Notes guarantees rank above all subordinated debts, including the Junior Notes, and are equal in payment priority with other non-subordinated debts. They are subordinated to secured debts to the extent of the value of the securing assets. Additionally, they are structurally subordinated to the debts and liabilities of subsidiaries that do not guarantee the Senior Notes. The indentures governing the Senior Notes limit South Bow's ability to: create liens without equally and ratably securing the notes; and engage in certain sale and leaseback transactions. Such indentures also limit South Bow's ability to consolidate, merge, or transfer all or substantially all its assets.
The Junior Notes guarantees are unsecured and rank below all senior debts, including the Senior Notes. They are equal in payment priority with other specified unsecured subordinated debts and are structurally subordinated to the debts of subsidiaries that do not guarantee the Junior Notes. In the event of bankruptcy or insolvency, they rank above common and preferred shares in asset distribution.
The guarantees on the Senior Notes and Junior Notes do not limit the amount of senior indebtedness that South Bow may incur or the amount of other indebtedness or liabilities that South Bow or its subsidiaries may incur, and do not contain any financial or other similar restrictive covenants.
South Bow Corporation Second Quarter 2026 Management's Discussion and Analysis | 34
Summarized Financial Information of the Obligor Group
In accordance with Rule 3-10 of the SEC's Regulation S-X, South Bow has provided the following summarized information and disclosures in lieu of filing separate financial statements for each of the guarantors of the securities. The summarized financial information of the Obligor Group is presented on a combined basis and has eliminated intercompany balances and transactions between the entities in the Obligor Group. The summarized financial information excludes information of any subsidiaries who are not issuers or guarantors as well as income from equity method investments. South Bow's credit ratings are based on the accompanying financial statements and therefore the accompanying financial statements provide a more appropriate view of the Company's financial position. The summarized financial information of the Obligor Group is below:
| | | | | | | | |
| June 30, | December 31, |
| U.S.$ millions | 2026 | 2025 |
Select Asset Information: | | |
| Current assets | 761 | | 586 | |
| Receivables from non-obligor subsidiaries | — | | — | |
| Non-current assets | 245 | | 262 | |
| Non-current receivables from non-obligor subsidiaries | 2,137 | | 2,137 | |
| | |
Select Liability Information: | | |
| Current liabilities | 204 | | 206 | |
| Payables to non-obligor subsidiaries | 1,855 | | 2,493 | |
| Non-current liabilities, including guaranteed debt | 5,809 | | 5,818 | |
| Non-current liabilities to non-obligor subsidiaries | 4,137 | | 4,137 | |
| | | | | | |
U.S.$ millions | Six Months Ended June 30, 2026 | |
| Revenues - external | — | | |
| Revenues from non-obligor subsidiaries | — | | |
| Operating loss of Obligor Group | (349) | | |
Net loss of Obligor Group | (412) | | |
Forward-looking Information
To help the reader understand Management's assessment of South Bow's future plans and financial outlook and future prospects overall, this MD&A includes certain statements and information which constitute forward-looking statements or forward-looking information (collectively, "forward-looking statements"). Forward-looking statements are typically identified by words such as "anticipate", "continue", "estimate", "expect", "may", "will", "project", "should", "could", "would", "believe", "plan", "intend", "design", "target", "undertake", "view", "indicate", "maintain", "explore", "entail", "schedule", "objective", "strategy", "likely", "potential", "outlook", "aim", "purpose", "goal", and similar expressions suggesting future events or future performance.
In particular, forward-looking statements in this MD&A include information and certain financial outlooks, about the following, among other things:
•the Company's financial and operational performance;
•expectations about strategies and goals for optimization, growth, and expansion and the methods South Bow expects to employ to implement such strategies;
•South Bow's capital allocation priorities;
•expectations regarding the advancement of the Prairie Connector project including anticipated timing of the FID, that the successful open season supports the continued advancement of the project and the Company’s share of estimated total pre-FID development costs;
South Bow Corporation Second Quarter 2026 Management's Discussion and Analysis | 35
•that the Company will continue to advance remedial actions relating to the MP-171 incident, and the expectation that it will continue to be able to meet all contractual transportation services while operating under the CAO;
•that South Bow's strategically positioned infrastructure continues to play an important role in connecting growing Western Canadian crude oil supply to key refining and export markets;
•expectations that WCSB crude oil supply will grow modestly throughout 2026 and remain below available pipeline egress capacity and the results and impacts thereof;
•expectations regarding demand for capacity on the U.S Gulf Coast segment of the Keystone Pipeline System;
•South Bow's financial outlook and annual guidance for 2026, including normalized EBITDA, financial charges, expected effective tax rate, distributable cash flow, and capital expenditures;
•South Bow's forecast of normalized EBITDA for each of its segments;
•expected normalized EBITDA in the third quarter of 2026 and the reasons therefor;
•expectations that South Bow's net debt-to-normalized EBITDA ratio will decrease modestly through 2026;
•the expected timing of principal repayments and certain other terms of South Bow's Senior Notes and Junior Notes;
•the timing of the Company’s nearest long-term debt maturity;
•South Bow's belief that it is well positioned to meet its operating obligations, including quarterly dividend payments, if, as, and when declared by the Board, and anticipated sources of funds;
•the Company's continued commitment to prudently managing leverage and the expectation that it will enhance its financial resilience, reduce debt service charges and create additional capacity to fund future growth initiatives and potentially grow shareholder returns;
•expected dividends and the designation thereof;
•expectations regarding cash flows associated with the Blackrod Connection Project throughout the second half of 2026 and 2027;
•South Bow's contractual obligations from 2026 through 2030 and thereafter and the categories thereof;
•the maximum term of South Bow's guarantees for certain jointly-owned entities and the potential exposure thereunder;
•that separation capital expenditures are not expected to be recovered through the Company’s tolling arrangements;
•expected capital expenditures, contractual obligations, commitments, and contingent liabilities;
•expected regulatory processes and outcomes;
•the expected impact of future legal and accounting changes;
•the remediation plan and the effectiveness of the actions taken pursuant to the remediation plan to remediate the identified material weakness in the Company's internal controls;
•the possibility that South Bow may need to provide collateral if a credit risk-related contingent event occurs or if the fair value of its derivative financial instruments exceeds pre-defined exposure limits; and
•expected industry, market, and economic conditions, including their impact on South Bow and on its customers and suppliers.
Forward-looking statements do not guarantee future performance. Actual events and results could be significantly different from those implied by forward-looking statements, including because of assumptions, risks, or uncertainties related to South Bow's business or events that happen after the date of this MD&A.
South Bow Corporation Second Quarter 2026 Management's Discussion and Analysis | 36
Forward-looking statements are based on a number of different assumptions, predictions, or projections and subject to a number of different risks, including but not limited to the following key assumptions and subject to the following risks and uncertainties:
Assumptions
•realization of expected benefits from acquisitions, divestitures, and the Spinoff;
•regulatory decisions and outcomes;
•forward pricing estimates;
•assumptions regarding the continuation of global trade policies and agreements currently in effect including tariffs;
•planned and unplanned outages and the use of the Company's pipelines;
•integrity and reliability of the Company's assets;
•anticipated construction costs, schedules, and completion dates;
•access to capital markets, including portfolio management;
•expected industry, market and economic conditions, including the impact of these on the Company and on its customers and suppliers;
•future operating costs being consistent with Management's current expectations;
•the Company's ability to maintain current credit ratings;
•the timely and effective implementation of the remediation plan to remediate the material weakness in the Company's internal controls;
•prevailing inflation rates, commodity, and labour prices;
•prevailing interest, tax, and foreign exchange rates;
•changes in U.S. tax legislation and its impacts on lowering current taxes; and
•nature and scope of hedging.
Risks and Uncertainties
•failure to realize the expected benefits from acquisitions, divestitures, and the Spinoff;
•the Company's ability to successfully implement its strategic priorities and whether they will yield the expected benefits;
•the Company's ability to implement a capital allocation strategy aligned with maximizing shareholder value;
•operating performance of the Company's pipelines and storage assets;
•amount of capacity sold and rates achieved in the Company's business;
•changing global trade policies, including tariffs and the impact on the Company's business, financial results, and operations;
•production levels within supply basins;
•construction and completion of capital projects;
•the implementation and effectiveness of the Company's new ERP and supervisory control and data acquisition systems;
•the remediation of the material weakness in the Company's internal controls and the timing thereof;
•identification of additional material weaknesses or deficiencies in the Company's internal controls;
•cost and availability of, and inflationary pressures on, labour, equipment, and materials;
•availability and market prices of commodities;
•access to capital and insurance markets on competitive terms;
•interest, tax, and foreign exchange rates;
•performance and credit risk of the Company's counterparties;
•regulatory decisions and outcomes of legal proceedings, including arbitration and insurance claims;
•the Company's ability to effectively anticipate and assess changes to government policies and regulations, including those related to the environment;
•the Company's ability to realize the value of tangible assets and contractual recoveries;
•competition in the business in which the Company operates;
•unexpected or unusual weather;
•acts of civil disobedience;
•cyber security and technological developments;
•sustainability-related risks;
•impact of energy transition on the Company's business;
•economic conditions in North America as well as globally;
South Bow Corporation Second Quarter 2026 Management's Discussion and Analysis | 37
•global health crises, such as pandemics and epidemics, and the impacts related thereto;
•risks involving ongoing geopolitical events including the conflicts in the Middle-East and the impacts related thereto;
•recovery of costs resulting from unexpected pollution or environmental events related to the Company's operations; and
•the other factors discussed under Risk Management herein and in the Company's AIF for the year ended December 31, 2025, which is available at www.sedarplus.ca.
The foregoing lists should not be construed as exhaustive. As actual results could vary significantly from the results implied by forward-looking statements, readers should not put undue reliance on forward-looking statements and should not use future-oriented information or financial outlooks for anything other than their intended purpose. South Bow does not update its forward-looking statements due to new information or future events unless required to by law.
Management approved the financial outlooks contained in this MD&A, including 2026 normalized EBITDA, 2026 financial charges, 2026 distributable cash flow, 2026 effective tax rate, 2026 capital expenditures (including growth and maintenance capital expenditures), and third quarter 2026 normalized EBITDA, 2026 net debt-to-normalized EBITDA ratio, and the Company’s share of the total amount of pre-FID development costs expected to be incurred in 2026 on the proposed Prairie Connector and Liberty Bridge projects, which are based on, among other things, the various assumptions disclosed in this MD&A, including those under Forward-looking Information as of the date of this MD&A. The internal projections, expectations, or beliefs are based on the 2026 budget, as applicable, which are subject to change in light of ongoing results, prevailing economic conditions, commodity prices, and industry conditions and regulations. The purpose of these financial outlooks is to inform readers about Management's expectations for the Company's financial and operational results in 2026, and such information may not be appropriate for other purposes. Readers are cautioned that the assumptions used in the preparation of such information, although considered reasonable at the time of preparation, may prove to be imprecise and may be material and adverse and, as such, undue reliance should not be placed on such financial outlooks.
South Bow's future shareholder distributions, including but not limited to the payment of dividends, if any, and the level thereof is uncertain. Any decision to pay dividends on South Bow's shares (including the actual amount, the declaration date, the record date and the payment date in connection therewith and any special dividends) will be subject to the discretion of the Board and may depend on a variety of factors, including, without limitation, South Bow's business performance, financial condition, financial requirements, growth plans, expected capital requirements and other conditions existing at such future time including, without limitation, contractual restrictions and satisfaction of the solvency tests imposed on South Bow under applicable corporate law. Further, the actual amount, the declaration date, the record date and the payment date of any dividend are subject to the discretion of the Board. There can be no assurance that South Bow will pay dividends in the future.
South Bow Corporation Second Quarter 2026 Management's Discussion and Analysis | 38
Glossary
Below are common abbreviations used within this MD&A:
| | | | | |
ACAO | Amended Corrective Action Order |
| bbl | barrel |
| bbl/d | barrels per day |
| C$ or CAD | Canadian dollar |
CAO | Corrective Action Order |
| CER | Canada Energy Regulator |
| |
| |
| EBITDA | earnings before interest, taxes, depreciation and amortization |
ERP | enterprise resource planning |
| FERC | Federal Energy Regulatory Commission |
LMCI | Land Matters Consultation Initiative |
| Mbbl | thousand barrels |
| Mbbl/d | thousand barrels per day |
MP-14 | Refers to the Milepost 14 pipeline incident in December 2022 involving the release of oil from the Keystone Pipeline System into a creek in Washington County, Kansas. Discussed in the Recent Developments section. |
MP-171 | Refers to the Milepost 171 pipeline incident in April 2025 involving the release of oil from the Keystone Pipeline System near Fort Ransom, North Dakota. Discussed in the Recent Developments section. |
NYSE | New York Stock Exchange |
PHMSA | Pipeline and Hazardous Materials Safety Administration |
RCA | root cause analysis |
| TSX | Toronto Stock Exchange |
U.S.$ or USD | United States dollar |
| U.S. GAAP | United States Generally Accepted Accounting Principles |
| |
WCSB | Western Canadian Sedimentary Basin |
| |
| |
| |
| |
| |
| |
| |
| |
South Bow Corporation Second Quarter 2026 Management's Discussion and Analysis | 39