Shareholder Report
May 31, 2026
USD ($)
Holding
This report describes changes to the Fund that occurred during the reporting period.
Fund Expenses
What were the Fund costs for the last year ?
(Based on a hypothetical $10,000 investment)
| Fund | Costs of a $10,000 investment | Costs paid as a percentage of a $10,000 investment |
| Asset Allocation Fund* | $71 | 0.66% |
| * |
The expenses shown in the table are meant to highlight your ongoing costs only and do not reflect any fees and expenses that may be charged by the variable annuity contracts and variable life insurance policies (“Variable Contracts”) that invest in the Fund. |
Management’s Discussion of Fund Performance
SUMMARY OF RESULTS
The Fund posted a return of 15.10% for the year ended May 31, 2026, compared to 29.78% for the S&P 500® Index (a broad-based securities market index) and 19.53% for the Blended Index (the "Performance Index") comprised of 60% S&P 500® Index; 40% Bloomberg U.S. Aggregate Bond Index. Over the period, U.S. small-cap equities outperformed large-cap equities. Treasury market volatility, already elevated in the second half of 2025 amid tariff-driven growth-inflation tensions and a weakening labor market, intensified in 2026 as Middle East conflict sparked an oil price surge, triggering a steep U.S. Treasury sell-off and pushing 10-year yields to multi-year highs. The mortgage-backed securities markets continued to grind tighter throughout late 2025 before experiencing significant volatility and widening in 2026. The credit market spreads continued to grind tighter post Liberation Day peaks before experiencing modest widening during the Middle East conflict.
The following is a summary of the top contributors and detractors that impacted the Fund's performance during the year relative to the Performance Index.
TOP PERFORMANCE CONTRIBUTORS
For the equity segment of the fund | Allocations in the following sectors: consumer staples; telecommunications; consumer cyclical. Security selection in the following sectors: commodities; software & services; consumer cyclical. Position weightings: Alphabet, Inc., Class A; Baker Hughes Co.; NXP Semiconductors NV
For the fixed income segment of the fund | Allocations in the following sectors: U.S. Treasuries; non-agency mortgage-backed securities; agency mortgage-backed securities. Security selection in the following sectors: asset-backed securities; corporate credit; U.S. Treasuries
TOP PERFORMANCE DETRACTORS
For the equity segment of the fund | Allocations in the following sectors: non-bank financials; retail; commodities. Security selection in the following sectors: semiconductors & hardware; non-bank financials; payments & business services. Position Weightings: Arthur J. Gallagher & Co., Intuit, Inc.; Mastercard, Inc., Class A
For the fixed income segment of the fund | Allocations in the following sectors: asset-backed securities; corporate credit; cash. Security selection in the following sectors: agency mortgage-backed securities; commercial mortgage-backed securities
Fund Performance
The following graph compares a $10,000 initial investment in the Fund to the index(es) listed below for the last 10 fiscal years of the Fund.
GROWTH OF $10,000
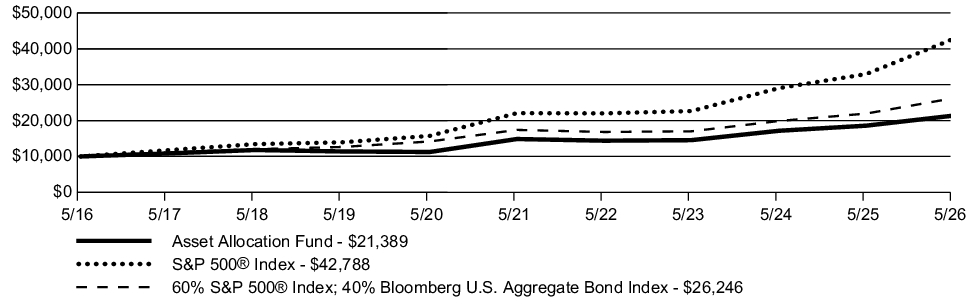
| AVERAGE ANNUAL TOTAL RETURN | 1 Year | 5 Year | 10 Year |
| Asset Allocation Fund | 15.10% | 7.55% | 7.90% |
| S&P 500® Index | 29.78% | 14.15% | 15.65% |
| 60% S&P 500® Index; 40% Bloomberg U.S. Aggregate Bond Index | 19.53% | 8.57% | 10.13% |
Key Fund Statistics
The following table outlines key fund statistics.
| Net assets | $149M |
| Total number of portfolio holdings | 634 |
| Total net advisory fee paid | $0.7M |
| Portfolio turnover rate during the reporting period | 38% |
Graphical Representation of Holdings
The information below represents the composition of the Fund's net assets as of the end of the period.
Top Industries*
| U.S. Government & Agency Obligations | 18.4% |
| Semiconductors | 12.9% |
| Internet | 9.4% |
| Banks | 5.9% |
| Computers | 5.7% |
| Software | 5.2% |
| Retail | 3.9% |
| Collateralized Mortgage Obligations | 3.7% |
| Electric | 3.7% |
| Diversified Financial Services | 3.6% |
| Other Asset Backed Securities | 2.8% |
| Pharmaceuticals | 2.4% |
| Auto Loan Receivables | 2.2% |
| Repurchase Agreements | 2.1% |
| Healthcare-Products | 1.8% |
Portfolio Composition
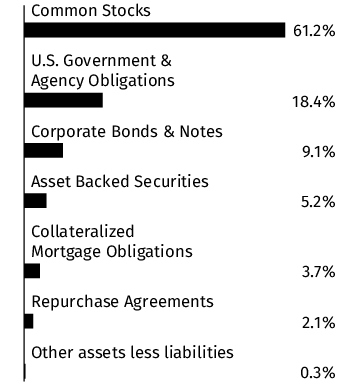
* Percentages exclude derivatives (other than purchased options), if any.
Material Fund Changes
This is a summary of certain changes to the Fund since the beginning of the period. Effective January 1, 2026, The Variable Annuity Life Insurance Company (“VALIC”), the investment adviser to the Fund, replaced SunAmerica Asset Management, LLC (“SunAmerica”) as the administrator of VALIC Company I (“VC I”) and SunAmerica became VC I’s sub-administrator. Additionally, on March 26, 2026, Corebridge Financial, Inc. and Equitable Holdings, Inc. (“EQH”) announced that they have entered into a definitive agreement to merge (the “Transaction”). The Transaction is expected to close by the end of 2026, subject to customary closing conditions, including the receipt of requisite regulatory approvals and approval of the shareholders of both Corebridge Financial, Inc. and EQH. Under the 1940 Act, an investment advisory agreement between a registered investment company, such as VC I, and its investment adviser must include a provision providing for its automatic termination upon its “assignment” (as defined in the 1940 Act). The closing of the Transaction may be deemed to cause an “assignment” of the Investment Advisory Agreement between VC I, on behalf of each Fund, and VALIC. As a result, the closing of the Transaction may cause the Investment Advisory Agreement to terminate automatically in accordance with its terms. It is anticipated that, prior to the closing of the Transaction, VC I’s Board of Directors (the “Board”) will consider a new investment advisory agreement between VC I, on behalf of each Fund, and VALIC. If approved by the Board, the new investment advisory agreement will be presented to the Funds’ shareholders for approval, and, if approved by shareholders, it will take effect upon the closing of the Transaction. For more comprehensive information, you may review the Fund’s next prospectus, which we expect to be available by September 30, 2026 at corebridgefinancial.com/rs/prospectus-and-reports/annuities#underlyingfunds. You can also request this information by calling Corebridge Financial, Inc. at 1-800-448-2542.
Changes in and Disagreements with Accountants
There were no changes in or disagreements with the accountants during the period.
This report describes changes to the Fund that occurred during the reporting period.
Fund Expenses
What were the Fund costs for the last year ?
(Based on a hypothetical $10,000 investment)
| Fund | Costs of a $10,000 investment | Costs paid as a percentage of a $10,000 investment |
| International Equities Index Fund* | $44 | 0.40% |
| * |
The expenses shown in the table are meant to highlight your ongoing costs only and do not reflect any fees and expenses that may be charged by the variable annuity contracts and variable life insurance policies (“Variable Contracts”) that invest in the Fund. |
Management’s Discussion of Fund Performance
SUMMARY OF RESULTS
The Fund is managed to seek to track the performance of the Index. The Subadviser may endeavor to track the Index by purchasing every stock included in the Index, in the same proportions; or, in the alternative, the Subadviser may invest in a sampling of Index stocks by utilizing a statistical technique known as "optimization".
The Fund posted a return of 22.40% for the year ended May 31, 2026, compared to a return of 22.80% for the MSCI EAFE Index (net) (a broad-based securities market & "Performance Index"). Over the period, developed international equities advanced but trailed the strongest U.S. growth-oriented and technology-heavy benchmarks. International equities outpaced weaker U.S. mid-cap growth benchmarks.
The following is a summary of the top contributors and detractors that impacted the Fund's performance during the year.
TOP PERFORMANCE CONTRIBUTORS
Allocations in the following sectors | financials; information technology, industrials
Position weightings | ASML Holding NV; HSBC Holdings PLC; SoftBank Group Corp.
Exposure to the following countries | Japan; United Kingdom; Netherlands
TOP PERFORMANCE DETRACTORS
Allocations in the following sectors | none
Position weightings | SAP SE; Novo Nordisk A/S, Class B; CSL, Ltd.
Exposure to the following countries | Denmark
Fund Performance
The following graph compares a $10,000 initial investment in the Fund to the index(es) listed below for the last 10 fiscal years of the Fund.
GROWTH OF $10,000
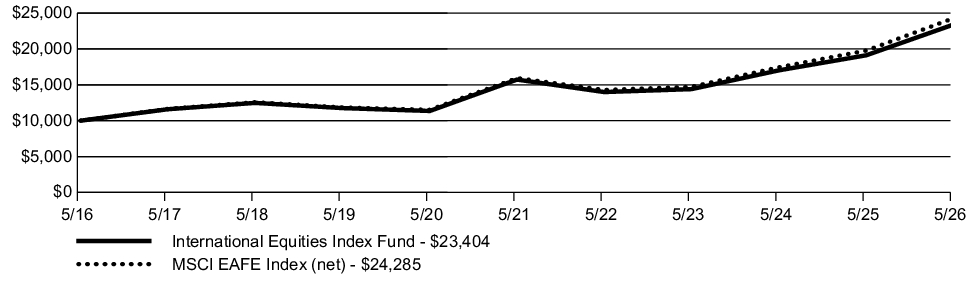
| AVERAGE ANNUAL TOTAL RETURN | 1 Year | 5 Year | 10 Year |
| International Equities Index Fund | 22.40% | 8.27% | 8.88% |
| MSCI EAFE Index (net) | 22.80% | 8.79% | 9.28% |
Key Fund Statistics
The following table outlines key fund statistics.
| Net assets | $2,180M |
| Total number of portfolio holdings | 685 |
| Total net advisory fee paid | $5.1M |
| Portfolio turnover rate during the reporting period | 29% |
Graphical Representation of Holdings
The information below represents the composition of the Fund's net assets as of the end of the period.
Top Industries*
| Banks | 16.4% |
| Pharmaceuticals | 7.6% |
| Semiconductors | 6.5% |
| Insurance | 5.5% |
| Oil & Gas | 3.6% |
| Telecommunications | 3.6% |
| Aerospace/Defense | 3.5% |
| Mining | 3.5% |
| Electric | 3.4% |
| Food | 2.7% |
| Machinery-Construction & Mining | 2.4% |
| Electrical Components & Equipment | 2.3% |
| Auto Manufacturers | 2.2% |
| Retail | 2.1% |
| Chemicals | 2.0% |
Portfolio Composition
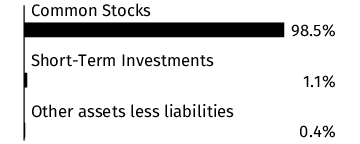
Country
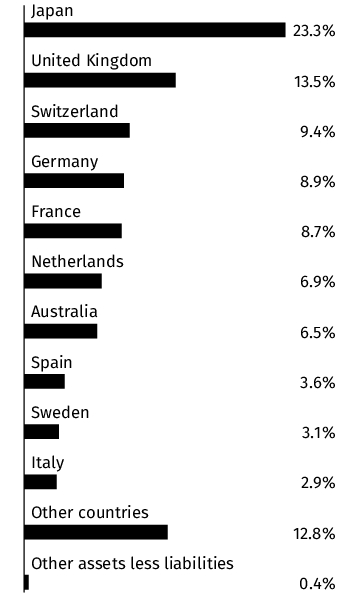
* Percentages exclude derivatives (other than purchased options), if any.
Material Fund Changes
This is a summary of certain changes to the Fund since the beginning of the period. Effective January 1, 2026, The Variable Annuity Life Insurance Company (“VALIC”), the investment adviser to the Fund, replaced SunAmerica Asset Management, LLC (“SunAmerica”) as the administrator of VALIC Company I (“VC I”) and SunAmerica became VC I’s sub-administrator. Additionally, on March 26, 2026, Corebridge Financial, Inc. and Equitable Holdings, Inc. (“EQH”) announced that they have entered into a definitive agreement to merge (the “Transaction”). The Transaction is expected to close by the end of 2026, subject to customary closing conditions, including the receipt of requisite regulatory approvals and approval of the shareholders of both Corebridge Financial, Inc. and EQH. Under the 1940 Act, an investment advisory agreement between a registered investment company, such as VC I, and its investment adviser must include a provision providing for its automatic termination upon its “assignment” (as defined in the 1940 Act). The closing of the Transaction may be deemed to cause an “assignment” of the Investment Advisory Agreement between VC I, on behalf of each Fund, and VALIC. As a result, the closing of the Transaction may cause the Investment Advisory Agreement to terminate automatically in accordance with its terms. It is anticipated that, prior to the closing of the Transaction, VC I’s Board of Directors (the “Board”) will consider a new investment advisory agreement between VC I, on behalf of each Fund, and VALIC. If approved by the Board, the new investment advisory agreement will be presented to the Funds’ shareholders for approval, and, if approved by shareholders, it will take effect upon the closing of the Transaction.
Effective September 29, 2025, the Fund entered into a contractual advisory fee waiver agreement with VALIC to lower the advisory fee rate payable by the Fund to VALIC to 0.315% of the Fund’s average daily net assets on the first $500 million, 0.215% of the Fund’s average daily net assets on the next $500 million, and 0.205% of the Fund’s average daily net assets over $1 billion. For more comprehensive information, you may review the Fund’s next prospectus, which we expect to be available by September 30, 2026 at corebridgefinancial.com/rs/prospectus-and-reports/annuities#underlyingfunds. You can also request this information by calling Corebridge Financial, Inc. at 1-800-448-2542.
Changes in and Disagreements with Accountants
There were no changes in or disagreements with the accountants during the period.
This report describes changes to the Fund that occurred during the reporting period.
Fund Expenses
What were the Fund costs for the last year ?
(Based on a hypothetical $10,000 investment)
| Fund | Costs of a $10,000 investment | Costs paid as a percentage of a $10,000 investment |
| International Government Bond Fund* | $80 | 0.78% |
| * |
The expenses shown in the table are meant to highlight your ongoing costs only and do not reflect any fees and expenses that may be charged by the variable annuity contracts and variable life insurance policies (“Variable Contracts”) that invest in the Fund. |
Management’s Discussion of Fund Performance
SUMMARY OF RESULTS
The Fund posted a return of 4.75% for the year ended May 31, 2026, compared to 3.77% for the Bloomberg Global Aggregate Index (USD hedged) (a broad-based securities market index) and 5.76% for the Blended Index (the "Performance Index") comprised of 70% FTSE WGBI Index (unhedged); 30% JPMorgan EMBI Global Diversified Index. Global bonds delivered positive total returns over the past twelve months, despite geopolitical volatility in global bond yields. Hard currency emerging market bonds outperformed.
The following is a summary of the top contributors and detractors that impacted the Fund's performance during the year relative to the Performance Index.
TOP PERFORMANCE CONTRIBUTORS
In aggregate | position weightings
Exposure to the following countries | Angola; Zambia; Ecuador
TOP PERFORMANCE DETRACTORS
In aggregate | country allocations; yield curve
Exposure to the following countries | lack of exposure to Venezuela; United States; lack of exposure to Ukraine
Fund Performance
The following graph compares a $10,000 initial investment in the Fund to the index(es) listed below for the last 10 fiscal years of the Fund.
GROWTH OF $10,000
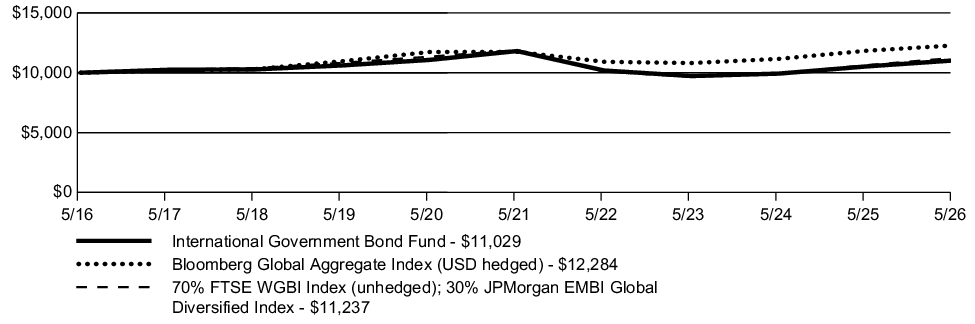
| AVERAGE ANNUAL TOTAL RETURN | 1 Year | 5 Year | 10 Year |
| International Government Bond Fund | 4.75% | (1.37)% | 0.98% |
| Bloomberg Global Aggregate Index (USD hedged) | 3.77% | 0.90% | 2.08% |
| 70% FTSE WGBI Index (unhedged); 30% JPMorgan EMBI Global Diversified Index | 5.76% | (1.12)% | 1.17% |
Key Fund Statistics
The following table outlines key fund statistics.
| Net assets | $55M |
| Total number of portfolio holdings | 146 |
| Total net advisory fee paid | $0.3M |
| Portfolio turnover rate during the reporting period | 186% |
Graphical Representation of Holdings
The information below represents the composition of the Fund as of the end of the period.
Top Industries*
(% of net assets)
(% of net assets)
| Foreign Government Obligations | 59.2% |
| U.S. Government & Agency Obligations | 33.3% |
| Oil & Gas | 2.2% |
| Short-Term Investments | 1.6% |
| Telecommunications | 0.6% |
| Investment Companies | 0.5% |
| Chemicals | 0.5% |
| Real Estate | 0.5% |
| Gas | 0.3% |
Country
(% of net assets)
(% of net assets)
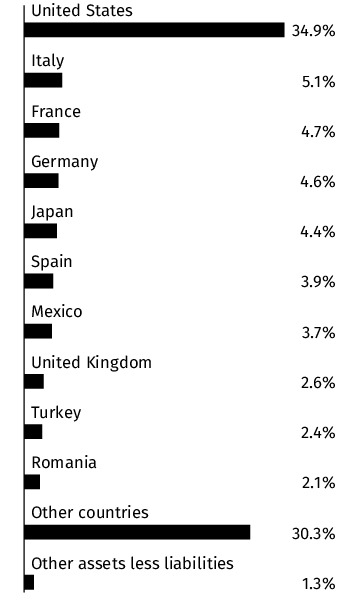
Credit Quality **
(% of total debt issues)
(% of total debt issues)
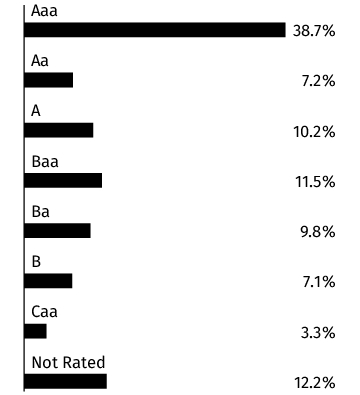
* Percentages exclude derivatives (other than purchased options), if any.
** Credit quality ratings shown above reflect the rating assigned by Moody's Investors Service, Inc. Where Moody's ratings are not available, we have used Standard & Poor's ratings. Unrated investments do not necessarily indicate low credit quality. Credit quality ratings are subject to change. Percentages exclude short-term securities.
Material Fund Changes
This is a summary of certain changes to the Fund since the beginning of the period. Effective January 1, 2026, The Variable Annuity Life Insurance Company (“VALIC”), the investment adviser to the Fund, replaced SunAmerica Asset Management, LLC (“SunAmerica”) as the administrator of VALIC Company I (“VC I”) and SunAmerica became VC I’s sub-administrator. Additionally, on March 26, 2026, Corebridge Financial, Inc. and Equitable Holdings, Inc. (“EQH”) announced that they have entered into a definitive agreement to merge (the “Transaction”). The Transaction is expected to close by the end of 2026, subject to customary closing conditions, including the receipt of requisite regulatory approvals and approval of the shareholders of both Corebridge Financial, Inc. and EQH. Under the 1940 Act, an investment advisory agreement between a registered investment company, such as VC I, and its investment adviser must include a provision providing for its automatic termination upon its “assignment” (as defined in the 1940 Act). The closing of the Transaction may be deemed to cause an “assignment” of the Investment Advisory Agreement between VC I, on behalf of each Fund, and VALIC. As a result, the closing of the Transaction may cause the Investment Advisory Agreement to terminate automatically in accordance with its terms. It is anticipated that, prior to the closing of the Transaction, VC I’s Board of Directors (the “Board”) will consider a new investment advisory agreement between VC I, on behalf of each Fund, and VALIC. If approved by the Board, the new investment advisory agreement will be presented to the Funds’ shareholders for approval, and, if approved by shareholders, it will take effect upon the closing of the Transaction.
Effective September 29, 2025, the Fund’s contractual advisory fee waiver was amended to lower the advisory fee rate payable by the Fund to VALIC to 0.44% of the Fund’s average daily net assets on the first $250 million, 0.39% of the Fund’s average daily net assets on the next $250 million, 0.34% of the Fund’s average daily net assets on the next $500 million, and 0.29% of the Fund’s average daily net assets over $1 billion. For more comprehensive information, you may review the Fund’s next prospectus, which we expect to be available by September 30, 2026 at corebridgefinancial.com/rs/prospectus-and-reports/annuities#underlyingfunds. You can also request this information by calling Corebridge Financial, Inc. at 1-800-448-2542.
Changes in and Disagreements with Accountants
There were no changes in or disagreements with the accountants during the period.
This report describes changes to the Fund that occurred during the reporting period.
Fund Expenses
What were the Fund costs for the last year ?
(Based on a hypothetical $10,000 investment)
| Fund | Costs of a $10,000 investment | Costs paid as a percentage of a $10,000 investment |
| International Growth Fund* | $83 | 0.82% |
| * |
The expenses shown in the table are meant to highlight your ongoing costs only and do not reflect any fees and expenses that may be charged by the variable annuity contracts and variable life insurance policies (“Variable Contracts”) that invest in the Fund. |
Management’s Discussion of Fund Performance
SUMMARY OF RESULTS
The Fund posted a return of 3.59% for the year ended May 31, 2026, compared to a return of 32.77% for the MSCI ACWI ex USA Index (net) (a broad-based securities market & "Performance Index"). International equities advanced during the 12-month period despite heightened geopolitical uncertainty. Equity markets were broadly supported by enthusiasm surrounding artificial intelligence advancements and expectations of more accommodative monetary policy.
The following is a summary of the top contributors and detractors that impacted the Fund's performance during the year relative to the Performance Index.
TOP PERFORMANCE CONTRIBUTORS
Allocations in the following sectors | information technology; health care; financials
Security selection in the following sectors | consumer staples
Position weightings | ASML Holding NV; Taiwan Semiconductor Manufacturing Co., Ltd.; Keyence Corp.
Exposure to the following countries | lack of exposure to China; Netherlands; Taiwan
TOP PERFORMANCE DETRACTORS
In aggregate | position weightings; country allocations; sector allocations
Allocations in the following sectors | consumer discretionary; communication services; lack of allocation in materials
Security selection in the following sectors | financials; information technology; consumer discretionary
Position weightings | Hermes International S.C.A.; MercadoLibre, Inc.; Spotify Technology SA
Exposure to the following countries | France; lack of exposure to South Korea; Sweden
Fund Performance
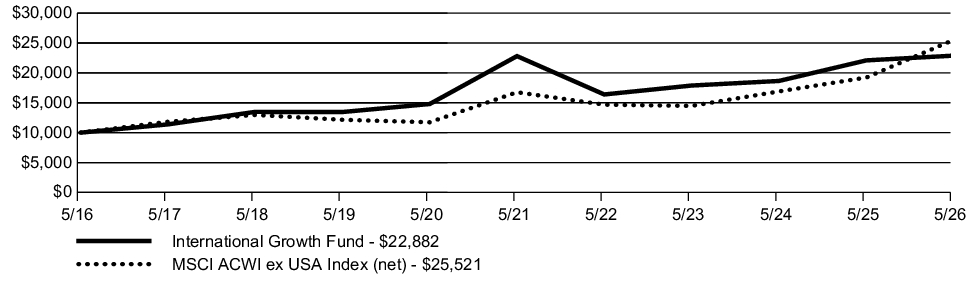
The following graph compares a $10,000 initial investment in the Fund to the index(es) listed below for the last 10 fiscal years of the Fund.
GROWTH OF $10,000
| AVERAGE ANNUAL TOTAL RETURN | 1 Year | 5 Year | 10 Year |
| International Growth Fund | 3.59% | 0.07% | 8.63% |
| MSCI ACWI ex USA Index (net) | 32.77% | 8.77% | 9.82% |
Key Fund Statistics
The following table outlines key fund statistics.
| Net assets | $342M |
| Total number of portfolio holdings | 31 |
| Total net advisory fee paid | $2.4M |
| Portfolio turnover rate during the reporting period | 15% |
Graphical Representation of Holdings
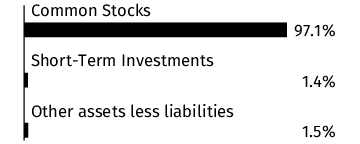
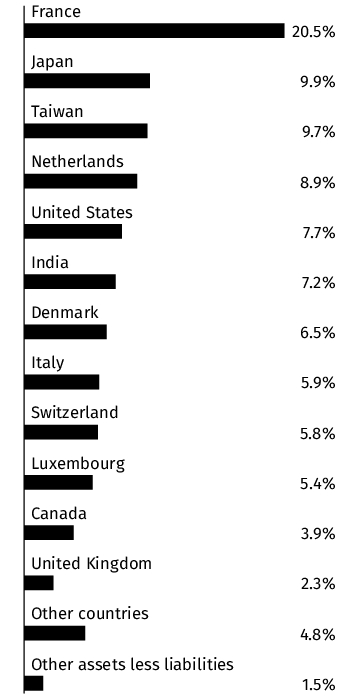
The information below represents the composition of the Fund's net assets as of the end of the period.
Top Industries*
| Semiconductors | 17.5% |
| Apparel | 14.6% |
| Internet | 10.5% |
| Retail | 8.6% |
| Banks | 6.9% |
| Transportation | 6.5% |
| Machinery-Diversified | 6.3% |
| Electrical Components & Equipment | 5.1% |
| Cosmetics/Personal Care | 4.8% |
| Healthcare-Products | 4.1% |
| Entertainment | 3.0% |
| Private Equity | 2.7% |
| Software | 1.5% |
| Insurance | 1.5% |
| Short-Term Investments | 1.4% |
Portfolio Composition
Country
* Percentages exclude derivatives (other than purchased options), if any.
Material Fund Changes
This is a summary of certain changes to the Fund since the beginning of the period. Effective January 1, 2026, The Variable Annuity Life Insurance Company (“VALIC”), the investment adviser to the Fund, replaced SunAmerica Asset Management, LLC (“SunAmerica”) as the administrator of VALIC Company I (“VC I”) and SunAmerica became VC I’s sub-administrator. Additionally, on March 26, 2026, Corebridge Financial, Inc. and Equitable Holdings, Inc. (“EQH”) announced that they have entered into a definitive agreement to merge (the “Transaction”). The Transaction is expected to close by the end of 2026, subject to customary closing conditions, including the receipt of requisite regulatory approvals and approval of the shareholders of both Corebridge Financial, Inc. and EQH. Under the 1940 Act, an investment advisory agreement between a registered investment company, such as VC I, and its investment adviser must include a provision providing for its automatic termination upon its “assignment” (as defined in the 1940 Act). The closing of the Transaction may be deemed to cause an “assignment” of the Investment Advisory Agreement between VC I, on behalf of each Fund, and VALIC. As a result, the closing of the Transaction may cause the Investment Advisory Agreement to terminate automatically in accordance with its terms. It is anticipated that, prior to the closing of the Transaction, VC I’s Board of Directors (the “Board”) will consider a new investment advisory agreement between VC I, on behalf of each Fund, and VALIC. If approved by the Board, the new investment advisory agreement will be presented to the Funds’ shareholders for approval, and, if approved by shareholders, it will take effect upon the closing of the Transaction. For more comprehensive information, you may review the Fund’s next prospectus, which we expect to be available by September 30, 2026 at corebridgefinancial.com/rs/prospectus-and-reports/annuities#underlyingfunds. You can also request this information by calling Corebridge Financial, Inc. at 1-800-448-2542.
Changes in and Disagreements with Accountants
There were no changes in or disagreements with the accountants during the period.
This report describes changes to the Fund that occurred during the reporting period.
Fund Expenses
What were the Fund costs for the last year ?
(Based on a hypothetical $10,000 investment)
| Fund | Costs of a $10,000 investment | Costs paid as a percentage of a $10,000 investment |
| Large Cap Core Fund* | $76 | 0.69% |
| * |
The expenses shown in the table are meant to highlight your ongoing costs only and do not reflect any fees and expenses that may be charged by the variable annuity contracts and variable life insurance policies (“Variable Contracts”) that invest in the Fund.
|
Management’s Discussion of Fund Performance
SUMMARY OF RESULTS
The Fund posted a return of 20.29% for the year ended May 31, 2026, compared to a return of 29.78% for the S&P 500® Index (a broad-based securities market & "Performance Index") and 28.66% for the Russell 1000® Growth Index (prior Performance Index). Over the period, U.S. large-cap equities underperformed small-cap equities significantly, according to the Russell® family of indices. In terms of style factors, value remained flat with respect to growth.
TOP PERFORMANCE CONTRIBUTORS
Massachusetts Financial Services Company - see Material Fund Changes for the time period covered | Allocations in the following sectors: consumer discretionary; utilities; energy. Security selection in the following sectors: consumer staples, communication services; health care. Position weightings: Taiwan Semiconductor Manufacturing Co., Ltd.; lack of position in Costco Wholesale Corp.; Amphenol Corp., Class A
J.P. Morgan Investment Management, Inc. - see Material Fund Changes for the time period covered | Allocations in the following sectors: consumer staples; real estate; materials. Security selection in the following sectors: utilities; real estate; consumer staples. Position weightings: Netflix, Inc.; NXP Semiconductors NV; Berkshire Hathaway, Inc., Class B
T. Rowe Price Associates, Inc. - see Material Fund Changes for the time period covered | Allocations in the following sectors: information technology; real estate; consumer staples. Security selection in the following sectors: financials; industrials and business services; consumer discretionary. Position weightings: Seagate Technology Holdings PLC; Keysight Technologies, Inc.; Vertiv Holdings Co., Class A
TOP PERFORMANCE DETRACTORS
Massachusetts Financial Services Company - see Material Fund Changes for the time period covered | In aggregate: sector allocations; position weightings. Allocations in the following sectors: financials; consumer staples; information technology. Security selection in the following sectors: information technology; financials; utilities. Position weightings: Accenture PLC, Class A; NVIDIA Corp.; lack of position in Broadcom, Inc.
J.P. Morgan Investment Management, Inc. - see Material Fund Changes for the time period covered | In aggregate: position weightings; sector allocations. Allocations in the following sectors: financials; consumer discretionary; utilities. Security selection in the following sectors: information technology; financials; health care. Position weightings: Intuit, Inc.; Arthur J. Gallagher & Co.; Blackstone, Inc.
T. Rowe Price Associates, Inc. - see Material Fund Changes for the time period covered | Allocations in the following sectors: financials; communication services; health care. Security selection in the following sectors: information technology; health care; communication services. Position weightings: Microsoft Corp., T-Mobile US, Inc., Applied Materials, Inc.
Fund Performance
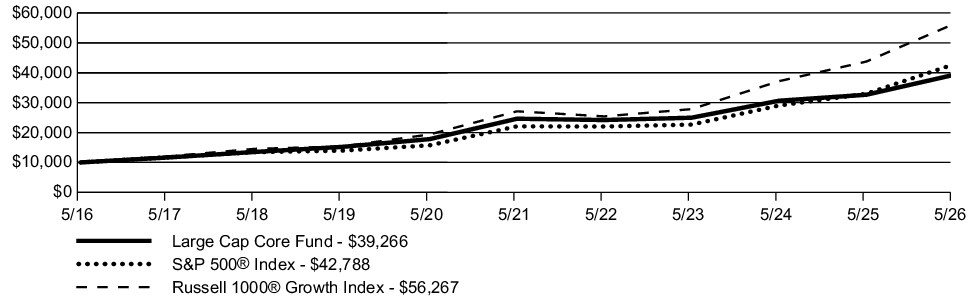
The following graph compares a $10,000 initial investment in the Fund to the index(es) listed below for the last 10 fiscal years of the Fund.
GROWTH OF $10,000
| AVERAGE ANNUAL TOTAL RETURN | 1 Year | 5 Year | 10 Year |
| Large Cap Core Fund | 20.29% | 9.78% | 14.66% |
| S&P 500® Index | 29.78% | 14.15% | 15.65% |
| Russell 1000® Growth Index | 28.66% | 15.73% | 18.86% |
Key Fund Statistics
The following table outlines key fund statistics.
| Net assets | $819M |
| Total number of portfolio holdings | 319 |
| Total net advisory fee paid | $4.0M |
| Portfolio turnover rate during the reporting period | 112% |
Graphical Representation of Holdings
The information below represents the composition of the Fund's net assets as of the end of the period.
Top Industries*
| Semiconductors | 19.8% |
| Internet | 14.2% |
| Computers | 8.9% |
| Software | 7.8% |
| Retail | 5.0% |
| Banks | 4.5% |
| Diversified Financial Services | 4.2% |
| Pharmaceuticals | 3.9% |
| Electric | 2.8% |
| Insurance | 2.6% |
| Healthcare-Products | 2.4% |
| Aerospace/Defense | 2.0% |
| Oil & Gas | 1.8% |
| Auto Manufacturers | 1.7% |
| Telecommunications | 1.5% |
Portfolio Composition
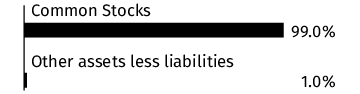
* Percentages exclude derivatives (other than purchased options), if any.
Material Fund Changes
This is a summary of certain changes to the Fund since the beginning of the period. Effective January 1, 2026, The Variable Annuity Life Insurance Company (“VALIC”), the investment adviser to the Fund, replaced SunAmerica Asset Management, LLC (“SunAmerica”) as the administrator of VALIC Company I (“VC I”) and SunAmerica became VC I’s sub-administrator. Additionally, on March 26, 2026, Corebridge Financial, Inc. and Equitable Holdings, Inc. (“EQH”) announced that they have entered into a definitive agreement to merge (the “Transaction”). The Transaction is expected to close by the end of 2026, subject to customary closing conditions, including the receipt of requisite regulatory approvals and approval of the shareholders of both Corebridge Financial, Inc. and EQH. Under the 1940 Act, an investment advisory agreement between a registered investment company, such as VC I, and its investment adviser must include a provision providing for its automatic termination upon its “assignment” (as defined in the 1940 Act). The closing of the Transaction may be deemed to cause an “assignment” of the Investment Advisory Agreement between VC I, on behalf of each Fund, and VALIC. As a result, the closing of the Transaction may cause the Investment Advisory Agreement to terminate automatically in accordance with its terms. It is anticipated that, prior to the closing of the Transaction, VC I’s Board of Directors (the “Board”) will consider a new investment advisory agreement between VC I, on behalf of each Fund, and VALIC. If approved by the Board, the new investment advisory agreement will be presented to the Funds’ shareholders for approval, and, if approved by shareholders, it will take effect upon the closing of the Transaction.
Effective September 29, 2025, J.P. Morgan Investment Management, Inc. and T. Rowe Price Associates, Inc. were appointed as subadvisers to the Fund, replacing the existing subadviser, Massachusetts Financial Services Company. Additionally, the Fund’s investment strategies, techniques and benchmark index were revised to reflect the investment strategies and techniques used by the new subadvisers. As a result, Depositary Receipts Risk, Derivatives Risk, Futures Risk, Sector Risk, and Technology Risk were added as principal risks, and Currency Risk and Focused Fund Risk were removed as principal risks. Additionally, effective September 29, 2025, the Fund’s contractual advisory fee waiver was amended to lower the advisory fee rate payable by the Fund to VALIC to 0.55% of the Fund’s average daily net assets on the first $750 million and 0.50% of the Fund’s average daily net assets over $750 million. In addition, the Fund changed its name from the “Large Capital Growth Fund” to the “Large Cap Core Fund.” For more comprehensive information, you may review the Fund’s next prospectus, which we expect to be available by September 30, 2026 at corebridgefinancial.com/rs/prospectus-and-reports/annuities#underlyingfunds. You can also request this information by calling Corebridge Financial, Inc. at 1-800-448-2542.
Changes in and Disagreements with Accountants
There were no changes in or disagreements with the accountants during the period.
This report describes changes to the Fund that occurred during the reporting period.
Fund Expenses
What were the Fund costs for the last year ?
(Based on a hypothetical $10,000 investment)
| Fund | Costs of a $10,000 investment | Costs paid as a percentage of a $10,000 investment |
| Mid Cap Index Fund* | $39 | 0.35% |
| * |
The expenses shown in the table are meant to highlight your ongoing costs only and do not reflect any fees and expenses that may be charged by the variable annuity contracts and variable life insurance policies (“Variable Contracts”) that invest in the Fund. |
Management’s Discussion of Fund Performance
SUMMARY OF RESULTS
The Fund is managed to seek to track the performance of the Index. The Subadviser may endeavor to track the Index by purchasing every stock included in the Index, in the same proportions; or, in the alternative, the Subadviser may invest in a sampling of Index stocks by utilizing a statistical technique known as "optimization".
The Fund posted a return of 25.52% for the year ended May 31, 2026, compared to a return of 29.45% for the Russell 3000® Index (a broad-based securities market index) and 25.88% for the S&P MidCap 400® Index (the "Performance Index"). Over the period, U.S. equities advanced, with technology-heavy and growth-oriented benchmarks leading the market. Smaller-cap equities also rose, while mid-cap growth lagged value-oriented benchmarks.
The following is a summary of the top contributors and detractors that impacted the Fund's performance during the year.
TOP PERFORMANCE CONTRIBUTORS
Allocations in the following sectors | information technology; industrials; energy
Position weightings | Lumentum Holdings, Inc.; Flex, Ltd.; Coherent Corp.
TOP PERFORMANCE DETRACTORS
Allocations in the following sectors | consumer staples
Position weightings | Duolingo, Inc.; Sprouts Farmers Market, Inc.; DocuSign, Inc.
Fund Performance
The following graph compares a $10,000 initial investment in the Fund to the index(es) listed below for the last 10 fiscal years of the Fund.
GROWTH OF $10,000
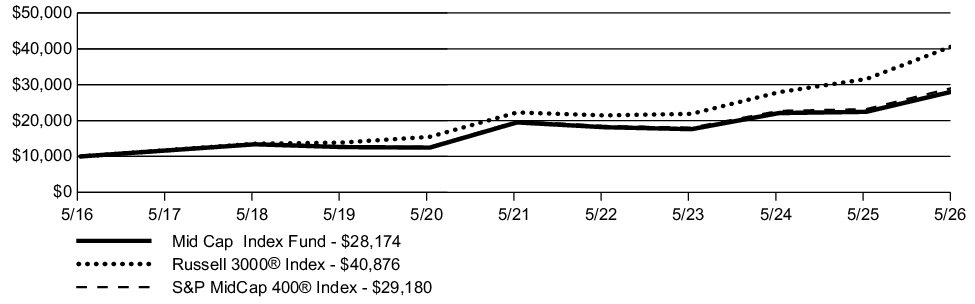
| AVERAGE ANNUAL TOTAL RETURN | 1 Year | 5 Year | 10 Year |
| Mid Cap Index Fund | 25.52% | 7.65% | 10.91% |
| Russell 3000® Index | 29.45% | 12.92% | 15.12% |
| S&P MidCap 400® Index | 25.88% | 8.08% | 11.30% |
Key Fund Statistics
The following table outlines key fund statistics.
| Net assets | $2,583M |
| Total number of portfolio holdings | 404 |
| Total net advisory fee paid | $6.6M |
| Portfolio turnover rate during the reporting period | 17% |
Graphical Representation of Holdings
The information below represents the composition of the Fund's net assets as of the end of the period.
Top Industries*
| REITS | 6.9% |
| Banks | 5.8% |
| Electronics | 5.4% |
| Semiconductors | 4.8% |
| Retail | 4.8% |
| Software | 4.0% |
| Insurance | 4.0% |
| Machinery-Diversified | 3.5% |
| Biotechnology | 3.4% |
| Oil & Gas | 3.1% |
| Commercial Services | 3.0% |
| Engineering & Construction | 2.7% |
| Diversified Financial Services | 2.7% |
| Aerospace/Defense | 2.6% |
| Computers | 2.6% |
Portfolio Composition
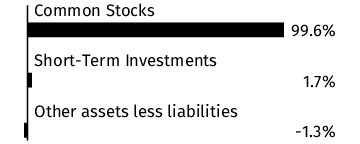
* Percentages exclude derivatives (other than purchased options), if any.
Material Fund Changes
This is a summary of certain changes to the Fund since the beginning of the period. Effective January 1, 2026, The Variable Annuity Life Insurance Company (“VALIC”), the investment adviser to the Fund, replaced SunAmerica Asset Management, LLC (“SunAmerica”) as the administrator of VALIC Company I (“VC I”) and SunAmerica became VC I’s sub-administrator. Additionally, on March 26, 2026, Corebridge Financial, Inc. and Equitable Holdings, Inc. (“EQH”) announced that they have entered into a definitive agreement to merge (the “Transaction”). The Transaction is expected to close by the end of 2026, subject to customary closing conditions, including the receipt of requisite regulatory approvals and approval of the shareholders of both Corebridge Financial, Inc. and EQH. Under the 1940 Act, an investment advisory agreement between a registered investment company, such as VC I, and its investment adviser must include a provision providing for its automatic termination upon its “assignment” (as defined in the 1940 Act). The closing of the Transaction may be deemed to cause an “assignment” of the Investment Advisory Agreement between VC I, on behalf of each Fund, and VALIC. As a result, the closing of the Transaction may cause the Investment Advisory Agreement to terminate automatically in accordance with its terms. It is anticipated that, prior to the closing of the Transaction, VC I’s Board of Directors (the “Board”) will consider a new investment advisory agreement between VC I, on behalf of each Fund, and VALIC. If approved by the Board, the new investment advisory agreement will be presented to the Funds’ shareholders for approval, and, if approved by shareholders, it will take effect upon the closing of the Transaction.
Effective September 29, 2025, the Fund’s contractual advisory fee waiver was amended to lower the advisory fee rate payable by the Fund to VALIC to 0.335% of the Fund’s average daily net assets on the first $500 million, 0.235% of the Fund’s average daily net assets on the next $2.5 billion, 0.185% of the Fund’s average daily net assets on the next $2 billion, and 0.135% of the Fund’s average daily net assets over $5 billion. For more comprehensive information, you may review the Fund’s next prospectus, which we expect to be available by September 30, 2026 at corebridgefinancial.com/rs/prospectus-and-reports/annuities#underlyingfunds. You can also request this information by calling Corebridge Financial, Inc. at 1-800-448-2542.
Changes in and Disagreements with Accountants
There were no changes in or disagreements with the accountants during the period.
This report describes changes to the Fund that occurred during the reporting period.
Fund Expenses
What were the Fund costs for the last year ?
(Based on a hypothetical $10,000 investment)
| Fund | Costs of a $10,000 investment | Costs paid as a percentage of a $10,000 investment |
| Mid Cap Strategic Growth Fund* | $80 | 0.73% |
| * |
The expenses shown in the table are meant to highlight your ongoing costs only and do not reflect any fees and expenses that may be charged by the variable annuity contracts and variable life insurance policies (“Variable Contracts”) that invest in the Fund.
|
Management’s Discussion of Fund Performance
SUMMARY OF RESULTS
The Fund posted a return of 19.00% for the year ended May 31, 2026, compared to a return of 29.45% for the Russell 3000® Index (a broad-based securities market index) and 7.88% for the Russell Midcap® Growth Index (the "Performance Index"). U.S. stocks rose over the period, fueled by healthy corporate earnings, enthusiasm around artificial intelligence (AI), and reduced tariff uncertainty. The economy was largely resilient, despite pockets of weakness and slowing employment growth. Markets experienced some volatility due to geopolitical tensions in the Middle East earlier in 2026, but this was followed by a recovery as risks of escalation eased and attention returned to company fundamentals.
The following is a summary, by subadviser, of the top contributors and detractors that impacted their portion of the Fund's performance during the year relative to the Performance Index.
TOP PERFORMANCE CONTRIBUTORS
Janus Henderson Investors US LLC | In aggregate: sector allocations; position weightings. Allocations in the following sectors: consumer discretionary; communication services; information technology. Security selection in the following sectors: information technology; health care; consumer discretionary. Position weightings: Flex, Ltd.; ON Semiconductor Corp.; JB Hunt Transport Services, Inc.
Voya Investment Management Co. LLC | In aggregate: position weightings; sector allocations. Allocations in the following sectors: industrials; communication services; consumer discretionary. Security selection in the following sectors: information technology; industrials; health care. Position weightings: Sandisk Corp.; Celestica, Inc.; Astera Labs, Inc.
TOP PERFORMANCE DETRACTORS
Janus Henderson Investors US LLC | Allocations in the following sectors: health care; energy; cash. Security selection in the following sectors: industrials; real estate; materials. Position weightings: lack of position in Vertiv Holdings Co., Class A; Constellation Software, Inc; lack of position in Rocket Lab Corp.
Voya Investment Management Co. LLC | Allocations in the following sectors: health care; cash; energy. Security selection in the following sectors: consumer staples; materials; real estate. Position weightings: Datadog, Inc., Class A; Wingstop, Inc.; Arthur J. Gallagher & Co.
Fund Performance
The following graph compares a $10,000 initial investment in the Fund to the index(es) listed below for the last 10 fiscal years of the Fund.
GROWTH OF $10,000
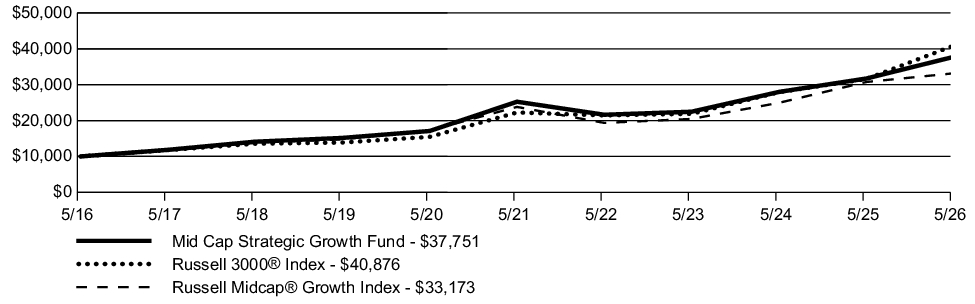
| AVERAGE ANNUAL TOTAL RETURN | 1 Year | 5 Year | 10 Year |
| Mid Cap Strategic Growth Fund | 19.00% | 8.37% | 14.21% |
| Russell 3000® Index | 29.45% | 12.92% | 15.12% |
| Russell Midcap® Growth Index | 7.88% | 6.86% | 12.74% |
Key Fund Statistics
The following table outlines key fund statistics.
| Net assets | $1,158M |
| Total number of portfolio holdings | 156 |
| Total net advisory fee paid | $7.6M |
| Portfolio turnover rate during the reporting period | 58% |
Graphical Representation of Holdings
The information below represents the composition of the Fund's net assets as of the end of the period.
Top Industries*
| Software | 7.4% |
| Aerospace/Defense | 6.9% |
| Healthcare-Products | 6.7% |
| Semiconductors | 6.6% |
| Retail | 6.1% |
| Electronics | 5.5% |
| Commercial Services | 5.3% |
| Biotechnology | 4.0% |
| Diversified Financial Services | 3.5% |
| Transportation | 3.3% |
| Pharmaceuticals | 3.1% |
| Internet | 3.0% |
| Computers | 2.8% |
| Electric | 2.6% |
| Short-Term Investments | 2.5% |
Portfolio Composition
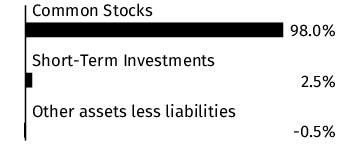
* Percentages exclude derivatives (other than purchased options), if any.
Material Fund Changes
This is a summary of certain changes to the Fund since the beginning of the period. Effective January 1, 2026, The Variable Annuity Life Insurance Company (“VALIC”), the investment adviser to the Fund, replaced SunAmerica Asset Management, LLC (“SunAmerica”) as the administrator of VALIC Company I (“VC I”) and SunAmerica became VC I’s sub-administrator. Additionally, on March 26, 2026, Corebridge Financial, Inc. and Equitable Holdings, Inc. (“EQH”) announced that they have entered into a definitive agreement to merge (the “Transaction”). The Transaction is expected to close by the end of 2026, subject to customary closing conditions, including the receipt of requisite regulatory approvals and approval of the shareholders of both Corebridge Financial, Inc. and EQH. Under the 1940 Act, an investment advisory agreement between a registered investment company, such as VC I, and its investment adviser must include a provision providing for its automatic termination upon its “assignment” (as defined in the 1940 Act). The closing of the Transaction may be deemed to cause an “assignment” of the Investment Advisory Agreement between VC I, on behalf of each Fund, and VALIC. As a result, the closing of the Transaction may cause the Investment Advisory Agreement to terminate automatically in accordance with its terms. It is anticipated that, prior to the closing of the Transaction, VC I’s Board of Directors (the “Board”) will consider a new investment advisory agreement between VC I, on behalf of each Fund, and VALIC. If approved by the Board, the new investment advisory agreement will be presented to the Funds’ shareholders for approval, and, if approved by shareholders, it will take effect upon the closing of the Transaction.
Effective September 29, 2025, the Fund’s investment strategies and techniques were revised to reflect the current investment strategies and techniques used by the Fund’s subadviser. As a result of these changes, ESG Investment Risk was added as a principal risk. For more comprehensive information, you may review the Fund’s next prospectus, which we expect to be available by September 30, 2026 at corebridgefinancial.com/rs/prospectus-and-reports/annuities#underlyingfunds. You can also request this information by calling Corebridge Financial, Inc. at 1-800-448-2542.
Changes in and Disagreements with Accountants
There were no changes in or disagreements with the accountants during the period.
This report describes changes to the Fund that occurred during the reporting period.
Fund Expenses
What were the Fund costs for the last year ?
(Based on a hypothetical $10,000 investment)
| Fund | Costs of a $10,000 investment | Costs paid as a percentage of a $10,000 investment |
| Nasdaq-100® Index Fund* | $51 | 0.42% |
| * |
The expenses shown in the table are meant to highlight your ongoing costs only and do not reflect any fees and expenses that may be charged by the variable annuity contracts and variable life insurance policies (“Variable Contracts”) that invest in the Fund. |
Management’s Discussion of Fund Performance
SUMMARY OF RESULTS
The Fund is managed to seek to track the performance of the Index. The Subadviser may endeavor to track the Index by purchasing every stock included in the Index, in the same proportions; or, in the alternative, the Subadviser may invest in a sampling of Index stocks by utilizing a statistical technique known as "optimization".
The Fund posted a return of 42.49% for the year ended May 31, 2026, compared to a return of 29.78% for the S&P 500® Index (a broad-based securities market index) and 43.09% for the Nasdaq-100® Index (the "Performance Index"). Over the period, U.S. equities advanced, with technology-heavy and growth-oriented benchmarks leading the market. Smaller-cap equities also rose, while mid-cap growth lagged value-oriented benchmarks.
The following is a summary of the top contributors and detractors that impacted the Fund's performance during the year.
TOP PERFORMANCE CONTRIBUTORS
Allocations in the following sectors | information technology; communication services; consumer discretionary
Position weightings | Micron Technology, Inc.; NVIDIA Corp.; Advanced Micro Devices, Inc.
TOP PERFORMANCE DETRACTORS
Allocations in the following sectors | Industrials; financials; real estate
Position weightings | Netflix, Inc.; Intuit, Inc.; Adobe, Inc.
Fund Performance
The following graph compares a $10,000 initial investment in the Fund to the index(es) listed below for the last 10 fiscal years of the Fund.
GROWTH OF $10,000
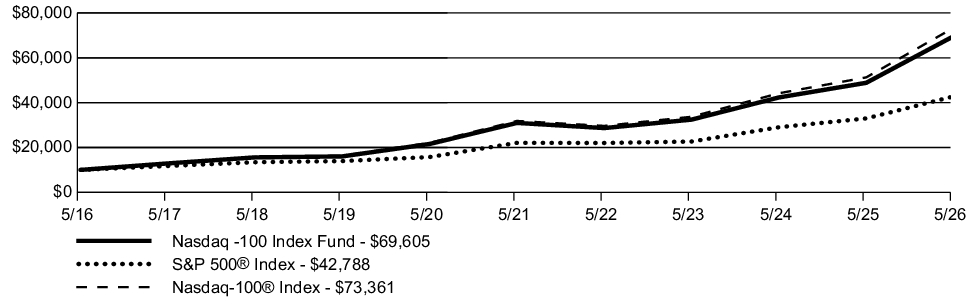
| AVERAGE ANNUAL TOTAL RETURN | 1 Year | 5 Year | 10 Year |
| Nasdaq-100® Index Fund | 42.49% | 17.59% | 21.41% |
| S&P 500® Index | 29.78% | 14.15% | 15.65% |
| Nasdaq-100® Index | 43.09% | 18.17% | 22.06% |
Key Fund Statistics
The following table outlines key fund statistics.
| Net assets | $1,295M |
| Total number of portfolio holdings | 105 |
| Total net advisory fee paid | $3.3M |
| Portfolio turnover rate during the reporting period | 11% |
Graphical Representation of Holdings
The information below represents the composition of the Fund's net assets as of the end of the period.
Top Industries*
| Semiconductors | 32.7% |
| Internet | 20.1% |
| Computers | 11.7% |
| Software | 10.2% |
| Retail | 5.5% |
| Auto Manufacturers | 3.7% |
| Telecommunications | 3.0% |
| Biotechnology | 2.6% |
| Beverages | 1.6% |
| Electric | 1.2% |
| Chemicals | 1.0% |
| Healthcare-Products | 1.0% |
| Commercial Services | 1.0% |
| Media | 0.9% |
| Electronics | 0.7% |
Portfolio Composition
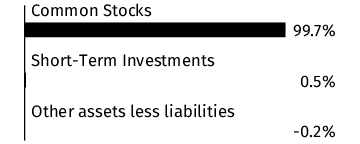
* Percentages exclude derivatives (other than purchased options), if any.
Material Fund Changes
This is a summary of certain changes to the Fund since the beginning of the period. Effective January 1, 2026, The Variable Annuity Life Insurance Company (“VALIC”), the investment adviser to the Fund, replaced SunAmerica Asset Management, LLC (“SunAmerica”) as the administrator of VALIC Company I (“VC I”) and SunAmerica became VC I’s sub-administrator. Additionally, on March 26, 2026, Corebridge Financial, Inc. and Equitable Holdings, Inc. (“EQH”) announced that they have entered into a definitive agreement to merge (the “Transaction”). The Transaction is expected to close by the end of 2026, subject to customary closing conditions, including the receipt of requisite regulatory approvals and approval of the shareholders of both Corebridge Financial, Inc. and EQH. Under the 1940 Act, an investment advisory agreement between a registered investment company, such as VC I, and its investment adviser must include a provision providing for its automatic termination upon its “assignment” (as defined in the 1940 Act). The closing of the Transaction may be deemed to cause an “assignment” of the Investment Advisory Agreement between VC I, on behalf of each Fund, and VALIC. As a result, the closing of the Transaction may cause the Investment Advisory Agreement to terminate automatically in accordance with its terms. It is anticipated that, prior to the closing of the Transaction, VC I’s Board of Directors (the “Board”) will consider a new investment advisory agreement between VC I, on behalf of each Fund, and VALIC. If approved by the Board, the new investment advisory agreement will be presented to the Funds’ shareholders for approval, and, if approved by shareholders, it will take effect upon the closing of the Transaction. For more comprehensive information, you may review the Fund’s next prospectus, which we expect to be available by September 30, 2026 at corebridgefinancial.com/rs/prospectus-and-reports/annuities#underlyingfunds. You can also request this information by calling Corebridge Financial, Inc. at 1-800-448-2542.
Changes in and Disagreements with Accountants
There were no changes in or disagreements with the accountants during the period.
This report describes changes to the Fund that occurred during the reporting period.
Fund Expenses
What were the Fund costs for the last year ?
(Based on a hypothetical $10,000 investment)
| Fund | Costs of a $10,000 investment | Costs paid as a percentage of a $10,000 investment |
| Science & Technology Fund* | $117 | 0.90% |
| * |
The expenses shown in the table are meant to highlight your ongoing costs only and do not reflect any fees and expenses that may be charged by the variable annuity contracts and variable life insurance policies (“Variable Contracts”) that invest in the Fund. |
Management’s Discussion of Fund Performance
SUMMARY OF RESULTS
The Fund posted a return of 60.51% for the year ended May 31, 2026, compared to 29.78% for the S&P 500® Index (a broad-based securities market index) and 66.24% for the S&P North American Technology Sector Index (the "Performance Index"). Over the annual period, global equity markets provided strong results across broad indices, particularly technology stocks which rallied thanks to favorable underlying fundamentals and earnings growth, particularly from AI-related stocks.
The following is a summary, by subadviser, of the top contributors and detractors that impacted their portion of the Fund's performance during the year relative to the Performance Index.
TOP PERFORMANCE CONTRIBUTORS
BlackRock Investment Management, LLC | In aggregate: position weightings. Allocations in the following industries: entertainment; automobiles; financial services. Security selection in the following industries: semiconductors & semiconductor equipment; entertainment; technology hardware, storage & peripherals. Position weightings: Spotify Technology SA; QUALCOMM, Inc.; SAP SE
Voya Investment Management Co. LLC | In aggregate: position weightings; sector allocations. Allocations in the following industries: software; electrical equipment; semiconductors & semiconductor equipment. Security selection in the following industries: technology hardware storage & peripherals; semiconductors & semiconductor equipment; IT services. Position weightings: Micron Technology, Inc.; Sandisk Corp.; Lam Research Corp.
TOP PERFORMANCE DETRACTORS
BlackRock Investment Management, LLC | In aggregate: sector allocations. Allocations in the following industries: IT services; semiconductor & semiconductor equipment; electrical equipment. Security selection in the following industries: software; IT services; communications equipment. Position weightings: lack of a position in Palantir Technologies, Inc., Class A; ASML Holding NV; Meta Platforms, Inc., Class A
Voya Investment Management Co. LLC | Allocations in the following industries: interactive media & services; cash; communications equipment. Security selection in the following industries: software; entertainment. Position weightings: lack of position in Intel Corp.; KraneShares CSI China Internet ETF; Zscaler, Inc.
Fund Performance
The following graph compares a $10,000 initial investment in the Fund to the index(es) listed below for the last 10 fiscal years of the Fund.
GROWTH OF $10,000
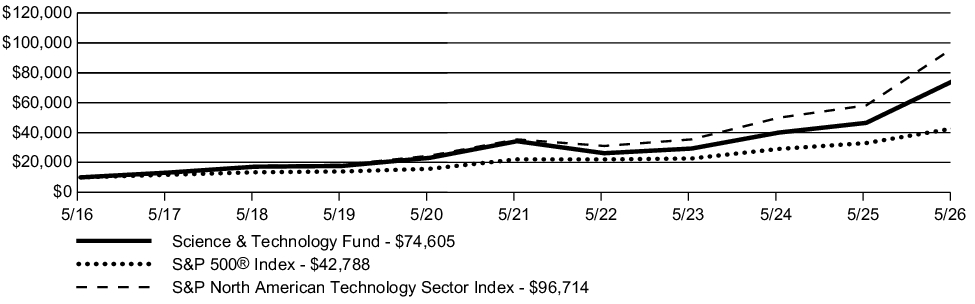
| AVERAGE ANNUAL TOTAL RETURN | 1 Year | 5 Year | 10 Year |
| Science & Technology Fund | 60.51% | 16.89% | 22.26% |
| S&P 500® Index | 29.78% | 14.15% | 15.65% |
| S&P North American Technology Sector Index | 66.24% | 22.27% | 25.47% |
Key Fund Statistics
The following table outlines key fund statistics.
| Net assets | $3,865M |
| Total number of portfolio holdings | 94 |
| Total net advisory fee paid | $25.4M |
| Portfolio turnover rate during the reporting period | 45% |
Graphical Representation of Holdings
The information below represents the composition of the Fund's net assets as of the end of the period.
Top Industries*
| Semiconductors | 43.2% |
| Computers | 15.4% |
| Software | 13.0% |
| Internet | 12.1% |
| Electronics | 6.9% |
| Telecommunications | 3.1% |
| Machinery-Construction & Mining | 2.0% |
| Auto Manufacturers | 1.0% |
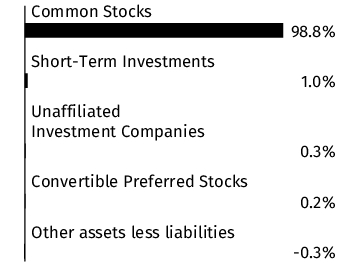
| Short-Term Investments | 1.0% |
| Aerospace/Defense | 0.8% |
| Chemicals | 0.5% |
| Electrical Components & Equipment | 0.4% |
| Unaffiliated Investment Companies | 0.3% |
| Diversified Financial Services | 0.2% |
| Automotive - Cars & Lt. Trucks | 0.1% |
Portfolio Composition
* Percentages exclude derivatives (other than purchased options), if any.
Material Fund Changes
This is a summary of certain changes to the Fund since the beginning of the period. Effective January 1, 2026, The Variable Annuity Life Insurance Company (“VALIC”), the investment adviser to the Fund, replaced SunAmerica Asset Management, LLC (“SunAmerica”) as the administrator of VALIC Company I (“VC I”) and SunAmerica became VC I’s sub-administrator. Additionally, on March 26, 2026, Corebridge Financial, Inc. and Equitable Holdings, Inc. (“EQH”) announced that they have entered into a definitive agreement to merge (the “Transaction”). The Transaction is expected to close by the end of 2026, subject to customary closing conditions, including the receipt of requisite regulatory approvals and approval of the shareholders of both Corebridge Financial, Inc. and EQH. Under the 1940 Act, an investment advisory agreement between a registered investment company, such as VC I, and its investment adviser must include a provision providing for its automatic termination upon its “assignment” (as defined in the 1940 Act). The closing of the Transaction may be deemed to cause an “assignment” of the Investment Advisory Agreement between VC I, on behalf of each Fund, and VALIC. As a result, the closing of the Transaction may cause the Investment Advisory Agreement to terminate automatically in accordance with its terms. It is anticipated that, prior to the closing of the Transaction, VC I’s Board of Directors (the “Board”) will consider a new investment advisory agreement between VC I, on behalf of each Fund, and VALIC. If approved by the Board, the new investment advisory agreement will be presented to the Funds’ shareholders for approval, and, if approved by shareholders, it will take effect upon the closing of the Transaction. For more comprehensive information, you may review the Fund’s next prospectus, which we expect to be available by September 30, 2026 at corebridgefinancial.com/rs/prospectus-and-reports/annuities#underlyingfunds. You can also request this information by calling Corebridge Financial, Inc. at 1-800-448-2542.
Changes in and Disagreements with Accountants
There were no changes in or disagreements with the accountants during the period.
This report describes changes to the Fund that occurred during the reporting period.
Fund Expenses
What were the Fund costs for the last year ?
(Based on a hypothetical $10,000 investment)
| Fund | Costs of a $10,000 investment | Costs paid as a percentage of a $10,000 investment |
| Systematic Growth Fund* | $72 | 0.64% |
| * |
The expenses shown in the table are meant to highlight your ongoing costs only and do not reflect any fees and expenses that may be charged by the variable annuity contracts and variable life insurance policies (“Variable Contracts”) that invest in the Fund. |
Management’s Discussion of Fund Performance
SUMMARY OF RESULTS
The Fund posted a return of 26.47% for the year ended May 31, 2026, compared to a return of 29.78% for the S&P 500® Index (a broad-based securities market index) and 28.66% for the Russell 1000® Growth Index (the "Performance Index").U.S. growth stocks, as measured by the Russell 1000 Growth Index, rose during the 1-year period. Against this backdrop, factor behavior was mixed, as investors reacted to ever evolving uncertainties. During the period, stocks with positive fundamental trends and attractive pricing outperformed, while higher quality stocks generally underperformed.
The following is a summary, by subadviser, of the top contributors and detractors that impacted their portion of the Fund's performance during the year relative to the Performance Index.
TOP PERFORMANCE CONTRIBUTORS
Goldman Sachs Asset Management, LLC | Allocations in the following sectors: communication services; real estate; utilities. Security selection in the following sectors: communication services; health care; materials. Position weightings: Alphabet, Inc., Class A; Netflix, Inc.; Comfort Systems USA, Inc.
Wellington Management Company, LLP | Allocations in the following sectors: consumer staples; consumer discretionary; real estate. Security selection in the following sectors: industrials; communication services; materials. Position weightings: Comfort Systems USA, Inc.; Dell Technologies, Inc., Class C; ServiceNow, Inc.
TOP PERFORMANCE DETRACTORS
Goldman Sachs Asset Management, LLC | In aggregate: sector allocations. Allocations in the following sectors: cash; information technology; financials. Security selection in the following sectors: information technology; consumer discretionary; industrials. Position weightings: Advanced Micro Devices, Inc.; Broadcom, Inc.; Microsoft Corp.
Wellington Management Company, LLP | Allocations in the following sectors: financials; cash; health care. Security selection in the following sectors: financials; information technology; health care. Position weightings: Advanced Micro Devices, Inc.; Fiserv, Inc.; Brown & Brown, Inc.
Fund Performance
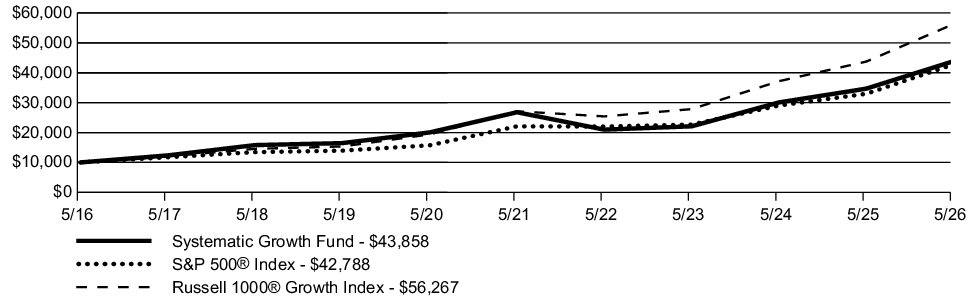
The following graph compares a $10,000 initial investment in the Fund to the index(es) listed below for the last 10 fiscal years of the Fund.
GROWTH OF $10,000
| AVERAGE ANNUAL TOTAL RETURN | 1 Year | 5 Year | 10 Year |
| Systematic Growth Fund | 26.47% | 10.36% | 15.93% |
| S&P 500® Index | 29.78% | 14.15% | 15.65% |
| Russell 1000® Growth Index | 28.66% | 15.73% | 18.86% |
Key Fund Statistics
The following table outlines key fund statistics.
| Net assets | $1,066M |
| Total number of portfolio holdings | 183 |
| Total net advisory fee paid | $5.6M |
| Portfolio turnover rate during the reporting period | 41% |
Graphical Representation of Holdings
The information below represents the composition of the Fund's net assets as of the end of the period.
Top Industries*
| Semiconductors | 22.9% |
| Internet | 20.3% |
| Software | 13.7% |
| Computers | 12.7% |
| Diversified Financial Services | 4.6% |
| Pharmaceuticals | 4.2% |
| Retail | 3.2% |
| Auto Manufacturers | 2.4% |
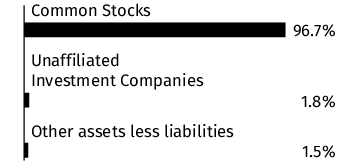
| Unaffiliated Investment Companies | 1.8% |
| Biotechnology | 1.6% |
| Commercial Services | 1.4% |
| Apparel | 1.2% |
| Engineering & Construction | 1.0% |
| Distribution/Wholesale | 0.9% |
| Beverages | 0.9% |
Portfolio Composition
* Percentages exclude derivatives (other than purchased options), if any.
Material Fund Changes
This is a summary of certain changes to the Fund since the beginning of the period. Effective January 1, 2026, The Variable Annuity Life Insurance Company (“VALIC”), the investment adviser to the Fund, replaced SunAmerica Asset Management, LLC (“SunAmerica”) as the administrator of VALIC Company I (“VC I”) and SunAmerica became VC I’s sub-administrator. Additionally, on March 26, 2026, Corebridge Financial, Inc. and Equitable Holdings, Inc. (“EQH”) announced that they have entered into a definitive agreement to merge (the “Transaction”). The Transaction is expected to close by the end of 2026, subject to customary closing conditions, including the receipt of requisite regulatory approvals and approval of the shareholders of both Corebridge Financial, Inc. and EQH. Under the 1940 Act, an investment advisory agreement between a registered investment company, such as VC I, and its investment adviser must include a provision providing for its automatic termination upon its “assignment” (as defined in the 1940 Act). The closing of the Transaction may be deemed to cause an “assignment” of the Investment Advisory Agreement between VC I, on behalf of each Fund, and VALIC. As a result, the closing of the Transaction may cause the Investment Advisory Agreement to terminate automatically in accordance with its terms. It is anticipated that, prior to the closing of the Transaction, VC I’s Board of Directors (the “Board”) will consider a new investment advisory agreement between VC I, on behalf of each Fund, and VALIC. If approved by the Board, the new investment advisory agreement will be presented to the Funds’ shareholders for approval, and, if approved by shareholders, it will take effect upon the closing of the Transaction. For more comprehensive information, you may review the Fund’s next prospectus, which we expect to be available by September 30, 2026 at corebridgefinancial.com/rs/prospectus-and-reports/annuities#underlyingfunds. You can also request this information by calling Corebridge Financial, Inc. at 1-800-448-2542.
Changes in and Disagreements with Accountants
There were no changes in or disagreements with the accountants during the period.
This report describes changes to the Fund that occurred during the reporting period.
Fund Expenses
What were the Fund costs for the last year ?
(Based on a hypothetical $10,000 investment)
| Fund | Costs of a $10,000 investment | Costs paid as a percentage of a $10,000 investment |
| Small Cap Index Fund* | $44 | 0.36% |
| * |
The expenses shown in the table are meant to highlight your ongoing costs only and do not reflect any fees and expenses that may be charged by the variable annuity contracts and variable life insurance policies (“Variable Contracts”) that invest in the Fund.
|
Management’s Discussion of Fund Performance
SUMMARY OF RESULTS
The Fund is managed to seek to track the performance of the Index. The Subadviser may endeavor to track the Index by purchasing every stock included in the Index, in the same proportions; or, in the alternative, the Subadviser may invest in a sampling of Index stocks by utilizing a statistical technique known as "optimization".
The Fund posted a return of 42.62% for the year ended May 31, 2026, compared to a return of 29.45% for the Russell 3000® Index (a broad-based securities market index) and 43.08% for the Russell 2000® Index (the "Performance Index"). Over the period, U.S. equities advanced, with technology-heavy and growth-oriented benchmarks leading the market. Smaller-cap equities also rose, while mid-cap growth lagged value-oriented benchmarks.
The following is a summary of the top contributors and detractors that impacted the Fund's performance during the year.
TOP PERFORMANCE CONTRIBUTORS
Allocations in the following sectors | information technology; industrials; health care
Position weightings | Bloom Energy Corp., Class A; Credo Technology Group Holding, Ltd.; Sterling Infrastructure, Inc.
TOP PERFORMANCE DETRACTORS
Allocations in the following sectors | consumer staples
Position weightings | Hims & Hers Health, Inc.; Badger Meter, Inc.; SPS Commerce, Inc.
Fund Performance
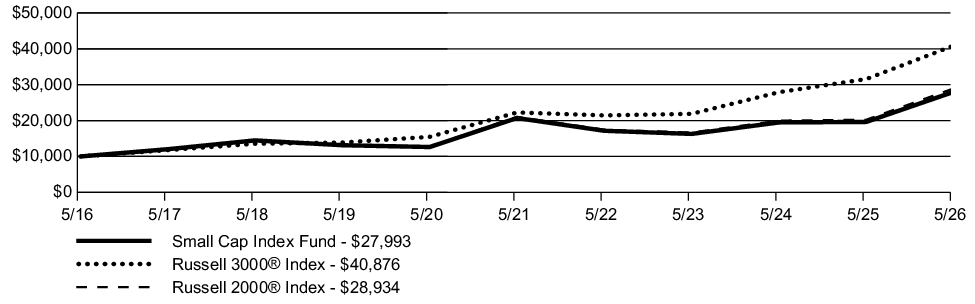
The following graph compares a $10,000 initial investment in the Fund to the index(es) listed below for the last 10 fiscal years of the Fund.
GROWTH OF $10,000
| AVERAGE ANNUAL TOTAL RETURN | 1 Year | 5 Year | 10 Year |
| Small Cap Index Fund | 42.62% | 6.21% | 10.84% |
| Russell 3000® Index | 29.45% | 12.92% | 15.12% |
| Russell 2000® Index | 43.08% | 6.61% | 11.21% |
Key Fund Statistics
The following table outlines key fund statistics.
| Net assets | $1,368M |
| Total number of portfolio holdings | 1,933 |
| Total net advisory fee paid | $2.7M |
| Portfolio turnover rate during the reporting period | 26% |
Graphical Representation of Holdings
The information below represents the composition of the Fund's net assets as of the end of the period.
Top Industries*
| Banks | 8.2% |
| Biotechnology | 7.8% |
| REITS | 5.2% |
| Software | 4.7% |
| Semiconductors | 4.1% |
| Electronics | 3.6% |
| Telecommunications | 3.5% |
| Commercial Services | 3.3% |
| Engineering & Construction | 3.3% |
| Healthcare-Products | 3.0% |
| Short-Term Investments | 3.0% |
| Retail | 2.7% |
| Diversified Financial Services | 2.6% |
| Oil & Gas | 2.5% |
| Pharmaceuticals | 2.5% |
Portfolio Composition
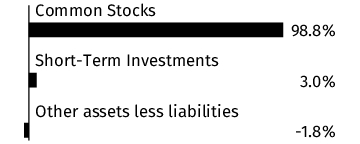
* Percentages exclude derivatives (other than purchased options), if any.
Material Fund Changes
This is a summary of certain changes to the Fund since the beginning of the period. Effective January 1, 2026, The Variable Annuity Life Insurance Company (“VALIC”), the investment adviser to the Fund, replaced SunAmerica Asset Management, LLC (“SunAmerica”) as the administrator of VALIC Company I (“VC I”) and SunAmerica became VC I’s sub-administrator. Additionally, on March 26, 2026, Corebridge Financial, Inc. and Equitable Holdings, Inc. (“EQH”) announced that they have entered into a definitive agreement to merge (the “Transaction”). The Transaction is expected to close by the end of 2026, subject to customary closing conditions, including the receipt of requisite regulatory approvals and approval of the shareholders of both Corebridge Financial, Inc. and EQH. Under the 1940 Act, an investment advisory agreement between a registered investment company, such as VC I, and its investment adviser must include a provision providing for its automatic termination upon its “assignment” (as defined in the 1940 Act). The closing of the Transaction may be deemed to cause an “assignment” of the Investment Advisory Agreement between VC I, on behalf of each Fund, and VALIC. As a result, the closing of the Transaction may cause the Investment Advisory Agreement to terminate automatically in accordance with its terms. It is anticipated that, prior to the closing of the Transaction, VC I’s Board of Directors (the “Board”) will consider a new investment advisory agreement between VC I, on behalf of each Fund, and VALIC. If approved by the Board, the new investment advisory agreement will be presented to the Funds’ shareholders for approval, and, if approved by shareholders, it will take effect upon the closing of the Transaction. For more comprehensive information, you may review the Fund’s next prospectus, which we expect to be available by September 30, 2026 at corebridgefinancial.com/rs/prospectus-and-reports/annuities#underlyingfunds. You can also request this information by calling Corebridge Financial, Inc. at 1-800-448-2542.
Changes in and Disagreements with Accountants
There were no changes in or disagreements with the accountants during the period.
This report describes changes to the Fund that occurred during the reporting period.
Fund Expenses
What were the Fund costs for the last year ?
(Based on a hypothetical $10,000 investment)
| Fund | Costs of a $10,000 investment | Costs paid as a percentage of a $10,000 investment |
| International Socially Responsible Fund* | $63 | 0.57% |
| * |
The expenses shown in the table are meant to highlight your ongoing costs only and do not reflect any fees and expenses that may be charged by the variable annuity contracts and variable life insurance policies (“Variable Contracts”) that invest in the Fund. |
Management’s Discussion of Fund Performance
SUMMARY OF RESULTS
The Fund is an optimized portfolio which seeks to track the MSCI EAFE Index (net), while investing in socially responsive companies. The Fund's criteria do not permit investment in companies whose businesses rely significantly on alcohol, firearms, gambling, tobacco, nuclear power, production of weaponry, have poor labor/employee relations or environmental records. These criteria may create differences in Fund performance relative to that of the Benchmark.
The Fund posted a return of 21.53% for the year ended May 31, 2026, compared to a return of 22.80% for the MSCI EAFE Index (net) (a broad-based securities market & "Performance Index"). Over the period, developed international equities advanced but trailed the strongest U.S. growth-oriented and technology-heavy benchmarks. International equities outpaced weaker U.S. mid-cap growth benchmarks.
The following is a summary of the top contributors and detractors that impacted the Fund's performance during the year relative to the Performance Index.
TOP PERFORMANCE CONTRIBUTORS
In aggregate | sector allocations
Allocations in the following sectors | consumer staples; information technology; financials
Security selection in the following sectors | industrials; information technology; energy
Position weightings | lack of position in Novo Nordisk A/S, Class B; lack of position in Nestle SA; lack of position in Antofagasta PLC
Exposure to the following countries | Netherlands; Denmark; France
TOP PERFORMANCE DETRACTORS
In aggregate | position weightings
Allocations in the following sectors | real estate; energy; industrials
Security selection in the following sectors | financials; materials; consumer discretionary
Position weightings | lack of position in HSBC Holdings PLC; lack of position in BHP Group, Ltd.; lack of position in Siemens Energy AG
Exposure to the following countries | Spain; Singapore; Switzerland
Fund Performance
The following graph compares a $10,000 initial investment in the Fund to the index(es) listed below for the last 10 fiscal years of the Fund.
GROWTH OF $10,000
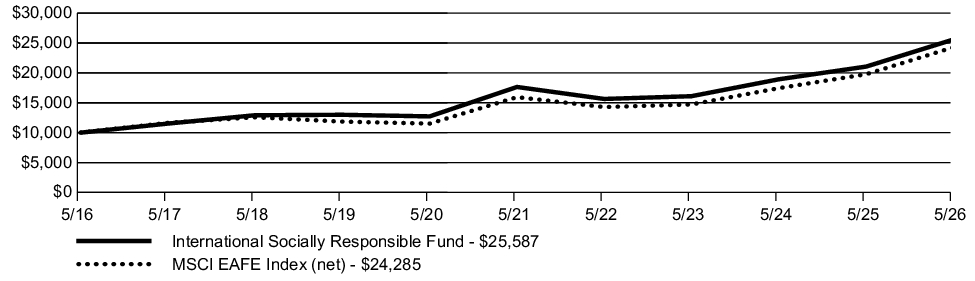
| AVERAGE ANNUAL TOTAL RETURN | 1 Year | 5 Year | 10 Year |
| International Socially Responsible Fund | 21.53% | 7.72% | 9.85% |
| MSCI EAFE Index (net) | 22.80% | 8.79% | 9.28% |
Key Fund Statistics
The following table outlines key fund statistics.
| Net assets | $511M |
| Total number of portfolio holdings | 464 |
| Total net advisory fee paid | $2.3M |
| Portfolio turnover rate during the reporting period | 9% |
Graphical Representation of Holdings
The information below represents the composition of the Fund's net assets as of the end of the period.
Top Industries*
| Banks | 14.0% |
| Insurance | 8.7% |
| Semiconductors | 7.2% |
| Pharmaceuticals | 6.4% |
| Chemicals | 3.3% |
| Electrical Components & Equipment | 3.0% |
| Telecommunications | 3.0% |
| Electric | 2.9% |
| Commercial Services | 2.7% |
| Oil & Gas | 2.6% |
| Engineering & Construction | 2.5% |
| Mining | 2.5% |
| Machinery-Diversified | 2.3% |
| Retail | 2.1% |
| Food | 2.0% |
Portfolio Composition
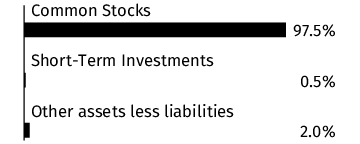
Country
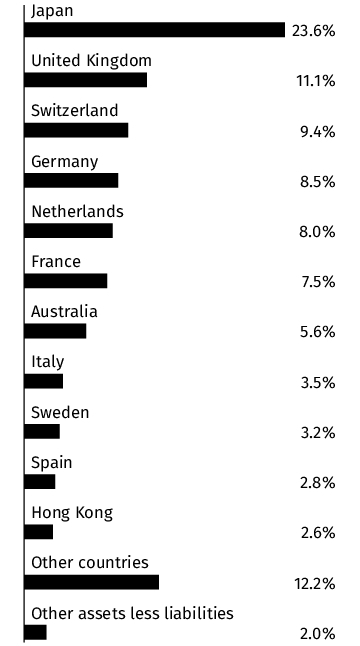
* Percentages exclude derivatives (other than purchased options), if any.
Material Fund Changes
This is a summary of certain changes to the Fund since the beginning of the period. Effective January 1, 2026, The Variable Annuity Life Insurance Company (“VALIC”), the investment adviser to the Fund, replaced SunAmerica Asset Management, LLC (“SunAmerica”) as the administrator of VALIC Company I (“VC I”) and SunAmerica became VC I’s sub-administrator. Additionally, on March 26, 2026, Corebridge Financial, Inc. and Equitable Holdings, Inc. (“EQH”) announced that they have entered into a definitive agreement to merge (the “Transaction”). The Transaction is expected to close by the end of 2026, subject to customary closing conditions, including the receipt of requisite regulatory approvals and approval of the shareholders of both Corebridge Financial, Inc. and EQH. Under the 1940 Act, an investment advisory agreement between a registered investment company, such as VC I, and its investment adviser must include a provision providing for its automatic termination upon its “assignment” (as defined in the 1940 Act). The closing of the Transaction may be deemed to cause an “assignment” of the Investment Advisory Agreement between VC I, on behalf of each Fund, and VALIC. As a result, the closing of the Transaction may cause the Investment Advisory Agreement to terminate automatically in accordance with its terms. It is anticipated that, prior to the closing of the Transaction, VC I’s Board of Directors (the “Board”) will consider a new investment advisory agreement between VC I, on behalf of each Fund, and VALIC. If approved by the Board, the new investment advisory agreement will be presented to the Funds’ shareholders for approval, and, if approved by shareholders, it will take effect upon the closing of the Transaction. For more comprehensive information, you may review the Fund’s next prospectus, which we expect to be available by September 30, 2026 at corebridgefinancial.com/rs/prospectus-and-reports/annuities#underlyingfunds. You can also request this information by calling Corebridge Financial, Inc. at 1-800-448-2542.
Changes in and Disagreements with Accountants
There were no changes in or disagreements with the accountants during the period.
This report describes changes to the Fund that occurred during the reporting period.
Fund Expenses
What were the Fund costs for the last year ?
(Based on a hypothetical $10,000 investment)
| Fund | Costs of a $10,000 investment | Costs paid as a percentage of a $10,000 investment |
| Stock Index Fund* | $25 | 0.22% |
| * |
The expenses shown in the table are meant to highlight your ongoing costs only and do not reflect any fees and expenses that may be charged by the variable annuity contracts and variable life insurance policies (“Variable Contracts”) that invest in the Fund. |
Management’s Discussion of Fund Performance
SUMMARY OF RESULTS
The Fund is managed to seek to track the performance of the Index. The Subadviser may endeavor to track the Index by purchasing every stock included in the Index, in the same proportions; or, in the alternative, the Subadviser may invest in a sampling of Index stocks by utilizing a statistical technique known as "optimization".
The Fund posted a return of 29.47% for the year ended May 31, 2026, compared to a return of 29.78% for the S&P 500® Index (a broad-based securities market & "Performance Index"). Over the period, U.S. equities advanced, with technology-heavy and growth-oriented benchmarks leading the market. Smaller-cap equities also rose, while mid-cap growth lagged value-oriented benchmarks.
The following is a summary of the top contributors and detractors that impacted the Fund's performance during the year.
TOP PERFORMANCE CONTRIBUTORS
Allocations in the following sectors | information technology; communication services; industrials
Position weightings | NVIDIA Corp.; Apple, Inc.; Alphabet, Inc., Class A
TOP PERFORMANCE DETRACTORS
Allocations in the following sectors | none
Position weightings | Netflix, Inc.; Intuit, Inc.; Boston Scientific Corp.
Fund Performance
The following graph compares a $10,000 initial investment in the Fund to the index(es) listed below for the last 10 fiscal years of the Fund.
GROWTH OF $10,000
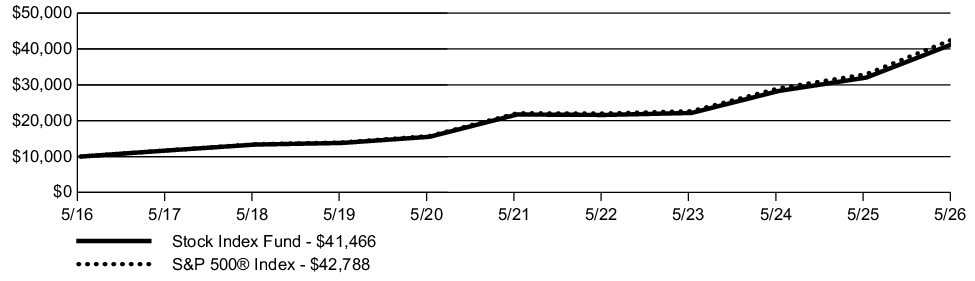
| AVERAGE ANNUAL TOTAL RETURN | 1 Year | 5 Year | 10 Year |
| Stock Index Fund | 29.47% | 13.80% | 15.28% |
| S&P 500® Index | 29.78% | 14.15% | 15.65% |
Key Fund Statistics
The following table outlines key fund statistics.
| Net assets | $7,158M |
| Total number of portfolio holdings | 508 |
| Total net advisory fee paid | $8.8M |
| Portfolio turnover rate during the reporting period | 4% |
Graphical Representation of Holdings
The information below represents the composition of the Fund's net assets as of the end of the period.
Top Industries*
| Semiconductors | 18.1% |
| Internet | 14.4% |
| Computers | 9.6% |
| Software | 8.2% |
| Pharmaceuticals | 4.3% |
| Banks | 4.2% |
| Retail | 3.8% |
| Diversified Financial Services | 3.2% |
| Insurance | 2.8% |
| Oil & Gas | 2.4% |
| Auto Manufacturers | 2.3% |
| Telecommunications | 2.1% |
| Electric | 2.0% |
| Aerospace/Defense | 1.9% |
| Healthcare-Products | 1.9% |
Portfolio Composition
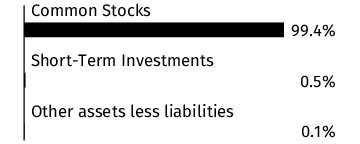
* Percentages exclude derivatives (other than purchased options), if any.
Material Fund Changes
This is a summary of certain changes to the Fund since the beginning of the period. Effective January 1, 2026, The Variable Annuity Life Insurance Company (“VALIC”), the investment adviser to the Fund, replaced SunAmerica Asset Management, LLC (“SunAmerica”) as the administrator of VALIC Company I (“VC I”) and SunAmerica became VC I’s sub-administrator. Additionally, on March 26, 2026, Corebridge Financial, Inc. and Equitable Holdings, Inc. (“EQH”) announced that they have entered into a definitive agreement to merge (the “Transaction”). The Transaction is expected to close by the end of 2026, subject to customary closing conditions, including the receipt of requisite regulatory approvals and approval of the shareholders of both Corebridge Financial, Inc. and EQH. Under the 1940 Act, an investment advisory agreement between a registered investment company, such as VC I, and its investment adviser must include a provision providing for its automatic termination upon its “assignment” (as defined in the 1940 Act). The closing of the Transaction may be deemed to cause an “assignment” of the Investment Advisory Agreement between VC I, on behalf of each Fund, and VALIC. As a result, the closing of the Transaction may cause the Investment Advisory Agreement to terminate automatically in accordance with its terms. It is anticipated that, prior to the closing of the Transaction, VC I’s Board of Directors (the “Board”) will consider a new investment advisory agreement between VC I, on behalf of each Fund, and VALIC. If approved by the Board, the new investment advisory agreement will be presented to the Funds’ shareholders for approval, and, if approved by shareholders, it will take effect upon the closing of the Transaction. For more comprehensive information, you may review the Fund’s next prospectus, which we expect to be available by September 30, 2026 at corebridgefinancial.com/rs/prospectus-and-reports/annuities#underlyingfunds. You can also request this information by calling Corebridge Financial, Inc. at 1-800-448-2542.
Changes in and Disagreements with Accountants
There were no changes in or disagreements with the accountants during the period.
This report describes changes to the Fund that occurred during the reporting period.
Fund Expenses
What were the Fund costs for the last year ?
(Based on a hypothetical $10,000 investment)
| Fund | Costs of a $10,000 investment | Costs paid as a percentage of a $10,000 investment |
| Government Securities Fund* | $58 | 0.57% |
| * |
The expenses shown in the table are meant to highlight your ongoing costs only and do not reflect any fees and expenses that may be charged by the variable annuity contracts and variable life insurance policies (“Variable Contracts”) that invest in the Fund.
|
Management’s Discussion of Fund Performance
SUMMARY OF RESULTS
The Fund posted a return of 4.23% for the year ended May 31, 2026, compared to a return of 5.13% for the Bloomberg U.S. Aggregate Bond Index (a broad-based securities market index) and 3.71% for the Bloomberg U.S. Government Bond Index (the "Performance Index"). During the period, the U.S. Treasury curve flattened as intermediate yields rose more than the long end. The two-year yield increased 11 bps to 4.00%, the five-year yield rose 18 bps to 4.14%, the ten-year yield edged up 3 bps to 4.44%, and the thirty-year yield increased 4 bps to 4.97%. In contrast, the front end rallied - the three-month yield fell 66 bps to 3.67% and the one-year yield declined 33 bps to 3.77%. Mortgage-backed securities outperformed U.S. Treasury and agency securities.
The following is a summary of the top contributors and detractors that impacted the Fund's performance during the year relative to the Performance Index.
TOP PERFORMANCE CONTRIBUTORS
In aggregate | sector allocations
Allocations in the following sectors | agency mortgage-backed securities; commercial mortgage-backed securities; corporate credit
Security selection in the following sectors | U.S. Treasuries; U.S agency debt securities
TOP PERFORMANCE DETRACTORS
Allocations in the following sectors | U.S. agency debt securities
Fund Performance
The following graph compares a $10,000 initial investment in the Fund to the index(es) listed below for the last 10 fiscal years of the Fund.
GROWTH OF $10,000
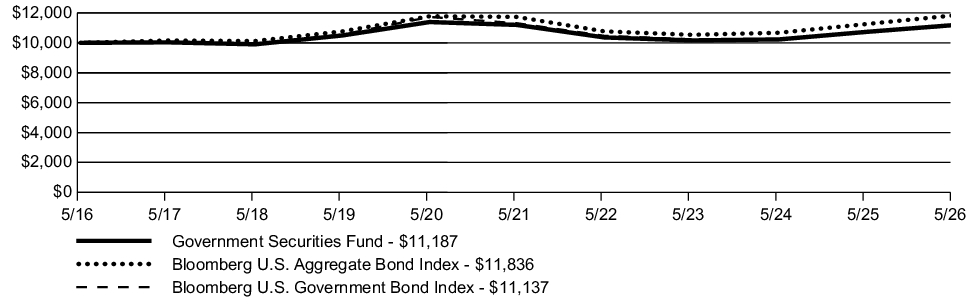
| AVERAGE ANNUAL TOTAL RETURN | 1 Year | 5 Year | 10 Year |
| Government Securities Fund | 4.23% | (0.02)% | 1.13% |
| Bloomberg U.S. Aggregate Bond Index | 5.13% | 0.17% | 1.70% |
| Bloomberg U.S. Government Bond Index | 3.71% | (0.31)% | 1.08% |
Key Fund Statistics
The following table outlines key fund statistics.
| Net assets | $199M |
| Total number of portfolio holdings | 265 |
| Total net advisory fee paid | $0.7M |
| Portfolio turnover rate during the reporting period | 59% |
Graphical Representation of Holdings
The information below represents the composition of the Fund as of the end of the period.
Portfolio Composition
(% of net assets)
(% of net assets)
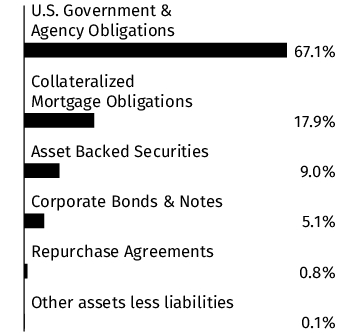
Credit Quality **
(% of total debt issues)
(% of total debt issues)
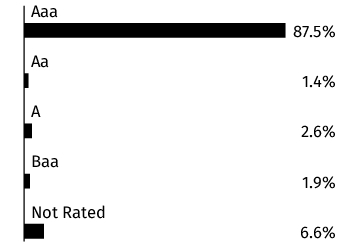
** Credit quality ratings shown above reflect the rating assigned by Moody's Investors Service, Inc. Where Moody's ratings are not available, we have used Standard & Poor's ratings. Unrated investments do not necessarily indicate low credit quality. Credit quality ratings are subject to change. Percentages exclude short-term securities.
Material Fund Changes
This is a summary of certain changes to the Fund since the beginning of the period. Effective January 1, 2026, The Variable Annuity Life Insurance Company (“VALIC”), the investment adviser to the Fund, replaced SunAmerica Asset Management, LLC (“SunAmerica”) as the administrator of VALIC Company I (“VC I”) and SunAmerica became VC I’s sub-administrator. Additionally, on March 26, 2026, Corebridge Financial, Inc. and Equitable Holdings, Inc. (“EQH”) announced that they have entered into a definitive agreement to merge (the “Transaction”). The Transaction is expected to close by the end of 2026, subject to customary closing conditions, including the receipt of requisite regulatory approvals and approval of the shareholders of both Corebridge Financial, Inc. and EQH. Under the 1940 Act, an investment advisory agreement between a registered investment company, such as VC I, and its investment adviser must include a provision providing for its automatic termination upon its “assignment” (as defined in the 1940 Act). The closing of the Transaction may be deemed to cause an “assignment” of the Investment Advisory Agreement between VC I, on behalf of each Fund, and VALIC. As a result, the closing of the Transaction may cause the Investment Advisory Agreement to terminate automatically in accordance with its terms. It is anticipated that, prior to the closing of the Transaction, VC I’s Board of Directors (the “Board”) will consider a new investment advisory agreement between VC I, on behalf of each Fund, and VALIC. If approved by the Board, the new investment advisory agreement will be presented to the Funds’ shareholders for approval, and, if approved by shareholders, it will take effect upon the closing of the Transaction.
Effective September 29, 2025, the Fund’s contractual advisory fee waiver was amended to lower the advisory fee rate payable by the Fund to VALIC to 0.385% of the Fund’s average daily net assets on the first $250 million, 0.335% of the Fund’s average daily net assets on the next $250 million, 0.285% of the Fund’s average daily net assets on the next $500 million, and 0.235% of the Fund’s average daily net assets over $1 billion. Effective January 29, 2026, the Fund made certain changes to its investment strategies with respect to derivatives. As a result, Derivatives Risk was added as a principal risk. For more comprehensive information, you may review the Fund’s next prospectus, which we expect to be available by September 30, 2026 at corebridgefinancial.com/rs/prospectus-and-reports/annuities#underlyingfunds. You can also request this information by calling Corebridge Financial, Inc. at 1-800-448-2542.
Changes in and Disagreements with Accountants
There were no changes in or disagreements with the accountants during the period.
This report describes changes to the Fund that occurred during the reporting period.
Fund Expenses
What were the Fund costs for the last year ?
(Based on a hypothetical $10,000 investment)
| Fund | Costs of a $10,000 investment | Costs paid as a percentage of a $10,000 investment |
| Systematic Core Fund* | $70 | 0.63% |
| * |
The expenses shown in the table are meant to highlight your ongoing costs only and do not reflect any fees and expenses that may be charged by the variable annuity contracts and variable life insurance policies (“Variable Contracts”) that invest in the Fund. |
Management’s Discussion of Fund Performance
SUMMARY OF RESULTS
The Fund posted a return of 22.73% for the year ended May 31, 2026, compared to a return of 28.85% for the Russell 1000® Index (a broad-based securities market & "Performance Index"). Over the period, U.S. large-cap equities underperformed small-cap equities significantly, according to the Russell® family of indices. In terms of style factors, value remained flat with respect to growth.
The following is a summary of the top contributors and detractors that impacted the Fund's performance during the year relative to the Performance Index.
TOP PERFORMANCE CONTRIBUTORS
Allocations in the following sectors | real estate; utilities; communication services
Security selection in the following sectors | health care; financials; communication services
Position weightings | Ciena Corp.; Millicom International Cellular SA; Jazz Pharmaceuticals PLC
TOP PERFORMANCE DETRACTORS
In aggregate | position weightings; sector allocations
Allocations in the following sectors | financials; information technology; consumer staples
Security selection in the following sectors | information technology; industrials; consumer staples
Position weightings | Micron Technology, Inc; Advanced Micro Devices, Inc; Intel Corp.
Fund Performance
The following graph compares a $10,000 initial investment in the Fund to the index(es) listed below for the last 10 fiscal years of the Fund.
GROWTH OF $10,000
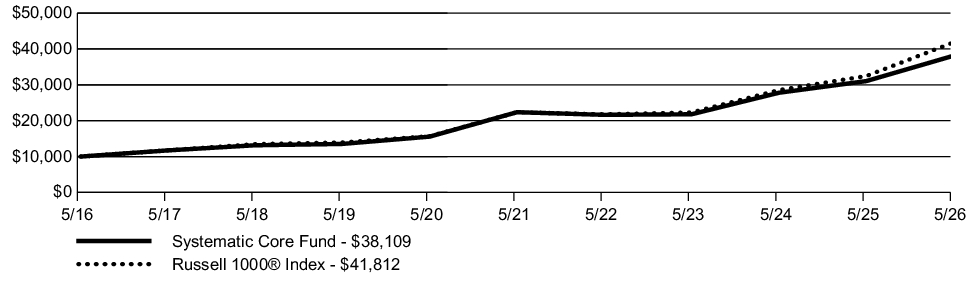
| AVERAGE ANNUAL TOTAL RETURN | 1 Year | 5 Year | 10 Year |
| Systematic Core Fund | 22.73% | 11.24% | 14.31% |
| Russell 1000® Index | 28.85% | 13.33% | 15.38% |
Key Fund Statistics
The following table outlines key fund statistics.
| Net assets | $680M |
| Total number of portfolio holdings | 347 |
| Total net advisory fee paid | $3.7M |
| Portfolio turnover rate during the reporting period | 58% |
Graphical Representation of Holdings
The information below represents the composition of the Fund's net assets as of the end of the period.
Top Industries*
| Internet | 15.1% |
| Semiconductors | 14.2% |
| Computers | 8.5% |
| Software | 7.2% |
| Retail | 6.7% |
| Insurance | 5.1% |
| Banks | 5.0% |
| Diversified Financial Services | 4.6% |
| Pharmaceuticals | 4.4% |
| Unaffiliated Investment Companies | 2.8% |
| Biotechnology | 2.6% |
| Telecommunications | 2.3% |
| Oil & Gas | 1.6% |
| Food | 1.5% |
| Apparel | 1.5% |
Portfolio Composition
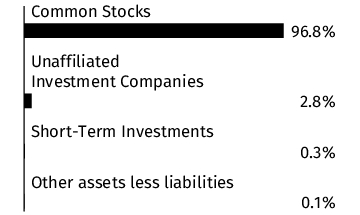
* Percentages exclude derivatives (other than purchased options), if any.
Material Fund Changes
This is a summary of certain changes to the Fund since the beginning of the period. Effective January 1, 2026, The Variable Annuity Life Insurance Company (“VALIC”), the investment adviser to the Fund, replaced SunAmerica Asset Management, LLC (“SunAmerica”) as the administrator of VALIC Company I (“VC I”) and SunAmerica became VC I’s sub-administrator. Additionally, on March 26, 2026, Corebridge Financial, Inc. and Equitable Holdings, Inc. (“EQH”) announced that they have entered into a definitive agreement to merge (the “Transaction”). The Transaction is expected to close by the end of 2026, subject to customary closing conditions, including the receipt of requisite regulatory approvals and approval of the shareholders of both Corebridge Financial, Inc. and EQH. Under the 1940 Act, an investment advisory agreement between a registered investment company, such as VC I, and its investment adviser must include a provision providing for its automatic termination upon its “assignment” (as defined in the 1940 Act). The closing of the Transaction may be deemed to cause an “assignment” of the Investment Advisory Agreement between VC I, on behalf of each Fund, and VALIC. As a result, the closing of the Transaction may cause the Investment Advisory Agreement to terminate automatically in accordance with its terms. It is anticipated that, prior to the closing of the Transaction, VC I’s Board of Directors (the “Board”) will consider a new investment advisory agreement between VC I, on behalf of each Fund, and VALIC. If approved by the Board, the new investment advisory agreement will be presented to the Funds’ shareholders for approval, and, if approved by shareholders, it will take effect upon the closing of the Transaction. For more comprehensive information, you may review the Fund’s next prospectus, which we expect to be available by September 30, 2026 at corebridgefinancial.com/rs/prospectus-and-reports/annuities#underlyingfunds. You can also request this information by calling Corebridge Financial, Inc. at 1-800-448-2542.
Changes in and Disagreements with Accountants
There were no changes in or disagreements with the accountants during the period.
This report describes changes to the Fund that occurred during the reporting period.
Fund Expenses
What were the Fund costs for the last year ?
(Based on a hypothetical $10,000 investment)
| Fund | Costs of a $10,000 investment | Costs paid as a percentage of a $10,000 investment |
| Dividend Value Fund* | $75 | 0.68% |
| * |
The expenses shown in the table are meant to highlight your ongoing costs only and do not reflect any fees and expenses that may be charged by the variable annuity contracts and variable life insurance policies (“Variable Contracts”) that invest in the Fund. |
Management’s Discussion of Fund Performance
SUMMARY OF RESULTS
The Fund posted a return of 21.89% for the year ended May 31, 2026, 29.78% for the S&P 500® Index (a broad-based securities market index) and 28.55% for the Russell 1000® Value Index (the "Performance Index"). A resilient U.S. economy, moderate inflation, continued enthusiasm for AI-related stocks and a Fed cutting interest rates helped markets make gains despite concerns over tariffs and war in the Middle East, which raised the specter of energy-driven inflation.
The following is a summary, by subadviser, of the top contributors and detractors that impacted their portion of the Fund's performance during the year relative to the Performance Index.
TOP PERFORMANCE CONTRIBUTORS
BlackRock Investment Management, LLC | In aggregate: sector allocations. Allocations in the following sectors: information technology; financials; consumer staples. Security selection in the following sectors: consumer discretionary; consumer staples; utilities. Position weightings: Samsung Electronics Co., Ltd.; Western Digital Corp.; lack of position in Berkshire Hathaway, Inc., Class B
ClearBridge Investments, LLC | In aggregate: sector allocations. Allocations in the following sectors: information technology; financials; consumer discretionary. Security selection in the following sectors: health care; utilities. Position weightings: Broadcom, Inc.; Texas Instruments Inc.; lack of position in Berkshire Hathaway Inc., Class B
TOP PERFORMANCE DETRACTORS
BlackRock Investment Management, LLC | In aggregate: position weightings. Allocations in the following sectors: cash; health care; energy. Security selection in the following sectors: communication services; information technology; health care. Position weightings: lack of position in Micron Technology, Inc.; Baxter International, Inc.; Fidelity National Information Services, Inc.
ClearBridge Investments, LLC | In aggregate: position weightings. Allocations in the following sectors: cash; consumer staples; industrials. Security selection in the following sectors: information technology; communication services; energy. Position weightings: lack of position in Micron Technology, Inc.; lack of position in Intel Corp.; Microsoft Corp.
Fund Performance
The following graph compares a $10,000 initial investment in the Fund to the index(es) listed below for the last 10 fiscal years of the Fund.
GROWTH OF $10,000
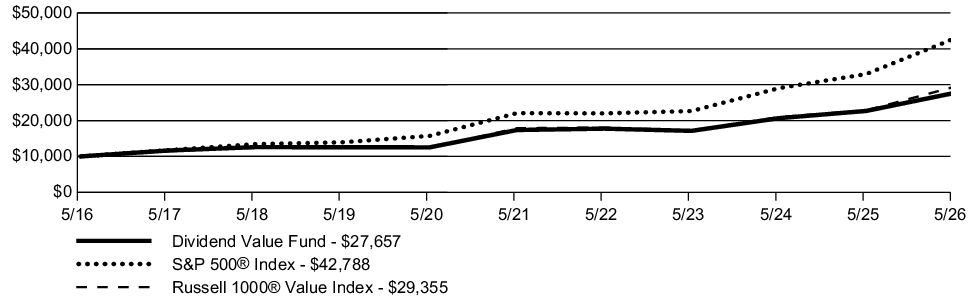
| AVERAGE ANNUAL TOTAL RETURN | 1 Year | 5 Year | 10 Year |
| Dividend Value Fund | 21.89% | 9.75% | 10.71% |
| S&P 500® Index | 29.78% | 14.15% | 15.65% |
| Russell 1000® Value Index | 28.55% | 10.42% | 11.37% |
Key Fund Statistics
The following table outlines key fund statistics.
| Net assets | $915M |
| Total number of portfolio holdings | 120 |
| Total net advisory fee paid | $3.8M |
| Portfolio turnover rate during the reporting period | 95% |
Graphical Representation of Holdings
The information below represents the composition of the Fund's net assets as of the end of the period.
Top Industries*
| Semiconductors | 8.8% |
| Internet | 8.6% |
| Pharmaceuticals | 7.7% |
| Banks | 7.1% |
| Diversified Financial Services | 4.3% |
| Oil & Gas | 4.1% |
| Electric | 3.8% |
| Insurance | 3.7% |
| Transportation | 3.5% |
| REITS | 3.5% |
| Computers | 3.4% |
| Software | 3.4% |
| Retail | 3.4% |
| Chemicals | 3.2% |
| Aerospace/Defense | 2.9% |
Portfolio Composition
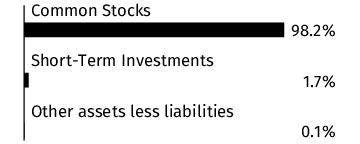
* Percentages exclude derivatives (other than purchased options), if any.
Material Fund Changes
This is a summary of certain changes to the Fund since the beginning of the period. Effective January 1, 2026, The Variable Annuity Life Insurance Company (“VALIC”), the investment adviser to the Fund, replaced SunAmerica Asset Management, LLC (“SunAmerica”) as the administrator of VALIC Company I (“VC I”) and SunAmerica became VC I’s sub-administrator. Additionally, on March 26, 2026, Corebridge Financial, Inc. and Equitable Holdings, Inc. (“EQH”) announced that they have entered into a definitive agreement to merge (the “Transaction”). The Transaction is expected to close by the end of 2026, subject to customary closing conditions, including the receipt of requisite regulatory approvals and approval of the shareholders of both Corebridge Financial, Inc. and EQH. Under the 1940 Act, an investment advisory agreement between a registered investment company, such as VC I, and its investment adviser must include a provision providing for its automatic termination upon its “assignment” (as defined in the 1940 Act). The closing of the Transaction may be deemed to cause an “assignment” of the Investment Advisory Agreement between VC I, on behalf of each Fund, and VALIC. As a result, the closing of the Transaction may cause the Investment Advisory Agreement to terminate automatically in accordance with its terms. It is anticipated that, prior to the closing of the Transaction, VC I’s Board of Directors (the “Board”) will consider a new investment advisory agreement between VC I, on behalf of each Fund, and VALIC. If approved by the Board, the new investment advisory agreement will be presented to the Funds’ shareholders for approval, and, if approved by shareholders, it will take effect upon the closing of the Transaction. For more comprehensive information, you may review the Fund’s next prospectus, which we expect to be available by September 30, 2026 at corebridgefinancial.com/rs/prospectus-and-reports/annuities#underlyingfunds. You can also request this information by calling Corebridge Financial, Inc. at 1-800-448-2542.
Changes in and Disagreements with Accountants
There were no changes in or disagreements with the accountants during the period.
This report describes changes to the Fund that occurred during the reporting period.
Fund Expenses
What were the Fund costs for the last year ?
(Based on a hypothetical $10,000 investment)
| Fund | Costs of a $10,000 investment | Costs paid as a percentage of a $10,000 investment |
| Inflation Protected Fund* | $57 | 0.55% |
| * |
The expenses shown in the table are meant to highlight your ongoing costs only and do not reflect any fees and expenses that may be charged by the variable annuity contracts and variable life insurance policies (“Variable Contracts”) that invest in the Fund. |
Management’s Discussion of Fund Performance
SUMMARY OF RESULTS
The Fund posted a return of 5.80% for the year ended May 31, 2026, compared to a return of 5.13% for the Bloomberg U.S. Aggregate Bond Index (a broad-based securities market index) and 4.90% for the Bloomberg U.S. Treasury Inflation-Protected Securities (“TIPS”) Index (the "Performance Index"). Global inflation linked bonds outperformed U.S. TIPS during the period according to the Bloomberg Global Inflation Linked Bond index and Bloomberg U.S. TIPS index.
The following is a summary of the top contributors and detractors that impacted the Fund's performance during the year relative to the Performance Index.
TOP PERFORMANCE CONTRIBUTORS
Allocations in the following sectors | developed non-U.S. dollar; emerging market debt; mortgage-backed securities
TOP PERFORMANCE DETRACTORS
Allocations in the following sectors | U.S. Government
Security selection in the following sectors | U.S. Government TIPS
Fund Performance
The following graph compares a $10,000 initial investment in the Fund to the index(es) listed below for the last 10 fiscal years of the Fund.
GROWTH OF $10,000
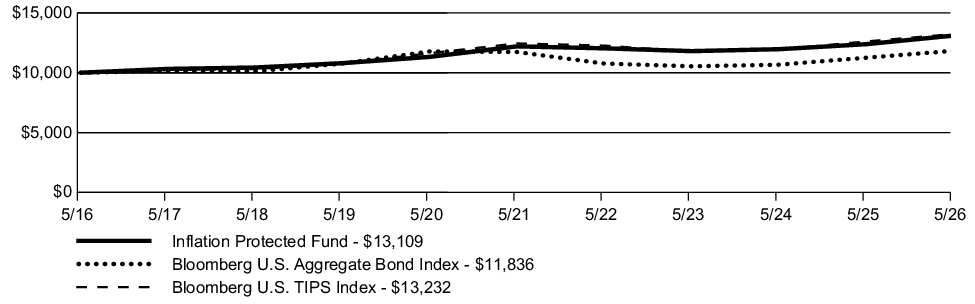
| AVERAGE ANNUAL TOTAL RETURN | 1 Year | 5 Year | 10 Year |
| Inflation Protected Fund | 5.80% | 1.44% | 2.74% |
| Bloomberg U.S. Aggregate Bond Index | 5.13% | 0.17% | 1.70% |
| Bloomberg U.S. TIPS Index | 4.90% | 1.23% | 2.84% |
Key Fund Statistics
The following table outlines key fund statistics.
| Net assets | $356M |
| Total number of portfolio holdings | 130 |
| Total net advisory fee paid | $1.6M |
| Portfolio turnover rate during the reporting period | 45% |
Graphical Representation of Holdings
The information below represents the composition of the Fund as of the end of the period.
Portfolio Composition
(% of net assets)
(% of net assets)
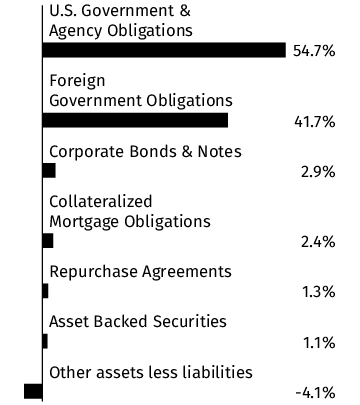
Credit Quality **
(% of total debt issues)
(% of total debt issues)
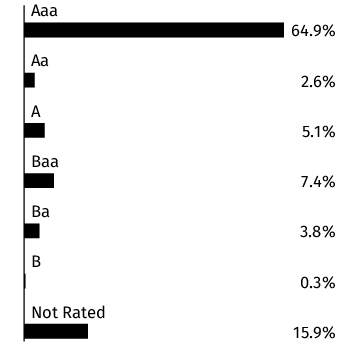
** Credit quality ratings shown above reflect the rating assigned by Moody's Investors Service, Inc. Where Moody's ratings are not available, we have used Standard & Poor's ratings. Unrated investments do not necessarily indicate low credit quality. Credit quality ratings are subject to change. Percentages exclude short-term securities.
Material Fund Changes
This is a summary of certain changes to the Fund since the beginning of the period. Effective January 1, 2026, The Variable Annuity Life Insurance Company (“VALIC”), the investment adviser to the Fund, replaced SunAmerica Asset Management, LLC (“SunAmerica”) as the administrator of VALIC Company I (“VC I”) and SunAmerica became VC I’s sub-administrator. Additionally, on March 26, 2026, Corebridge Financial, Inc. and Equitable Holdings, Inc. (“EQH”) announced that they have entered into a definitive agreement to merge (the “Transaction”). The Transaction is expected to close by the end of 2026, subject to customary closing conditions, including the receipt of requisite regulatory approvals and approval of the shareholders of both Corebridge Financial, Inc. and EQH. Under the 1940 Act, an investment advisory agreement between a registered investment company, such as VC I, and its investment adviser must include a provision providing for its automatic termination upon its “assignment” (as defined in the 1940 Act). The closing of the Transaction may be deemed to cause an “assignment” of the Investment Advisory Agreement between VC I, on behalf of each Fund, and VALIC. As a result, the closing of the Transaction may cause the Investment Advisory Agreement to terminate automatically in accordance with its terms. It is anticipated that, prior to the closing of the Transaction, VC I’s Board of Directors (the “Board”) will consider a new investment advisory agreement between VC I, on behalf of each Fund, and VALIC. If approved by the Board, the new investment advisory agreement will be presented to the Funds’ shareholders for approval, and, if approved by shareholders, it will take effect upon the closing of the Transaction.
Effective September 29, 2025, the Fund’s contractual advisory fee waiver was amended to lower the advisory fee rate payable by the Fund to VALIC to 0.405% of the Fund’s average daily net assets on the first $250 million, 0.355% of the Fund’s average daily net assets on the next $250 million, and 0.305% of the Fund’s average daily net assets over $500 million. For more comprehensive information, you may review the Fund’s next prospectus, which we expect to be available by September 30, 2026 at corebridgefinancial.com/rs/prospectus-and-reports/annuities#underlyingfunds. You can also request this information by calling Corebridge Financial, Inc. at 1-800-448-2542.
Changes in and Disagreements with Accountants
There were no changes in or disagreements with the accountants during the period.
This report describes changes to the Fund that occurred during the reporting period.
Fund Expenses
What were the Fund costs for the last year ?
(Based on a hypothetical $10,000 investment)
| Fund | Costs of a $10,000 investment | Costs paid as a percentage of a $10,000 investment |
| Systematic Value Fund* | $72 | 0.64% |
| * |
The expenses shown in the table are meant to highlight your ongoing costs only and do not reflect any fees and expenses that may be charged by the variable annuity contracts and variable life insurance policies (“Variable Contracts”) that invest in the Fund. |
Management’s Discussion of Fund Performance
SUMMARY OF RESULTS
The Fund posted a return of 25.53% for the year ended May 31, 2026, compared to a return of 29.78% for the S&P 500® Index (a broad-based securities market index) and 28.55% for the Russell 1000® Value Index (the "Performance Index"). U.S. value stocks, as measured by the Russell 1000 Value Index, rose during the 1-year period ending May 31, 2026. Against this backdrop, factor behavior was mixed, as investors reacted to ever evolving uncertainties. During the period, deeper value stocks and value stocks with positive fundamental trend generally outperformed, while higher quality value stocks generally underperformed.
The following is a summary of the top contributors and detractors that impacted the Fund's performance during the year relative to the Performance Index.
TOP PERFORMANCE CONTRIBUTORS
Allocations in the following sectors | information technology; utilities; consumer discretionary
Security selection in the following sectors | health care; consumer discretionary; energy
Position weightings | Micron Technology, Inc.; Dell Technologies, Inc., Class C; APA Corp.
TOP PERFORMANCE DETRACTORS
In aggregate | position weightings
Allocations in the following sectors | financials; energy; cash
Security selection in the following sectors | information technology; communication services; consumer staples
Position weightings | Intel Corp.; Boston Scientific Corp.; Roper Technologies, Inc.
Fund Performance
The following graph compares a $10,000 initial investment in the Fund to the index(es) listed below for the last 10 fiscal years of the Fund.
GROWTH OF $10,000
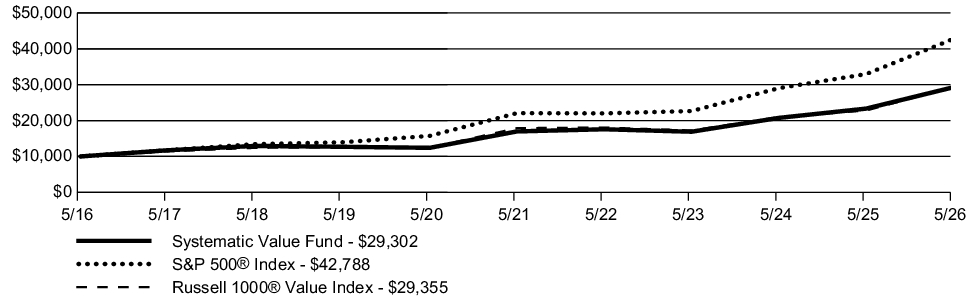
| AVERAGE ANNUAL TOTAL RETURN | 1 Year | 5 Year | 10 Year |
| Systematic Value Fund | 25.53% | 11.53% | 11.35% |
| S&P 500® Index | 29.78% | 14.15% | 15.65% |
| Russell 1000® Value Index | 28.55% | 10.42% | 11.37% |
Key Fund Statistics
The following table outlines key fund statistics.
| Net assets | $653M |
| Total number of portfolio holdings | 162 |
| Total net advisory fee paid | $2.7M |
| Portfolio turnover rate during the reporting period | 93% |
Graphical Representation of Holdings
The information below represents the composition of the Fund's net assets as of the end of the period.
Top Industries*
| Semiconductors | 9.6% |
| Internet | 8.6% |
| Banks | 8.4% |
| Insurance | 6.8% |
| Computers | 6.0% |
| Oil & Gas | 5.1% |
| Diversified Financial Services | 4.8% |
| Pharmaceuticals | 4.7% |
| REITS | 4.1% |
| Telecommunications | 3.1% |
| Biotechnology | 2.8% |
| Electronics | 2.6% |
| Retail | 2.6% |
| Healthcare-Products | 2.3% |
| Agriculture | 2.1% |
Portfolio Composition
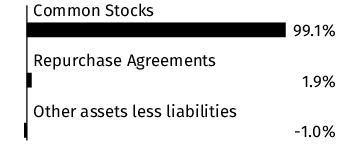
* Percentages exclude derivatives (other than purchased options), if any.
Material Fund Changes
This is a summary of certain changes to the Fund since the beginning of the period. Effective January 1, 2026, The Variable Annuity Life Insurance Company (“VALIC”), the investment adviser to the Fund, replaced SunAmerica Asset Management, LLC (“SunAmerica”) as the administrator of VALIC Company I (“VC I”) and SunAmerica became VC I’s sub-administrator. Additionally, on March 26, 2026, Corebridge Financial, Inc. and Equitable Holdings, Inc. (“EQH”) announced that they have entered into a definitive agreement to merge (the “Transaction”). The Transaction is expected to close by the end of 2026, subject to customary closing conditions, including the receipt of requisite regulatory approvals and approval of the shareholders of both Corebridge Financial, Inc. and EQH. Under the 1940 Act, an investment advisory agreement between a registered investment company, such as VC I, and its investment adviser must include a provision providing for its automatic termination upon its “assignment” (as defined in the 1940 Act). The closing of the Transaction may be deemed to cause an “assignment” of the Investment Advisory Agreement between VC I, on behalf of each Fund, and VALIC. As a result, the closing of the Transaction may cause the Investment Advisory Agreement to terminate automatically in accordance with its terms. It is anticipated that, prior to the closing of the Transaction, VC I’s Board of Directors (the “Board”) will consider a new investment advisory agreement between VC I, on behalf of each Fund, and VALIC. If approved by the Board, the new investment advisory agreement will be presented to the Funds’ shareholders for approval, and, if approved by shareholders, it will take effect upon the closing of the Transaction. For more comprehensive information, you may review the Fund’s next prospectus, which we expect to be available by September 30, 2026 at corebridgefinancial.com/rs/prospectus-and-reports/annuities#underlyingfunds. You can also request this information by calling Corebridge Financial, Inc. at 1-800-448-2542.
Changes in and Disagreements with Accountants
There were no changes in or disagreements with the accountants during the period.
This report describes changes to the Fund that occurred during the reporting period.
Fund Expenses
What were the Fund costs for the last year ?
(Based on a hypothetical $10,000 investment)
| Fund | Costs of a $10,000 investment | Costs paid as a percentage of a $10,000 investment |
| International Value Fund* | $89 | 0.78% |
| * |
The expenses shown in the table are meant to highlight your ongoing costs only and do not reflect any fees and expenses that may be charged by the variable annuity contracts and variable life insurance policies (“Variable Contracts”) that invest in the Fund. |
Management’s Discussion of Fund Performance
SUMMARY OF RESULTS
The Fund posted a return of 28.45% for the year ended May 31, 2026, compared to a return of 32.77% for the MSCI ACWI ex USA Index (net) (a broad-based securities market) and 30.07% for the MSCI EAFE Value Index (net) (the "Performance Index"). Over the period, U.S. equities outperformed developed international equities, according to the Russell 1000 Index and MSCI EAFE Index (net). Within developed international, value-oriented stocks outperformed growth stocks, and small-cap stocks outperformed large- and mid-cap stocks, according to the MSCI EAFE family of indices.
The following is a summary, by subadviser, of the top contributors and detractors that impacted their portion of the Fund's performance during the year relative to the Performance Index.
TOP PERFORMANCE CONTRIBUTORS
Columbia Management Investments Advisers, LLC | In aggregate: sector allocations. Allocations in the following sectors: energy; information technology; cash. Security selection in the following sectors: financials; consumer staples; energy. Position weightings: Energy Fuels, Inc.; Pan American Silver Corp.; Piraeus Bank SA. Exposure to the following countries: Canada; United States; Switzerland
Goldman Sachs Asset Management, LLC | Allocations in the following sectors: information technology; consumer staples; lack of allocation in real estate. Security selection in the following sectors: information technology; financials; materials. Position weightings: Murata Manufacturing Co., Ltd.; Taiwan Semiconductor Manufacturing Co., Ltd; Rio Tinto PLC. Exposure to the following countries: Japan; Taiwan; Singapore
TOP PERFORMANCE DETRACTORS
Columbia Management Investments Advisers, LLC | In aggregate: position weightings. Allocations in the following sectors: consumer staples; financials; real estate. Security selection in the following sectors: information technology; consumer discretionary; materials. Position weightings: Check Point Software Technologies, Ltd.; Sankyo Co., Ltd.; Burford Capital, Ltd. Exposure to the following countries: Japan; United Kingdom; Israel
Goldman Sachs Asset Management, LLC | Allocations in the following sectors: materials; consumer discretionary; health care. Security selection in the following sectors: industrials; communication services; consumer staples. Position weightings: Capgemini SE; Compass Group PLC; Coca-Cola Europacific Partners PLC. Exposure to the following countries: Switzerland; United States; Australia
Fund Performance
The following graph compares a $10,000 initial investment in the Fund to the index(es) listed below for the last 10 fiscal years of the Fund.
GROWTH OF $10,000
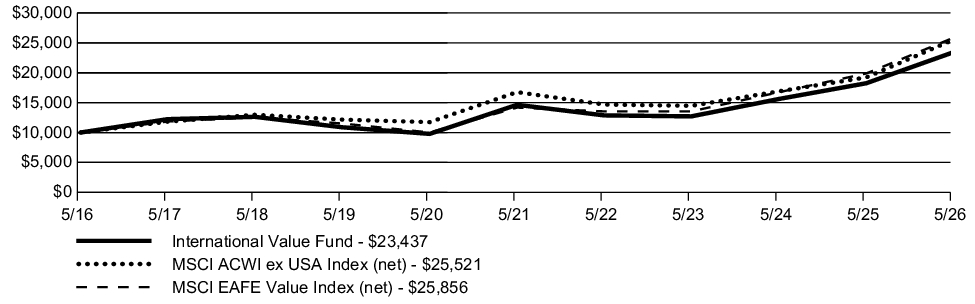
| AVERAGE ANNUAL TOTAL RETURN | 1 Year | 5 Year | 10 Year |
| International Value Fund | 28.45% | 9.87% | 8.89% |
| MSCI ACWI ex USA Index (net) | 32.77% | 8.77% | 9.82% |
| MSCI EAFE Value Index (net) | 30.07% | 12.78% | 9.97% |
Key Fund Statistics
The following table outlines key fund statistics.
| Net assets | $516M |
| Total number of portfolio holdings | 142 |
| Total net advisory fee paid | $2.8M |
| Portfolio turnover rate during the reporting period | 66% |
Graphical Representation of Holdings
The information below represents the composition of the Fund's net assets as of the end of the period.
Top Industries*
| Banks | 22.0% |
| Pharmaceuticals | 7.5% |
| Oil & Gas | 6.3% |
| Insurance | 6.0% |
| Mining | 5.0% |
| Electric | 5.0% |
| Diversified Financial Services | 4.4% |
| Food | 4.4% |
| Distribution/Wholesale | 3.5% |
| Beverages | 2.4% |
| Retail | 2.4% |
| Electronics | 2.3% |
| Telecommunications | 2.1% |
| Miscellaneous Manufacturing | 1.9% |
| Commercial Services | 1.7% |
Portfolio Composition
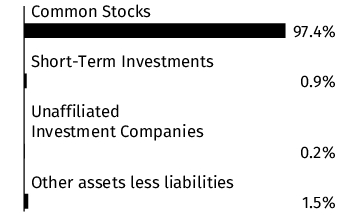
Country
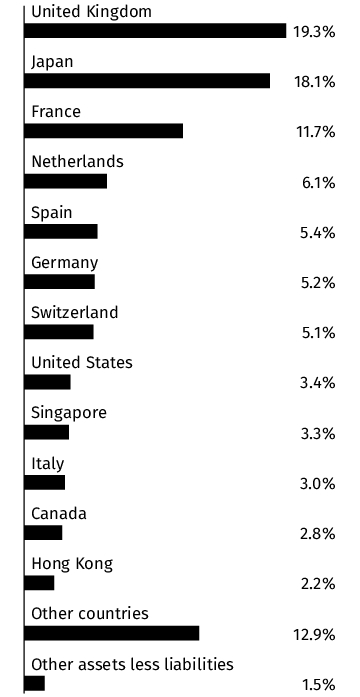
* Percentages exclude derivatives (other than purchased options), if any.
Material Fund Changes
This is a summary of certain changes to the Fund since the beginning of the period. Effective January 1, 2026, The Variable Annuity Life Insurance Company (“VALIC”), the investment adviser to the Fund, replaced SunAmerica Asset Management, LLC (“SunAmerica”) as the administrator of VALIC Company I (“VC I”) and SunAmerica became VC I’s sub-administrator. Additionally, on March 26, 2026, Corebridge Financial, Inc. and Equitable Holdings, Inc. (“EQH”) announced that they have entered into a definitive agreement to merge (the “Transaction”). The Transaction is expected to close by the end of 2026, subject to customary closing conditions, including the receipt of requisite regulatory approvals and approval of the shareholders of both Corebridge Financial, Inc. and EQH. Under the 1940 Act, an investment advisory agreement between a registered investment company, such as VC I, and its investment adviser must include a provision providing for its automatic termination upon its “assignment” (as defined in the 1940 Act). The closing of the Transaction may be deemed to cause an “assignment” of the Investment Advisory Agreement between VC I, on behalf of each Fund, and VALIC. As a result, the closing of the Transaction may cause the Investment Advisory Agreement to terminate automatically in accordance with its terms. It is anticipated that, prior to the closing of the Transaction, VC I’s Board of Directors (the “Board”) will consider a new investment advisory agreement between VC I, on behalf of each Fund, and VALIC. If approved by the Board, the new investment advisory agreement will be presented to the Funds’ shareholders for approval, and, if approved by shareholders, it will take effect upon the closing of the Transaction. For more comprehensive information, you may review the Fund’s next prospectus, which we expect to be available by September 30, 2026 at corebridgefinancial.com/rs/prospectus-and-reports/annuities#underlyingfunds. You can also request this information by calling Corebridge Financial, Inc. at 1-800-448-2542.
Changes in and Disagreements with Accountants
There were no changes in or disagreements with the accountants during the period.
This report describes changes to the Fund that occurred during the reporting period.
Fund Expenses
What were the Fund costs for the last year ?
(Based on a hypothetical $10,000 investment)
| Fund | Costs of a $10,000 investment | Costs paid as a percentage of a $10,000 investment |
| Emerging Economies Fund* | $126 | 0.99% |
| * |
The expenses shown in the table are meant to highlight your ongoing costs only and do not reflect any fees and expenses that may be charged by the variable annuity contracts and variable life insurance policies (“Variable Contracts”) that invest in the Fund. |
Management’s Discussion of Fund Performance
SUMMARY OF RESULTS
The Fund posted a return of 54.26% for the year ended May 31, 2026, compared to a return of 32.77% for the MSCI ACWI ex USA Index (net) (a broad-based securities market index) and 54.31% for the MSCI Emerging Markets Index (net) (the "Performance Index"). The dominant driver of emerging markets strong performance over the period was the AI and semiconductor cycle, which reshaped emerging market leadership around Taiwan and Korea. This gave emerging markets unusually direct exposure to the AI hardware supply chain, including semiconductor, memory, server, and computer-equipment beneficiaries. Performance was also supported by improving investor appetite toward emerging market assets, helped by better earnings momentum, attractive valuations, and expectations for easier policy in several markets. Geopolitics added to volatility.
The following is a summary, by subadviser, of the top contributors and detractors that impacted their portion of the Fund's performance during the year relative to the Performance Index.
TOP PERFORMANCE CONTRIBUTORS
In aggregate | sector allocations; country allocations
Allocations in the following sectors | information technology; consumer staples; utilities
Security selection in the following sectors | financials; information technology
Position weightings | Samsung Electronics Co., Ltd. GDR; Samsung Electronics Co., Ltd.; SK Hynix, Inc.
Exposure to the following countries | Taiwan; Kuwait; India
TOP PERFORMANCE DETRACTORS
In aggregate | position weightings
Allocations in the following sectors | energy; communication services; materials
Security selection in the following sectors | materials; communication services; consumer discretionary
Position weightings | Samsung Electronics Co., Ltd. (Preference Shares); Tencent Holdings, Ltd.; SK Square Co., Ltd.
Exposure to the following countries | China; Thailand; Brazil
Fund Performance
The following graph compares a $10,000 initial investment in the Fund to the index(es) listed below for the last 10 fiscal years of the Fund.
GROWTH OF $10,000
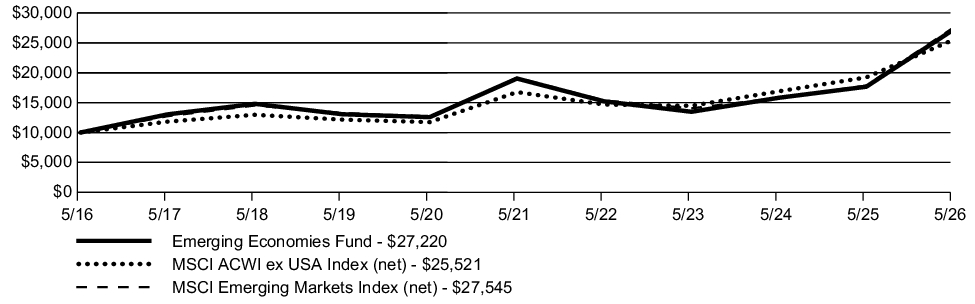
| AVERAGE ANNUAL TOTAL RETURN | 1 Year | 5 Year | 10 Year |
| Emerging Economies Fund | 54.26% | 7.42% | 10.53% |
| MSCI ACWI ex USA Index (net) | 32.77% | 8.77% | 9.82% |
| MSCI Emerging Markets Index (net) | 54.31% | 7.54% | 10.66% |
Key Fund Statistics
The following table outlines key fund statistics.
| Net assets | $949M |
| Total number of portfolio holdings | 577 |
| Total net advisory fee paid | $6.4M |
| Portfolio turnover rate during the reporting period | 127% |
Graphical Representation of Holdings
The information below represents the composition of the Fund's net assets as of the end of the period.
Top Industries*
| Semiconductors | 34.0% |
| Banks | 11.2% |
| Internet | 6.9% |
| Electronics | 5.6% |
| Oil & Gas | 4.3% |
| Telecommunications | 3.3% |
| Mining | 3.0% |
| Computers | 3.0% |
| Diversified Financial Services | 2.5% |
| Insurance | 2.1% |
| Electrical Components & Equipment | 2.0% |
| Auto Manufacturers | 1.7% |
| Pharmaceuticals | 1.7% |
| Retail | 1.5% |
| Iron/Steel | 1.3% |
Portfolio Composition
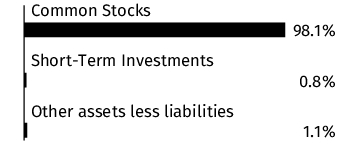
Country
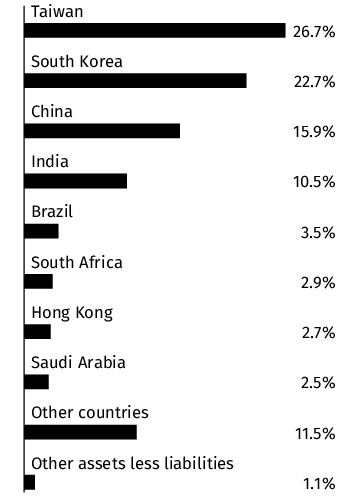
* Percentages exclude derivatives (other than purchased options), if any.
Material Fund Changes
This is a summary of certain changes to the Fund since the beginning of the period. Effective January 1, 2026, The Variable Annuity Life Insurance Company (“VALIC”), the investment adviser to the Fund, replaced SunAmerica Asset Management, LLC (“SunAmerica”) as the administrator of VALIC Company I (“VC I”) and SunAmerica became VC I’s sub-administrator. Additionally, on March 26, 2026, Corebridge Financial, Inc. and Equitable Holdings, Inc. (“EQH”) announced that they have entered into a definitive agreement to merge (the “Transaction”). The Transaction is expected to close by the end of 2026, subject to customary closing conditions, including the receipt of requisite regulatory approvals and approval of the shareholders of both Corebridge Financial, Inc. and EQH. Under the 1940 Act, an investment advisory agreement between a registered investment company, such as VC I, and its investment adviser must include a provision providing for its automatic termination upon its “assignment” (as defined in the 1940 Act). The closing of the Transaction may be deemed to cause an “assignment” of the Investment Advisory Agreement between VC I, on behalf of each Fund, and VALIC. As a result, the closing of the Transaction may cause the Investment Advisory Agreement to terminate automatically in accordance with its terms. It is anticipated that, prior to the closing of the Transaction, VC I’s Board of Directors (the “Board”) will consider a new investment advisory agreement between VC I, on behalf of each Fund, and VALIC. If approved by the Board, the new investment advisory agreement will be presented to the Funds’ shareholders for approval, and, if approved by shareholders, it will take effect upon the closing of the Transaction.
Effective September 29, 2025, Quantitative Investing Risk was added as a principal risk of the Fund. For more comprehensive information, you may review the Fund’s next prospectus, which we expect to be available by September 30, 2026 at corebridgefinancial.com/rs/prospectus-and-reports/annuities#underlyingfunds. You can also request this information by calling Corebridge Financial, Inc. at 1-800-448-2542.
Changes in and Disagreements with Accountants
There were no changes in or disagreements with the accountants during the period.
This report describes changes to the Fund that occurred during the reporting period.
Fund Expenses
What were the Fund costs for the last year ?
(Based on a hypothetical $10,000 investment)
| Fund | Costs of a $10,000 investment | Costs paid as a percentage of a $10,000 investment |
| Global Strategy Fund* | $71 | 0.63% |
| * |
The expenses shown in the table are meant to highlight your ongoing costs only and do not reflect any fees and expenses that may be charged by the variable annuity contracts and variable life insurance policies (“Variable Contracts”) that invest in the Fund. |
Management’s Discussion of Fund Performance
SUMMARY OF RESULTS
The Fund posted a return of 26.24% for the year ended May 31, 2026, compared to a return of 30.27% for the MSCI ACWI Index (net) (a broad-based securities market index) and 19.19% for the Blended Index (the "Performance Index") comprised of 60% MSCI ACWI Index (net); 40% Bloomberg Global Aggregate Index (USD hedged). Over the 12-month period, U.S. equities slightly outperformed international developed equities and underperformed emerging markets equities. The global fixed income market posted broadly positive results over the one-year period, supported by strong performance in 2025 driven by declining yields, tighter credit spreads, and higher starting income levels. However, returns became more uneven in early 2026 as persistent inflation, geopolitical risks, and shifting expectations for central bank policy led to higher volatility and upward pressure on yields. Overall, the environment transitioned from broad, rate-driven gains to a more selective, income-oriented market with greater dispersion across sectors and regions.
The following is a summary, by subadviser, of the top contributors and detractors that impacted their portion of the Fund's performance during the year relative to the Performance Index.
TOP PERFORMANCE CONTRIBUTORS
Brandywine Global Investments, LLC - Global Debt portion | In aggregate: yield curve. Allocations in the following sectors: U.S. corporate credit; U.S. agency mortgage-backed securities; emerging markets sovereign debt. Exposure to the following countries: United States; Brazil; Mexico
Franklin Advisers, Inc. - Global Equity portion | In aggregate: country allocations; position weightings. Allocations in the following sectors: Information technology; financials; consumer discretionary. Security selection in the following sectors: Information technology; communication services; materials. Position weightings: Micron Technology, Inc.; SK Hynix, Inc.; Samsung Electronics Co., Ltd. Exposure to the following countries: South Korea; United States; Germany
TOP PERFORMANCE DETRACTORS
Brandywine Global Investments, LLC - Global Debt portion | Allocations in the following sectors: UK bond futures. Exposure to the following countries: China; Japan; United Kingdom
Franklin Advisers, Inc. - Global Equity portion | Allocations in the following sectors: health care; cash; energy. Security selection in the following sectors: real estate. Position weightings: Adobe, Inc.; Booking Holdings, Inc.; 3i Group PLC. Exposure to the following countries: Netherlands; United Kingdom; United Arab Emirates
Fund Performance
The following graph compares a $10,000 initial investment in the Fund to the index(es) listed below for the last 10 fiscal years of the Fund.
GROWTH OF $10,000
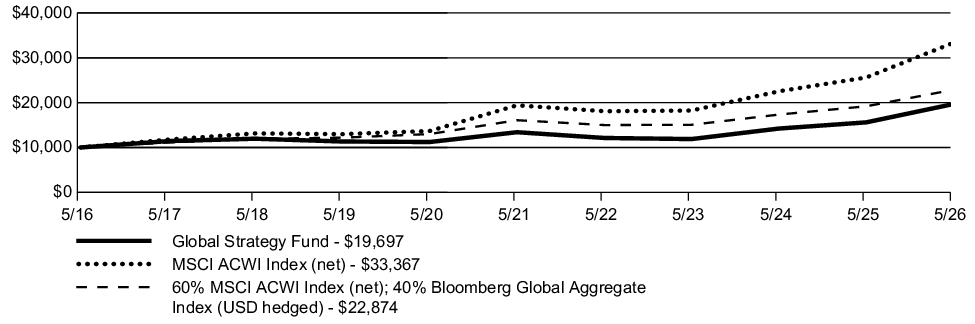
| AVERAGE ANNUAL TOTAL RETURN | 1 Year | 5 Year | 10 Year |
| Global Strategy Fund | 26.24% | 8.00% | 7.01% |
| MSCI ACWI Index (net) | 30.27% | 11.45% | 12.81% |
| 60% MSCI ACWI Index (net); 40% Bloomberg Global Aggregate Index (USD hedged) | 19.19% | 7.30% | 8.63% |
Key Fund Statistics
The following table outlines key fund statistics.
| Net assets | $247M |
| Total number of portfolio holdings | 612 |
| Total net advisory fee paid | $1.0M |
| Portfolio turnover rate during the reporting period | 55% |
Graphical Representation of Holdings
The information below represents the composition of the Fund's net assets as of the end of the period.
Top Industries*
| Semiconductors | 13.3% |
| Internet | 7.6% |
| Foreign Government Obligations | 7.1% |
| Banks | 6.5% |
| Short-Term Investments | 5.6% |
| Diversified Financial Services | 5.1% |
| Other Asset Backed Securities | 4.4% |
| Collateralized Mortgage Obligations | 4.2% |
| Oil & Gas | 4.1% |
| Software | 3.7% |
| Investment Companies | 3.4% |
| Computers | 3.4% |
| Pharmaceuticals | 3.4% |
| Electric | 2.2% |
| Insurance | 2.0% |
Portfolio Composition
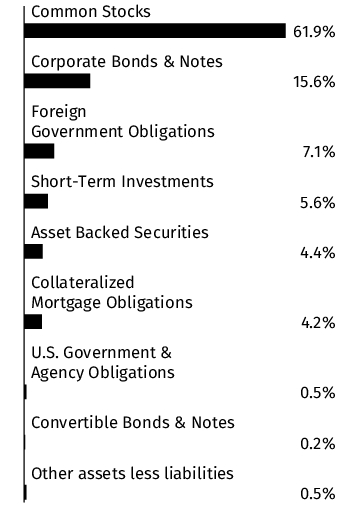
Country
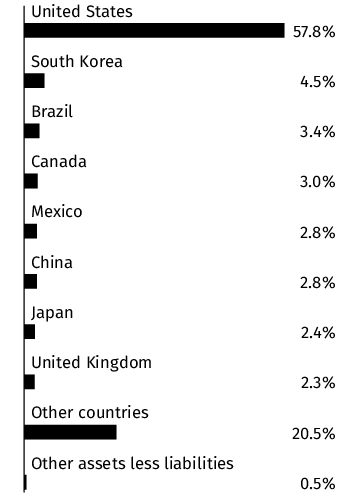
* Percentages exclude derivatives (other than purchased options), if any.
Material Fund Changes
This is a summary of certain changes to the Fund since the beginning of the period. Effective January 1, 2026, The Variable Annuity Life Insurance Company (“VALIC”), the investment adviser to the Fund, replaced SunAmerica Asset Management, LLC (“SunAmerica”) as the administrator of VALIC Company I (“VC I”) and SunAmerica became VC I’s sub-administrator. Additionally, on March 26, 2026, Corebridge Financial, Inc. and Equitable Holdings, Inc. (“EQH”) announced that they have entered into a definitive agreement to merge (the “Transaction”). The Transaction is expected to close by the end of 2026, subject to customary closing conditions, including the receipt of requisite regulatory approvals and approval of the shareholders of both Corebridge Financial, Inc. and EQH. Under the 1940 Act, an investment advisory agreement between a registered investment company, such as VC I, and its investment adviser must include a provision providing for its automatic termination upon its “assignment” (as defined in the 1940 Act). The closing of the Transaction may be deemed to cause an “assignment” of the Investment Advisory Agreement between VC I, on behalf of each Fund, and VALIC. As a result, the closing of the Transaction may cause the Investment Advisory Agreement to terminate automatically in accordance with its terms. It is anticipated that, prior to the closing of the Transaction, VC I’s Board of Directors (the “Board”) will consider a new investment advisory agreement between VC I, on behalf of each Fund, and VALIC. If approved by the Board, the new investment advisory agreement will be presented to the Funds’ shareholders for approval, and, if approved by shareholders, it will take effect upon the closing of the Transaction.
Effective September 29, 2025, the subadviser to the Fund made certain changes to the Fund’s investment strategies with respect to the subadviser’s multi-factor selection process. For more comprehensive information, you may review the Fund’s next prospectus, which we expect to be available by September 30, 2026 at corebridgefinancial.com/rs/prospectus-and-reports/annuities#underlyingfunds. You can also request this information by calling Corebridge Financial, Inc. at 1-800-448-2542.
Changes in and Disagreements with Accountants
There were no changes in or disagreements with the accountants during the period.
This report describes changes to the Fund that occurred during the reporting period.
Fund Expenses
What were the Fund costs for the last year ?
(Based on a hypothetical $10,000 investment)
| Fund | Costs of a $10,000 investment | Costs paid as a percentage of a $10,000 investment |
| Small Cap Core Fund* | $99 | 0.91% |
| * |
The expenses shown in the table are meant to highlight your ongoing costs only and do not reflect any fees and expenses that may be charged by the variable annuity contracts and variable life insurance policies (“Variable Contracts”) that invest in the Fund.
|
Management’s Discussion of Fund Performance
SUMMARY OF RESULTS
The Fund posted a return of 17.83% for the year ended May 31, 2026, compared to a return of 29.45% for the Russell 3000® Index (a broad-based securities market index) and 43.08% for Russell 2000® Index (the "Performance Index") and 44.36% for the Russell 2000® Value Index (prior Performance Index). Over the period, U.S. small-cap equities outperformed large- and mid-cap equities, according to the Russell® family of indices. Value-oriented stocks outperformed growth stocks across the market-cap spectrum.
The following is a summary of the top contributors and detractors that impacted the Fund's performance during the year relative to the Performance Index.
TOP PERFORMANCE CONTRIBUTORS
Allspring Global Investments, LLC - see Material Fund Changes for the time period covered | In aggregate: sector allocations. Allocations in the following sectors: materials; real estate; utilities. Security selection in the following sectors: consumer discretionary; utilities. Position weightings: Mueller Industries, Inc.; Douglas Dynamics, Inc.; Chord Energy Corp.
Invesco Advisers, Inc. - see Material Fund Changes for the time period covered | Allocations in the following sectors: utilities; health care; cash. Security selection in the following sectors: health care; consumer discretionary; utilities. Position weightings: Guardant Health, Inc.; Lattice Semiconductor Corp.; BrightSpring Health Services, Inc.
TOP PERFORMANCE DETRACTORS
Allspring Global Investments, LLC - see Material Fund Changes for the time period covered | In aggregate: position weightings. Allocations in the following sectors: consumer staples; energy; cash. Security selection in the following sectors: materials; information technology; health care. Position weightings: J&J Snack Foods Corp.; Silgan Holdings, Inc.; Innospec, Inc.
Invesco Advisers, Inc. - see Material Fund Changes for the time period covered | Allocations in the following sectors: consumer discretionary; information technology; financials. Security selection in the following sectors: industrials; real estate; financials. Position weightings: lack of position in IonQ, Inc.; Atmus Filtration Technologies, Inc.; Northern Oil & Gas, Inc.
Fund Performance
The following graph compares a $10,000 initial investment in the Fund to the index(es) listed below for the last 10 fiscal years of the Fund.
GROWTH OF $10,000
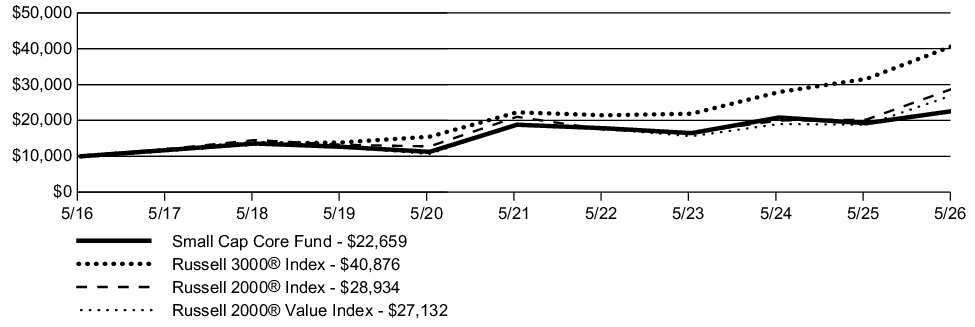
| AVERAGE ANNUAL TOTAL RETURN | 1 Year | 5 Year | 10 Year |
| Small Cap Core Fund | 17.83% | 3.80% | 8.52% |
| Russell 3000® Index | 29.45% | 12.92% | 15.12% |
| Russell 2000® Index | 43.08% | 6.61% | 11.21% |
| Russell 2000® Value Index | 44.36% | 7.27% | 10.50% |
Key Fund Statistics
The following table outlines key fund statistics.
| Net assets | $173M |
| Total number of portfolio holdings | 104 |
| Total net advisory fee paid | $1.2M |
| Portfolio turnover rate during the reporting period | 124% |
Graphical Representation of Holdings
The information below represents the composition of the Fund's net assets as of the end of the period.
Top Industries*
| Semiconductors | 9.0% |
| Banks | 8.5% |
| REITS | 6.3% |
| Electronics | 5.7% |
| Healthcare-Products | 5.4% |
| Machinery-Diversified | 4.6% |
| Biotechnology | 4.6% |
| Diversified Financial Services | 4.0% |
| Oil & Gas | 3.9% |
| Auto Parts & Equipment | 3.7% |
| Retail | 3.5% |
| Healthcare-Services | 3.5% |
| Miscellaneous Manufacturing | 2.9% |
| Commercial Services | 2.7% |
| Savings & Loans | 2.6% |
Portfolio Composition
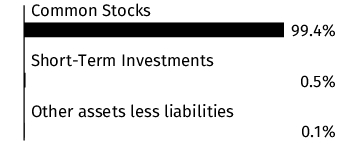
* Percentages exclude derivatives (other than purchased options), if any.
Material Fund Changes
This is a summary of certain changes to the Fund since the beginning of the period. Effective January 1, 2026, The Variable Annuity Life Insurance Company (“VALIC”), the investment adviser to the Fund, replaced SunAmerica Asset Management, LLC (“SunAmerica”) as the administrator of VALIC Company I (“VC I”) and SunAmerica became VC I’s sub-administrator. Additionally, on March 26, 2026, Corebridge Financial, Inc. and Equitable Holdings, Inc. (“EQH”) announced that they have entered into a definitive agreement to merge (the “Transaction”). The Transaction is expected to close by the end of 2026, subject to customary closing conditions, including the receipt of requisite regulatory approvals and approval of the shareholders of both Corebridge Financial, Inc. and EQH. Under the 1940 Act, an investment advisory agreement between a registered investment company, such as VC I, and its investment adviser must include a provision providing for its automatic termination upon its “assignment” (as defined in the 1940 Act). The closing of the Transaction may be deemed to cause an “assignment” of the Investment Advisory Agreement between VC I, on behalf of each Fund, and VALIC. As a result, the closing of the Transaction may cause the Investment Advisory Agreement to terminate automatically in accordance with its terms. It is anticipated that, prior to the closing of the Transaction, VC I’s Board of Directors (the “Board”) will consider a new investment advisory agreement between VC I, on behalf of each Fund, and VALIC. If approved by the Board, the new investment advisory agreement will be presented to the Funds’ shareholders for approval, and, if approved by shareholders, it will take effect upon the closing of the Transaction.
Effective September 29, 2025, the Fund entered into a contractual advisory fee waiver agreement with VALIC to lower the advisory fee rate payable by the Fund to VALIC to 0.72% of the Fund’s average daily net assets on the first $500 million and 0.67% of the Fund’s average daily net assets over $500 million. Effective April 30, 2026, Invesco Advisers, Inc. (“Invesco) was appointed as subadviser to the Fund, replacing the existing subadviser, Allspring Global Investments, LLC. In connection with Invesco’s appointment, the Fund’s investment objective, investment strategies and techniques were revised to reflect the investment strategies and techniques used by Invesco. As a result of these changes, Real Estate Investment Trusts Risk was added as a principal risk, and Value Style Risk was removed as a principal risk. Also effective April 30, 2026, the Fund’s contractual advisory fee waiver was amended to lower the advisory fee rate payable by the Fund to VALIC to 0.64% of the Fund’s average daily net assets on the first $500 million and 0.59% of the Fund’s average daily net assets over $500 million. In addition, the Fund changed its name from the “Small Cap Special Values Fund” to the “Small Cap Core Fund.” For more comprehensive information, you may review the Fund’s next prospectus, which we expect to be available by September 30, 2026 at corebridgefinancial.com/rs/prospectus-and-reports/annuities#underlyingfunds. You can also request this information by calling Corebridge Financial, Inc. at 1-800-448-2542.
Changes in and Disagreements with Accountants
There were no changes in or disagreements with the accountants during the period.
This report describes changes to the Fund that occurred during the reporting period.
Fund Expenses
What were the Fund costs for the last year ?
(Based on a hypothetical $10,000 investment)
| Fund | Costs of a $10,000 investment | Costs paid as a percentage of a $10,000 investment |
| Growth Fund* | $70 | 0.61% |
| * |
The expenses shown in the table are meant to highlight your ongoing costs only and do not reflect any fees and expenses that may be charged by the variable annuity contracts and variable life insurance policies (“Variable Contracts”) that invest in the Fund. |
Management’s Discussion of Fund Performance
SUMMARY OF RESULTS
The Fund posted a return of 28.81% for the year ended May 31, 2026, compared to a return of 29.78% for the S&P 500® Index (a broad-based securities market index) and 28.66% for the Russell 1000® Growth Index (the "Performance Index"). Over the period, U.S. equities advanced, with technology-heavy and growth-oriented benchmarks leading the market. Smaller-cap equities also rose, while mid-cap growth lagged value-oriented benchmarks. Growth-oriented stocks modestly outperformed value overall, though leadership broadened over time, and rising macro uncertainty and higher rates drove rotations into value and defensive sectors at times.
The following is a summary, by subadviser, of the top contributors and detractors that impacted their portion of the Fund's performance during the year relative to the Performance Index.
TOP PERFORMANCE CONTRIBUTORS
BlackRock Investment Management, LLC (active) | In aggregate: sector allocations. Allocations in the following sectors: consumer staples; financials; industrials. Security selection in the following sectors: information technology; consumer discretionary. Position weightings: Intel Corp.; Datadog, Inc., Class A; Lam Research Corp.
BlackRock Investment Management, LLC (passive) | Allocations in the following sectors: information technology; communication services; consumer discretionary. Position weightings: NVIDIA Corp.; Apple, Inc.; Broadcom, Inc.
TOP PERFORMANCE DETRACTORS
BlackRock Investment Management, LLC (active) | Allocations in the following sectors: real estate; materials; cash. Security selection in the following sectors: communication services; industrials; financials. Position weightings: Alphabet, Inc., Class C; Advanced Micro Devices, Inc.; Apple, Inc.
BlackRock Investment Management, LLC (passive) | Allocations in the following sectors: financials; utilities; materials. Position weightings: Netflix, Inc.; Intuit, Inc.; ServiceNow, Inc.
Fund Performance
The following graph compares a $10,000 initial investment in the Fund to the index(es) listed below for the last 10 fiscal years of the Fund.
GROWTH OF $10,000
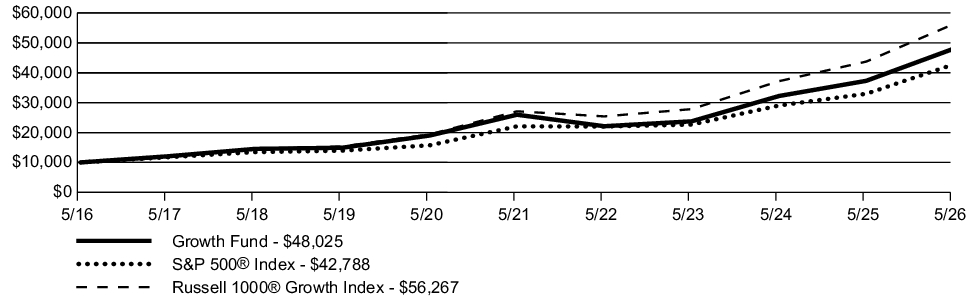
| AVERAGE ANNUAL TOTAL RETURN | 1 Year | 5 Year | 10 Year |
| Growth Fund | 28.81% | 13.09% | 16.99% |
| S&P 500® Index | 29.78% | 14.15% | 15.65% |
| Russell 1000® Growth Index | 28.66% | 15.73% | 18.86% |
Key Fund Statistics
The following table outlines key fund statistics.
| Net assets | $1,682M |
| Total number of portfolio holdings | 390 |
| Total net advisory fee paid | $9.0M |
| Portfolio turnover rate during the reporting period | 88% |
Graphical Representation of Holdings
The information below represents the composition of the Fund's net assets as of the end of the period.
Top Industries*
| Semiconductors | 24.8% |
| Internet | 21.8% |
| Software | 16.4% |
| Computers | 7.5% |
| Aerospace/Defense | 3.8% |
| Machinery-Construction & Mining | 3.5% |
| Pharmaceuticals | 3.2% |
| REITS | 3.1% |
| Commercial Services | 2.4% |
| Diversified Financial Services | 1.9% |
| Electronics | 1.7% |
| Electrical Components & Equipment | 1.6% |
| Mining | 1.6% |
| Auto Manufacturers | 1.5% |
| Retail | 1.5% |
Portfolio Composition
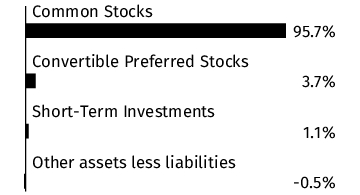
* Percentages exclude derivatives (other than purchased options), if any.
Material Fund Changes
This is a summary of certain changes to the Fund since the beginning of the period. Effective January 1, 2026, The Variable Annuity Life Insurance Company (“VALIC”), the investment adviser to the Fund, replaced SunAmerica Asset Management, LLC (“SunAmerica”) as the administrator of VALIC Company I (“VC I”) and SunAmerica became VC I’s sub-administrator. Additionally, on March 26, 2026, Corebridge Financial, Inc. and Equitable Holdings, Inc. (“EQH”) announced that they have entered into a definitive agreement to merge (the “Transaction”). The Transaction is expected to close by the end of 2026, subject to customary closing conditions, including the receipt of requisite regulatory approvals and approval of the shareholders of both Corebridge Financial, Inc. and EQH. Under the 1940 Act, an investment advisory agreement between a registered investment company, such as VC I, and its investment adviser must include a provision providing for its automatic termination upon its “assignment” (as defined in the 1940 Act). The closing of the Transaction may be deemed to cause an “assignment” of the Investment Advisory Agreement between VC I, on behalf of each Fund, and VALIC. As a result, the closing of the Transaction may cause the Investment Advisory Agreement to terminate automatically in accordance with its terms. It is anticipated that, prior to the closing of the Transaction, VC I’s Board of Directors (the “Board”) will consider a new investment advisory agreement between VC I, on behalf of each Fund, and VALIC. If approved by the Board, the new investment advisory agreement will be presented to the Funds’ shareholders for approval, and, if approved by shareholders, it will take effect upon the closing of the Transaction. For more comprehensive information, you may review the Fund’s next prospectus, which we expect to be available by September 30, 2026 at corebridgefinancial.com/rs/prospectus-and-reports/annuities#underlyingfunds. You can also request this information by calling Corebridge Financial, Inc. at 1-800-448-2542.
Changes in and Disagreements with Accountants
There were no changes in or disagreements with the accountants during the period.
This report describes changes to the Fund that occurred during the reporting period.
Fund Expenses
What were the Fund costs for the last year ?
(Based on a hypothetical $10,000 investment)
| Fund | Costs of a $10,000 investment | Costs paid as a percentage of a $10,000 investment |
| Global Real Estate Fund* | $96 | 0.91% |
| * |
The expenses shown in the table are meant to highlight your ongoing costs only and do not reflect any fees and expenses that may be charged by the variable annuity contracts and variable life insurance policies (“Variable Contracts”) that invest in the Fund. |
Management’s Discussion of Fund Performance
SUMMARY OF RESULTS
The Fund posted a return of 11.35% for the year ended May 31, 2026, compared to a return of 30.27% for the MSCI ACWI Index (net) (a broad-based securities market index) and 13.28% for the FTSE EPRA/NAREIT Developed Index (the "Performance Index"). Global real estate markets delivered positive but uneven returns amid elevated interest rates, moderating inflation, and episodic geopolitical volatility. Performance favored secular growth sectors such as data centers and health care, while rate-sensitive areas like residential and certain office segments lagged.
The following is a summary, by subadviser, of the top contributors and detractors that impacted their portion of the Fund's performance during the year relative to the Performance Index.
TOP PERFORMANCE CONTRIBUTORS
Duff & Phelps Investment Management Company | Allocations in the following industries: data centers; specialty; health care. Security selection in the following industries: diversified; data centers; specialty. Position weightings: Merlin Properties Socimi SA; Welltower, Inc.; Mitsubishi Estate Co., Ltd. Exposure to the following countries: Australia; Spain; Japan
Massachusetts Financial Services Company | Allocations in the following industries: real estate operating companies; other specialized REITS; asset management & custody banks. Security selection in the following industries: Health care REITS; single-family residential REITS; other specialized REITS. Position weightings: Healthcare Realty Trust, Inc.; lack of position in AvalonBay Communities, Inc.; Ventas, Inc. Exposure to the following countries: lack of exposure to Sweden; France; Germany
TOP PERFORMANCE DETRACTORS
Duff & Phelps Investment Management Company | Allocations in the following sectors: residential; telecommunication REITs; diversified. Security selection in the following sectors: residential; lodging/resorts; health care. Position weightings: UNITE Group PLC; American Homes 4 Rent, Class A; American Tower Corp. Exposure to the following countries: United Kingdom; United States; Singapore
Massachusetts Financial Services Company | In aggregate: country allocations; position weightings; sector allocations. Allocations in the following industries: health care REITS; single-family residential REITS; office REITS. Security selection in the following industries: industrial REITS; self-storage REITS; multi-family residential REITS. Position weightings: lack of position in Welltower, Inc.; Shurgard Self Storage, Ltd.; Grainger PLC. Exposure to the following countries: Hong Kong; United Kingdom; United States
Fund Performance
The following graph compares a $10,000 initial investment in the Fund to the index(es) listed below for the last 10 fiscal years of the Fund.
GROWTH OF $10,000
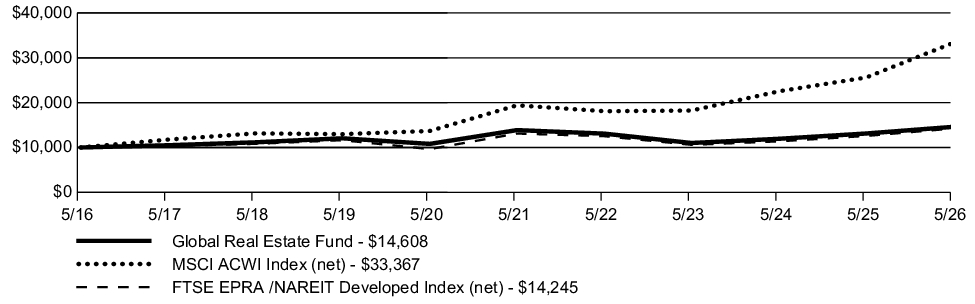
| AVERAGE ANNUAL TOTAL RETURN | 1 Year | 5 Year | 10 Year |
| Global Real Estate Fund | 11.35% | 1.04% | 3.86% |
| MSCI ACWI Index (net) | 30.27% | 11.45% | 12.81% |
| FTSE EPRA /NAREIT Developed Index (net) | 13.28% | 1.68% | 3.60% |
Key Fund Statistics
The following table outlines key fund statistics.
| Net assets | $324M |
| Total number of portfolio holdings | 89 |
| Total net advisory fee paid | $2.0M |
| Portfolio turnover rate during the reporting period | 26% |
Graphical Representation of Holdings
The information below represents the composition of the Fund's net assets as of the end of the period.
Top Industries*
| Diversified REITS | 19.0% |
| Warehouse/Industrial REITS | 14.7% |
| Health Care REITS | 13.4% |
| Shopping Centers REITS | 9.9% |
| Apartment REITS | 9.4% |
| Real Estate | 8.8% |
| Storage REITS | 5.9% |
| Office Property REITS | 4.6% |
| Regional Malls REITS | 4.5% |
| Hotel REITS | 2.5% |
| Single Tenant REITS | 2.4% |
| Telecommunications | 1.5% |
| Manufactured Homes REITS | 1.2% |
| Healthcare-Services | 1.0% |
| Short-Term Investments | 0.7% |
Portfolio Composition
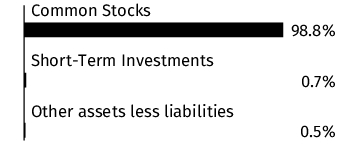
Country
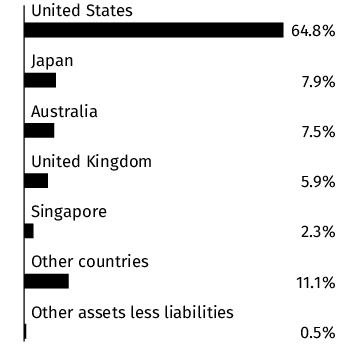
* Percentages exclude derivatives (other than purchased options), if any.
Material Fund Changes
This is a summary of certain changes to the Fund since the beginning of the period. Effective January 1, 2026, The Variable Annuity Life Insurance Company (“VALIC”), the investment adviser to the Fund, replaced SunAmerica Asset Management, LLC (“SunAmerica”) as the administrator of VALIC Company I (“VC I”) and SunAmerica became VC I’s sub-administrator. Additionally, on March 26, 2026, Corebridge Financial, Inc. and Equitable Holdings, Inc. (“EQH”) announced that they have entered into a definitive agreement to merge (the “Transaction”). The Transaction is expected to close by the end of 2026, subject to customary closing conditions, including the receipt of requisite regulatory approvals and approval of the shareholders of both Corebridge Financial, Inc. and EQH. Under the 1940 Act, an investment advisory agreement between a registered investment company, such as VC I, and its investment adviser must include a provision providing for its automatic termination upon its “assignment” (as defined in the 1940 Act). The closing of the Transaction may be deemed to cause an “assignment” of the Investment Advisory Agreement between VC I, on behalf of each Fund, and VALIC. As a result, the closing of the Transaction may cause the Investment Advisory Agreement to terminate automatically in accordance with its terms. It is anticipated that, prior to the closing of the Transaction, VC I’s Board of Directors (the “Board”) will consider a new investment advisory agreement between VC I, on behalf of each Fund, and VALIC. If approved by the Board, the new investment advisory agreement will be presented to the Funds’ shareholders for approval, and, if approved by shareholders, it will take effect upon the closing of the Transaction.
Effective September 28, 2026, Duff & Phelps Investment Management Co. (“Duff & Phelps”), an existing subadviser to the Fund, will replace Massachusetts Financial Services Company as a subadviser to a portion of the Fund, making Duff & Phelps the sole subadviser to the Fund. In connection with Duff & Phelps’s appointment, the Fund’s investment strategies and techniques will be revised to reflect the current investment strategies and techniques used by Duff & Phelps. For more comprehensive information, you may review the Fund’s next prospectus, which we expect to be available by September 30, 2026 at corebridgefinancial.com/rs/prospectus-and-reports/annuities#underlyingfunds. You can also request this information by calling Corebridge Financial, Inc. at 1-800-448-2542.
Changes in and Disagreements with Accountants
There were no changes in or disagreements with the accountants during the period.
This report describes changes to the Fund that occurred during the reporting period.
Fund Expenses
What were the Fund costs for the last year ?
(Based on a hypothetical $10,000 investment)
| Fund | Costs of a $10,000 investment | Costs paid as a percentage of a $10,000 investment |
| Dynamic Allocation Fund* | $38 | 0.35% |
| * |
The expenses shown in the table are meant to highlight your ongoing costs only and do not reflect any fees and expenses that may be charged by the variable annuity contracts and variable life insurance policies (“Variable Contracts”) that invest in the Fund. |
Management’s Discussion of Fund Performance
SUMMARY OF RESULTS
The Fund consists of two components: A fund-of-funds component representing investments in VC I Funds, and an overlay component which invests in cash, treasuries, and futures, to manage the Fund's net equity exposure.
The Fund posted a return of 16.62% for the year ended May 31, 2026, compared to a return of 29.78% S&P 500® Index (a broad-based securities market index) and 19.53% for the Blended Index (the "Performance Index") comprised of 60% S&P 500® Index; 40% Bloomberg U.S. Aggregate Bond Index. Equity markets surged during the period, helped by easing trade concerns, optimism around AI, and expectations for rate cuts by the Federal Reserve. Stocks were broadly higher, led by small-cap companies. Heightened geopolitical tensions, particularly surrounding Iran and broader Middle East instability, contributed to intermittent market volatility, while the Federal Reserve held rates steady amid mixed inflation signals.
The following is a summary, by subadviser, of the top contributors and detractors that impacted their portion of the Fund's performance during the year relative to the Performance Index.
TOP PERFORMANCE CONTRIBUTORS
AllianceBernstein, L.P. (overlay) | Allocations in the following strategies: tactical equity; equity futures contracts used to adjust exposures and manage risk of the Fund
AllianceBernstein, L.P. (fund of funds)- see Material Fund Changes for the time period covered | Allocations in the following sectors: growth equities; value equities . Allocation to the following funds: Stock Index Fund; Systematic Value Fund; Nasdaq-100 Index Fund
SunAmerica Asset Management, LLC - see Material Fund Changes for the time period covered | Allocations in the following sectors: small cap equity. Allocation to the following funds: Systematic Growth Fund; Core Bond Fund; Capital Appreciation Fund
TOP PERFORMANCE DETRACTORS
AllianceBernstein, L.P. (overlay) | Allocations in the following strategies: option overlay; fixed income
AllianceBernstein, L.P. (fund of funds)- see Material Fund Changes for the time period covered | Allocations in the following sectors: core equities. Allocation to the following funds: None
SunAmerica Asset Management, LLC - see Material Fund Changes for the time period covered | Allocations in the following sectors: international equity; mid-cap equity; global real estate. Allocation to the following funds: Systematic Value Fund; Dividend Value Fund; Large Cap Core Fund (formerly Large Capital Growth Fund)
Fund Performance
The following graph compares a $10,000 initial investment in the Fund to the index(es) listed below for the last 10 fiscal years of the Fund.
GROWTH OF $10,000
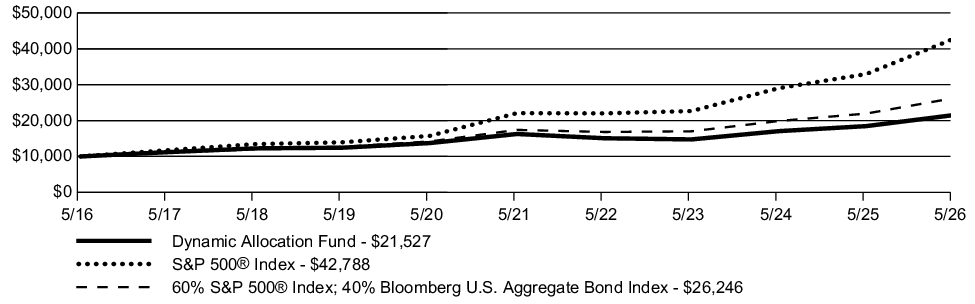
| AVERAGE ANNUAL TOTAL RETURN | 1 Year | 5 Year | 10 Year |
| Dynamic Allocation Fund | 16.62% | 5.77% | 7.97% |
| S&P 500® Index | 29.78% | 14.15% | 15.65% |
| 60% S&P 500® Index; 40% Bloomberg U.S. Aggregate Bond Index | 19.53% | 8.57% | 10.13% |
Key Fund Statistics
The following table outlines key fund statistics.
| Net assets | $124M |
| Total number of portfolio holdings | 48 |
| Total net advisory fee paid | $0.3M |
| Portfolio turnover rate during the reporting period | 58% |
Graphical Representation of Holdings
The information below represents the composition of the Fund's net assets as of the end of the period.
Portfolio Composition
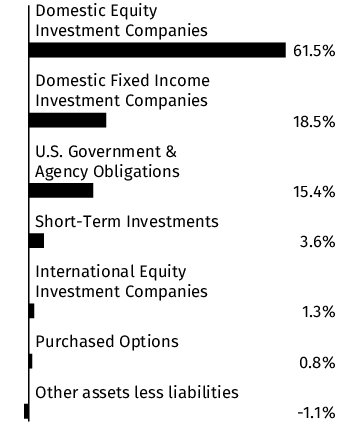
Material Fund Changes
This is a summary of certain changes to the Fund since the beginning of the period. Effective January 1, 2026, The Variable Annuity Life Insurance Company (“VALIC”), the investment adviser to the Fund, replaced SunAmerica Asset Management, LLC (“SunAmerica”) as the administrator of VALIC Company I (“VC I”) and SunAmerica became VC I’s sub-administrator. Additionally, on March 26, 2026, Corebridge Financial, Inc. and Equitable Holdings, Inc. (“EQH”) announced that they have entered into a definitive agreement to merge (the “Transaction”). The Transaction is expected to close by the end of 2026, subject to customary closing conditions, including the receipt of requisite regulatory approvals and approval of the shareholders of both Corebridge Financial, Inc. and EQH. Under the 1940 Act, an investment advisory agreement between a registered investment company, such as VC I, and its investment adviser must include a provision providing for its automatic termination upon its “assignment” (as defined in the 1940 Act). The closing of the Transaction may be deemed to cause an “assignment” of the Investment Advisory Agreement between VC I, on behalf of each Fund, and VALIC. As a result, the closing of the Transaction may cause the Investment Advisory Agreement to terminate automatically in accordance with its terms. It is anticipated that, prior to the closing of the Transaction, VC I’s Board of Directors (the “Board”) will consider a new investment advisory agreement between VC I, on behalf of each Fund, and VALIC. If approved by the Board, the new investment advisory agreement will be presented to the Funds’ shareholders for approval, and, if approved by shareholders, it will take effect upon the closing of the Transaction.
Effective September 29, 2025, AllianceBernstein L.P. (“AllianceBernstein“), an existing subadviser to the Fund, replaced SunAmerica Asset Management, LLC as the subadviser to the Fund’s Fund-of-Funds Component, making AllianceBernstein the sole subadviser to the Fund. In connection with AllianceBernstein’s appointment, the Fund’s investment strategies and techniques were revised to reflect the current investment strategies and techniques used by AllianceBernstein. As a result, Affiliated Fund Risk was removed as a principal risk of the Fund. In addition, the Fund entered into a voluntary advisory fee waiver agreement with VALIC to lower the advisory fee rate payable by the Fund to VALIC in connection with the Fund’s investment in an AllianceBernstein-advised money market fund. For more comprehensive information, you may review the Fund’s next prospectus, which we expect to be available by September 30, 2026 at corebridgefinancial.com/rs/prospectus-and-reports/annuities#underlyingfunds. You can also request this information by calling Corebridge Financial, Inc. at 1-800-448-2542.
Changes in and Disagreements with Accountants
There were no changes in or disagreements with the accountants during the period.
This report describes changes to the Fund that occurred during the reporting period.
Fund Expenses
What were the Fund costs for the last year ?
(Based on a hypothetical $10,000 investment)
| Fund | Costs of a $10,000 investment | Costs paid as a percentage of a $10,000 investment |
| Aggressive Allocation Lifestyle Fund* | $11 | 0.10% |
| * |
The expenses shown in the table are meant to highlight your ongoing costs only and do not reflect any fees and expenses that may be charged by the variable annuity contracts and variable life insurance policies (“Variable Contracts”) that invest in the Fund. |
Management’s Discussion of Fund Performance
SUMMARY OF RESULTS
The Aggressive Allocation Lifestyle Fund invests in a combination of affiliated funds, also known as “fund of funds.” The Fund does not select specific sectors, securities, or countries and thus these factors do not influence performance. Rather, the key indicators of performance are asset allocation and manager selection.
The Fund posted a return of 21.58% for the year ended May 31, 2026, compared to 29.78% for the S&P 500® Index (a broad-based securities market index) and 21.93% for the Blended Index (the "Performance Index") comprised of 56% Russell 3000® Index; 19% MSCI EAFE Index (net); 25% Bloomberg U.S. Aggregate Bond Index. Over the period, emerging market equities outperformed U.S. equities and international developed equities. Credit markets showed resilience, particularly in high yield segments.
The following is a summary of the top contributors and detractors that impacted the Fund's performance during the year relative to the Performance Index.
TOP PERFORMANCE CONTRIBUTORS
Allocations in the following funds | Core Bond Fund; High Yield Fund
TOP PERFORMANCE DETRACTORS
Allocations in the following funds | Large Cap Core Fund; Small Cap Growth Fund; Systematic Value Fund
Fund Performance
The following graph compares a $10,000 initial investment in the Fund to the index(es) listed below for the last 10 fiscal years of the Fund.
GROWTH OF $10,000
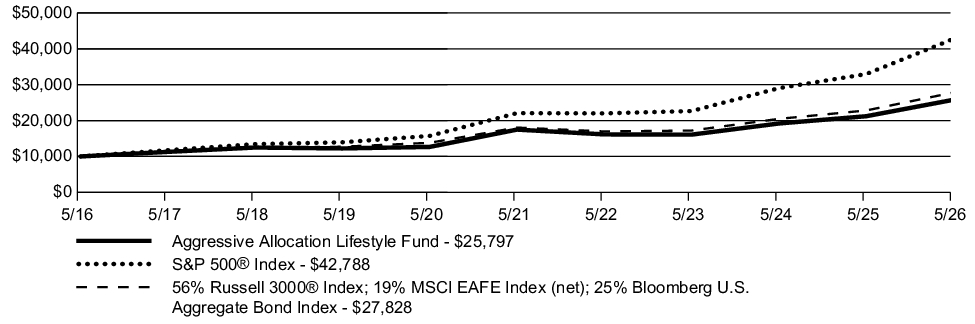
| AVERAGE ANNUAL TOTAL RETURN | 1 Year | 5 Year | 10 Year |
| Aggressive Allocation Lifestyle Fund | 21.58% | 8.09% | 9.94% |
| S&P 500® Index | 29.78% | 14.15% | 15.65% |
| 56% Russell 3000® Index; 19% MSCI EAFE Index (net); 25% Bloomberg U.S. Aggregate Bond Index | 21.93% | 9.05% | 10.78% |
Key Fund Statistics
The following table outlines key fund statistics.
| Net assets | $789M |
| Total number of portfolio holdings | 12 |
| Total net advisory fee paid | $0.5M |
| Portfolio turnover rate during the reporting period | 25% |
Graphical Representation of Holdings
The information below represents the composition of the Fund's net assets as of the end of the period.
Portfolio Composition
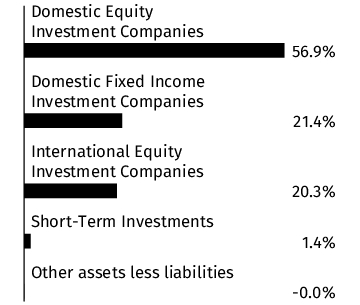
Material Fund Changes
This is a summary of certain changes to the Fund since the beginning of the period. Effective January 1, 2026, The Variable Annuity Life Insurance Company (“VALIC”), the investment adviser to the Fund, replaced SunAmerica Asset Management, LLC (“SunAmerica”) as the administrator of VALIC Company I (“VC I”) and SunAmerica became VC I’s sub-administrator. Additionally, on March 26, 2026, Corebridge Financial, Inc. and Equitable Holdings, Inc. (“EQH”) announced that they have entered into a definitive agreement to merge (the “Transaction”). The Transaction is expected to close by the end of 2026, subject to customary closing conditions, including the receipt of requisite regulatory approvals and approval of the shareholders of both Corebridge Financial, Inc. and EQH. Under the 1940 Act, an investment advisory agreement between a registered investment company, such as VC I, and its investment adviser must include a provision providing for its automatic termination upon its “assignment” (as defined in the 1940 Act). The closing of the Transaction may be deemed to cause an “assignment” of the Investment Advisory Agreement between VC I, on behalf of each Fund, and VALIC. As a result, the closing of the Transaction may cause the Investment Advisory Agreement to terminate automatically in accordance with its terms. It is anticipated that, prior to the closing of the Transaction, VC I’s Board of Directors (the “Board”) will consider a new investment advisory agreement between VC I, on behalf of each Fund, and VALIC. If approved by the Board, the new investment advisory agreement will be presented to the Funds’ shareholders for approval, and, if approved by shareholders, it will take effect upon the closing of the Transaction.
Effective September 29, 2025, the Fund changed its name from the “Aggressive Growth Lifestyle Fund” to the “Aggressive Allocation Lifestyle Fund.” For more comprehensive information, you may review the Fund’s next prospectus, which we expect to be available by September 30, 2026 at corebridgefinancial.com/rs/prospectus-and-reports/annuities#underlyingfunds. You can also request this information by calling Corebridge Financial, Inc. at 1-800-448-2542.
Changes in and Disagreements with Accountants
There were no changes in or disagreements with the accountants during the period.
This report describes changes to the Fund that occurred during the reporting period.
Fund Expenses
What were the Fund costs for the last year ?
(Based on a hypothetical $10,000 investment)
| Fund | Costs of a $10,000 investment | Costs paid as a percentage of a $10,000 investment |
| U.S. Socially Responsible Fund* | $40 | 0.36% |
| * |
The expenses shown in the table are meant to highlight your ongoing costs only and do not reflect any fees and expenses that may be charged by the variable annuity contracts and variable life insurance policies (“Variable Contracts”) that invest in the Fund.
|
Management’s Discussion of Fund Performance
SUMMARY OF RESULTS
The Fund is an optimized portfolio which seeks to track the S&P 500® Index while investing in socially responsive companies. The Fund's criteria do not permit investment in companies whose businesses rely significantly on alcohol, firearms, gambling, tobacco, nuclear power, or production of weaponry. Furthermore, companies deemed to have poor labor/employee relations or environmental records are also screened out of the investable universe. These criteria may create differences in Fund performance relative to the Benchmark.
The Fund posted a return of 24.86% for the year ended May 31, 2026, compared to a return of 29.78% for the S&P 500® Index (a broad-based securities market & "Performance Index"). Over the period, U.S. equities advanced, with technology-heavy and growth-oriented benchmarks leading the market. Smaller-cap equities also rose, while mid-cap growth lagged value-oriented benchmarks.
The following is a summary of the top contributors and detractors that impacted the Fund's performance during the year relative to the Performance Index.
TOP PERFORMANCE CONTRIBUTORS
In aggregate | sector allocations
Allocations in the following sectors | information technology; consumer staples; health care
Security selection in the following sectors | information technology; real estate
Position weightings | Western Digital Corp.; lack of position in Microsoft Corp.; Seagate Technology Holdings PLC
TOP PERFORMANCE DETRACTORS
In aggregate | position weightings
Allocations in the following sectors | financials; communication services; real estate
Security selection in the following sectors | communication services; financials, health care
Position weightings | lack of position in Alphabet, Inc., Class A; lack of position in Alphabet, Inc., Class C; Apple, Inc.
Fund Performance
The following graph compares a $10,000 initial investment in the Fund to the index(es) listed below for the last 10 fiscal years of the Fund.
GROWTH OF $10,000
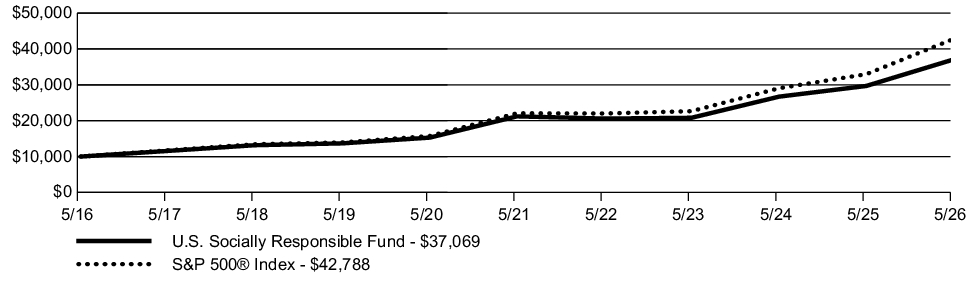
| AVERAGE ANNUAL TOTAL RETURN | 1 Year | 5 Year | 10 Year |
| U.S. Socially Responsible Fund | 24.86% | 11.81% | 14.00% |
| S&P 500® Index | 29.78% | 14.15% | 15.65% |
Key Fund Statistics
The following table outlines key fund statistics.
| Net assets | $420M |
| Total number of portfolio holdings | 162 |
| Total net advisory fee paid | $1.2M |
| Portfolio turnover rate during the reporting period | 8% |
Graphical Representation of Holdings
The information below represents the composition of the Fund's net assets as of the end of the period.
Top Industries*
| Semiconductors | 22.1% |
| Computers | 11.4% |
| Diversified Financial Services | 7.7% |
| Software | 7.3% |
| Internet | 5.8% |
| Telecommunications | 4.6% |
| Retail | 4.1% |
| Healthcare-Products | 3.0% |
| Commercial Services | 2.9% |
| REITS | 2.7% |
| Electric | 2.6% |
| Insurance | 2.2% |
| Biotechnology | 2.1% |
| Chemicals | 1.7% |
| Beverages | 1.6% |
Portfolio Composition
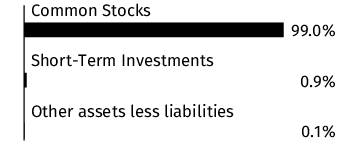
* Percentages exclude derivatives (other than purchased options), if any.
Material Fund Changes
This is a summary of certain changes to the Fund since the beginning of the period. Effective January 1, 2026, The Variable Annuity Life Insurance Company (“VALIC”), the investment adviser to the Fund, replaced SunAmerica Asset Management, LLC (“SunAmerica”) as the administrator of VALIC Company I (“VC I”) and SunAmerica became VC I’s sub-administrator. Additionally, on March 26, 2026, Corebridge Financial, Inc. and Equitable Holdings, Inc. (“EQH”) announced that they have entered into a definitive agreement to merge (the “Transaction”). The Transaction is expected to close by the end of 2026, subject to customary closing conditions, including the receipt of requisite regulatory approvals and approval of the shareholders of both Corebridge Financial, Inc. and EQH. Under the 1940 Act, an investment advisory agreement between a registered investment company, such as VC I, and its investment adviser must include a provision providing for its automatic termination upon its “assignment” (as defined in the 1940 Act). The closing of the Transaction may be deemed to cause an “assignment” of the Investment Advisory Agreement between VC I, on behalf of each Fund, and VALIC. As a result, the closing of the Transaction may cause the Investment Advisory Agreement to terminate automatically in accordance with its terms. It is anticipated that, prior to the closing of the Transaction, VC I’s Board of Directors (the “Board”) will consider a new investment advisory agreement between VC I, on behalf of each Fund, and VALIC. If approved by the Board, the new investment advisory agreement will be presented to the Funds’ shareholders for approval, and, if approved by shareholders, it will take effect upon the closing of the Transaction. For more comprehensive information, you may review the Fund’s next prospectus, which we expect to be available by September 30, 2026 at corebridgefinancial.com/rs/prospectus-and-reports/annuities#underlyingfunds. You can also request this information by calling Corebridge Financial, Inc. at 1-800-448-2542.
Changes in and Disagreements with Accountants
There were no changes in or disagreements with the accountants during the period.
This report describes changes to the Fund that occurred during the reporting period.
Fund Expenses
What were the Fund costs for the last year ?
(Based on a hypothetical $10,000 investment)
| Fund | Costs of a $10,000 investment | Costs paid as a percentage of a $10,000 investment |
| Capital Appreciation Fund* | $77 | 0.68% |
| * |
The expenses shown in the table are meant to highlight your ongoing costs only and do not reflect any fees and expenses that may be charged by the variable annuity contracts and variable life insurance policies (“Variable Contracts”) that invest in the Fund.
|
Management’s Discussion of Fund Performance
SUMMARY OF RESULTS
The Fund posted a return of 25.21% for the year ended May 31, 2026, compared to a return of 29.78% for the S&P 500® Index (a broad-based securities market index) and 28.66% for the Russell 1000® Growth Index (the "Performance Index"). U.S. large cap stocks delivered strong gains of roughly ~25–28%, extending the large-cap rally driven by mega-cap and growth stocks. Performance remained highly concentrated in the largest companies, particularly technology-oriented firms tied to AI and innovation themes, although early 2026 saw increased volatility and some rotation toward value amid geopolitical and rate uncertainty.
The following is a summary of the top contributors and detractors that impacted the Fund's performance during the year relative to the Performance Index.
TOP PERFORMANCE CONTRIBUTORS
Allocations in the following sectors | consumer staples; energy; real estate
Security selection in the following sectors | financials; health care; communication services
Position weightings | Advanced Micro Devices, Inc.; Alphabet, Inc., Class C; Microsoft Corp.
TOP PERFORMANCE DETRACTORS
In aggregate | sector allocations
Allocations in the following sectors | health care; financials; cash
Security selection in the following sectors | information technology; industrials
Position weightings | Adobe, Inc.; Alphabet, Inc., Class A; Apple, Inc.
Fund Performance
The following graph compares a $10,000 initial investment in the Fund to the index(es) listed below for the last 10 fiscal years of the Fund.
GROWTH OF $10,000
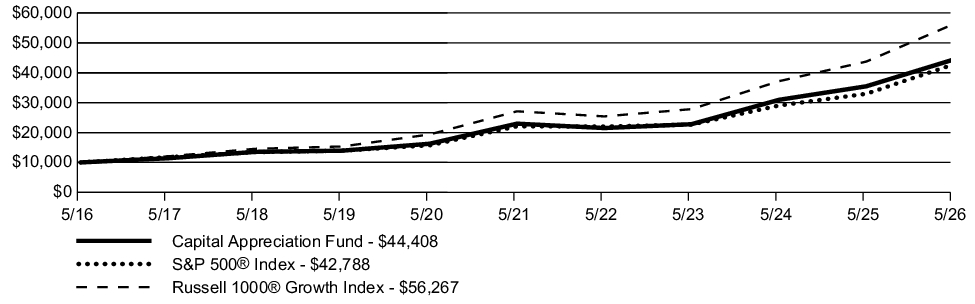
| AVERAGE ANNUAL TOTAL RETURN | 1 Year | 5 Year | 10 Year |
| Capital Appreciation Fund | 25.21% | 14.10% | 16.08% |
| S&P 500® Index | 29.78% | 14.15% | 15.65% |
| Russell 1000® Growth Index | 28.66% | 15.73% | 18.86% |
Key Fund Statistics
The following table outlines key fund statistics.
| Net assets | $458M |
| Total number of portfolio holdings | 65 |
| Total net advisory fee paid | $2.0M |
| Portfolio turnover rate during the reporting period | 62% |
Graphical Representation of Holdings
The information below represents the composition of the Fund's net assets as of the end of the period.
Top Industries*
| Semiconductors | 25.5% |
| Internet | 20.1% |
| Software | 10.3% |
| Computers | 10.0% |
| Pharmaceuticals | 6.8% |
| Diversified Financial Services | 3.8% |
| Telecommunications | 3.4% |
| Retail | 2.8% |
| Biotechnology | 2.7% |
| Auto Manufacturers | 2.3% |
| Insurance | 1.8% |
| Short-Term Investments | 1.7% |
| Electric | 1.0% |
| Healthcare-Services | 0.9% |
| Oil & Gas Services | 0.9% |
Portfolio Composition
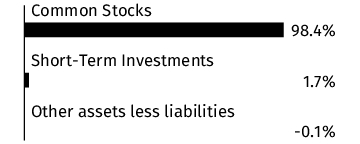
* Percentages exclude derivatives (other than purchased options), if any.
Material Fund Changes
This is a summary of certain changes to the Fund since the beginning of the period. Effective January 1, 2026, The Variable Annuity Life Insurance Company (“VALIC”), the investment adviser to the Fund, replaced SunAmerica Asset Management, LLC (“SunAmerica”) as the administrator of VALIC Company I (“VC I”) and SunAmerica became VC I’s sub-administrator. Additionally, on March 26, 2026, Corebridge Financial, Inc. and Equitable Holdings, Inc. (“EQH”) announced that they have entered into a definitive agreement to merge (the “Transaction”). The Transaction is expected to close by the end of 2026, subject to customary closing conditions, including the receipt of requisite regulatory approvals and approval of the shareholders of both Corebridge Financial, Inc. and EQH. Under the 1940 Act, an investment advisory agreement between a registered investment company, such as VC I, and its investment adviser must include a provision providing for its automatic termination upon its “assignment” (as defined in the 1940 Act). The closing of the Transaction may be deemed to cause an “assignment” of the Investment Advisory Agreement between VC I, on behalf of each Fund, and VALIC. As a result, the closing of the Transaction may cause the Investment Advisory Agreement to terminate automatically in accordance with its terms. It is anticipated that, prior to the closing of the Transaction, VC I’s Board of Directors (the “Board”) will consider a new investment advisory agreement between VC I, on behalf of each Fund, and VALIC. If approved by the Board, the new investment advisory agreement will be presented to the Funds’ shareholders for approval, and, if approved by shareholders, it will take effect upon the closing of the Transaction.
Effective September 29, 2025, the Fund’s investment strategies and techniques were revised to reflect the current investment strategies and techniques used by the Fund’s subadviser. As a result of these changes, ESG Investment Risk was removed as a principal risk. For more comprehensive information, you may review the Fund’s next prospectus, which we expect to be available by September 30, 2026 at corebridgefinancial.com/rs/prospectus-and-reports/annuities#underlyingfunds. You can also request this information by calling Corebridge Financial, Inc. at 1-800-448-2542.
Changes in and Disagreements with Accountants
There were no changes in or disagreements with the accountants during the period.
This report describes changes to the Fund that occurred during the reporting period.
Fund Expenses
What were the Fund costs for the last year ?
(Based on a hypothetical $10,000 investment)
| Fund | Costs of a $10,000 investment | Costs paid as a percentage of a $10,000 investment |
| Conservative Allocation Lifestyle Fund* | $14 | 0.13% |
| * |
The expenses shown in the table are meant to highlight your ongoing costs only and do not reflect any fees and expenses that may be charged by the variable annuity contracts and variable life insurance policies (“Variable Contracts”) that invest in the Fund. |
Management’s Discussion of Fund Performance
SUMMARY OF RESULTS
The Conservative Allocation Lifestyle Fund invests in a combination of affiliated funds, also known as “fund of funds.” The Fund does not select specific sectors, securities, or countries and thus these factors do not influence performance. Rather, the key indicators of performance are asset allocation and manager selection.
The Fund posted a return of 13.07% for the year ended May 31, 2026, compared to 29.78% for the S&P 500® Index (a broad-based securities market index) and 12.77% for the Blended Index (the "Performance Index") comprised of 26% Russell 3000® Index; 9% MSCI EAFE Index (net); 65% Bloomberg U.S. Aggregate Bond Index. Over the period, emerging market equities outperformed U.S. equities and international developed equities. Credit markets showed resilience, particularly in high yield segments.
The following is a summary of the top contributors and detractors that impacted the Fund's performance during the year relative to the Performance Index.
TOP PERFORMANCE CONTRIBUTORS
Allocations in the following funds | Core Bond Fund; High Yield Fund
TOP PERFORMANCE DETRACTORS
Allocations in the following funds | Large Cap Core Fund; Small Cap Growth Fund; Systematic Value Fund
Fund Performance
The following graph compares a $10,000 initial investment in the Fund to the index(es) listed below for the last 10 fiscal years of the Fund.
GROWTH OF $10,000
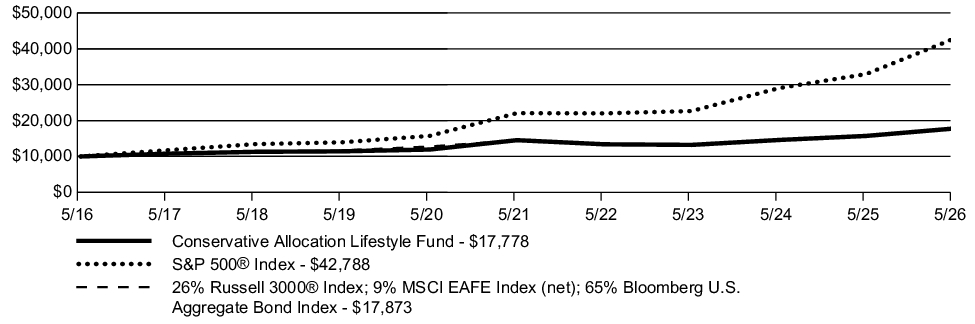
| AVERAGE ANNUAL TOTAL RETURN | 1 Year | 5 Year | 10 Year |
| Conservative Allocation Lifestyle Fund | 13.07% | 4.11% | 5.92% |
| S&P 500® Index | 29.78% | 14.15% | 15.65% |
| 26% Russell 3000® Index; 9% MSCI EAFE Index (net); 65% Bloomberg U.S. Aggregate Bond Index | 12.77% | 4.33% | 5.98% |
Key Fund Statistics
The following table outlines key fund statistics.
| Net assets | $283M |
| Total number of portfolio holdings | 12 |
| Total net advisory fee paid | $0.2M |
| Portfolio turnover rate during the reporting period | 17% |
Graphical Representation of Holdings
The information below represents the composition of the Fund's net assets as of the end of the period.
Portfolio Composition
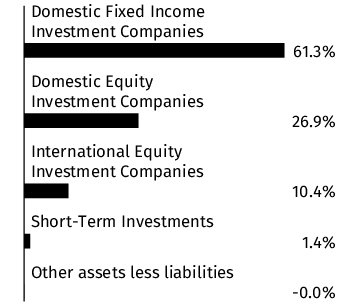
Material Fund Changes
This is a summary of certain changes to the Fund since the beginning of the period. Effective January 1, 2026, The Variable Annuity Life Insurance Company (“VALIC”), the investment adviser to the Fund, replaced SunAmerica Asset Management, LLC (“SunAmerica”) as the administrator of VALIC Company I (“VC I”) and SunAmerica became VC I’s sub-administrator. Additionally, on March 26, 2026, Corebridge Financial, Inc. and Equitable Holdings, Inc. (“EQH”) announced that they have entered into a definitive agreement to merge (the “Transaction”). The Transaction is expected to close by the end of 2026, subject to customary closing conditions, including the receipt of requisite regulatory approvals and approval of the shareholders of both Corebridge Financial, Inc. and EQH. Under the 1940 Act, an investment advisory agreement between a registered investment company, such as VC I, and its investment adviser must include a provision providing for its automatic termination upon its “assignment” (as defined in the 1940 Act). The closing of the Transaction may be deemed to cause an “assignment” of the Investment Advisory Agreement between VC I, on behalf of each Fund, and VALIC. As a result, the closing of the Transaction may cause the Investment Advisory Agreement to terminate automatically in accordance with its terms. It is anticipated that, prior to the closing of the Transaction, VC I’s Board of Directors (the “Board”) will consider a new investment advisory agreement between VC I, on behalf of each Fund, and VALIC. If approved by the Board, the new investment advisory agreement will be presented to the Funds’ shareholders for approval, and, if approved by shareholders, it will take effect upon the closing of the Transaction.
Effective September 29, 2025, the Fund changed its name from the “Conservative Growth Lifestyle Fund” to the “Conservative Allocation Lifestyle Fund.” For more comprehensive information, you may review the Fund’s next prospectus, which we expect to be available by September 30, 2026 at corebridgefinancial.com/rs/prospectus-and-reports/annuities#underlyingfunds. You can also request this information by calling Corebridge Financial, Inc. at 1-800-448-2542.
Changes in and Disagreements with Accountants
There were no changes in or disagreements with the accountants during the period.
This report describes changes to the Fund that occurred during the reporting period.
Fund Expenses
What were the Fund costs for the last year ?
(Based on a hypothetical $10,000 investment)
| Fund | Costs of a $10,000 investment | Costs paid as a percentage of a $10,000 investment |
| Core Bond Fund* | $49 | 0.48% |
| * |
The expenses shown in the table are meant to highlight your ongoing costs only and do not reflect any fees and expenses that may be charged by the variable annuity contracts and variable life insurance policies (“Variable Contracts”) that invest in the Fund.
|
Management’s Discussion of Fund Performance
SUMMARY OF RESULTS
The Fund posted a return of 5.58% for the year ending May 31, 2026, compared to a return of 5.13% for the Bloomberg U.S. Aggregate Bond Index (a broad-based securities market & "Performance Index"). Expectations for Fed policy shifts and increased Treasury supply led to a "bear steepening" of the yield curve, where longer-term yields increased more rapidly than short-term yields as investors demanded higher premiums for long-term fiscal risks. Credit spreads experienced temporary widening, peaking in early 2026 amid macroeconomic uncertainty. However, spreads tightened as resilient corporate fundamentals and solid global growth calmed markets.
The following is a summary, by subadviser, of the top contributors and detractors that impacted their portion of the Fund's performance during the year relative to the Performance Index.
TOP PERFORMANCE CONTRIBUTORS
J.P. Morgan Investment Management | Allocations in the following sectors: U.S. Treasuries; agency mortgage-backed securities; non-agency mortgage-backed securities. Security selection in the following sectors: corporate credit; U.S. Treasuries; asset-backed securities
PineBridge Investments, LLC | In aggregate: sector allocations; position weightings. Allocations in the following sectors: Treasuries; agency mortgage-backed securities; industrials. Security selection in the following sectors: industrials; financials; sovereign
TOP PERFORMANCE DETRACTORS
J.P. Morgan Investment Management | Allocations in the following sectors: cash; corporate credit; asset-backed securities. Security selection in the following sectors: agency mortgage-backed securities; U.S. agency
PineBridge Investments, LLC | Allocations in the following sectors: cash; local authority; commercial mortgage-backed securities. Security selection in the following sectors: asset-backed securities
Fund Performance
The following graph compares a $10,000 initial investment in the Fund to the index(es) listed below for the last 10 fiscal years of the Fund.
GROWTH OF $10,000
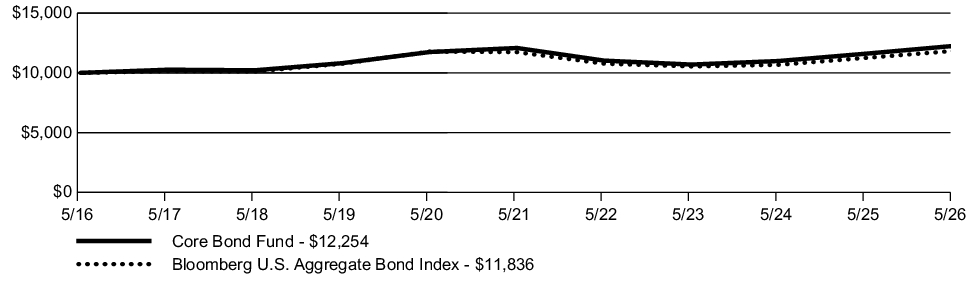
| AVERAGE ANNUAL TOTAL RETURN | 1 Year | 5 Year | 10 Year |
| Core Bond Fund | 5.58% | 0.28% | 2.05% |
| Bloomberg U.S. Aggregate Bond Index | 5.13% | 0.17% | 1.70% |
Key Fund Statistics
The following table outlines key fund statistics.
| Net assets | $2,612M |
| Total number of portfolio holdings | 1,843 |
| Total net advisory fee paid | $10.2M |
| Portfolio turnover rate during the reporting period | 30% |
Graphical Representation of Holdings
The information below represents the composition of the Fund as of the end of the period.
Top Industries*
(% of net assets)
(% of net assets)
| U.S. Government & Agency Obligations | 54.8% |
| Banks | 8.7% |
| Collateralized Mortgage Obligations | 4.5% |
| Short-Term Investments | 3.7% |
| Other Asset Backed Securities | 3.6% |
| Electric | 3.2% |
| Auto Loan Receivables | 2.8% |
| Foreign Government Obligations | 1.3% |
| Pipelines | 1.3% |
| Telecommunications | 1.2% |
| Pharmaceuticals | 1.2% |
| Diversified Financial Services | 0.9% |
| Oil & Gas | 0.9% |
| Healthcare-Services | 0.8% |
| Internet | 0.8% |
Portfolio Composition
(% of net assets)
(% of net assets)
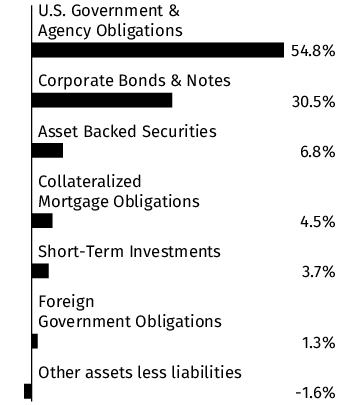
Credit Quality **
(% of total debt issues)
(% of total debt issues)
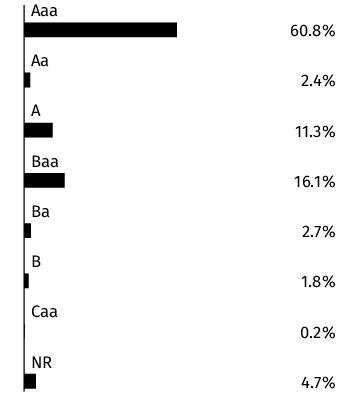
* Percentages exclude derivatives (other than purchased options), if any.
** Credit quality ratings shown above reflect the rating assigned by Moody's Investors Service, Inc. Where Moody's ratings are not available, we have used Standard & Poor's ratings. Unrated investments do not necessarily indicate low credit quality. Credit quality ratings are subject to change. Percentages exclude short-term securities.
Material Fund Changes
This is a summary of certain changes to the Fund since the beginning of the period. Effective January 1, 2026, The Variable Annuity Life Insurance Company (“VALIC”), the investment adviser to the Fund, replaced SunAmerica Asset Management, LLC (“SunAmerica”) as the administrator of VALIC Company I (“VC I”) and SunAmerica became VC I’s sub-administrator. Additionally, on March 26, 2026, Corebridge Financial, Inc. and Equitable Holdings, Inc. (“EQH”) announced that they have entered into a definitive agreement to merge (the “Transaction”). The Transaction is expected to close by the end of 2026, subject to customary closing conditions, including the receipt of requisite regulatory approvals and approval of the shareholders of both Corebridge Financial, Inc. and EQH. Under the 1940 Act, an investment advisory agreement between a registered investment company, such as VC I, and its investment adviser must include a provision providing for its automatic termination upon its “assignment” (as defined in the 1940 Act). The closing of the Transaction may be deemed to cause an “assignment” of the Investment Advisory Agreement between VC I, on behalf of each Fund, and VALIC. As a result, the closing of the Transaction may cause the Investment Advisory Agreement to terminate automatically in accordance with its terms. It is anticipated that, prior to the closing of the Transaction, VC I’s Board of Directors (the “Board”) will consider a new investment advisory agreement between VC I, on behalf of each Fund, and VALIC. If approved by the Board, the new investment advisory agreement will be presented to the Funds’ shareholders for approval, and, if approved by shareholders, it will take effect upon the closing of the Transaction. For more comprehensive information, you may review the Fund’s next prospectus, which we expect to be available by September 30, 2026 at corebridgefinancial.com/rs/prospectus-and-reports/annuities#underlyingfunds. You can also request this information by calling Corebridge Financial, Inc. at 1-800-448-2542.
Changes in and Disagreements with Accountants
There were no changes in or disagreements with the accountants during the period.
This report describes changes to the Fund that occurred during the reporting period.
Fund Expenses
What were the Fund costs for the last year ?
(Based on a hypothetical $10,000 investment)
| Fund | Costs of a $10,000 investment | Costs paid as a percentage of a $10,000 investment |
| High Yield Bond Fund* | $71 | 0.68% |
| * |
The expenses shown in the table are meant to highlight your ongoing costs only and do not reflect any fees and expenses that may be charged by the variable annuity contracts and variable life insurance policies (“Variable Contracts”) that invest in the Fund.
|
Management’s Discussion of Fund Performance
SUMMARY OF RESULTS
The Fund posted a return of 8.53% for the year ended May 31, 2026, compared to a return of 5.50% for the Bloomberg U.S. Universal Index (a broad-based securities market index) and 7.44% for the FTSE US High-Yield Market Index (the "Performance Index"). Over the twelve-month period spreads tightened by 57 basis points (bps) to 258 bps. Yields decreased by 43 bps to 7.29% according to the Bloomberg U.S. Corporate High Yield index.
The following is a summary of the top contributors and detractors that impacted the Fund's performance during the year relative to the Performance Index.
TOP PERFORMANCE CONTRIBUTORS
Allocations in the following industries | consumer products; transportation; paper
Security selection in the following industries | technology; financial institutions; retailers
Position weightings | Oracle Corp.; Hudson Pacific Properties LP; Terawulf, Inc.
TOP PERFORMANCE DETRACTORS
Allocations in the following industries | packaging; metal/mining, technology
Security selection in the following industries | building materials; metal/mining; leisure
Position weightings | lack of position in DISH Network Corp.; McAfee Corp.; KKR & Co., Inc.
Fund Performance
The following graph compares a $10,000 initial investment in the Fund to the index(es) listed below for the last 10 fiscal years of the Fund.
GROWTH OF $10,000
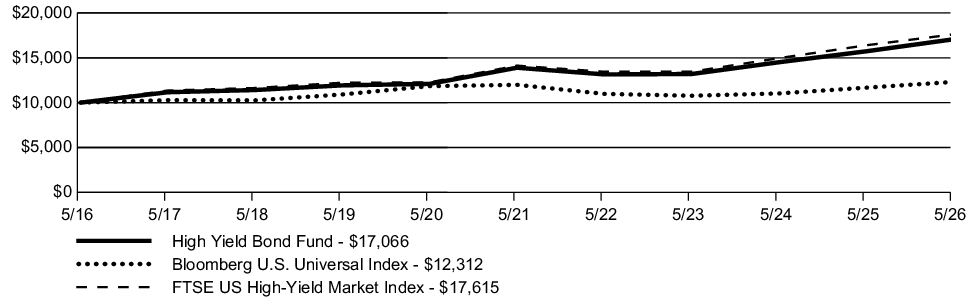
| AVERAGE ANNUAL TOTAL RETURN | 1 Year | 5 Year | 10 Year |
| High Yield Bond Fund | 8.53% | 4.20% | 5.49% |
| Bloomberg U.S. Universal Index | 5.50% | 0.54% | 2.10% |
| FTSE US High-Yield Market Index | 7.44% | 4.51% | 5.82% |
Key Fund Statistics
The following table outlines key fund statistics.
| Net assets | $365M |
| Total number of portfolio holdings | 352 |
| Total net advisory fee paid | $2.3M |
| Portfolio turnover rate during the reporting period | 56% |
Graphical Representation of Holdings
The information below represents the composition of the Fund as of the end of the period.
Top Industries*
(% of net assets)
(% of net assets)
| Media | 9.2% |
| Diversified Financial Services | 7.0% |
| Retail | 5.5% |
| Telecommunications | 5.0% |
| Software | 4.9% |
| Short-Term Investments | 4.9% |
| Commercial Services | 4.5% |
| Oil & Gas | 4.4% |
| Food | 3.8% |
| Packaging & Containers | 3.6% |
| Pipelines | 3.5% |
| REITS | 3.5% |
| Entertainment | 3.1% |
| Insurance | 3.1% |
| Healthcare-Services | 3.1% |
Portfolio Composition
(% of net assets)
(% of net assets)
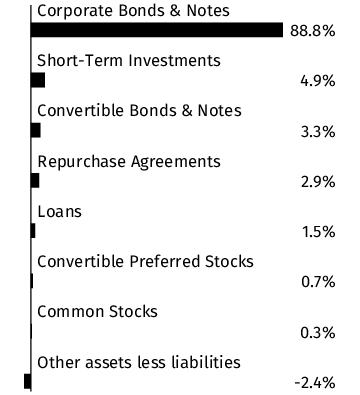
Credit Quality **
(% of total debt issues)
(% of total debt issues)
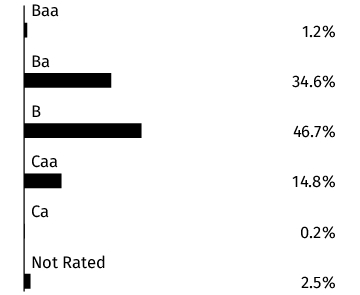
* Percentages exclude derivatives (other than purchased options), if any.
** Credit quality ratings shown above reflect the rating assigned by Moody's Investors Service, Inc. Where Moody's ratings are not available, we have used Standard & Poor's ratings. Unrated investments do not necessarily indicate low credit quality. Credit quality ratings are subject to change. Percentages exclude short-term securities.
Material Fund Changes
This is a summary of certain changes to the Fund since the beginning of the period. Effective January 1, 2026, The Variable Annuity Life Insurance Company (“VALIC”), the investment adviser to the Fund, replaced SunAmerica Asset Management, LLC (“SunAmerica”) as the administrator of VALIC Company I (“VC I”) and SunAmerica became VC I’s sub-administrator. Additionally, on March 26, 2026, Corebridge Financial, Inc. and Equitable Holdings, Inc. (“EQH”) announced that they have entered into a definitive agreement to merge (the “Transaction”). The Transaction is expected to close by the end of 2026, subject to customary closing conditions, including the receipt of requisite regulatory approvals and approval of the shareholders of both Corebridge Financial, Inc. and EQH. Under the 1940 Act, an investment advisory agreement between a registered investment company, such as VC I, and its investment adviser must include a provision providing for its automatic termination upon its “assignment” (as defined in the 1940 Act). The closing of the Transaction may be deemed to cause an “assignment” of the Investment Advisory Agreement between VC I, on behalf of each Fund, and VALIC. As a result, the closing of the Transaction may cause the Investment Advisory Agreement to terminate automatically in accordance with its terms. It is anticipated that, prior to the closing of the Transaction, VC I’s Board of Directors (the “Board”) will consider a new investment advisory agreement between VC I, on behalf of each Fund, and VALIC. If approved by the Board, the new investment advisory agreement will be presented to the Funds’ shareholders for approval, and, if approved by shareholders, it will take effect upon the closing of the Transaction. For more comprehensive information, you may review the Fund’s next prospectus, which we expect to be available by September 30, 2026 at corebridgefinancial.com/rs/prospectus-and-reports/annuities#underlyingfunds. You can also request this information by calling Corebridge Financial, Inc. at 1-800-448-2542.
Changes in and Disagreements with Accountants
There were no changes in or disagreements with the accountants during the period.
This report describes changes to the Fund that occurred during the reporting period.
Fund Expenses
What were the Fund costs for the last year ?
(Based on a hypothetical $10,000 investment)
| Fund | Costs of a $10,000 investment | Costs paid as a percentage of a $10,000 investment |
| International Opportunities Fund* | $115 | 1.05% |
| * |
The expenses shown in the table are meant to highlight your ongoing costs only and do not reflect any fees and expenses that may be charged by the variable annuity contracts and variable life insurance policies (“Variable Contracts”) that invest in the Fund. |
Management’s Discussion of Fund Performance
SUMMARY OF RESULTS
The Fund posted a return of 18.79% for the year ended May 31, 2026, compared to a return of 32.77% for the MSCI ACWI ex USA Index (net) (a broad-based securities market) and 29.74% for the MSCI ACWI ex USA SMID Cap Index (net) (the "Performance Index"). Over the period, international stocks outperformed U.S. stocks, largely due to broader market leadership and currency tailwinds. Within international markets, growth stocks underperformed value stocks as performance was driven by strength in cyclical sectors such as financials and industrials sectors. Quality stocks rebounded during the period, though still lagged the broaderequity markets.
The following is a summary, by subadviser, of the top contributors and detractors that impacted their portion of the Fund's performance during the year relative to the Performance Index.
TOP PERFORMANCE CONTRIBUTORS
Invesco Advisers, Inc. | Allocations in the following sectors: information technology; real estate; consumer discretionary. Security selection in the following sectors: consumer staples; real estate. Position weightings: Disco Corp.; Mycronic AB; Sprott, Inc. Exposure to the following countries: India; Brazil; Ireland
Wellington Management Company, LLP | In aggregate: position weightings; country allocations. Allocations in the following sectors: consumer staples; health care; communication services. Security selection in the following sectors: information technology; materials; communication services. Position weightings: Chroma ATE, Inc.; Unimicron Technology Corp.; ASPEED Technology, Inc. Exposure to the following countries: India; Taiwan; Japan
TOP PERFORMANCE DETRACTORS
Invesco Advisers, Inc. | In aggregate: country allocations; position weightings. Allocations in the following sectors: materials; consumer staples; health care. Security selection in the following sectors: information technology; industrials; health care. Position weightings: Carl Zeiss Meditec AG; Partners Group Holding AG; CTS Eventim AG & Co. KGaA. Exposure to the following countries: Japan; Germany; Taiwan
Wellington Management Company, LLP | Allocations in the following sectors: real estate; consumer discretionary; cash. Security selection in the following sectors: industrials; consumer staples; consumer discretionary. Position weightings: Fiverr International, Ltd.; SimilarWeb, Ltd.; lack of position in Samsung Electro-Mechanics Co., Ltd. Exposure to the following countries: United Kingdom; lack of exposure to South Korea; Netherlands
Fund Performance
The following graph compares a $10,000 initial investment in the Fund to the index(es) listed below for the last 10 fiscal years of the Fund.
GROWTH OF $10,000
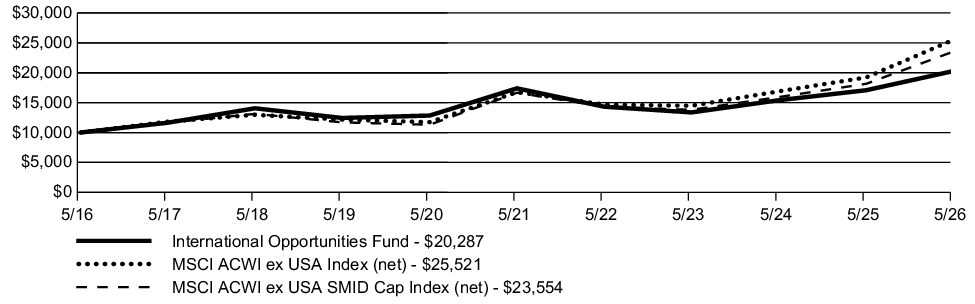
| AVERAGE ANNUAL TOTAL RETURN | 1 Year | 5 Year | 10 Year |
| International Opportunities Fund | 18.79% | 3.13% | 7.33% |
| MSCI ACWI ex USA Index (net) | 32.77% | 8.77% | 9.82% |
| MSCI ACWI ex USA SMID Cap Index (net) | 29.74% | 7.17% | 8.94% |
Key Fund Statistics
The following table outlines key fund statistics.
| Net assets | $298M |
| Total number of portfolio holdings | 315 |
| Total net advisory fee paid | $2.7M |
| Portfolio turnover rate during the reporting period | 105% |
Graphical Representation of Holdings
The information below represents the composition of the Fund's net assets as of the end of the period.
Top Industries*
| Banks | 7.1% |
| Machinery-Diversified | 6.5% |
| Retail | 5.1% |
| Electronics | 4.2% |
| Computers | 3.9% |
| Commercial Services | 3.9% |
| Food | 3.7% |
| Miscellaneous Manufacturing | 3.6% |
| Engineering & Construction | 3.2% |
| Semiconductors | 3.2% |
| Healthcare-Products | 3.0% |
| Software | 2.8% |
| Chemicals | 2.5% |
| Mining | 2.5% |
| Real Estate | 2.4% |
Portfolio Composition
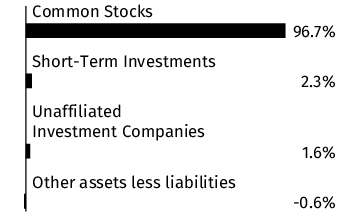
Country
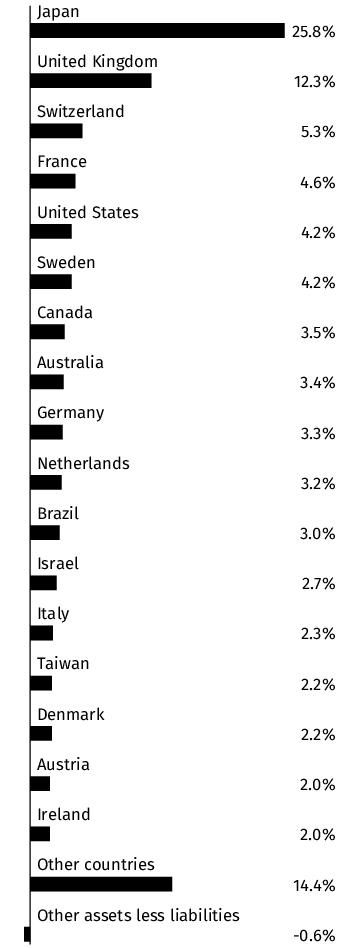
* Percentages exclude derivatives (other than purchased options), if any.
Material Fund Changes
This is a summary of certain changes to the Fund since the beginning of the period. Effective January 1, 2026, The Variable Annuity Life Insurance Company (“VALIC”), the investment adviser to the Fund, replaced SunAmerica Asset Management, LLC (“SunAmerica”) as the administrator of VALIC Company I (“VC I”) and SunAmerica became VC I’s sub-administrator. Additionally, on March 26, 2026, Corebridge Financial, Inc. and Equitable Holdings, Inc. (“EQH”) announced that they have entered into a definitive agreement to merge (the “Transaction”). The Transaction is expected to close by the end of 2026, subject to customary closing conditions, including the receipt of requisite regulatory approvals and approval of the shareholders of both Corebridge Financial, Inc. and EQH. Under the 1940 Act, an investment advisory agreement between a registered investment company, such as VC I, and its investment adviser must include a provision providing for its automatic termination upon its “assignment” (as defined in the 1940 Act). The closing of the Transaction may be deemed to cause an “assignment” of the Investment Advisory Agreement between VC I, on behalf of each Fund, and VALIC. As a result, the closing of the Transaction may cause the Investment Advisory Agreement to terminate automatically in accordance with its terms. It is anticipated that, prior to the closing of the Transaction, VC I’s Board of Directors (the “Board”) will consider a new investment advisory agreement between VC I, on behalf of each Fund, and VALIC. If approved by the Board, the new investment advisory agreement will be presented to the Funds’ shareholders for approval, and, if approved by shareholders, it will take effect upon the closing of the Transaction.
Effective September 29, 2025, European Investment Risk was added as a principal risk of the Fund. For more comprehensive information, you may review the Fund’s next prospectus, which we expect to be available by September 30, 2026 at corebridgefinancial.com/rs/prospectus-and-reports/annuities#underlyingfunds. You can also request this information by calling Corebridge Financial, Inc. at 1-800-448-2542.
Changes in and Disagreements with Accountants
There were no changes in or disagreements with the accountants during the period.
This report describes changes to the Fund that occurred during the reporting period.
Fund Expenses
What were the Fund costs for the last year ?
(Based on a hypothetical $10,000 investment)
| Fund | Costs of a $10,000 investment | Costs paid as a percentage of a $10,000 investment |
| Mid Cap Value Fund* | $91 | 0.83% |
| * |
The expenses shown in the table are meant to highlight your ongoing costs only and do not reflect any fees and expenses that may be charged by the variable annuity contracts and variable life insurance policies (“Variable Contracts”) that invest in the Fund. |
Management’s Discussion of Fund Performance
SUMMARY OF RESULTS
The Fund posted a return of 20.29% for the year ended May 31, 2026, compared to a return of 29.45% for the Russell 3000® Index (a broad-based securities market index) and 27.21% for the Russell Midcap® Value Index (the "Performance Index"). During the period value indices generally outperformed growth, and small company stocks outpaced larger capitalization names. The technology sector was the largest source of strength in the benchmark. During the period, mid cap value stocks outperformed mid cap growth stocks when measured using the Russell Midcap Value and Growth indices. Mid cap stocks underperformed both small cap and large cap stocks, as measured by the Russell Midcap, Russell 2000, and Russell 1000 indices respectively.
The following is a summary, by subadviser, of the top contributors and detractors that impacted their portion of the Fund's performance during the year relative to the Performance Index.
TOP PERFORMANCE CONTRIBUTORS
Boston Partners Global Investors, Inc. | Allocations in the following sectors: real estate; utilities; communication services. Security selection in the following sectors: real estate; energy; materials. Position weightings: Flex, Ltd.; TechniPFMC PLC; Keysight Technologies, Inc.
Wellington Management Company, LLP | In aggregate: sector allocations. Allocations in the following sectors: information technology; consumer staples; utilities. Security selection in the following sectors: consumer discretionary; industrials; financials. Position weightings: MKS, Inc.; Flex, Ltd.; Viavi Solutions, Inc.
TOP PERFORMANCE DETRACTORS
Boston Partners Global Investors, Inc. | In aggregate: position weightings. Allocations in the following sectors: information technology; consumer discretionary; cash. Security selection in the following sectors: information technology; health care; consumer discretionary. Position weightings: LPL Financial Holdings, Inc.; Check Point Software Technologies, Ltd.; CDW Corp.
Wellington Management Company, LLP | In aggregate: position weightings. Allocations in the following sectors: consumer discretionary; financials; materials. Security selection in the following sectors: information technology; health care; materials. Position weightings: Sandisk Corp.; lack of position in Ciena Corp.; Lumentum Holdings, Inc.
Fund Performance
The following graph compares a $10,000 initial investment in the Fund to the index(es) listed below for the last 10 fiscal years of the Fund.
GROWTH OF $10,000
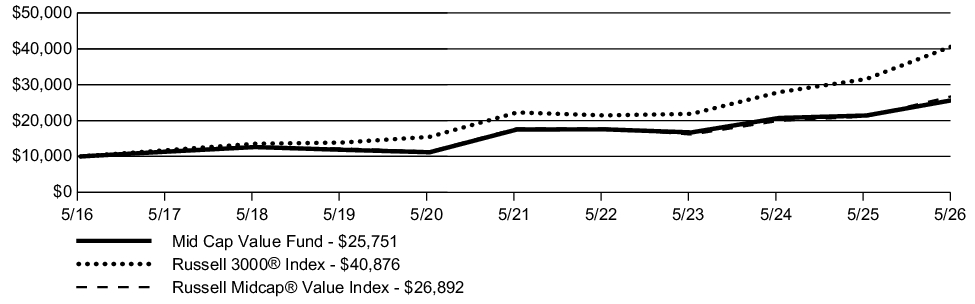
| AVERAGE ANNUAL TOTAL RETURN | 1 Year | 5 Year | 10 Year |
| Mid Cap Value Fund | 20.29% | 8.01% | 9.92% |
| Russell 3000® Index | 29.45% | 12.92% | 15.12% |
| Russell Midcap® Value Index | 27.21% | 8.57% | 10.40% |
Key Fund Statistics
The following table outlines key fund statistics.
| Net assets | $682M |
| Total number of portfolio holdings | 209 |
| Total net advisory fee paid | $4.4M |
| Portfolio turnover rate during the reporting period | 112% |
Graphical Representation of Holdings
The information below represents the composition of the Fund's net assets as of the end of the period.
Top Industries*
| Diversified Financial Services | 7.8% |
| Banks | 6.7% |
| REITS | 6.3% |
| Oil & Gas | 4.7% |
| Retail | 4.1% |
| Computers | 4.0% |
| Electronics | 3.8% |
| Transportation | 3.6% |
| Building Materials | 3.3% |
| Healthcare-Products | 3.1% |
| Healthcare-Services | 3.0% |
| Aerospace/Defense | 2.8% |
| Semiconductors | 2.7% |
| Commercial Services | 2.7% |
| Machinery-Diversified | 2.5% |
Portfolio Composition
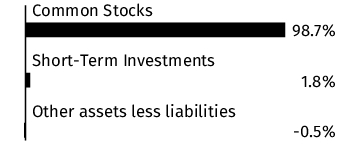
* Percentages exclude derivatives (other than purchased options), if any.
Material Fund Changes
This is a summary of certain changes to the Fund since the beginning of the period. Effective January 1, 2026, The Variable Annuity Life Insurance Company (“VALIC”), the investment adviser to the Fund, replaced SunAmerica Asset Management, LLC (“SunAmerica”) as the administrator of VALIC Company I (“VC I”) and SunAmerica became VC I’s sub-administrator. Additionally, on March 26, 2026, Corebridge Financial, Inc. and Equitable Holdings, Inc. (“EQH”) announced that they have entered into a definitive agreement to merge (the “Transaction”). The Transaction is expected to close by the end of 2026, subject to customary closing conditions, including the receipt of requisite regulatory approvals and approval of the shareholders of both Corebridge Financial, Inc. and EQH. Under the 1940 Act, an investment advisory agreement between a registered investment company, such as VC I, and its investment adviser must include a provision providing for its automatic termination upon its “assignment” (as defined in the 1940 Act). The closing of the Transaction may be deemed to cause an “assignment” of the Investment Advisory Agreement between VC I, on behalf of each Fund, and VALIC. As a result, the closing of the Transaction may cause the Investment Advisory Agreement to terminate automatically in accordance with its terms. It is anticipated that, prior to the closing of the Transaction, VC I’s Board of Directors (the “Board”) will consider a new investment advisory agreement between VC I, on behalf of each Fund, and VALIC. If approved by the Board, the new investment advisory agreement will be presented to the Funds’ shareholders for approval, and, if approved by shareholders, it will take effect upon the closing of the Transaction. For more comprehensive information, you may review the Fund’s next prospectus, which we expect to be available by September 30, 2026 at corebridgefinancial.com/rs/prospectus-and-reports/annuities#underlyingfunds. You can also request this information by calling Corebridge Financial, Inc. at 1-800-448-2542.
Changes in and Disagreements with Accountants
There were no changes in or disagreements with the accountants during the period.
This report describes changes to the Fund that occurred during the reporting period.
Fund Expenses
What were the Fund costs for the last year ?
(Based on a hypothetical $10,000 investment)
| Fund | Costs of a $10,000 investment | Costs paid as a percentage of a $10,000 investment |
| Moderate Allocation Lifestyle Fund* | $11 | 0.10% |
| * |
The expenses shown in the table are meant to highlight your ongoing costs only and do not reflect any fees and expenses that may be charged by the variable annuity contracts and variable life insurance policies (“Variable Contracts”) that invest in the Fund. |
Management’s Discussion of Fund Performance
SUMMARY OF RESULTS
The Moderate Allocation Lifestyle Fund invests in a combination of affiliated funds, also known as “fund of funds.” The Fund does not select specific sectors, securities, or countries and thus these factors do not influence performance. Rather, the key indicators of performance are asset allocation and manager selection.
The Fund posted a return of 17.39% for the year ended May 31, 2026, compared to 29.78% for the S&P 500® Index (a broad-based securities market index) and 17.29% for the Blended Index (the "Performance Index") comprised of 41% Russell 3000® Index; 14% MSCI EAFE Index (net); 45% Bloomberg U.S. Aggregate Bond Index. Over the period, emerging market equities outperformed U.S. equities and international developed equities. Credit markets showed resilience, particularly in high yield segments.
The following is a summary of the top contributors and detractors that impacted the Fund's performance during the year relative to the Performance Index.
TOP PERFORMANCE CONTRIBUTORS
Allocations in the following funds | Core Bond Fund; High Yield Fund
TOP PERFORMANCE DETRACTORS
Allocations in the following funds | Large Cap Core Fund; Small Cap Growth Fund; Systematic Value Fund
Fund Performance
The following graph compares a $10,000 initial investment in the Fund to the index(es) listed below for the last 10 fiscal years of the Fund.
GROWTH OF $10,000
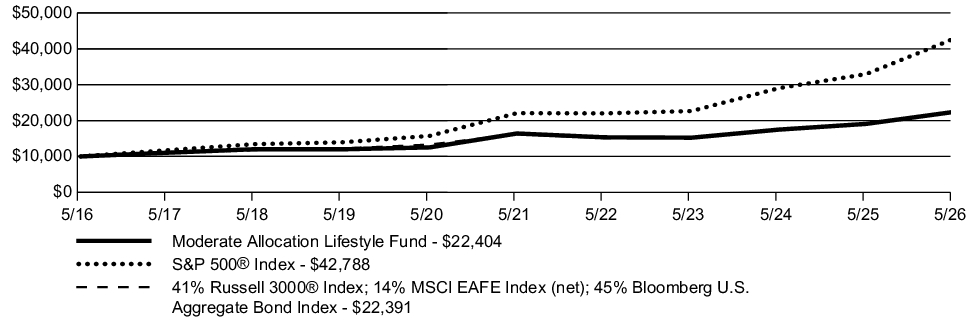
| AVERAGE ANNUAL TOTAL RETURN | 1 Year | 5 Year | 10 Year |
| Moderate Allocation Lifestyle Fund | 17.39% | 6.44% | 8.40% |
| S&P 500® Index | 29.78% | 14.15% | 15.65% |
| 41% Russell 3000® Index; 14% MSCI EAFE Index (net); 45% Bloomberg U.S. Aggregate Bond Index | 17.29% | 6.69% | 8.39% |
Key Fund Statistics
The following table outlines key fund statistics.
| Net assets | $1,042M |
| Total number of portfolio holdings | 12 |
| Total net advisory fee paid | $0.7M |
| Portfolio turnover rate during the reporting period | 21% |
Graphical Representation of Holdings
The information below represents the composition of the Fund's net assets as of the end of the period.
Portfolio Composition
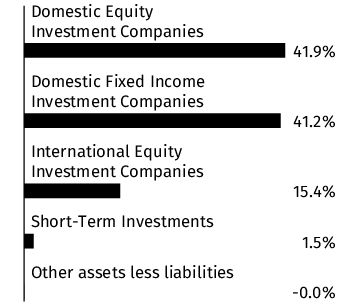
Material Fund Changes
This is a summary of certain changes to the Fund since the beginning of the period. Effective January 1, 2026, The Variable Annuity Life Insurance Company (“VALIC”), the investment adviser to the Fund, replaced SunAmerica Asset Management, LLC (“SunAmerica”) as the administrator of VALIC Company I (“VC I”) and SunAmerica became VC I’s sub-administrator. Additionally, on March 26, 2026, Corebridge Financial, Inc. and Equitable Holdings, Inc. (“EQH”) announced that they have entered into a definitive agreement to merge (the “Transaction”). The Transaction is expected to close by the end of 2026, subject to customary closing conditions, including the receipt of requisite regulatory approvals and approval of the shareholders of both Corebridge Financial, Inc. and EQH. Under the 1940 Act, an investment advisory agreement between a registered investment company, such as VC I, and its investment adviser must include a provision providing for its automatic termination upon its “assignment” (as defined in the 1940 Act). The closing of the Transaction may be deemed to cause an “assignment” of the Investment Advisory Agreement between VC I, on behalf of each Fund, and VALIC. As a result, the closing of the Transaction may cause the Investment Advisory Agreement to terminate automatically in accordance with its terms. It is anticipated that, prior to the closing of the Transaction, VC I’s Board of Directors (the “Board”) will consider a new investment advisory agreement between VC I, on behalf of each Fund, and VALIC. If approved by the Board, the new investment advisory agreement will be presented to the Funds’ shareholders for approval, and, if approved by shareholders, it will take effect upon the closing of the Transaction.
Effective September 29, 2025, the Fund changed its name from the “Moderate Growth Lifestyle Fund” to the “Moderate Allocation Lifestyle Fund." For more comprehensive information, you may review the Fund’s next prospectus, which we expect to be available by September 30, 2026 at corebridgefinancial.com/rs/prospectus-and-reports/annuities#underlyingfunds. You can also request this information by calling Corebridge Financial, Inc. at 1-800-448-2542.
Changes in and Disagreements with Accountants
There were no changes in or disagreements with the accountants during the period.
This report describes changes to the Fund that occurred during the reporting period.
Fund Expenses
What were the Fund costs for the last year ?
(Based on a hypothetical $10,000 investment)
| Fund | Costs of a $10,000 investment | Costs paid as a percentage of a $10,000 investment |
| Small Cap Value Fund* | $103 | 0.85% |
| * |
The expenses shown in the table are meant to highlight your ongoing costs only and do not reflect any fees and expenses that may be charged by the variable annuity contracts and variable life insurance policies (“Variable Contracts”) that invest in the Fund. |
Management’s Discussion of Fund Performance
SUMMARY OF RESULTS
The Fund posted a return of 42.14% for the year ended May 31, 2026, compared to a return of 29.45% for the Russell 3000® Index (a broad-based securities market index) and 44.36% for the Russell 2000® Value Index (the "Performance Index"). Over the period, U.S. large-cap equities underperformed small-cap equities.
The following is a summary of the top contributors and detractors that impacted the Fund's performance during the year relative to the Performance Index.
TOP PERFORMANCE CONTRIBUTORS
Allocations in the following sectors | software & services; basic materials; cash
Security selection in the following sectors | basic materials; retail; finance
Position weightings | Modine Manufacturing Co.; MYR Group, Inc.; Erasca, Inc.
TOP PERFORMANCE DETRACTORS
In aggregate | position weightings
Allocations in the following sectors | systems hardware; pharmaceuticals; telecommunications
Security selection in the following sectors | pharmaceuticals; software & services; energy
Position weightings | MaxLinear, Inc.; DNOW, Inc.; ABM Industries, Inc.
Fund Performance
The following graph compares a $10,000 initial investment in the Fund to the index(es) listed below for the last 10 fiscal years of the Fund.
GROWTH OF $10,000
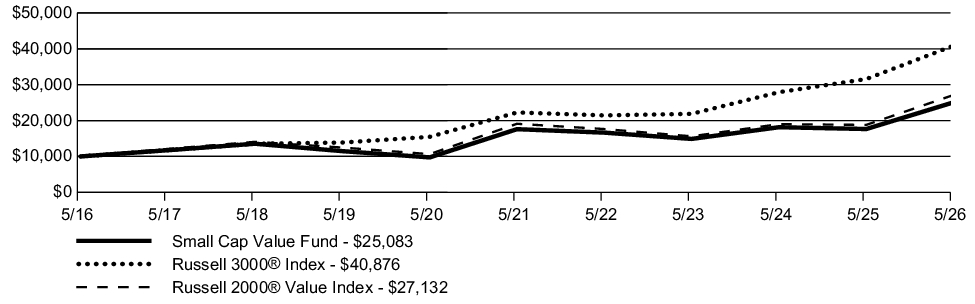
| AVERAGE ANNUAL TOTAL RETURN | 1 Year | 5 Year | 10 Year |
| Small Cap Value Fund | 42.14% | 7.34% | 9.63% |
| Russell 3000® Index | 29.45% | 12.92% | 15.12% |
| Russell 2000® Value Index | 44.36% | 7.27% | 10.50% |
Key Fund Statistics
The following table outlines key fund statistics.
| Net assets | $252M |
| Total number of portfolio holdings | 473 |
| Total net advisory fee paid | $1.6M |
| Portfolio turnover rate during the reporting period | 80% |
Graphical Representation of Holdings
The information below represents the composition of the Fund's net assets as of the end of the period.
Top Industries*
| Banks | 15.0% |
| REITS | 9.7% |
| Biotechnology | 5.3% |
| Oil & Gas | 4.3% |
| Investment Companies | 3.8% |
| Semiconductors | 3.4% |
| Electronics | 3.3% |
| Repurchase Agreements | 2.8% |
| Insurance | 2.8% |
| Electric | 2.7% |
| Auto Parts & Equipment | 2.5% |
| Diversified Financial Services | 2.4% |
| Retail | 2.4% |
| Transportation | 2.4% |
| Software | 2.3% |
Portfolio Composition
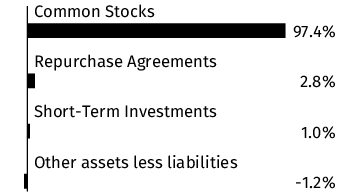
* Percentages exclude derivatives (other than purchased options), if any.
Material Fund Changes
This is a summary of certain changes to the Fund since the beginning of the period. Effective January 1, 2026, The Variable Annuity Life Insurance Company (“VALIC”), the investment adviser to the Fund, replaced SunAmerica Asset Management, LLC (“SunAmerica”) as the administrator of VALIC Company I (“VC I”) and SunAmerica became VC I’s sub-administrator. Additionally, on March 26, 2026, Corebridge Financial, Inc. and Equitable Holdings, Inc. (“EQH”) announced that they have entered into a definitive agreement to merge (the “Transaction”). The Transaction is expected to close by the end of 2026, subject to customary closing conditions, including the receipt of requisite regulatory approvals and approval of the shareholders of both Corebridge Financial, Inc. and EQH. Under the 1940 Act, an investment advisory agreement between a registered investment company, such as VC I, and its investment adviser must include a provision providing for its automatic termination upon its “assignment” (as defined in the 1940 Act). The closing of the Transaction may be deemed to cause an “assignment” of the Investment Advisory Agreement between VC I, on behalf of each Fund, and VALIC. As a result, the closing of the Transaction may cause the Investment Advisory Agreement to terminate automatically in accordance with its terms. It is anticipated that, prior to the closing of the Transaction, VC I’s Board of Directors (the “Board”) will consider a new investment advisory agreement between VC I, on behalf of each Fund, and VALIC. If approved by the Board, the new investment advisory agreement will be presented to the Funds’ shareholders for approval, and, if approved by shareholders, it will take effect upon the closing of the Transaction. For more comprehensive information, you may review the Fund’s next prospectus, which we expect to be available by September 30, 2026 at corebridgefinancial.com/rs/prospectus-and-reports/annuities#underlyingfunds. You can also request this information by calling Corebridge Financial, Inc. at 1-800-448-2542.
Changes in and Disagreements with Accountants
There were no changes in or disagreements with the accountants during the period.
This report describes changes to the Fund that occurred during the reporting period.
Fund Expenses
What were the Fund costs for the last year ?
(Based on a hypothetical $10,000 investment)
| Fund | Costs of a $10,000 investment | Costs paid as a percentage of a $10,000 investment |
| Small Cap Growth Fund* | $99 | 0.88% |
| * |
The expenses shown in the table are meant to highlight your ongoing costs only and do not reflect any fees and expenses that may be charged by the variable annuity contracts and variable life insurance policies (“Variable Contracts”) that invest in the Fund.
|
Management’s Discussion of Fund Performance
SUMMARY OF RESULTS
The Fund posted a return of 25.99% for the year ended May 31, 2026, compared to a return of 29.45% for the Russell 3000® Index (a broad-based securities market index) and 41.87% for the Russell 2000® Growth Index (the "Performance Index"). Over the period, U.S. small-cap equities outperformed large-cap equities. Value stocks outperformed growth in the small-cap space.
The following is a summary of the top contributors and detractors that impacted the Fund's performance during the year relative to the Performance Index.
TOP PERFORMANCE CONTRIBUTORS
Allocations in the following sectors | financials; industrials; communication services
Security selection in the following sectors | utilities; consumer staples; communication services
Position weightings | Sterling Infrastructure, Inc.; MACOM Technology Solutions Holdings, Inc.; MKS, Inc.
TOP PERFORMANCE DETRACTORS
In aggregate | position weightings
Allocations in the following sectors | utilities; cash; energy
Security selection in the following sectors | industrials; financials; consumer discretionary
Position weightings | lack of position in Bloom Energy Corp., Class A; Klaviyo, Inc., Class A; Q2 Holdings, Inc.
Fund Performance
The following graph compares a $10,000 initial investment in the Fund to the index(es) listed below for the last 10 fiscal years of the Fund.
GROWTH OF $10,000
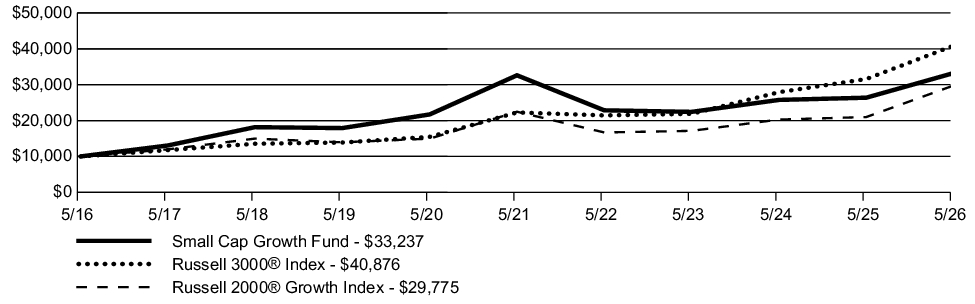
| AVERAGE ANNUAL TOTAL RETURN | 1 Year | 5 Year | 10 Year |
| Small Cap Growth Fund | 25.99% | 0.37% | 12.76% |
| Russell 3000® Index | 29.45% | 12.92% | 15.12% |
| Russell 2000® Growth Index | 41.87% | 5.80% | 11.53% |
Key Fund Statistics
The following table outlines key fund statistics.
| Net assets | $540M |
| Total number of portfolio holdings | 153 |
| Total net advisory fee paid | $3.9M |
| Portfolio turnover rate during the reporting period | 99% |
Graphical Representation of Holdings
The information below represents the composition of the Fund's net assets as of the end of the period.
Top Industries*
| Biotechnology | 10.3% |
| Semiconductors | 8.0% |
| Engineering & Construction | 6.1% |
| Aerospace/Defense | 5.1% |
| Software | 5.1% |
| Electronics | 4.8% |
| Healthcare-Services | 4.1% |
| Machinery-Diversified | 3.4% |
| Diversified Financial Services | 3.3% |
| Healthcare-Products | 3.3% |
| Retail | 3.2% |
| Internet | 3.0% |
| Electric | 2.9% |
| Telecommunications | 2.8% |
| Pharmaceuticals | 2.8% |
Portfolio Composition
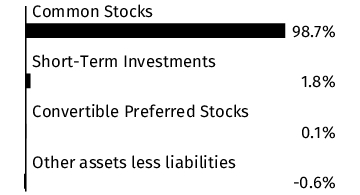
* Percentages exclude derivatives (other than purchased options), if any.
Material Fund Changes
This is a summary of certain changes to the Fund since the beginning of the period. Effective January 1, 2026, The Variable Annuity Life Insurance Company (“VALIC”), the investment adviser to the Fund, replaced SunAmerica Asset Management, LLC (“SunAmerica”) as the administrator of VALIC Company I (“VC I”) and SunAmerica became VC I’s sub-administrator. Additionally, on March 26, 2026, Corebridge Financial, Inc. and Equitable Holdings, Inc. (“EQH”) announced that they have entered into a definitive agreement to merge (the “Transaction”). The Transaction is expected to close by the end of 2026, subject to customary closing conditions, including the receipt of requisite regulatory approvals and approval of the shareholders of both Corebridge Financial, Inc. and EQH. Under the 1940 Act, an investment advisory agreement between a registered investment company, such as VC I, and its investment adviser must include a provision providing for its automatic termination upon its “assignment” (as defined in the 1940 Act). The closing of the Transaction may be deemed to cause an “assignment” of the Investment Advisory Agreement between VC I, on behalf of each Fund, and VALIC. As a result, the closing of the Transaction may cause the Investment Advisory Agreement to terminate automatically in accordance with its terms. It is anticipated that, prior to the closing of the Transaction, VC I’s Board of Directors (the “Board”) will consider a new investment advisory agreement between VC I, on behalf of each Fund, and VALIC. If approved by the Board, the new investment advisory agreement will be presented to the Funds’ shareholders for approval, and, if approved by shareholders, it will take effect upon the closing of the Transaction. For more comprehensive information, you may review the Fund’s next prospectus, which we expect to be available by September 30, 2026 at corebridgefinancial.com/rs/prospectus-and-reports/annuities#underlyingfunds. You can also request this information by calling Corebridge Financial, Inc. at 1-800-448-2542.
Changes in and Disagreements with Accountants
There were no changes in or disagreements with the accountants during the period.
| [1] | The expenses shown in the table are meant to highlight your ongoing costs only and do not reflect any fees and expenses that may be charged by the variable annuity contracts and variable life insurance policies (“Variable Contracts”) that invest in the Fund. |
| [2] | The expenses shown in the table are meant to highlight your ongoing costs only and do not reflect any fees and expenses that may be charged by the variable annuity contracts and variable life insurance policies (“Variable Contracts”) that invest in the Fund. |
| [3] | The expenses shown in the table are meant to highlight your ongoing costs only and do not reflect any fees and expenses that may be charged by the variable annuity contracts and variable life insurance policies (“Variable Contracts”) that invest in the Fund. |
| [4] | The expenses shown in the table are meant to highlight your ongoing costs only and do not reflect any fees and expenses that may be charged by the variable annuity contracts and variable life insurance policies (“Variable Contracts”) that invest in the Fund. |
| [5] | The expenses shown in the table are meant to highlight your ongoing costs only and do not reflect any fees and expenses that may be charged by the variable annuity contracts and variable life insurance policies (“Variable Contracts”) that invest in the Fund. |
| [6] | The expenses shown in the table are meant to highlight your ongoing costs only and do not reflect any fees and expenses that may be charged by the variable annuity contracts and variable life insurance policies (“Variable Contracts”) that invest in the Fund. |
| [7] | The expenses shown in the table are meant to highlight your ongoing costs only and do not reflect any fees and expenses that may be charged by the variable annuity contracts and variable life insurance policies (“Variable Contracts”) that invest in the Fund. |
| [8] | The expenses shown in the table are meant to highlight your ongoing costs only and do not reflect any fees and expenses that may be charged by the variable annuity contracts and variable life insurance policies (“Variable Contracts”) that invest in the Fund. |
| [9] | The expenses shown in the table are meant to highlight your ongoing costs only and do not reflect any fees and expenses that may be charged by the variable annuity contracts and variable life insurance policies (“Variable Contracts”) that invest in the Fund. |
| [10] | The expenses shown in the table are meant to highlight your ongoing costs only and do not reflect any fees and expenses that may be charged by the variable annuity contracts and variable life insurance policies (“Variable Contracts”) that invest in the Fund. |
| [11] | The expenses shown in the table are meant to highlight your ongoing costs only and do not reflect any fees and expenses that may be charged by the variable annuity contracts and variable life insurance policies (“Variable Contracts”) that invest in the Fund. |
| [12] | The expenses shown in the table are meant to highlight your ongoing costs only and do not reflect any fees and expenses that may be charged by the variable annuity contracts and variable life insurance policies (“Variable Contracts”) that invest in the Fund. |
| [13] | The expenses shown in the table are meant to highlight your ongoing costs only and do not reflect any fees and expenses that may be charged by the variable annuity contracts and variable life insurance policies (“Variable Contracts”) that invest in the Fund. |
| [14] | The expenses shown in the table are meant to highlight your ongoing costs only and do not reflect any fees and expenses that may be charged by the variable annuity contracts and variable life insurance policies (“Variable Contracts”) that invest in the Fund. |
| [15] | The expenses shown in the table are meant to highlight your ongoing costs only and do not reflect any fees and expenses that may be charged by the variable annuity contracts and variable life insurance policies (“Variable Contracts”) that invest in the Fund. |
| [16] | The expenses shown in the table are meant to highlight your ongoing costs only and do not reflect any fees and expenses that may be charged by the variable annuity contracts and variable life insurance policies (“Variable Contracts”) that invest in the Fund. |
| [17] | The expenses shown in the table are meant to highlight your ongoing costs only and do not reflect any fees and expenses that may be charged by the variable annuity contracts and variable life insurance policies (“Variable Contracts”) that invest in the Fund. |
| [18] | The expenses shown in the table are meant to highlight your ongoing costs only and do not reflect any fees and expenses that may be charged by the variable annuity contracts and variable life insurance policies (“Variable Contracts”) that invest in the Fund. |
| [19] | The expenses shown in the table are meant to highlight your ongoing costs only and do not reflect any fees and expenses that may be charged by the variable annuity contracts and variable life insurance policies (“Variable Contracts”) that invest in the Fund. |
| [20] | The expenses shown in the table are meant to highlight your ongoing costs only and do not reflect any fees and expenses that may be charged by the variable annuity contracts and variable life insurance policies (“Variable Contracts”) that invest in the Fund. |
| [21] | The expenses shown in the table are meant to highlight your ongoing costs only and do not reflect any fees and expenses that may be charged by the variable annuity contracts and variable life insurance policies (“Variable Contracts”) that invest in the Fund. |
| [22] | The expenses shown in the table are meant to highlight your ongoing costs only and do not reflect any fees and expenses that may be charged by the variable annuity contracts and variable life insurance policies (“Variable Contracts”) that invest in the Fund. |
| [23] | The expenses shown in the table are meant to highlight your ongoing costs only and do not reflect any fees and expenses that may be charged by the variable annuity contracts and variable life insurance policies (“Variable Contracts”) that invest in the Fund. |
| [24] | The expenses shown in the table are meant to highlight your ongoing costs only and do not reflect any fees and expenses that may be charged by the variable annuity contracts and variable life insurance policies (“Variable Contracts”) that invest in the Fund. |
| [25] | The expenses shown in the table are meant to highlight your ongoing costs only and do not reflect any fees and expenses that may be charged by the variable annuity contracts and variable life insurance policies (“Variable Contracts”) that invest in the Fund. |
| [26] | The expenses shown in the table are meant to highlight your ongoing costs only and do not reflect any fees and expenses that may be charged by the variable annuity contracts and variable life insurance policies (“Variable Contracts”) that invest in the Fund. |
| [27] | The expenses shown in the table are meant to highlight your ongoing costs only and do not reflect any fees and expenses that may be charged by the variable annuity contracts and variable life insurance policies (“Variable Contracts”) that invest in the Fund. |
| [28] | The expenses shown in the table are meant to highlight your ongoing costs only and do not reflect any fees and expenses that may be charged by the variable annuity contracts and variable life insurance policies (“Variable Contracts”) that invest in the Fund. |
| [29] | The expenses shown in the table are meant to highlight your ongoing costs only and do not reflect any fees and expenses that may be charged by the variable annuity contracts and variable life insurance policies (“Variable Contracts”) that invest in the Fund. |
| [30] | The expenses shown in the table are meant to highlight your ongoing costs only and do not reflect any fees and expenses that may be charged by the variable annuity contracts and variable life insurance policies (“Variable Contracts”) that invest in the Fund. |
| [31] | The expenses shown in the table are meant to highlight your ongoing costs only and do not reflect any fees and expenses that may be charged by the variable annuity contracts and variable life insurance policies (“Variable Contracts”) that invest in the Fund. |
| [32] | The expenses shown in the table are meant to highlight your ongoing costs only and do not reflect any fees and expenses that may be charged by the variable annuity contracts and variable life insurance policies (“Variable Contracts”) that invest in the Fund. |
| [33] | The expenses shown in the table are meant to highlight your ongoing costs only and do not reflect any fees and expenses that may be charged by the variable annuity contracts and variable life insurance policies (“Variable Contracts”) that invest in the Fund. |
| [34] | The expenses shown in the table are meant to highlight your ongoing costs only and do not reflect any fees and expenses that may be charged by the variable annuity contracts and variable life insurance policies (“Variable Contracts”) that invest in the Fund. |
| [35] | The expenses shown in the table are meant to highlight your ongoing costs only and do not reflect any fees and expenses that may be charged by the variable annuity contracts and variable life insurance policies (“Variable Contracts”) that invest in the Fund. |
| [36] | The expenses shown in the table are meant to highlight your ongoing costs only and do not reflect any fees and expenses that may be charged by the variable annuity contracts and variable life insurance policies (“Variable Contracts”) that invest in the Fund. |