Building a high-performing, growth-focused, sterile injectable CDMO August 2026 Exhibit 99.2
2 Important Information Regarding Forward-Looking Statements This presentation contains forward-looking statements regarding future events and our future results that are subject to the safe harbor created under the Private Securities Litigation Reform Act of 1995 and other safe harbors under the Securities Act of 1933 and the Securities Exchange Act of 1934. Words such as “anticipate”, “estimate”, “expect”, “project”, “aim,” “designed to,” “plan”, “intend”, “believe”, “may”, “might”, “will”, “should”, “can have”, “likely” and similar expressions are used to identify forward-looking statements. In addition, all statements regarding our future financial and operating performance and strategy, including our goals of achieving a 12+% revenue CAGR and increasing Adjusted EBITDA margins to more than 25%; positioning of the Company for sustained, long-term growth; key initiatives that are expected to continue to drive margin improvement; financial guidance for 2026 and longer-term outlook; three-pronged strategy for growth comprised of maximizing our existing customer business, advancing programs currently within our late-stage development pipeline towards commercialization, and winning impactful new business that will continue to fill our project pipeline; anticipated revenue growth and improved capacity utilization; annual production capacity; growing reputation as a partner-of-choice for customers seeking exceptional quality and compliance; the future diversification of our customer base and reduction of dependency on any one customer; visibility and nature of leading revenue indicators; revenue potential and launch timelines from our late-stage development portfolio; continued efficiency and cost containment discipline; increasing demand for our capabilities; the talent and experience in place to execute our growth strategy; significant inflection point in existing commercial customer demand beginning in 2027; potential upside to contractual minimums; diversification of our customer base; expected benefits of our ERP system; attracting new high-value business; aggressive and achievable growth strategy of both top and bottom line; high growth market expected to increase 100% by 2030; capital investments enable clear path to scale; and use of cash resources or need to raise additional financing in 2026 or in the near-term, are forward- looking statements. All forward-looking statements involve certain risks and uncertainties that could cause actual results to differ materially, including such factors as, among others, the timing and amount of future expenses, revenue, net income (loss), Adjusted EBITDA, cash flow and capital requirements, and timing and availability of and the need for additional financing; our ability to maintain or expand our relationships with our current customers, including the impact of changes in consumer demand for the products we manufacture for our customers; our ability to grow and diversify our business with new customers, including the potential loss of development customers if they do not receive required funding or regulatory approvals or for other reasons; our ability to comply with covenants under our credit agreements and to pay required interest and principal payments when due; our ability to fund or pay redemptions of shares of the outstanding Series A Convertible Preferred Stock in accordance with their terms; our ability to raise additional capital for ongoing needs, including through equity financing, debt financing, collaborations, strategic alliances or licensing arrangements; the impact of macroeconomic events or circumstances on our operations and financial performance, including inflation, tariffs, interest rates, social unrest and global instability; the performance of our third-party suppliers; pharmaceutical industry market forces that may impact our customers’ success and continued demand for the products we produce for those customers; our ability to recruit or retain key scientific, technical, business development, and management personnel and our executive officers; our ability to comply with stringent U.S. and foreign government regulation in the manufacture of pharmaceutical products, including current Good Manufacturing Practice, or cGMP; the outcome and cost of existing and any new litigation or regulatory proceedings; and other risk factors set forth from time to time in the company’s filings with the SEC, including, but not limited to, the Annual Report on Form 10-KT for the transition period ended December 31, 2025 (the “December 2025 10-KT”). For additional information about factors that could cause actual results to differ materially from those described in the forward- looking statements, please refer to our filings with the SEC, including the risk factors contained in the December 2025 10-KT. Forward-looking statements represent management’s current expectations as of the date hereof and are inherently uncertain. Except as required by law, we do not undertake any obligation to update forward-looking statements made by us to reflect subsequent events or circumstances.
3 Non-GAAP Financial Measures This presentation contains non-GAAP financial information, including Adjusted EBITDA and free cash flow. The company has included a reconciliation of Adjusted EBITDA to net income or loss and operating cash flows to free cash flow, the most directly comparable financial measures calculated in accordance with GAAP; please see “Reconciliation of Non-GAAP Financial Measures” later in this presentation for such reconciliations. For the periods presented herein, we defined Adjusted EBITDA as net income or loss before (i) interest expense, net of interest income, (ii) income tax expense or benefit, (iii) depreciation, (iv) stock-based compensation, (v) change in fair value of debt derivatives, (vi) franchise tax, (vii) reorganization costs, (viii) restructuring costs or recovery, and (ix) loss on sale or disposal of equipment. We define free cash flow as operating cash flows reduced by capital expenditures. The company has disclosed these non-GAAP financial measures to supplement its consolidated financial statements presented in accordance with GAAP. These non-GAAP financial measures exclude/include certain items that are included in the company’s results reported in accordance with GAAP because we believe they are not reflective of our core operations or indicative of our ongoing operations. Management believes these non-GAAP financial measures provide useful additional information to investors about trends in the company’s operations and are useful for period-over-period comparisons. Investors, as well as management, use Adjusted EBITDA and free cash flow, in addition to GAAP financial measures, to monitor trends in the company’s operations, understand and compare operating results across accounting periods, for financial and operational decision making, for planning and forecasting purposes, and with respect to Adjusted EBITDA as a measure of performance for compensation decisions. These non-GAAP financial measures should not be considered in isolation or as a substitute for the comparable GAAP measures. In addition, these non-GAAP financial measures may not be the same as similar measures provided by other companies due to the potential differences in methods of calculation and items being excluded/included. These non-GAAP financial measures should be read in conjunction with the company’s consolidated financial statements presented in accordance with GAAP. The company is reaffirming its revenue and Adjusted EBITDA guidance for calendar year 2026. The company is not providing forward-looking guidance for U.S. GAAP net loss or a quantitative reconciliation of its 2026 Adjusted EBITDA to the most directly comparable U.S. GAAP measure, U.S. GAAP net loss, because it is unable to predict with reasonable certainty the ultimate outcome of certain significant items, including restructuring expenses, reorganization expenses, asset impairments, litigation settlements and other contingencies, changes to the fair value of the debt derivative liability, certain other gains or losses, and income tax accounting, as certain of these items have not occurred, are out of the company's control and/or cannot be reasonably predicted without unreasonable effort. These items are uncertain, depend on various factors, and could have a material impact on U.S. GAAP reported results for the guidance period.
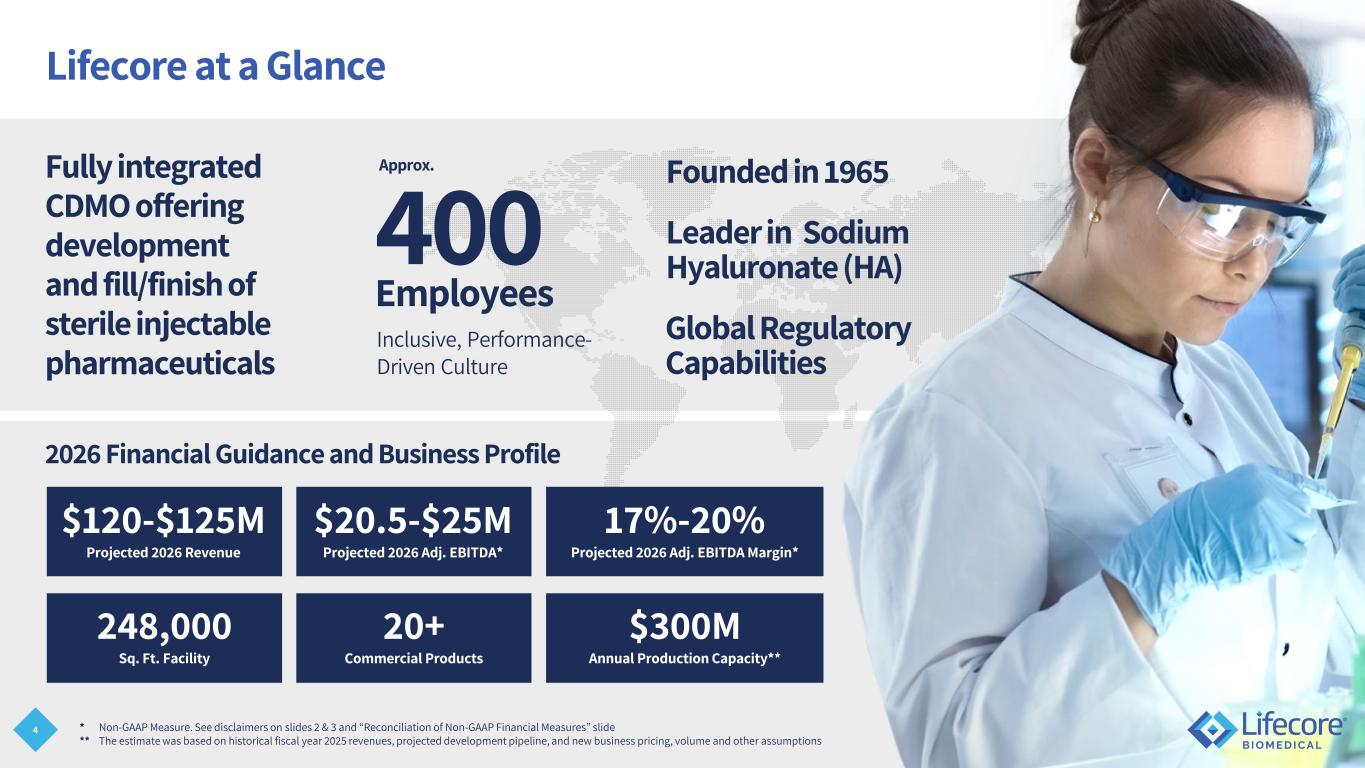
4 Lifecore at a Glance 400 Employees Inclusive, Performance- Driven Culture Fully integrated CDMO offering development and fill/finish of sterile injectable pharmaceuticals Leader in Sodium Hyaluronate (HA) Global Regulatory Capabilities Founded in 1965 * Non-GAAP Measure. See disclaimers on slides 2 & 3 and “Reconciliation of Non-GAAP Financial Measures” slide ** The estimate was based on historical fiscal year 2025 revenues, projected development pipeline, and new business pricing, volume and other assumptions Approx. 248,000 Sq. Ft. Facility $300M Annual Production Capacity** 20+ Commercial Products 2026 Financial Guidance and Business Profile $120-$125M Projected 2026 Revenue $20.5-$25M Projected 2026 Adj. EBITDA* 17%-20% Projected 2026 Adj. EBITDA Margin*
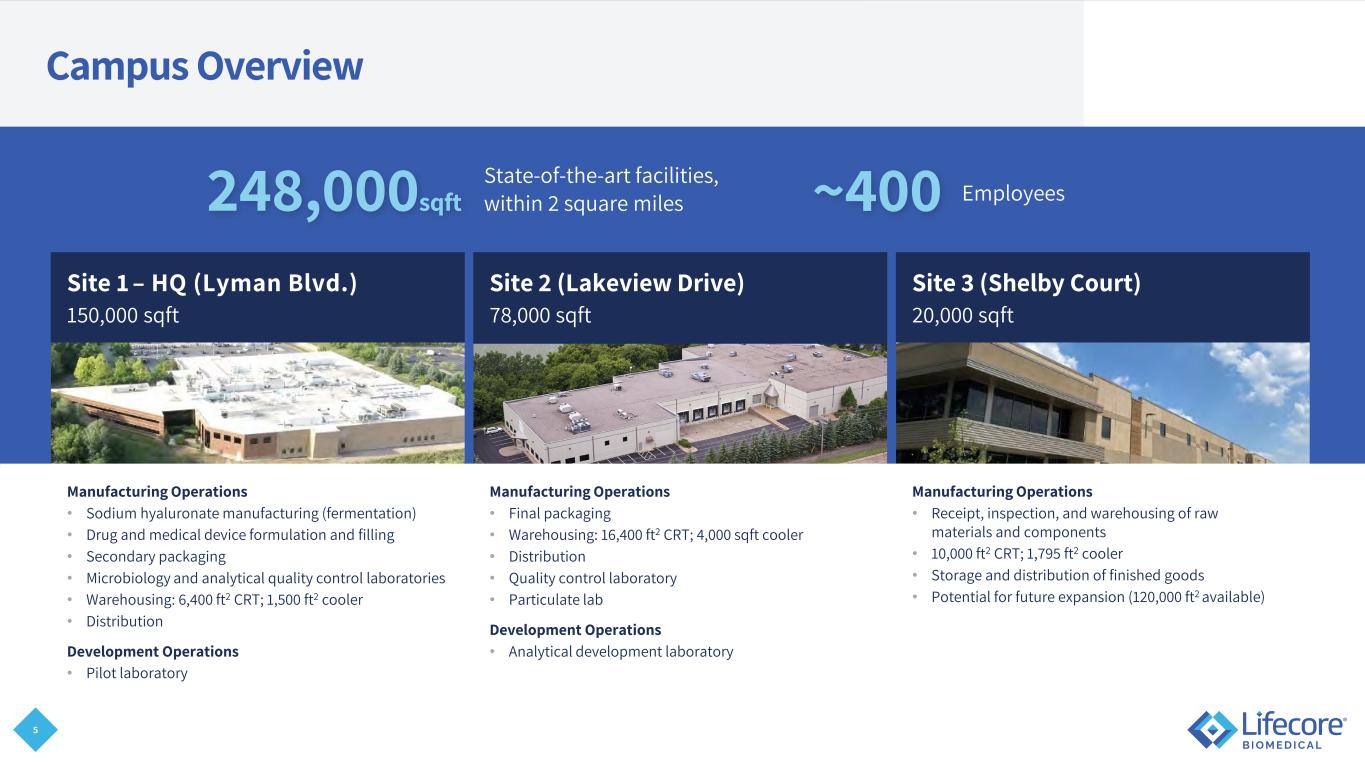
5 Campus Overview Site 1 – HQ (Lyman Blvd.) 150,000 sqft Site 2 (Lakeview Drive) 78,000 sqft Site 3 (Shelby Court) 20,000 sqft Manufacturing Operations • Sodium hyaluronate manufacturing (fermentation) • Drug and medical device formulation and filling • Secondary packaging • Microbiology and analytical quality control laboratories • Warehousing: 6,400 ft2 CRT; 1,500 ft2 cooler • Distribution Development Operations • Pilot laboratory Manufacturing Operations • Final packaging • Warehousing: 16,400 ft2 CRT; 4,000 sqft cooler • Distribution • Quality control laboratory • Particulate lab Development Operations • Analytical development laboratory Manufacturing Operations • Receipt, inspection, and warehousing of raw materials and components • 10,000 ft2 CRT; 1,795 ft2 cooler • Storage and distribution of finished goods • Potential for future expansion (120,000 ft2 available) 248,000sqft ~400State-of-the-art facilities, within 2 square miles Employees
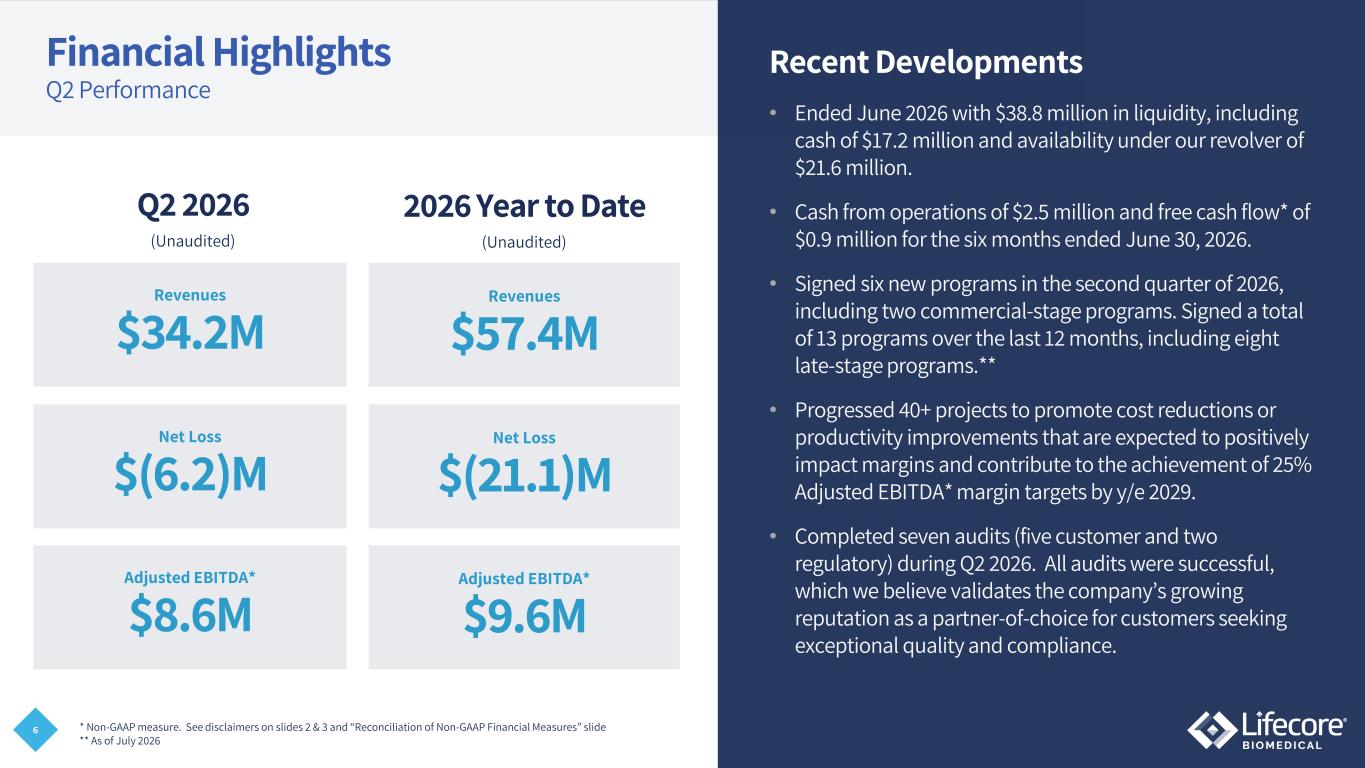
6 Financial Highlights Q2 Performance Recent Developments • Ended June 2026 with $38.8 million in liquidity, including cash of $17.2 million and availability under our revolver of $21.6 million. • Cash from operations of $2.5 million and free cash flow* of $0.9 million for the six months ended June 30, 2026. • Signed six new programs in the second quarter of 2026, including two commercial-stage programs. Signed a total of 13 programs over the last 12 months, including eight late-stage programs.** • Progressed 40+ projects to promote cost reductions or productivity improvements that are expected to positively impact margins and contribute to the achievement of 25% Adjusted EBITDA* margin targets by y/e 2029. • Completed seven audits (five customer and two regulatory) during Q2 2026. All audits were successful, which we believe validates the company’s growing reputation as a partner-of-choice for customers seeking exceptional quality and compliance. * Non-GAAP measure. See disclaimers on slides 2 & 3 and “Reconciliation of Non-GAAP Financial Measures” slide ** As of July 2026 Q2 2026 $34.2M Revenues $(6.2)M Net Loss $8.6M Adjusted EBITDA* (Unaudited) 2026 Year to Date $57.4M Revenues $(21.1)M Net Loss $9.6M Adjusted EBITDA* (Unaudited)
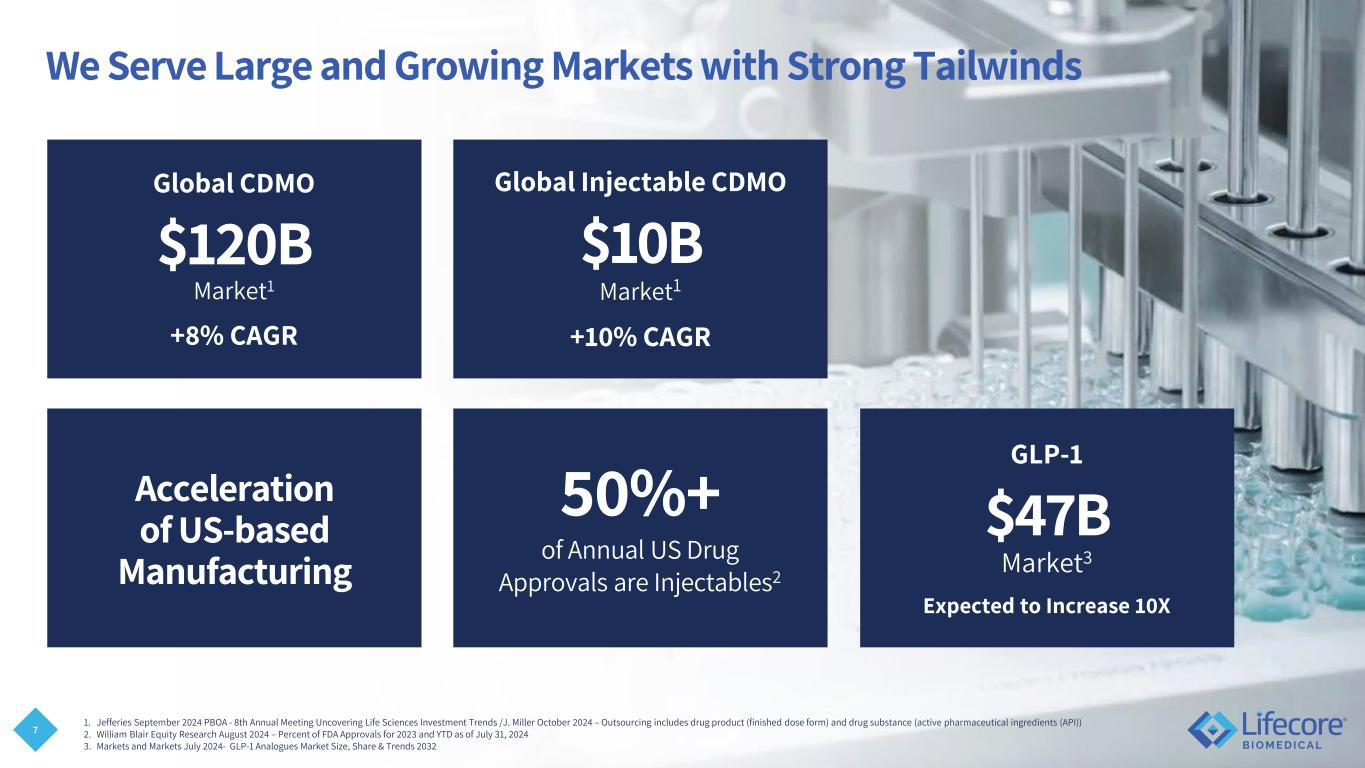
7 We Serve Large and Growing Markets with Strong Tailwinds Global Injectable CDMO $10B Market1 +10% CAGR Acceleration of US-based Manufacturing Global CDMO $120B Market1 +8% CAGR 50%+ of Annual US Drug Approvals are Injectables2 GLP-1 $47B Market3 Expected to Increase 10X 1. Jefferies September 2024 PBOA - 8th Annual Meeting Uncovering Life Sciences Investment Trends /J. Miller October 2024 – Outsourcing includes drug product (finished dose form) and drug substance (active pharmaceutical ingredients (API)) 2. William Blair Equity Research August 2024 – Percent of FDA Approvals for 2023 and YTD as of July 31, 2024 3. Markets and Markets July 2024- GLP-1 Analogues Market Size, Share & Trends 2032
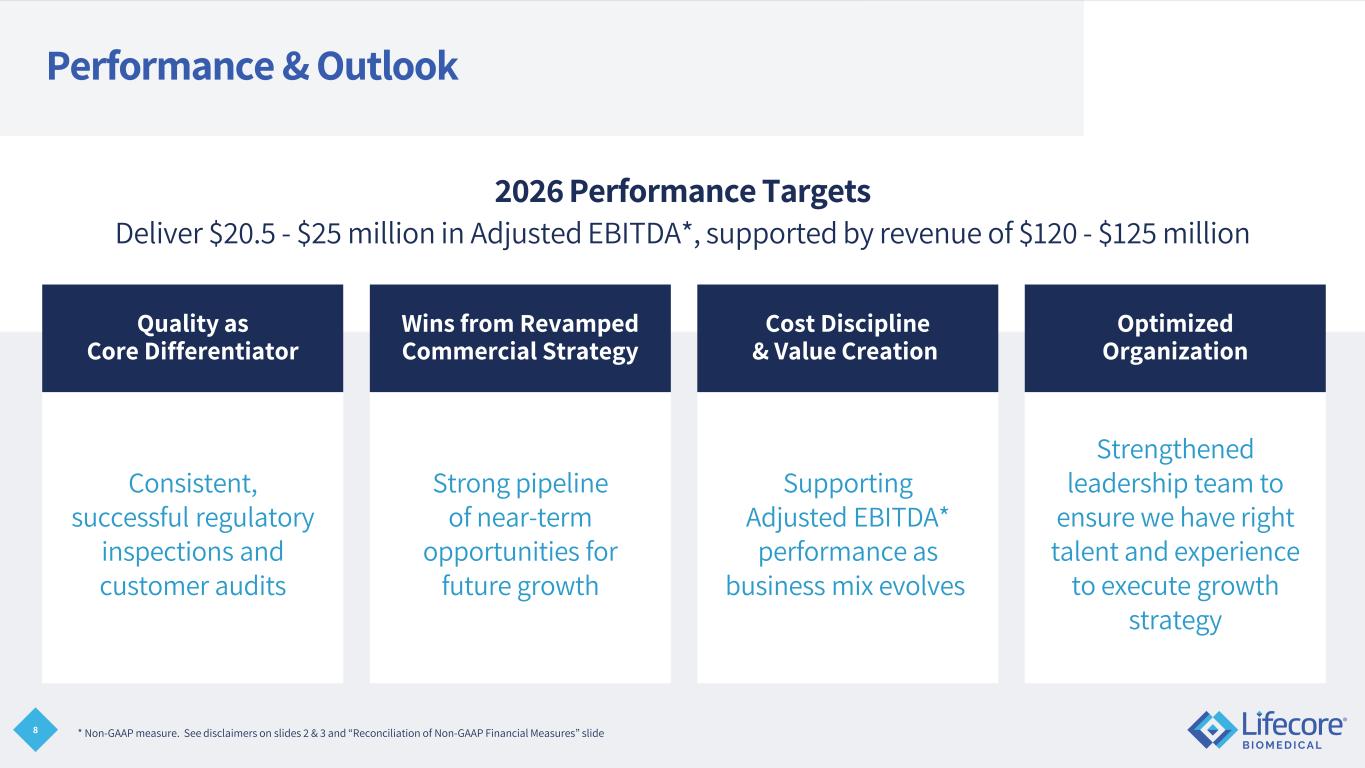
8 Consistent, successful regulatory inspections and customer audits Strong pipeline of near-term opportunities for future growth Supporting Adjusted EBITDA* performance as business mix evolves Strengthened leadership team to ensure we have right talent and experience to execute growth strategy Performance & Outlook Quality as Core Differentiator Wins from Revamped Commercial Strategy Cost Discipline & Value Creation Optimized Organization 2026 Performance Targets Deliver $20.5 - $25 million in Adjusted EBITDA*, supported by revenue of $120 - $125 million * Non-GAAP measure. See disclaimers on slides 2 & 3 and “Reconciliation of Non-GAAP Financial Measures” slide
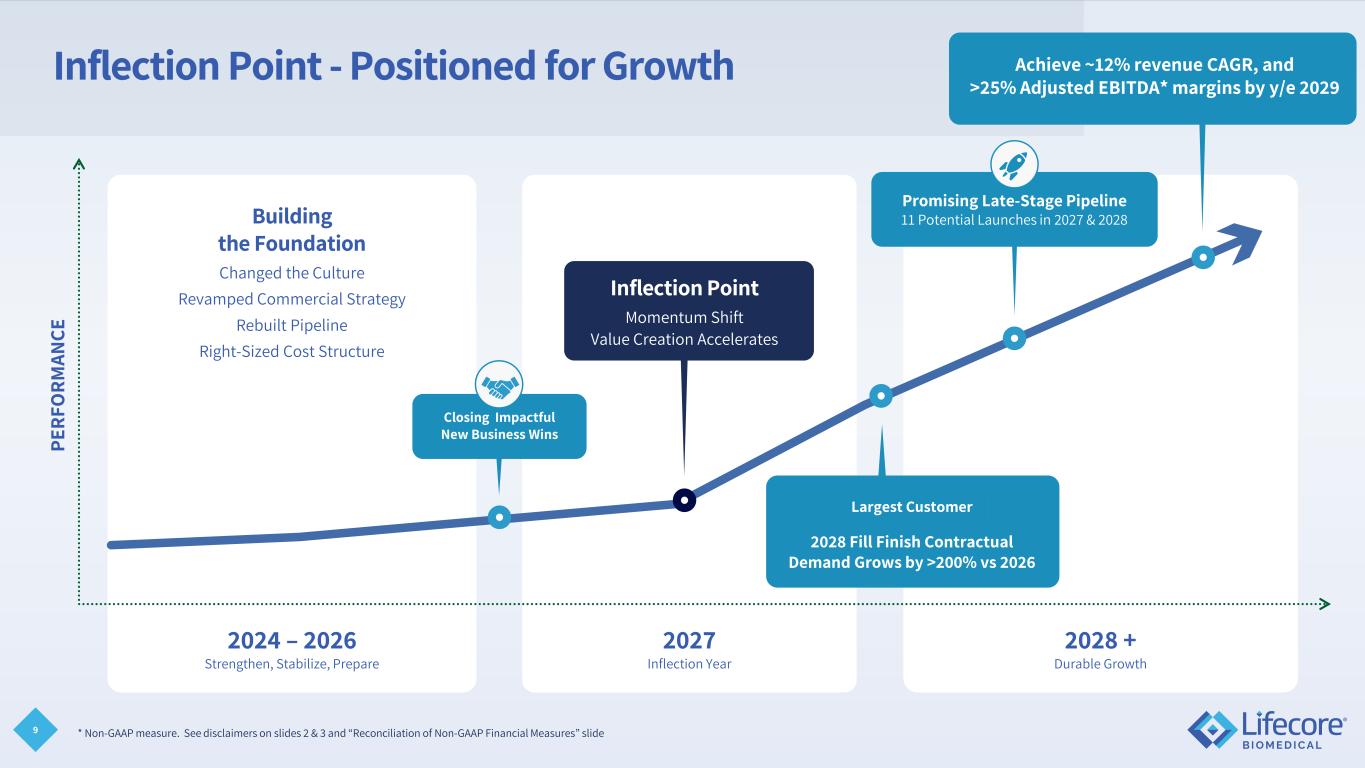
9 Inflection Point - Positioned for Growth 2027 Inflection Year 2024 – 2026 Strengthen, Stabilize, Prepare 2028 + Durable Growth Building the Foundation Changed the Culture Revamped Commercial Strategy Rebuilt Pipeline Right-Sized Cost Structure PE RF O RM AN CE 2028 Fill Finish Contractual Demand Grows by >200% vs 2026 Closing Impactful New Business Wins Inflection Point Momentum Shift Value Creation Accelerates Promising Late-Stage Pipeline 11 Potential Launches in 2027 & 2028 Sustain 10-5-3 Close – File - Launch Largest Customer Achieve ~12% revenue CAGR, and >25% Adjusted EBITDA* margins by y/e 2029 * Non-GAAP measure. See disclaimers on slides 2 & 3 and “Reconciliation of Non-GAAP Financial Measures” slide
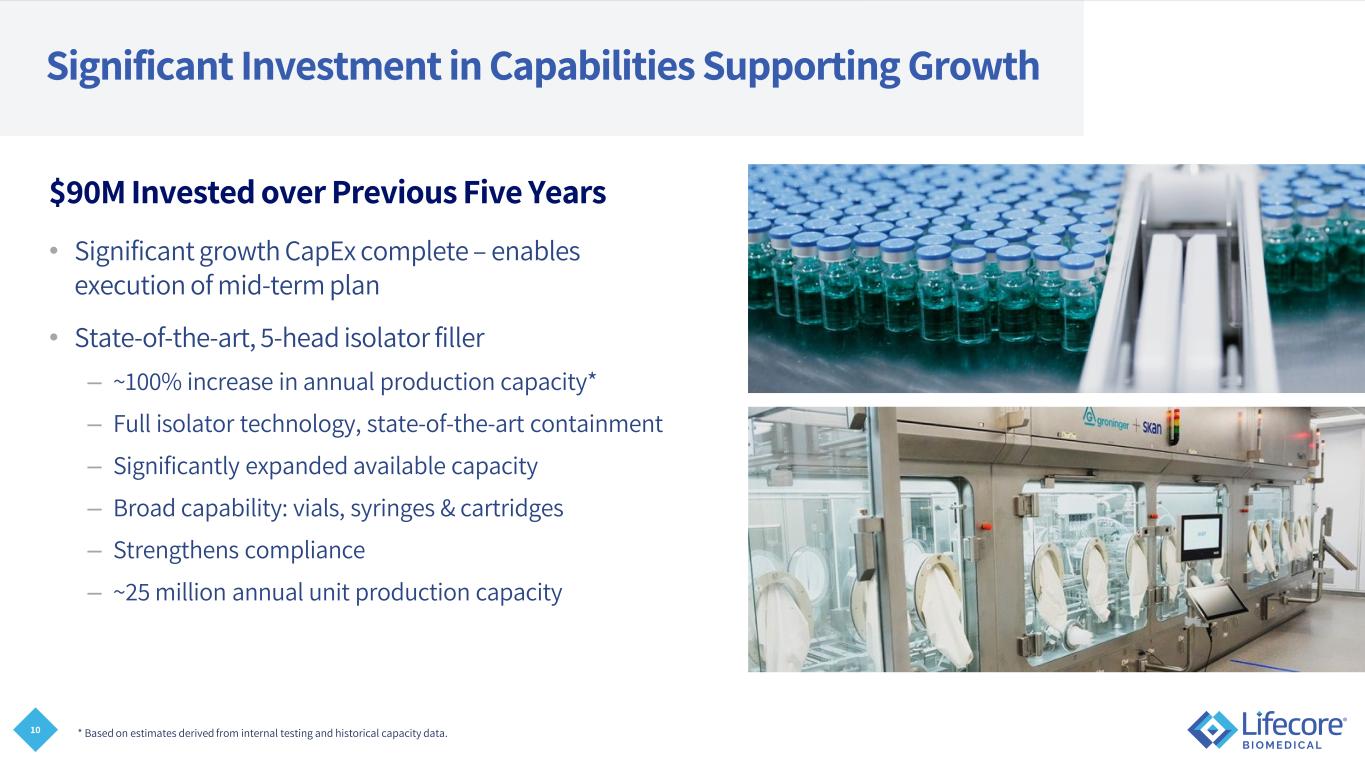
10 $90M Invested over Previous Five Years • Significant growth CapEx complete – enables execution of mid-term plan • State-of-the-art, 5-head isolator filler – ~100% increase in annual production capacity* – Full isolator technology, state-of-the-art containment – Significantly expanded available capacity – Broad capability: vials, syringes & cartridges – Strengthens compliance – ~25 million annual unit production capacity * Based on estimates derived from internal testing and historical capacity data. Significant Investment in Capabilities Supporting Growth
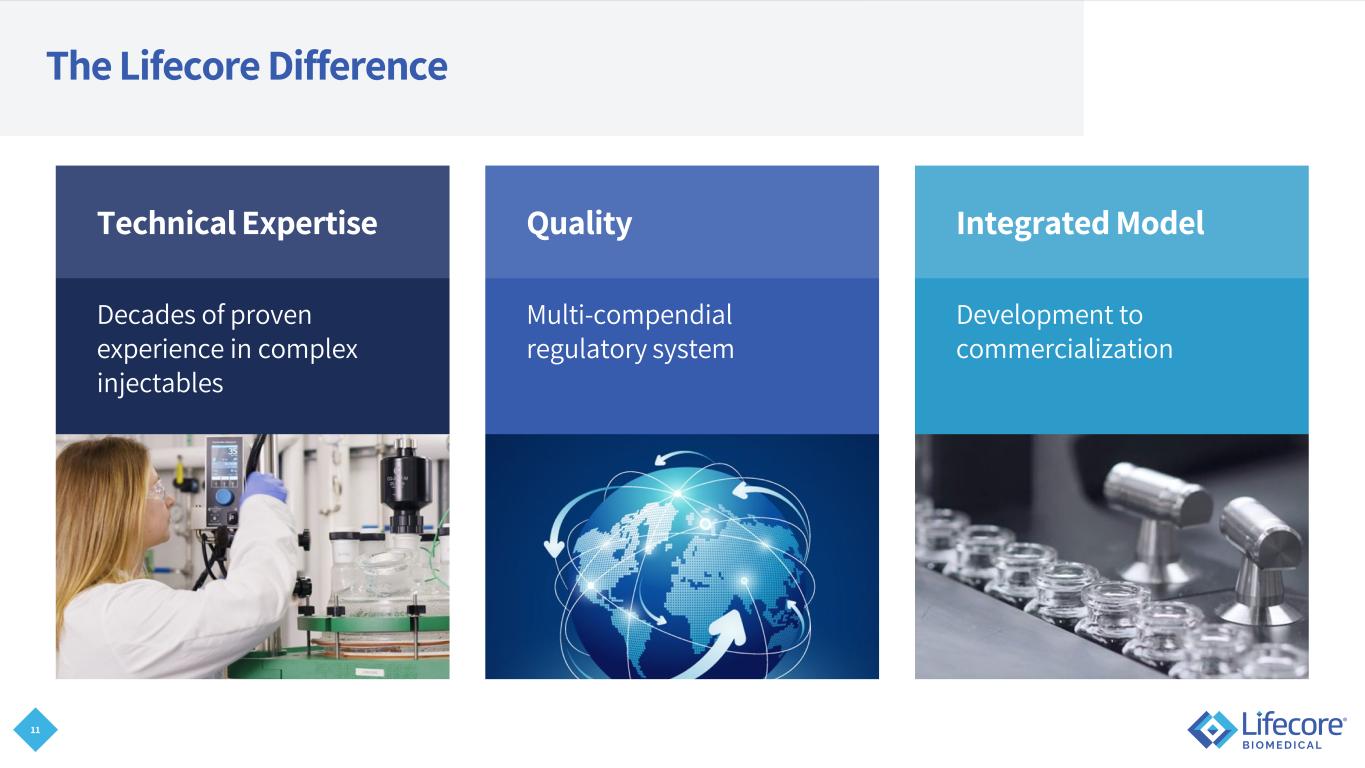
11 The Lifecore Difference Technical Expertise Decades of proven experience in complex injectables Integrated Model Development to commercialization Quality Multi-compendial regulatory system
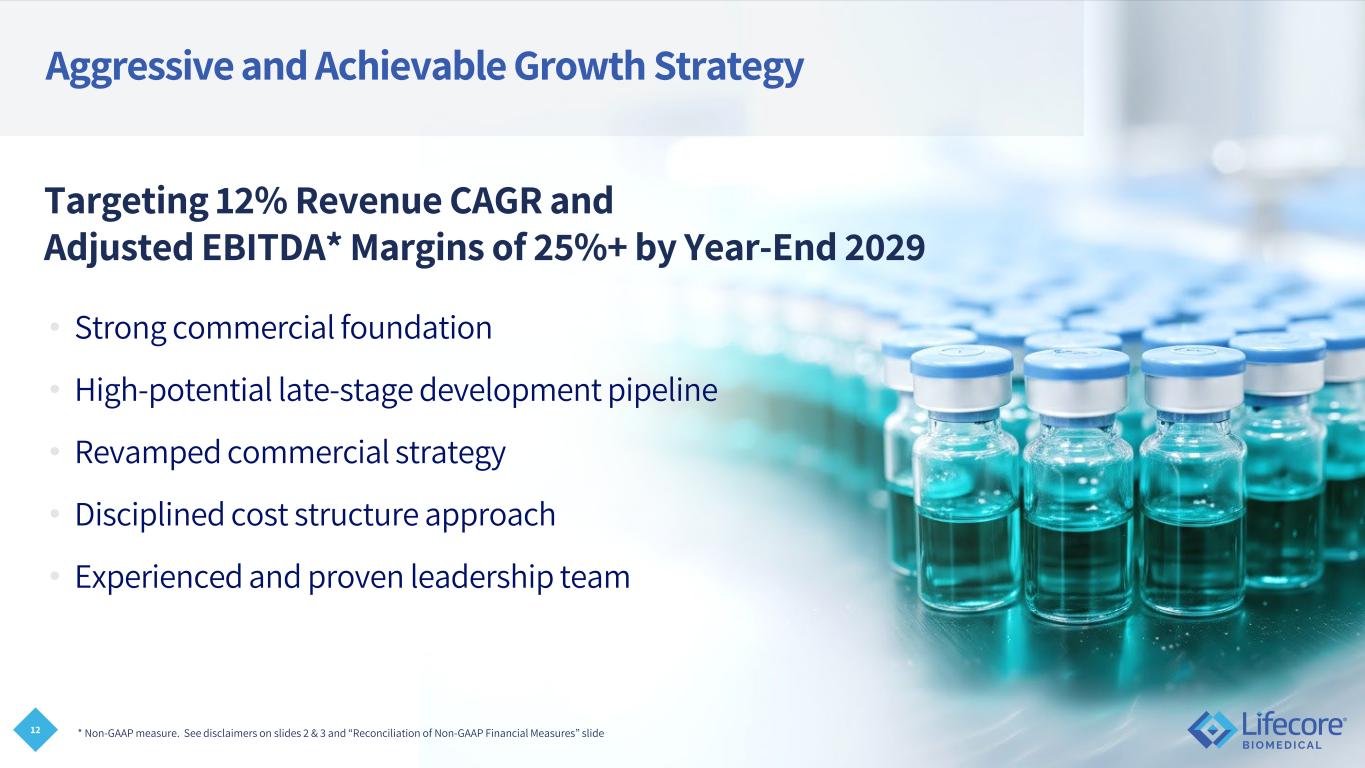
12 Aggressive and Achievable Growth Strategy • Strong commercial foundation • High-potential late-stage development pipeline • Revamped commercial strategy • Disciplined cost structure approach • Experienced and proven leadership team Targeting 12% Revenue CAGR and Adjusted EBITDA* Margins of 25%+ by Year-End 2029 * Non-GAAP measure. See disclaimers on slides 2 & 3 and “Reconciliation of Non-GAAP Financial Measures” slide
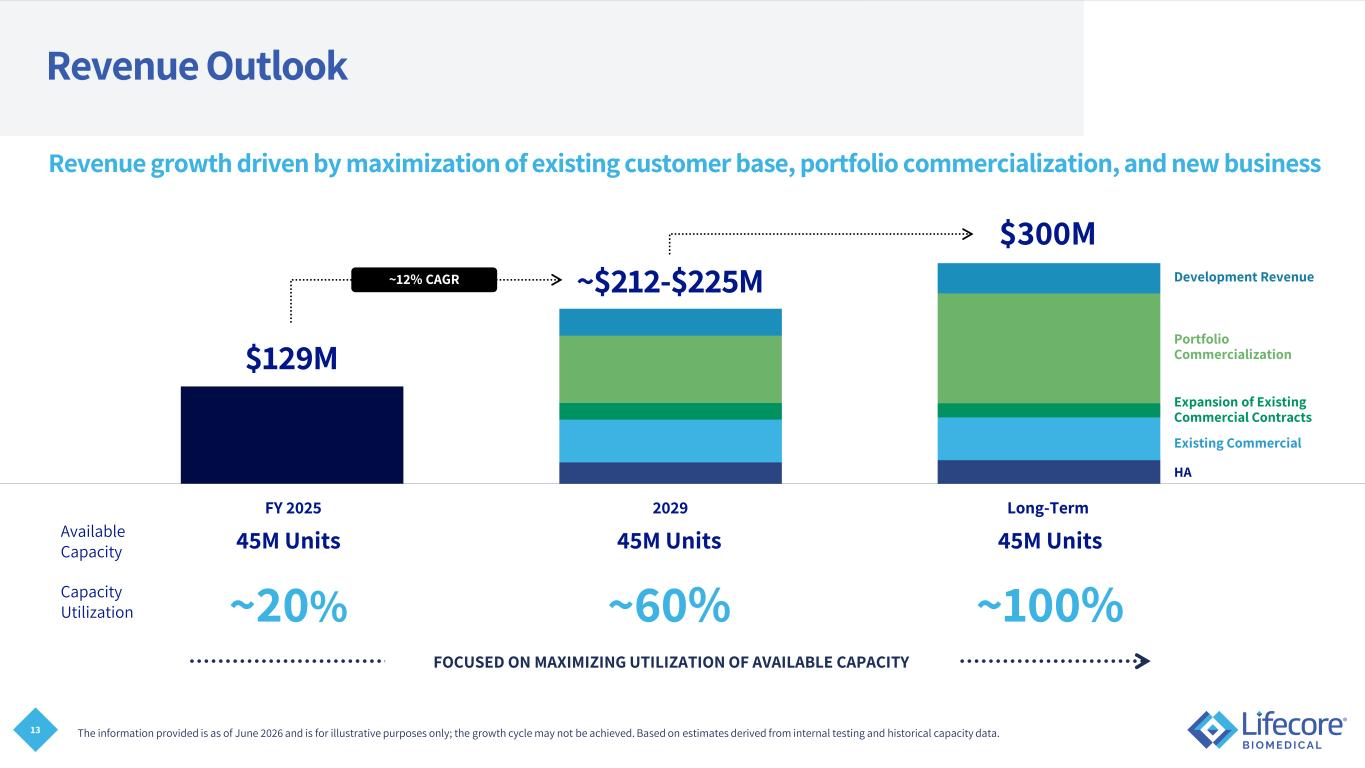
13 FOCUSED ON MAXIMIZING UTILIZATION OF AVAILABLE CAPACITY Revenue Outlook Revenue growth driven by maximization of existing customer base, portfolio commercialization, and new business 45M Units 45M Units 45M Units ~20% ~60% ~100% Available Capacity Capacity Utilization The information provided is as of June 2026 and is for illustrative purposes only; the growth cycle may not be achieved. Based on estimates derived from internal testing and historical capacity data. FY 2025 2029 Long-Term ~12% CAGR $129M ~$212-$225M $300M HA Existing Commercial Expansion of Existing Commercial Contracts Portfolio Commercialization Development Revenue
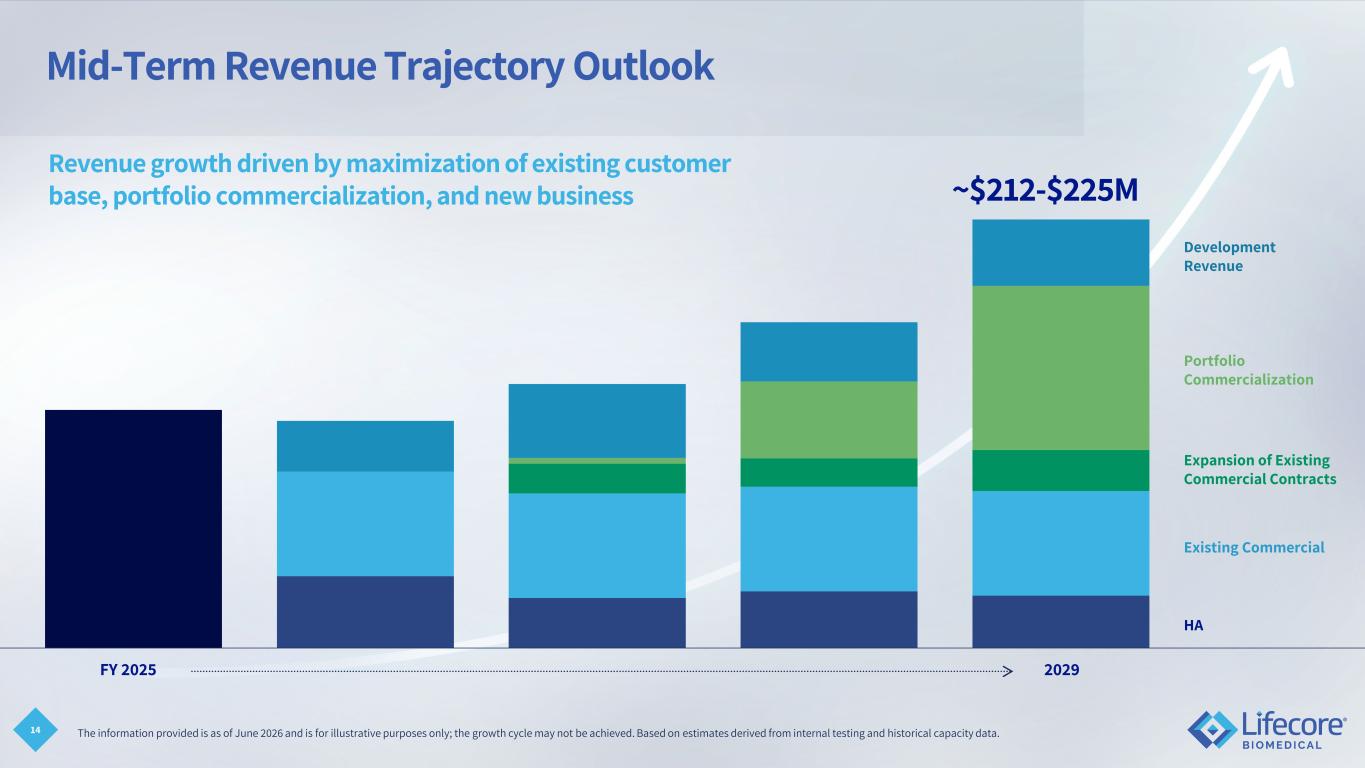
14 Mid-Term Revenue Trajectory Outlook Revenue growth driven by maximization of existing customer base, portfolio commercialization, and new business FY 2025 2029 ~$212-$225M HA Existing Commercial Expansion of Existing Commercial Contracts Portfolio Commercialization Development Revenue The information provided is as of June 2026 and is for illustrative purposes only; the growth cycle may not be achieved. Based on estimates derived from internal testing and historical capacity data.
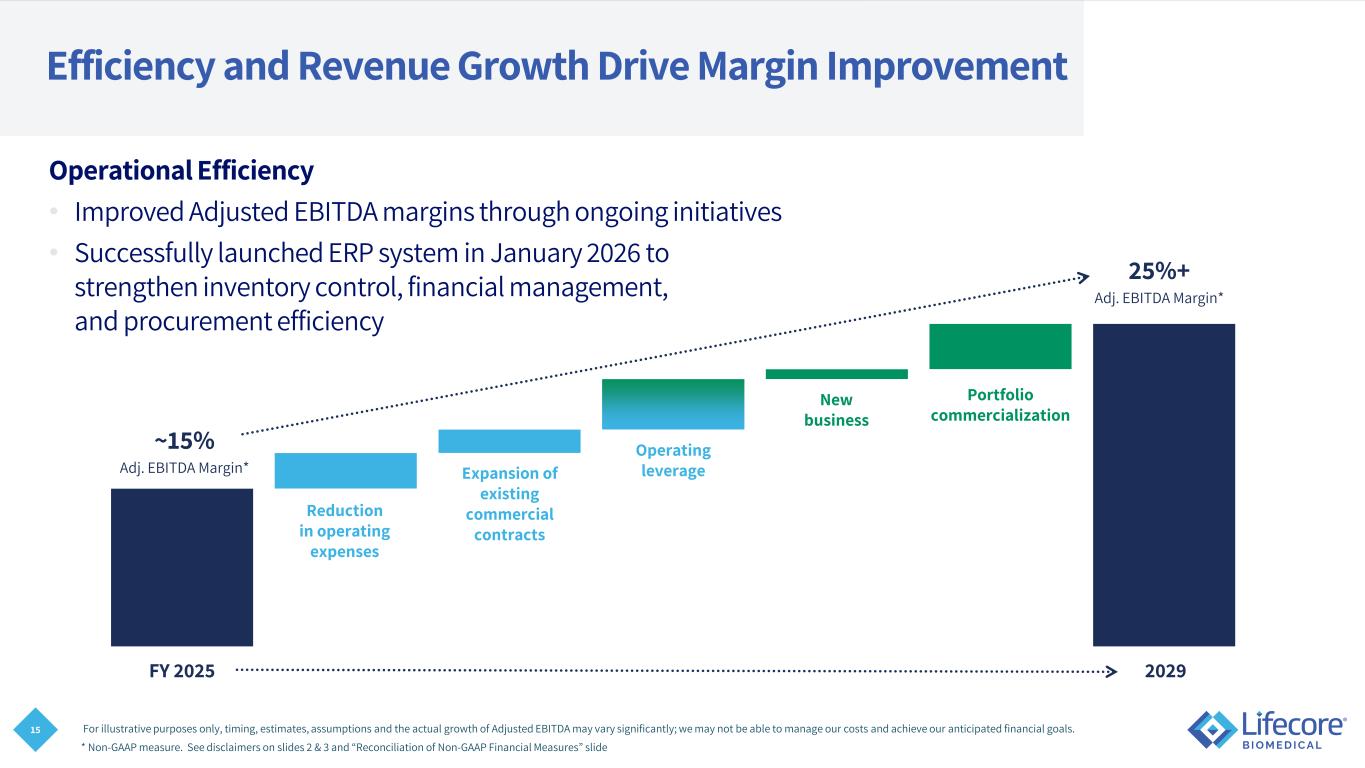
15 FY 2025 2029 Efficiency and Revenue Growth Drive Margin Improvement Operational Efficiency • Improved Adjusted EBITDA margins through ongoing initiatives • Successfully launched ERP system in January 2026 to strengthen inventory control, financial management, and procurement efficiency For illustrative purposes only, timing, estimates, assumptions and the actual growth of Adjusted EBITDA may vary significantly; we may not be able to manage our costs and achieve our anticipated financial goals. ~15% 25%+ Adj. EBITDA Margin* Adj. EBITDA Margin* Reduction in operating expenses Expansion of existing commercial contracts Portfolio commercialization New business Operating leverage * Non-GAAP measure. See disclaimers on slides 2 & 3 and “Reconciliation of Non-GAAP Financial Measures” slide
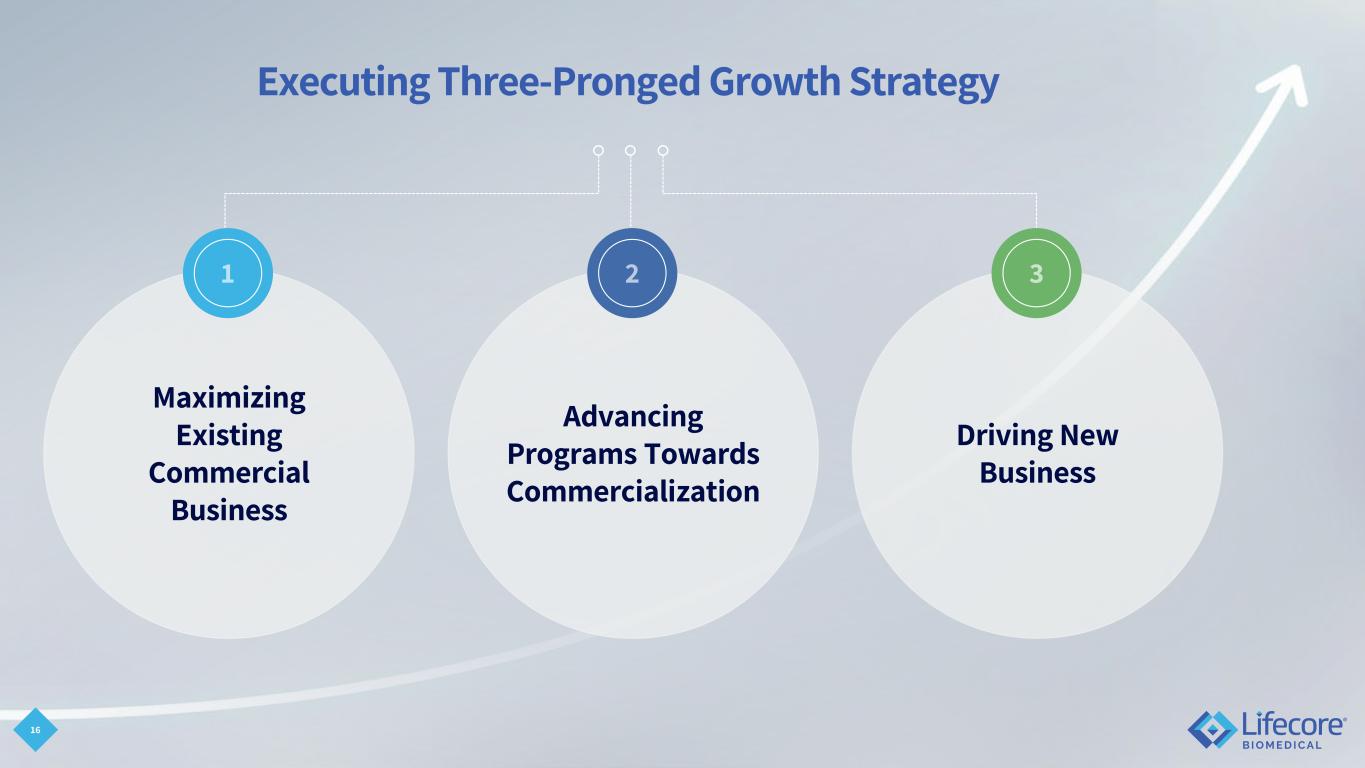
Executing Three-Pronged Growth Strategy 16 Maximizing Existing Commercial Business Advancing Programs Towards Commercialization Driving New Business
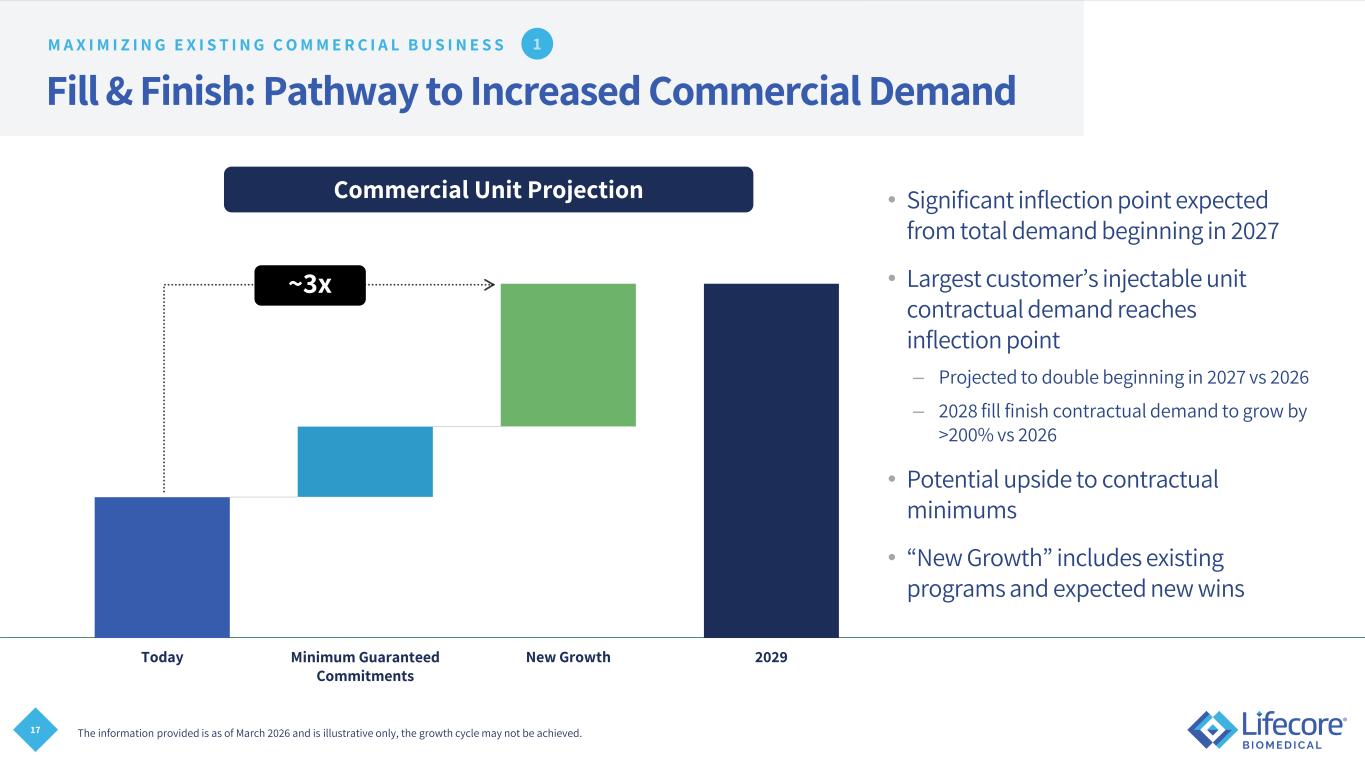
17 Fill & Finish: Pathway to Increased Commercial Demand • Significant inflection point expected from total demand beginning in 2027 • Largest customer’s injectable unit contractual demand reaches inflection point – Projected to double beginning in 2027 vs 2026 – 2028 fill finish contractual demand to grow by >200% vs 2026 • Potential upside to contractual minimums • “New Growth” includes existing programs and expected new wins The information provided is as of March 2026 and is illustrative only, the growth cycle may not be achieved. M A X I M I Z I N G E X I S T I N G C O M M E R C I A L B U S I N E S S Today Minimum Guaranteed Commitments New Growth 2029 Commercial Unit Projection ~3x
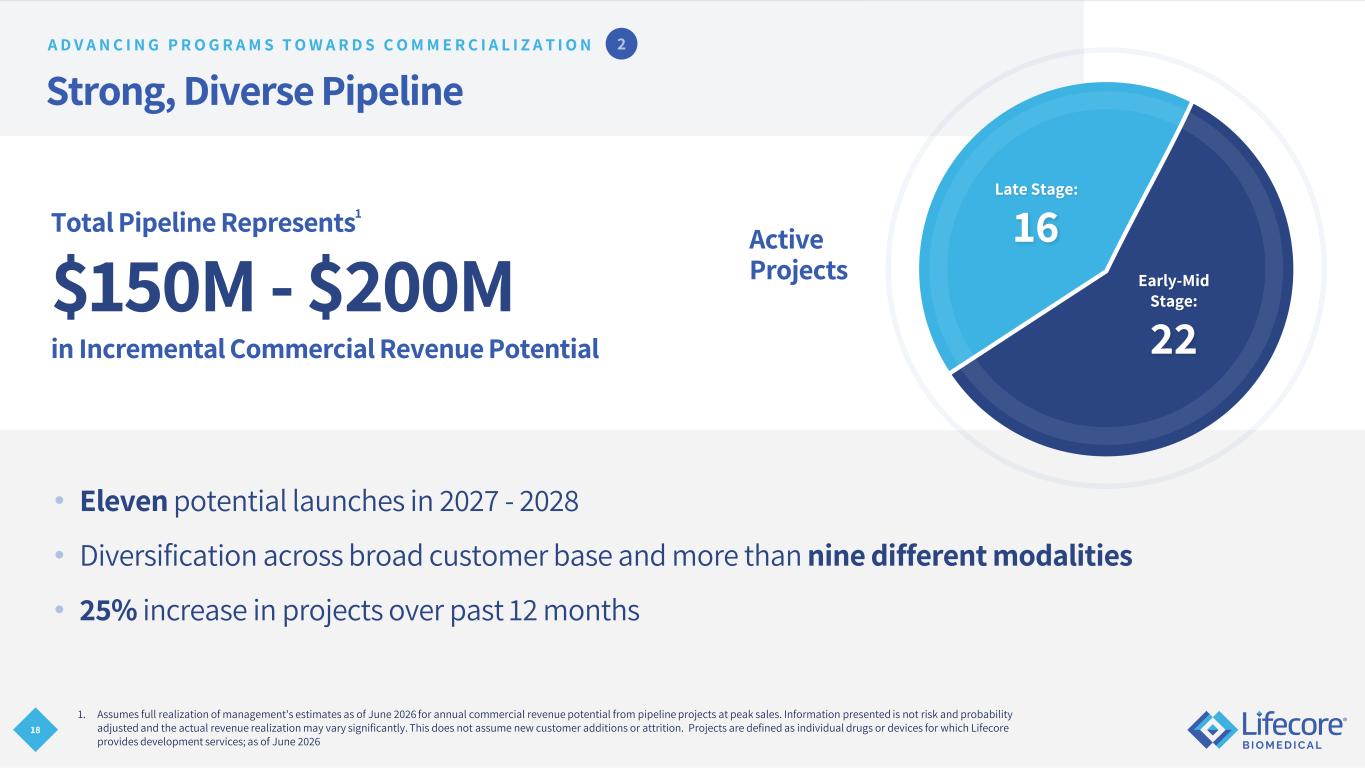
18 Strong, Diverse Pipeline • Eleven potential launches in 2027 - 2028 • Diversification across broad customer base and more than nine different modalities • 25% increase in projects over past 12 months Total Pipeline Represents1 $150M - $200M in Incremental Commercial Revenue Potential 1. Assumes full realization of management's estimates as of June 2026 for annual commercial revenue potential from pipeline projects at peak sales. Information presented is not risk and probability adjusted and the actual revenue realization may vary significantly. This does not assume new customer additions or attrition. Projects are defined as individual drugs or devices for which Lifecore provides development services; as of June 2026 Active Projects Late Stage: 16 Early-Mid Stage: 22 A D V A N C I N G P R O G R A M S T O W A R D S C O M M E R C I A L I Z A T I O N
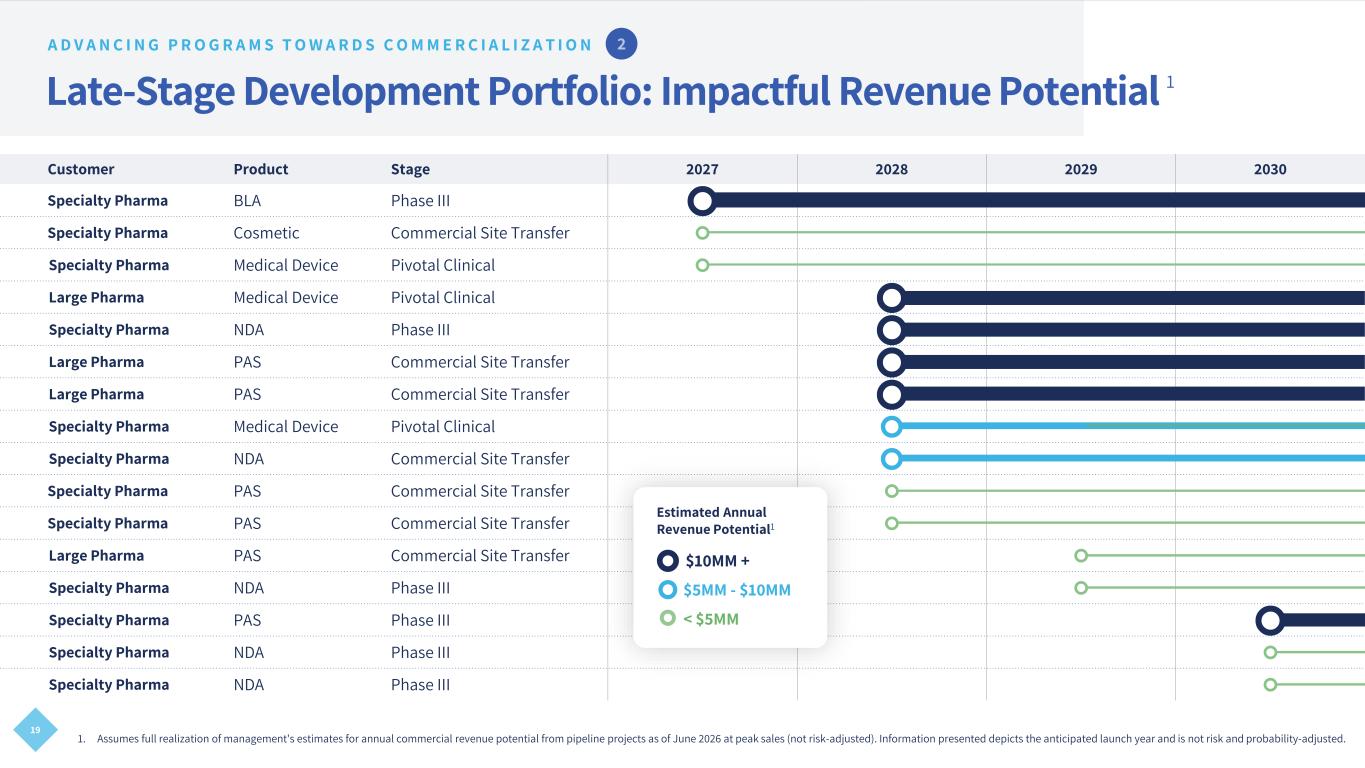
19 Customer Product Stage 2027 2028 2029 2030 Specialty Pharma BLA Phase III Specialty Pharma Cosmetic Commercial Site Transfer Specialty Pharma Medical Device Pivotal Clinical Large Pharma Medical Device Pivotal Clinical Specialty Pharma NDA Phase III Large Pharma PAS Commercial Site Transfer Large Pharma PAS Commercial Site Transfer Specialty Pharma Medical Device Pivotal Clinical Specialty Pharma NDA Commercial Site Transfer Specialty Pharma PAS Commercial Site Transfer Specialty Pharma PAS Commercial Site Transfer Large Pharma PAS Commercial Site Transfer Specialty Pharma NDA Phase III Specialty Pharma PAS Phase III Specialty Pharma NDA Phase III Specialty Pharma NDA Phase III Late-Stage Development Portfolio: Impactful Revenue Potential 1 $10MM + $5MM - $10MM < $5MM Estimated Annual Revenue Potential1 A D V A N C I N G P R O G R A M S T O W A R D S C O M M E R C I A L I Z A T I O N 1. Assumes full realization of management's estimates for annual commercial revenue potential from pipeline projects as of June 2026 at peak sales (not risk-adjusted). Information presented depicts the anticipated launch year and is not risk and probability-adjusted.
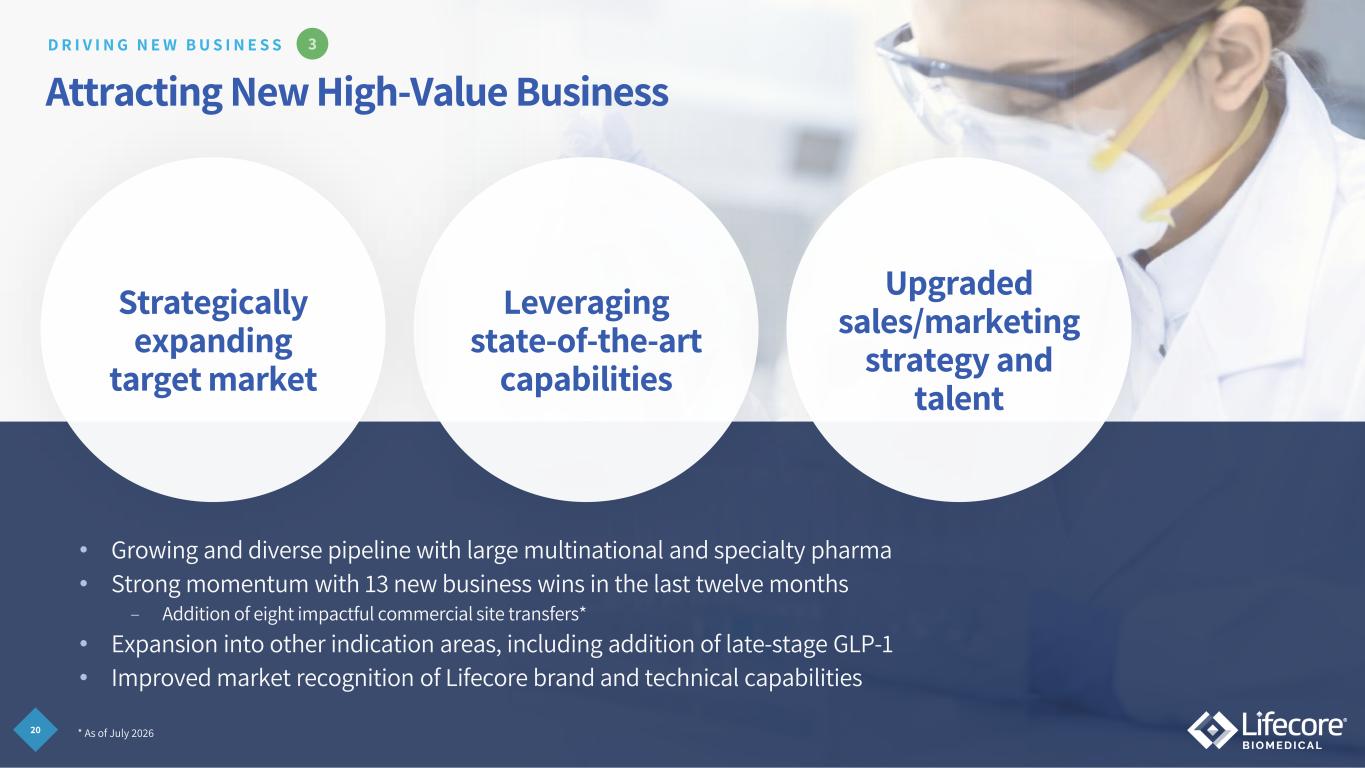
20 Attracting New High-Value Business Leveraging state-of-the-art capabilities Strategically expanding target market Upgraded sales/marketing strategy and talent D R I V I N G N E W B U S I N E S S • Growing and diverse pipeline with large multinational and specialty pharma • Strong momentum with 13 new business wins in the last twelve months – Addition of eight impactful commercial site transfers* • Expansion into other indication areas, including addition of late-stage GLP-1 • Improved market recognition of Lifecore brand and technical capabilities * As of July 2026
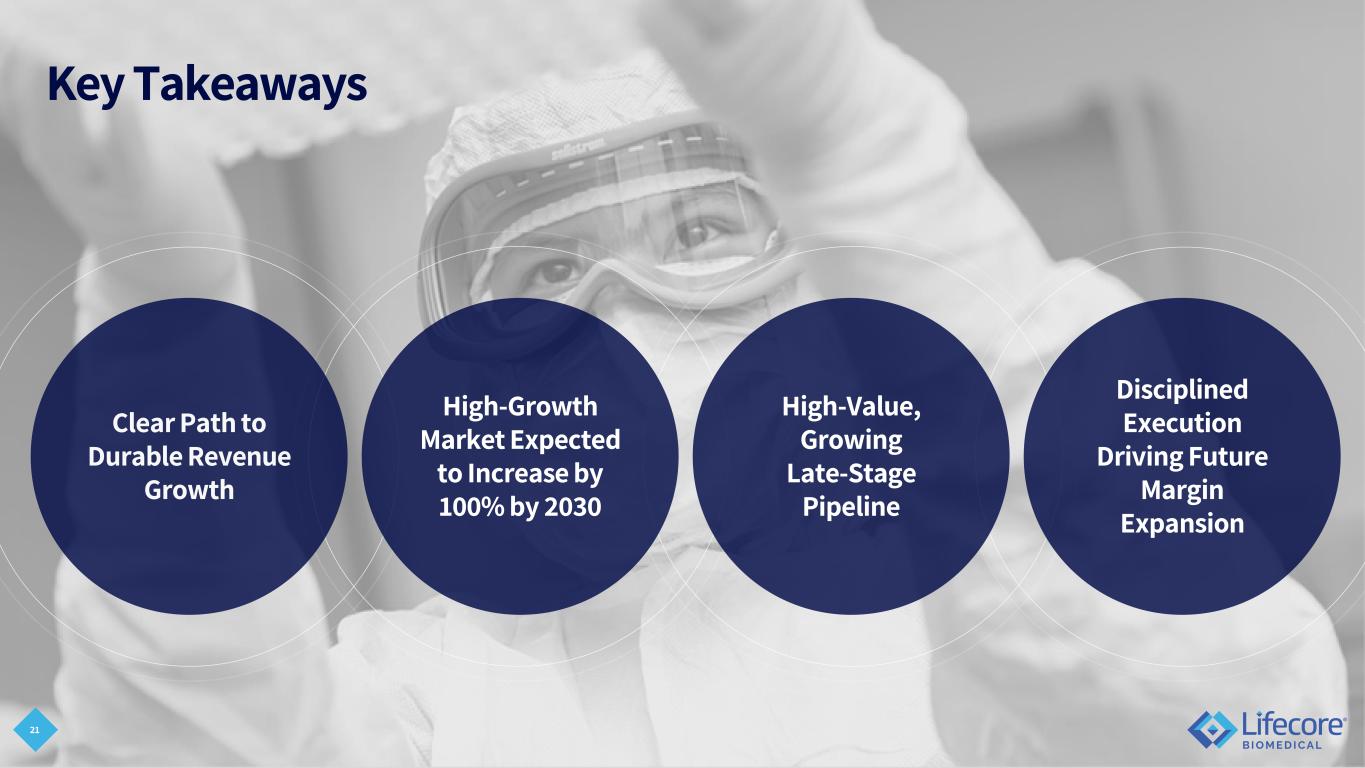
21 Key Takeaways High-Growth Market Expected to Increase by 100% by 2030 High-Value, Growing Late-Stage Pipeline Disciplined Execution Driving Future Margin Expansion Clear Path to Durable Revenue Growth
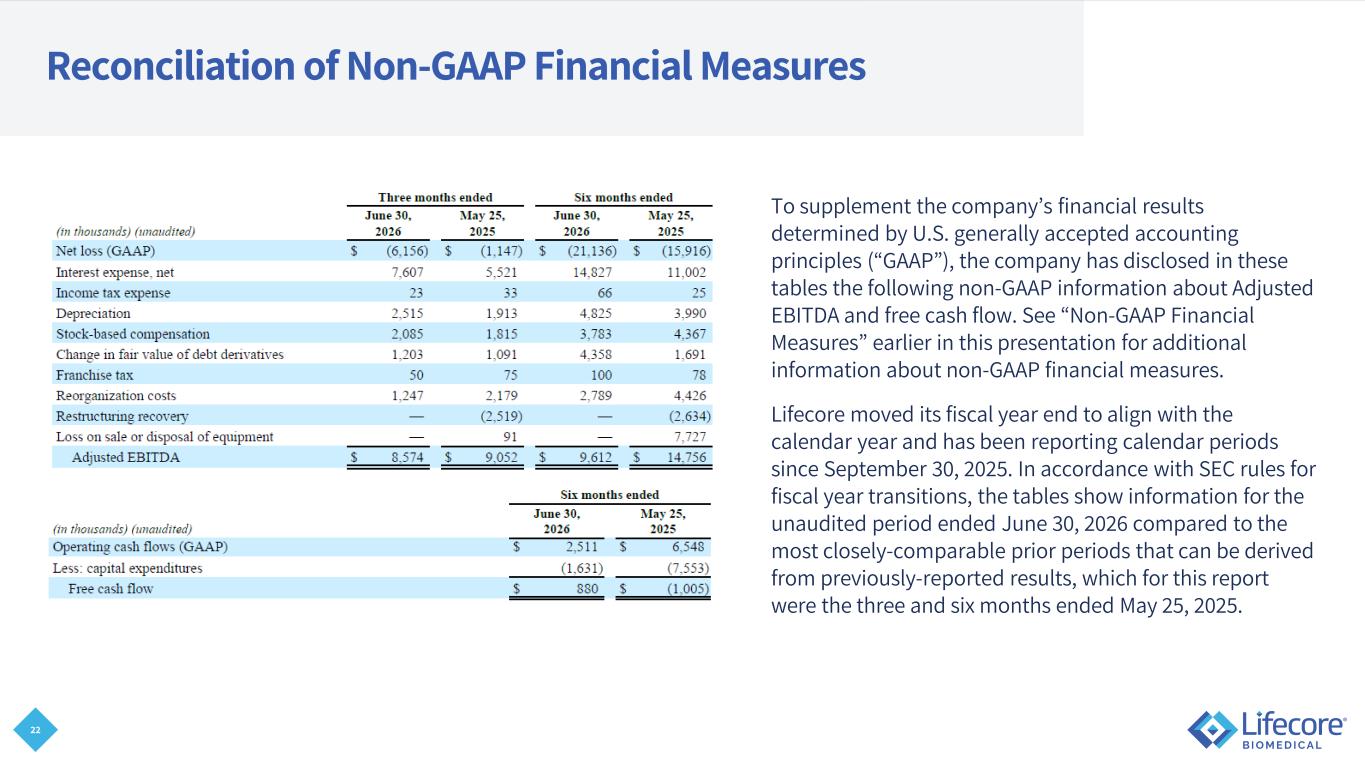
22 Reconciliation of Non-GAAP Financial Measures To supplement the company’s financial results determined by U.S. generally accepted accounting principles (“GAAP”), the company has disclosed in these tables the following non-GAAP information about Adjusted EBITDA and free cash flow. See “Non-GAAP Financial Measures” earlier in this presentation for additional information about non-GAAP financial measures. Lifecore moved its fiscal year end to align with the calendar year and has been reporting calendar periods since September 30, 2025. In accordance with SEC rules for fiscal year transitions, the tables show information for the unaudited period ended June 30, 2026 compared to the most closely-comparable prior periods that can be derived from previously-reported results, which for this report were the three and six months ended May 25, 2025.
Thank you