Exhibit 99.2
Q2 2026 EARNINGS RESULTS August 5, 2026
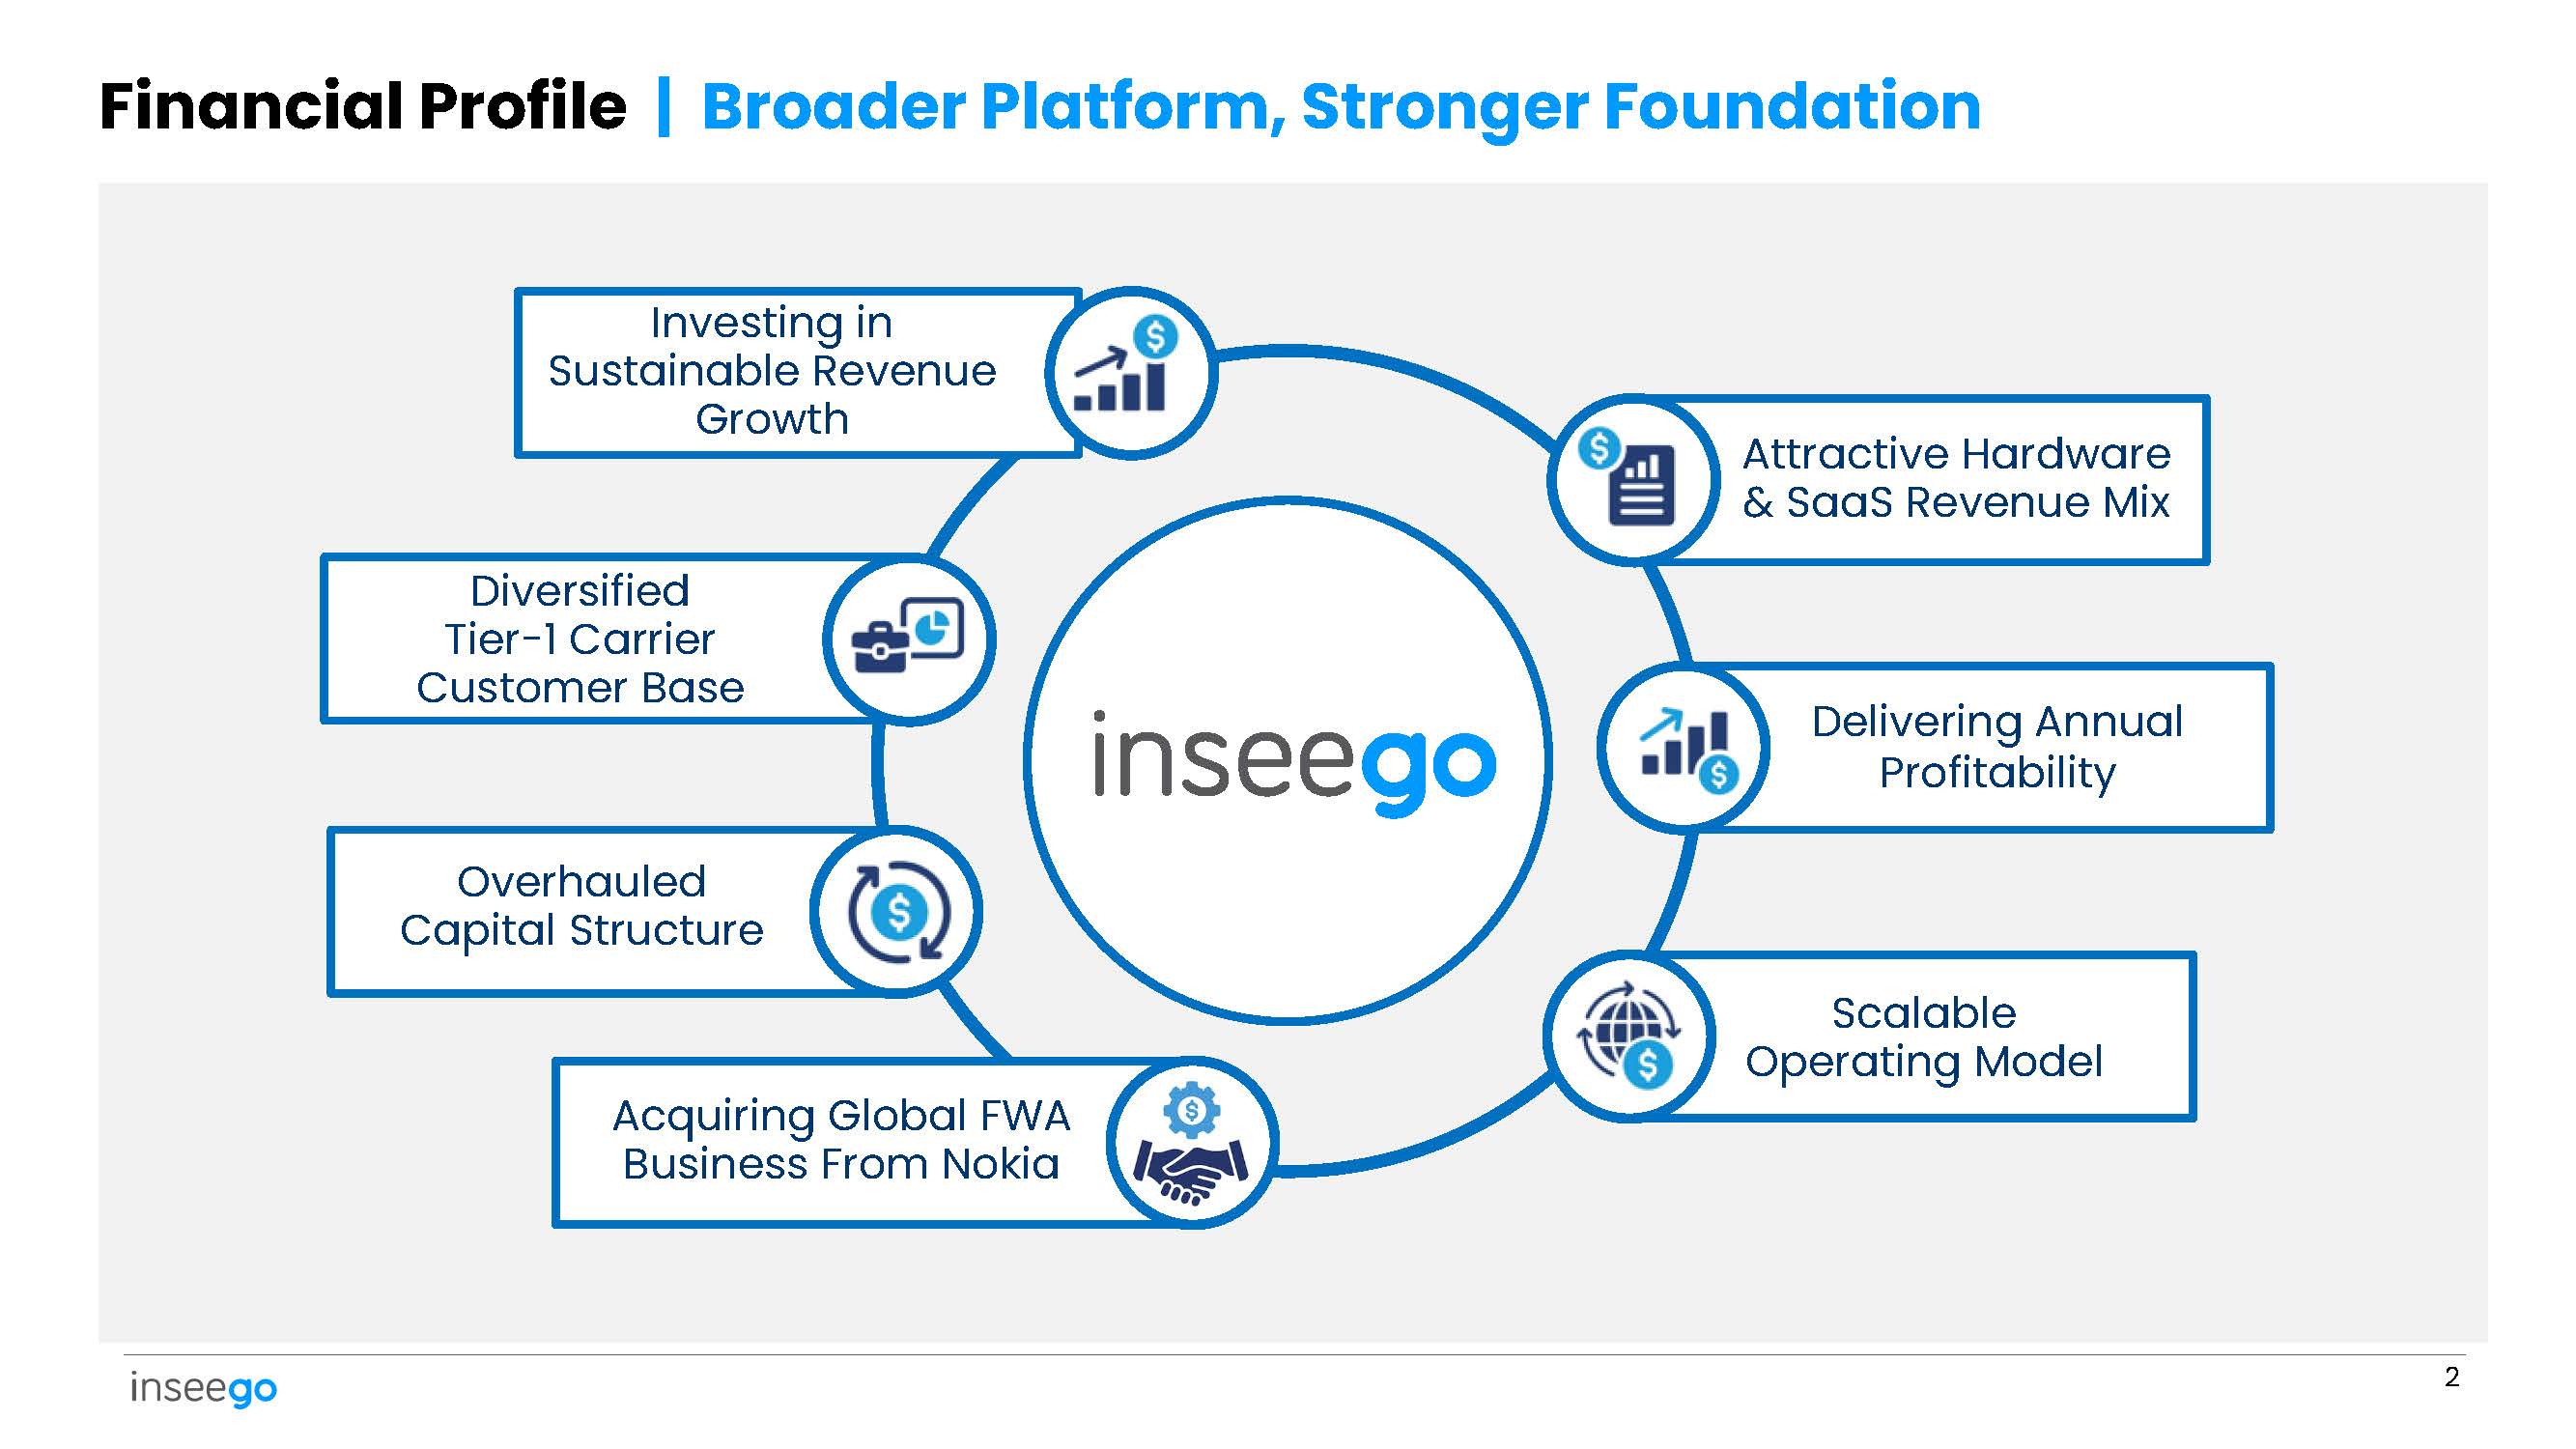
Financial Profile | Broader Platform, Stronger Foundation Overhauled Capital Structure Scalable Operating Model Attractive Hardware & SaaS Revenue Mix Delivering Annual Profitability Diversified Tier - 1 Carrier Customer Base Investing in Sustainable Revenue Growth Acquiring Global FWA Business From Nokia 2
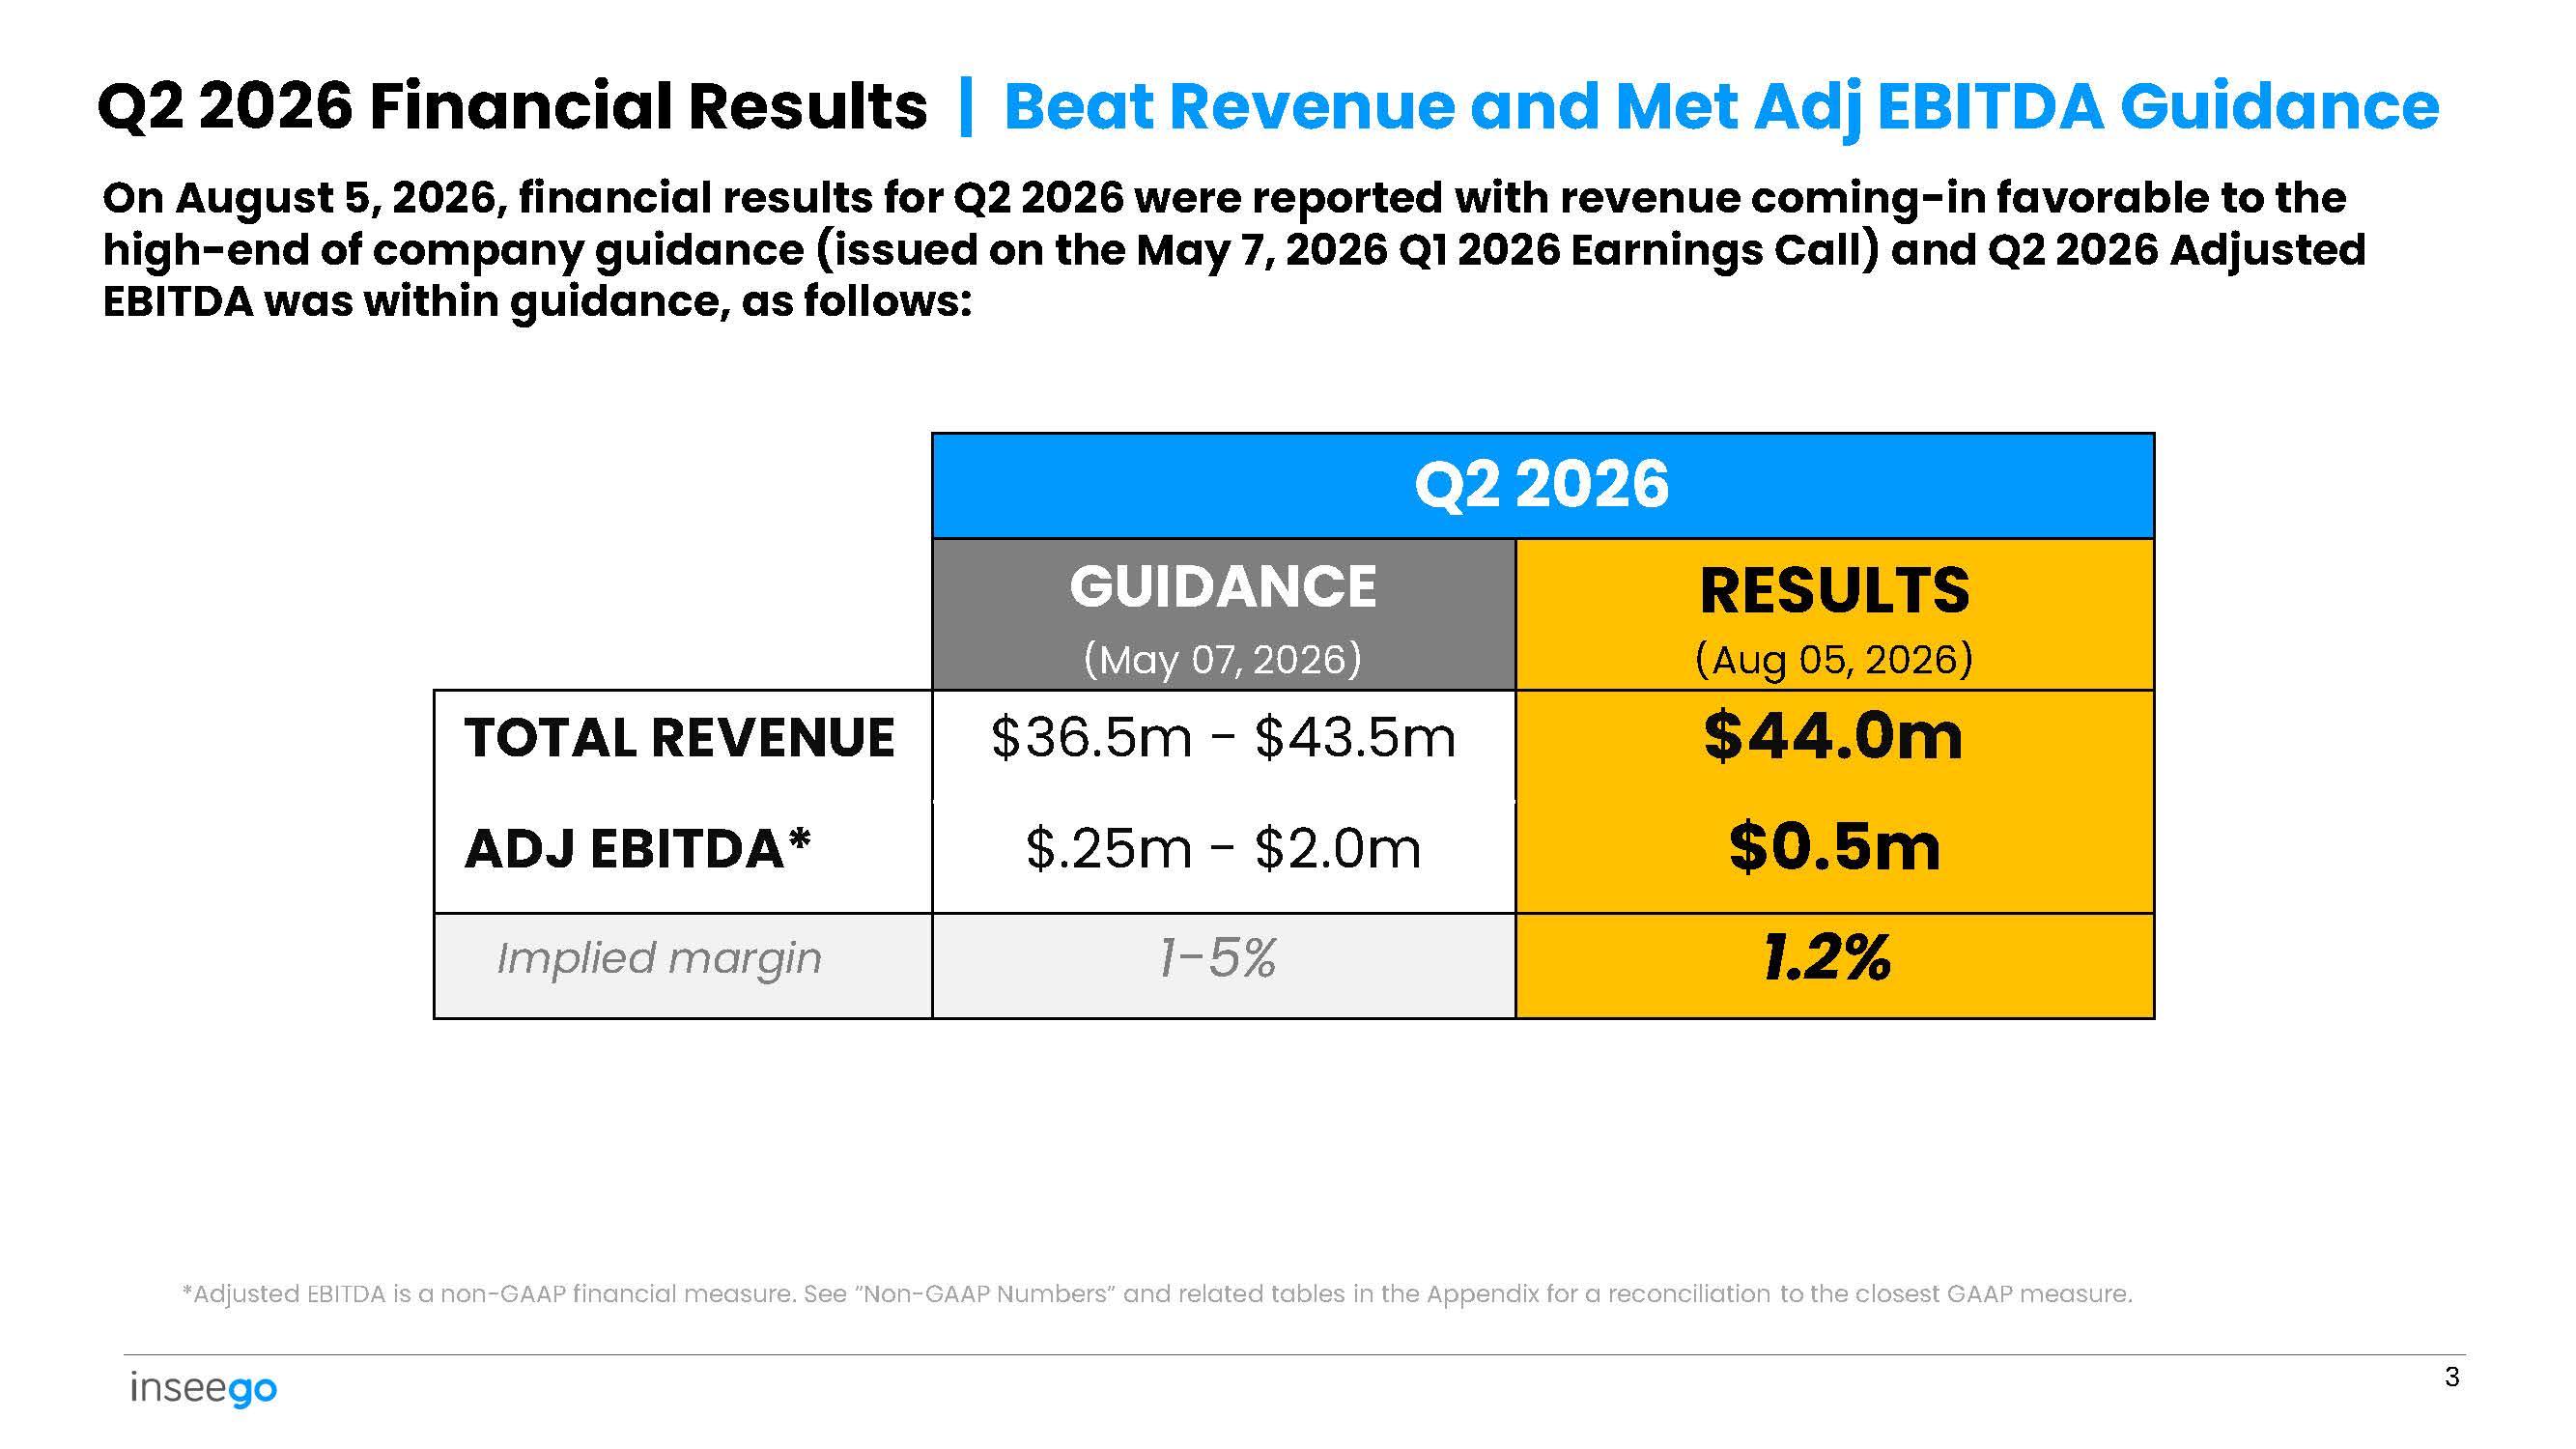
Q2 2026 RESULTS (Aug 05, 2026) GUIDANCE (May 07, 2026) $44.0m $0.5m $36.5m - $43.5m $.25m - $2.0m TOTAL REVENUE ADJ EBITDA* 1.2% 1 - 5% Implied margin 3 Q2 2026 Financial Results | Beat Revenue and Met Adj EBITDA Guidance On August 5, 2026, financial results for Q2 2026 were reported with revenue coming - in favorable to the high - end of company guidance (issued on the May 7, 2026 Q1 2026 Earnings Call) and Q2 2026 Adjusted EBITDA was within guidance, as follows: *Adjusted EBITDA is a non - GAAP financial measure. See ”Non - GAAP Numbers” and related tables in the Appendix for a reconciliation to the closest GAAP measure.
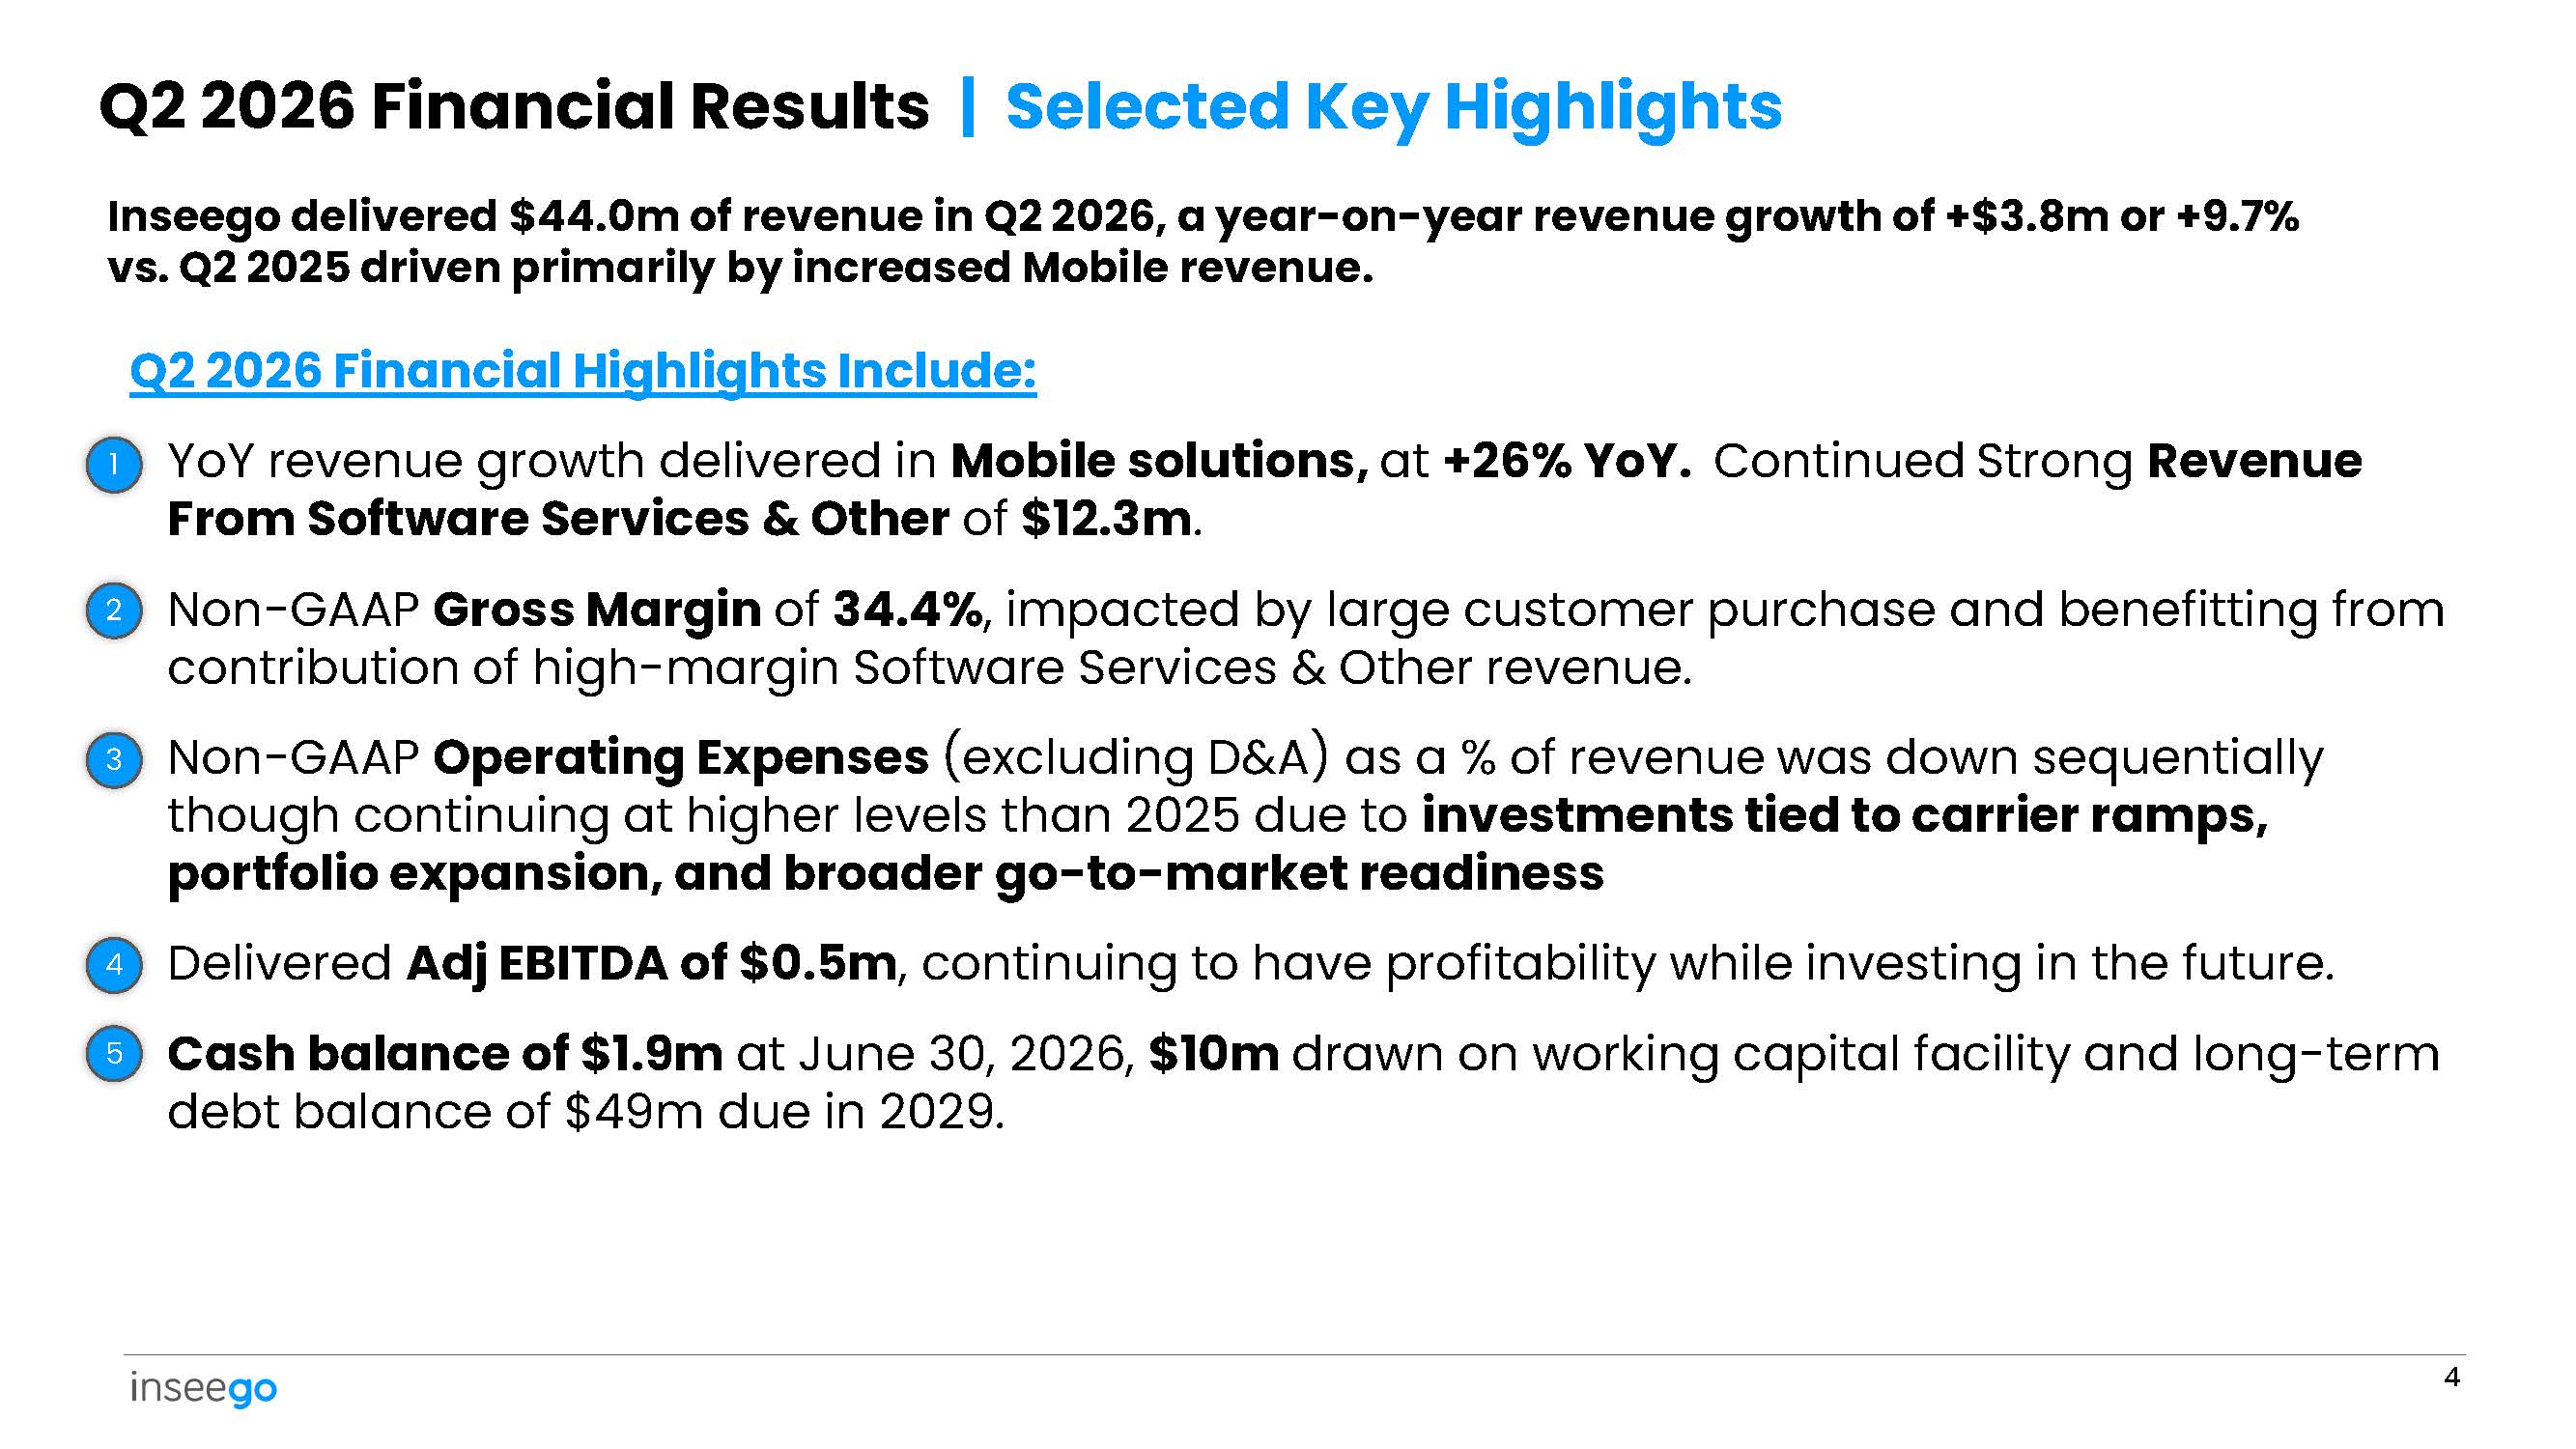
Inseego delivered $44.0m of revenue in Q2 2026, a year - on - year revenue growth of +$3.8m or +9.7% vs. Q2 2025 driven primarily by increased Mobile revenue. Q2 2026 Financial Highlights Include: YoY revenue growth delivered in Mobile solutions, at +26% YoY. Continued Strong Revenue From Software Services & Other of $12.3m . Q2 2026 Financial Results | Selected Key Highlights • 1 2 • Non - GAAP Gross Margin of 34.4% , impacted by large customer purchase and benefitting from contribution of high - margin Software Services & Other revenue. 3 • Non - GAAP Operating Expenses (excluding D&A) as a % of revenue was down sequentially though continuing at higher levels than 2025 due to investments tied to carrier ramps, portfolio expansion, and broader go - to - market readiness 4 • Delivered Adj EBITDA of $0.5m , continuing to have profitability while investing in the future. 5 • Cash balance of $1.9m at June 30, 2026, $10m drawn on working capital facility and long - term debt balance of $49m due in 2029. 4
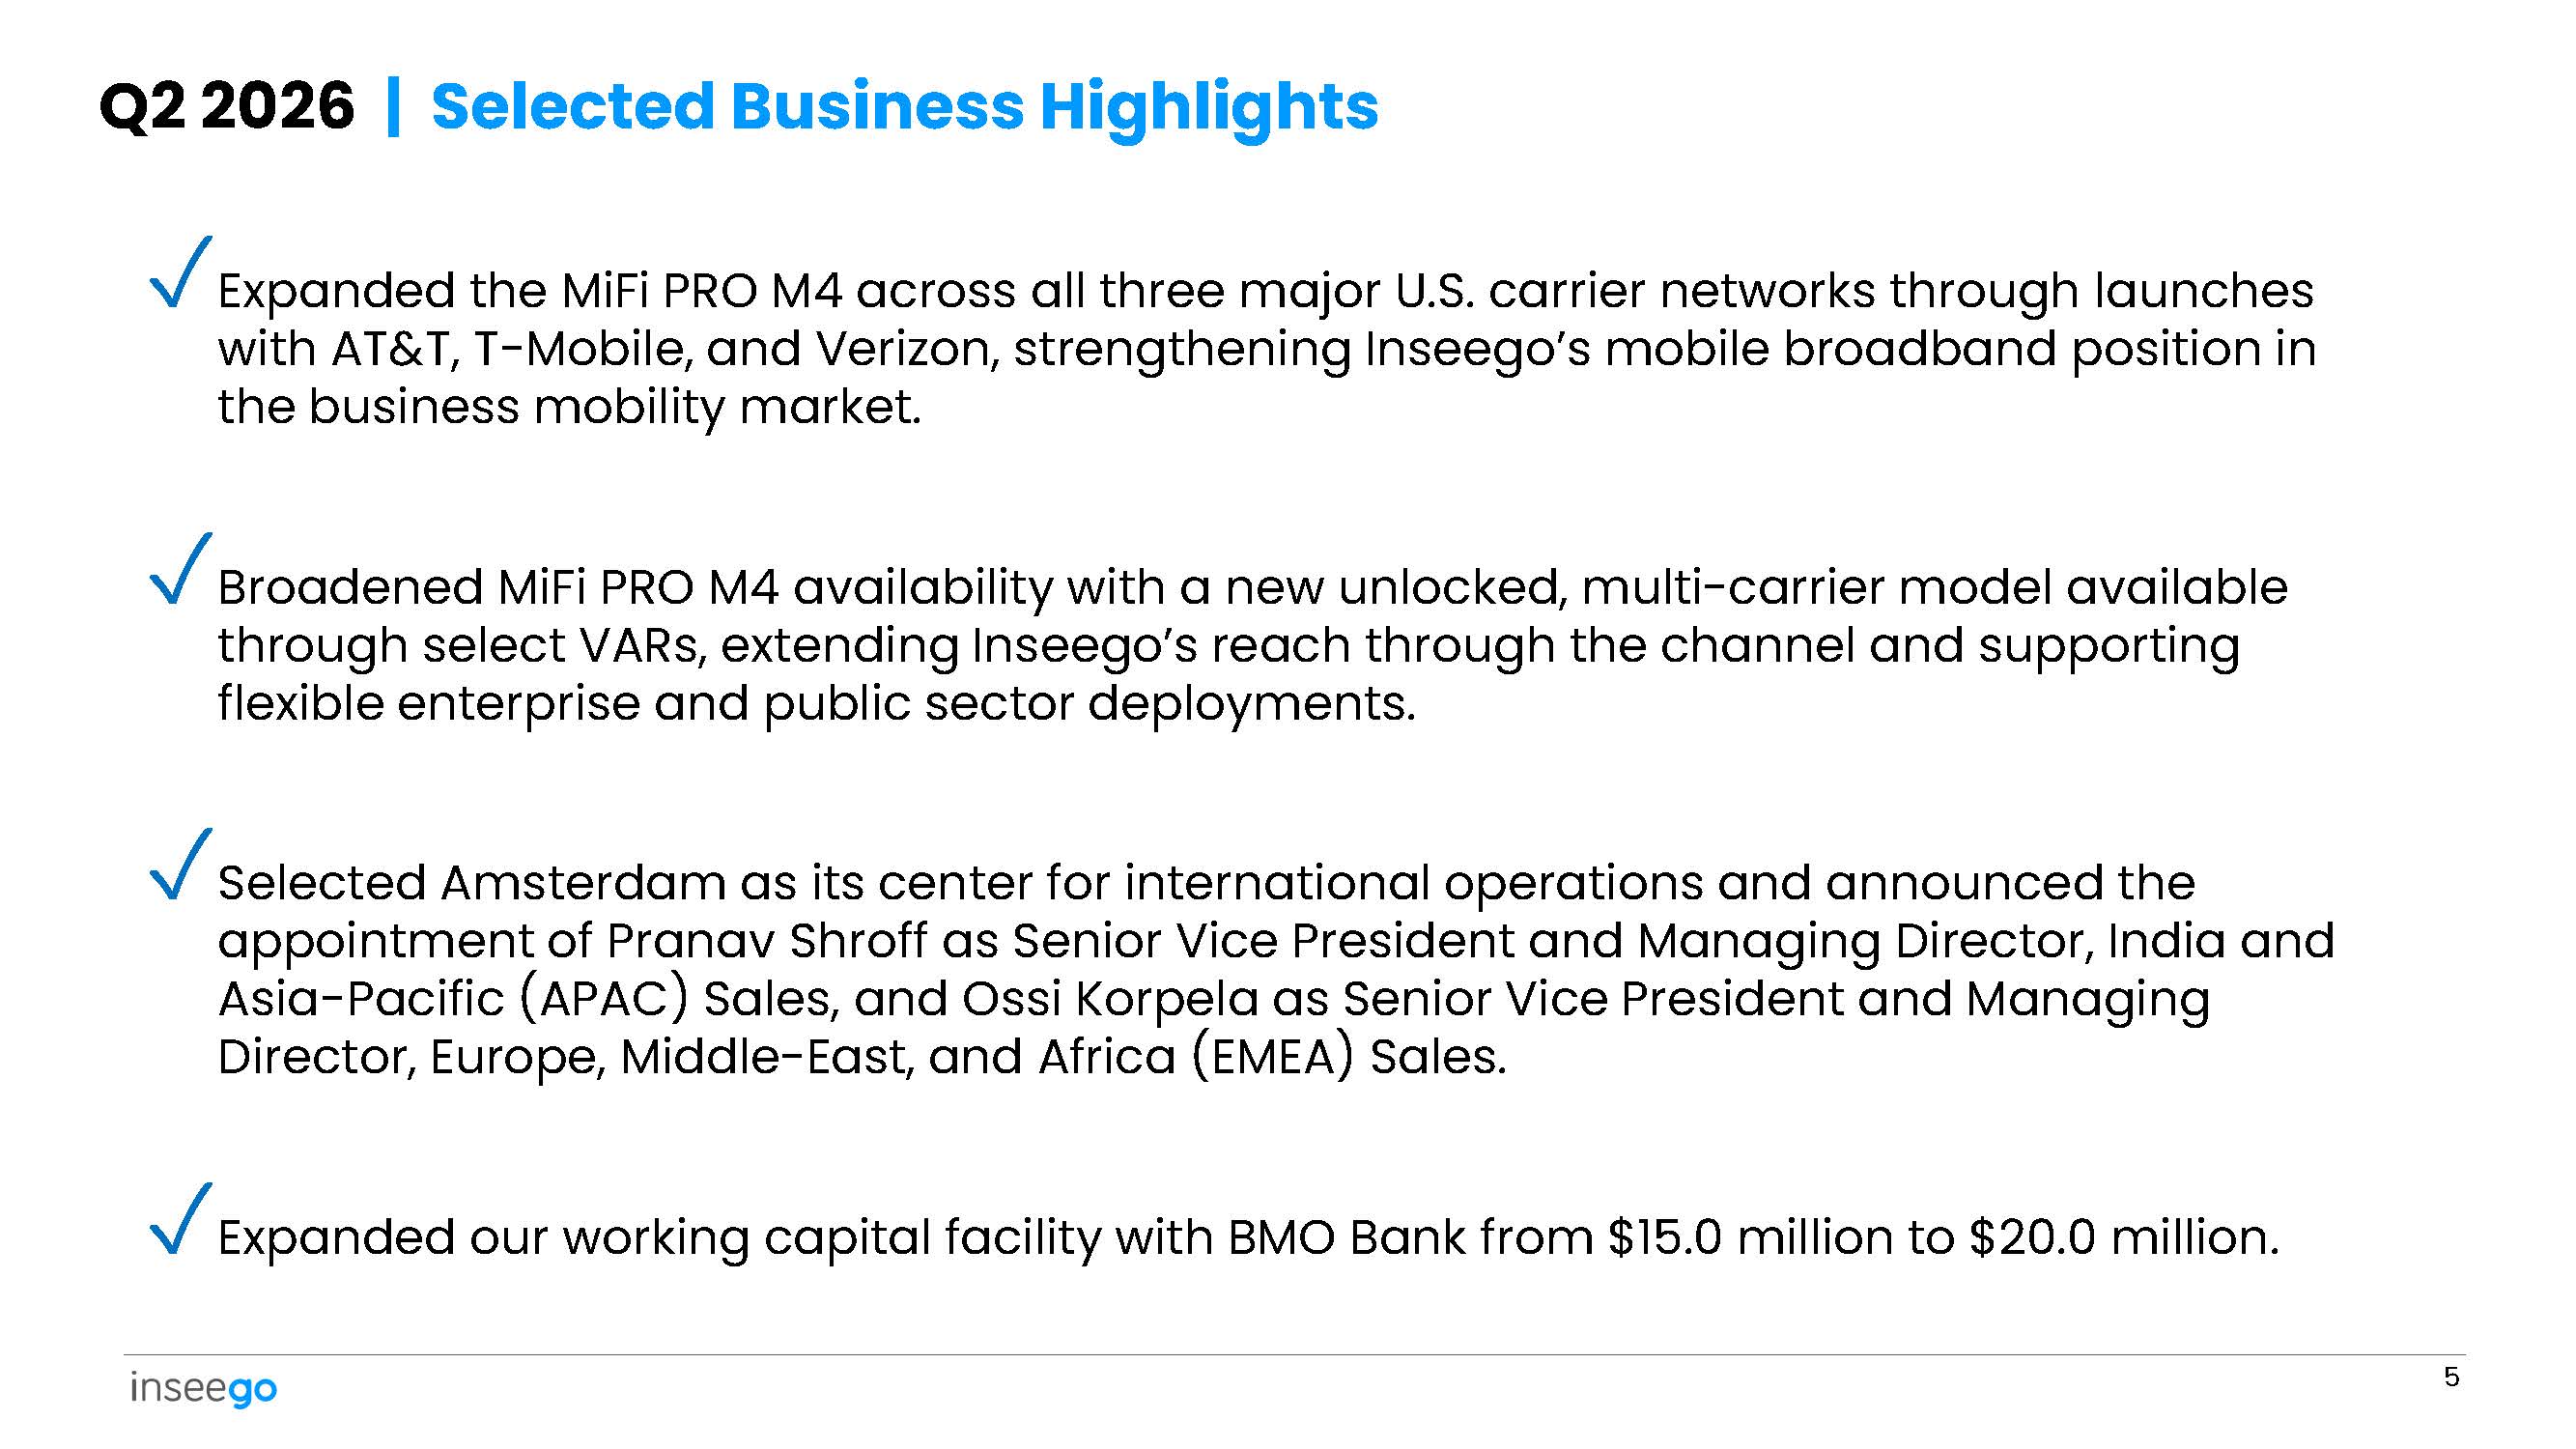
✓ Expanded the MiFi PRO M4 across all three major U.S. carrier networks through launches with AT&T, T - Mobile, and Verizon, strengthening Inseego’s mobile broadband position in the business mobility market. ✓ Broadened MiFi PRO M4 availability with a new unlocked, multi - carrier model available through select VARs, extending Inseego’s reach through the channel and supporting flexible enterprise and public sector deployments. ✓ Selected Amsterdam as its center for international operations and announced the appointment of Pranav Shroff as Senior Vice President and Managing Director, India and Asia - Pacific (APAC) Sales, and Ossi Korpela as Senior Vice President and Managing Director, Europe, Middle - East, and Africa (EMEA) Sales. ✓ Expanded our working capital facility with BMO Bank from $15.0 million to $20.0 million. 5 Q2 2026 | Selected Business Highlights
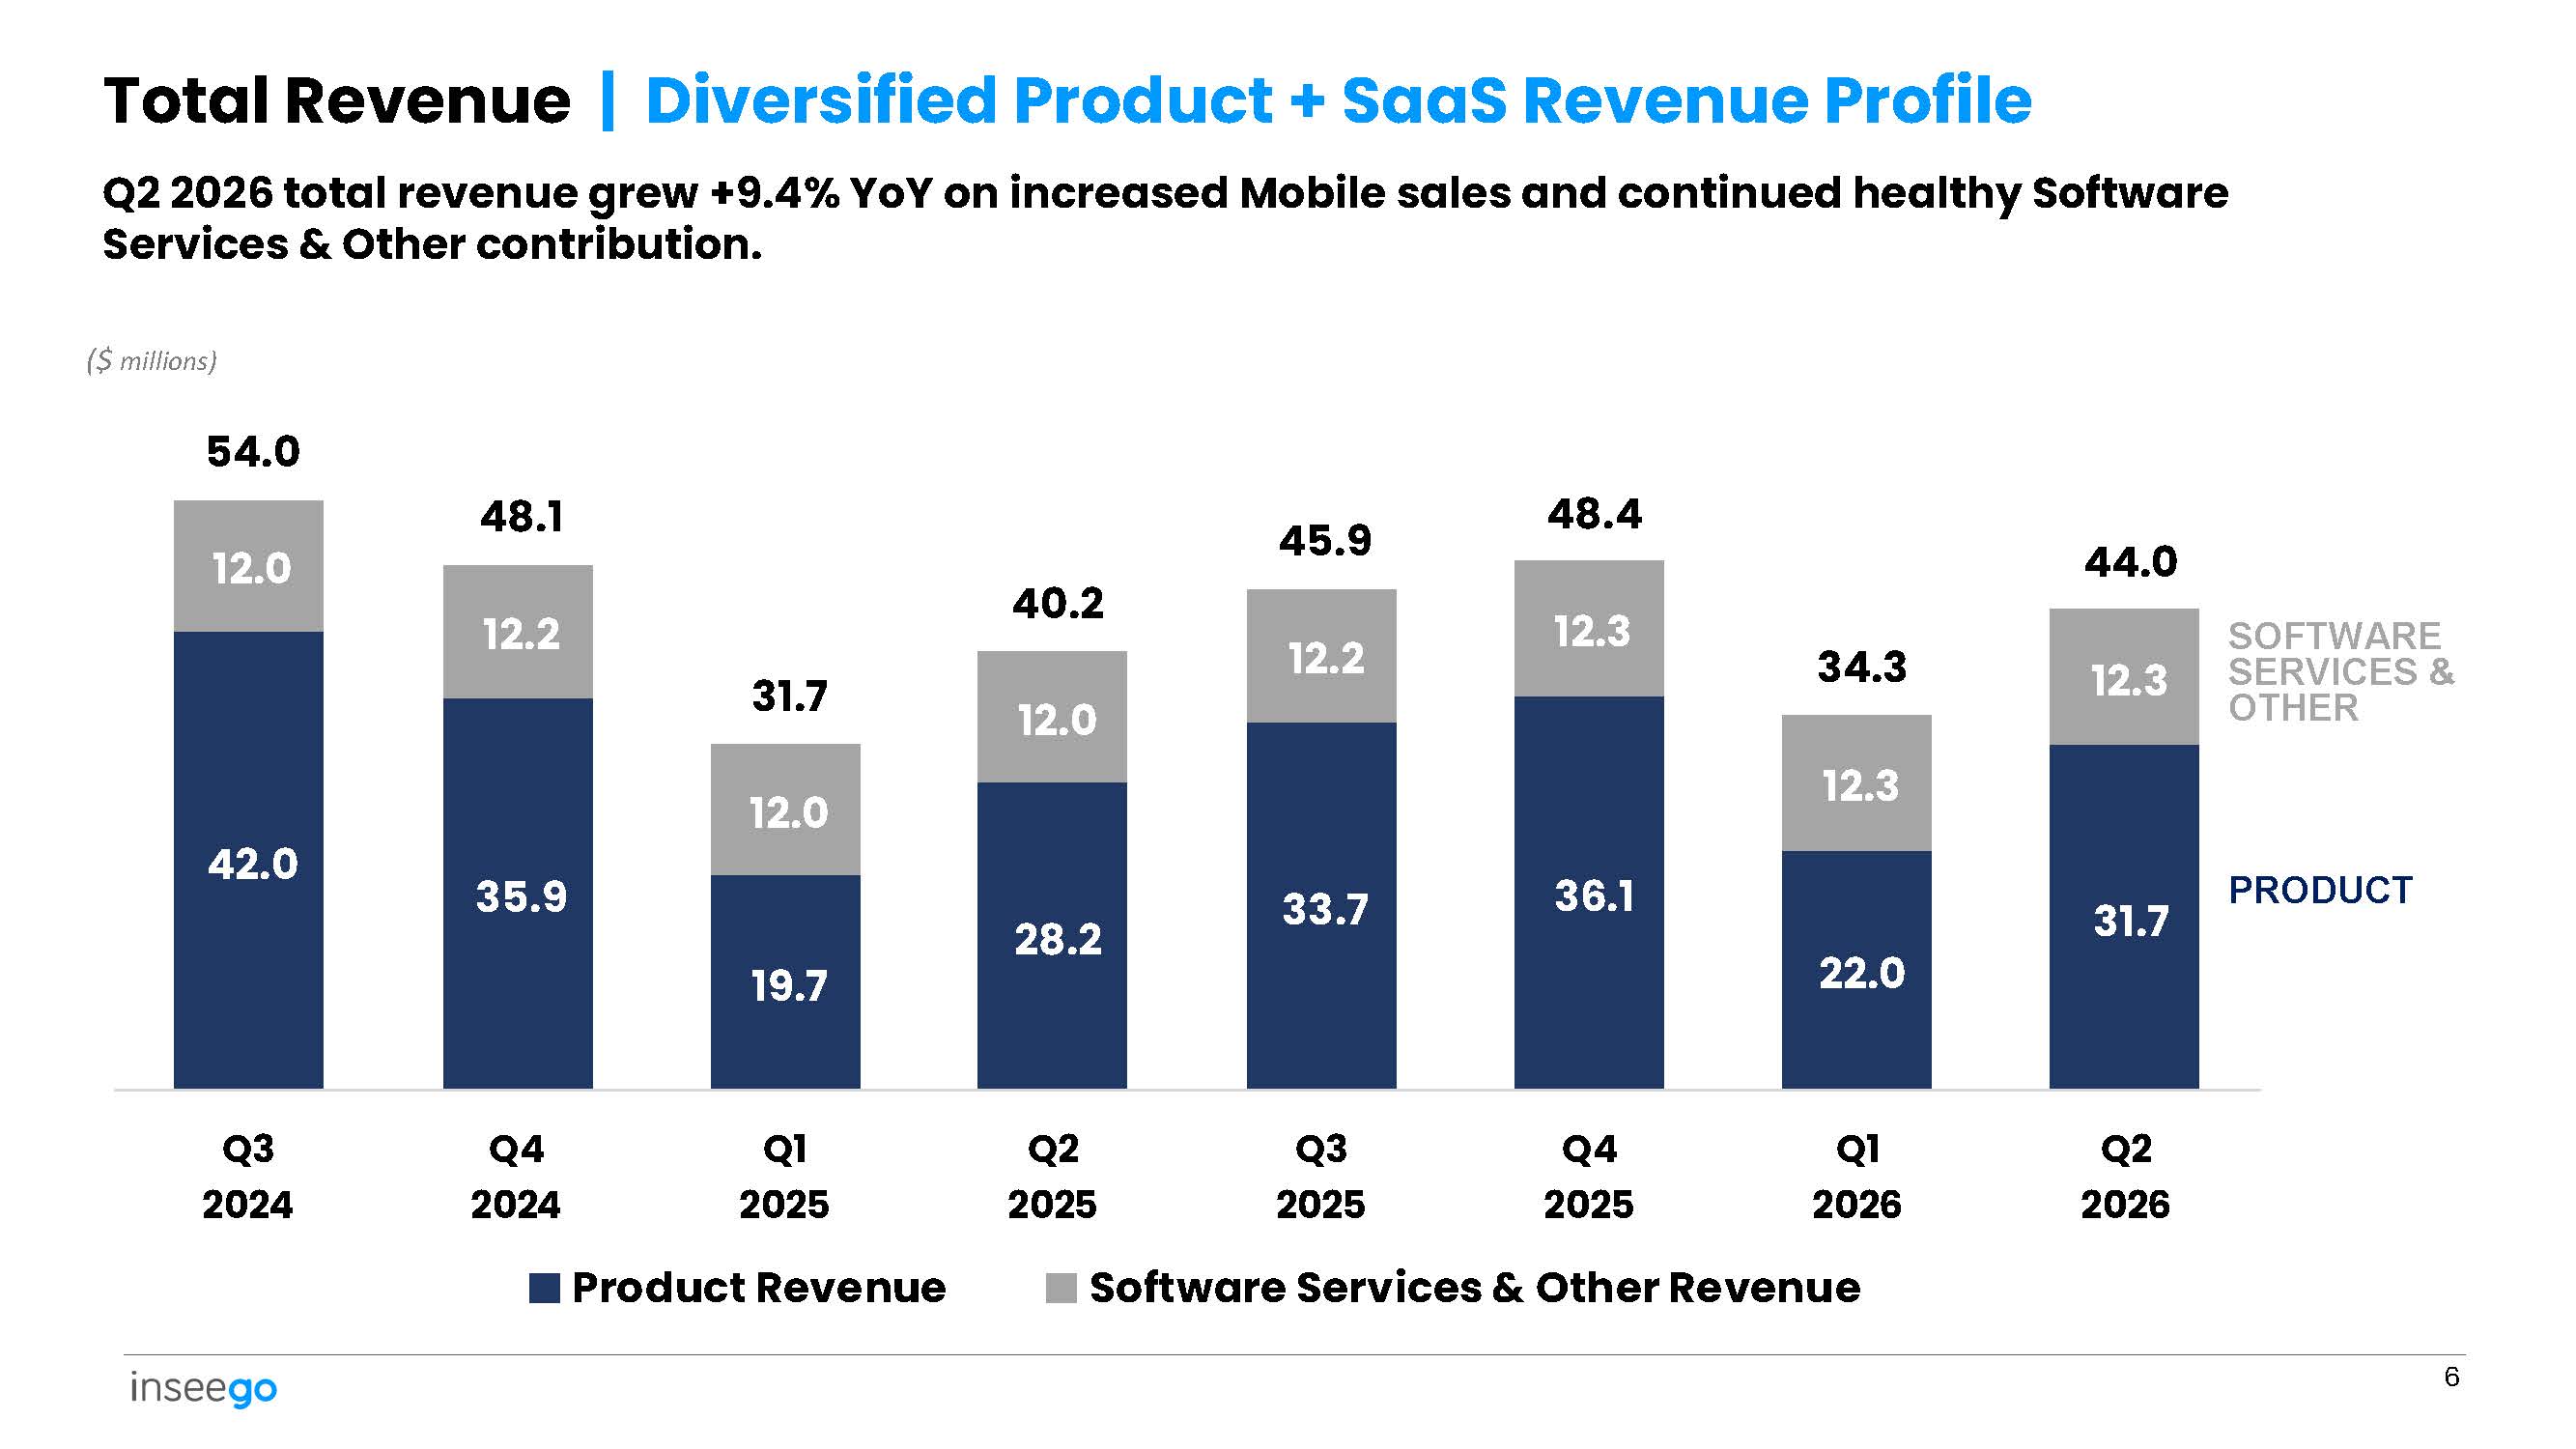
42.0 35.9 19.7 28.2 33.7 36.1 22.0 31.7 12.0 12.2 12.0 12.0 12.2 12.3 12.3 12.3 Q2 2026 total revenue grew +9.4% YoY on increased Mobile sales and continued healthy Software Services & Other contribution. ($ millions) 54.0 48.1 31.7 40.2 45.9 48.4 34.3 44.0 Q3 2024 Q4 2024 Q1 2025 Product Revenue Q2 2025 Q3 2025 Q4 2025 Q1 2026 Q2 2026 Software Services & Other Revenue 6 Total Revenue | Diversified Product + SaaS Revenue Profile PRODUCT SOFTWARE SERVICES & OTHER
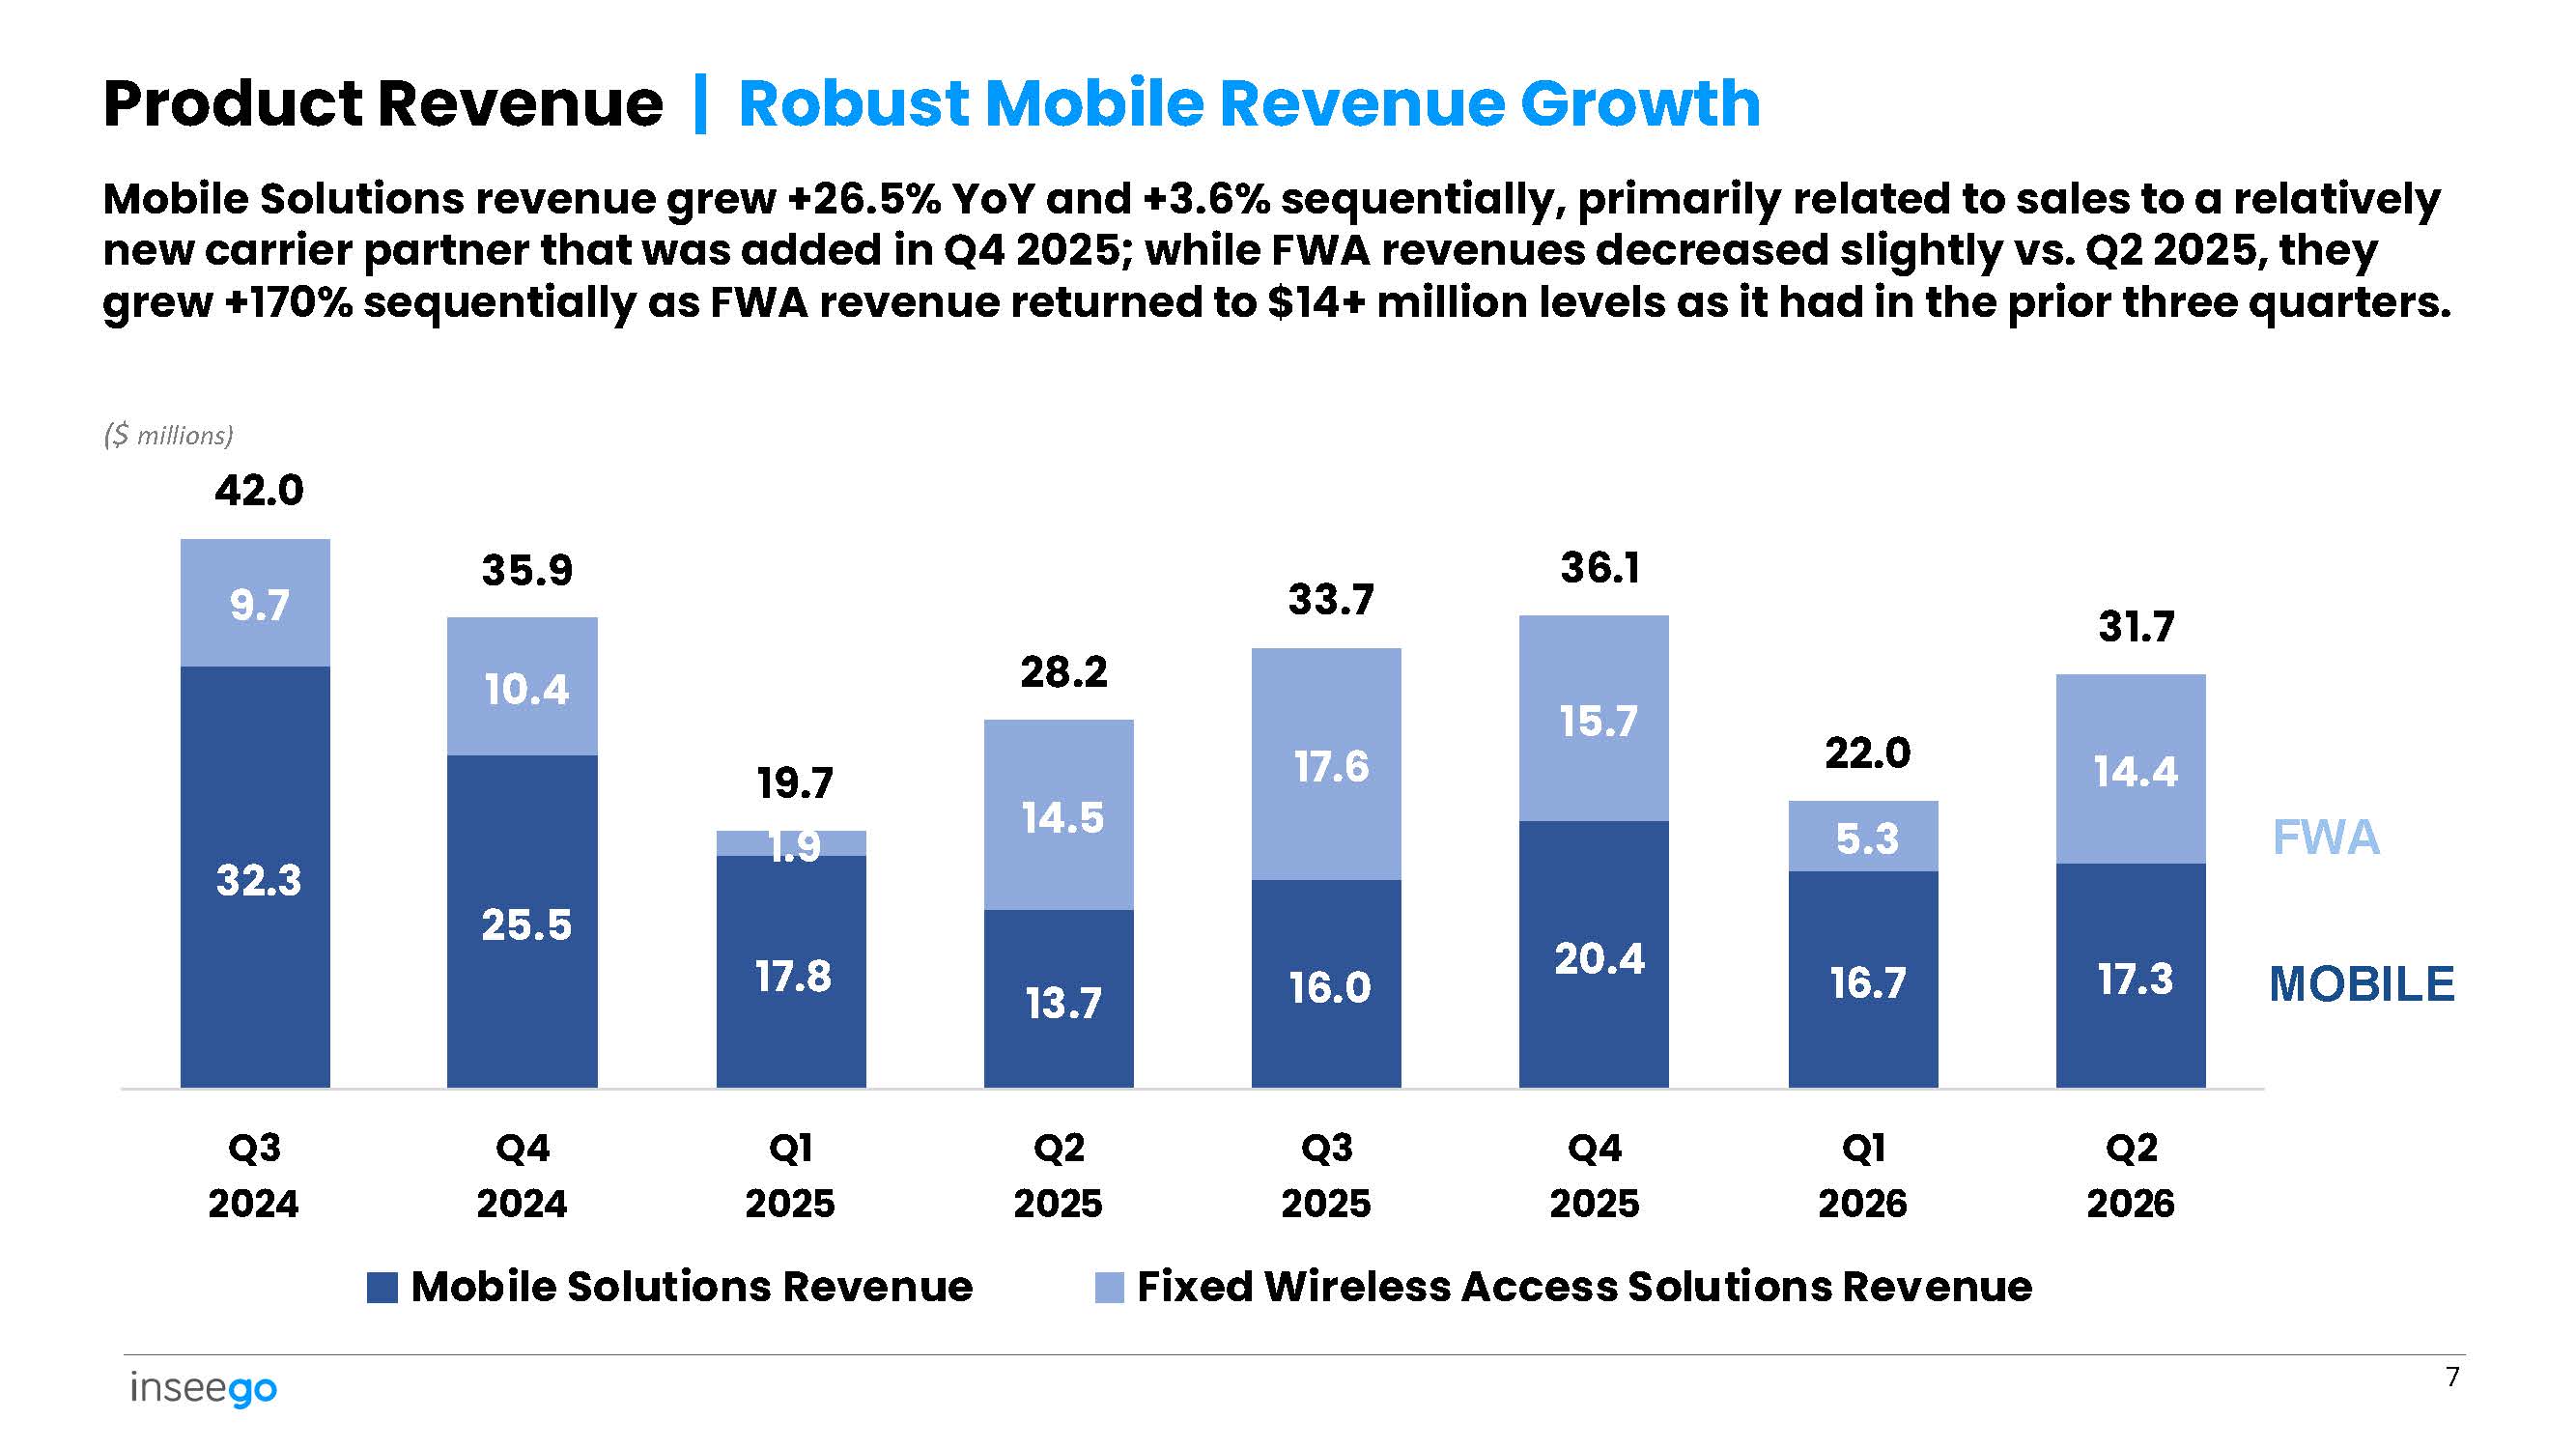
32.3 25.5 17.8 13.7 16.0 20.4 16.7 17.3 9.7 10.4 14.5 17.6 15.7 5.3 14.4 Mobile Solutions revenue grew +26.5% YoY and +3.6% sequentially, primarily related to sales to a relatively new carrier partner that was added in Q4 2025; while FWA revenues decreased slightly vs. Q2 2025, they grew +170% sequentially as FWA revenue returned to $14+ million levels as it had in the prior three quarters. ($ millions) 42.0 35.9 19.7 1.9 28.2 33.7 36.1 22.0 31.7 Q3 2024 Q4 2024 Q1 2025 Q2 2025 Q3 2025 Q4 2025 Q1 2026 Q2 2026 Mobile Solutions Revenue Fixed Wireless Access Solutions Revenue 7 Product Revenue | Robust Mobile Revenue Growth MOBILE FWA
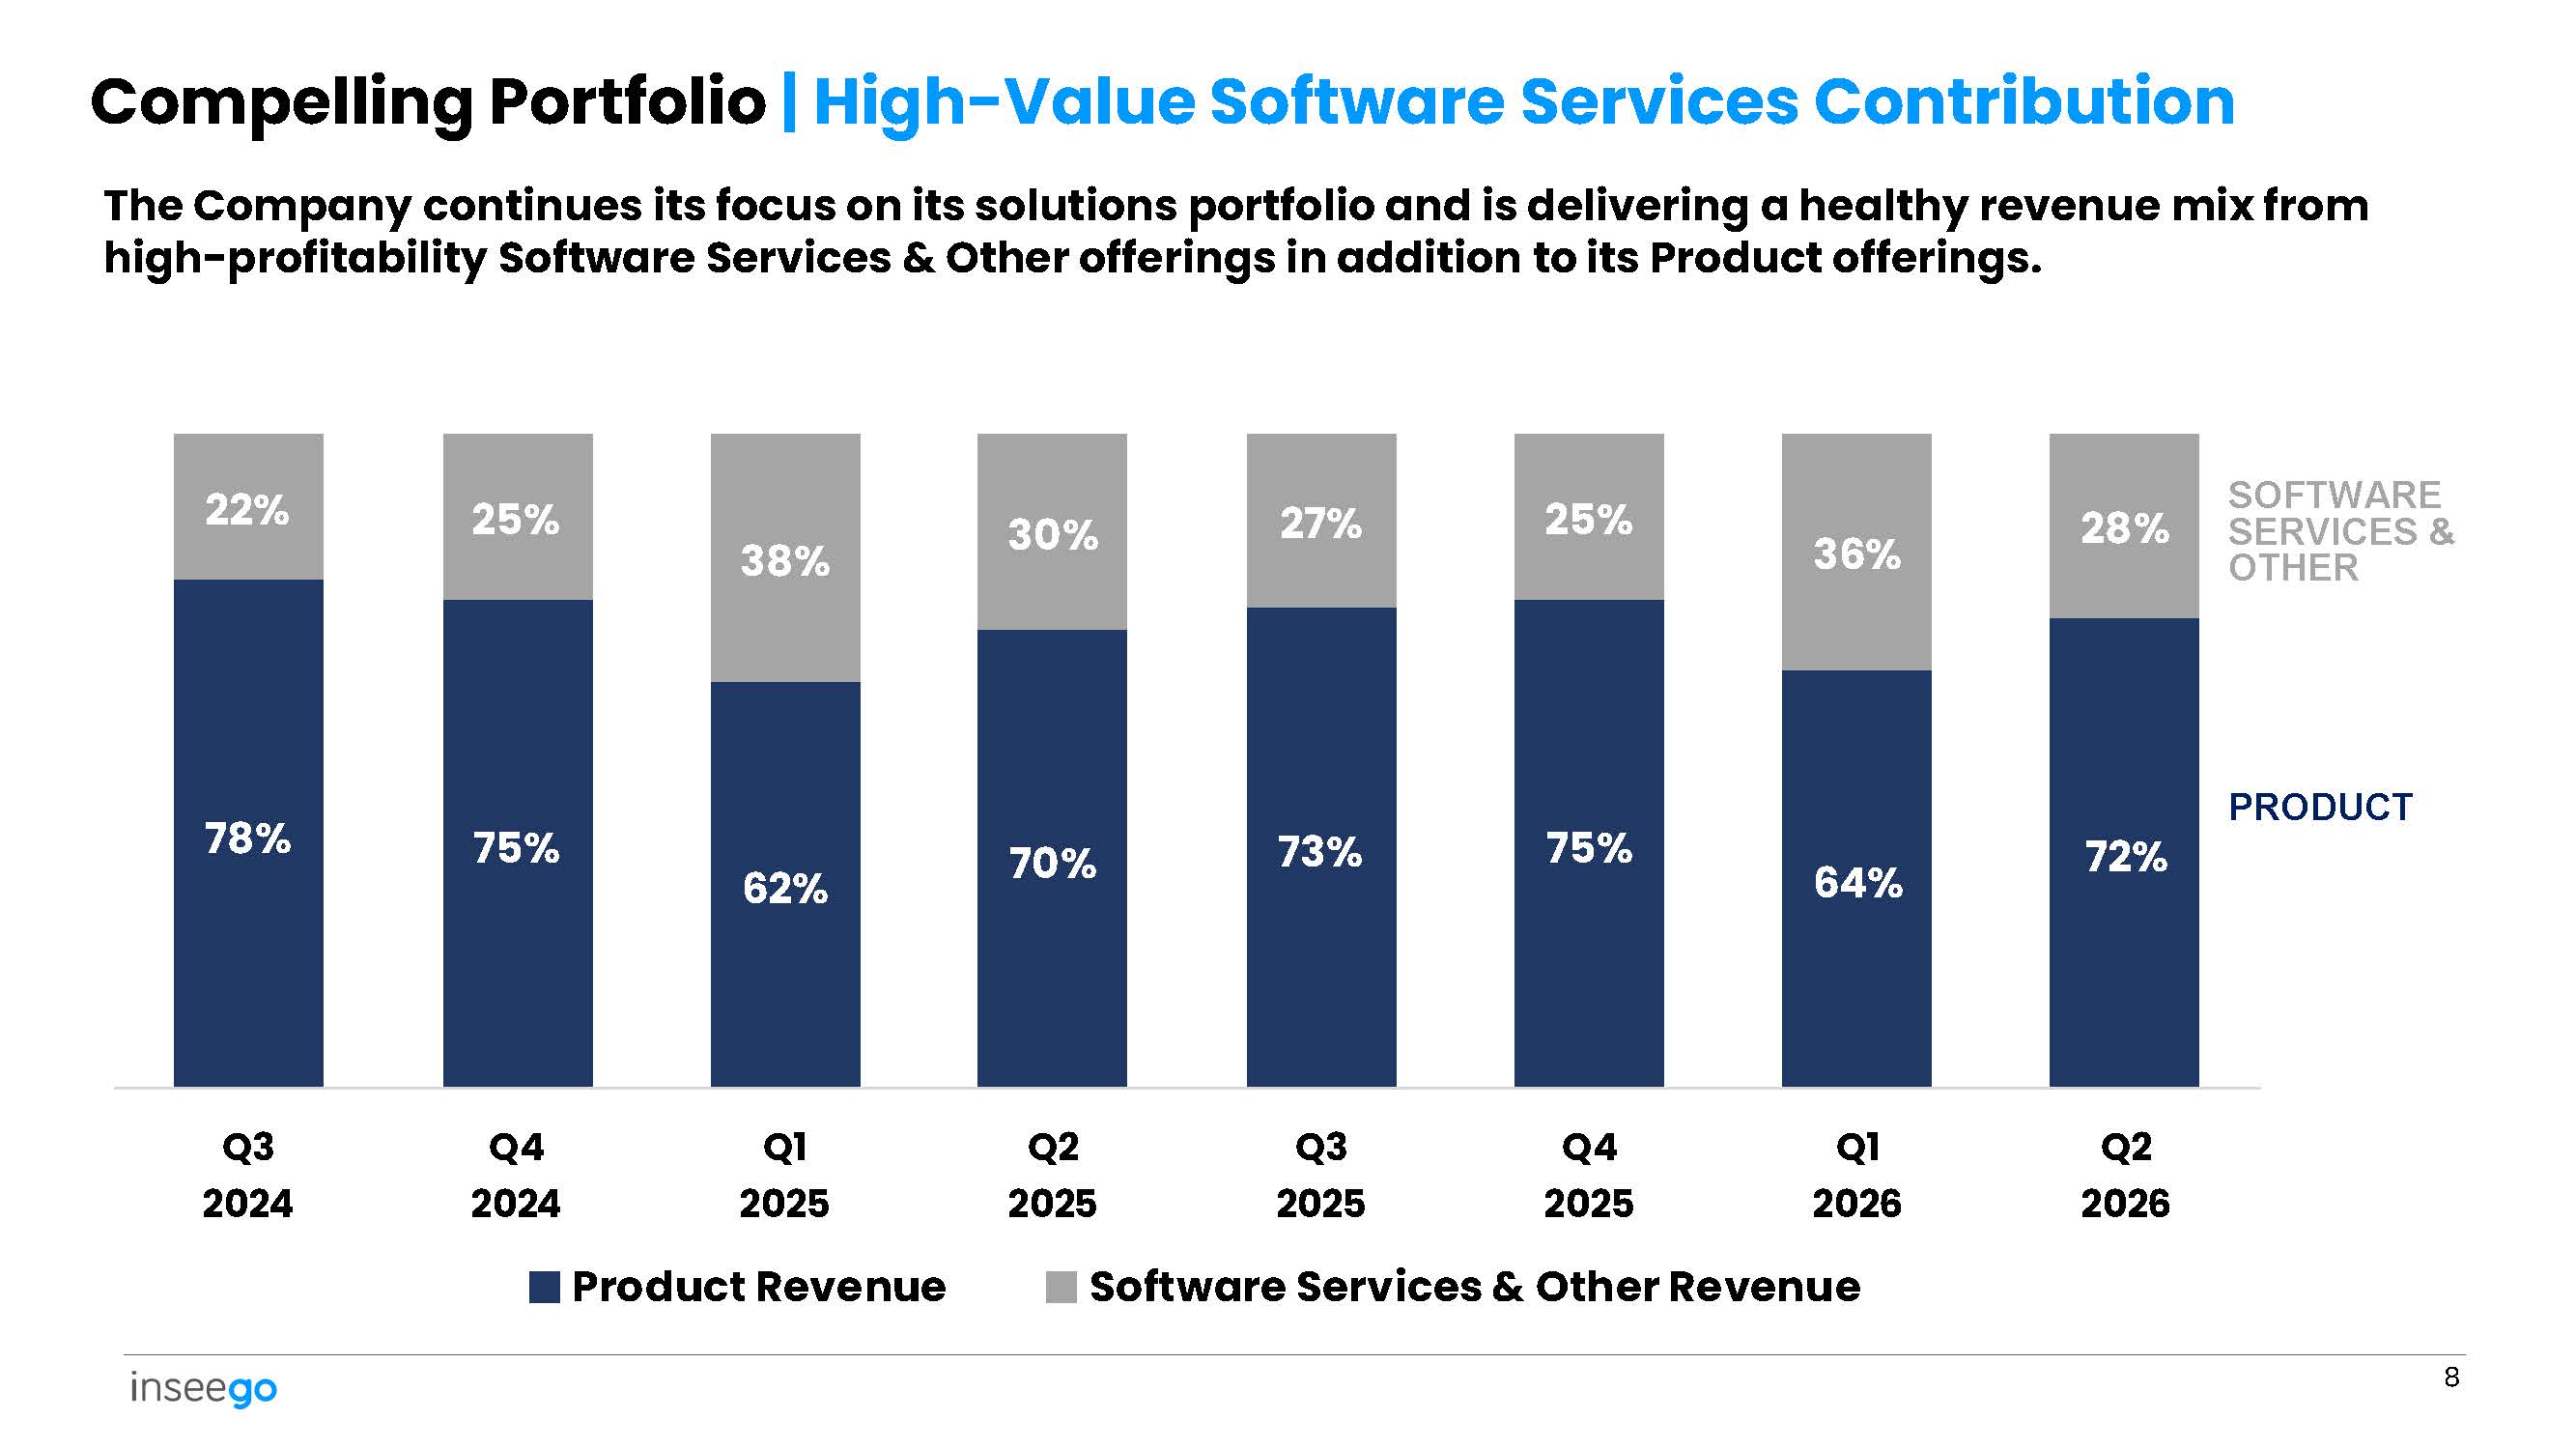
78% 75% 62% 70% 73% 75% 64% 72% 22% 25% 38% 30% 27% 25% 36% 28% Q2 Q1 Q4 Q3 Q2 Q1 Q4 Q3 2026 2026 2025 2025 2025 2025 2024 2024 Product Revenue Software Services & Other Revenue 8 Compelling Portfolio | High - Value Software Services Contribution The Company continues its focus on its solutions portfolio and is delivering a healthy revenue mix from high - profitability Software Services & Other offerings in addition to its Product offerings. PRODUCT SOFTWARE SERVICES & OTHER
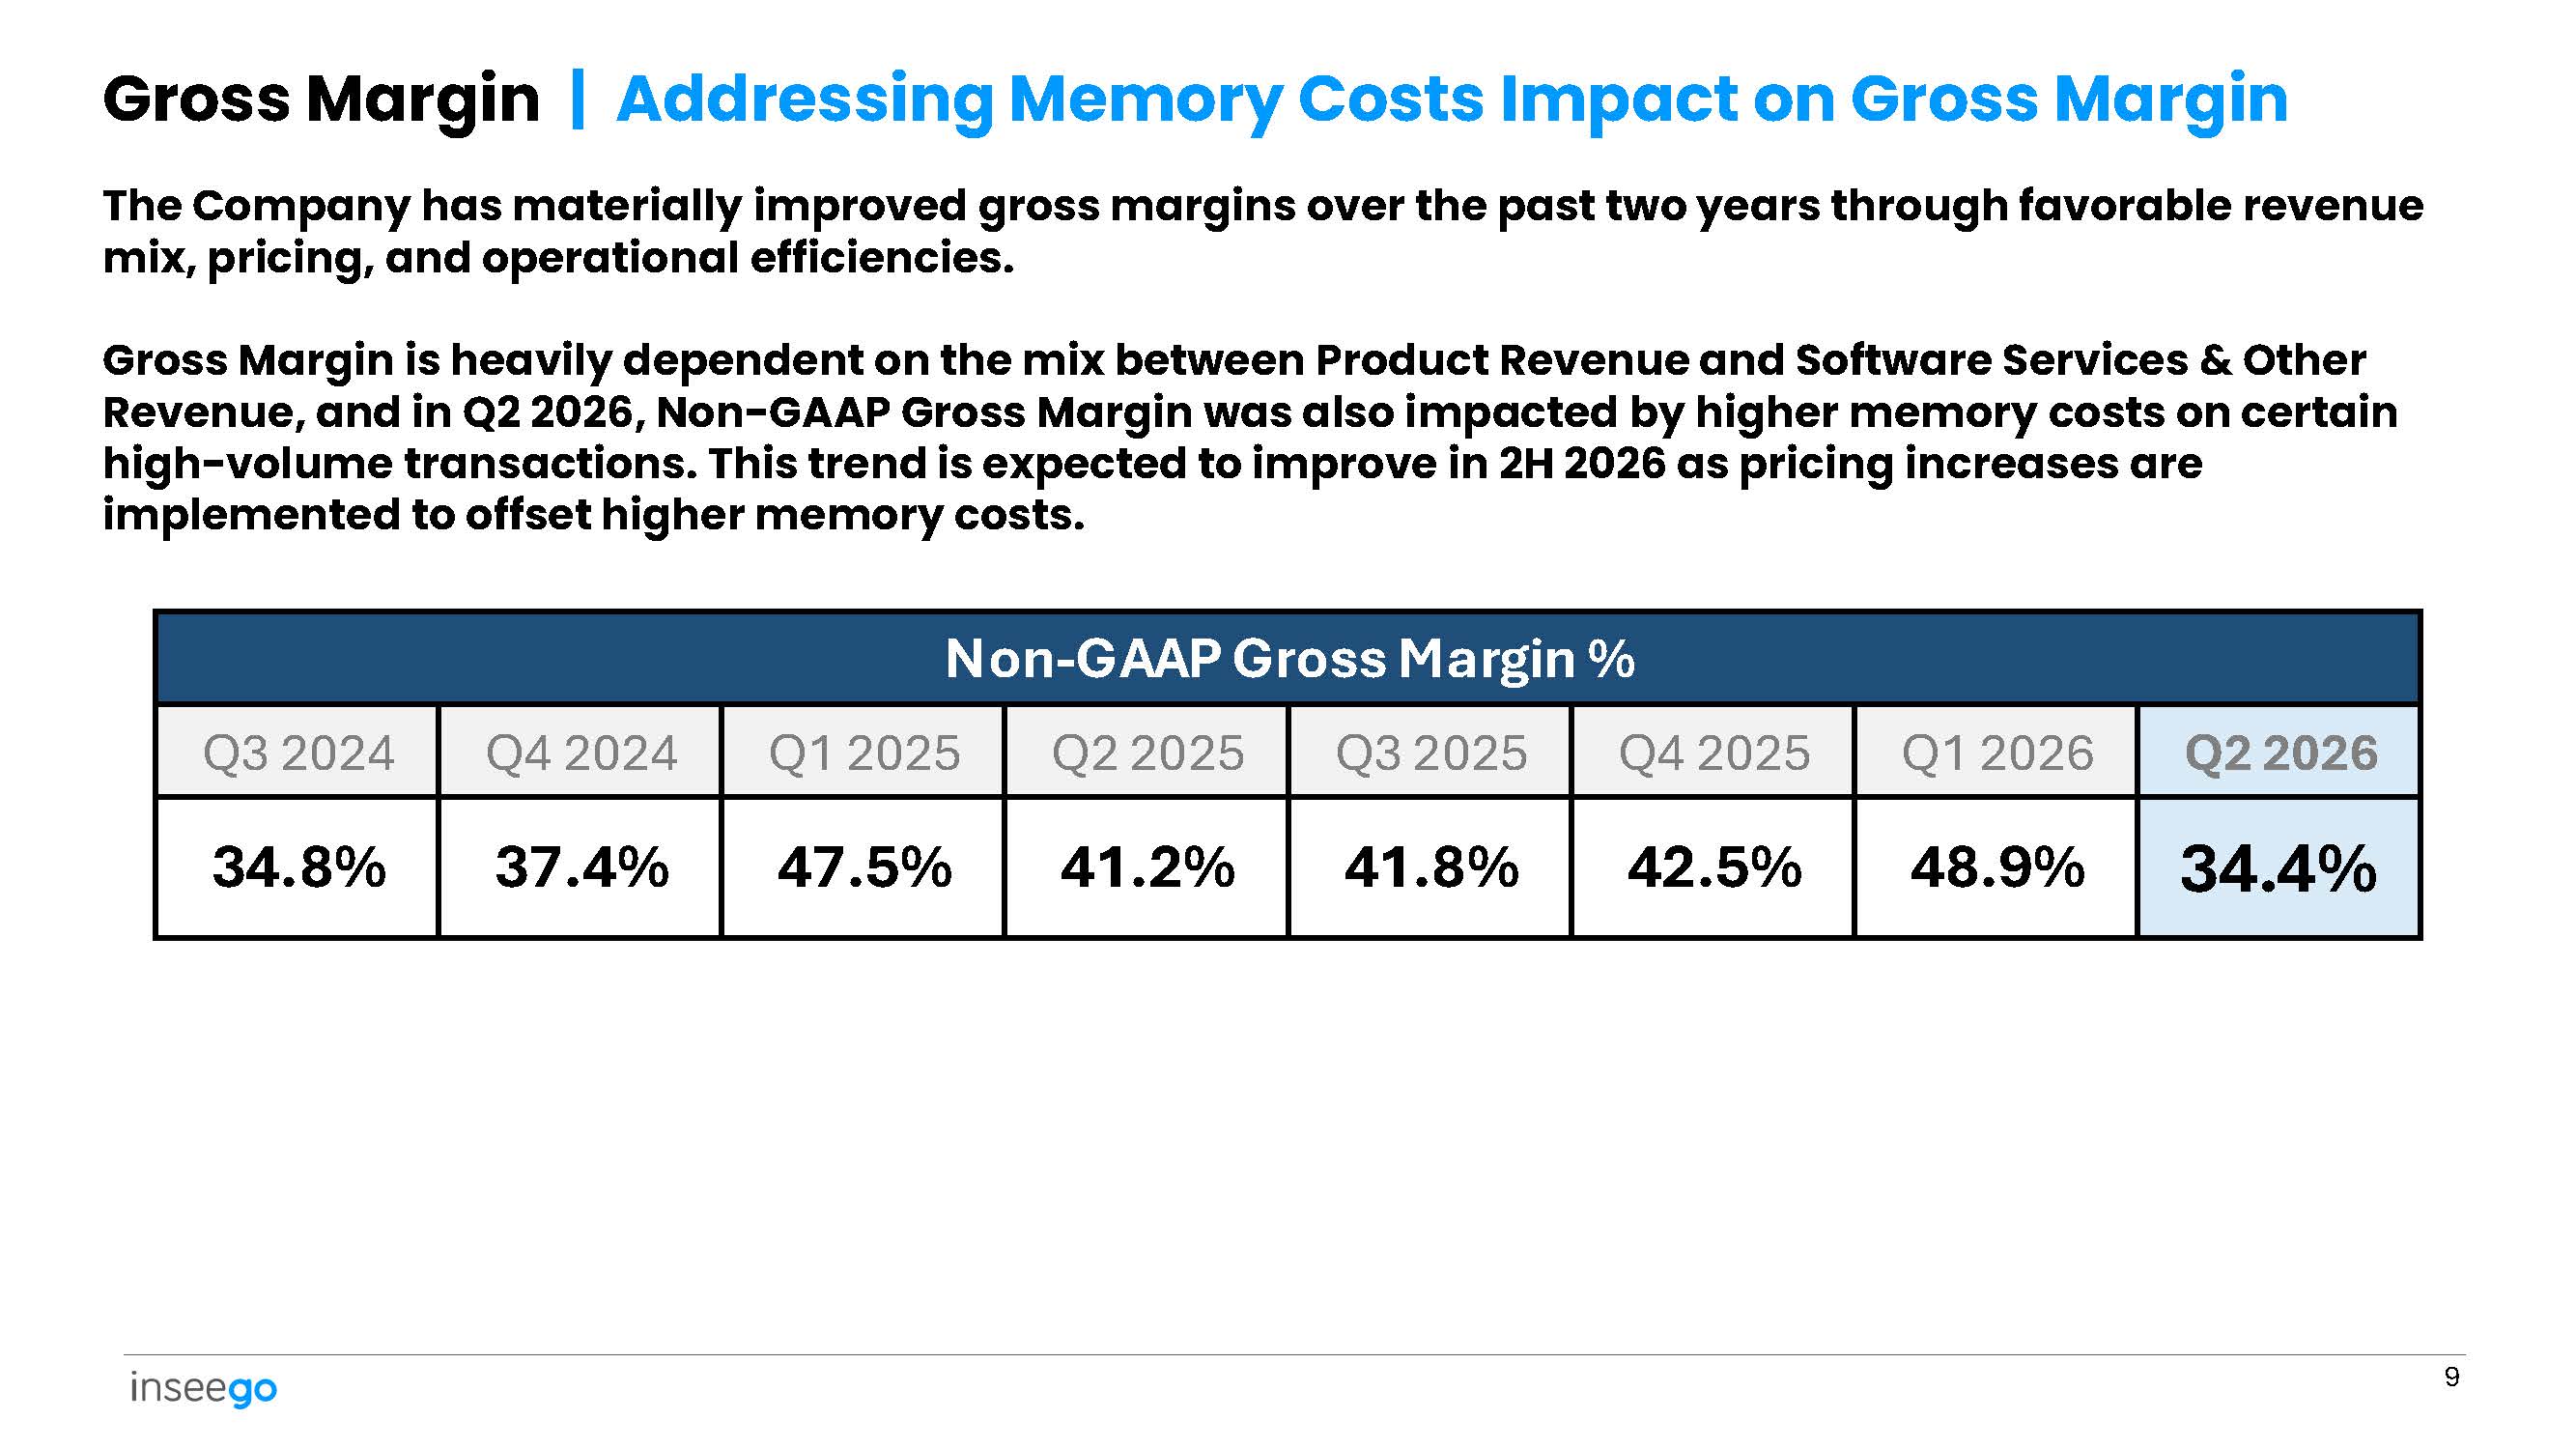
Gross Margin | Addressing Memory Costs Impact on Gross Margin 9 The Company has materially improved gross margins over the past two years through favorable revenue mix, pricing, and operational efficiencies. Gross Margin is heavily dependent on the mix between Product Revenue and Software Services & Other Revenue, and in Q2 2026, Non - GAAP Gross Margin was also impacted by higher memory costs on certain high - volume transactions. This trend is expected to improve in 2H 2026 as pricing increases are implemented to offset higher memory costs. Non - GAAP Gross Margin % Q2 2026 Q1 2026 Q4 2025 Q3 2025 Q2 2025 Q1 2025 Q4 2024 Q3 2024 34.4% 48.9% 42.5% 41.8% 41.2% 47.5% 37.4% 34.8%
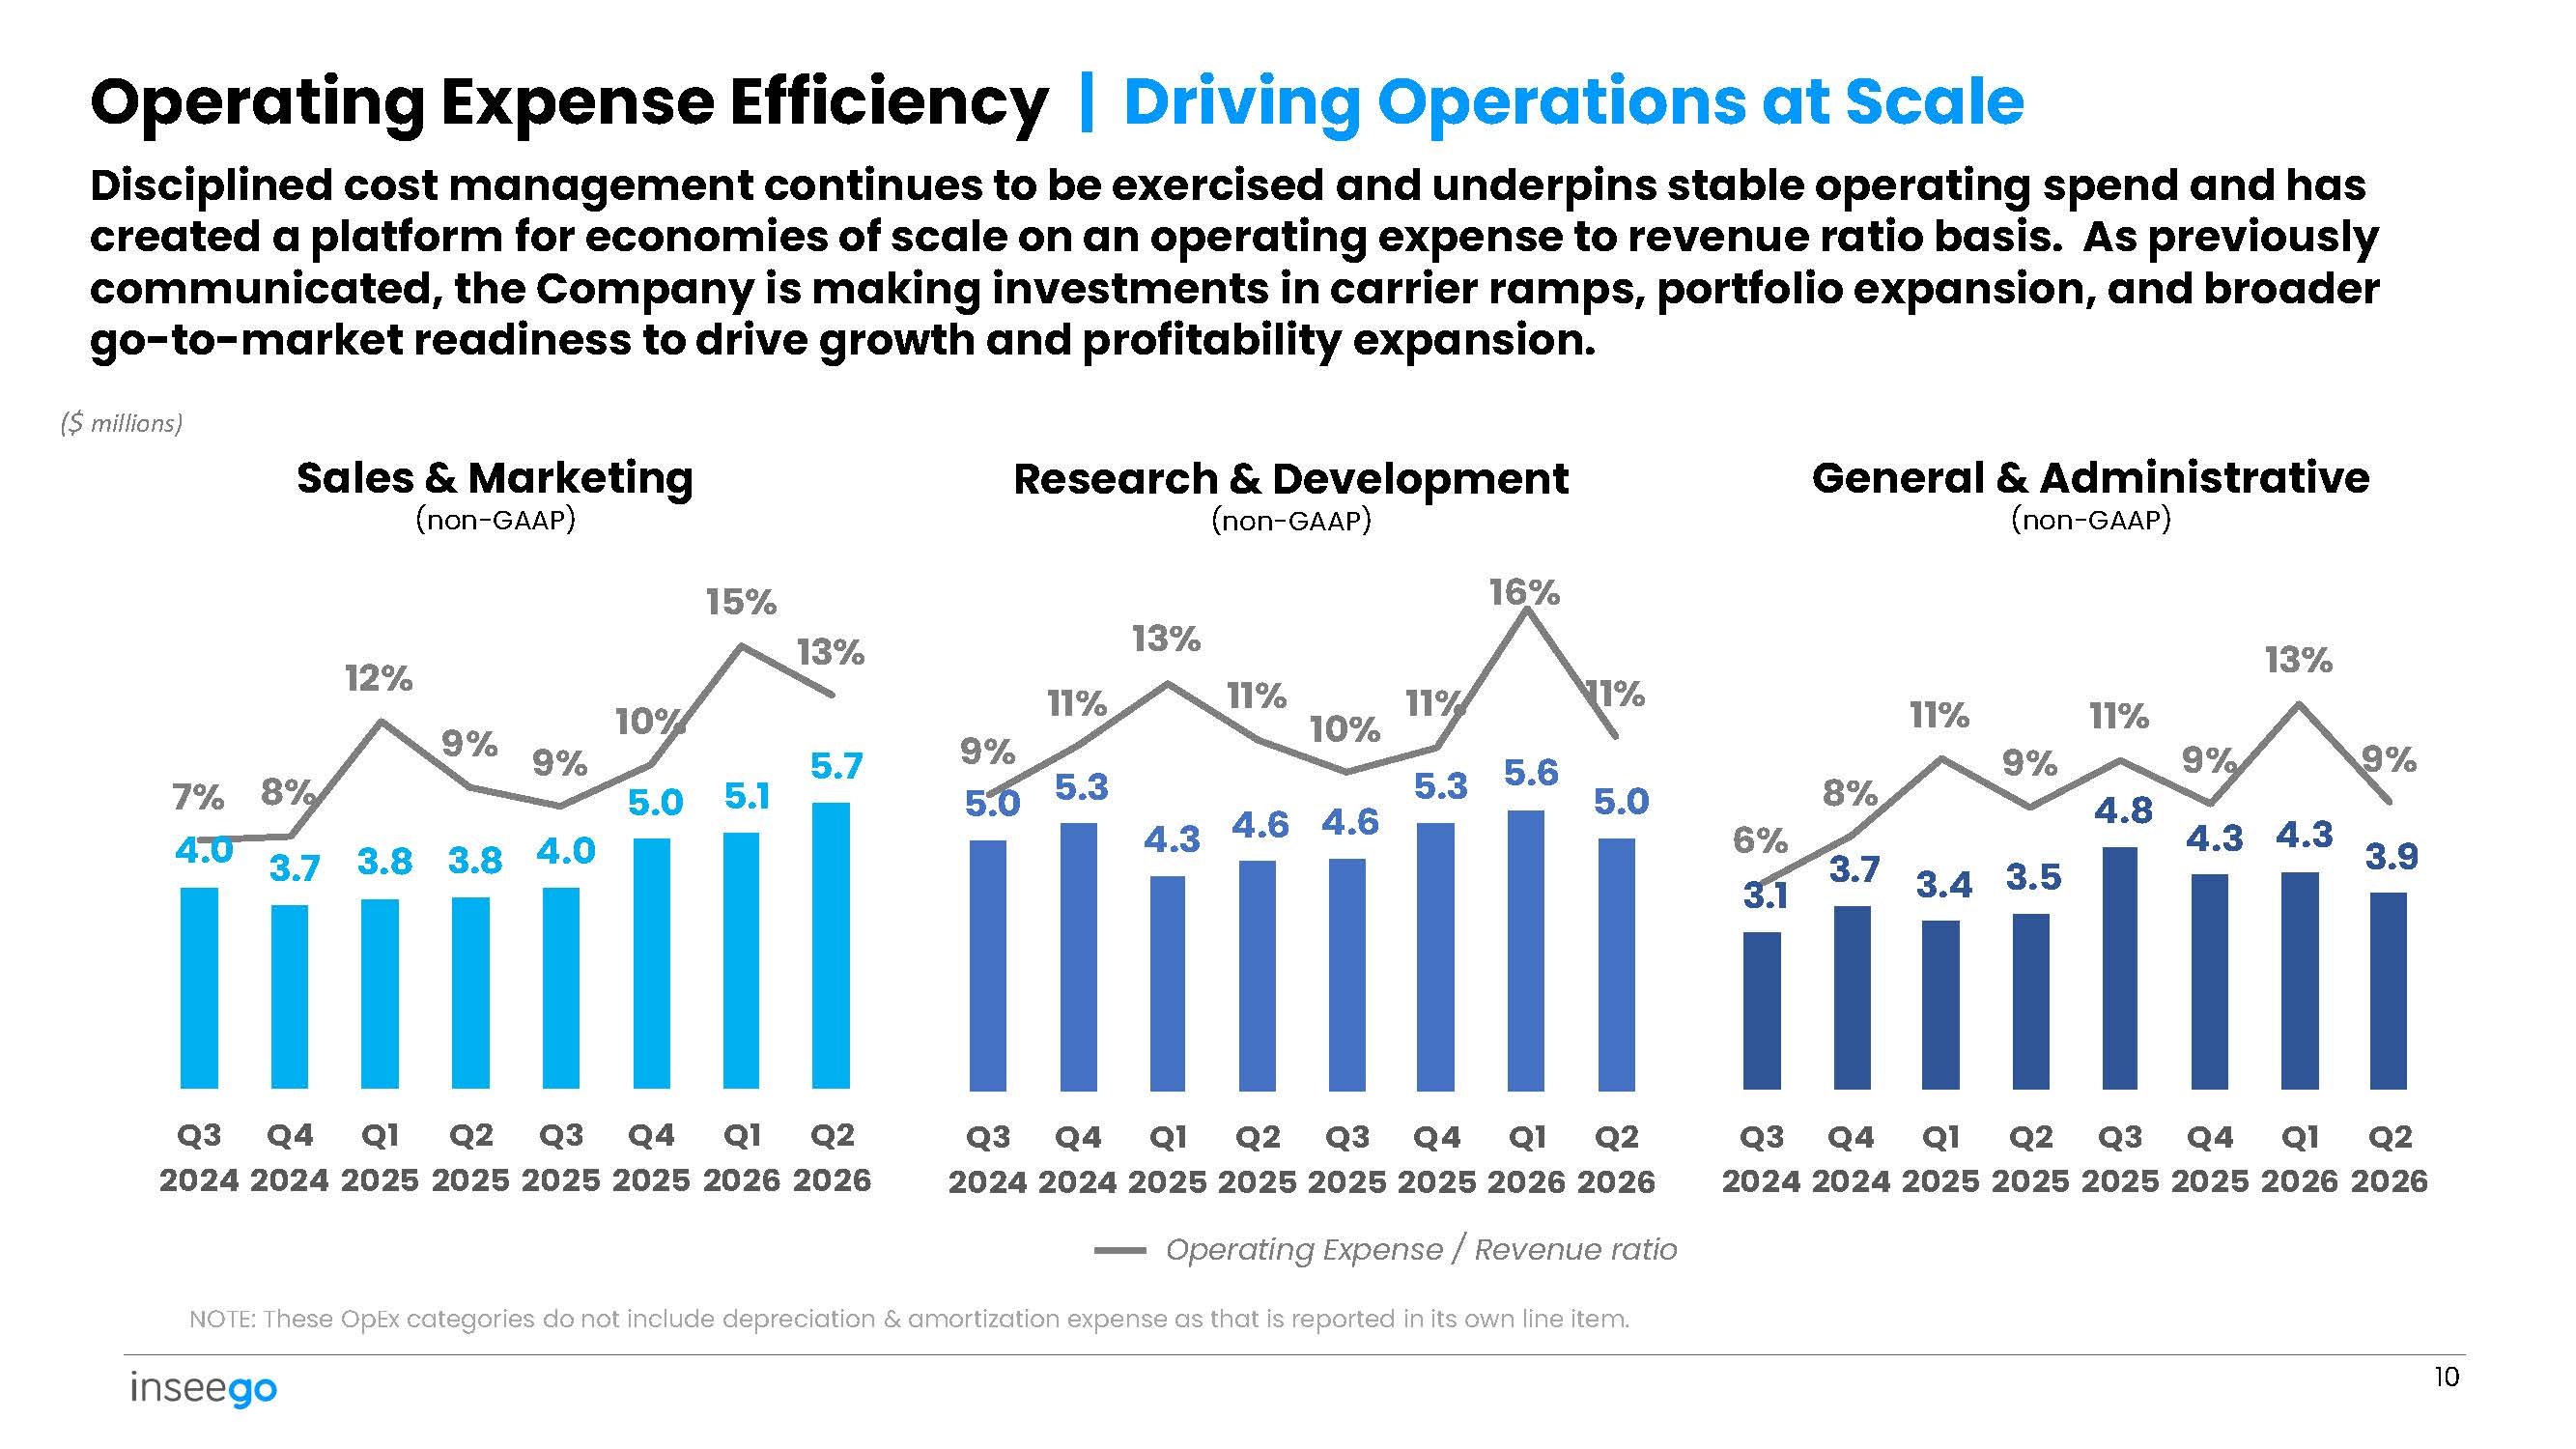
3.4 3.5 4.8 4.3 3.9 6% 3.1 8% 3.7 11% 9% 11% 9% 4.3 13% 9% 4.3 4.6 4.6 5.3 5.6 5.0 9% 5.0 11% 5.3 13% 11% 10% 11% 16% 11% Operating Expense Efficiency | Driving Operations at Scale Disciplined cost management continues to be exercised and underpins stable operating spend and has created a platform for economies of scale on an operating expense to revenue ratio basis . As previously communicated, the Company is making investments in carrier ramps, portfolio expansion, and broader go - to - market readiness to drive growth and profitability expansion . ($ millions) Sales & Marketing (non - GAAP) Research & Development (non - GAAP) General & Administrative (non - GAAP) Q3 Q4 Q1 Q2 Q3 Q4 Q1 Q2 Q3 Q4 Q1 Q2 Q3 Q4 Q1 Q2 2024 2024 2025 2025 2025 2025 2026 2026 2024 2024 2025 2025 2025 2025 2026 2026 Operating Expense / Revenue ratio NOTE: These OpEx categories do not include depreciation & amortization expense as that is reported in its own line item. 3.8 3.8 10 5.1 5.7 7% 4.0 8% 3.7 12% 9% 9% 4.0 10% 5.0 15% 13% Q3 Q4 Q1 Q2 Q3 Q4 Q1 Q2 2024 2024 2025 2025 2025 2025 2026 2026
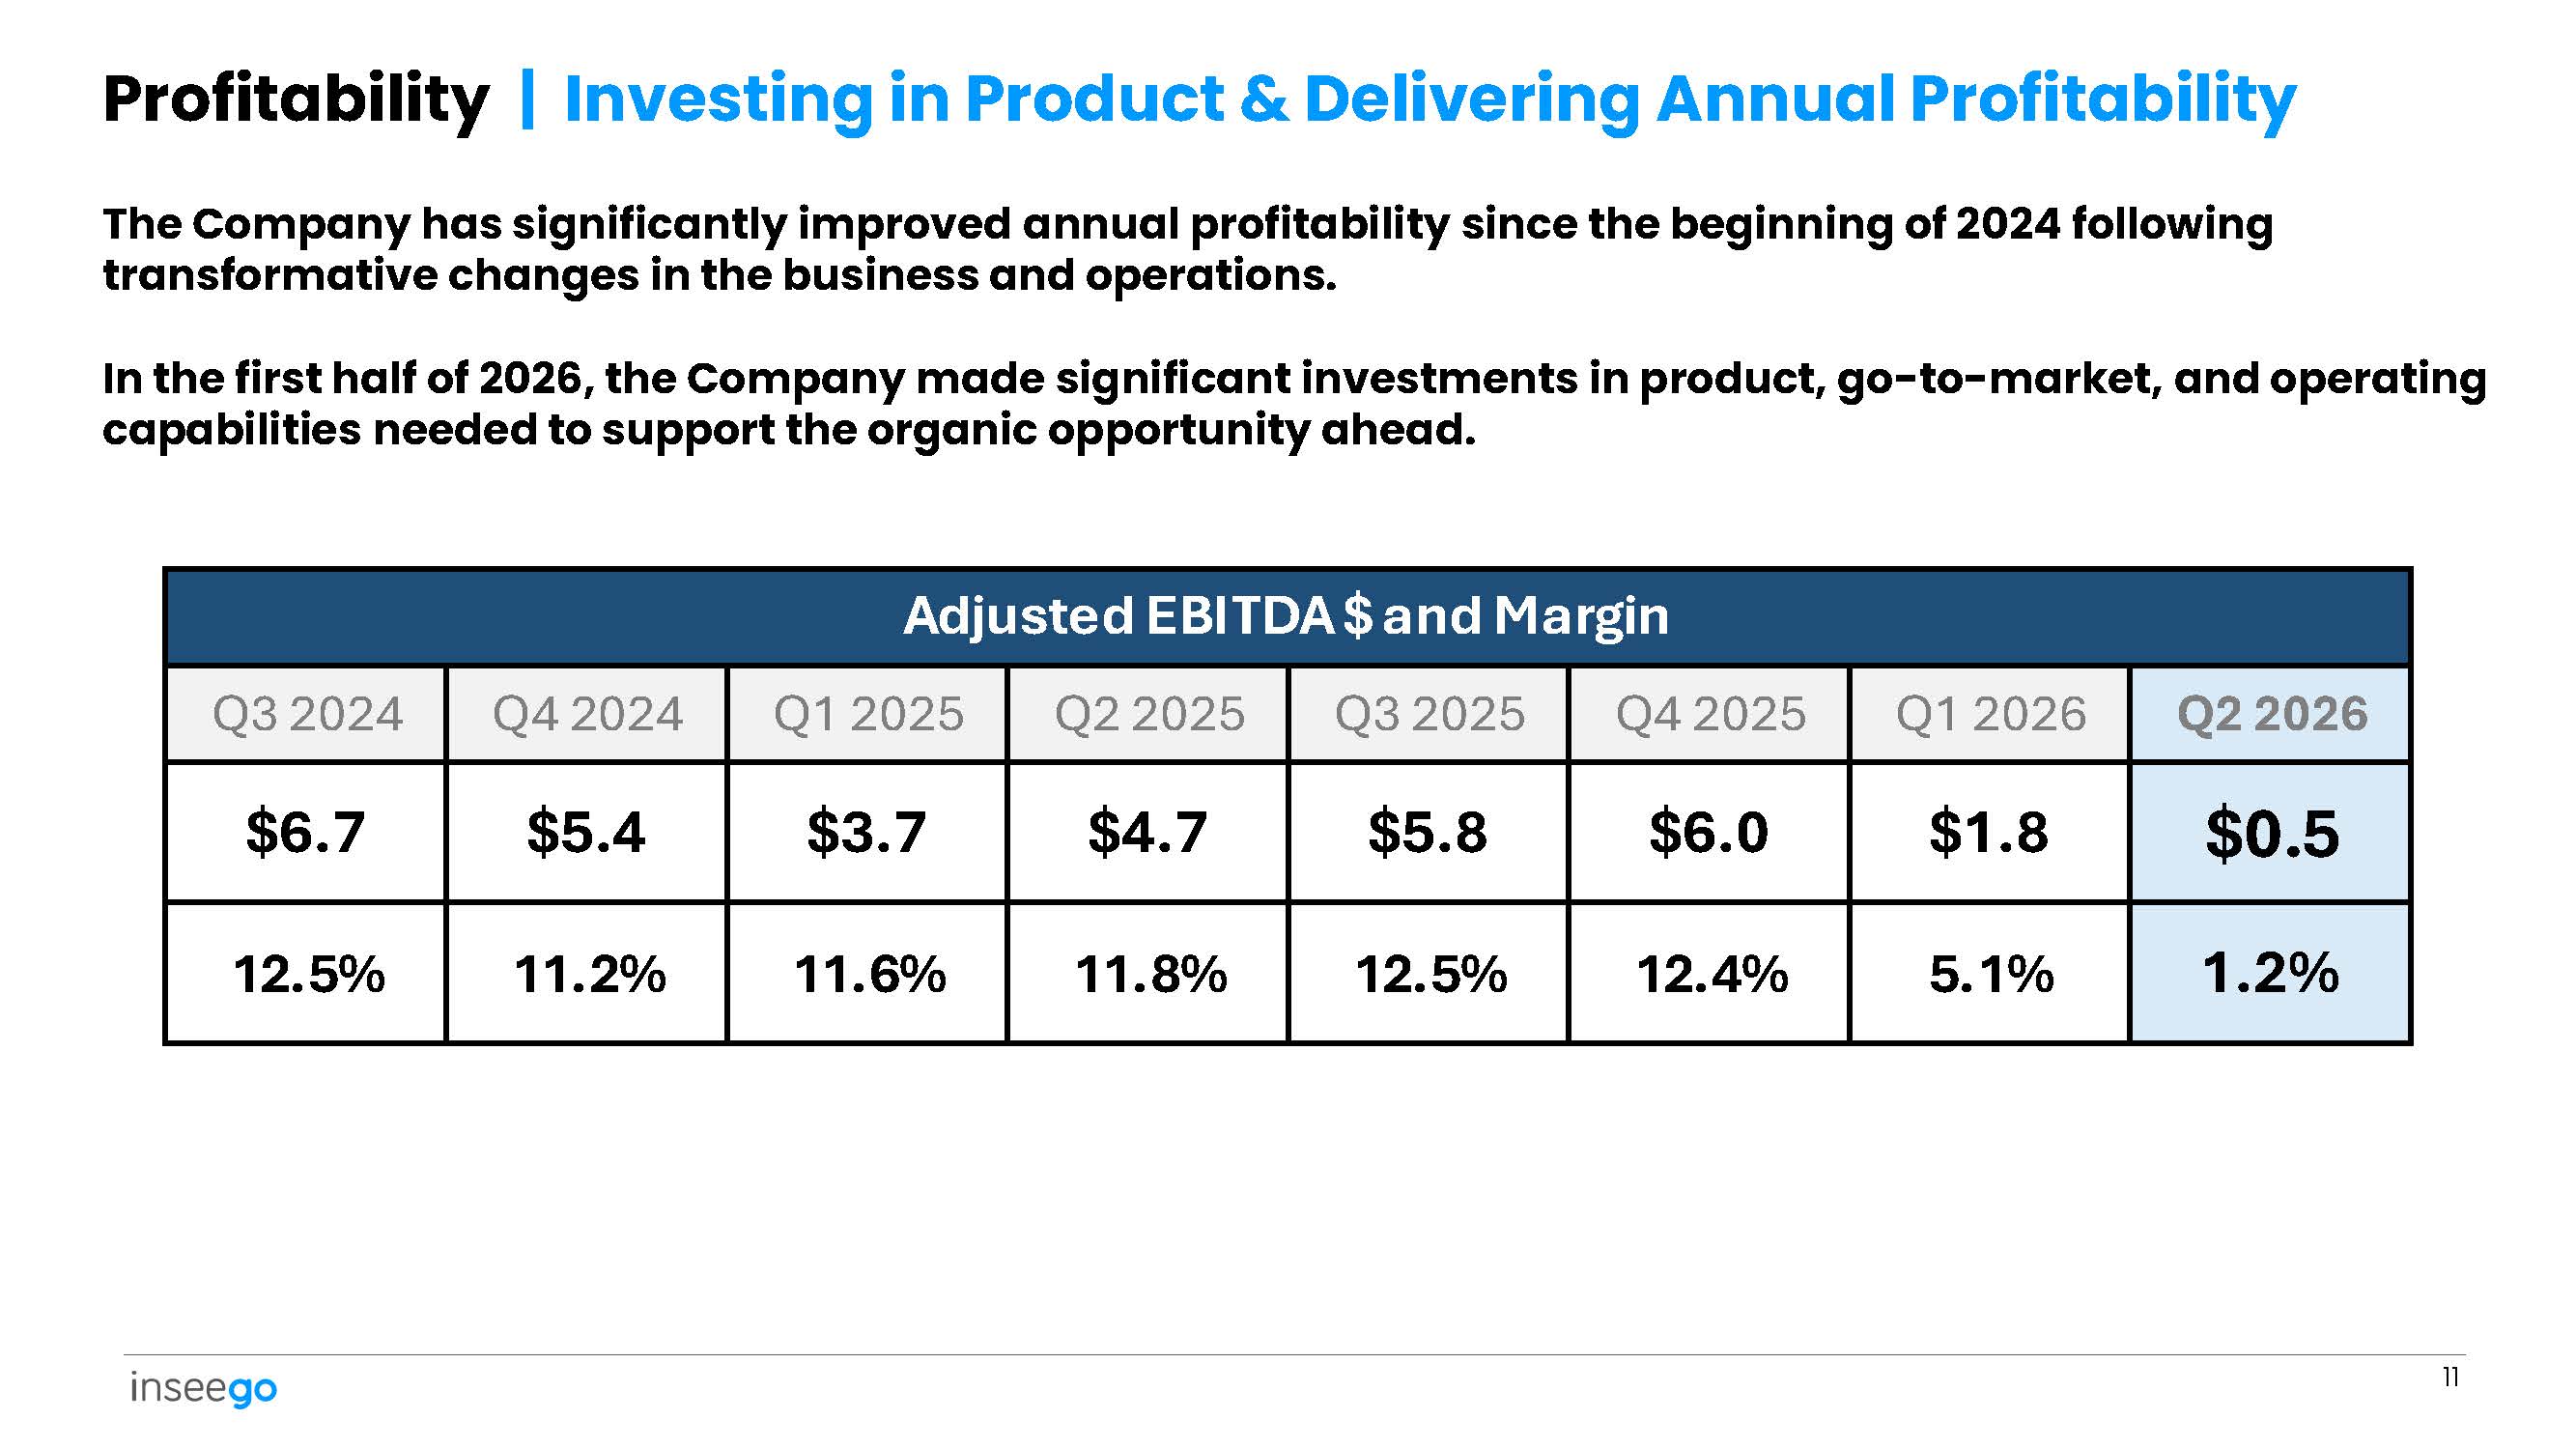
Profitability | Investing in Product & Delivering Annual Profitability 11 The Company has significantly improved annual profitability since the beginning of 2024 following transformative changes in the business and operations. In the first half of 2026, the Company made significant investments in product, go - to - market, and operating capabilities needed to support the organic opportunity ahead. Adjusted EBITDA $ and Margin Q2 2026 Q1 2026 Q4 2025 Q3 2025 Q2 2025 Q1 2025 Q4 2024 Q3 2024 $0.5 $1.8 $6.0 $5.8 $4.7 $3.7 $5.4 $6.7 1.2% 5.1% 12.4% 12.5% 11.8% 11.6% 11.2% 12.5%
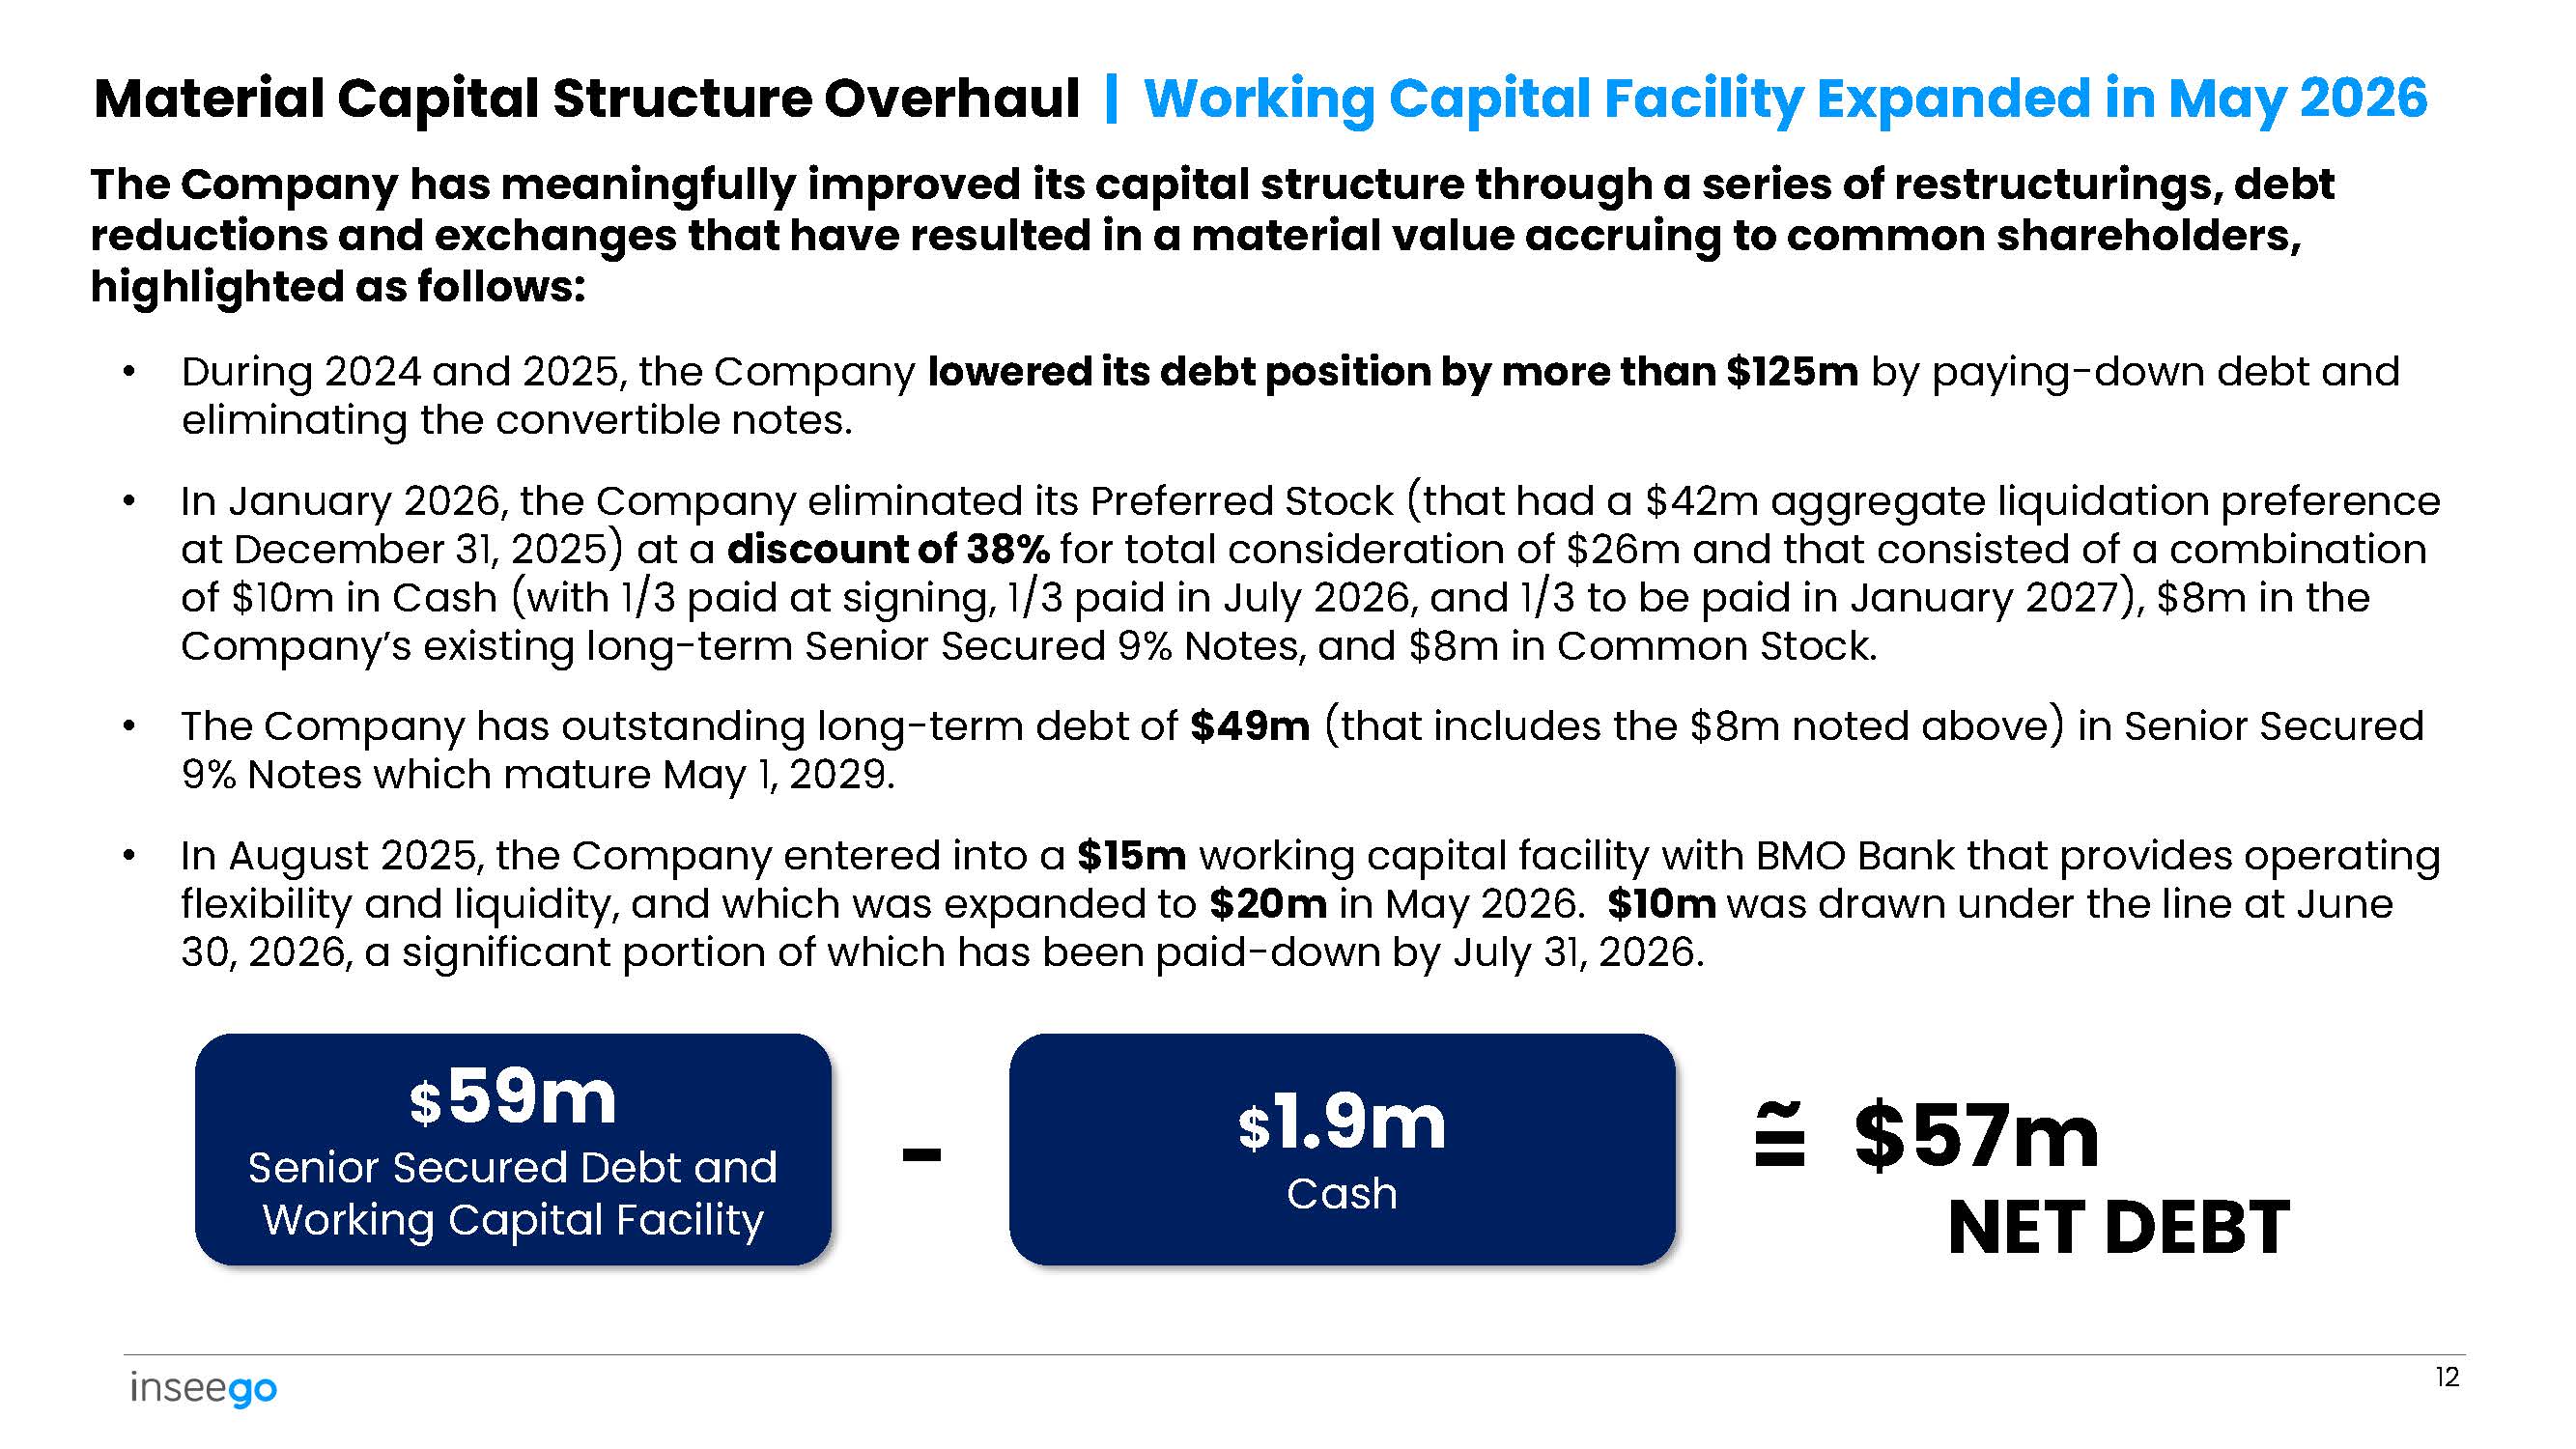
Material Capital Structure Overhaul | Working Capital Facility Expanded in May 2026 The Company has meaningfully improved its capital structure through a series of restructurings, debt reductions and exchanges that have resulted in a material value accruing to common shareholders, highlighted as follows: • During 2024 and 2025, the Company lowered its debt position by more than $125m by paying - down debt and eliminating the convertible notes. • In January 2026, the Company eliminated its Preferred Stock (that had a $42m aggregate liquidation preference at December 31, 2025) at a discount of 38% for total consideration of $26m and that consisted of a combination of $10m in Cash (with 1/3 paid at signing, 1/3 paid in July 2026, and 1/3 to be paid in January 2027), $8m in the Company’s existing long - term Senior Secured 9% Notes, and $8m in Common Stock. • The Company has outstanding long - term debt of $49m (that includes the $8m noted above) in Senior Secured 9% Notes which mature May 1, 2029. • In August 2025, the Company entered into a $15m working capital facility with BMO Bank that provides operating flexibility and liquidity, and which was expanded to $20m in May 2026. $10m was drawn under the line at June 30, 2026, a significant portion of which has been paid - down by July 31, 2026. $ 59m Senior Secured Debt and Working Capital Facility $ 1.9m Cash 12 - NET DEBT = ~ $57m
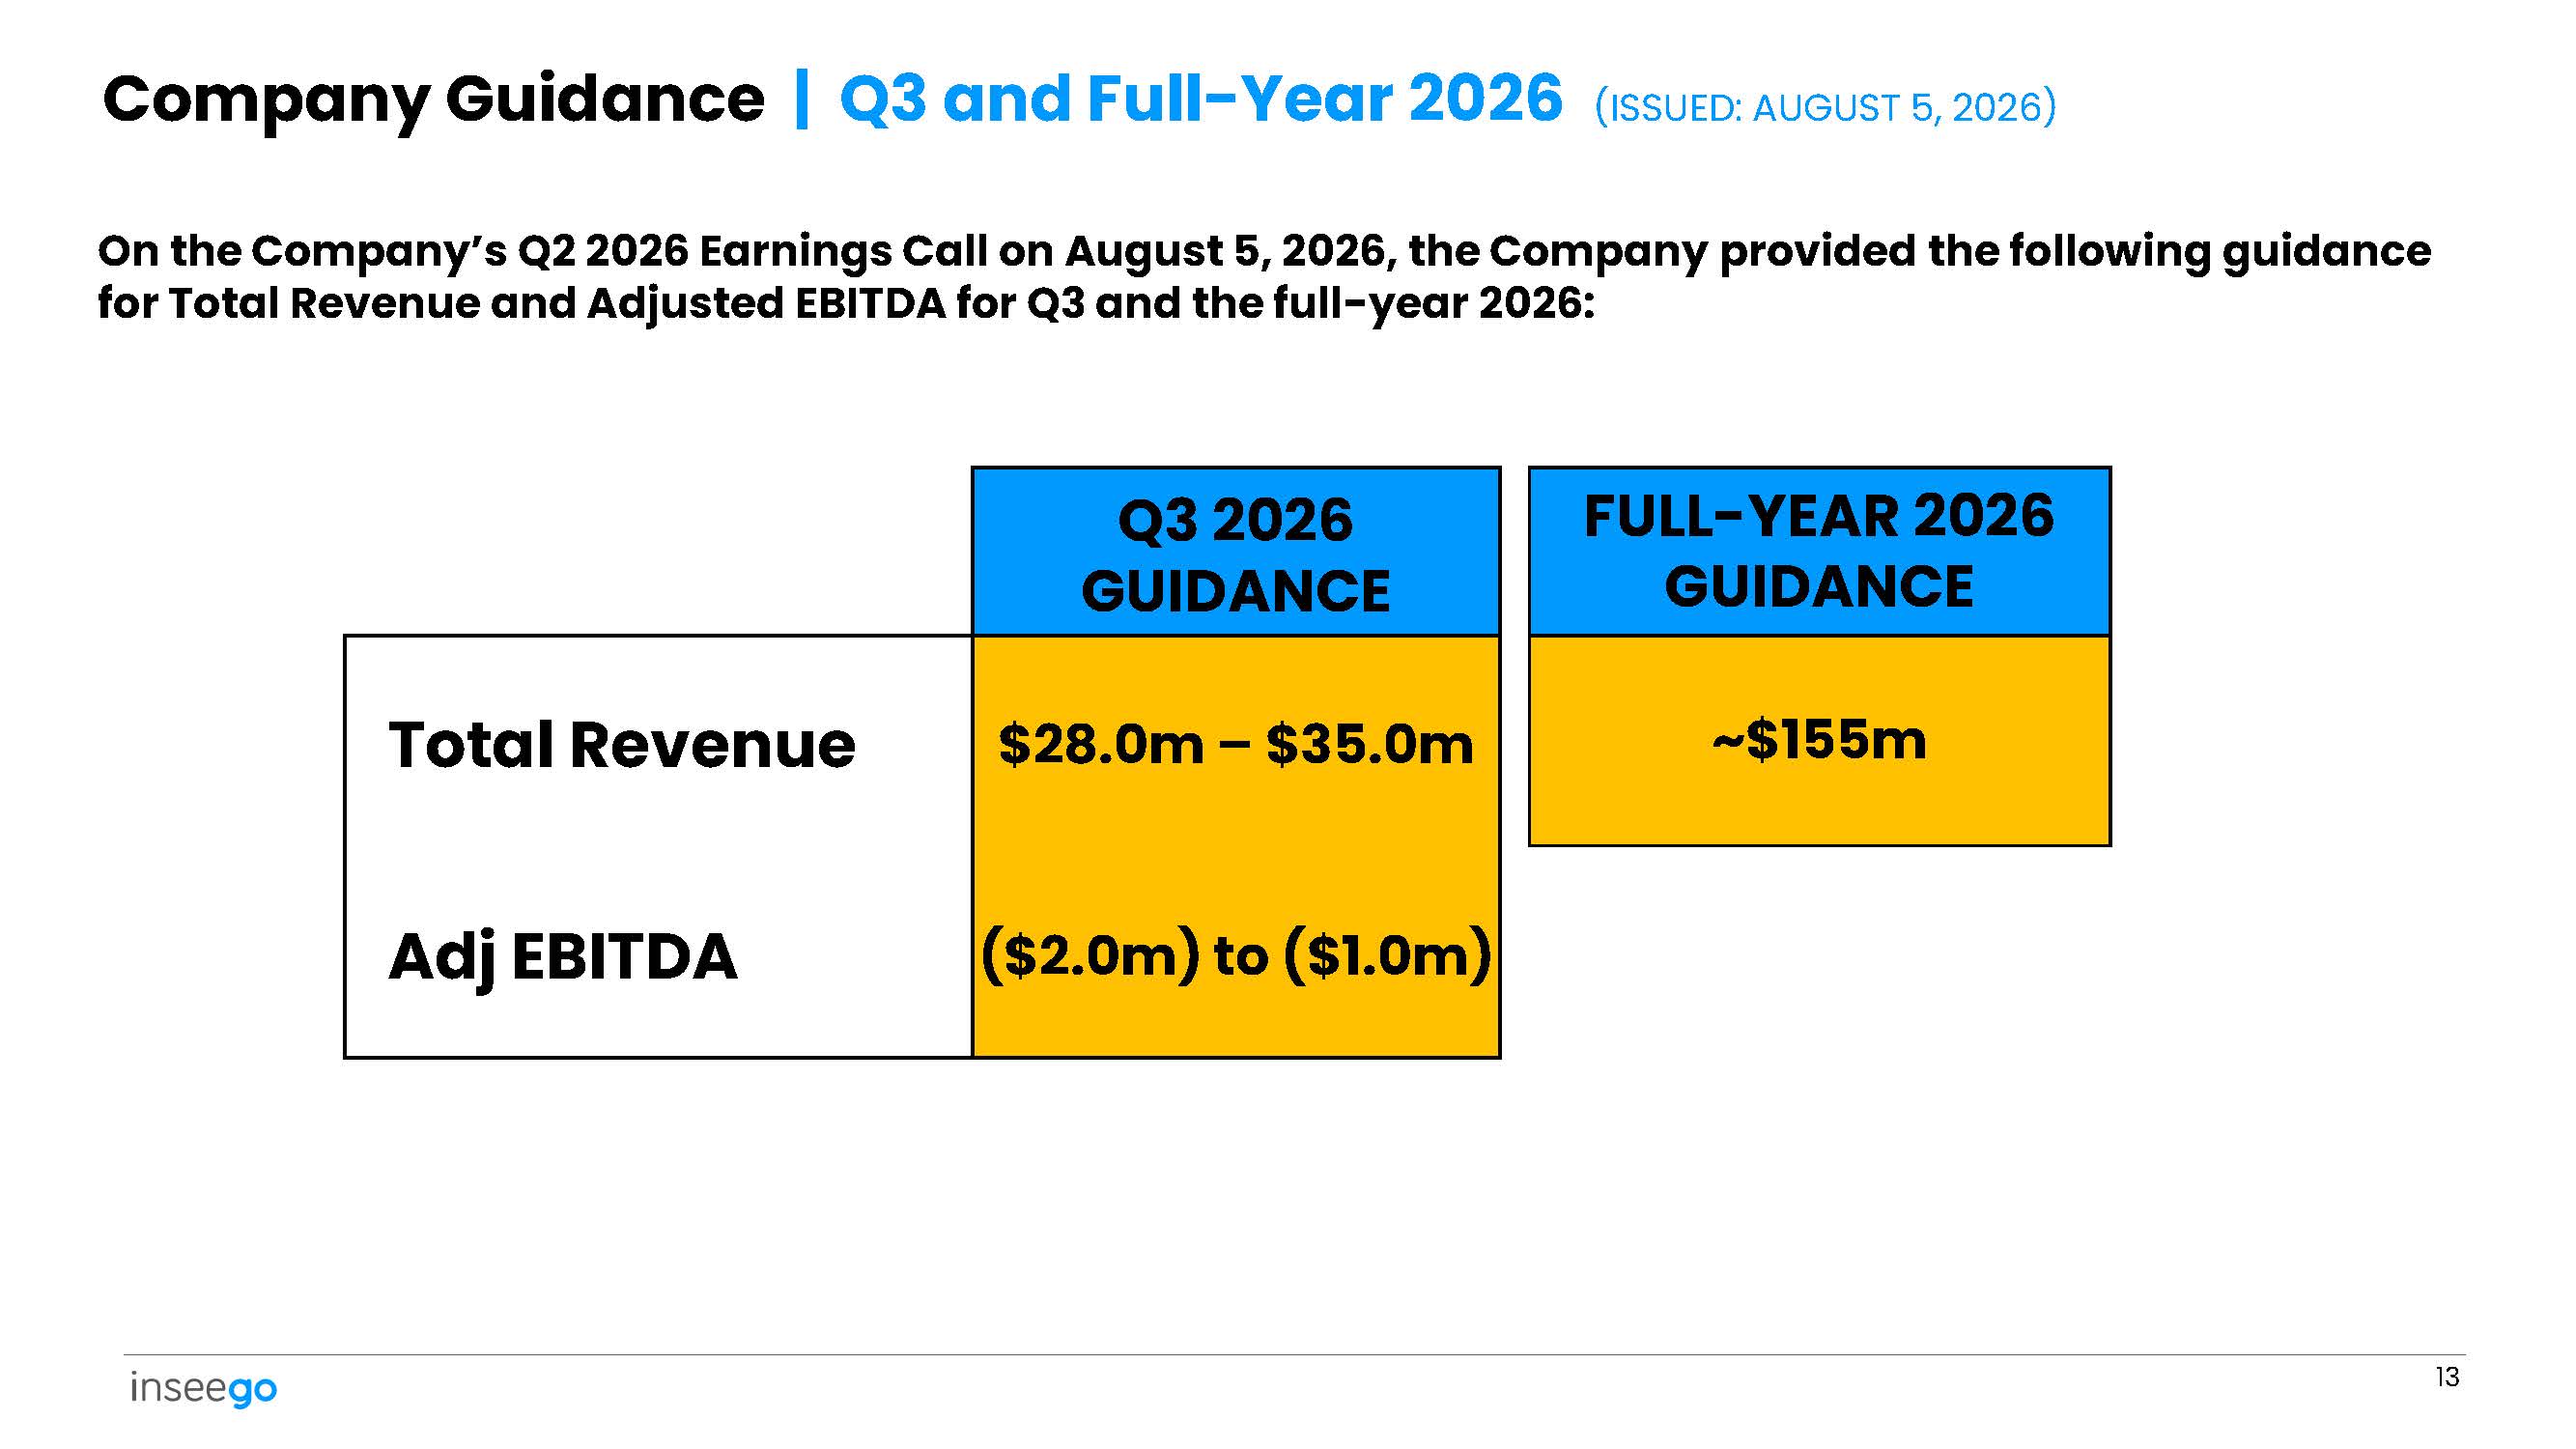
FULL - YEAR 2026 GUIDANCE Q3 2026 GUIDANCE ~$155m $28.0m – $35.0m Total Revenue ($2.0m) to ($1.0m) Adj EBITDA 13 On the Company’s Q2 2026 Earnings Call on August 5, 2026, the Company provided the following guidance for Total Revenue and Adjusted EBITDA for Q3 and the full - year 2026: Company Guidance | Q3 and Full - Year 2026 (ISSUED: AUGUST 5, 2026)
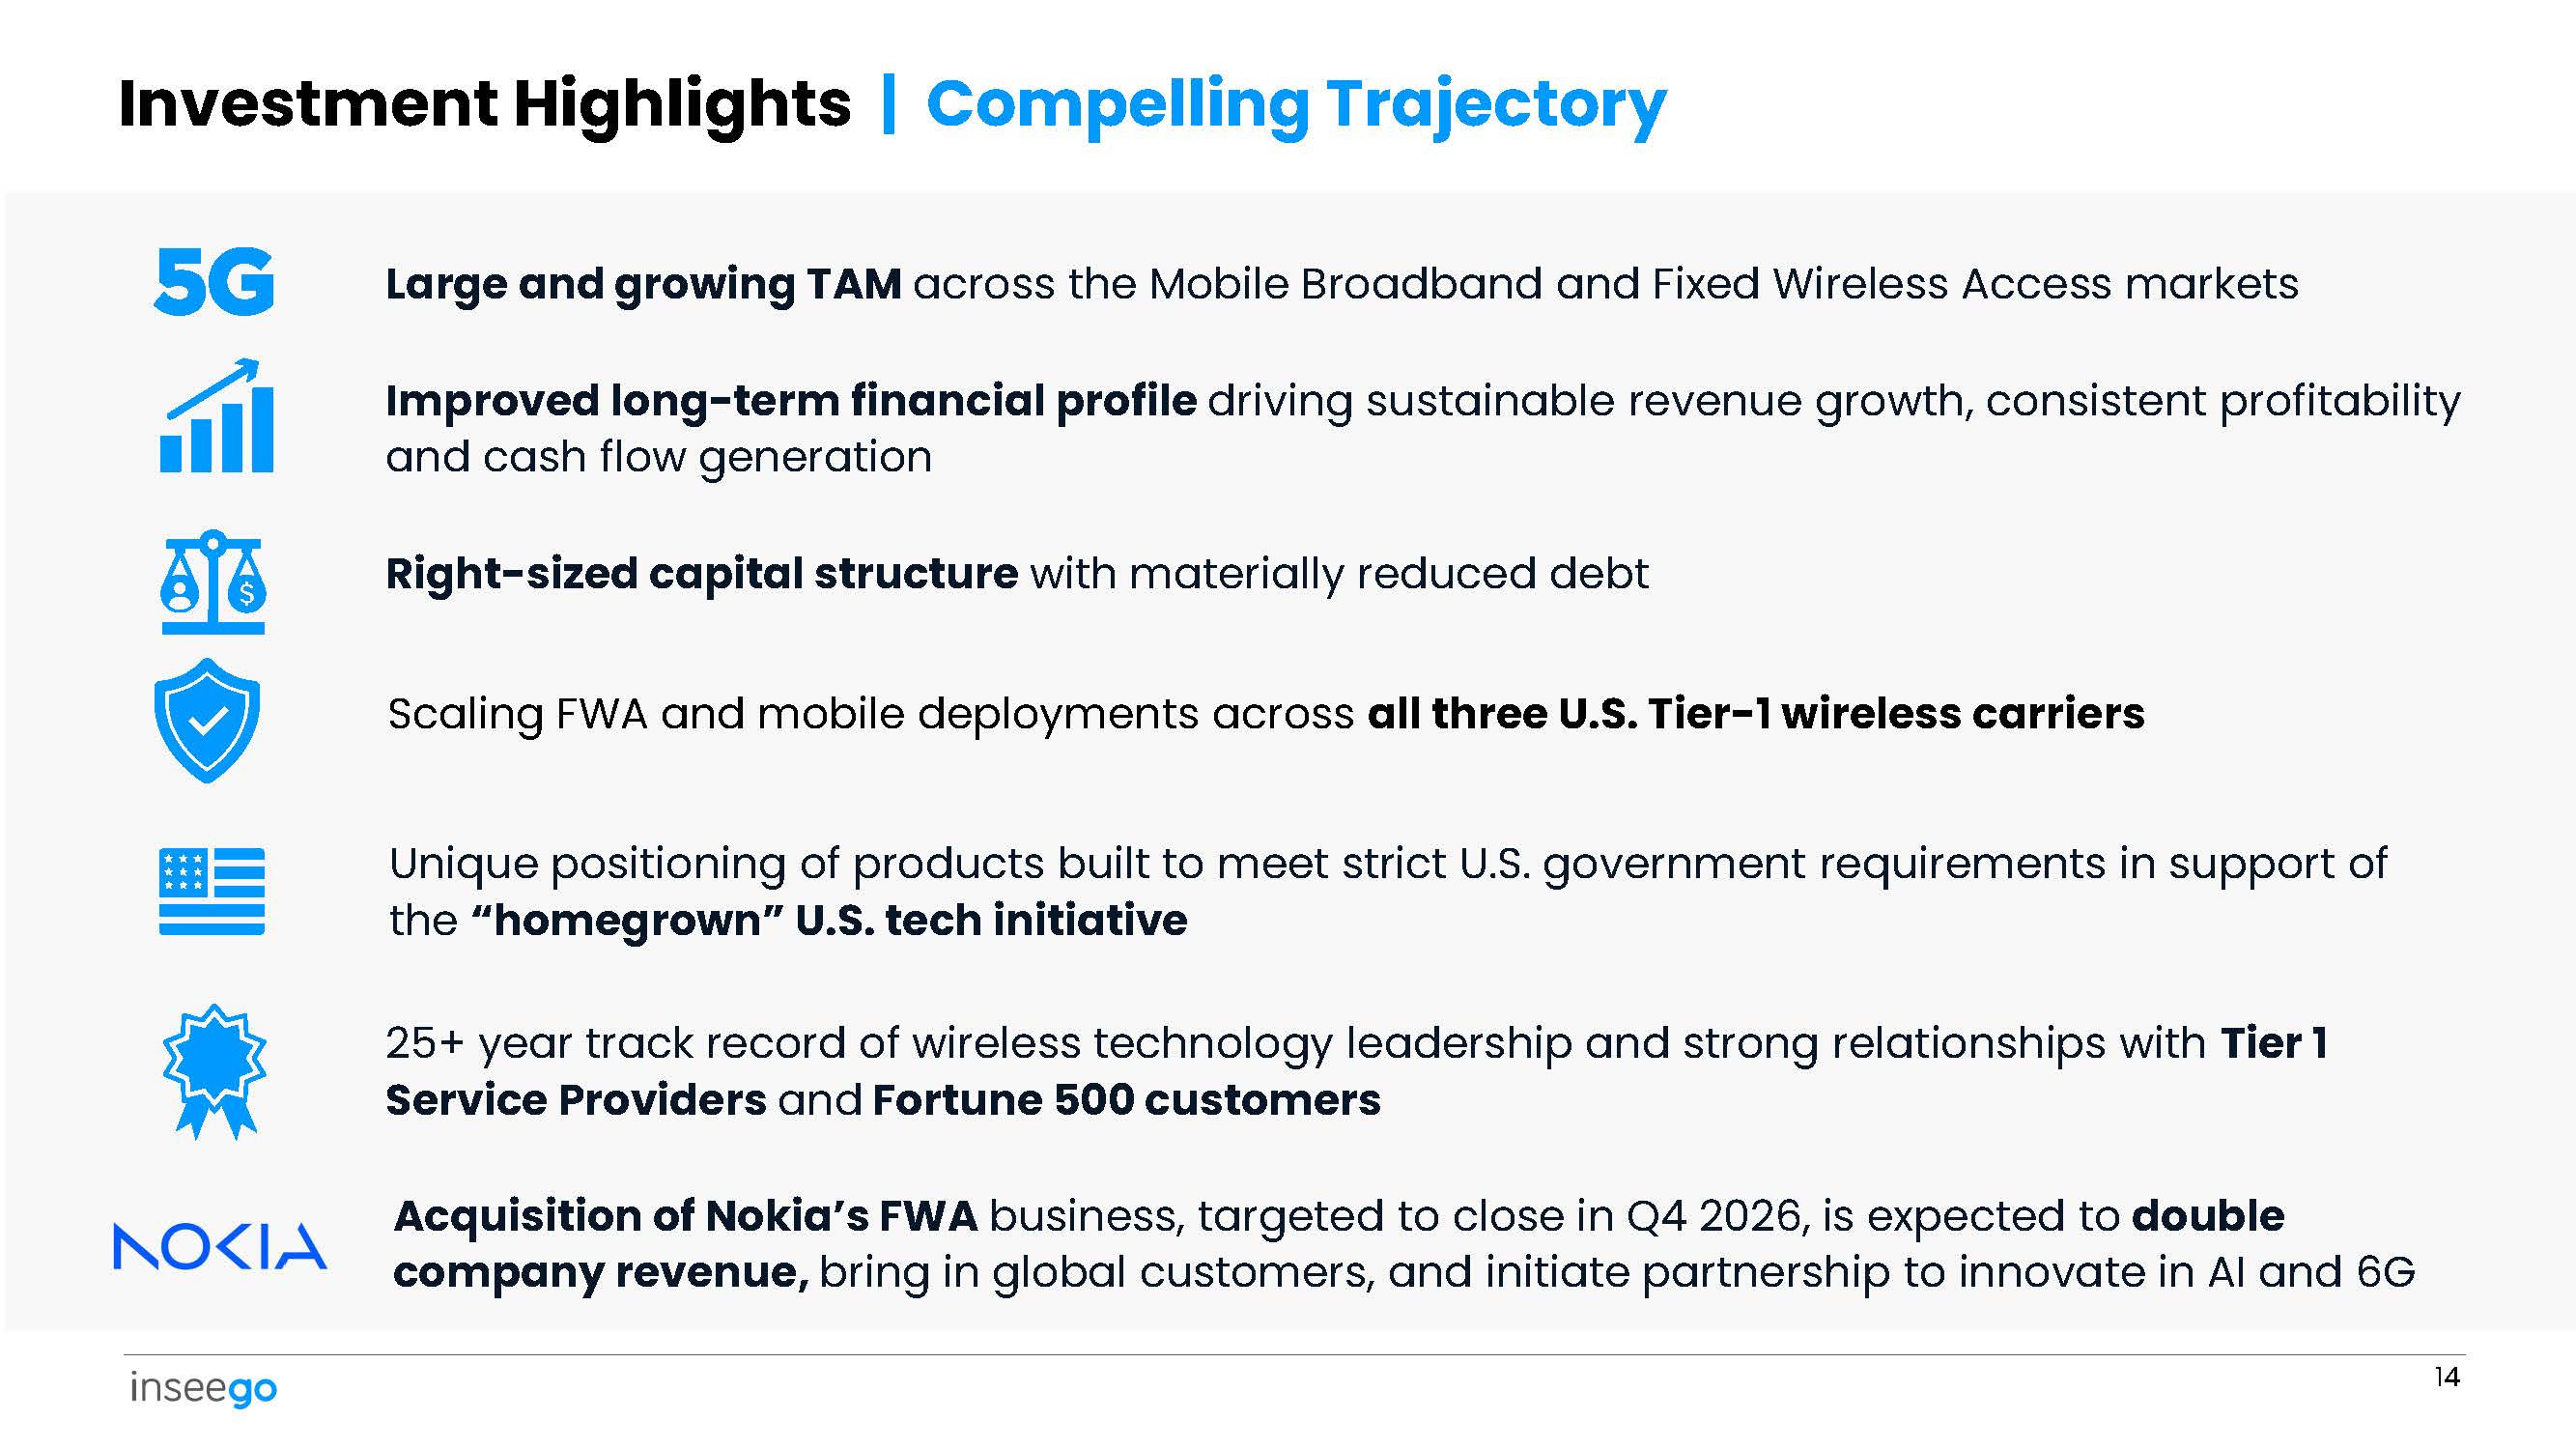
Investment Highlights | Compelling Trajectory Large and growing TAM across the Mobile Broadband and Fixed Wireless Access markets Improved long - term financial profile driving sustainable revenue growth, consistent profitability and cash flow generation Right - sized capital structure with materially reduced debt Scaling FWA and mobile deployments across all three U.S. Tier - 1 wireless carriers Unique positioning of products built to meet strict U.S. government requirements in support of the “homegrown” U.S. tech initiative 25+ year track record of wireless technology leadership and strong relationships with Tier 1 Service Providers and Fortune 500 customers Acquisition of Nokia’s FWA business, targeted to close in Q4 2026, is expected to double company revenue, bring in global customers, and initiate partnership to innovate in AI and 6G 14
NON - GAAP NUMBERS Reconciliations to GAAP Financials APPENDIX
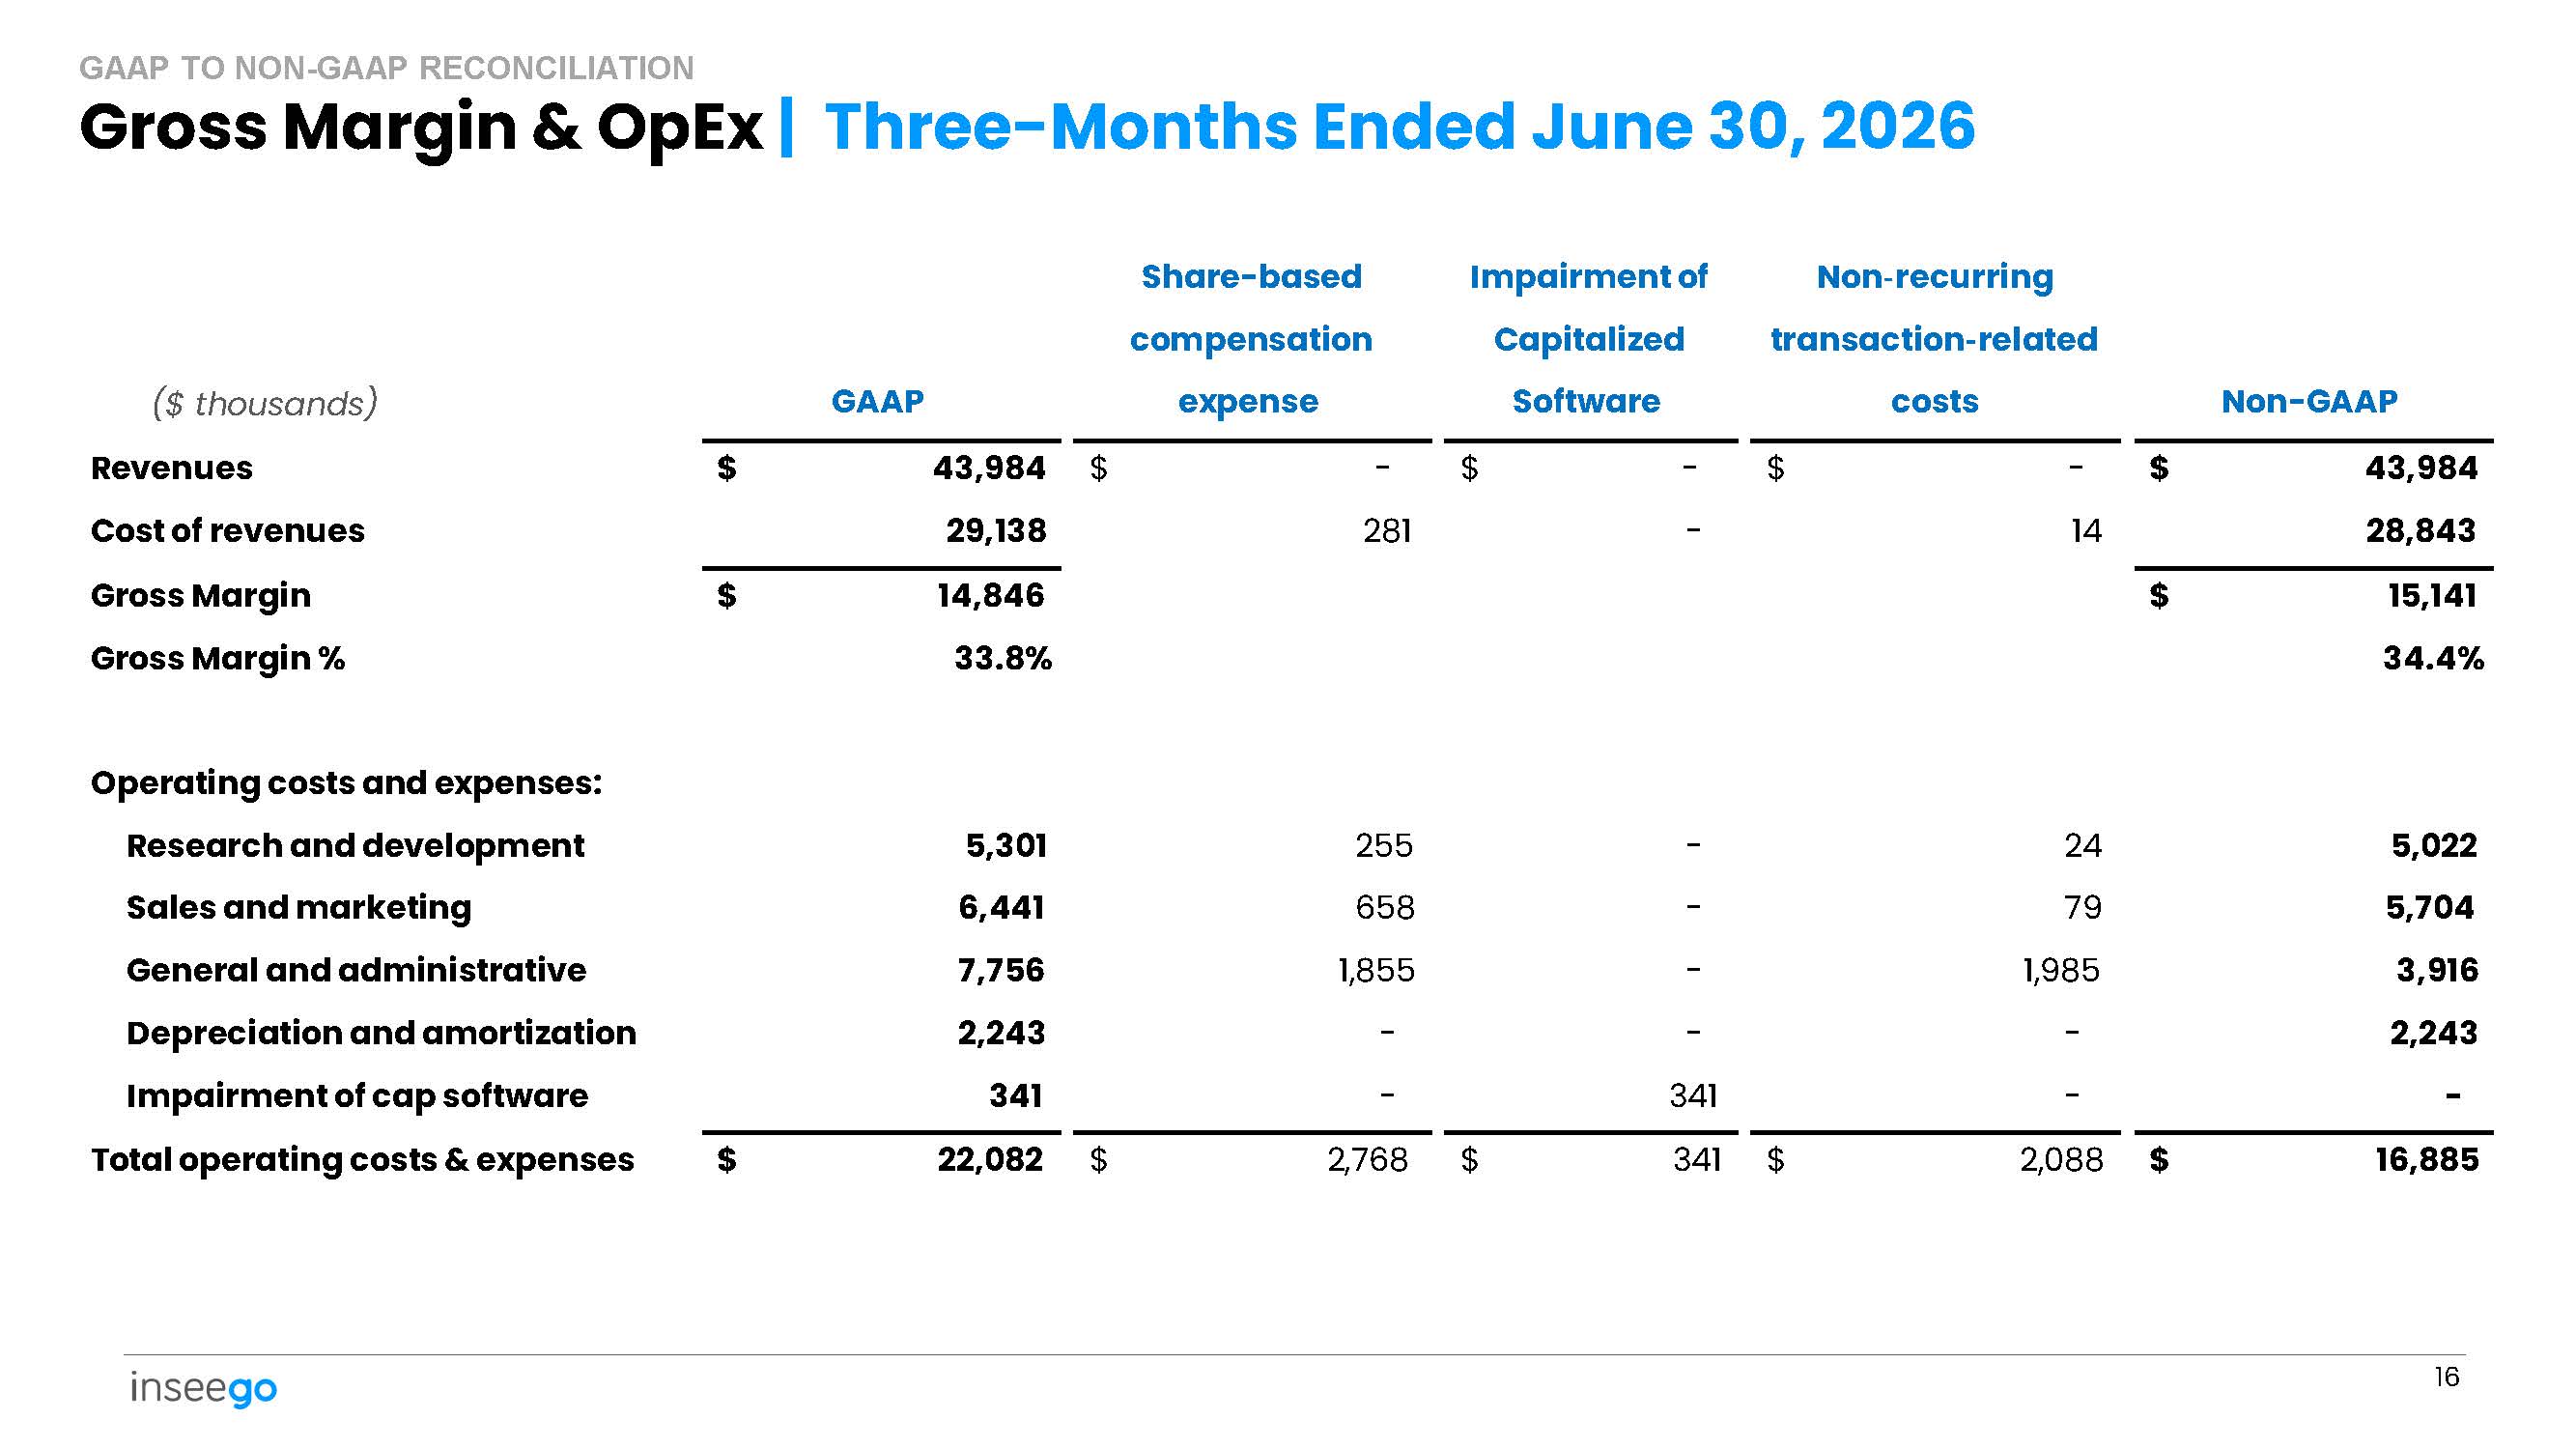
($ thousands) 16 GAAP Share - based compensation expense Impairment of Capitalized Software Non - recurring transaction - related costs Non - GAAP $ 43,984 - $ - $ - $ $ 43,984 Revenues 28,843 14 - 281 29,138 Cost of revenues $ 15,141 $ 14,846 Gross Margin 34.4% 33.8% Gross Margin % 5,022 24 - 255 5,301 Operating costs and expenses: Research and development 5,704 79 - 658 6,441 Sales and marketing 3,916 1,985 - 1,855 7,756 General and administrative 2,243 - - - 2,243 Depreciation and amortization - - 341 - 341 Impairment of cap software $ 16,885 2,088 $ 341 $ 2,768 $ $ 22,082 Total operating costs & expenses Gross Margin & OpEx | Three - Months Ended June 30, 2026 GAAP TO NON - GAAP RECONCILIATION
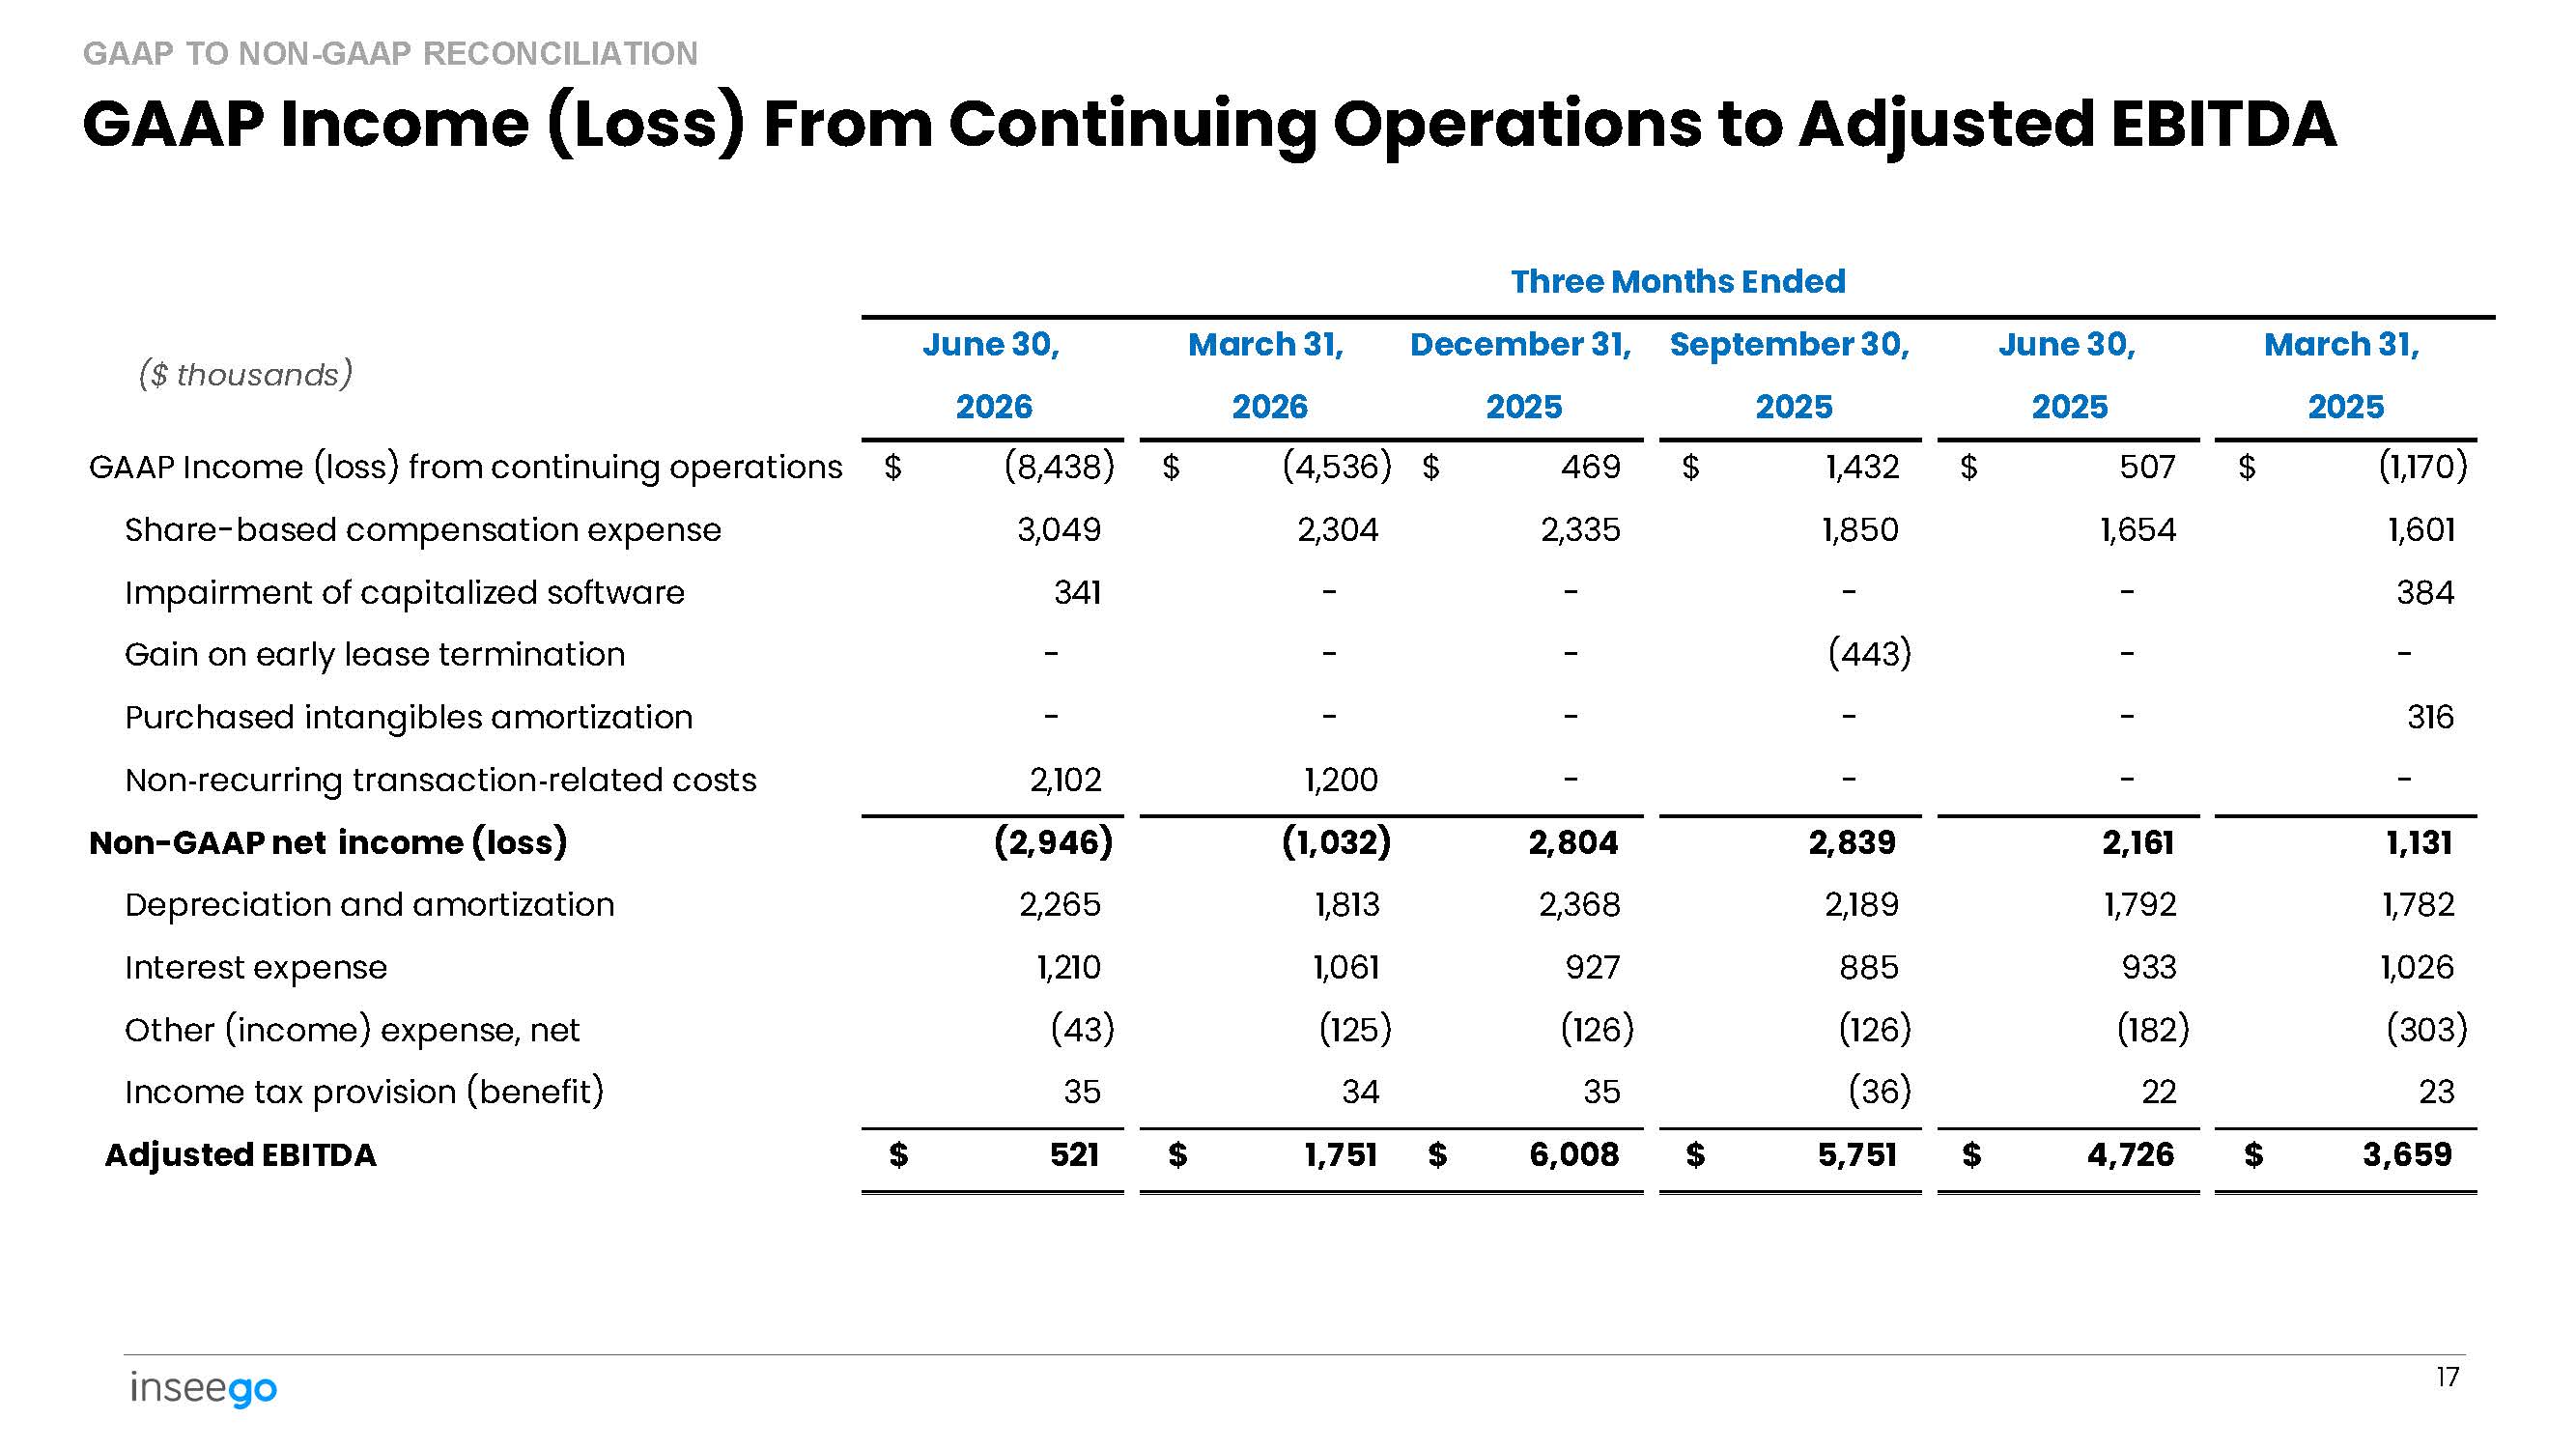
March 31, 2025 June 30, 2025 September 30, 2025 December 31, 2025 March 31, 2026 June 30, 2026 ($ thousands) $ (1,170) $ 507 $ 1,432 $ 469 $ (4,536) $ (8,438) GAAP Income (loss) from continuing operations 1,601 1,654 1,850 2,335 2,304 3,049 Share - based compensation expense 384 - - - - 341 Impairment of capitalized software - - (443) - - - Gain on early lease termination 316 - - - - - Purchased intangibles amortization - - - - 1,200 2,102 Non - recurring transaction - related costs 1,131 2,161 2,839 2,804 (1,032) (2,946) Non - GAAP net income (loss) 1,782 1,792 2,189 2,368 1,813 2,265 Depreciation and amortization 1,026 933 885 927 1,061 1,210 Interest expense (303) (182) (126) (126) (125) (43) Other (income) expense, net 23 22 (36) 35 34 35 Income tax provision (benefit) $ 3,659 $ 4,726 $ 5,751 $ 6,008 $ 1,751 $ 521 Adjusted EBITDA 17 Three Months Ended GAAP Income (Loss) From Continuing Operations to Adjusted EBITDA GAAP TO NON - GAAP RECONCILIATION
Safe Harbor Statement This presentation contains statements about expected future events, including Inseego’s planned acquisition (the “Proposed Transaction”) of Nokia’s global FWA business (the “FWA Business”), that are forward - looking and subject to risks and uncertainties. For these statements, we claim the safe harbor for “forward - looking statements” within the meaning of the Private Securities Litigation Reform Act of 1995. Forward looking statements are typically identified by words or phrases such as “may,” “will,” “intend,” “should,” “believe,” “expect,” “anticipate,” “project,” “estimate” and other words or terms that do not relate solely to historical matters. These forward - looking statements include, but are not limited to, statements regarding Inseego’s expected operational and financial performance and the anticipated timing and benefits of the Proposed Transaction. For a discussion of factors that could cause actual results to differ materially from expectations, including risks and uncertainties related to the Proposed Transaction, such as the possibility that closing conditions may not be satisfied, the transaction may not close on the anticipated timeline or at all, anticipated synergies from the Proposed Transaction may not be realized when expected, or at all, and integration may be more difficult, costly or time - consuming than anticipated, please refer to the risk factors described in our filings with the SEC, including filings related to the Proposed Transaction. Any forward - looking statement speaks only as of the date on which it is made, and Inseego expressly disclaims any obligation to update or revise its forward - looking statements to reflect information, events or circumstances that arise after the date of this presentation, except as may be required by applicable law. Non - GAAP Financial Measures Non - GAAP gross margins and operating expenses exclude restructuring charges, share based compensation expenses, debt restructuring charges, impairments of capitalized software charges, acquisition - related intangible asset amortization, non - recurring transaction related costs, and other certain non - recurring gains and losses. This presentation contains references to certain non - GAAP financial measures and should be viewed in conjunction with our press releases and supplementary information on our website ( www.inseego.com/investors ) which present a complete reconciliation of GAAP and Non - GAAP results. Market Data and Statistics This presentation includes statistical and other industry and market data that Inseego obtained from industry publications and research, surveys, studies, and other similar third - party sources, as well as Inseego’s estimates based on such data and on Inseego’s internal sources . Such data and estimates involve a number of assumptions and limitations, and you are cautioned not to give undue weight to such data and estimates . Inseego believes that the information from these third - party sources is reliable ; however, Inseego has not independently verified them, makes no representation as to their accuracy or completeness, and does not undertake to update the data from such sources after the date of this presentation . Trademarks This presentation contains trademarks, service marks, trade names, and copyrights of Inseego, Nokia, and third parties, which are the property of their respective owners . The use or display of third parties’ trademarks, service marks, trade names, or copyrights in this presentation is not intended to, and does not imply, a relationship with Inseego or Nokia, or an endorsement or sponsorship by or of Inseego or Nokia . 18 Disclaimers
www.inseego.com NASDAQ: INSG