Shareholder Report
May 31, 2026
USD ($)
Holding
This report describes changes to the Fund that occurred during the reporting period.
What were the Fund costs for the last year?
(based on a hypothetical $10,000 investment)
| Class name | Costs of a $10,000 investment |
Costs paid as a percentage of a $10,000 investment |
| $126 | 1.15% |
How did the Fund perform last year?
- For the reporting period ended May 31, 2026, the Fund's Class R Shares returned 19.83%.
- For the same period, the Fund’s benchmark, the MSCI ACWI ex USA Index (Net) returned 32.77%.
What contributed to absolute performance?
At the individual stock level, SK Hynix Inc., the Korean semiconductor company, led positive contributions. SK Hynix continues to benefit from its leading position in memory, with favorable supply-demand dynamics and persistent shortages driven by strong server and AI-related demand. The company’s increased quarterly profits have reinforced the memory upcycle narrative. Shares of Taiwan Semiconductor Manufacturing Co. Ltd moved higher as the company's leading position in advanced chip fabrication continued to attract investor interest. As AI-driven demand intensified over the period, the company posted a series of record results while signaling conviction in the long-term demand trajectory by raising capital expenditure guidance. MediaTek, Inc., the Taiwanese chip manufacturer, also contributed notably as investors focused on its rapidly growing role in AI infrastructure driven by the company's positioning in manufacturing Tensor Processing Units. The position was trimmed as MediaTek’s key smartphone end-market faces headwinds from higher memory prices.
What detracted from absolute performance?
At the individual stock level, SAP, the German enterprise software company, was a leading detractor on fears of AI disruption and a weaker-than-expected cloud backlog that signaled a more cautious spending environment. The position was eliminated reflecting the stock’s elevated valuation and less compelling risk-reward. U.K. information and analytics company RELX plc was another laggard on concerns around the potential for AI to erode the competitive moats of data services providers. The position was exited as the risk-reward became less compelling given increased scrutiny of business models across the sector. Shares of Tencent, the Chinese technology company, came under pressure on concerns around AI-driven disruption and disintermediation within the gaming segment alongside broader weakness in Chinese internet stocks. The position has been maintained on conviction with respect to Tencent’s deeply embedded social ecosystem, gaming leadership, net cash balance sheet and relatively undemanding valuation.
The views expressed reflect the opinions of BlackRock as of the date of this report and are subject to change based on changes in market, economic or other conditions. These views are not intended to be a forecast of future events and are no guarantee of future results.
Fund performance
Cumulative performance: June 1, 2016 through May 31, 2026
Initial investment of $10,000
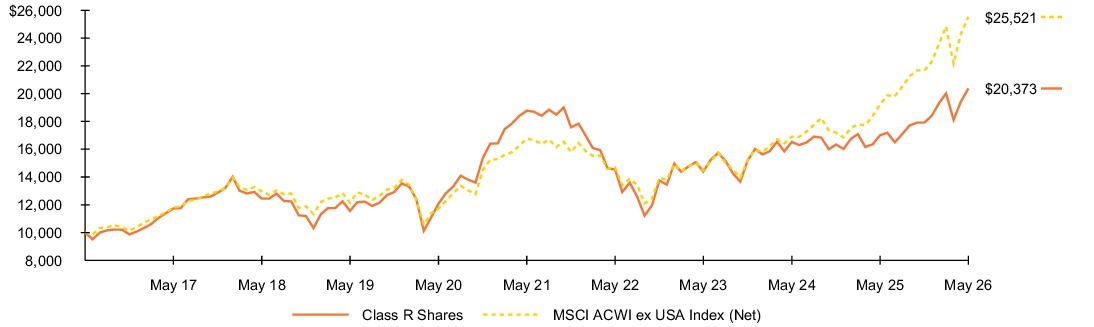
See “Average annual total returns” for additional information on fund performance.
Average annual total returns
| 1 Year | 5 Years | 10 Years | |||
| 19.83 | % | 1.65 | % | 7.38 | % |
| 32.77 | 8.77 | 9.82 |
Key Fund statistics
| $1,144,549,618 |
| 48 |
| $6,349,289 |
| 66% |
What did the Fund invest in?
(as of May 31, 2026)
Geographic allocation
| Country | Percent of Net Assets |
|
| 12.1 | % | |
| 11.2 | ||
| 9.3 | ||
| 8.4 | ||
| 8.3 | ||
| 6.8 | ||
| 6.8 | ||
| 6.5 | ||
| 6.3 | ||
| 5.0 | ||
| 18.2 | ||
| 1.1 |
Ten largest holdings
| Security(a) | Percent of Net Assets |
|
| 6.9 | % | |
| 3.5 | ||
| 3.3 | ||
| 3.2 | ||
| 3.1 | ||
| 3.0 | ||
| 3.0 | ||
| 2.7 | ||
| 2.7 | ||
| 2.6 |
| Excludes short-term securities. |
| Ten largest countries are presented. Additional countries are found in Other. |
Ten largest holdings
| Security(a) | Percent of Net Assets |
|
| 6.9 | % | |
| 3.5 | ||
| 3.3 | ||
| 3.2 | ||
| 3.1 | ||
| 3.0 | ||
| 3.0 | ||
| 2.7 | ||
| 2.7 | ||
| 2.6 |
Material fund changes
This is a summary of planned changes to the Fund since May 31, 2025. For more complete information, you may review the Fund’s next prospectus, which we expect to be available approximately 120 days after May 31, 2026 at blackrock.com/fundreports or upon request by contacting us at (800) 441-7762.
Effective June 1, 2026, BlackRock Advisors, LLC has voluntarily agreed to cap the Fund’s total annual fund operating expenses after fee waiver to 1.00% as a percentage of the Fund’s average daily net assets.
Effective June 1, 2026, BlackRock Advisors, LLC has voluntarily agreed to cap the Fund’s total annual fund operating expenses after fee waiver to 1.00% as a percentage of the Fund’s average daily net assets.
This is a summary of planned changes to the Fund since May 31, 2025. For more complete information, you may review the Fund’s next prospectus, which we expect to be available approximately 120 days after May 31, 2026 at blackrock.com/fundreports or upon request by contacting us at (800) 441-7762.
This report describes changes to the Fund that occurred during the reporting period.
What were the Fund costs for the last year?
(based on a hypothetical $10,000 investment)
| Class name | Costs of a $10,000 investment |
Costs paid as a percentage of a $10,000 investment |
| $66 | 0.60% |
How did the Fund perform last year?
- For the reporting period ended May 31, 2026, the Fund's Class K Shares returned 20.51%.
- For the same period, the Fund’s benchmark, the MSCI ACWI ex USA Index (Net) returned 32.77%.
What contributed to absolute performance?
At the individual stock level, SK Hynix Inc., the Korean semiconductor company, led positive contributions. SK Hynix continues to benefit from its leading position in memory, with favorable supply-demand dynamics and persistent shortages driven by strong server and AI-related demand. The company’s increased quarterly profits have reinforced the memory upcycle narrative. Shares of Taiwan Semiconductor Manufacturing Co. Ltd moved higher as the company's leading position in advanced chip fabrication continued to attract investor interest. As AI-driven demand intensified over the period, the company posted a series of record results while signaling conviction in the long-term demand trajectory by raising capital expenditure guidance. MediaTek, Inc., the Taiwanese chip manufacturer, also contributed notably as investors focused on its rapidly growing role in AI infrastructure driven by the company's positioning in manufacturing Tensor Processing Units. The position was trimmed as MediaTek’s key smartphone end-market faces headwinds from higher memory prices.
What detracted from absolute performance?
At the individual stock level, SAP, the German enterprise software company, was a leading detractor on fears of AI disruption and a weaker-than-expected cloud backlog that signaled a more cautious spending environment. The position was eliminated reflecting the stock’s elevated valuation and less compelling risk-reward. U.K. information and analytics company RELX plc was another laggard on concerns around the potential for AI to erode the competitive moats of data services providers. The position was exited as the risk-reward became less compelling given increased scrutiny of business models across the sector. Shares of Tencent, the Chinese technology company, came under pressure on concerns around AI-driven disruption and disintermediation within the gaming segment alongside broader weakness in Chinese internet stocks. The position has been maintained on conviction with respect to Tencent’s deeply embedded social ecosystem, gaming leadership, net cash balance sheet and relatively undemanding valuation.
The views expressed reflect the opinions of BlackRock as of the date of this report and are subject to change based on changes in market, economic or other conditions. These views are not intended to be a forecast of future events and are no guarantee of future results.
Fund performance
Cumulative performance: June 1, 2016 through May 31, 2026
Initial investment of $10,000
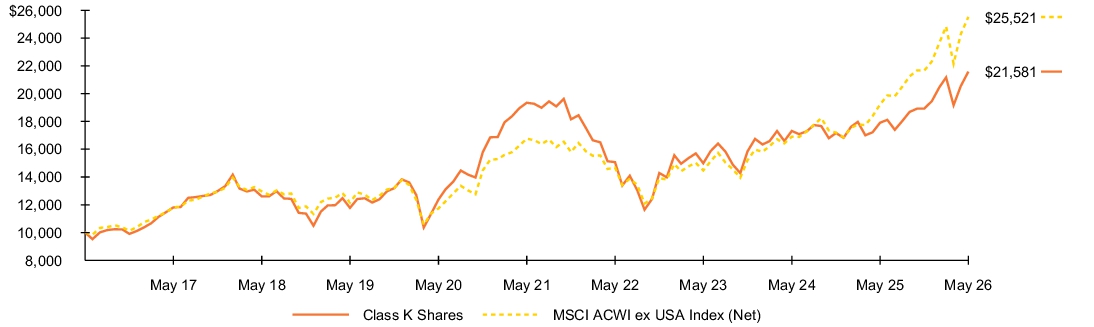
See “Average annual total returns” for additional information on fund performance.
Average annual total returns
| 1 Year | 5 Years | 10 Years | |||
| 20.51 | % | 2.21 | % | 8.00 | % |
| 32.77 | 8.77 | 9.82 |
Key Fund statistics
| $1,144,549,618 |
| 48 |
| $6,349,289 |
| 66% |
What did the Fund invest in?
(as of May 31, 2026)
Geographic allocation
| Country | Percent of Net Assets |
|
| 12.1 | % | |
| 11.2 | ||
| 9.3 | ||
| 8.4 | ||
| 8.3 | ||
| 6.8 | ||
| 6.8 | ||
| 6.5 | ||
| 6.3 | ||
| 5.0 | ||
| 18.2 | ||
| 1.1 |
Ten largest holdings
| Security(a) | Percent of Net Assets |
|
| 6.9 | % | |
| 3.5 | ||
| 3.3 | ||
| 3.2 | ||
| 3.1 | ||
| 3.0 | ||
| 3.0 | ||
| 2.7 | ||
| 2.7 | ||
| 2.6 |
| Excludes short-term securities. |
| Ten largest countries are presented. Additional countries are found in Other. |
Ten largest holdings
| Security(a) | Percent of Net Assets |
|
| 6.9 | % | |
| 3.5 | ||
| 3.3 | ||
| 3.2 | ||
| 3.1 | ||
| 3.0 | ||
| 3.0 | ||
| 2.7 | ||
| 2.7 | ||
| 2.6 |
Material fund changes
This is a summary of planned changes to the Fund since May 31, 2025. For more complete information, you may review the Fund’s next prospectus, which we expect to be available approximately 120 days after May 31, 2026 at blackrock.com/fundreports or upon request by contacting us at (800) 441-7762.
Effective June 1, 2026, BlackRock Advisors, LLC has voluntarily agreed to cap the Fund’s total annual fund operating expenses after fee waiver to 0.45% as a percentage of the Fund’s average daily net assets.
Effective June 1, 2026, BlackRock Advisors, LLC has voluntarily agreed to cap the Fund’s total annual fund operating expenses after fee waiver to 0.45% as a percentage of the Fund’s average daily net assets.
This is a summary of planned changes to the Fund since May 31, 2025. For more complete information, you may review the Fund’s next prospectus, which we expect to be available approximately 120 days after May 31, 2026 at blackrock.com/fundreports or upon request by contacting us at (800) 441-7762.
This report describes changes to the Fund that occurred during the reporting period.
What were the Fund costs for the last year?
(based on a hypothetical $10,000 investment)
| Class name | Costs of a $10,000 investment |
Costs paid as a percentage of a $10,000 investment |
| $181 | 1.65% |
How did the Fund perform last year?
- For the reporting period ended May 31, 2026, the Fund's Investor C Shares returned 19.24%.
- For the same period, the Fund’s benchmark, the MSCI ACWI ex USA Index (Net) returned 32.77%.
What contributed to absolute performance?
At the individual stock level, SK Hynix Inc., the Korean semiconductor company, led positive contributions. SK Hynix continues to benefit from its leading position in memory, with favorable supply-demand dynamics and persistent shortages driven by strong server and AI-related demand. The company’s increased quarterly profits have reinforced the memory upcycle narrative. Shares of Taiwan Semiconductor Manufacturing Co. Ltd moved higher as the company's leading position in advanced chip fabrication continued to attract investor interest. As AI-driven demand intensified over the period, the company posted a series of record results while signaling conviction in the long-term demand trajectory by raising capital expenditure guidance. MediaTek, Inc., the Taiwanese chip manufacturer, also contributed notably as investors focused on its rapidly growing role in AI infrastructure driven by the company's positioning in manufacturing Tensor Processing Units. The position was trimmed as MediaTek’s key smartphone end-market faces headwinds from higher memory prices.
What detracted from absolute performance?
At the individual stock level, SAP, the German enterprise software company, was a leading detractor on fears of AI disruption and a weaker-than-expected cloud backlog that signaled a more cautious spending environment. The position was eliminated reflecting the stock’s elevated valuation and less compelling risk-reward. U.K. information and analytics company RELX plc was another laggard on concerns around the potential for AI to erode the competitive moats of data services providers. The position was exited as the risk-reward became less compelling given increased scrutiny of business models across the sector. Shares of Tencent, the Chinese technology company, came under pressure on concerns around AI-driven disruption and disintermediation within the gaming segment alongside broader weakness in Chinese internet stocks. The position has been maintained on conviction with respect to Tencent’s deeply embedded social ecosystem, gaming leadership, net cash balance sheet and relatively undemanding valuation.
The views expressed reflect the opinions of BlackRock as of the date of this report and are subject to change based on changes in market, economic or other conditions. These views are not intended to be a forecast of future events and are no guarantee of future results.
Fund performance
Cumulative performance: June 1, 2016 through May 31, 2026
Initial investment of $10,000
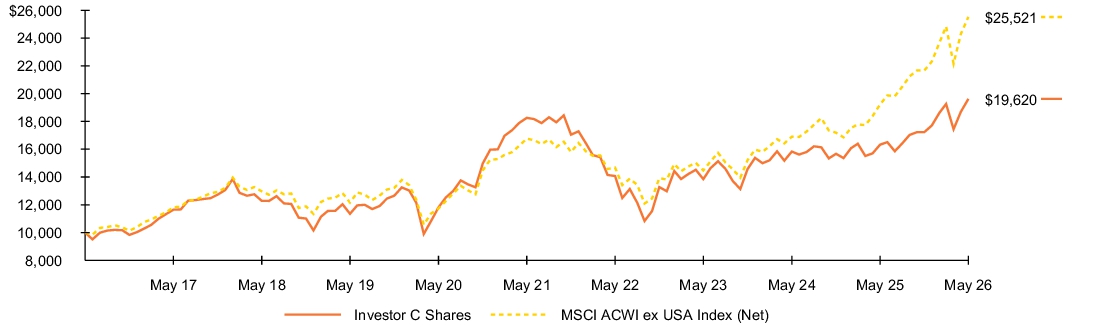
See “Average annual total returns” for additional information on fund performance.
Average annual total returns
| 1 Year | 5 Years | 10 Years | |||
| 19.24 | % | 1.13 | % | 6.97 | % |
| 18.24 | 1.13 | 6.97 | |||
| 32.77 | 8.77 | 9.82 |
Key Fund statistics
| $1,144,549,618 |
| 48 |
| $6,349,289 |
| 66% |
What did the Fund invest in?
(as of May 31, 2026)
Geographic allocation
| Country | Percent of Net Assets |
|
| 12.1 | % | |
| 11.2 | ||
| 9.3 | ||
| 8.4 | ||
| 8.3 | ||
| 6.8 | ||
| 6.8 | ||
| 6.5 | ||
| 6.3 | ||
| 5.0 | ||
| 18.2 | ||
| 1.1 |
Ten largest holdings
| Security(a) | Percent of Net Assets |
|
| 6.9 | % | |
| 3.5 | ||
| 3.3 | ||
| 3.2 | ||
| 3.1 | ||
| 3.0 | ||
| 3.0 | ||
| 2.7 | ||
| 2.7 | ||
| 2.6 |
| Excludes short-term securities. |
| Ten largest countries are presented. Additional countries are found in Other. |
Ten largest holdings
| Security(a) | Percent of Net Assets |
|
| 6.9 | % | |
| 3.5 | ||
| 3.3 | ||
| 3.2 | ||
| 3.1 | ||
| 3.0 | ||
| 3.0 | ||
| 2.7 | ||
| 2.7 | ||
| 2.6 |
Material fund changes
This is a summary of planned changes to the Fund since May 31, 2025. For more complete information, you may review the Fund’s next prospectus, which we expect to be available approximately 120 days after May 31, 2026 at blackrock.com/fundreports or upon request by contacting us at (800) 441-7762.
Effective June 1, 2026, BlackRock Advisors, LLC has voluntarily agreed to cap the Fund’s total annual fund operating expenses after fee waiver to 1.50% as a percentage of the Fund’s average daily net assets.
Effective June 1, 2026, BlackRock Advisors, LLC has voluntarily agreed to cap the Fund’s total annual fund operating expenses after fee waiver to 1.50% as a percentage of the Fund’s average daily net assets.
This is a summary of planned changes to the Fund since May 31, 2025. For more complete information, you may review the Fund’s next prospectus, which we expect to be available approximately 120 days after May 31, 2026 at blackrock.com/fundreports or upon request by contacting us at (800) 441-7762.
This report describes changes to the Fund that occurred during the reporting period.
What were the Fund costs for the last year?
(based on a hypothetical $10,000 investment)
| Class name | Costs of a $10,000 investment |
Costs paid as a percentage of a $10,000 investment |
| $99 | 0.90% |
How did the Fund perform last year?
- For the reporting period ended May 31, 2026, the Fund's Investor A Shares returned 20.16%.
- For the same period, the Fund’s benchmark, the MSCI ACWI ex USA Index (Net) returned 32.77%.
What contributed to absolute performance?
At the individual stock level, SK Hynix Inc., the Korean semiconductor company, led positive contributions. SK Hynix continues to benefit from its leading position in memory, with favorable supply-demand dynamics and persistent shortages driven by strong server and AI-related demand. The company’s increased quarterly profits have reinforced the memory upcycle narrative. Shares of Taiwan Semiconductor Manufacturing Co. Ltd moved higher as the company's leading position in advanced chip fabrication continued to attract investor interest. As AI-driven demand intensified over the period, the company posted a series of record results while signaling conviction in the long-term demand trajectory by raising capital expenditure guidance. MediaTek, Inc., the Taiwanese chip manufacturer, also contributed notably as investors focused on its rapidly growing role in AI infrastructure driven by the company's positioning in manufacturing Tensor Processing Units. The position was trimmed as MediaTek’s key smartphone end-market faces headwinds from higher memory prices.
What detracted from absolute performance?
At the individual stock level, SAP, the German enterprise software company, was a leading detractor on fears of AI disruption and a weaker-than-expected cloud backlog that signaled a more cautious spending environment. The position was eliminated reflecting the stock’s elevated valuation and less compelling risk-reward. U.K. information and analytics company RELX plc was another laggard on concerns around the potential for AI to erode the competitive moats of data services providers. The position was exited as the risk-reward became less compelling given increased scrutiny of business models across the sector. Shares of Tencent, the Chinese technology company, came under pressure on concerns around AI-driven disruption and disintermediation within the gaming segment alongside broader weakness in Chinese internet stocks. The position has been maintained on conviction with respect to Tencent’s deeply embedded social ecosystem, gaming leadership, net cash balance sheet and relatively undemanding valuation.
The views expressed reflect the opinions of BlackRock as of the date of this report and are subject to change based on changes in market, economic or other conditions. These views are not intended to be a forecast of future events and are no guarantee of future results.
Fund performance
Cumulative performance: June 1, 2016 through May 31, 2026
Initial investment of $10,000
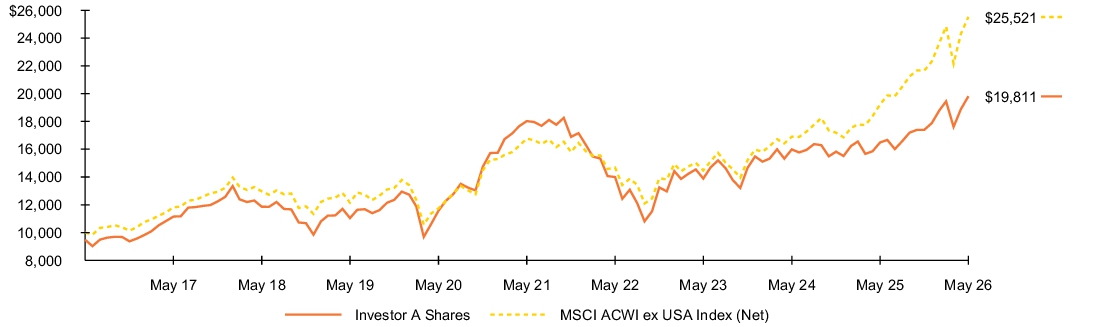
See “Average annual total returns” for additional information on fund performance.
Average annual total returns
| 1 Year | 5 Years | 10 Years | |||
| 20.16 | % | 1.91 | % | 7.65 | % |
| 13.85 | 0.81 | 7.08 | |||
| 32.77 | 8.77 | 9.82 |
Key Fund statistics
| $1,144,549,618 |
| 48 |
| $6,349,289 |
| 66% |
What did the Fund invest in?
(as of May 31, 2026)
Geographic allocation
| Country | Percent of Net Assets |
|
| 12.1 | % | |
| 11.2 | ||
| 9.3 | ||
| 8.4 | ||
| 8.3 | ||
| 6.8 | ||
| 6.8 | ||
| 6.5 | ||
| 6.3 | ||
| 5.0 | ||
| 18.2 | ||
| 1.1 |
Ten largest holdings
| Security(a) | Percent of Net Assets |
|
| 6.9 | % | |
| 3.5 | ||
| 3.3 | ||
| 3.2 | ||
| 3.1 | ||
| 3.0 | ||
| 3.0 | ||
| 2.7 | ||
| 2.7 | ||
| 2.6 |
| Excludes short-term securities. |
| Ten largest countries are presented. Additional countries are found in Other. |
Ten largest holdings
| Security(a) | Percent of Net Assets |
|
| 6.9 | % | |
| 3.5 | ||
| 3.3 | ||
| 3.2 | ||
| 3.1 | ||
| 3.0 | ||
| 3.0 | ||
| 2.7 | ||
| 2.7 | ||
| 2.6 |
Material fund changes
This is a summary of planned changes to the Fund since May 31, 2025. For more complete information, you may review the Fund’s next prospectus, which we expect to be available approximately 120 days after May 31, 2026 at blackrock.com/fundreports or upon request by contacting us at (800) 441-7762.
Effective June 1, 2026, BlackRock Advisors, LLC has voluntarily agreed to cap the Fund’s total annual fund operating expenses after fee waiver to 0.75% as a percentage of the Fund’s average daily net assets.
Effective June 1, 2026, BlackRock Advisors, LLC has voluntarily agreed to cap the Fund’s total annual fund operating expenses after fee waiver to 0.75% as a percentage of the Fund’s average daily net assets.
This is a summary of planned changes to the Fund since May 31, 2025. For more complete information, you may review the Fund’s next prospectus, which we expect to be available approximately 120 days after May 31, 2026 at blackrock.com/fundreports or upon request by contacting us at (800) 441-7762.
This report describes changes to the Fund that occurred during the reporting period.
What were the Fund costs for the last year?
(based on a hypothetical $10,000 investment)
| Class name | Costs of a $10,000 investment |
Costs paid as a percentage of a $10,000 investment |
| $72 | 0.65% |
How did the Fund perform last year?
- For the reporting period ended May 31, 2026, the Fund's Institutional Shares returned 20.40%.
- For the same period, the Fund’s benchmark, the MSCI ACWI ex USA Index (Net) returned 32.77%.
What contributed to absolute performance?
At the individual stock level, SK Hynix Inc., the Korean semiconductor company, led positive contributions. SK Hynix continues to benefit from its leading position in memory, with favorable supply-demand dynamics and persistent shortages driven by strong server and AI-related demand. The company’s increased quarterly profits have reinforced the memory upcycle narrative. Shares of Taiwan Semiconductor Manufacturing Co. Ltd moved higher as the company's leading position in advanced chip fabrication continued to attract investor interest. As AI-driven demand intensified over the period, the company posted a series of record results while signaling conviction in the long-term demand trajectory by raising capital expenditure guidance. MediaTek, Inc., the Taiwanese chip manufacturer, also contributed notably as investors focused on its rapidly growing role in AI infrastructure driven by the company's positioning in manufacturing Tensor Processing Units. The position was trimmed as MediaTek’s key smartphone end-market faces headwinds from higher memory prices.
What detracted from absolute performance?
At the individual stock level, SAP, the German enterprise software company, was a leading detractor on fears of AI disruption and a weaker-than-expected cloud backlog that signaled a more cautious spending environment. The position was eliminated reflecting the stock’s elevated valuation and less compelling risk-reward. U.K. information and analytics company RELX plc was another laggard on concerns around the potential for AI to erode the competitive moats of data services providers. The position was exited as the risk-reward became less compelling given increased scrutiny of business models across the sector. Shares of Tencent, the Chinese technology company, came under pressure on concerns around AI-driven disruption and disintermediation within the gaming segment alongside broader weakness in Chinese internet stocks. The position has been maintained on conviction with respect to Tencent’s deeply embedded social ecosystem, gaming leadership, net cash balance sheet and relatively undemanding valuation.
The views expressed reflect the opinions of BlackRock as of the date of this report and are subject to change based on changes in market, economic or other conditions. These views are not intended to be a forecast of future events and are no guarantee of future results.
Fund performance
Cumulative performance: June 1, 2016 through May 31, 2026
Initial investment of $10,000
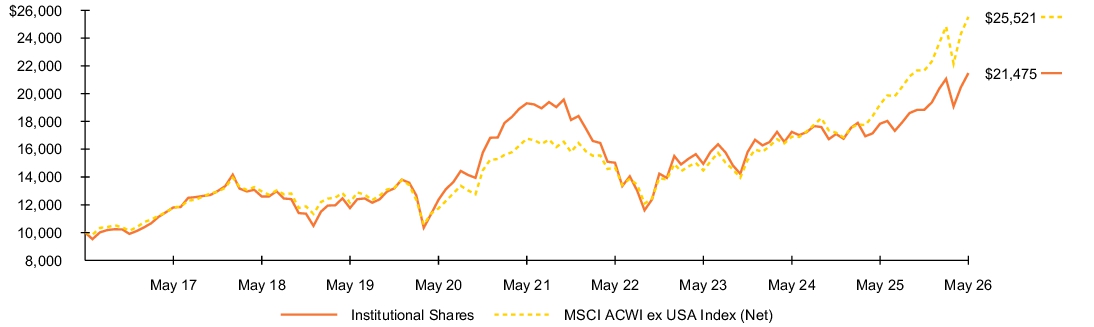
See “Average annual total returns” for additional information on fund performance.
Average annual total returns
| 1 Year | 5 Years | 10 Years | |||
| 20.40 | % | 2.15 | % | 7.94 | % |
| 32.77 | 8.77 | 9.82 |
Key Fund statistics
| $1,144,549,618 |
| 48 |
| $6,349,289 |
| 66% |
What did the Fund invest in?
(as of May 31, 2026)
Geographic allocation
| Country | Percent of Net Assets |
|
| 12.1 | % | |
| 11.2 | ||
| 9.3 | ||
| 8.4 | ||
| 8.3 | ||
| 6.8 | ||
| 6.8 | ||
| 6.5 | ||
| 6.3 | ||
| 5.0 | ||
| 18.2 | ||
| 1.1 |
Ten largest holdings
| Security(a) | Percent of Net Assets |
|
| 6.9 | % | |
| 3.5 | ||
| 3.3 | ||
| 3.2 | ||
| 3.1 | ||
| 3.0 | ||
| 3.0 | ||
| 2.7 | ||
| 2.7 | ||
| 2.6 |
| Excludes short-term securities. |
| Ten largest countries are presented. Additional countries are found in Other. |
Ten largest holdings
| Security(a) | Percent of Net Assets |
|
| 6.9 | % | |
| 3.5 | ||
| 3.3 | ||
| 3.2 | ||
| 3.1 | ||
| 3.0 | ||
| 3.0 | ||
| 2.7 | ||
| 2.7 | ||
| 2.6 |
Material fund changes
This is a summary of planned changes to the Fund since May 31, 2025. For more complete information, you may review the Fund’s next prospectus, which we expect to be available approximately 120 days after May 31, 2026 at blackrock.com/fundreports or upon request by contacting us at (800) 441-7762.
Effective June 1, 2026, BlackRock Advisors, LLC has voluntarily agreed to cap the Fund’s total annual fund operating expenses after fee waiver to 0.50% as a percentage of the Fund’s average daily net assets.
Effective June 1, 2026, BlackRock Advisors, LLC has voluntarily agreed to cap the Fund’s total annual fund operating expenses after fee waiver to 0.50% as a percentage of the Fund’s average daily net assets.
This is a summary of planned changes to the Fund since May 31, 2025. For more complete information, you may review the Fund’s next prospectus, which we expect to be available approximately 120 days after May 31, 2026 at blackrock.com/fundreports or upon request by contacting us at (800) 441-7762.