
August 2026 Second Quarter 2026 Earnings Call Exhibit 99.2
Forward Looking Statement Statements contained in this presentation that state the Partnership’s or management’s expectations or predictions of the future are forward-looking statements. The words “believe,” “expect,” “should,” “intends,” “anticipates”, “estimates,” “target” and other similar expressions identify forward-looking statements. It is important to note that actual results could differ materially from those projected in such forward-looking statements. For more information concerning factors that could cause actual results to differ from those expressed or forecasted, see CrossAmerica’s annual reports on Form 10-K, quarterly reports on Form 10-Q and other reports filed with the Securities and Exchange Commission and available on the Partnership’s website at www.crossamericapartners.com. If any of these factors materialize, or if our underlying assumptions prove to be incorrect, actual results may vary significantly from what we projected. Any forward-looking statement you see or hear during this presentation reflects our current views as of the date of this presentation with respect to future events. We assume no obligation to publicly update or revise these forward-looking statements for any reason, whether as a result of new information, future events, or otherwise.
CrossAmerica Business Overview Maura Topper, President & CEO
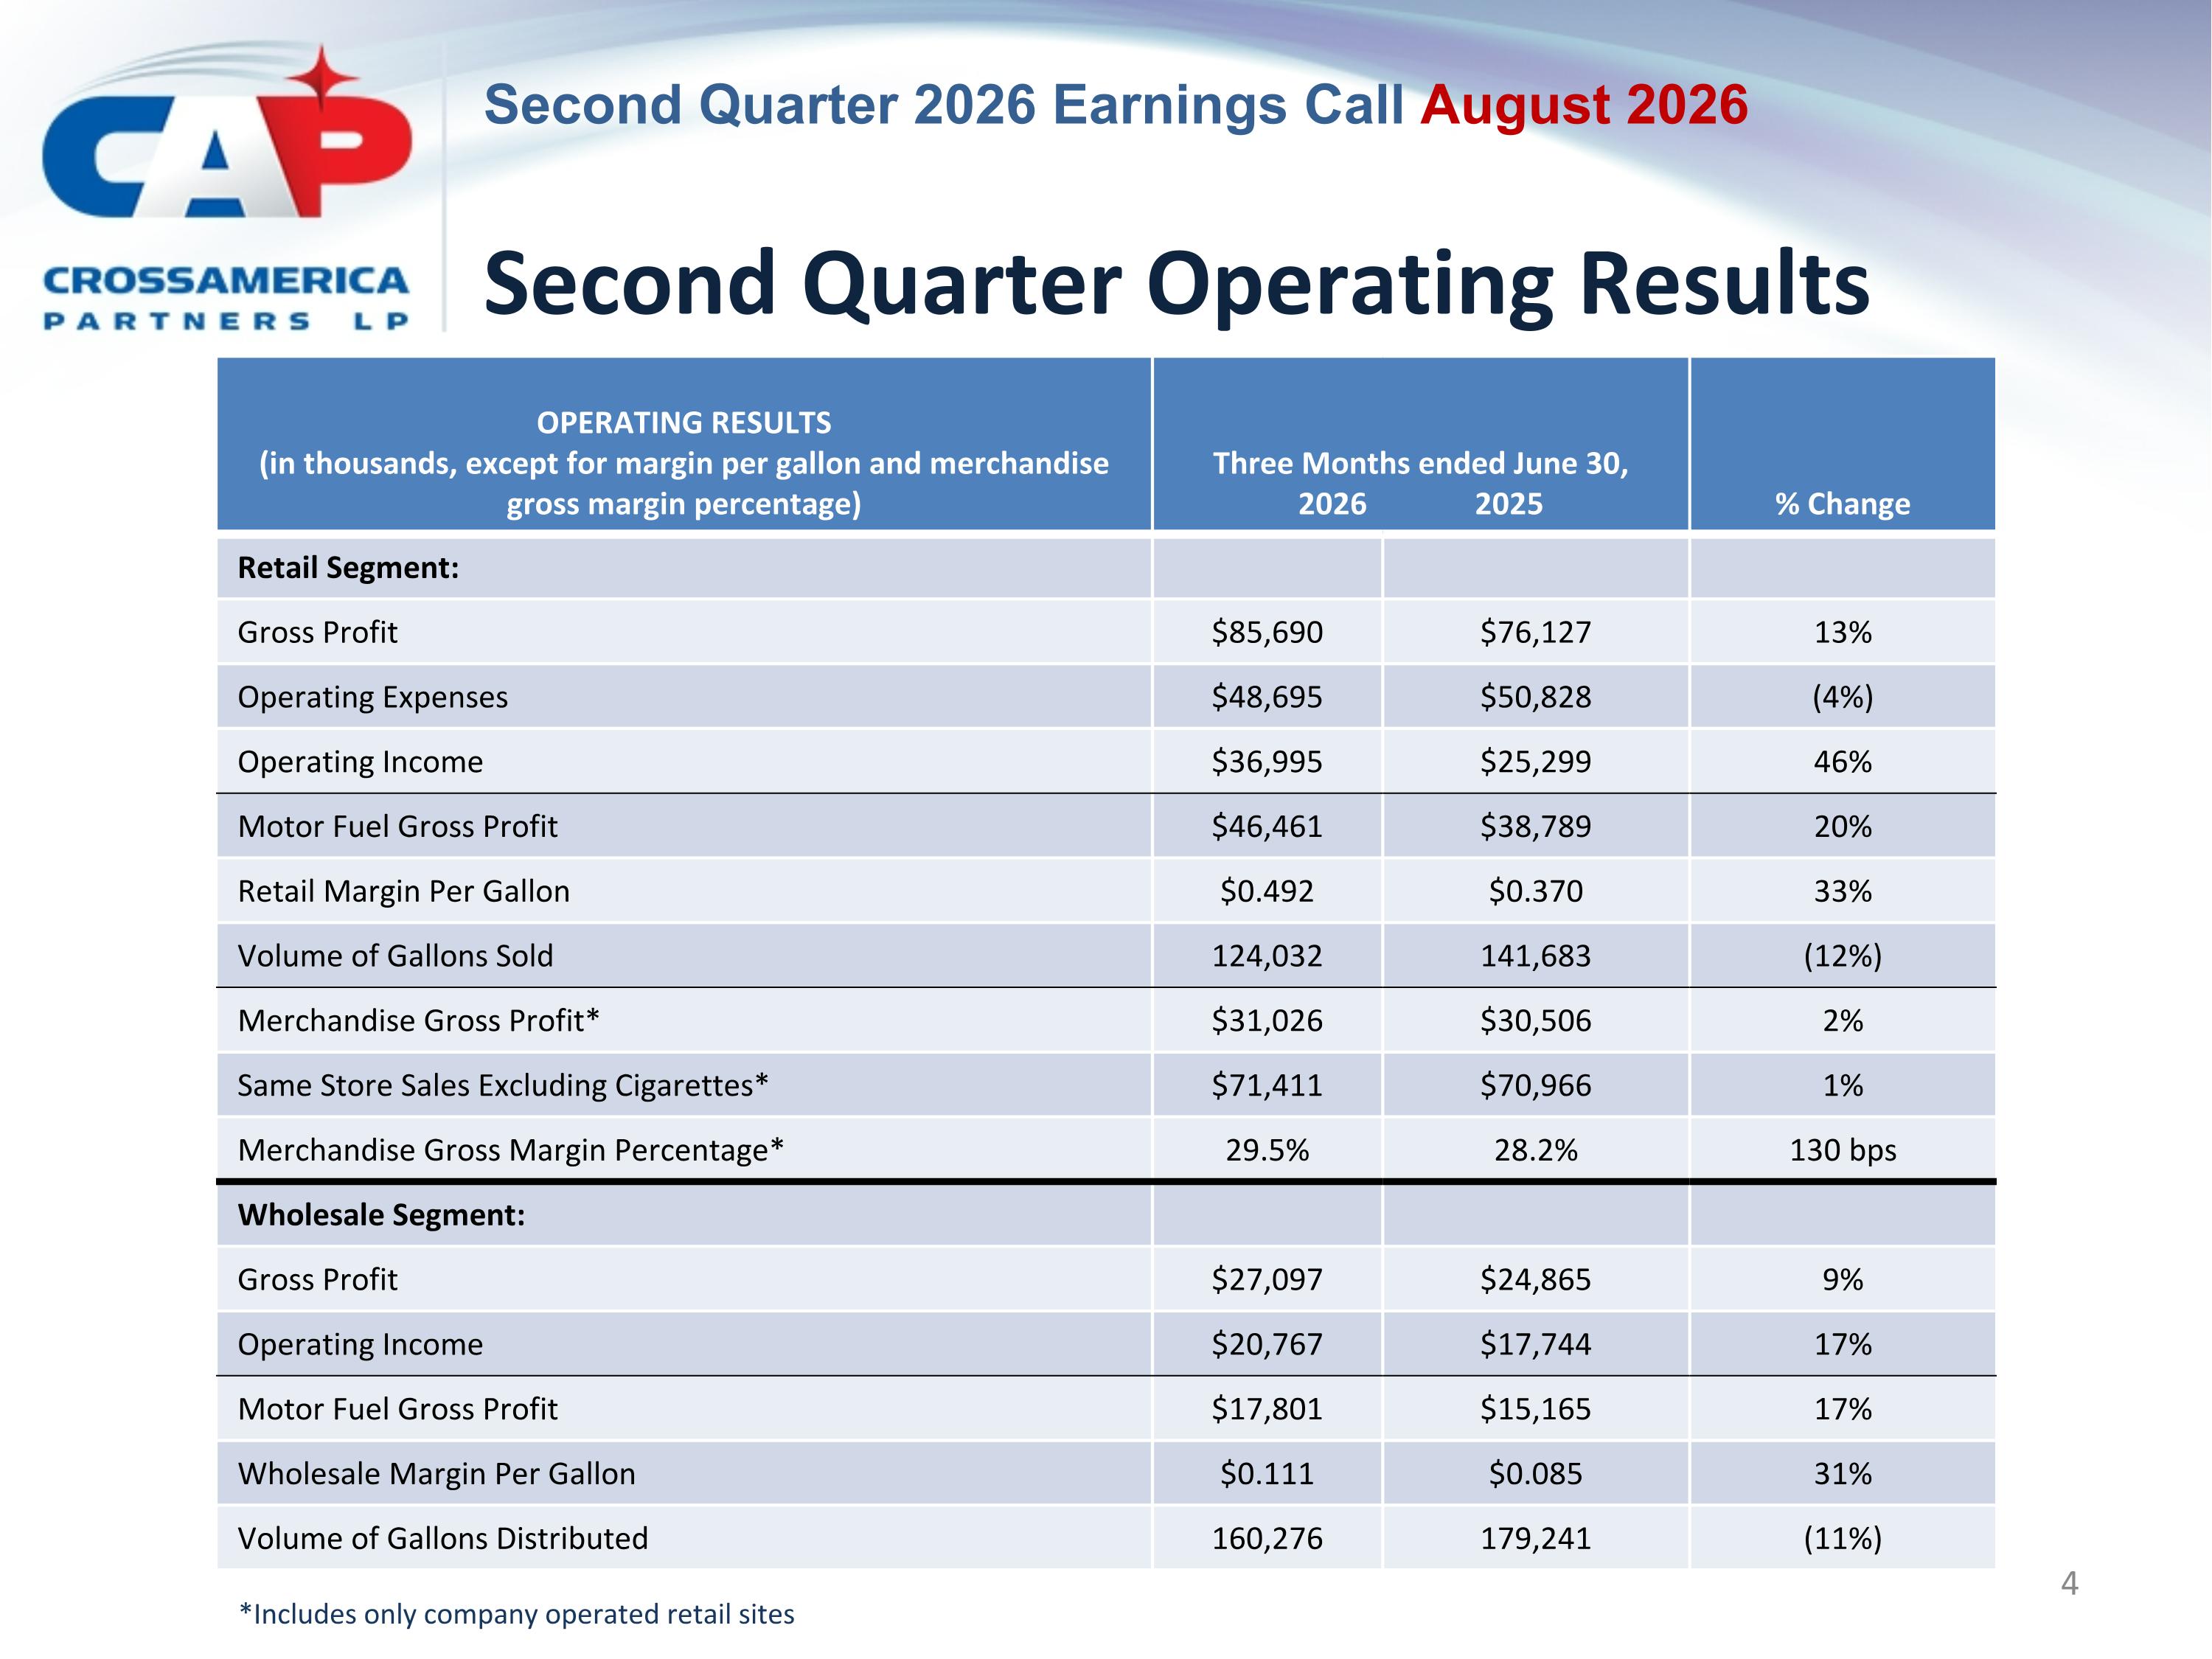
Second Quarter Operating Results OPERATING RESULTS (in thousands, except for margin per gallon and merchandise gross margin percentage) Three Months ended June 30, 2026 2025 % Change Retail Segment: Gross Profit $85,690 $76,127 13% Operating Expenses $48,695 $50,828 (4%) Operating Income $36,995 $25,299 46% Motor Fuel Gross Profit $46,461 $38,789 20% Retail Margin Per Gallon $0.492 $0.370 33% Volume of Gallons Sold 124,032 141,683 (12%) Merchandise Gross Profit* $31,026 $30,506 2% Same Store Sales Excluding Cigarettes* $71,411 $70,966 1% Merchandise Gross Margin Percentage* 29.5% 28.2% 130 bps Wholesale Segment: Gross Profit $27,097 $24,865 9% Operating Income $20,767 $17,744 17% Motor Fuel Gross Profit $17,801 $15,165 17% Wholesale Margin Per Gallon $0.111 $0.085 31% Volume of Gallons Distributed 160,276 179,241 (11%) *Includes only company operated retail sites
CrossAmerica Financial Overview Jon Benfield, Chief Financial Officer
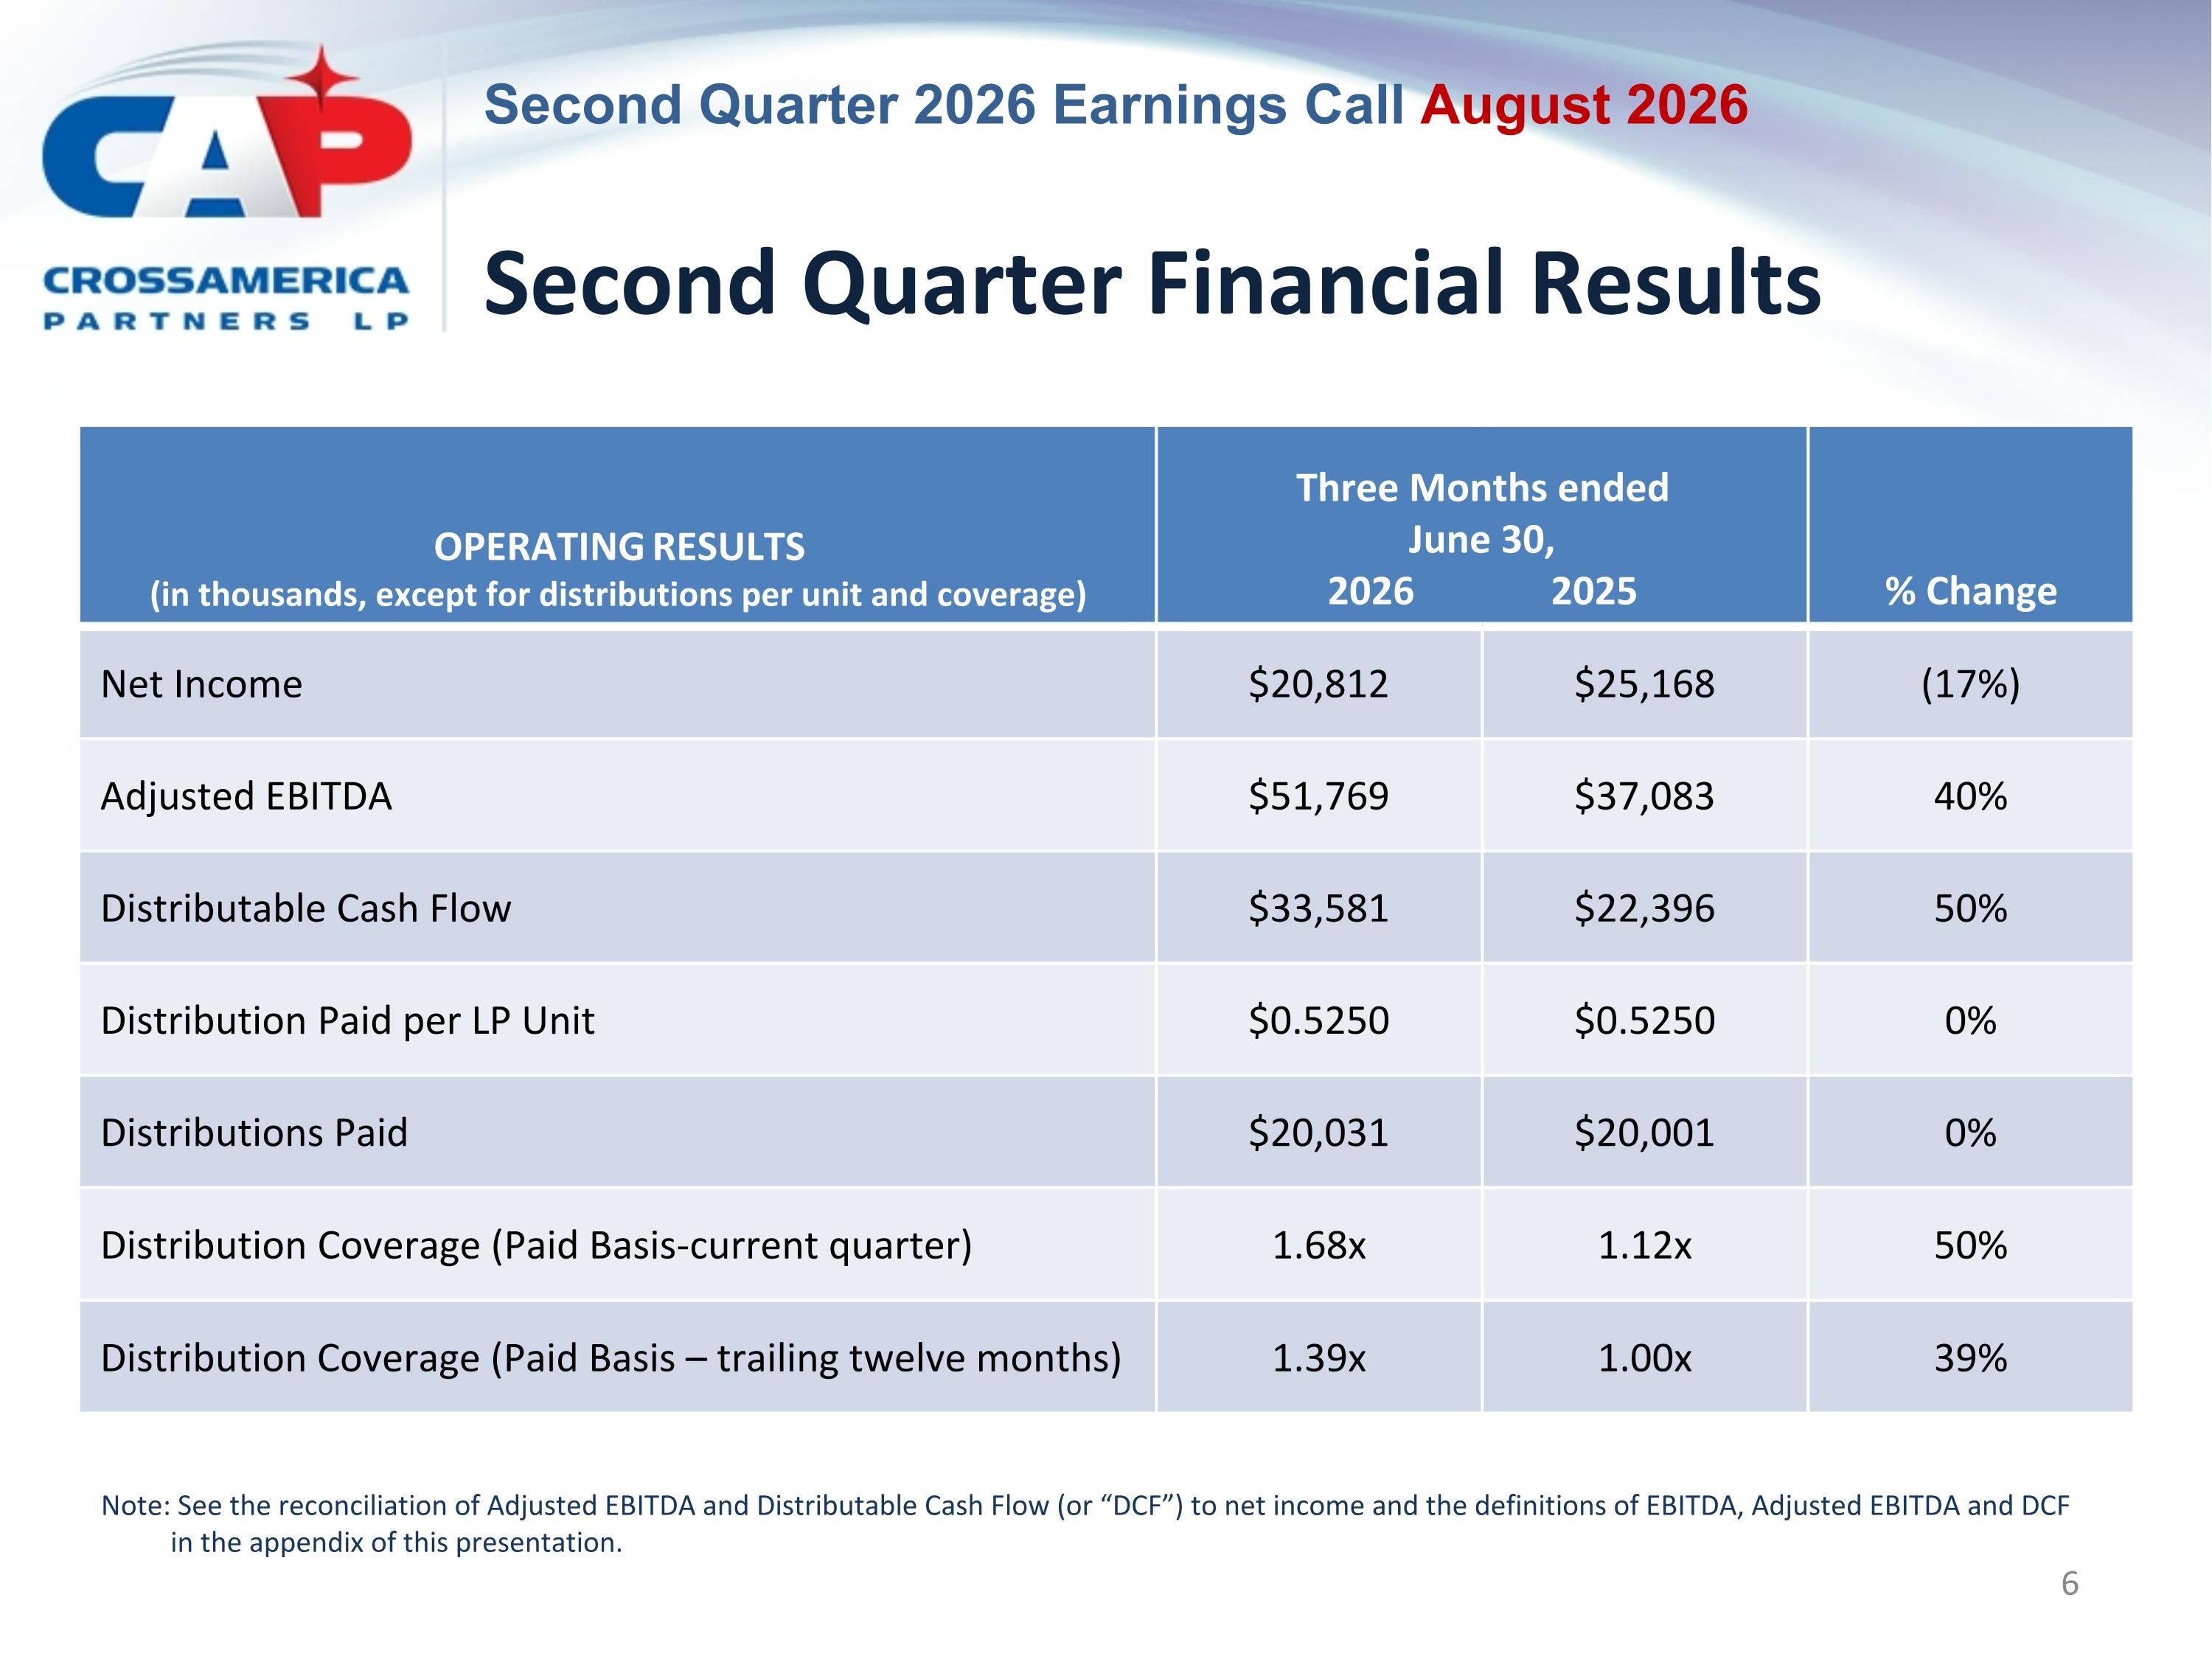
Second Quarter Financial Results OPERATING RESULTS (in thousands, except for distributions per unit and coverage) Three Months ended June 30, 2026 2025 % Change Net Income $20,812 $25,168 (17%) Adjusted EBITDA $51,769 $37,083 40% Distributable Cash Flow $33,581 $22,396 50% Distribution Paid per LP Unit $0.5250 $0.5250 0% Distributions Paid $20,031 $20,001 0% Distribution Coverage (Paid Basis-current quarter) 1.68x 1.12x 50% Distribution Coverage (Paid Basis – trailing twelve months) 1.39x 1.00x 39% Note: See the reconciliation of Adjusted EBITDA and Distributable Cash Flow (or “DCF”) to net income and the definitions of EBITDA, Adjusted EBITDA and DCF in the appendix of this presentation.
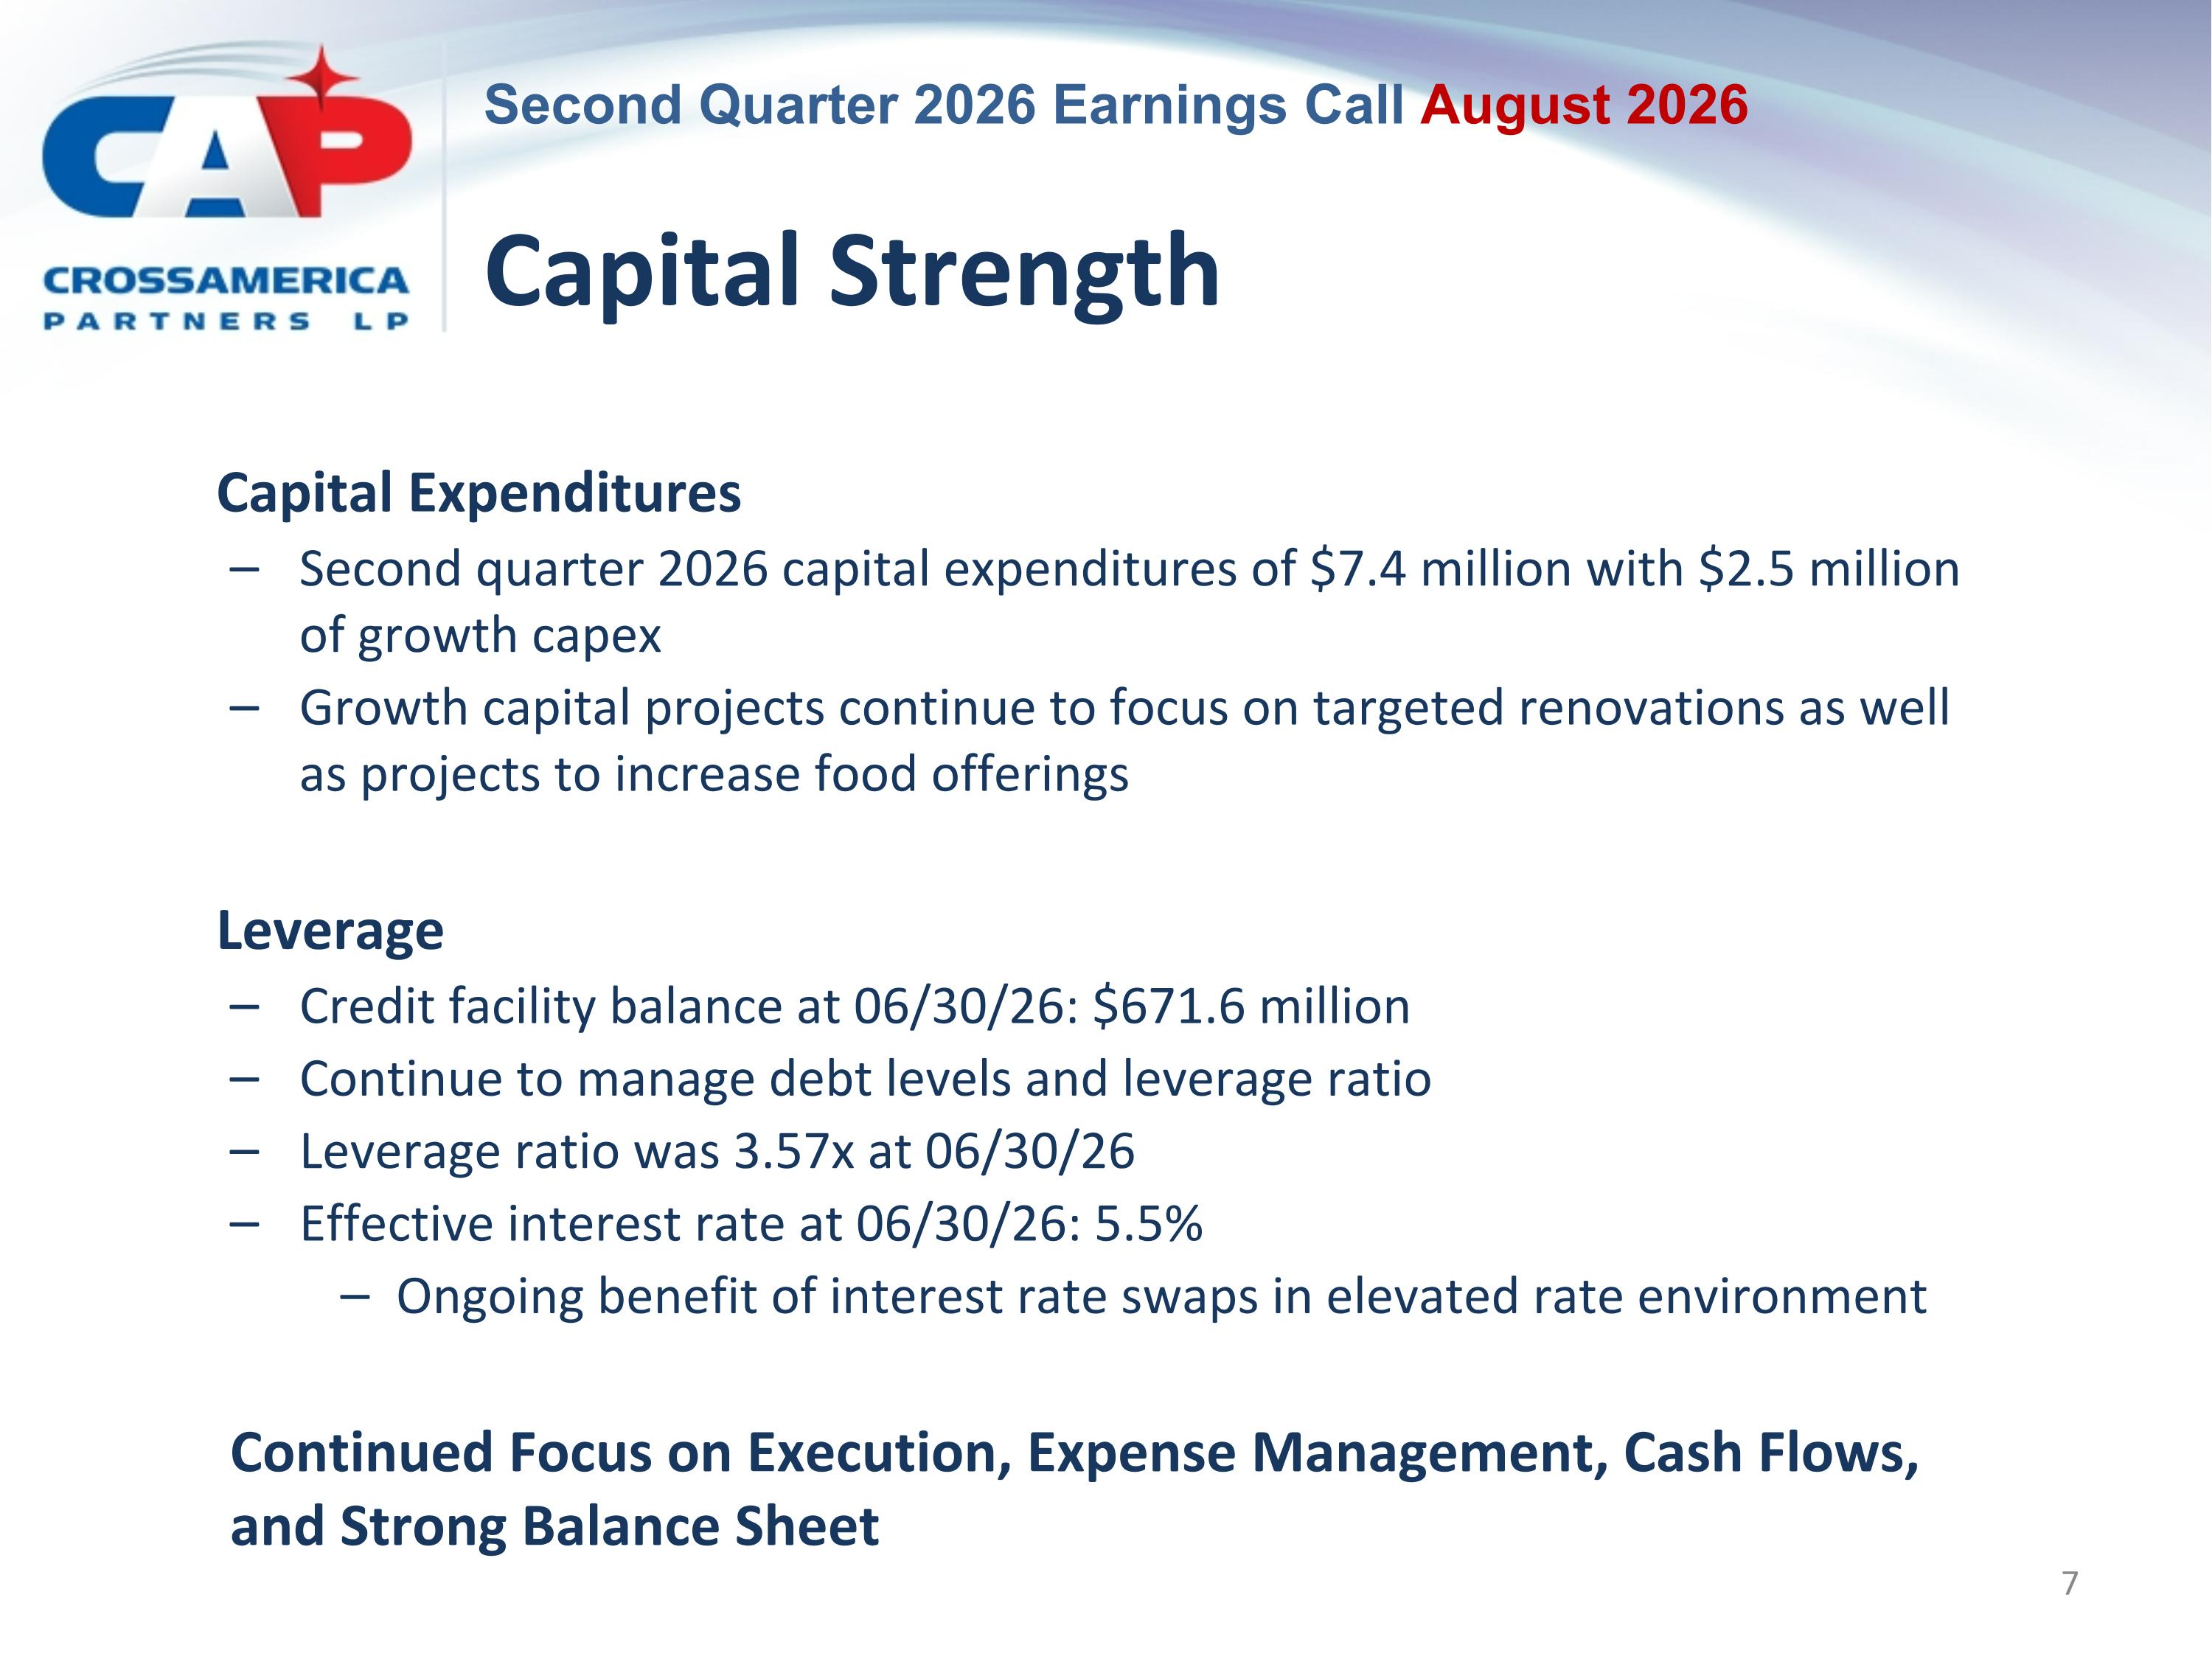
Capital Strength Capital Expenditures Second quarter 2026 capital expenditures of $7.4 million with $2.5 million of growth capex Growth capital projects continue to focus on targeted renovations as well as projects to increase food offerings Leverage Credit facility balance at 06/30/26: $671.6 million Continue to manage debt levels and leverage ratio Leverage ratio was 3.57x at 06/30/26 Effective interest rate at 06/30/26: 5.5% Ongoing benefit of interest rate swaps in elevated rate environment Continued Focus on Execution, Expense Management, Cash Flows, and Strong Balance Sheet

Appendix Second Quarter 2026 Earnings Call
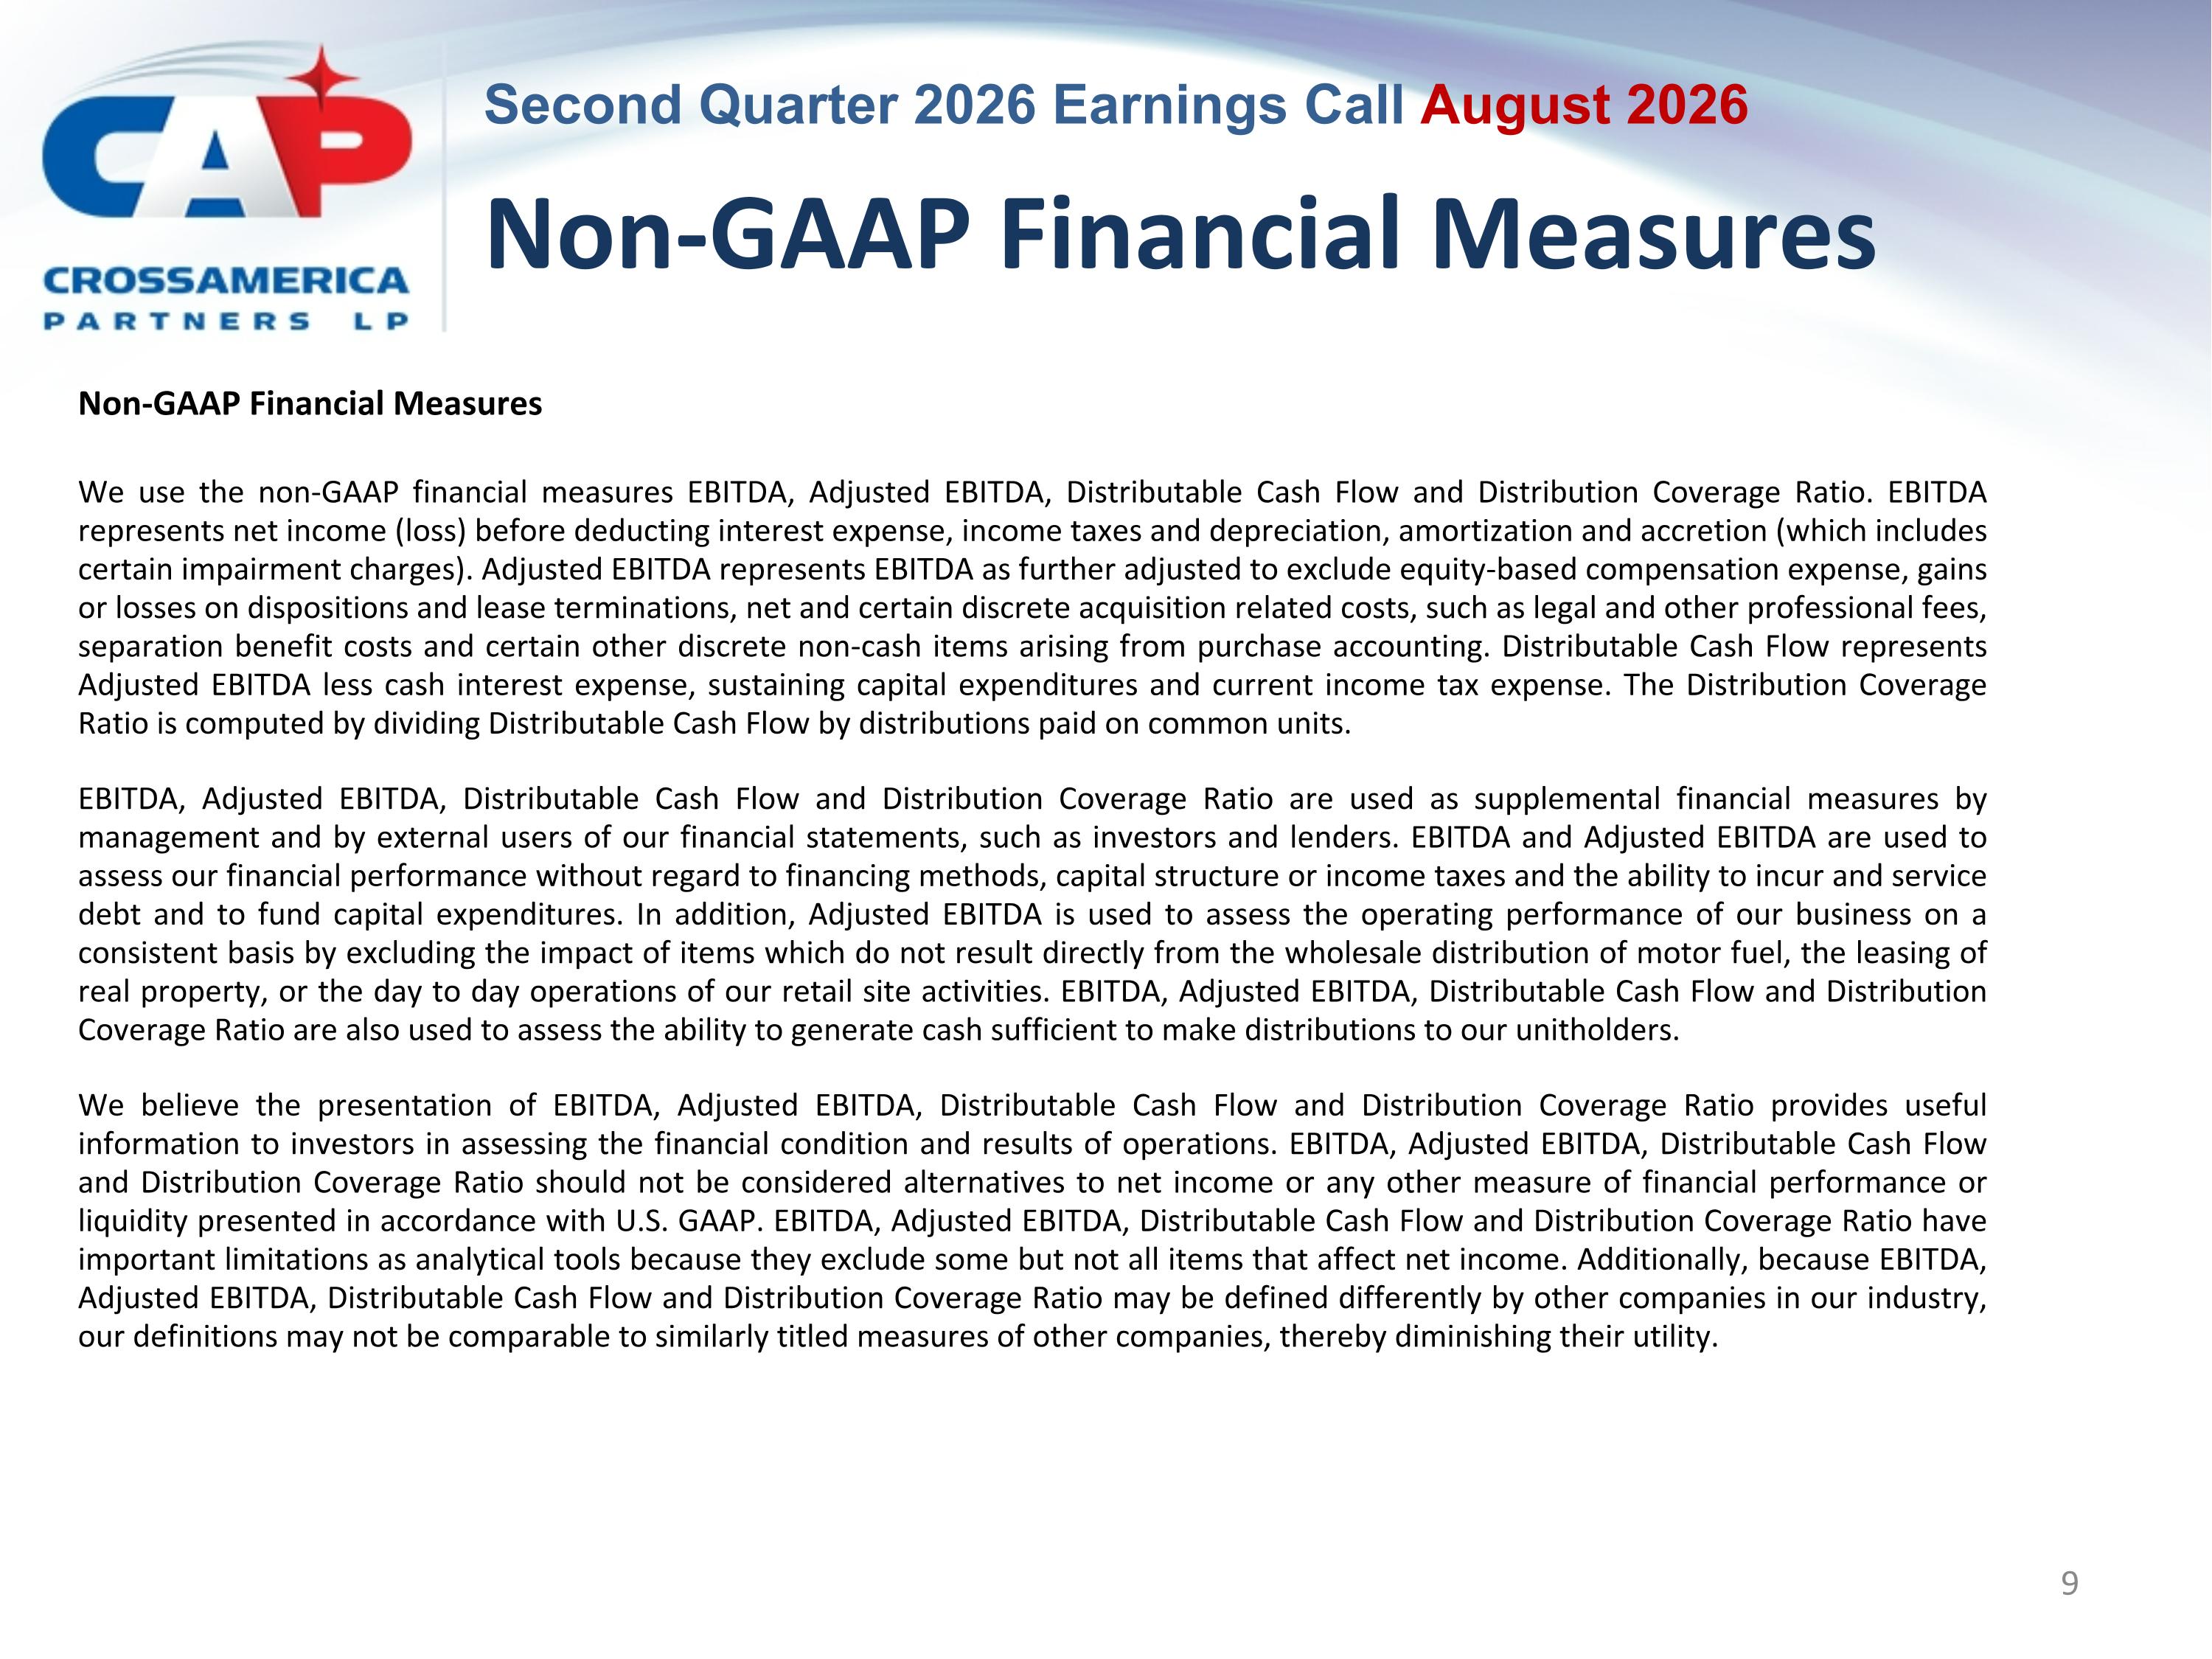
Non-GAAP Financial Measures Non-GAAP Financial Measures We use the non-GAAP financial measures EBITDA, Adjusted EBITDA, Distributable Cash Flow and Distribution Coverage Ratio. EBITDA represents net income (loss) before deducting interest expense, income taxes and depreciation, amortization and accretion (which includes certain impairment charges). Adjusted EBITDA represents EBITDA as further adjusted to exclude equity-based compensation expense, gains or losses on dispositions and lease terminations, net and certain discrete acquisition related costs, such as legal and other professional fees, separation benefit costs and certain other discrete non-cash items arising from purchase accounting. Distributable Cash Flow represents Adjusted EBITDA less cash interest expense, sustaining capital expenditures and current income tax expense. The Distribution Coverage Ratio is computed by dividing Distributable Cash Flow by distributions paid on common units. EBITDA, Adjusted EBITDA, Distributable Cash Flow and Distribution Coverage Ratio are used as supplemental financial measures by management and by external users of our financial statements, such as investors and lenders. EBITDA and Adjusted EBITDA are used to assess our financial performance without regard to financing methods, capital structure or income taxes and the ability to incur and service debt and to fund capital expenditures. In addition, Adjusted EBITDA is used to assess the operating performance of our business on a consistent basis by excluding the impact of items which do not result directly from the wholesale distribution of motor fuel, the leasing of real property, or the day to day operations of our retail site activities. EBITDA, Adjusted EBITDA, Distributable Cash Flow and Distribution Coverage Ratio are also used to assess the ability to generate cash sufficient to make distributions to our unitholders. We believe the presentation of EBITDA, Adjusted EBITDA, Distributable Cash Flow and Distribution Coverage Ratio provides useful information to investors in assessing the financial condition and results of operations. EBITDA, Adjusted EBITDA, Distributable Cash Flow and Distribution Coverage Ratio should not be considered alternatives to net income or any other measure of financial performance or liquidity presented in accordance with U.S. GAAP. EBITDA, Adjusted EBITDA, Distributable Cash Flow and Distribution Coverage Ratio have important limitations as analytical tools because they exclude some but not all items that affect net income. Additionally, because EBITDA, Adjusted EBITDA, Distributable Cash Flow and Distribution Coverage Ratio may be defined differently by other companies in our industry, our definitions may not be comparable to similarly titled measures of other companies, thereby diminishing their utility.
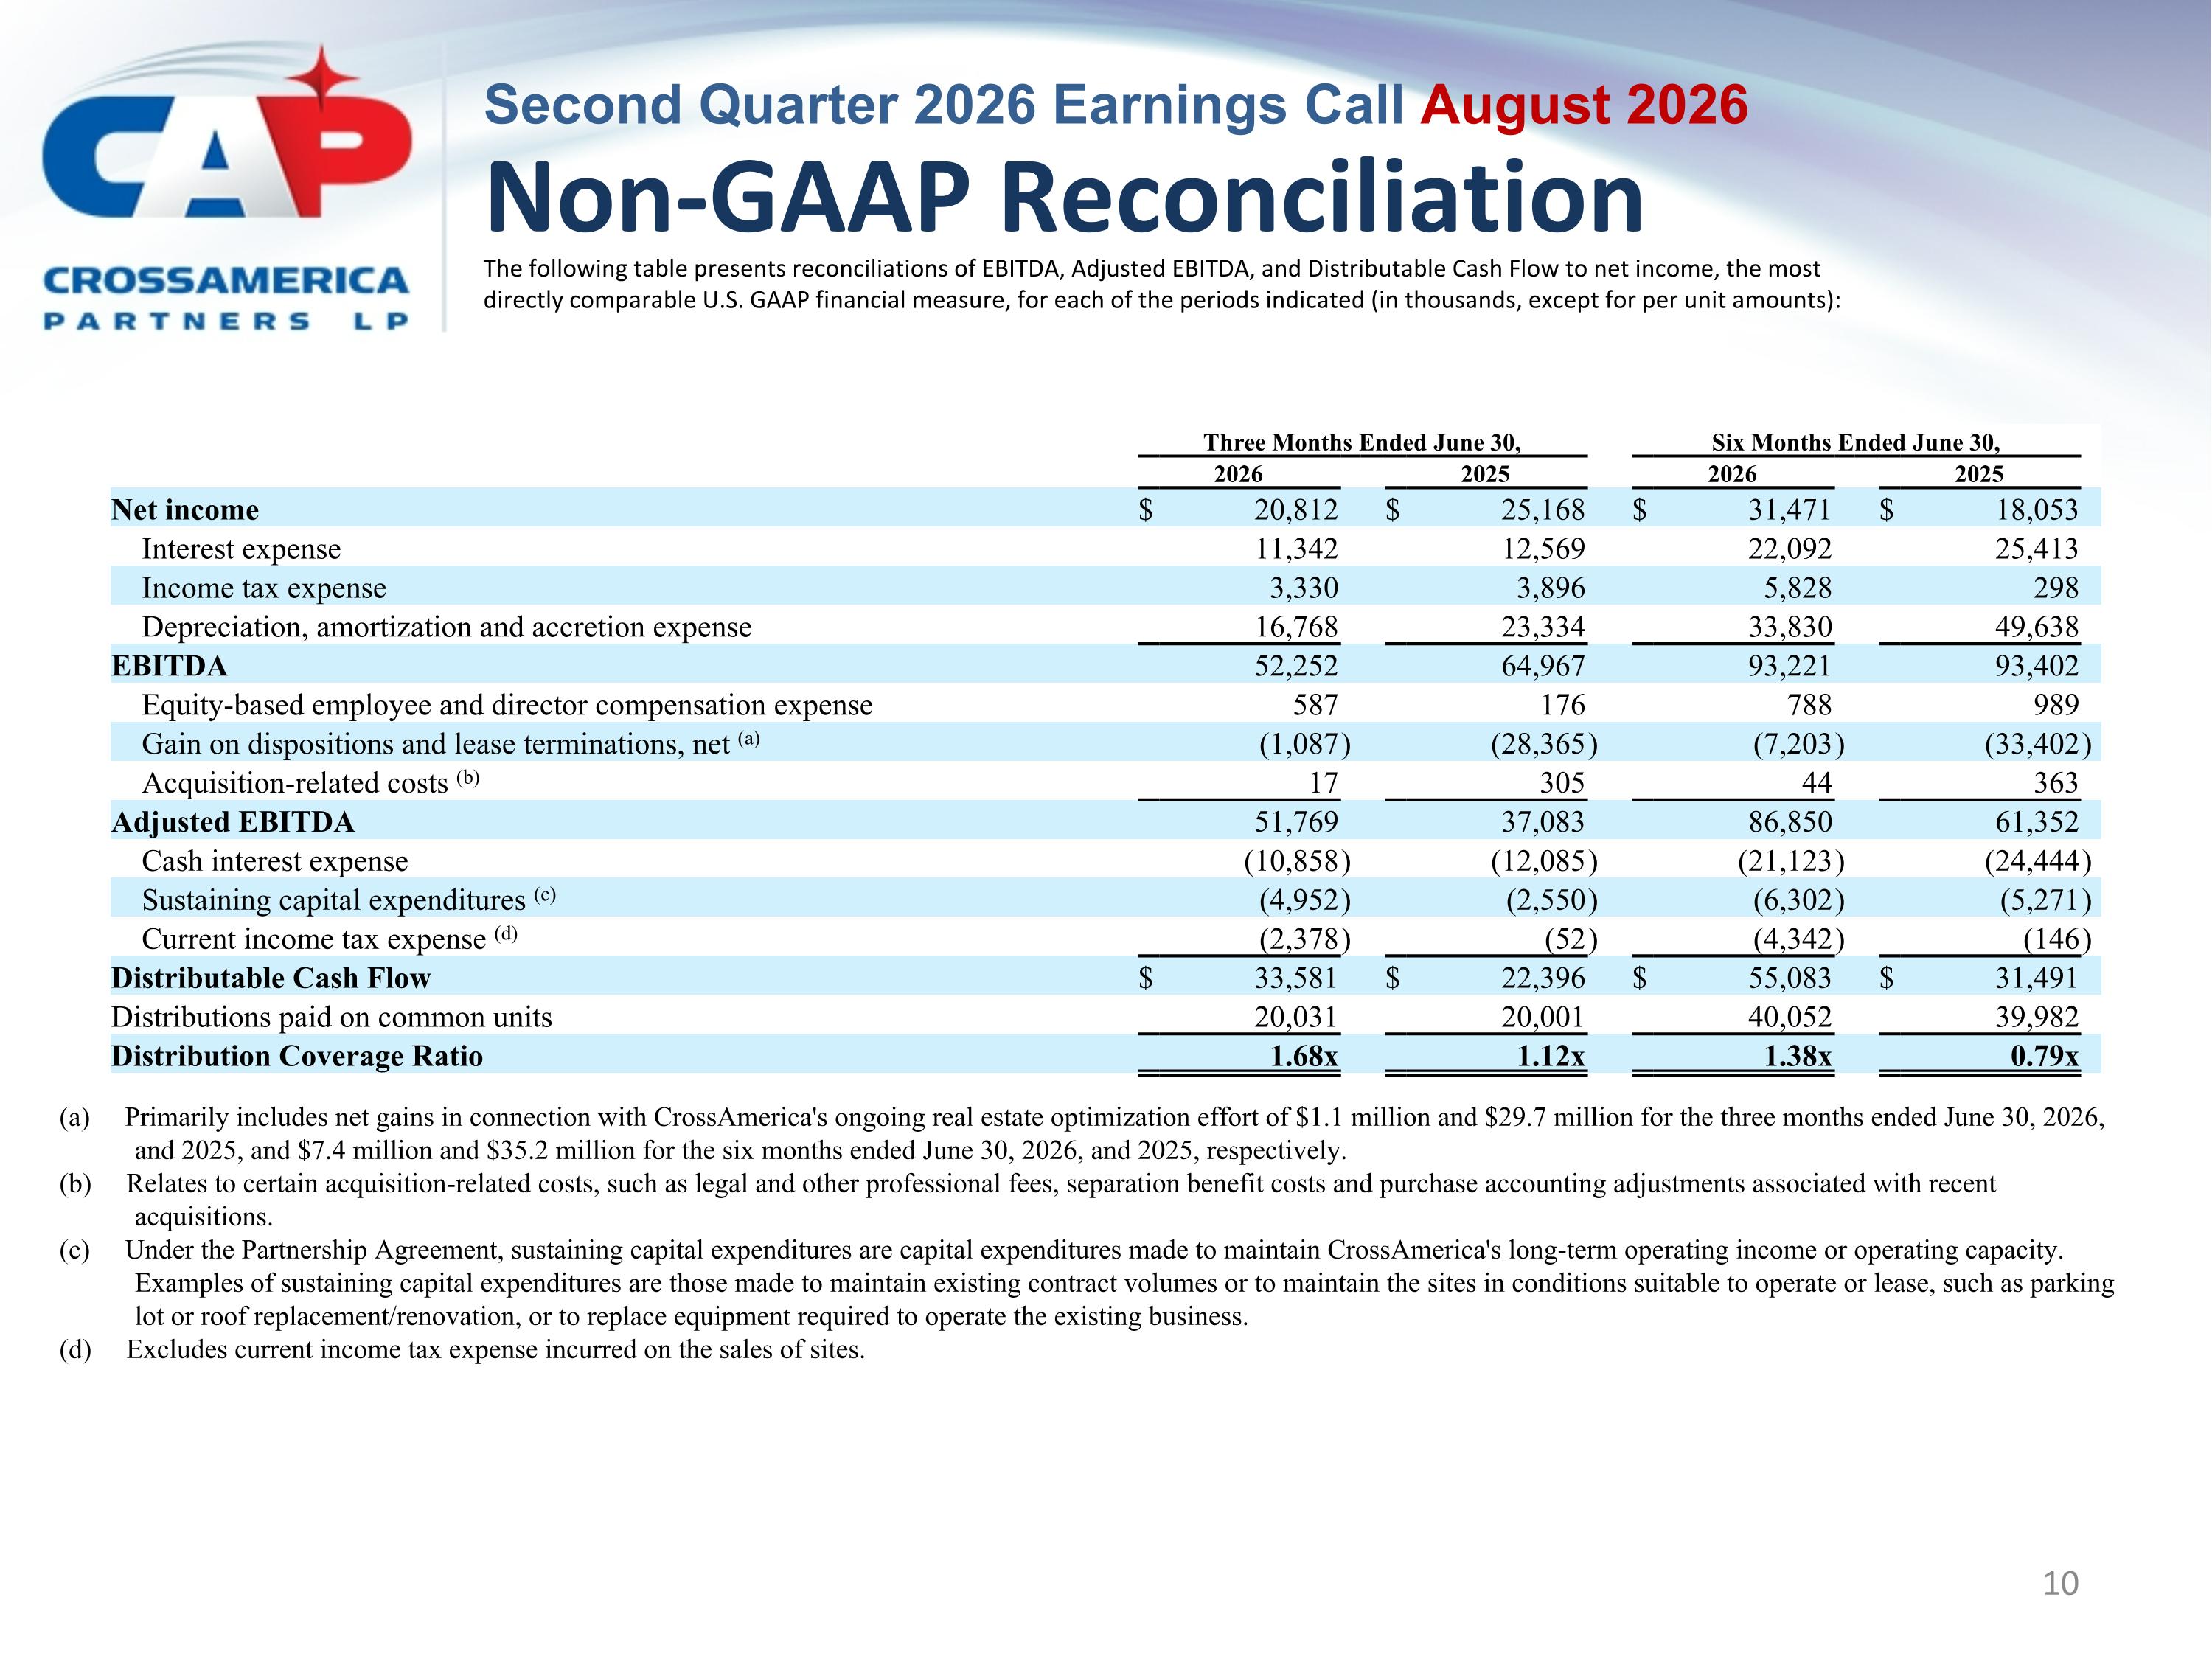
Non-GAAP Reconciliation The following table presents reconciliations of EBITDA, Adjusted EBITDA, and Distributable Cash Flow to net income, the most directly comparable U.S. GAAP financial measure, for each of the periods indicated (in thousands, except for per unit amounts): (a) Primarily includes net gains in connection with CrossAmerica's ongoing real estate optimization effort of $1.1 million and $29.7 million for the three months ended June 30, 2026, and 2025, and $7.4 million and $35.2 million for the six months ended June 30, 2026, and 2025, respectively. (b) Relates to certain acquisition-related costs, such as legal and other professional fees, separation benefit costs and purchase accounting adjustments associated with recent acquisitions. (c) Under the Partnership Agreement, sustaining capital expenditures are capital expenditures made to maintain CrossAmerica's long-term operating income or operating capacity. Examples of sustaining capital expenditures are those made to maintain existing contract volumes or to maintain the sites in conditions suitable to operate or lease, such as parking lot or roof replacement/renovation, or to replace equipment required to operate the existing business. (d) Excludes current income tax expense incurred on the sales of sites. Three Months Ended June 30, Six Months Ended June 30, 2026 2025 2026 2025 Net income $ 20,812 $ 25,168 $ 31,471 $ 18,053 Interest expense 11,342 12,569 22,092 25,413 Income tax expense 3,330 3,896 5,828 298 Depreciation, amortization and accretion expense 16,768 23,334 33,830 49,638 EBITDA 52,252 64,967 93,221 93,402 Equity-based employee and director compensation expense 587 176 788 989 Gain on dispositions and lease terminations, net (a) (1,087 ) (28,365 ) (7,203 ) (33,402 ) Acquisition-related costs (b) 17 305 44 363 Adjusted EBITDA 51,769 37,083 86,850 61,352 Cash interest expense (10,858 ) (12,085 ) (21,123 ) (24,444 ) Sustaining capital expenditures (c) (4,952 ) (2,550 ) (6,302 ) (5,271 ) Current income tax expense (d) (2,378 ) (52 ) (4,342 ) (146 ) Distributable Cash Flow $ 33,581 $ 22,396 $ 55,083 $ 31,491 Distributions paid on common units 20,031 20,001 40,052 39,982 Distribution Coverage Ratio 1.68x 1.12x 1.38x 0.79x