
14.YoB + + Exhibit 99.2
` Q2 2026 Shareholder Letter 1
Q2 2026 Shareholder Letter 2
To Our Shareholders ZipRecruiter’s momentum accelerated in the second quarter, growing revenue 5% year-over-year to $118.1 million, which was $6 million above the midpoint of our guidance range. Net income in the second quarter was $43.4 million, equating to a net income margin of 37%. Adjusted EBITDA was $14.6 million, or a margin of 12%, which was above the midpoint of our guidance range and above the Adjusted EBITDA margin of 8% in Q2’25. Additionally, in Q2, we repurchased $294.6 million of our 5% senior unsecured notes at a discount of approximately $65 million to par. That transaction meaningfully reduced our debt burden while allowing us to maintain $174 million in cash and investments, and emerge with enough capital to fully fund future growth initiatives. At ZipRecruiter, our focus is on increasing conversations between employers and job seekers. We believe it is this real world, outcomes-based approach that has been fueling our growth. A number of product improvements in Q2 drove up conversations: ● Next Gen Search delivered a step function increase in quality applications: Over the course of Q2, we continued the deployment of our next generation search and matching engine. The new engine dramatically improves our ability to assess whether a job seeker is qualified for an open role. Qualified applications in Q2 increased 34% quarter-over-quarter. This lift in qualified applications, paired with our other product improvements, doubled the employer response-rate per application year-over-year. This increases our conviction that delivering more qualified applications leads to more conversations between employers and job seekers. ● Audio messages enable candidates to showcase their soft skills: In Q2, we enabled candidates applying through “Be Seen First” to record an audio message to submit to employers along with their resume. These audio messages allow the candidates to showcase their soft skills and personality as an additional way to stand out. Early data shows that candidates utilizing audio messages saw an 8% increase in the rate of getting a response. ● Automated candidate outreach makes using ZipRecruiter even more efficient: Our new AI feature, “Smart Outreach,” minimizes manual recruiting legwork so hiring teams can connect with the right talent fast. In Q2, this tool enabled employers to instantly turn job descriptions into customized, multi-step message campaigns sent directly to candidates in our Resume Database of over 50 million job seekers1. Recognizing that 1 ZipRecruiter Internal Data, Jan 2026 Q2 2026 Shareholder Letter 3
over 80% of candidates prefer proactive outreach, this tool automates the initial connection to make the hiring process faster, easier, and more personal. We delivered these marketplace improvements and strong Q2 results in what continues to be a subdued labor market. Hires and quits remained stable versus Q1, but overall, still near their lowest levels since 20152. We believe it is our execution driving our performance. The volume of connections happening on ZipRecruiter is accelerating, increasing satisfaction for both sides of our marketplace. We look forward to sharing more progress with you in the quarters ahead. _____________________ ________________________ Ian Siegel David Travers Chief Executive Officer President and interim Chief Financial Officer 2 Source: U.S. Bureau of Labor Statistics, Total hires and quits, Q2 2026 (As of June 2026) Q2 2026 Shareholder Letter 4
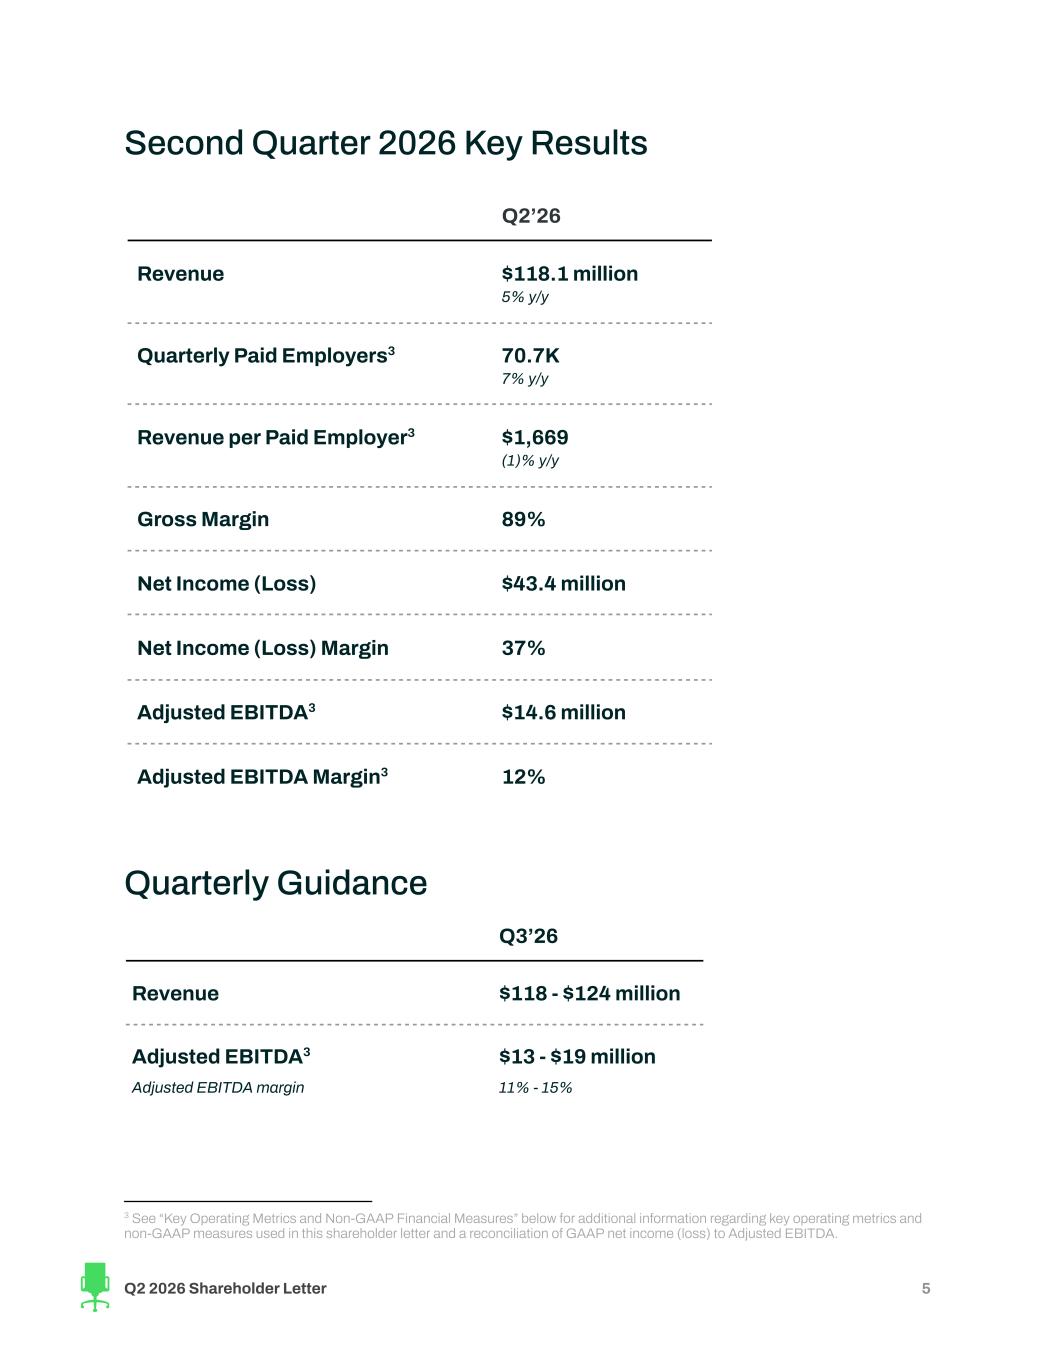
Second Quarter 2026 Key Results Q2’26 Revenue $118.1 million 5% y/y Quarterly Paid Employers3 70.7K 7% y/y Revenue per Paid Employer3 $1,669 (1)% y/y Gross Margin 89% Net Income (Loss) $43.4 million Net Income (Loss) Margin 37% Adjusted EBITDA3 $14.6 million Adjusted EBITDA Margin3 12% Quarterly Guidance Q3’26 Revenue $118 - $124 million Adjusted EBITDA3 Adjusted EBITDA margin $13 - $19 million 11% - 15% 3 See “Key Operating Metrics and Non-GAAP Financial Measures” below for additional information regarding key operating metrics and non-GAAP measures used in this shareholder letter and a reconciliation of GAAP net income (loss) to Adjusted EBITDA. Q2 2026 Shareholder Letter 5
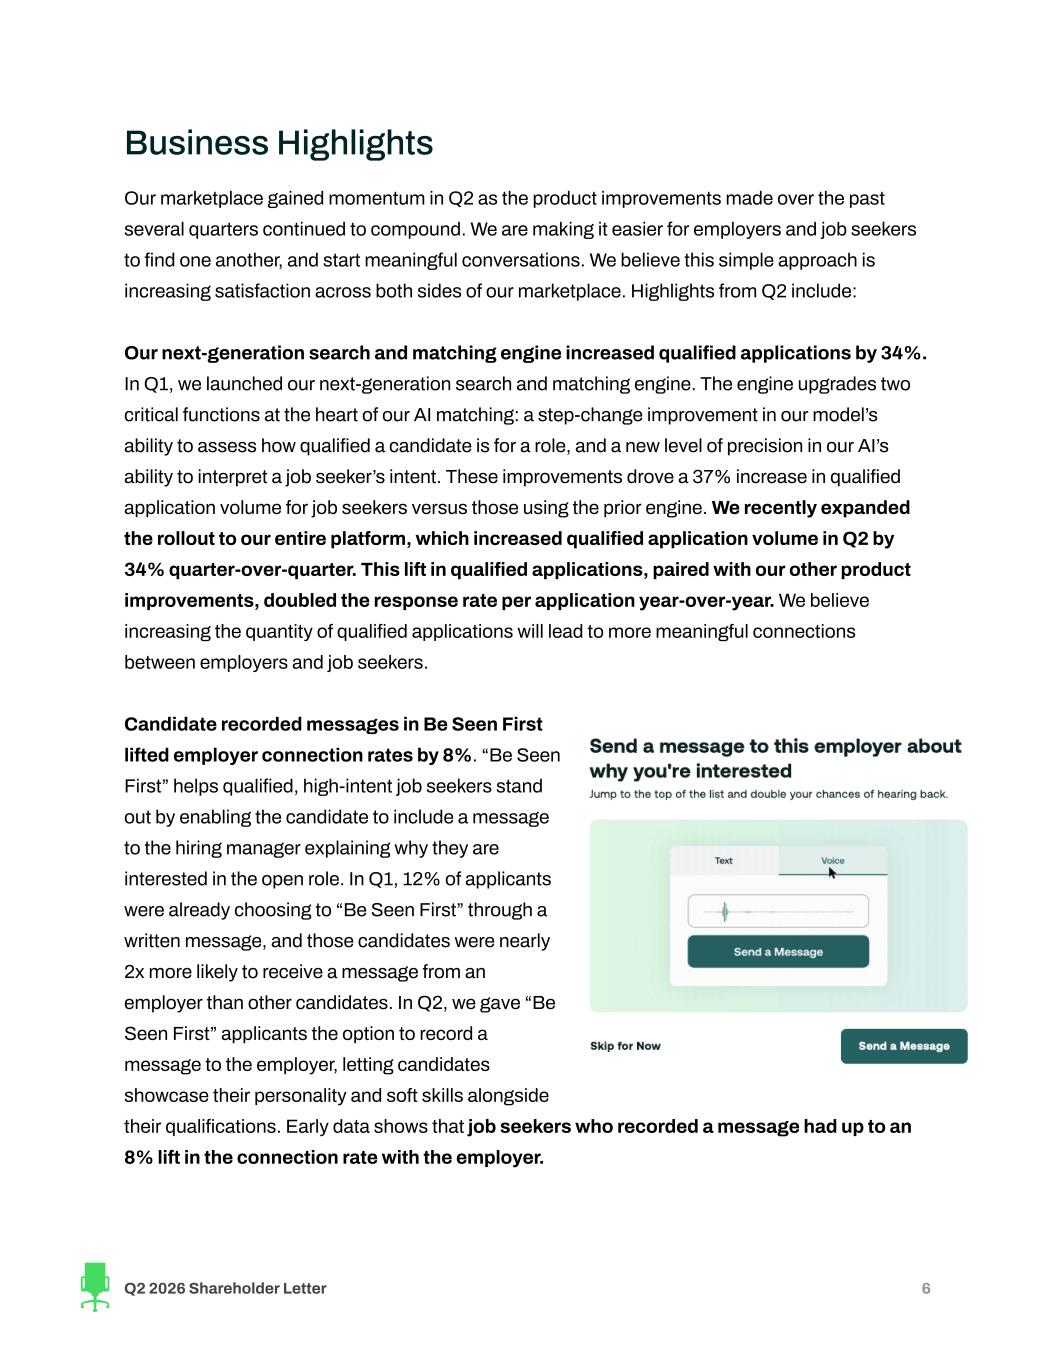
Business Highlights Our marketplace gained momentum in Q2 as the product improvements made over the past several quarters continued to compound. We are making it easier for employers and job seekers to find one another, and start meaningful conversations. We believe this simple approach is increasing satisfaction across both sides of our marketplace. Highlights from Q2 include: Our next-generation search and matching engine increased qualified applications by 34%. In Q1, we launched our next-generation search and matching engine. The engine upgrades two critical functions at the heart of our AI matching: a step-change improvement in our model’s ability to assess how qualified a candidate is for a role, and a new level of precision in our AI’s ability to interpret a job seeker’s intent. These improvements drove a 37% increase in qualified application volume for job seekers versus those using the prior engine. We recently expanded the rollout to our entire platform, which increased qualified application volume in Q2 by 34% quarter-over-quarter. This lift in qualified applications, paired with our other product improvements, doubled the response rate per application year-over-year. We believe increasing the quantity of qualified applications will lead to more meaningful connections between employers and job seekers. Candidate recorded messages in Be Seen First lifted employer connection rates by 8%. “Be Seen First” helps qualified, high-intent job seekers stand out by enabling the candidate to include a message to the hiring manager explaining why they are interested in the open role. In Q1, 12% of applicants were already choosing to “Be Seen First” through a written message, and those candidates were nearly 2x more likely to receive a message from an employer than other candidates. In Q2, we gave “Be Seen First” applicants the option to record a message to the employer, letting candidates showcase their personality and soft skills alongside their qualifications. Early data shows that job seekers who recorded a message had up to an 8% lift in the connection rate with the employer. Q2 2026 Shareholder Letter 6
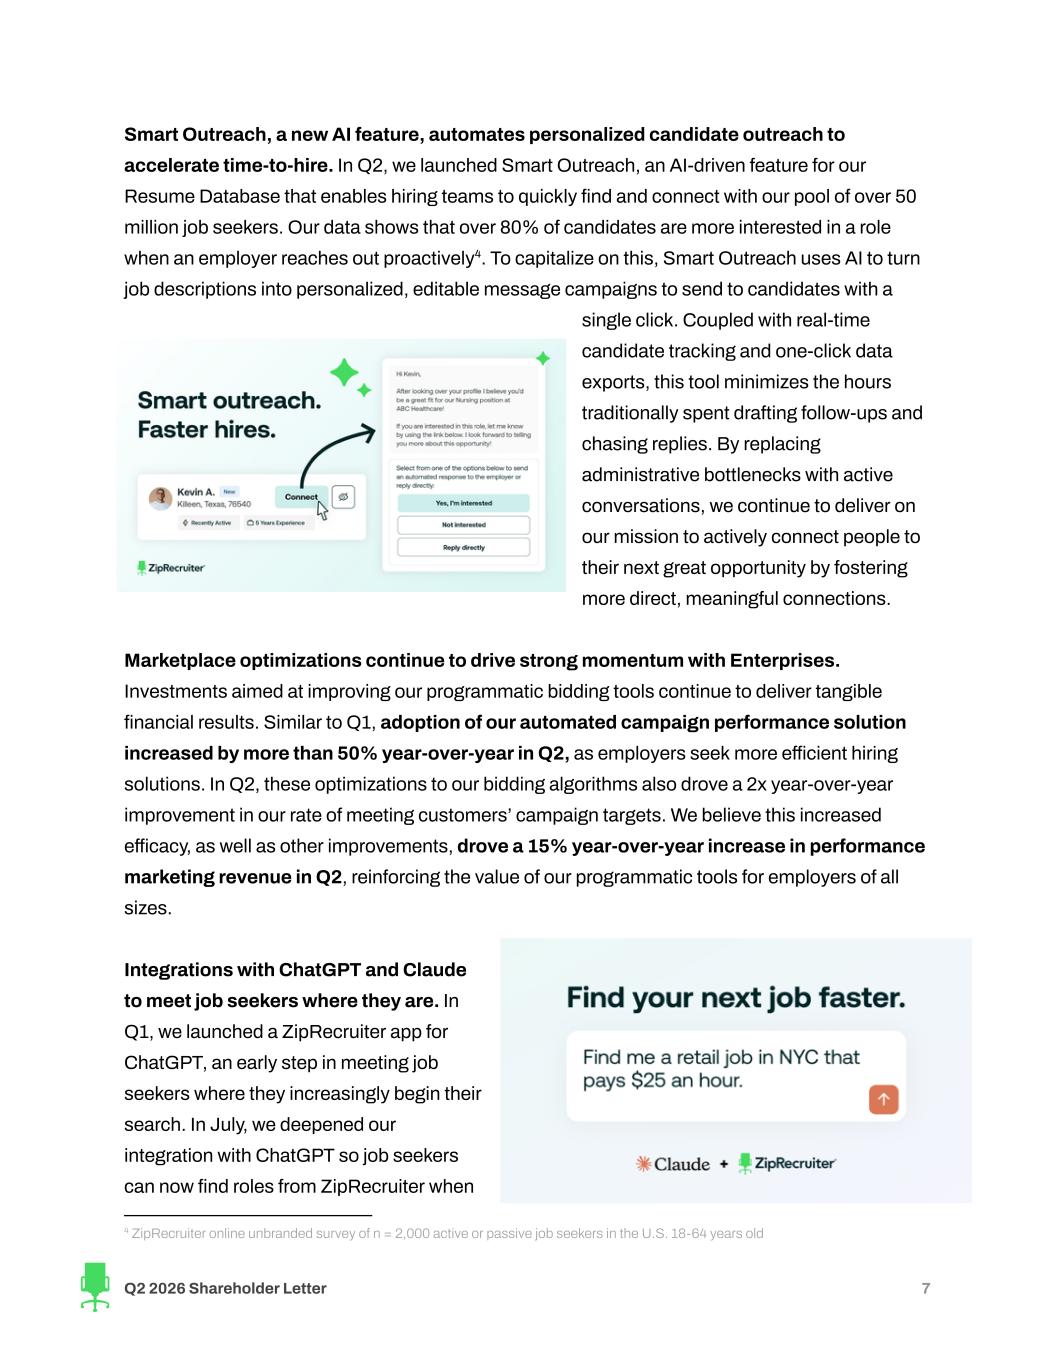
Smart Outreach, a new AI feature, automates personalized candidate outreach to accelerate time-to-hire. In Q2, we launched Smart Outreach, an AI-driven feature for our Resume Database that enables hiring teams to quickly find and connect with our pool of over 50 million job seekers. Our data shows that over 80% of candidates are more interested in a role when an employer reaches out proactively4. To capitalize on this, Smart Outreach uses AI to turn job descriptions into personalized, editable message campaigns to send to candidates with a single click. Coupled with real-time candidate tracking and one-click data exports, this tool minimizes the hours traditionally spent drafting follow-ups and chasing replies. By replacing administrative bottlenecks with active conversations, we continue to deliver on our mission to actively connect people to their next great opportunity by fostering more direct, meaningful connections. Marketplace optimizations continue to drive strong momentum with Enterprises. Investments aimed at improving our programmatic bidding tools continue to deliver tangible financial results. Similar to Q1, adoption of our automated campaign performance solution increased by more than 50% year-over-year in Q2, as employers seek more efficient hiring solutions. In Q2, these optimizations to our bidding algorithms also drove a 2x year-over-year improvement in our rate of meeting customers’ campaign targets. We believe this increased efficacy, as well as other improvements, drove a 15% year-over-year increase in performance marketing revenue in Q2, reinforcing the value of our programmatic tools for employers of all sizes. Integrations with ChatGPT and Claude to meet job seekers where they are. In Q1, we launched a ZipRecruiter app for ChatGPT, an early step in meeting job seekers where they increasingly begin their search. In July, we deepened our integration with ChatGPT so job seekers can now find roles from ZipRecruiter when 4 ZipRecruiter online unbranded survey of n = 2,000 active or passive job seekers in the U.S. 18-64 years old Q2 2026 Shareholder Letter 7
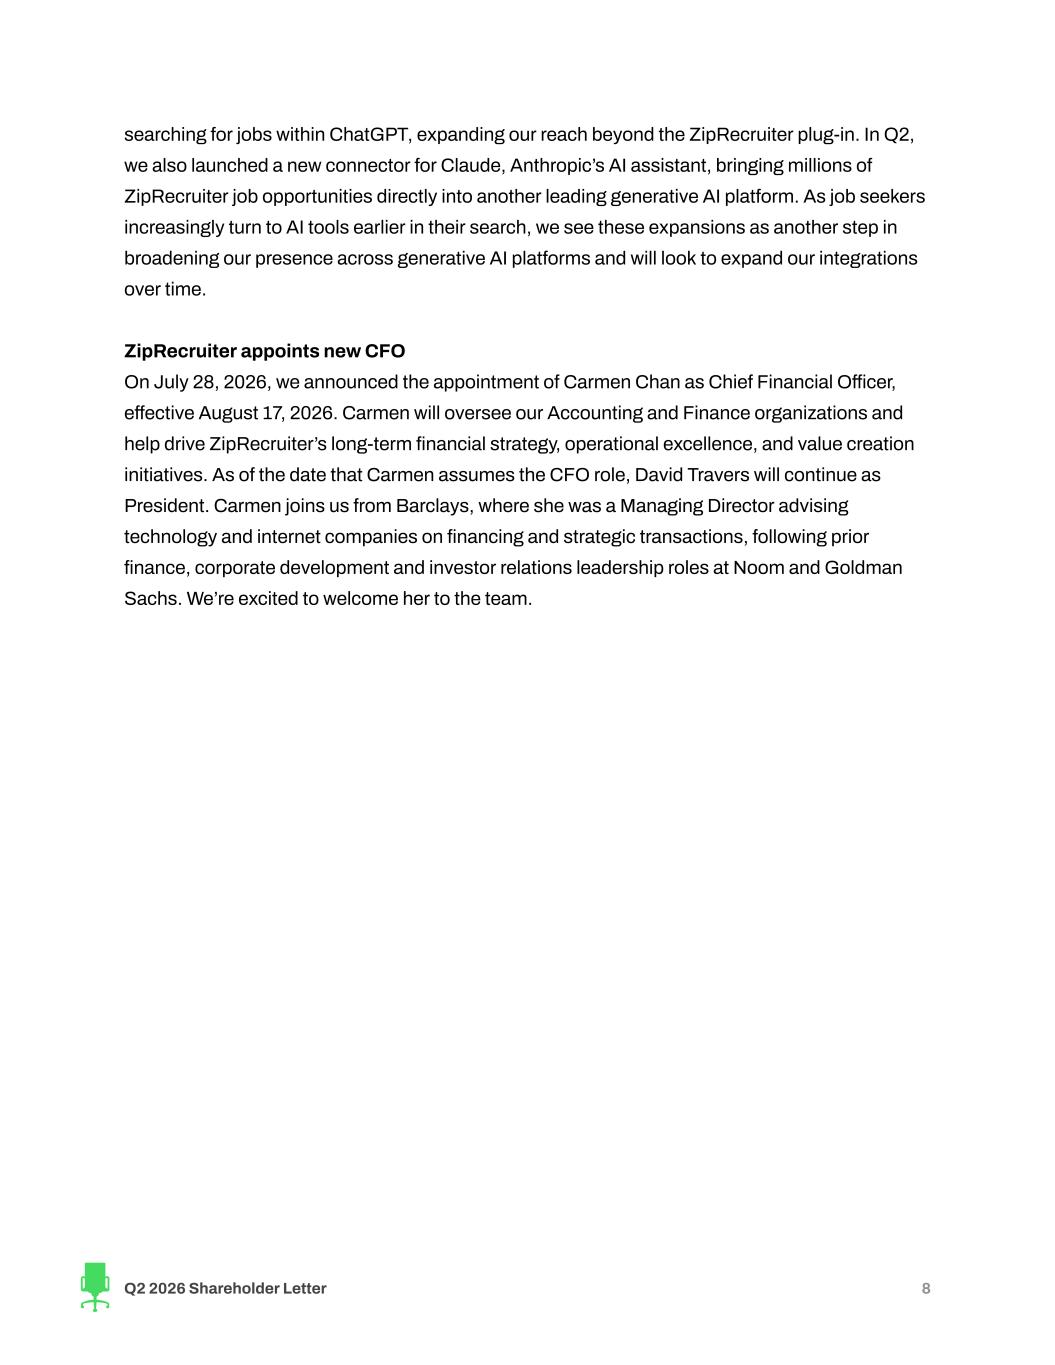
searching for jobs within ChatGPT, expanding our reach beyond the ZipRecruiter plug-in. In Q2, we also launched a new connector for Claude, Anthropic’s AI assistant, bringing millions of ZipRecruiter job opportunities directly into another leading generative AI platform. As job seekers increasingly turn to AI tools earlier in their search, we see these expansions as another step in broadening our presence across generative AI platforms and will look to expand our integrations over time. ZipRecruiter appoints new CFO On July 28, 2026, we announced the appointment of Carmen Chan as Chief Financial Officer, effective August 17, 2026. Carmen will oversee our Accounting and Finance organizations and help drive ZipRecruiter’s long-term financial strategy, operational excellence, and value creation initiatives. As of the date that Carmen assumes the CFO role, David Travers will continue as President. Carmen joins us from Barclays, where she was a Managing Director advising technology and internet companies on financing and strategic transactions, following prior finance, corporate development and investor relations leadership roles at Noom and Goldman Sachs. We’re excited to welcome her to the team. Q2 2026 Shareholder Letter 8
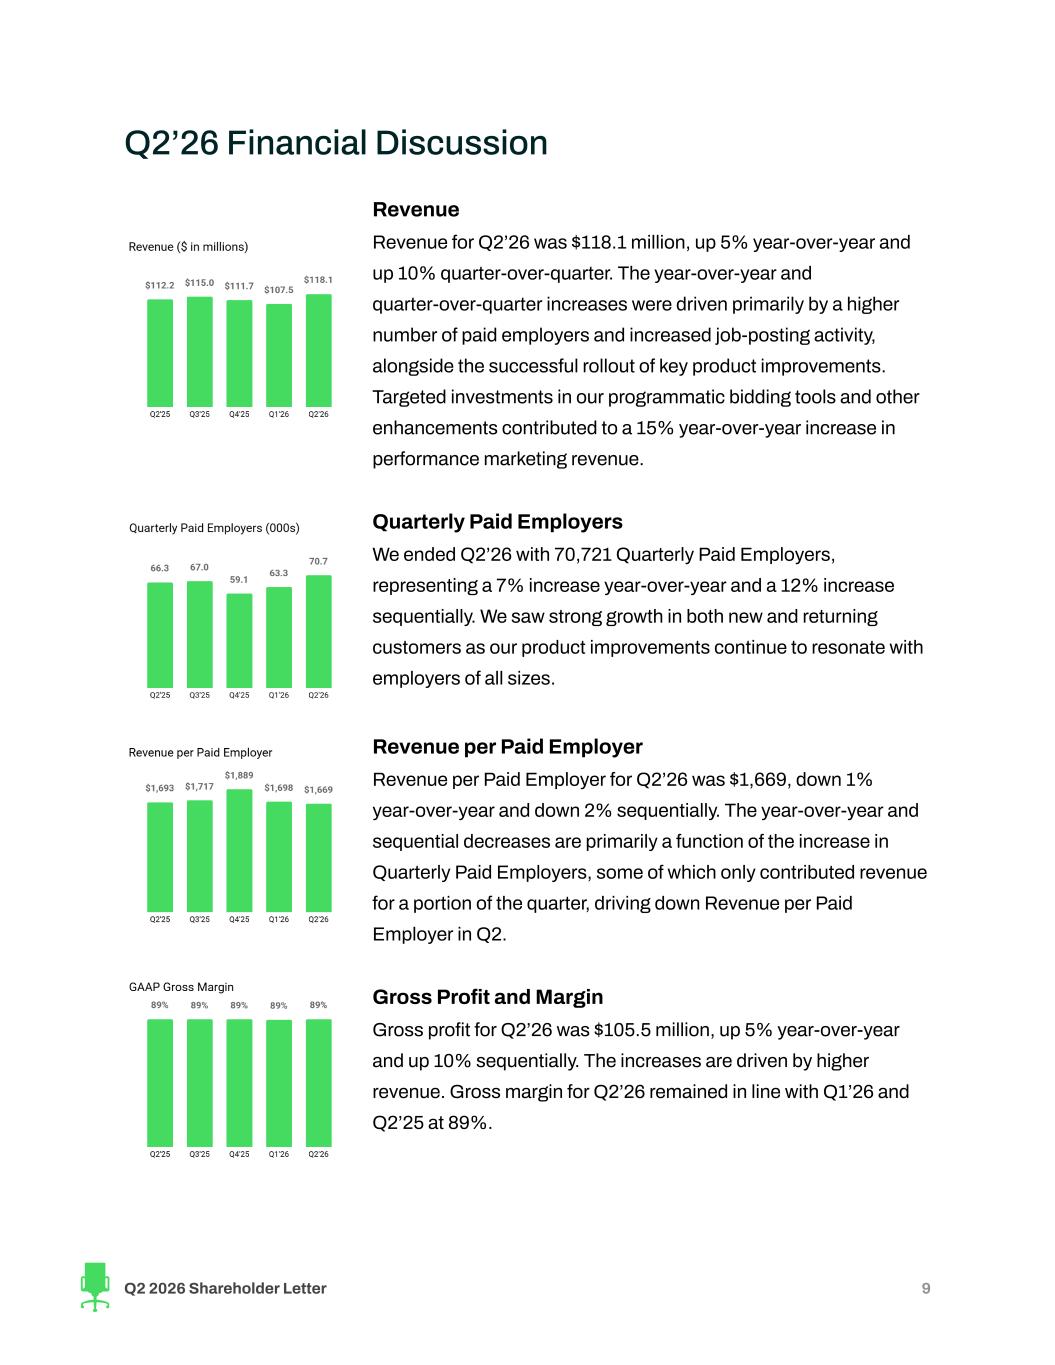
Q2’26 Financial Discussion Revenue Revenue for Q2’26 was $118.1 million, up 5% year-over-year and up 10% quarter-over-quarter. The year-over-year and quarter-over-quarter increases were driven primarily by a higher number of paid employers and increased job-posting activity, alongside the successful rollout of key product improvements. Targeted investments in our programmatic bidding tools and other enhancements contributed to a 15% year-over-year increase in performance marketing revenue. Quarterly Paid Employers We ended Q2’26 with 70,721 Quarterly Paid Employers, representing a 7% increase year-over-year and a 12% increase sequentially. We saw strong growth in both new and returning customers as our product improvements continue to resonate with employers of all sizes. Revenue per Paid Employer Revenue per Paid Employer for Q2’26 was $1,669, down 1% year-over-year and down 2% sequentially. The year-over-year and sequential decreases are primarily a function of the increase in Quarterly Paid Employers, some of which only contributed revenue for a portion of the quarter, driving down Revenue per Paid Employer in Q2. Gross Profit and Margin Gross profit for Q2’26 was $105.5 million, up 5% year-over-year and up 10% sequentially. The increases are driven by higher revenue. Gross margin for Q2’26 remained in line with Q1’26 and Q2’25 at 89%. Q2 2026 Shareholder Letter 9
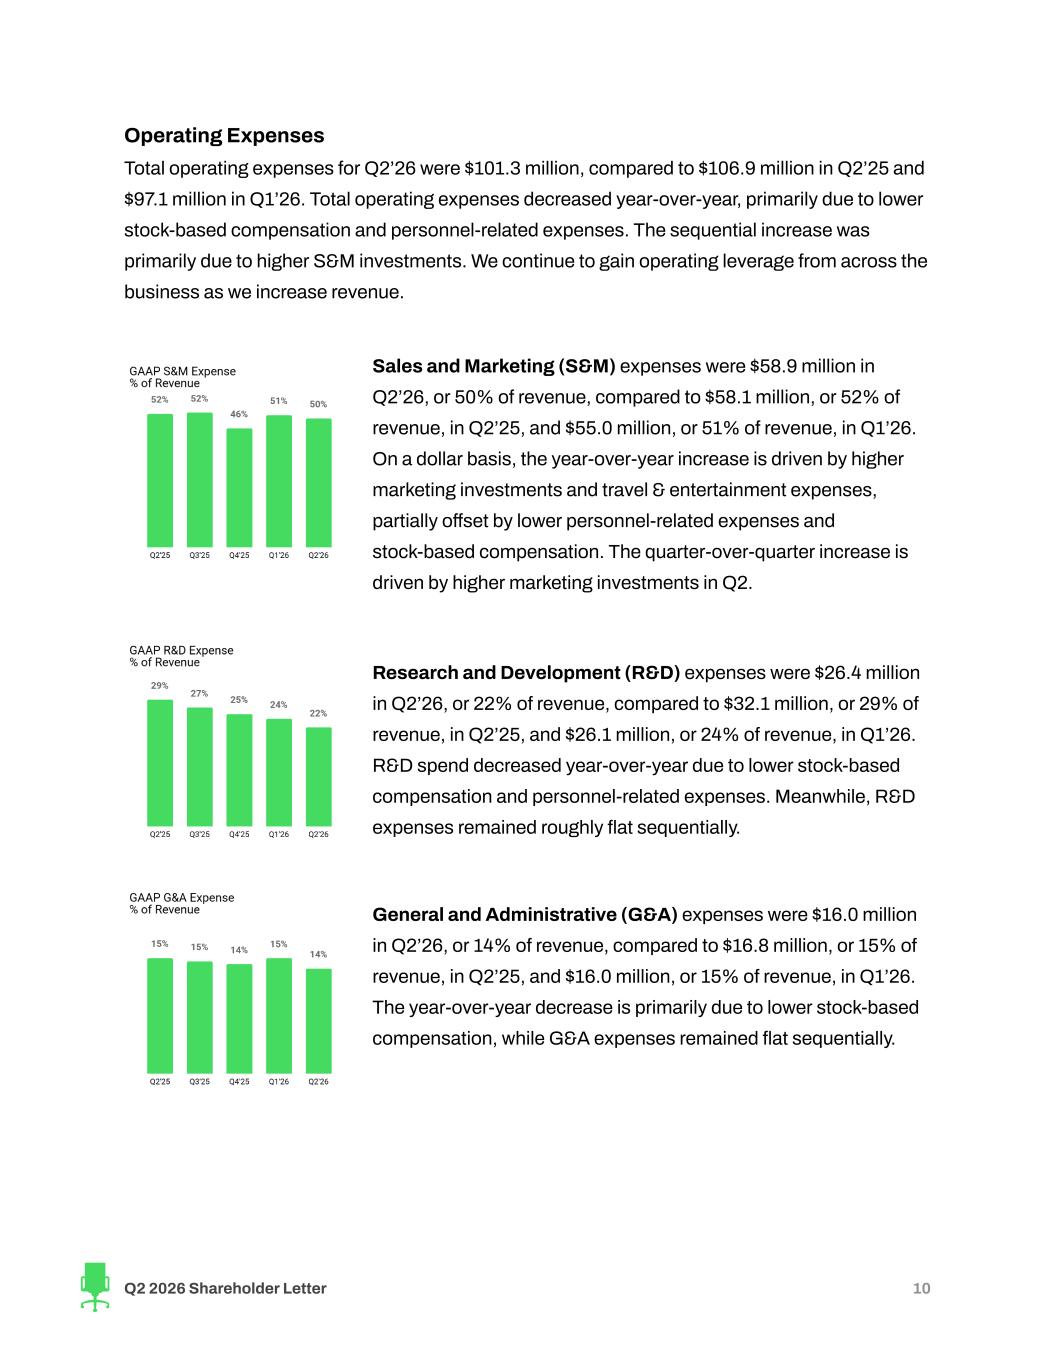
Operating Expenses Total operating expenses for Q2’26 were $101.3 million, compared to $106.9 million in Q2’25 and $97.1 million in Q1’26. Total operating expenses decreased year-over-year, primarily due to lower stock-based compensation and personnel-related expenses. The sequential increase was primarily due to higher S&M investments. We continue to gain operating leverage from across the business as we increase revenue. Sales and Marketing (S&M) expenses were $58.9 million in Q2’26, or 50% of revenue, compared to $58.1 million, or 52% of revenue, in Q2’25, and $55.0 million, or 51% of revenue, in Q1’26. On a dollar basis, the year-over-year increase is driven by higher marketing investments and travel & entertainment expenses, partially offset by lower personnel-related expenses and stock-based compensation. The quarter-over-quarter increase is driven by higher marketing investments in Q2. Research and Development (R&D) expenses were $26.4 million in Q2’26, or 22% of revenue, compared to $32.1 million, or 29% of revenue, in Q2’25, and $26.1 million, or 24% of revenue, in Q1’26. R&D spend decreased year-over-year due to lower stock-based compensation and personnel-related expenses. Meanwhile, R&D expenses remained roughly flat sequentially. General and Administrative (G&A) expenses were $16.0 million in Q2’26, or 14% of revenue, compared to $16.8 million, or 15% of revenue, in Q2’25, and $16.0 million, or 15% of revenue, in Q1’26. The year-over-year decrease is primarily due to lower stock-based compensation, while G&A expenses remained flat sequentially. Q2 2026 Shareholder Letter 10
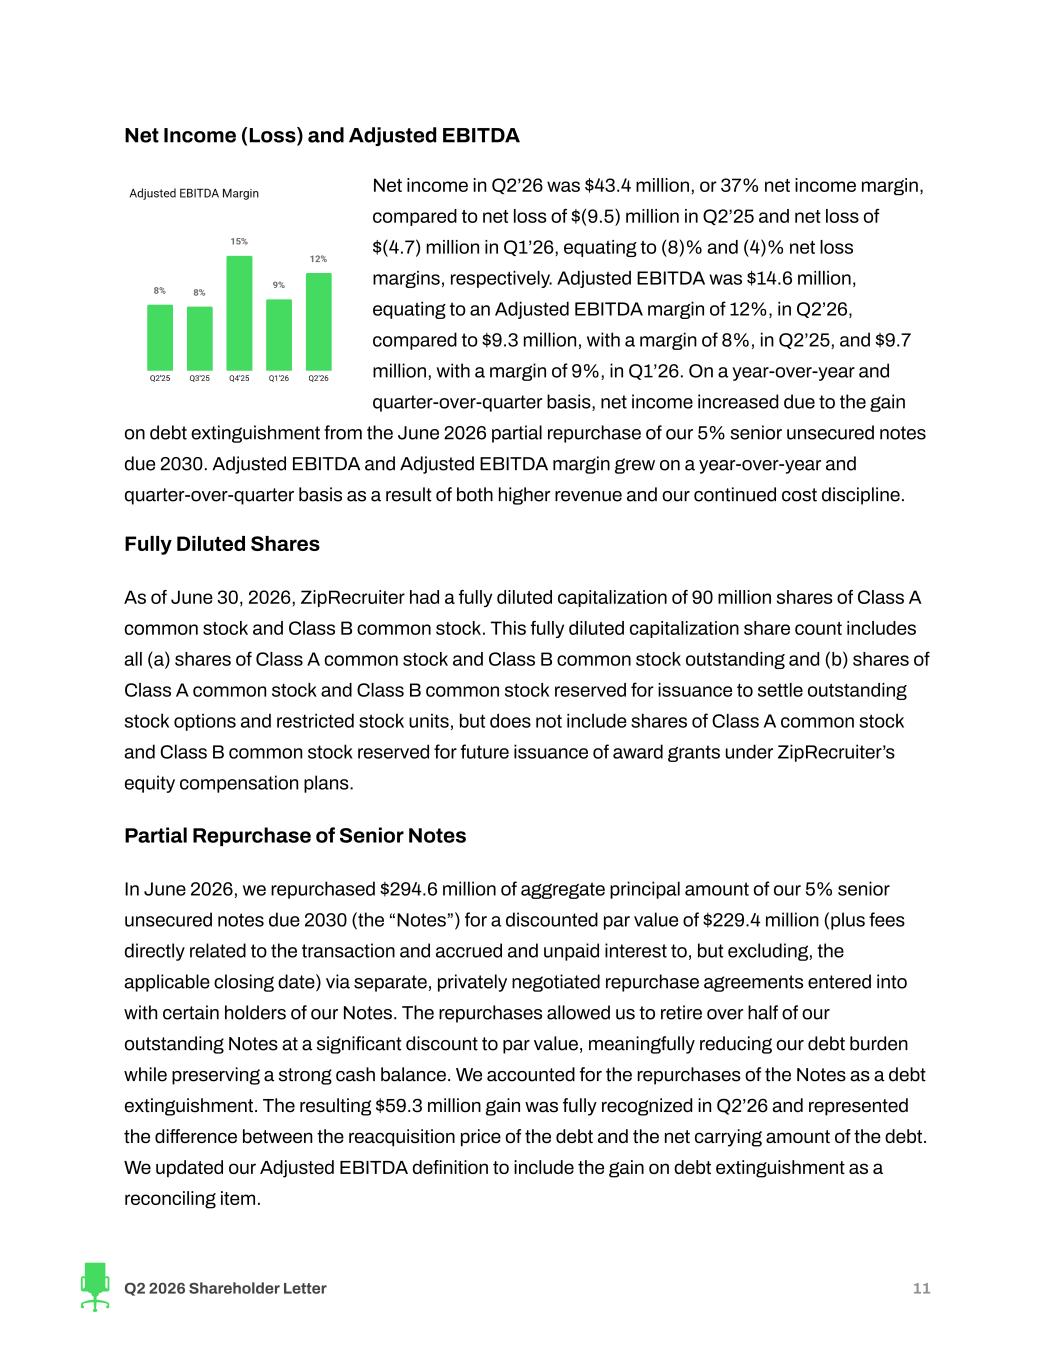
Net Income (Loss) and Adjusted EBITDA Net income in Q2’26 was $43.4 million, or 37% net income margin, compared to net loss of $(9.5) million in Q2’25 and net loss of $(4.7) million in Q1’26, equating to (8)% and (4)% net loss margins, respectively. Adjusted EBITDA was $14.6 million, equating to an Adjusted EBITDA margin of 12%, in Q2’26, compared to $9.3 million, with a margin of 8%, in Q2’25, and $9.7 million, with a margin of 9%, in Q1’26. On a year-over-year and quarter-over-quarter basis, net income increased due to the gain on debt extinguishment from the June 2026 partial repurchase of our 5% senior unsecured notes due 2030. Adjusted EBITDA and Adjusted EBITDA margin grew on a year-over-year and quarter-over-quarter basis as a result of both higher revenue and our continued cost discipline. Fully Diluted Shares As of June 30, 2026, ZipRecruiter had a fully diluted capitalization of 90 million shares of Class A common stock and Class B common stock. This fully diluted capitalization share count includes all (a) shares of Class A common stock and Class B common stock outstanding and (b) shares of Class A common stock and Class B common stock reserved for issuance to settle outstanding stock options and restricted stock units, but does not include shares of Class A common stock and Class B common stock reserved for future issuance of award grants under ZipRecruiter’s equity compensation plans. Partial Repurchase of Senior Notes In June 2026, we repurchased $294.6 million of aggregate principal amount of our 5% senior unsecured notes due 2030 (the “Notes”) for a discounted par value of $229.4 million (plus fees directly related to the transaction and accrued and unpaid interest to, but excluding, the applicable closing date) via separate, privately negotiated repurchase agreements entered into with certain holders of our Notes. The repurchases allowed us to retire over half of our outstanding Notes at a significant discount to par value, meaningfully reducing our debt burden while preserving a strong cash balance. We accounted for the repurchases of the Notes as a debt extinguishment. The resulting $59.3 million gain was fully recognized in Q2’26 and represented the difference between the reacquisition price of the debt and the net carrying amount of the debt. We updated our Adjusted EBITDA definition to include the gain on debt extinguishment as a reconciling item. Q2 2026 Shareholder Letter 11
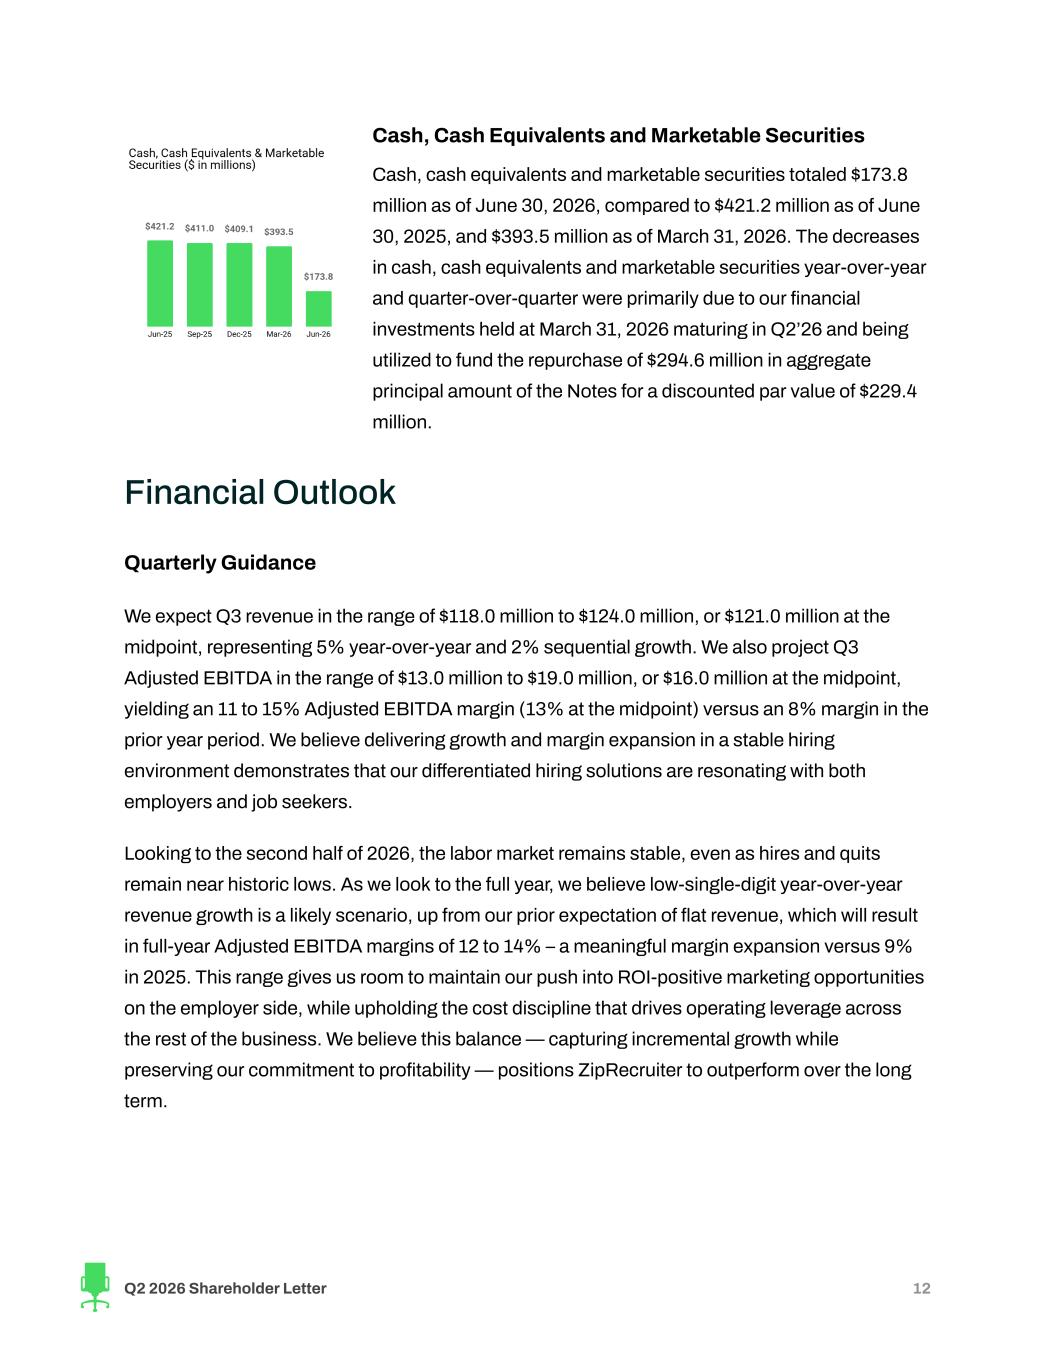
Cash, Cash Equivalents and Marketable Securities Cash, cash equivalents and marketable securities totaled $173.8 million as of June 30, 2026, compared to $421.2 million as of June 30, 2025, and $393.5 million as of March 31, 2026. The decreases in cash, cash equivalents and marketable securities year-over-year and quarter-over-quarter were primarily due to our financial investments held at March 31, 2026 maturing in Q2’26 and being utilized to fund the repurchase of $294.6 million in aggregate principal amount of the Notes for a discounted par value of $229.4 million. Financial Outlook Quarterly Guidance We expect Q3 revenue in the range of $118.0 million to $124.0 million, or $121.0 million at the midpoint, representing 5% year-over-year and 2% sequential growth. We also project Q3 Adjusted EBITDA in the range of $13.0 million to $19.0 million, or $16.0 million at the midpoint, yielding an 11 to 15% Adjusted EBITDA margin (13% at the midpoint) versus an 8% margin in the prior year period. We believe delivering growth and margin expansion in a stable hiring environment demonstrates that our differentiated hiring solutions are resonating with both employers and job seekers. Looking to the second half of 2026, the labor market remains stable, even as hires and quits remain near historic lows. As we look to the full year, we believe low-single-digit year-over-year revenue growth is a likely scenario, up from our prior expectation of flat revenue, which will result in full-year Adjusted EBITDA margins of 12 to 14% – a meaningful margin expansion versus 9% in 2025. This range gives us room to maintain our push into ROI-positive marketing opportunities on the employer side, while upholding the cost discipline that drives operating leverage across the rest of the business. We believe this balance — capturing incremental growth while preserving our commitment to profitability — positions ZipRecruiter to outperform over the long term. Q2 2026 Shareholder Letter 12
Forward-Looking Statements This shareholder letter contains forward-looking statements within the meaning of the Private Securities Litigation Reform Act of 1995. All statements contained in this shareholder letter that do not relate to matters of historical fact should be considered forward-looking statements, including, without limitation, statements regarding adoption of our AI-powered product enhancements accelerating and expected AI platform integrations; our market share; statements under the section titled “Financial Outlook”; statements regarding our financial performance showing signs of momentum and our expected financial performance and operational performance for the second half of 2026 and fiscal year 2026; statements regarding our expected future revenue growth, Adjusted EBITDA profitability and key strategies and investments; statements regarding the effects of seasonal trends on our results of operations; statements regarding the volume and acceleration of connections between job seekers and employers happening on ZipRecruiter; statements regarding improvements in the broader labor market; statements regarding our new products or product improvements, including, but not limited to, our next generation search and matching engine, our automated campaign optimization solution, our ZipRecruiter apps for Claude and ChatGPT, and Be Seen First and the use of artificial intelligence in our products, and the expected performance thereof; statements regarding the anticipated timing of Ms. Chan’s appointment as Chief Financial Officer and the effective date on which Mr. Travers will no longer serve as the company’s interim Chief Financial Officer, as well as statements that include the words “expect,” “intend,” “plan,” “believe,” “project,” “forecast,” “estimate,” “may,” “should,” “anticipate” and similar statements of a future or forward-looking nature. These forward-looking statements are based on management’s current expectations. These statements are neither promises nor guarantees, but involve known and unknown risks, uncertainties and other important factors that may cause actual results, performance or achievements to be materially different from any future results, performance or achievements expressed or implied by the forward-looking statements, including, but not limited to: our ability to attract and retain employers and job seekers; our ability to compete with well-established competitors and new entrants; our ability to achieve and/or maintain profitability; our ability to maintain, protect and enhance our brand and intellectual property; our dependence on macroeconomic factors, including potential unfavorable changes in U.S. trade or other policies, such as U.S. tariff policies, and the potential negative economic consequences thereof; our ability to maintain and improve the quality of our platform; our dependence on the interoperability of our platform with mobile operating systems that we do not control; our ability to successfully implement our business plan during a global economic downturn that may impact the demand for our services or have a material adverse impact on our and our business partners’ financial condition and results of operations; our ability and the ability of third parties to protect our users’ personal or other data from a security breach and to comply with laws and regulations relating to consumer data privacy and data protection; our ability to detect errors, defects or disruptions in our platform; our ability to comply with the terms of underlying licenses of open source software components on our platform; our ability to expand into markets outside the United States; our ability to achieve desired operating margins; our compliance with a wide variety of U.S. and international laws and regulations; our reliance on Amazon Web Services; our ability to mitigate payment and fraud risks; our dependence on our senior management and our ability to attract and retain new talent; and the other important risk factors more fully discussed and described in documents we have filed with the Securities and Exchange Commission (“SEC”), including our Annual Report on Form 10-K for the year ended December 31, 2025 and our Quarterly Report on Form 10-Q for the quarter ended March 31, 2026 that we filed with the SEC and our Quarterly Report on Form 10-Q for the quarter ended June 30, 2026 that we will file with the SEC. In addition, we operate in a very competitive and rapidly changing environment. New risks emerge from time to time. It is not possible for our management to predict all risks, nor can we assess the impact of all factors on our business or the extent to which any factor, or combination of factors, may cause actual results to differ materially from those contained in any forward-looking statements that we may make. In light of these risks, uncertainties and assumptions, the forward-looking events and circumstances discussed in this release are inherently uncertain and may not occur, and actual results could differ materially and adversely from those anticipated or implied in the forward-looking statements. Accordingly, you should not rely upon forward-looking statements as predictions of future events. In addition, the forward-looking statements made in this shareholder letter relate only to events or information as of the date on which the statements are made in this letter. Except as required by law, we undertake no obligation to update or revise publicly any Q2 2026 Shareholder Letter 13

forward-looking statements, whether as a result of new information, future events or otherwise, after the date on which the statements are made or to reflect the occurrence of unanticipated events. Q2 2026 Shareholder Letter 14
Conference Call Details We will host a conference call to discuss our financial results on Wednesday, August 5, 2026, at 2:00 p.m. Pacific Time. A live webcast of the call can be accessed from ZipRecruiter’s Investor Relations website. An archived version will be available on the website two hours after the call. Investors and analysts can participate in the conference call by dialing +1 (833) 461-5787 or +1 (585) 542-9983 for callers outside the United States, and using the conference ID 795476829. Q2 2026 Shareholder Letter 15
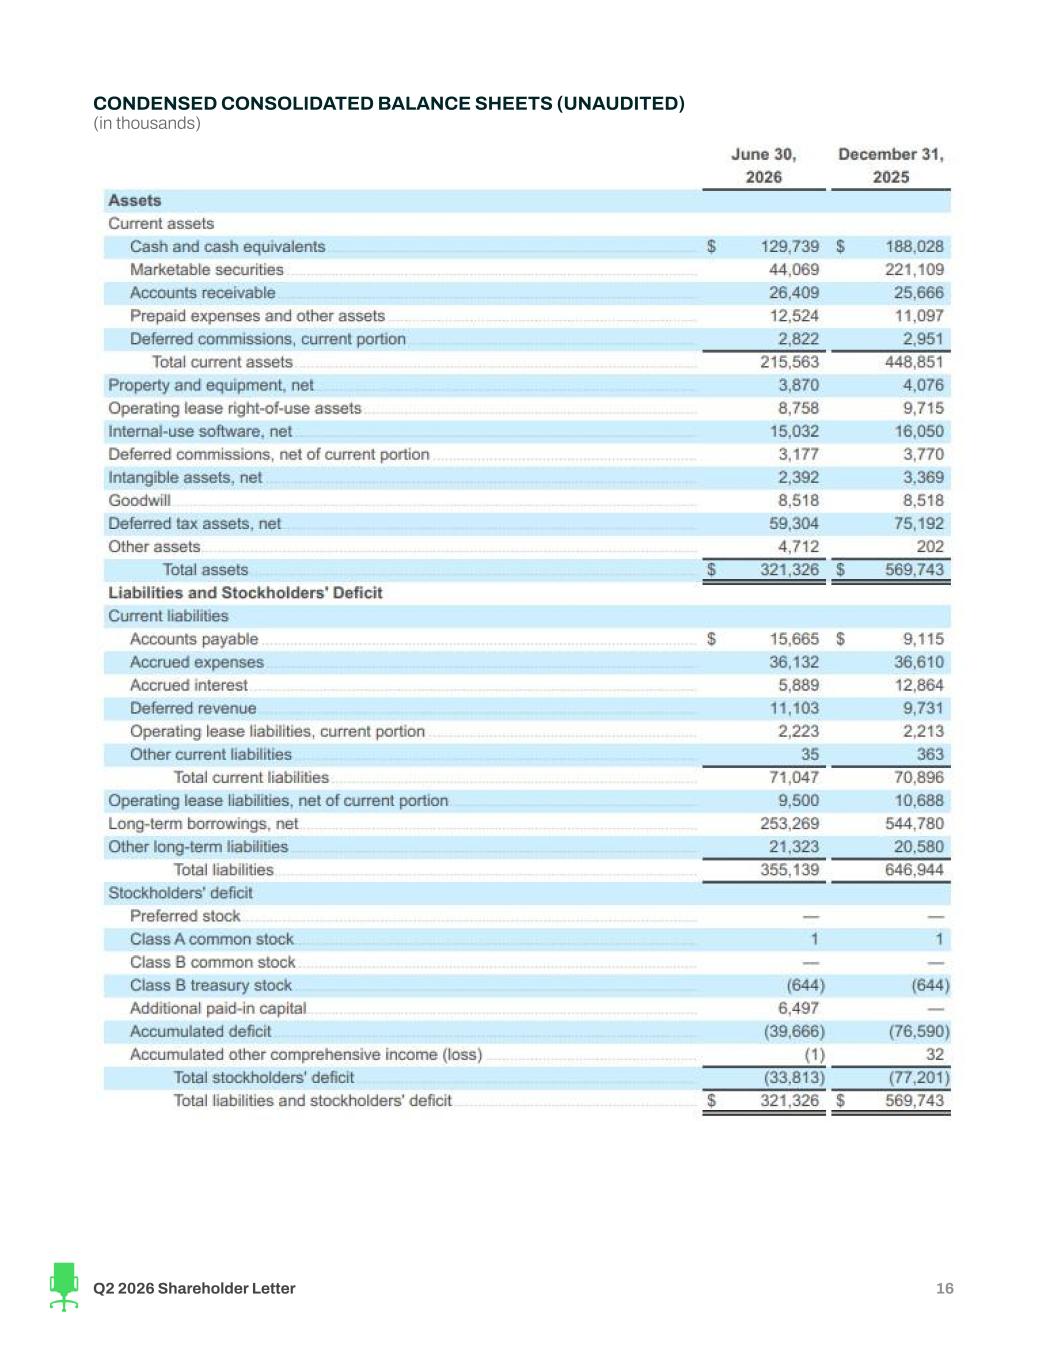
CONDENSED CONSOLIDATED BALANCE SHEETS (UNAUDITED) (in thousands) Q2 2026 Shareholder Letter 16
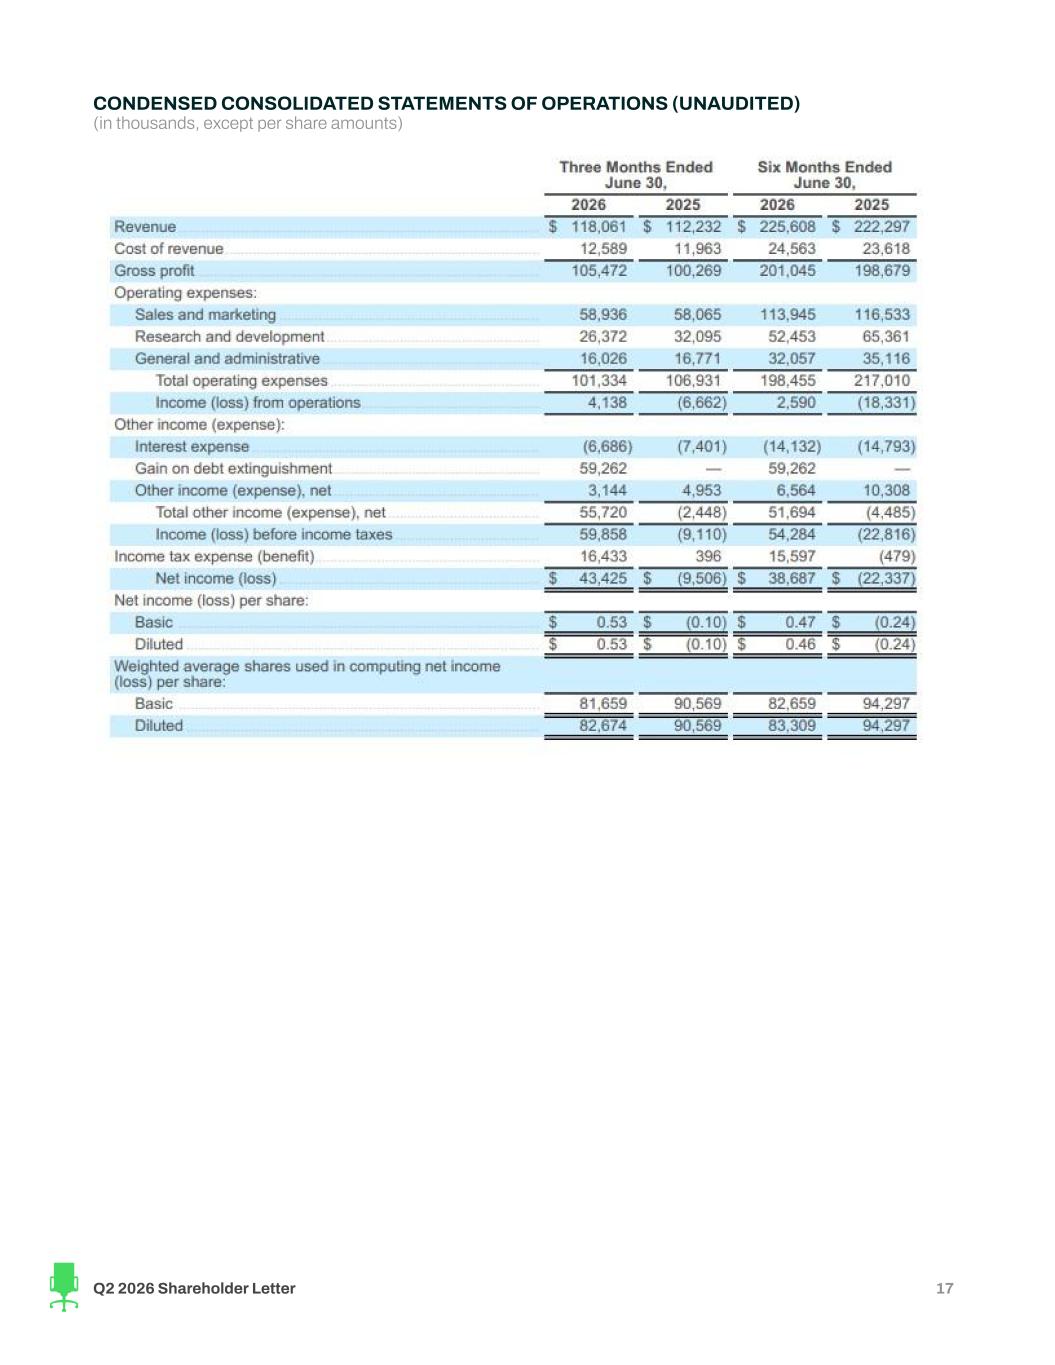
CONDENSED CONSOLIDATED STATEMENTS OF OPERATIONS (UNAUDITED) (in thousands, except per share amounts) Q2 2026 Shareholder Letter 17
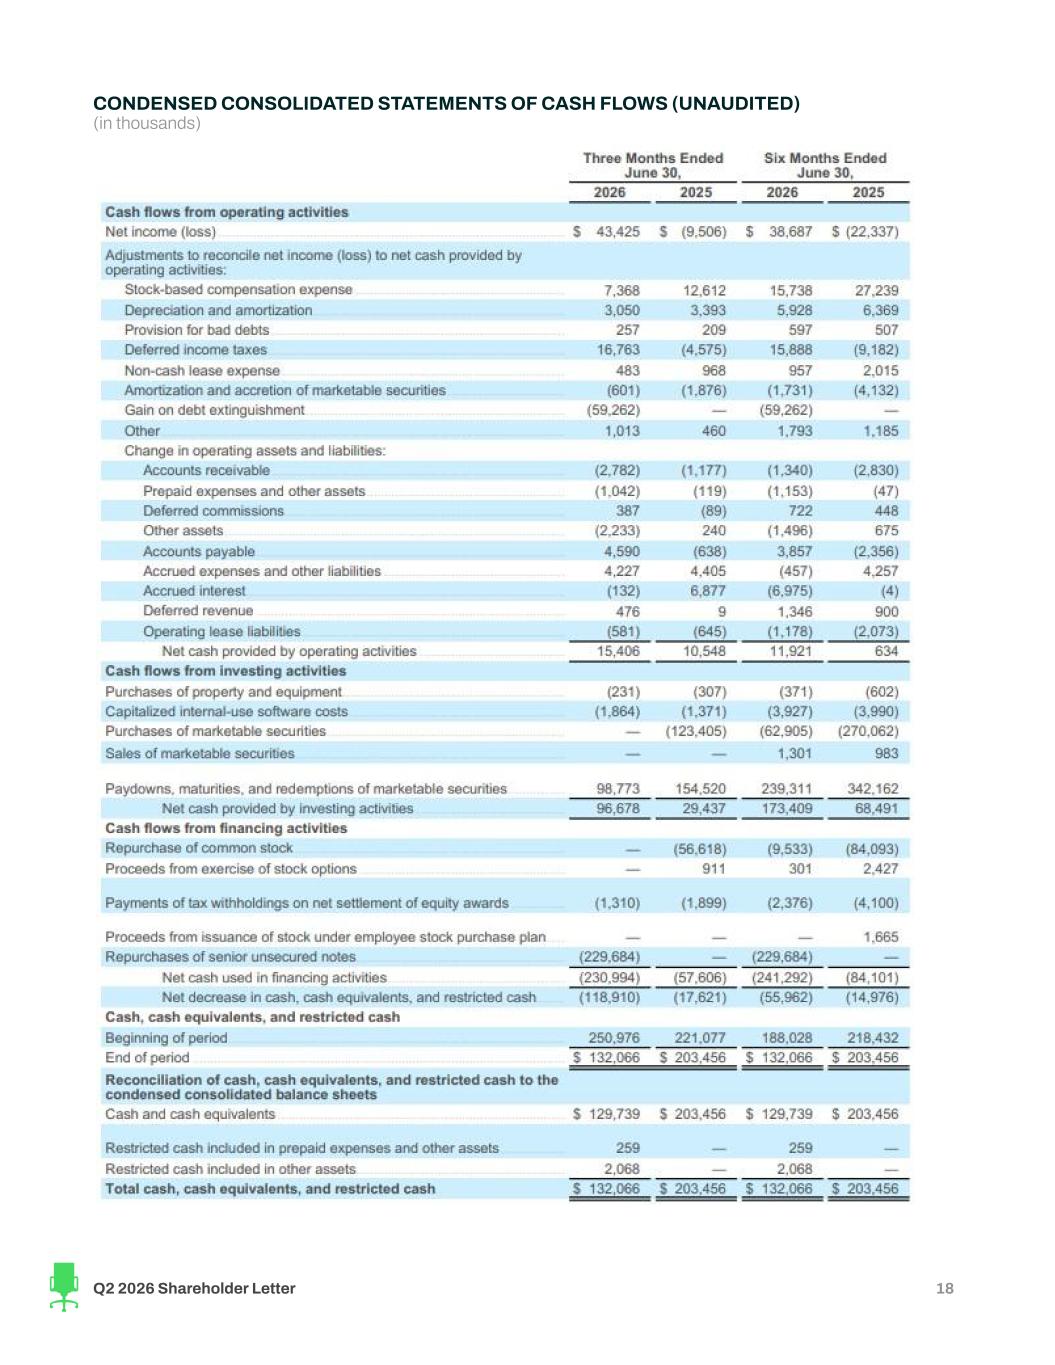
CONDENSED CONSOLIDATED STATEMENTS OF CASH FLOWS (UNAUDITED) (in thousands) Q2 2026 Shareholder Letter 18
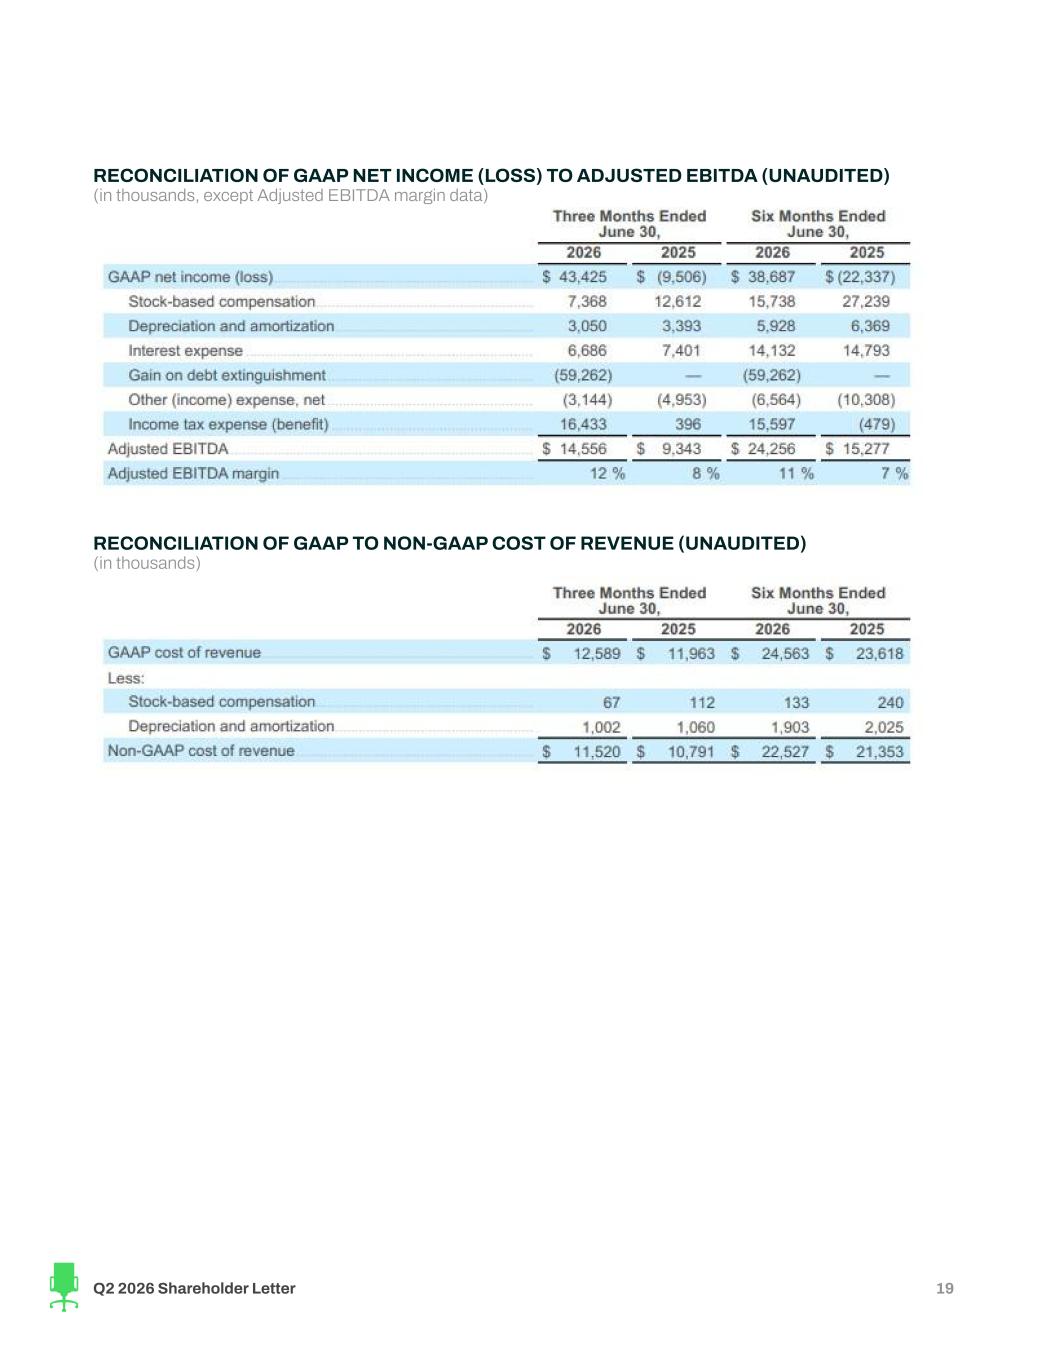
RECONCILIATION OF GAAP NET INCOME (LOSS) TO ADJUSTED EBITDA (UNAUDITED) (in thousands, except Adjusted EBITDA margin data) RECONCILIATION OF GAAP TO NON-GAAP COST OF REVENUE (UNAUDITED) (in thousands) Q2 2026 Shareholder Letter 19
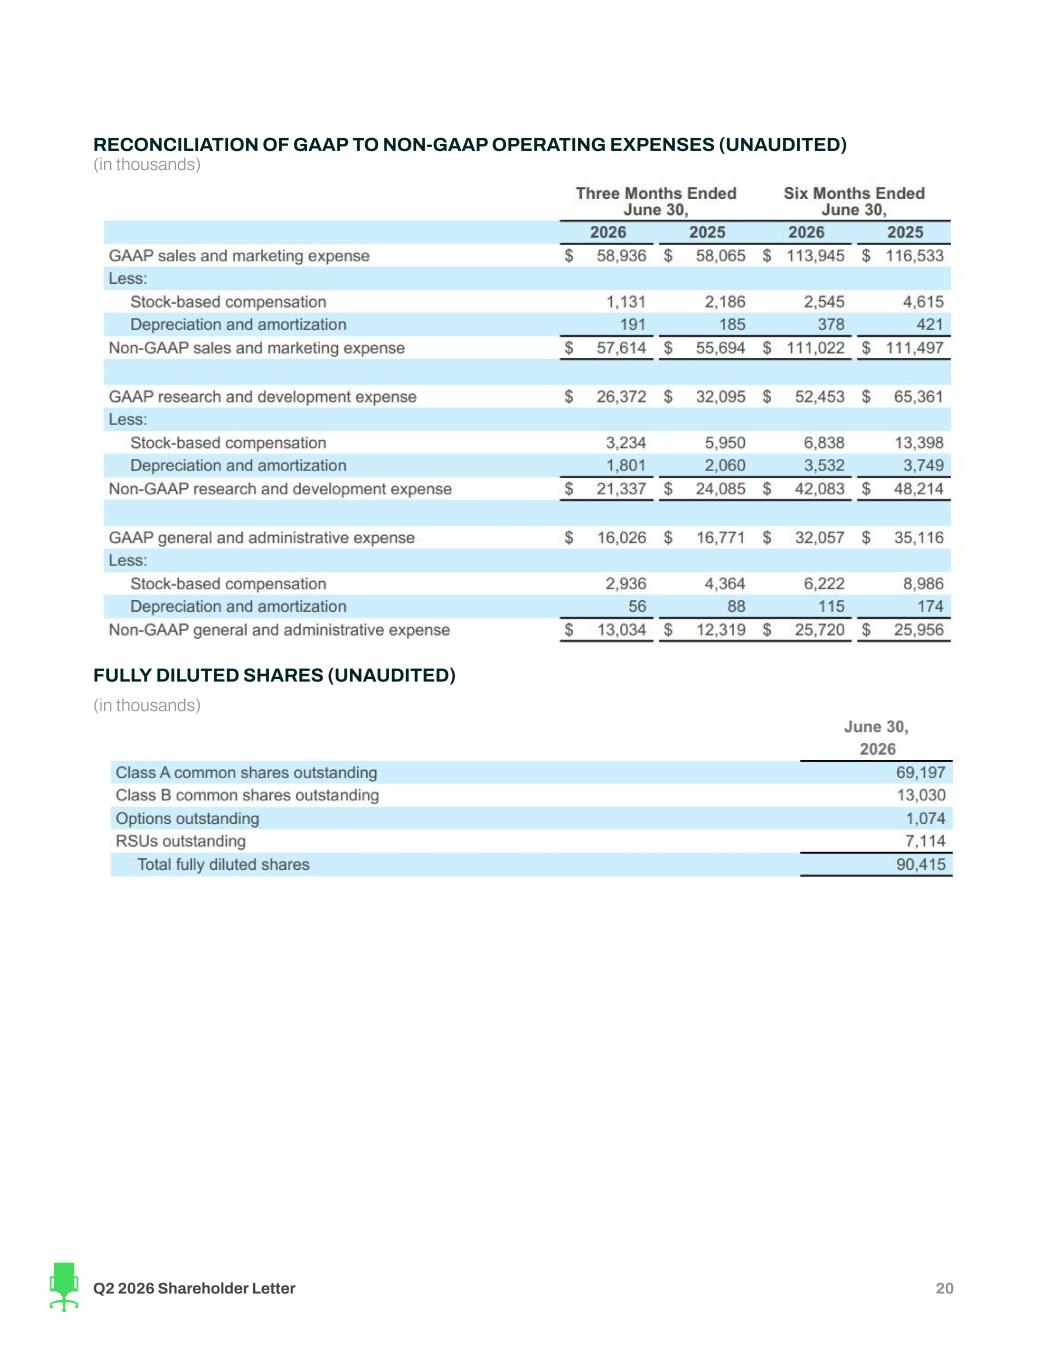
RECONCILIATION OF GAAP TO NON-GAAP OPERATING EXPENSES (UNAUDITED) (in thousands) FULLY DILUTED SHARES (UNAUDITED) (in thousands) Q2 2026 Shareholder Letter 20
Key Operating Metrics and Non-GAAP Financial Measures This shareholder letter includes certain key operating metrics, including Quarterly Paid Employers and Revenue per Paid Employer, and non-GAAP financial measures, including Non-GAAP cost of revenue, Non-GAAP operating expenses, Adjusted EBITDA and Adjusted EBITDA margin. We define Paid Employers as any actively recruiting employer(s) (or entities acting on behalf of an employer) on a paying subscription plan or performance marketing campaign for at least one day. Paid Employer(s) excludes employers from our Job Distribution Partners or other indirect channels, employers who are not actively recruiting, and employers on free trial. Job Distribution Partners are defined as third-party sites who have a relationship with us and advertise jobs from our marketplace. Quarterly Paid Employers means, with respect to any fiscal quarter, the count of Paid Employers during such fiscal quarter. Revenue per Paid Employer is the total company revenue in a particular period divided by the count of Quarterly Paid Employers in the same period. We define Non-GAAP cost of revenue as our cost of revenue before stock-based compensation expense, and depreciation and amortization. We define Non-GAAP operating expenses as our operating expenses before stock-based compensation expense, and depreciation and amortization. We define Adjusted EBITDA as our net income (loss) before interest expense, gain on debt extinguishment, other (income) expense, net, income tax expense (benefit) and depreciation and amortization, adjusted to eliminate stock-based compensation expense. Adjusted EBITDA margin represents Adjusted EBITDA as a percentage of revenue for the same period. Management and our board of directors use these key operating metrics and non-GAAP financial measures as supplemental measures of our performance because they assist us in comparing our operating performance on a consistent basis, as they remove the impact of some items not directly resulting from our core operations. We also use these key operating metrics and non-GAAP financial measures for planning purposes, including the preparation of our internal annual operating budget and financial projections, to evaluate the performance and effectiveness of our strategic initiatives and to evaluate our capacity for capital expenditures to expand our business. Non-GAAP cost of revenue, Non-GAAP operating expenses, Adjusted EBITDA and Adjusted EBITDA margin should not be considered in isolation, as an alternative to, or superior to net income (loss), revenue, cash flows or other measures derived in accordance with GAAP. These non-GAAP measures are frequently used by analysts, investors and other interested parties to evaluate companies in our industry. Management believes that the presentation of non-GAAP financial measures is an appropriate measure of operating performance because they eliminate the impact of some expenses that do not relate directly to the performance of our underlying business. These non-GAAP financial measures should not be construed as an inference that our future results will be unaffected by unusual or other items. Additionally, Adjusted EBITDA and Adjusted EBITDA margin are not intended to be a measure of free cash flow for management’s discretionary use, as they do not reflect our tax payments and certain other cash costs that may recur in the future, including, among other things, cash requirements for costs to replace assets being depreciated and amortized including our capitalized internal use software. Management compensates for these limitations by relying on our GAAP results in addition to using Adjusted EBITDA and Adjusted EBITDA margin as supplemental measures of our performance. Our measures of Adjusted EBITDA and Adjusted EBITDA margin used herein are not necessarily comparable to similarly titled captions of other companies due to different methods of calculation. We are not able to provide a reconciliation of forward-looking Adjusted EBITDA and Adjusted EBITDA margin for Q3’26 or the full fiscal year 2026 to net income (loss) and net income (loss) margin, the comparable GAAP measures, respectively, because certain items that are excluded from non-GAAP financial measures cannot be reasonably predicted or are not in our control. In particular, we are unable to forecast the timing or magnitude of stock-based compensation or amortization of internal-use software, as applicable, without unreasonable efforts, and these items could significantly impact, either individually or in the aggregate, GAAP measures in the future. See the tables above regarding reconciliations of these non-GAAP financial measures to the most directly comparable GAAP measures. Q2 2026 Shareholder Letter 21