
August 5, 2026 Q2 2026 Earnings
Safe Harbor Statement Under the Private Securities Litigation Reform Act of 1995 This presentation contains "forward-looking statements" about Expedia Group’s financial performance, operating results, and guidance, which may include, but are not limited to, statements relating to future gross bookings; revenues; expenses; margins and margin expansion, including adjusted EBITDA margin expansion; profitability; net income (loss); earnings per share; and other measures of results of operations and the prospects for future growth of Expedia Group's business. These forward-looking statements are based on assumptions that are inherently subject to uncertainties, risks and changes in circumstances that are difficult to predict. Actual results may differ materially from the results predicted and reported results should not be considered as an indication of future performance. The potential risks and uncertainties that could cause actual results to differ from the results predicted include, among others: intense competition from online travel agencies, suppliers, search engines, B2B businesses offering competing travel technology solutions and services, and emerging AI- powered platforms; declines or disruptions in the travel industry from economic conditions, geopolitical events, or public health issues; dependence on relationships with travel suppliers and other B2B partners; liquidity constraints and limited access to capital markets; substantial indebtedness and covenant restrictions; dependence on search engines and changes to search algorithms or traffic acquisition costs; costs of maintaining brand awareness and marketing effectiveness; payment processing risks, fraud, and third-party payment provider dependencies; reliance on third-party business partners and service providers; challenges in international operations and regulatory compliance; risks from acquisitions, investments, divestitures, and commercial arrangements; ability to retain and attract qualified personnel and key executives; execution risks from strategic initiatives and operational transformations; counterparty risks and foreign exchange exposure; regulatory risks in alternative accommodations and evolving legal requirements; tax law changes and interpretation uncertainties; litigation and unfavorable legal outcomes; intellectual property protection and infringement risks; technology system failures, cybersecurity breaches, and data protection compliance; privacy regulation compliance across multiple jurisdictions; concentrated voting control and potential conflicts of interest; ESG-related costs, risks, and stakeholder expectations; climate change impacts on travel and operations; and stock price volatility. For more information about risks and uncertainties associated with Expedia Group's business, please refer to the "Management's Discussion and Analysis of Financial Condition and Results of Operations" and "Risk Factors" sections of our most recently filed periodic reports on Form 10-K and Form 10-Q, which are available on our investor relations website at ir.expediagroup.com and on the SEC website at www.sec.gov. All information provided in this presentation is as of August 5, 2026. We undertake no duty to update any forward-looking statement to conform the statement to actual results or changes in Expedia Group's expectations unless required by law. Non-GAAP Measures This presentation includes certain non- GAAP measures. Reconciliations of the measures to the nearest comparable GAAP measures are included in the appendix at the end of this presentation. Trademarks & logos Trademarks and logos are the property of their respective owners. © 2026 Expedia, Inc. All rights reserved. Notes and Definitions Please also refer to the appendix for an explanation of certain terms used in this presentation. 2A u g u s t 5 , 2 0 2 6
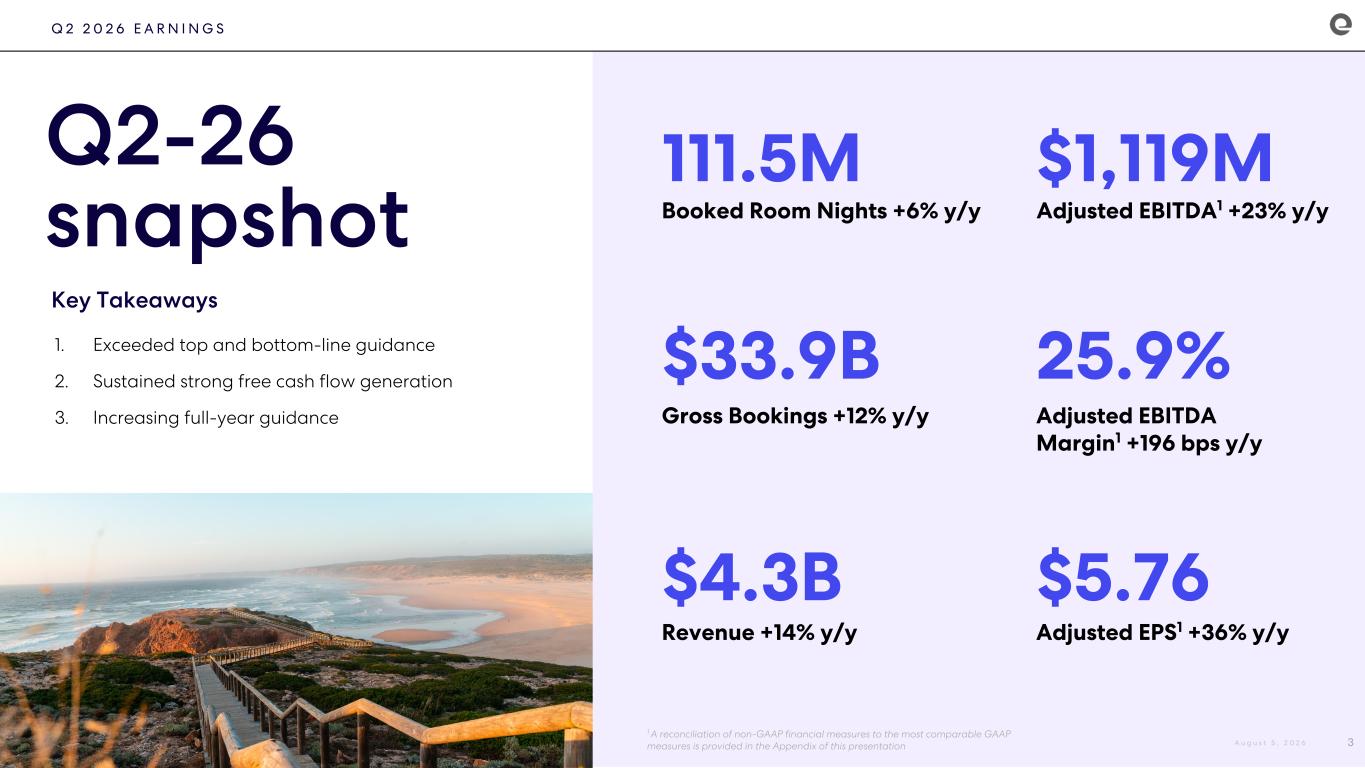
Booked Room Nights +6% y/y 111.5M $4.3B $33.9B Q 2 2 0 2 6 E A R N I N G S 1 A reconciliation of non-GAAP financial measures to the most comparable GAAP measures is provided in the Appendix of this presentation Gross Bookings +12% y/y Revenue +14% y/y Adjusted EBITDA1 +23% y/y $1,119M $5.76 25.9% Adjusted EBITDA Margin1 +196 bps y/y Adjusted EPS1 +36% y/y Q2-26 snapshot Key Takeaways 3 1. Exceeded top and bottom-line guidance 2. Sustained strong free cash flow generation 3. Increasing full-year guidance A u g u s t 5 , 2 0 2 6
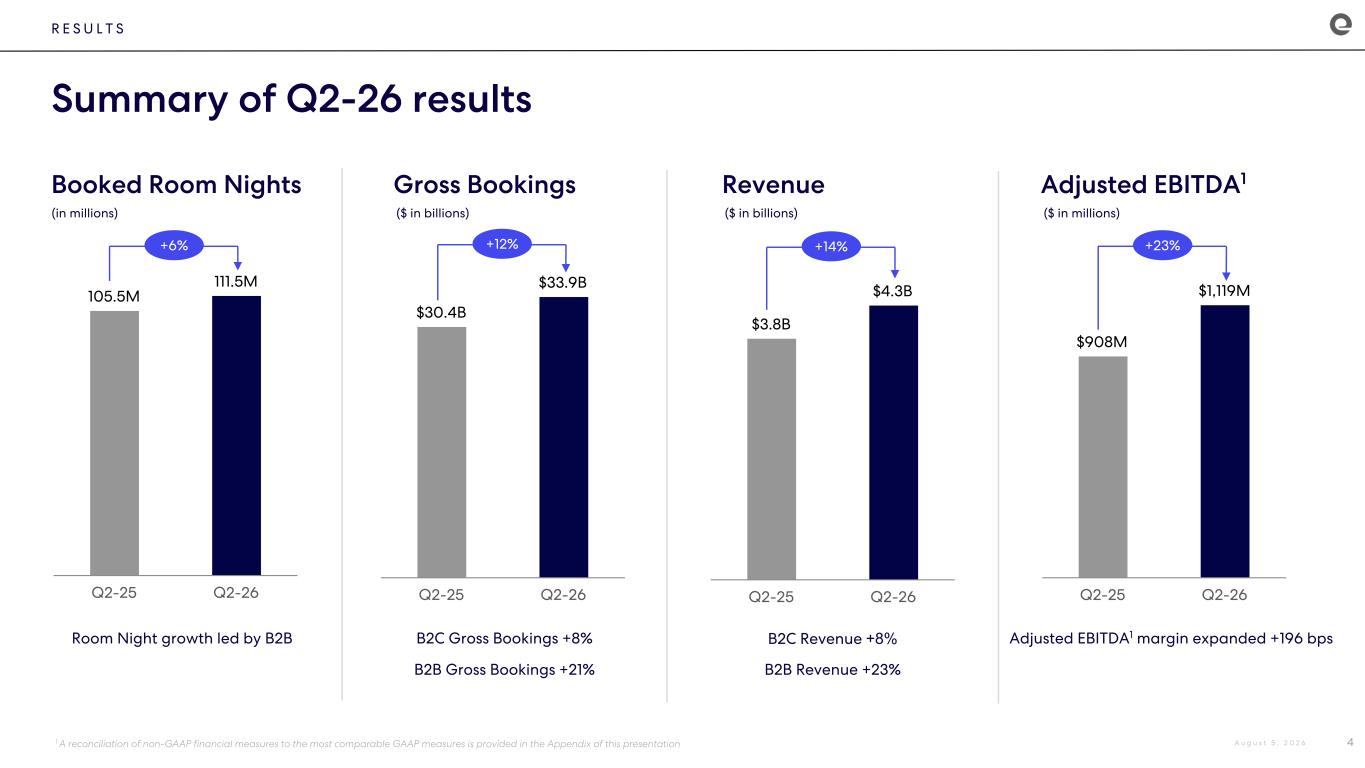
$3.8B $4.3B Q2-25 Q2-26 105.5M 111.5M Q2-25 Q2-26 R E S U L T S Summary of Q2-26 results 4 B2C Gross Bookings +8% B2B Gross Bookings +21% Gross Bookings B2C Revenue +8% B2B Revenue +23% RevenueBooked Room Nights Adjusted EBITDA1 margin expanded +196 bps Adjusted EBITDA1 (in millions) ($ in billions) ($ in billions) ($ in millions) 1 A reconciliation of non-GAAP financial measures to the most comparable GAAP measures is provided in the Appendix of this presentation Room Night growth led by B2B +6% $30.4B $33.9B Q2-25 Q2-26 +12% +14% $908M $1,119M Q2-25 Q2-26 +23% A u g u s t 5 , 2 0 2 6
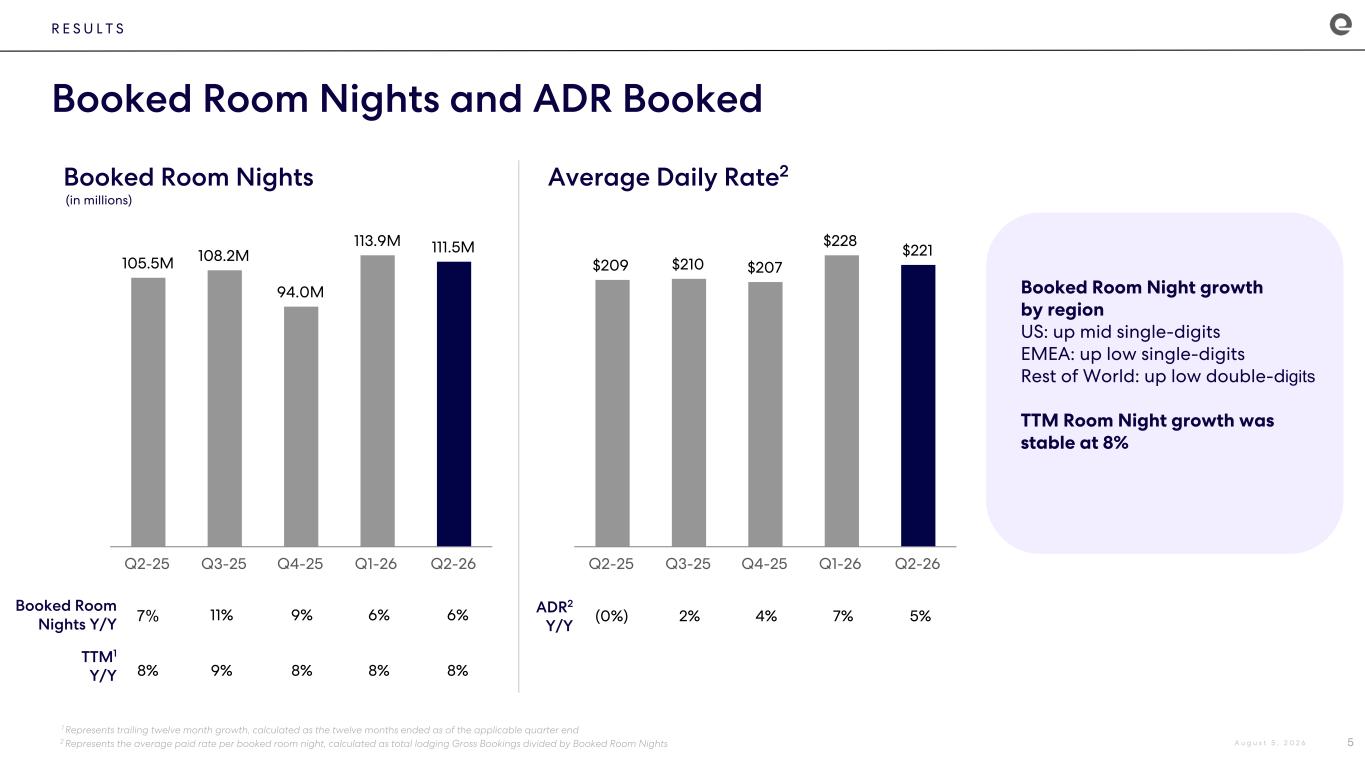
R E S U L T S Booked Room Nights and ADR Booked 5 Booked Room Nights Average Daily Rate2 (in millions) 105.5M 108.2M 94.0M 113.9M 111.5M Q2-25 Q3-25 Q4-25 Q1-26 Q2-26 7% 8% 11% 9% 9% 8% 6% 8% 6% 8% Booked Room Nights Y/Y $209 $210 $207 $228 $221 Q2-25 Q3-25 Q4-25 Q1-26 Q2-26 (0%) 2% 4% 7% 5%ADR2 Y/Y TTM1 Y/Y Booked Room Night growth by region US: up mid single-digits EMEA: up low single-digits Rest of World: up low double-digits TTM Room Night growth was stable at 8% 1 Represents trailing twelve month growth, calculated as the twelve months ended as of the applicable quarter end 2 Represents the average paid rate per booked room night, calculated as total lodging Gross Bookings divided by Booked Room Nights A u g u s t 5 , 2 0 2 6
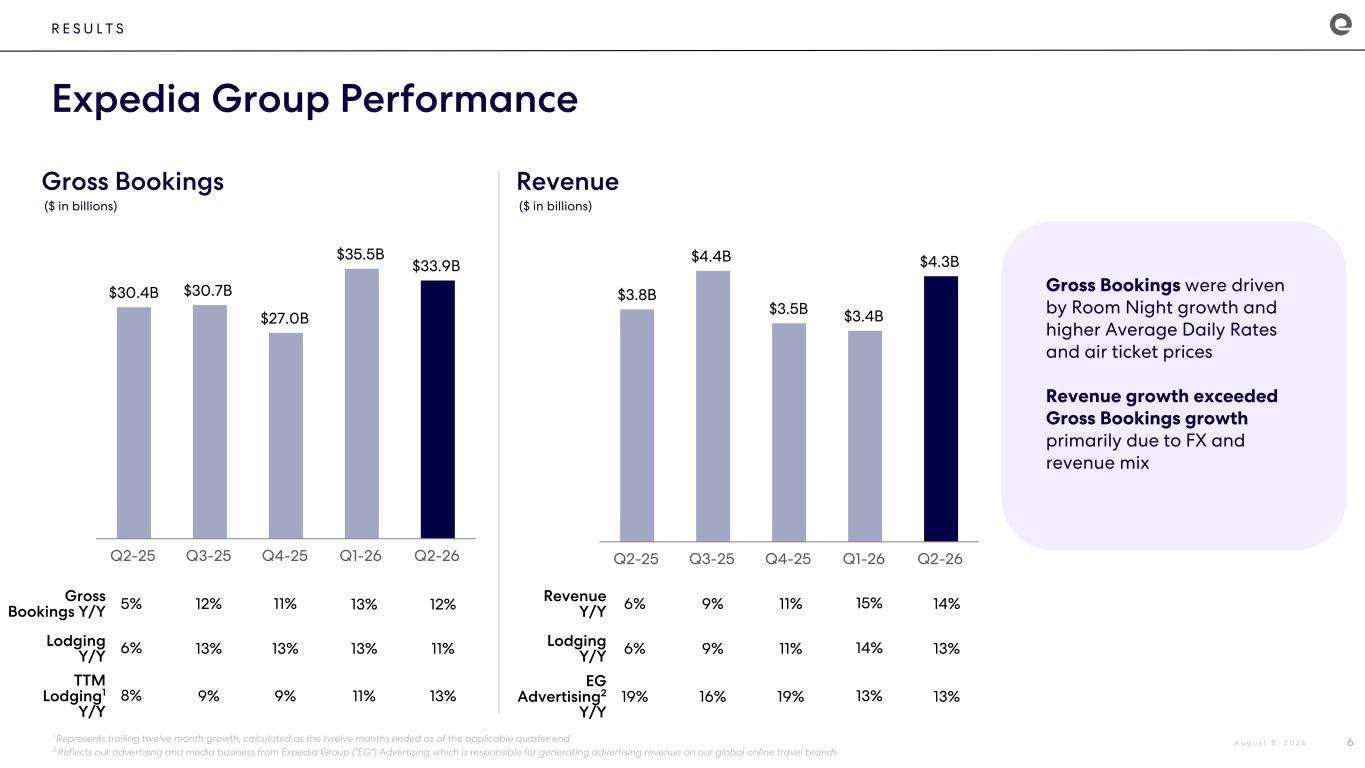
R E S U L T S Expedia Group Performance 6 Gross Bookings Revenue ($ in billions) ($ in billions) 1 Represents trailing twelve month growth, calculated as the twelve months ended as of the applicable quarter end 2 Reflects our advertising and media business from Expedia Group ("EG") Advertising which is responsible for generating advertising revenue on our global online travel brands $30.4B $30.7B $27.0B $35.5B $33.9B Q2-25 Q3-25 Q4-25 Q1-26 Q2-26 $3.8B $4.4B $3.5B $3.4B $4.3B Q2-25 Q3-25 Q4-25 Q1-26 Q2-26 Gross Bookings Y/Y Lodging Y/Y TTM Lodging1 Y/Y 5% 6% 8% 12% 13% 9% 11% 13% 9% 13% 13% 11% 12% 11% 13% Revenue Y/Y Lodging Y/Y EG Advertising2 Y/Y 6% 6% 19% 9% 9% 16% 11% 11% 19% 14% 13% 13% 15% 14% 13% Gross Bookings were driven by Room Night growth and higher Average Daily Rates and air ticket prices Revenue growth exceeded Gross Bookings growth primarily due to FX and revenue mix A u g u s t 5 , 2 0 2 6
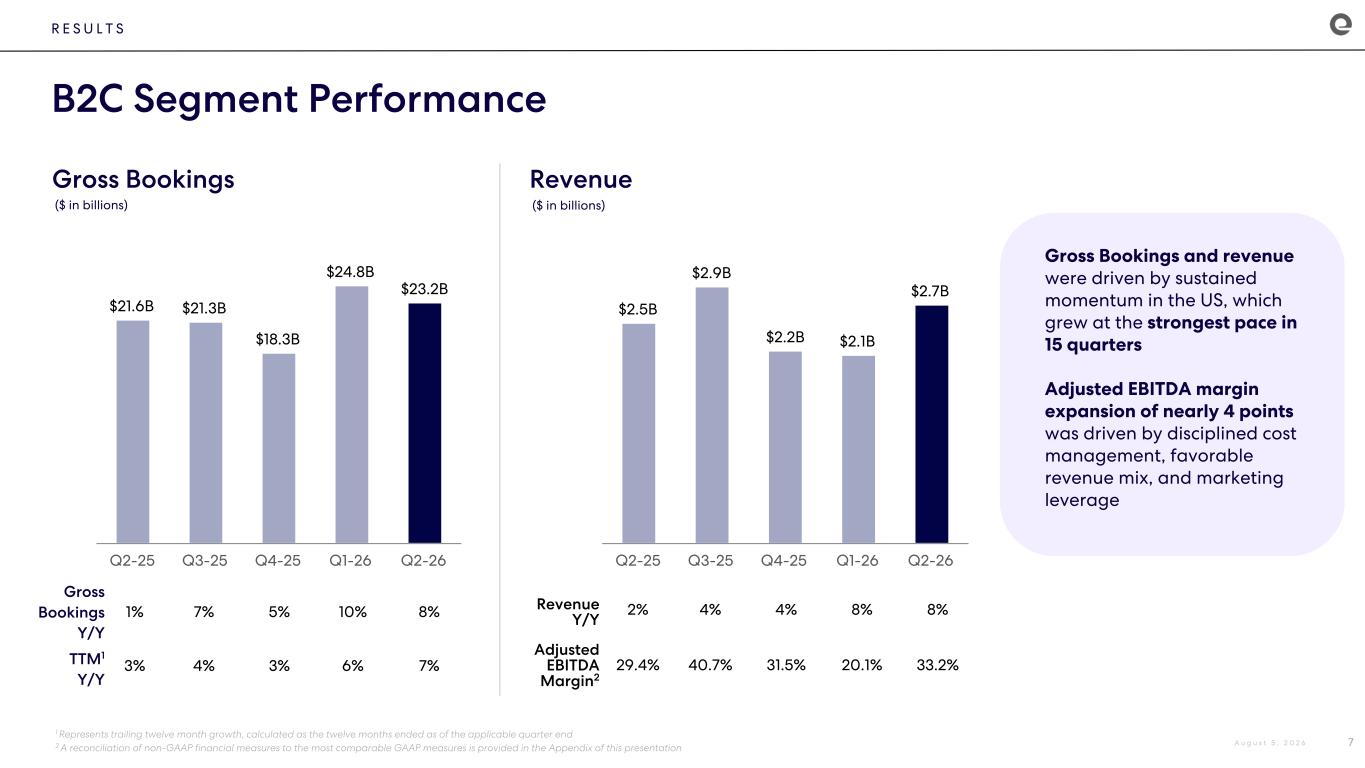
Gross Bookings and revenue were driven by sustained momentum in the US, which grew at the strongest pace in 15 quarters Adjusted EBITDA margin expansion of nearly 4 points was driven by disciplined cost management, favorable revenue mix, and marketing leverage R E S U L T S B2C Segment Performance 7 Gross Bookings Revenue ($ in billions) ($ in billions) 1 Represents trailing twelve month growth, calculated as the twelve months ended as of the applicable quarter end 2 A reconciliation of non-GAAP financial measures to the most comparable GAAP measures is provided in the Appendix of this presentation Gross Bookings Y/Y $21.6B $21.3B $18.3B $24.8B $23.2B Q2-25 Q3-25 Q4-25 Q1-26 Q2-26 $2.5B $2.9B $2.2B $2.1B $2.7B Q2-25 Q3-25 Q4-25 Q1-26 Q2-26 1% 3% 7% 4% 5% 3% Revenue Y/Y Adjusted EBITDA Margin2 2% 29.4% 4% 40.7% 4% 31.5% 8% 20.1% 8% 33.2% 10% 6% 8% 7%TTM1 Y/Y A u g u s t 5 , 2 0 2 6
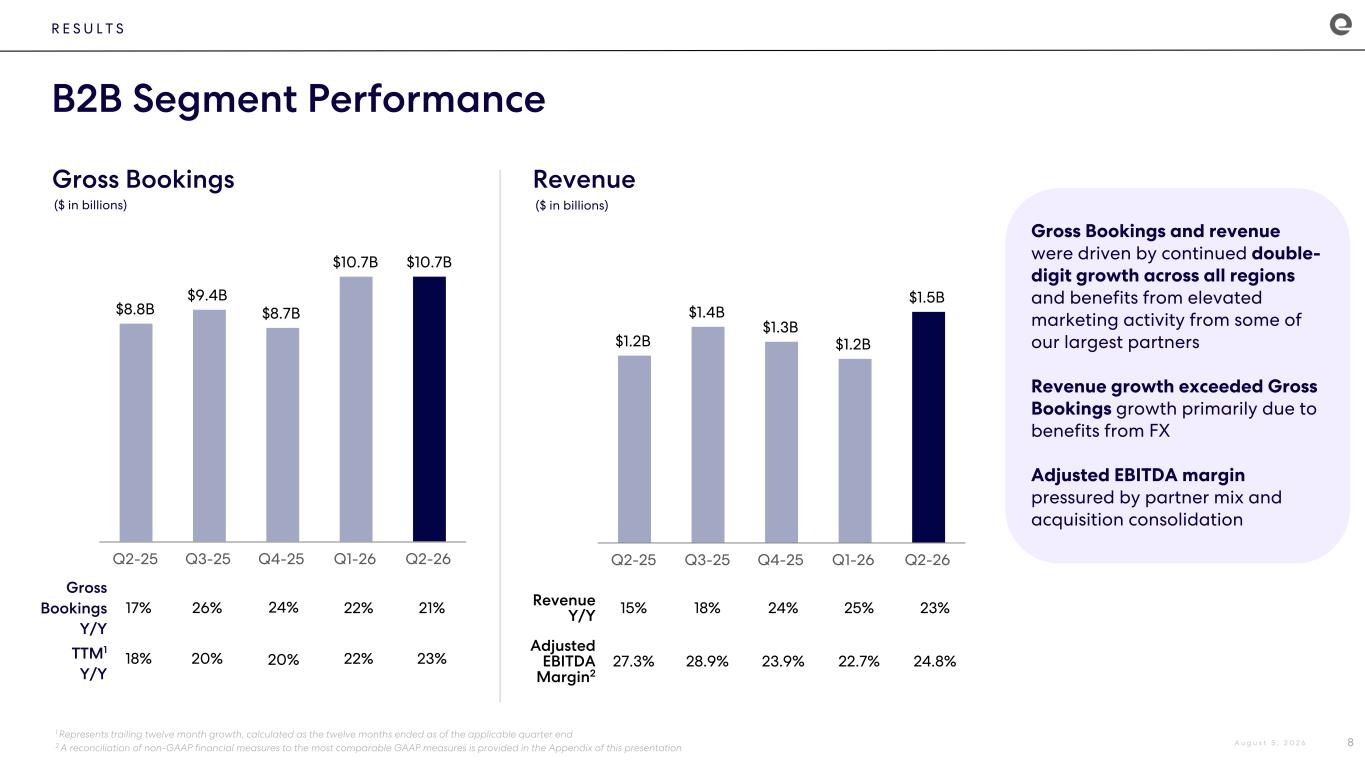
Gross Bookings Y/Y R E S U L T S B2B Segment Performance 8 1 Represents trailing twelve month growth, calculated as the twelve months ended as of the applicable quarter end 2 A reconciliation of non-GAAP financial measures to the most comparable GAAP measures is provided in the Appendix of this presentation $8.8B $9.4B $8.7B $10.7B $10.7B Q2-25 Q3-25 Q4-25 Q1-26 Q2-26 $1.2B $1.4B $1.3B $1.2B $1.5B Q2-25 Q3-25 Q4-25 Q1-26 Q2-26 17% 18% 26% 20% 24% 20% 22% 22% 21% 23% 15% 27.3% 18% 28.9% 24% 23.9% 25% 22.7% 23% 24.8% Revenue Y/Y Adjusted EBITDA Margin2 TTM1 Y/Y Gross Bookings and revenue were driven by continued double- digit growth across all regions and benefits from elevated marketing activity from some of our largest partners Revenue growth exceeded Gross Bookings growth primarily due to benefits from FX Adjusted EBITDA margin pressured by partner mix and acquisition consolidation Gross Bookings Revenue ($ in billions) ($ in billions) A u g u s t 5 , 2 0 2 6
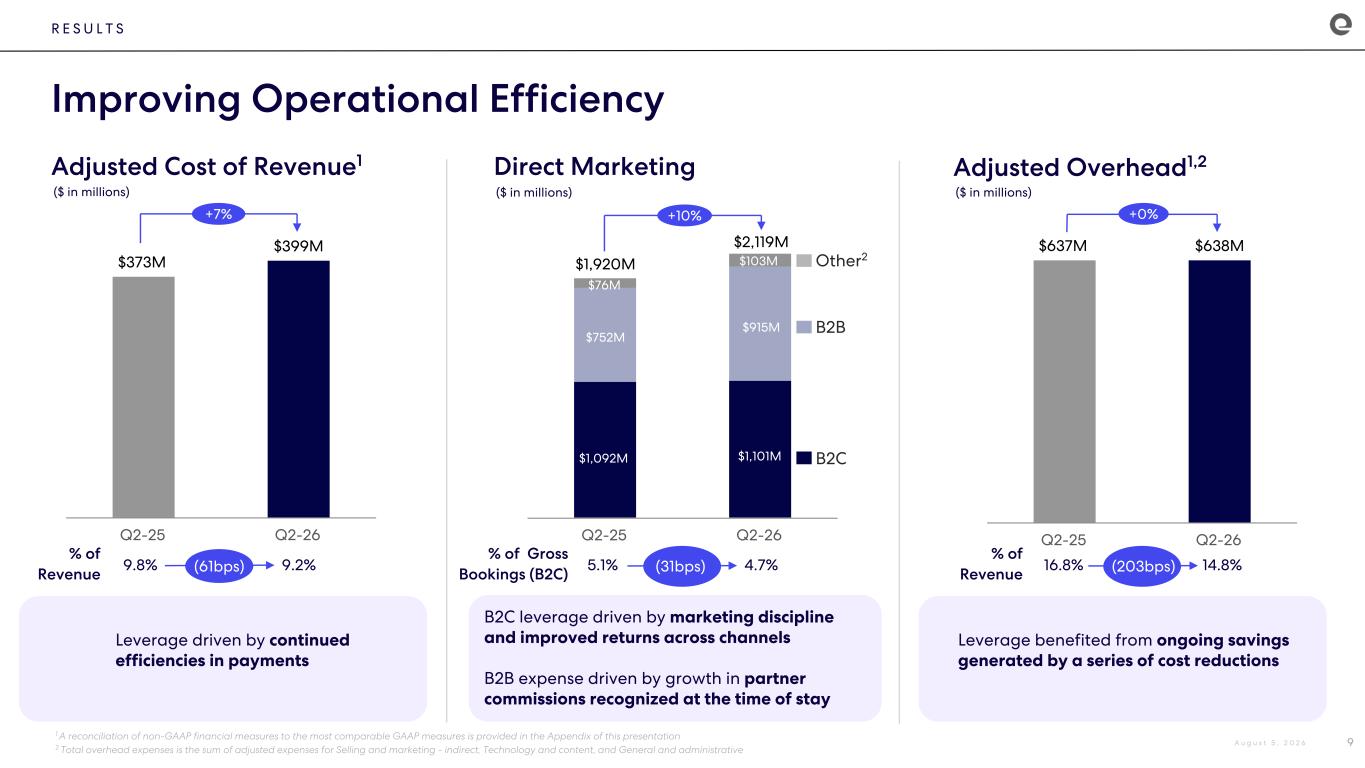
$373M $399M Q2-25 Q2-26 $637M $638M Q2-25 Q2-26 R E S U L T S Improving Operational Efficiency 9 Direct Marketing Adjusted Overhead1,2Adjusted Cost of Revenue1 ($ in millions) ($ in millions) ($ in millions) 1 A reconciliation of non-GAAP financial measures to the most comparable GAAP measures is provided in the Appendix of this presentation 2 Total overhead expenses is the sum of adjusted expenses for Selling and marketing - indirect, Technology and content, and General and administrative +7% +0% 9.8% 9.2% % of Revenue (61bps) 16.8% 14.8% % of Revenue (203bps) Q2-25 Q2-26 +10% 5.1% 4.7% % of Gross Bookings (B2C) (31bps) B2C B2B Other2 $915M $1,101M $103M $1,092M $752M $76M $2,119M $1,920M B2C leverage driven by marketing discipline and improved returns across channels B2B expense driven by growth in partner commissions recognized at the time of stay A u g u s t 5 , 2 0 2 6 Leverage driven by continued efficiencies in payments Leverage benefited from ongoing savings generated by a series of cost reductions
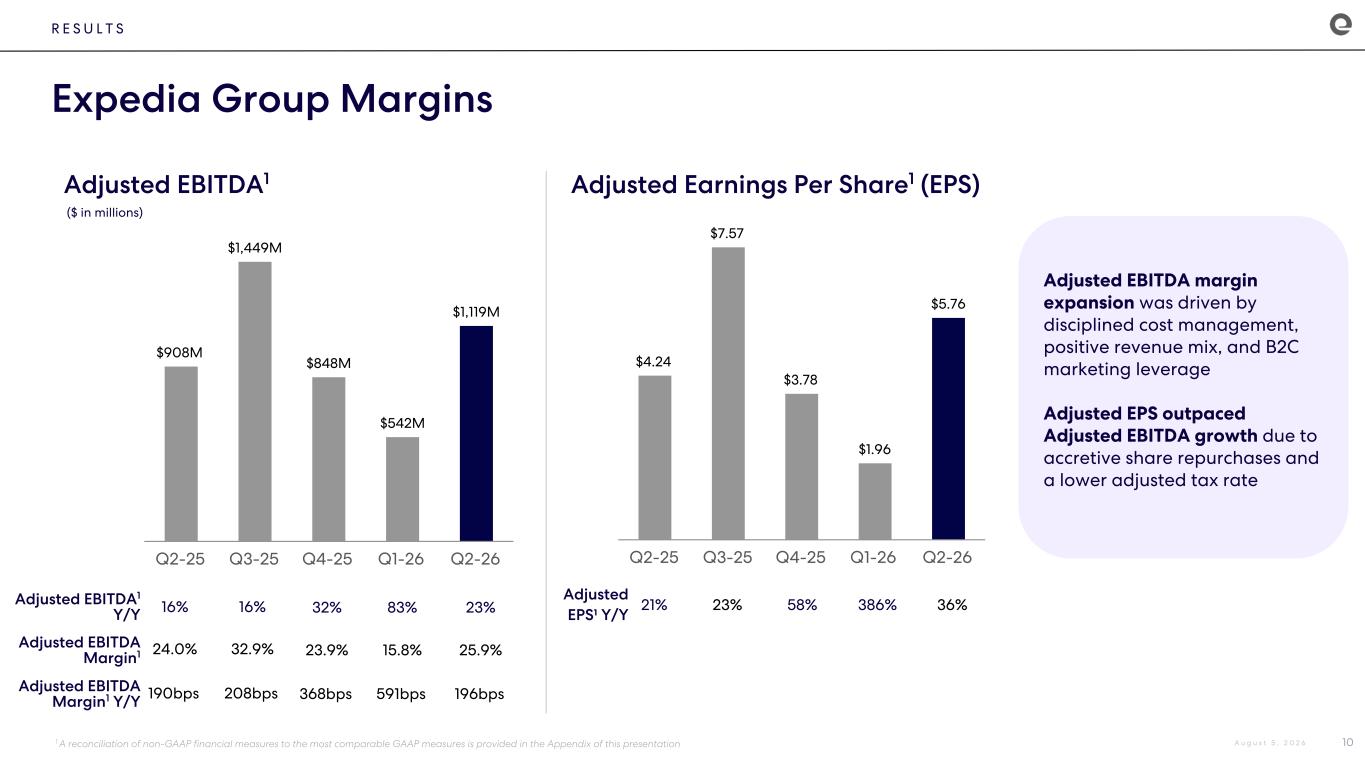
Adjusted EBITDA margin expansion was driven by disciplined cost management, positive revenue mix, and B2C marketing leverage Adjusted EPS outpaced Adjusted EBITDA growth due to accretive share repurchases and a lower adjusted tax rate R E S U L T S Expedia Group Margins 10 Adjusted EBITDA1 Adjusted Earnings Per Share1 (EPS) ($ in millions) 1 A reconciliation of non-GAAP financial measures to the most comparable GAAP measures is provided in the Appendix of this presentation Adjusted EPS¹ Y/Y $908M $1,449M $848M $542M $1,119M Q2-25 Q3-25 Q4-25 Q1-26 Q2-26 Adjusted EBITDA1 Y/Y Adjusted EBITDA Margin1 Adjusted EBITDA Margin1 Y/Y 16% 24.0% 190bps 16% 32.9% 208bps 32% 23.9% 368bps 83% 15.8% 591bps 23% 25.9% 196bps 21% 23% 58% 386% 36% $4.24 $7.57 $3.78 $1.96 $5.76 Q2-25 Q3-25 Q4-25 Q1-26 Q2-26 A u g u s t 5 , 2 0 2 6
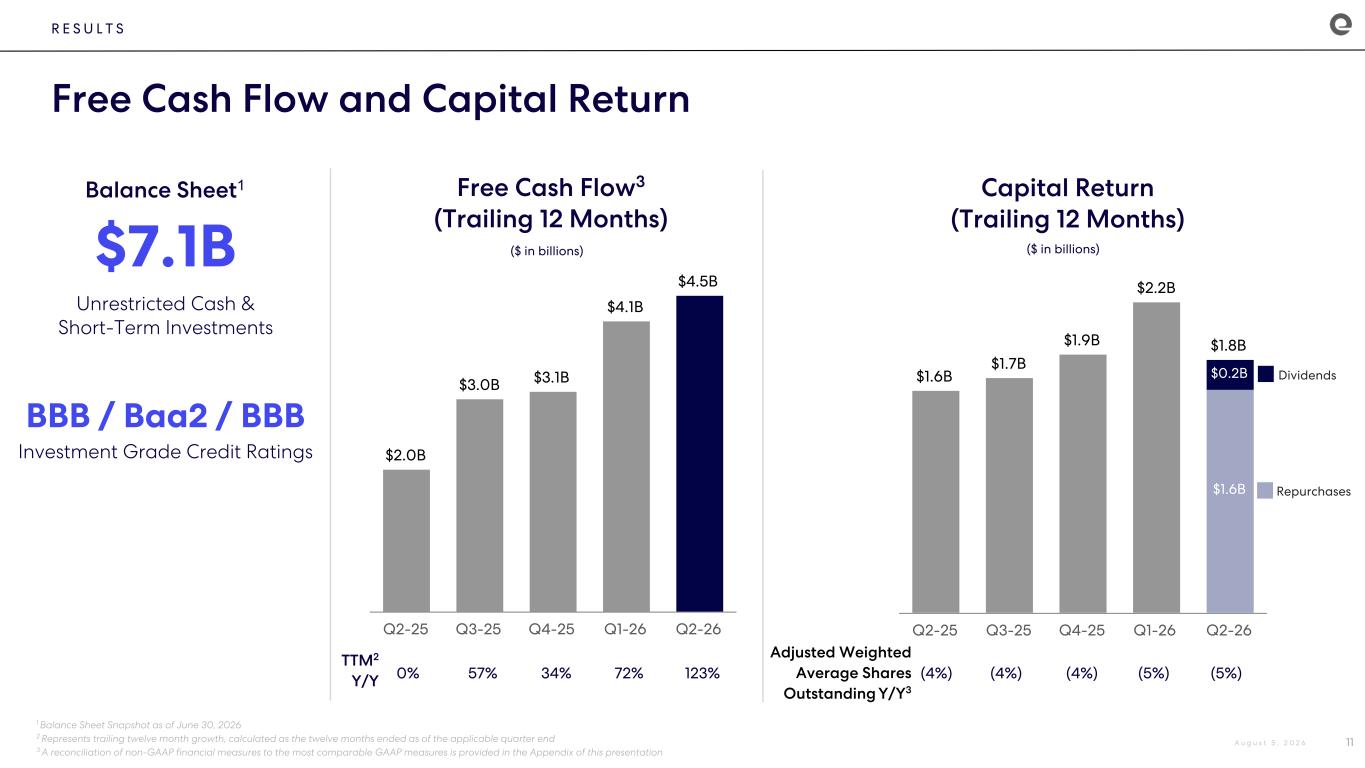
TTM2 Y/Y $1.6B $1.7B $1.9B $2.2B $1.8B Q2-25 Q3-25 Q4-25 Q1-26 Q2-26 R E S U L T S Free Cash Flow and Capital Return 11 Balance Sheet1 1 Balance Sheet Snapshot as of June 30, 2026 2 Represents trailing twelve month growth, calculated as the twelve months ended as of the applicable quarter end 3 A reconciliation of non-GAAP financial measures to the most comparable GAAP measures is provided in the Appendix of this presentation Capital Return (Trailing 12 Months) ($ in billions) Dividends Repurchases $2.0B $3.0B $3.1B $4.1B $4.5B Q2-25 Q3-25 Q4-25 Q1-26 Q2-26 Free Cash Flow3 (Trailing 12 Months) ($ in billions)$7.1B Unrestricted Cash & Short-Term Investments BBB / Baa2 / BBB Investment Grade Credit Ratings $0.2B $1.6B Adjusted Weighted Average Shares Outstanding Y/Y3 (4%) (4%) (4%) (5%) (5%)0% 57% 34% 72% 123% A u g u s t 5 , 2 0 2 6
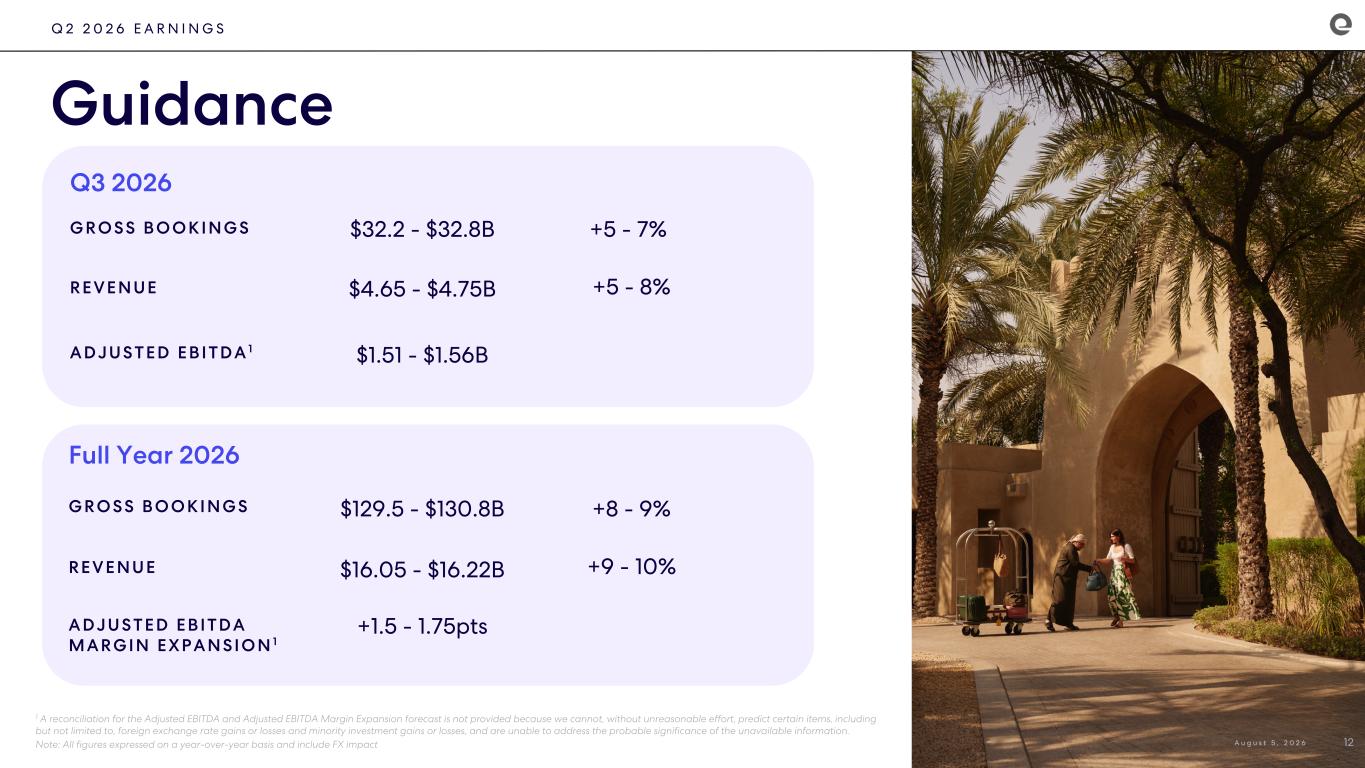
A D J U S T E D E B I T D A 1 Guidance G R O S S B O O K I N G S 12 Q3 2026 1 A reconciliation for the Adjusted EBITDA and Adjusted EBITDA Margin Expansion forecast is not provided because we cannot, without unreasonable effort, predict certain items, including but not limited to, foreign exchange rate gains or losses and minority investment gains or losses, and are unable to address the probable significance of the unavailable information. Note: All figures expressed on a year-over-year basis and include FX impact R E V E N U E $32.2 - $32.8B $1.51 - $1.56B Q 2 2 0 2 6 E A R N I N G S $4.65 - $4.75B A u g u s t 5 , 2 0 2 6 G R O S S B O O K I N G S Full Year 2026 R E V E N U E $129.5 - $130.8B $16.05 - $16.22B A D J U S T E D E B I T D A M A R G I N E X P A N S I O N 1 +1.5 - 1.75pts +5 - 7% +5 - 8% +8 - 9% +9 - 10%


Appendix Q 2 2 0 2 6 E A R N I N G S
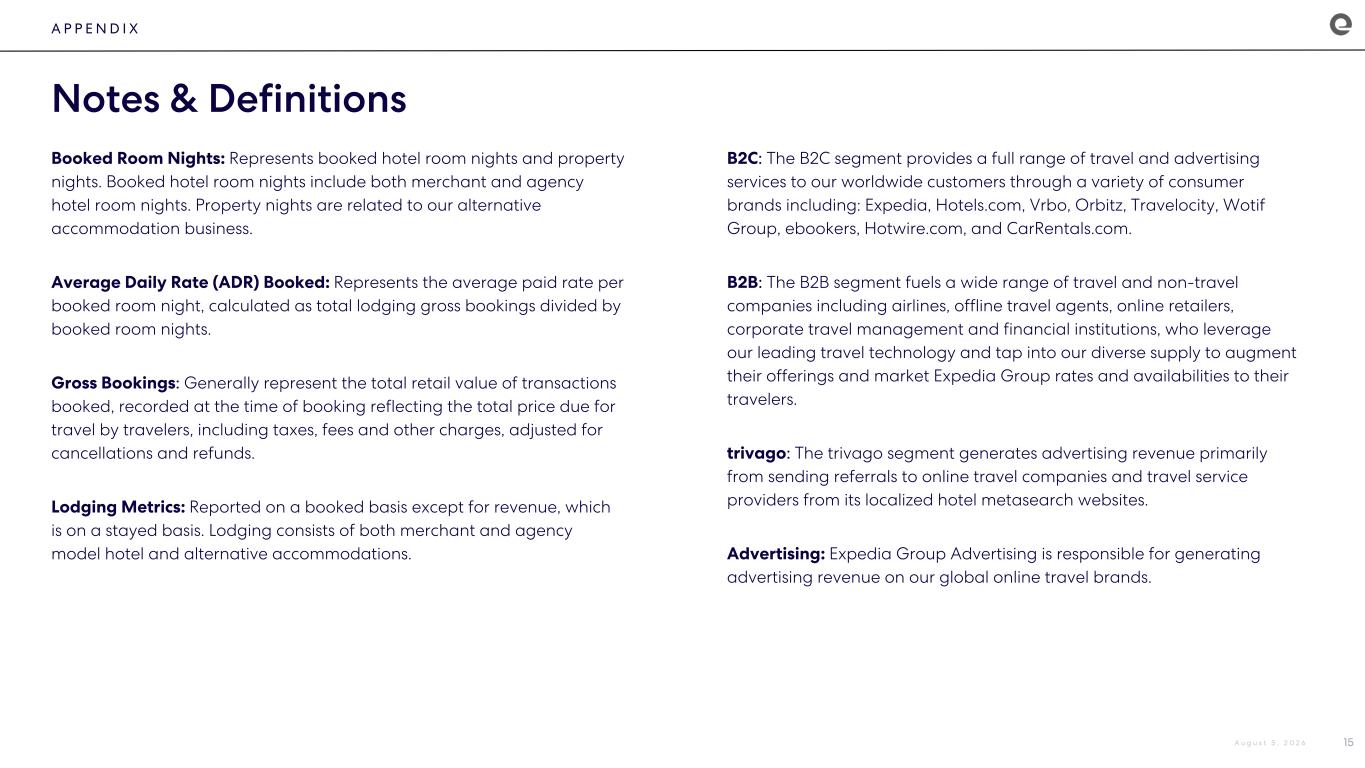
A P P E N D I X Notes & Definitions 15 Booked Room Nights: Represents booked hotel room nights and property nights. Booked hotel room nights include both merchant and agency hotel room nights. Property nights are related to our alternative accommodation business. Average Daily Rate (ADR) Booked: Represents the average paid rate per booked room night, calculated as total lodging gross bookings divided by booked room nights. Gross Bookings: Generally represent the total retail value of transactions booked, recorded at the time of booking reflecting the total price due for travel by travelers, including taxes, fees and other charges, adjusted for cancellations and refunds. Lodging Metrics: Reported on a booked basis except for revenue, which is on a stayed basis. Lodging consists of both merchant and agency model hotel and alternative accommodations. B2C: The B2C segment provides a full range of travel and advertising services to our worldwide customers through a variety of consumer brands including: Expedia, Hotels.com, Vrbo, Orbitz, Travelocity, Wotif Group, ebookers, Hotwire.com, and CarRentals.com. B2B: The B2B segment fuels a wide range of travel and non-travel companies including airlines, offline travel agents, online retailers, corporate travel management and financial institutions, who leverage our leading travel technology and tap into our diverse supply to augment their offerings and market Expedia Group rates and availabilities to their travelers. trivago: The trivago segment generates advertising revenue primarily from sending referrals to online travel companies and travel service providers from its localized hotel metasearch websites. Advertising: Expedia Group Advertising is responsible for generating advertising revenue on our global online travel brands. A u g u s t 5 , 2 0 2 6
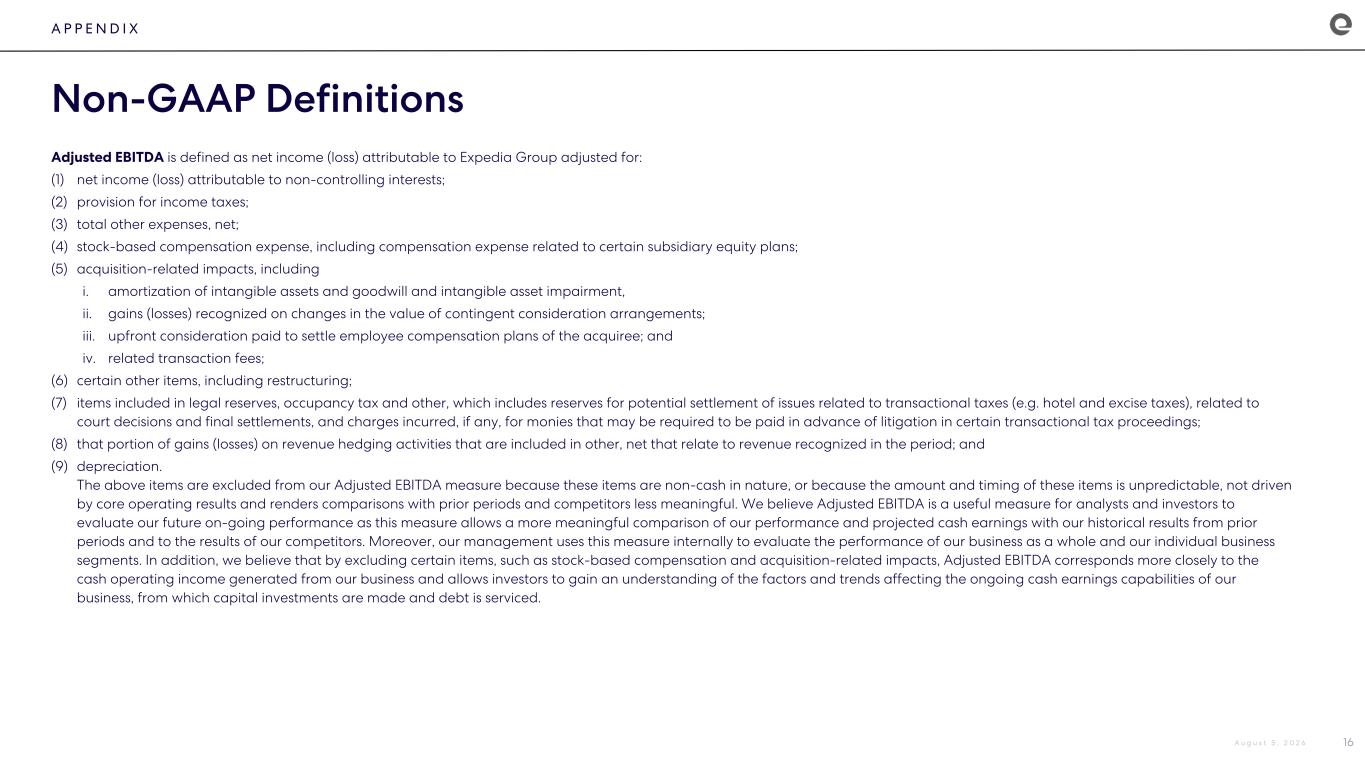
A P P E N D I X Non-GAAP Definitions 16 Adjusted EBITDA is defined as net income (loss) attributable to Expedia Group adjusted for: (1) net income (loss) attributable to non-controlling interests; (2) provision for income taxes; (3) total other expenses, net; (4) stock-based compensation expense, including compensation expense related to certain subsidiary equity plans; (5) acquisition-related impacts, including i. amortization of intangible assets and goodwill and intangible asset impairment, ii. gains (losses) recognized on changes in the value of contingent consideration arrangements; iii. upfront consideration paid to settle employee compensation plans of the acquiree; and iv. related transaction fees; (6) certain other items, including restructuring; (7) items included in legal reserves, occupancy tax and other, which includes reserves for potential settlement of issues related to transactional taxes (e.g. hotel and excise taxes), related to court decisions and final settlements, and charges incurred, if any, for monies that may be required to be paid in advance of litigation in certain transactional tax proceedings; (8) that portion of gains (losses) on revenue hedging activities that are included in other, net that relate to revenue recognized in the period; and (9) depreciation. The above items are excluded from our Adjusted EBITDA measure because these items are non-cash in nature, or because the amount and timing of these items is unpredictable, not driven by core operating results and renders comparisons with prior periods and competitors less meaningful. We believe Adjusted EBITDA is a useful measure for analysts and investors to evaluate our future on-going performance as this measure allows a more meaningful comparison of our performance and projected cash earnings with our historical results from prior periods and to the results of our competitors. Moreover, our management uses this measure internally to evaluate the performance of our business as a whole and our individual business segments. In addition, we believe that by excluding certain items, such as stock-based compensation and acquisition-related impacts, Adjusted EBITDA corresponds more closely to the cash operating income generated from our business and allows investors to gain an understanding of the factors and trends affecting the ongoing cash earnings capabilities of our business, from which capital investments are made and debt is serviced. A u g u s t 5 , 2 0 2 6
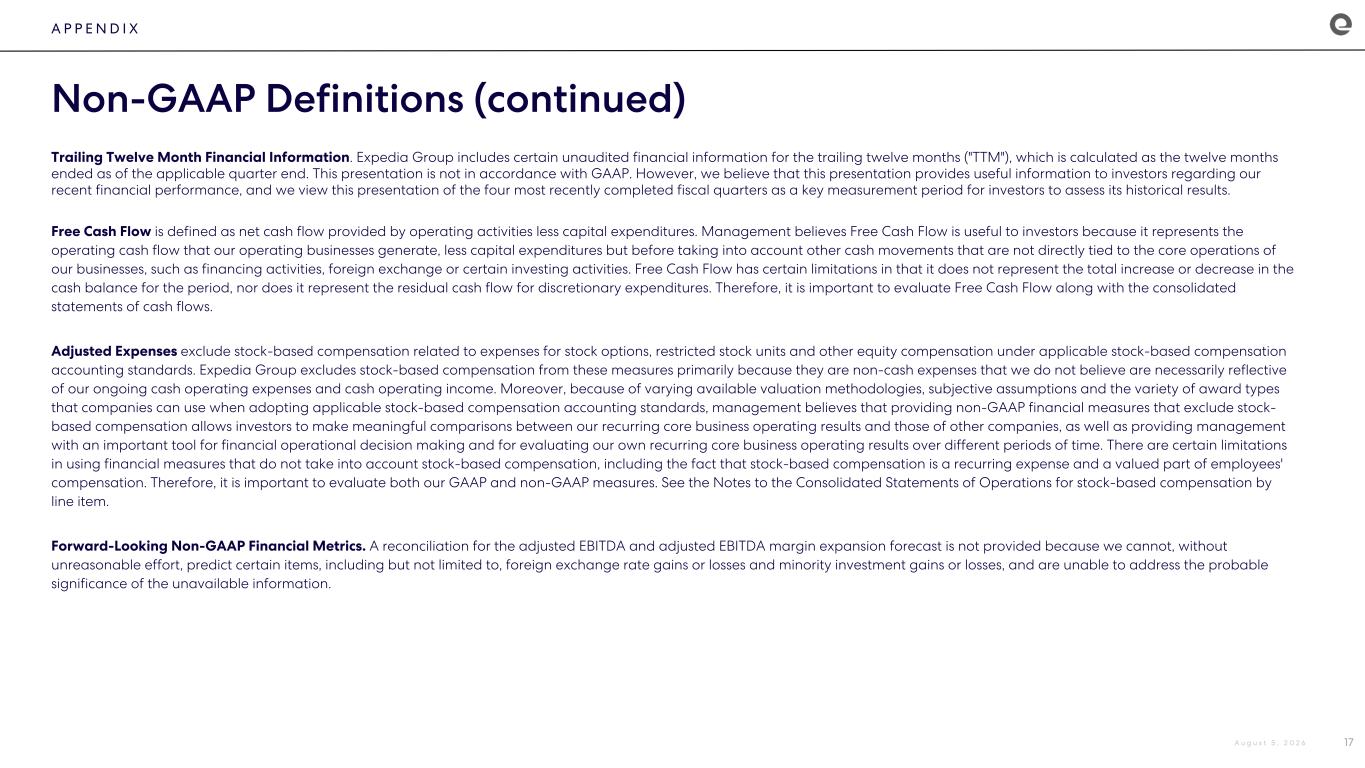
A P P E N D I X Non-GAAP Definitions (continued) 17 Trailing Twelve Month Financial Information. Expedia Group includes certain unaudited financial information for the trailing twelve months ("TTM"), which is calculated as the twelve months ended as of the applicable quarter end. This presentation is not in accordance with GAAP. However, we believe that this presentation provides useful information to investors regarding our recent financial performance, and we view this presentation of the four most recently completed fiscal quarters as a key measurement period for investors to assess its historical results. Free Cash Flow is defined as net cash flow provided by operating activities less capital expenditures. Management believes Free Cash Flow is useful to investors because it represents the operating cash flow that our operating businesses generate, less capital expenditures but before taking into account other cash movements that are not directly tied to the core operations of our businesses, such as financing activities, foreign exchange or certain investing activities. Free Cash Flow has certain limitations in that it does not represent the total increase or decrease in the cash balance for the period, nor does it represent the residual cash flow for discretionary expenditures. Therefore, it is important to evaluate Free Cash Flow along with the consolidated statements of cash flows. Adjusted Expenses exclude stock-based compensation related to expenses for stock options, restricted stock units and other equity compensation under applicable stock-based compensation accounting standards. Expedia Group excludes stock-based compensation from these measures primarily because they are non-cash expenses that we do not believe are necessarily reflective of our ongoing cash operating expenses and cash operating income. Moreover, because of varying available valuation methodologies, subjective assumptions and the variety of award types that companies can use when adopting applicable stock-based compensation accounting standards, management believes that providing non-GAAP financial measures that exclude stock- based compensation allows investors to make meaningful comparisons between our recurring core business operating results and those of other companies, as well as providing management with an important tool for financial operational decision making and for evaluating our own recurring core business operating results over different periods of time. There are certain limitations in using financial measures that do not take into account stock-based compensation, including the fact that stock-based compensation is a recurring expense and a valued part of employees' compensation. Therefore, it is important to evaluate both our GAAP and non-GAAP measures. See the Notes to the Consolidated Statements of Operations for stock-based compensation by line item. Forward-Looking Non-GAAP Financial Metrics. A reconciliation for the adjusted EBITDA and adjusted EBITDA margin expansion forecast is not provided because we cannot, without unreasonable effort, predict certain items, including but not limited to, foreign exchange rate gains or losses and minority investment gains or losses, and are unable to address the probable significance of the unavailable information. A u g u s t 5 , 2 0 2 6
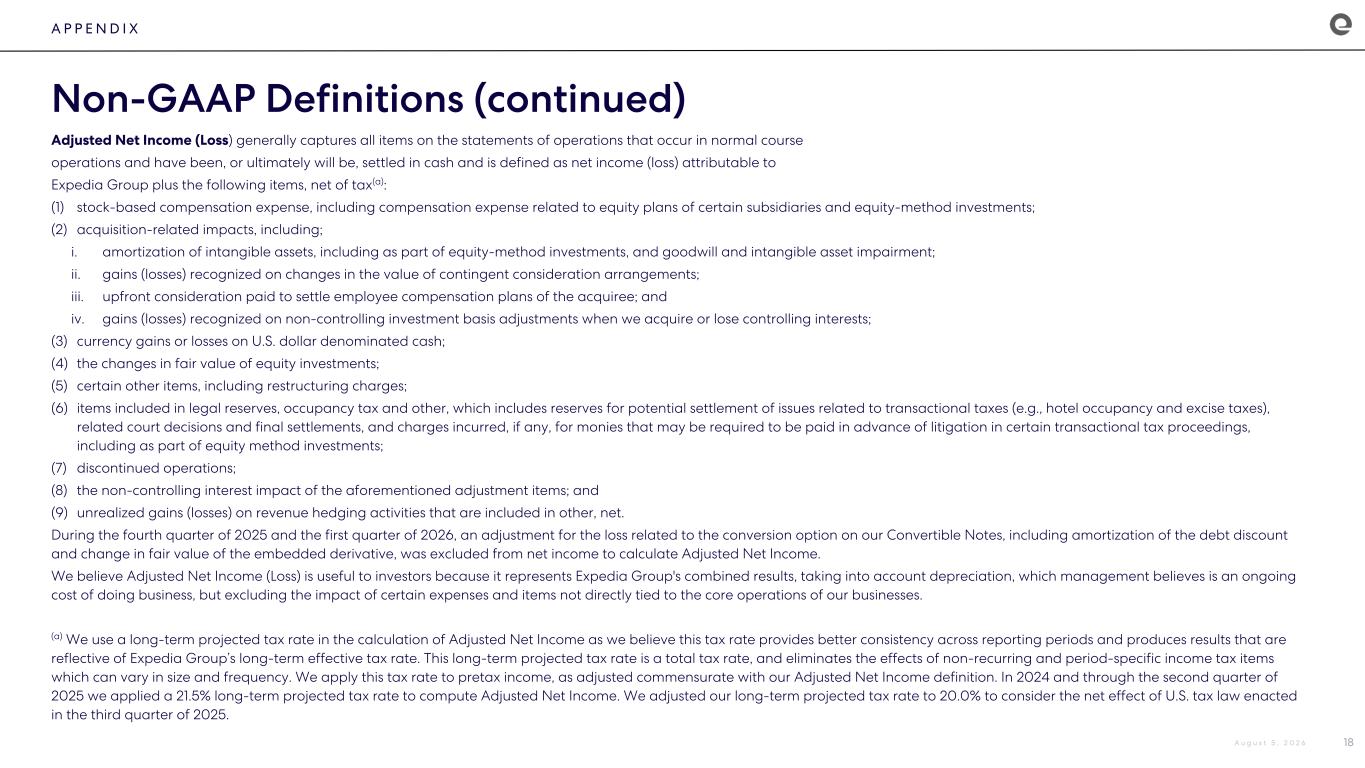
A P P E N D I X Non-GAAP Definitions (continued) 18 Adjusted Net Income (Loss) generally captures all items on the statements of operations that occur in normal course operations and have been, or ultimately will be, settled in cash and is defined as net income (loss) attributable to Expedia Group plus the following items, net of tax(a): (1) stock-based compensation expense, including compensation expense related to equity plans of certain subsidiaries and equity-method investments; (2) acquisition-related impacts, including; i. amortization of intangible assets, including as part of equity-method investments, and goodwill and intangible asset impairment; ii. gains (losses) recognized on changes in the value of contingent consideration arrangements; iii. upfront consideration paid to settle employee compensation plans of the acquiree; and iv. gains (losses) recognized on non-controlling investment basis adjustments when we acquire or lose controlling interests; (3) currency gains or losses on U.S. dollar denominated cash; (4) the changes in fair value of equity investments; (5) certain other items, including restructuring charges; (6) items included in legal reserves, occupancy tax and other, which includes reserves for potential settlement of issues related to transactional taxes (e.g., hotel occupancy and excise taxes), related court decisions and final settlements, and charges incurred, if any, for monies that may be required to be paid in advance of litigation in certain transactional tax proceedings, including as part of equity method investments; (7) discontinued operations; (8) the non-controlling interest impact of the aforementioned adjustment items; and (9) unrealized gains (losses) on revenue hedging activities that are included in other, net. During the fourth quarter of 2025 and the first quarter of 2026, an adjustment for the loss related to the conversion option on our Convertible Notes, including amortization of the debt discount and change in fair value of the embedded derivative, was excluded from net income to calculate Adjusted Net Income. We believe Adjusted Net Income (Loss) is useful to investors because it represents Expedia Group's combined results, taking into account depreciation, which management believes is an ongoing cost of doing business, but excluding the impact of certain expenses and items not directly tied to the core operations of our businesses. (a) We use a long-term projected tax rate in the calculation of Adjusted Net Income as we believe this tax rate provides better consistency across reporting periods and produces results that are reflective of Expedia Group’s long-term effective tax rate. This long-term projected tax rate is a total tax rate, and eliminates the effects of non-recurring and period-specific income tax items which can vary in size and frequency. We apply this tax rate to pretax income, as adjusted commensurate with our Adjusted Net Income definition. In 2024 and through the second quarter of 2025 we applied a 21.5% long-term projected tax rate to compute Adjusted Net Income. We adjusted our long-term projected tax rate to 20.0% to consider the net effect of U.S. tax law enacted in the third quarter of 2025. A u g u s t 5 , 2 0 2 6
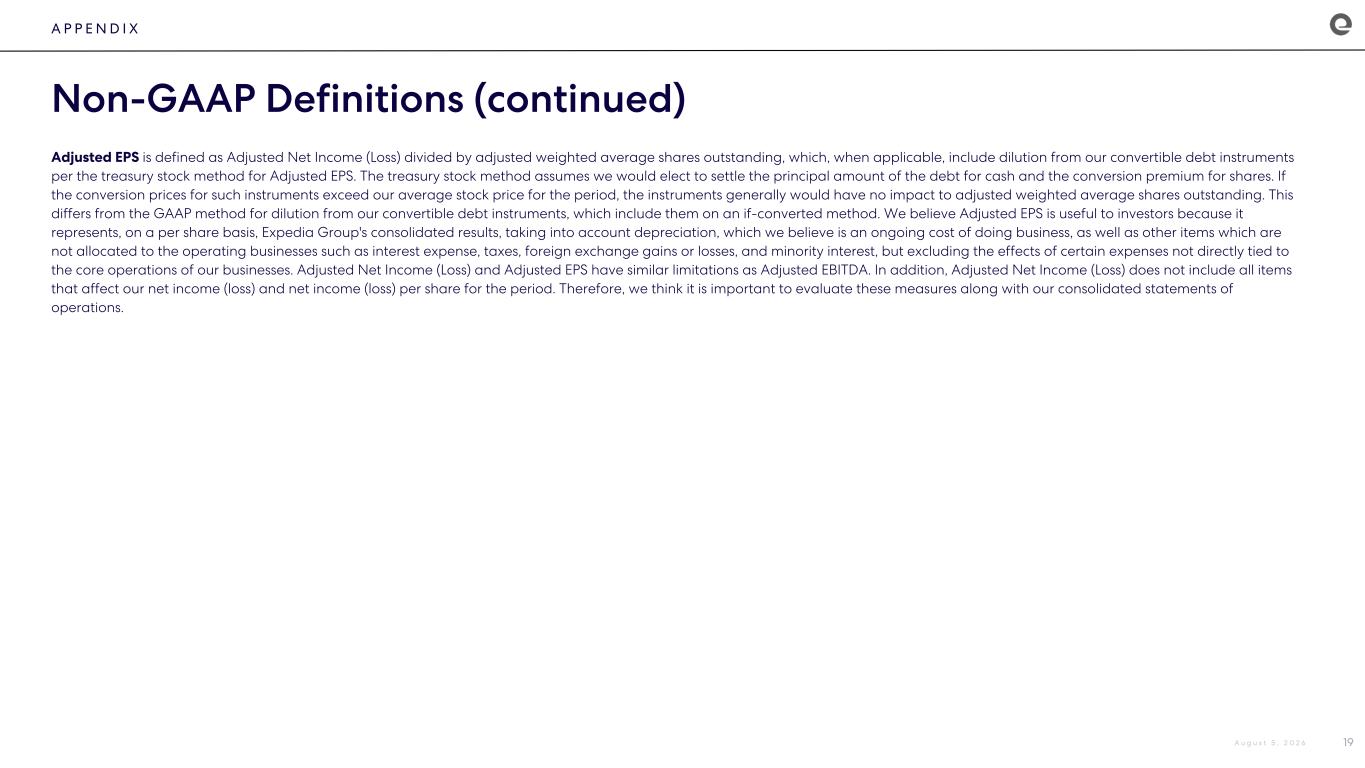
A P P E N D I X Non-GAAP Definitions (continued) 19 Adjusted EPS is defined as Adjusted Net Income (Loss) divided by adjusted weighted average shares outstanding, which, when applicable, include dilution from our convertible debt instruments per the treasury stock method for Adjusted EPS. The treasury stock method assumes we would elect to settle the principal amount of the debt for cash and the conversion premium for shares. If the conversion prices for such instruments exceed our average stock price for the period, the instruments generally would have no impact to adjusted weighted average shares outstanding. This differs from the GAAP method for dilution from our convertible debt instruments, which include them on an if-converted method. We believe Adjusted EPS is useful to investors because it represents, on a per share basis, Expedia Group's consolidated results, taking into account depreciation, which we believe is an ongoing cost of doing business, as well as other items which are not allocated to the operating businesses such as interest expense, taxes, foreign exchange gains or losses, and minority interest, but excluding the effects of certain expenses not directly tied to the core operations of our businesses. Adjusted Net Income (Loss) and Adjusted EPS have similar limitations as Adjusted EBITDA. In addition, Adjusted Net Income (Loss) does not include all items that affect our net income (loss) and net income (loss) per share for the period. Therefore, we think it is important to evaluate these measures along with our consolidated statements of operations. A u g u s t 5 , 2 0 2 6
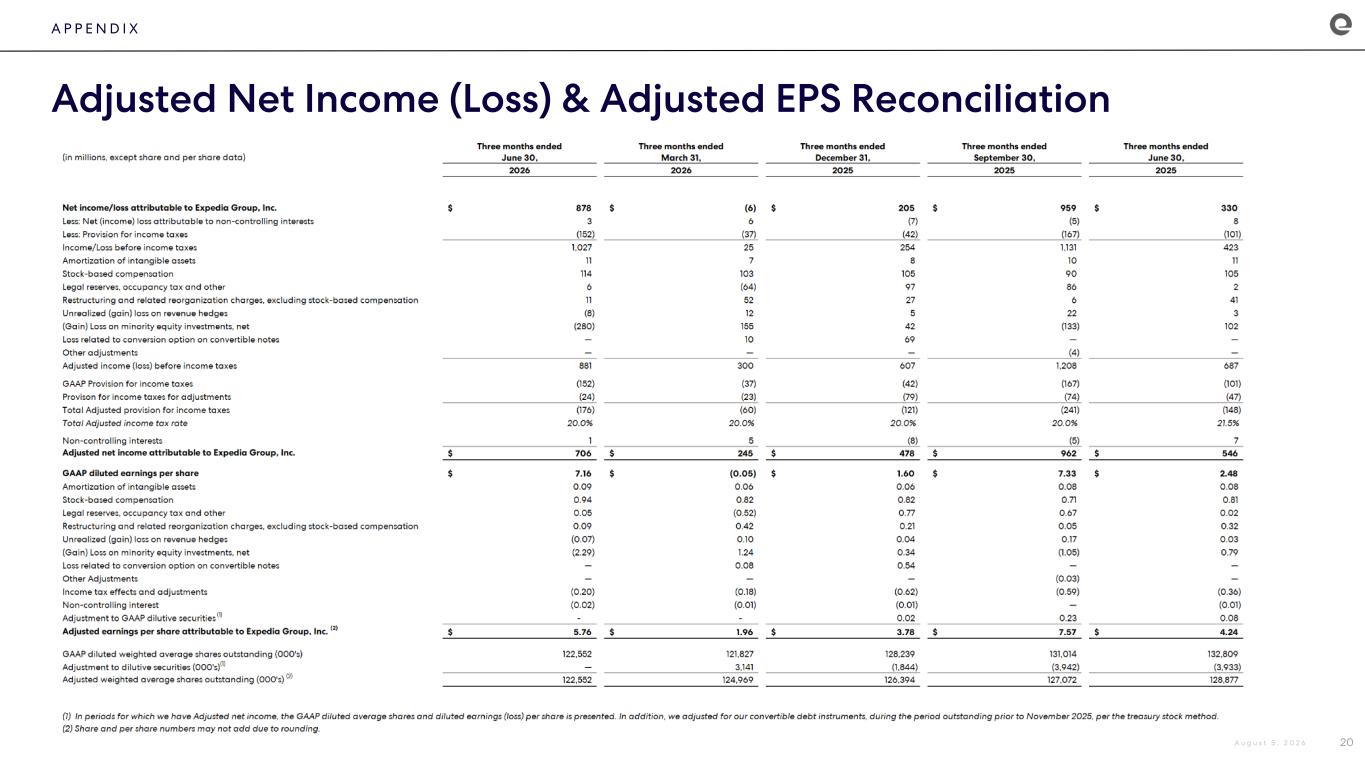
A P P E N D I X Adjusted Net Income (Loss) & Adjusted EPS Reconciliation 20A u g u s t 5 , 2 0 2 6
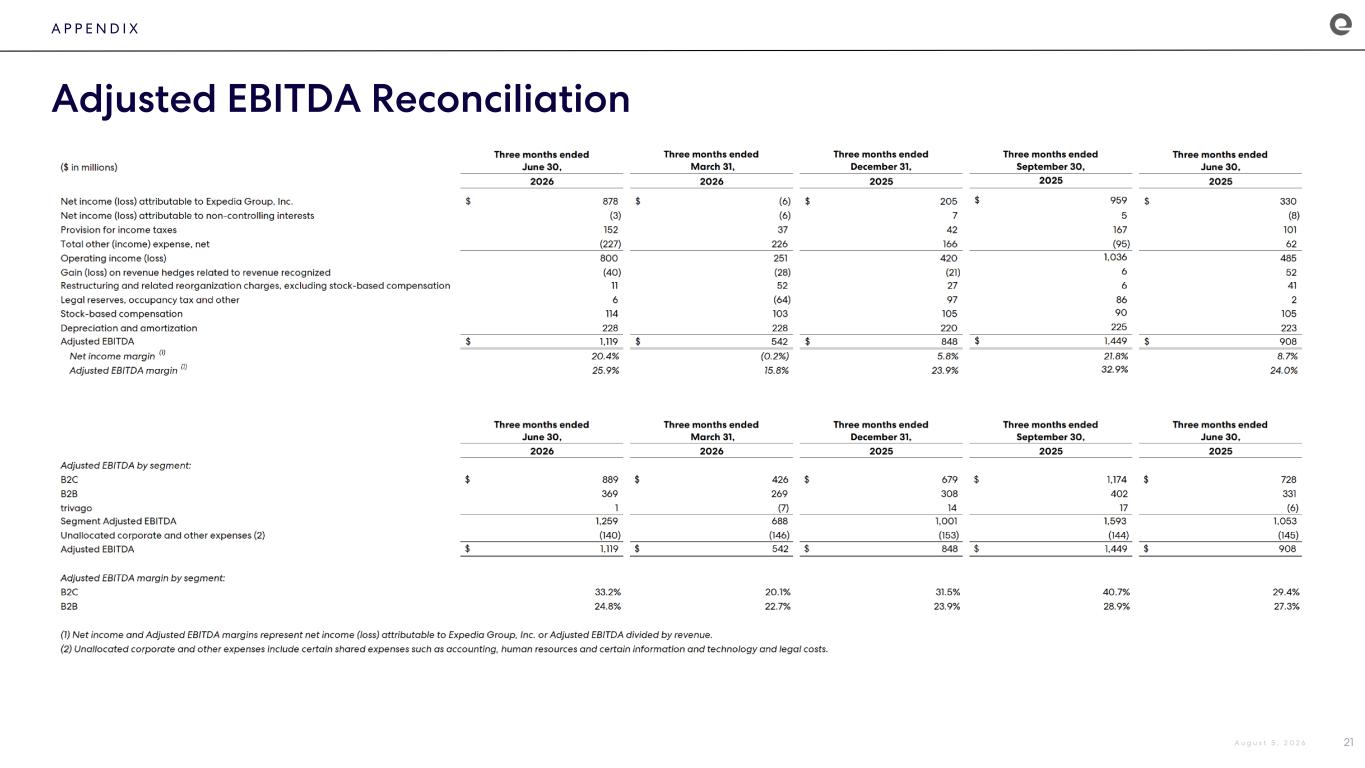
A P P E N D I X Adjusted EBITDA Reconciliation 21A u g u s t 5 , 2 0 2 6
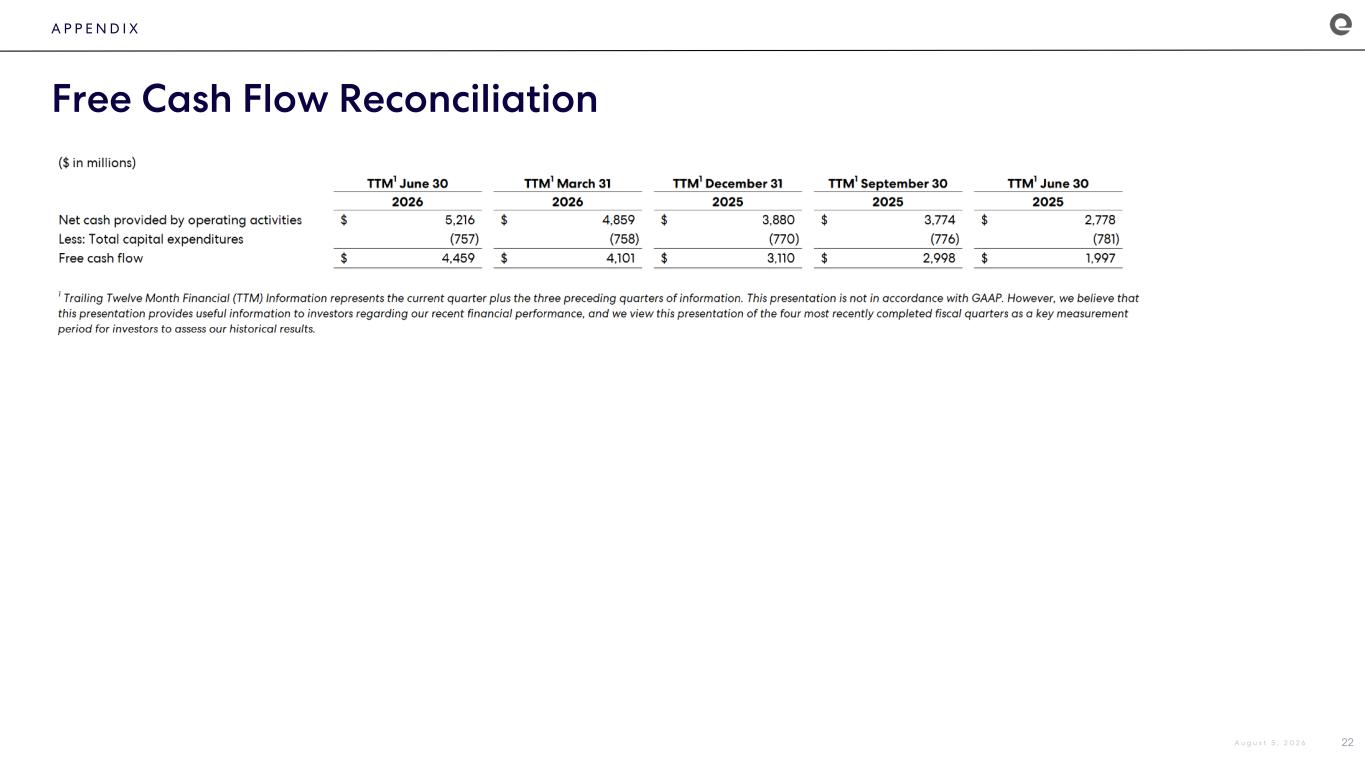
A P P E N D I X Free Cash Flow Reconciliation 22A u g u s t 5 , 2 0 2 6
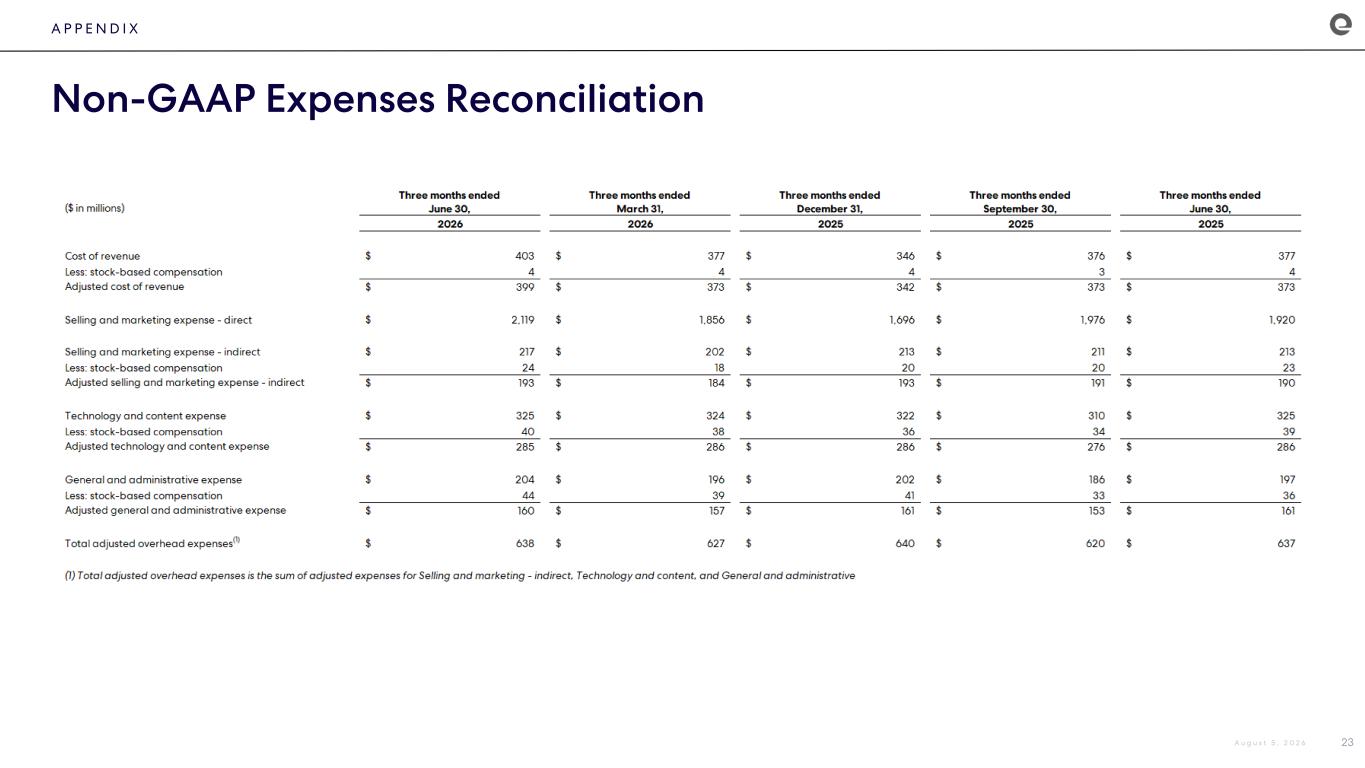
A P P E N D I X Non-GAAP Expenses Reconciliation 23A u g u s t 5 , 2 0 2 6