Exhibit 99.2 2026 INVESTOR DAY AU G U S T 5 | N E W YO R K C I TY
Welcome and Opening Remarks Andy Larkin | VP, INVESTOR RELATIONS 2 0 2 6 I N V E S T O R D A Y
Forward-Looking Statements This presentation contains forward-looking statements within the meaning of the federal securities laws with respect to the expected benefits of the recent acquisitions of Concrete Pipe & Precast (“CP&P”) and Foley Products Company (“Foley”), general economic conditions, key macro-economic drivers that impact our business, the effects of ongoing trade actions, the effects of continued pressure on the liquidity of our customers, potential synergies and growth provided by acquisitions and strategic investments, the performance of the precast business, demand for our products, shipment volumes, metal margins, backlog volumes, the ability to operate our steel mills at full capacity particularly during periods of domestic mill start-ups, future availability and cost of supplies of raw materials and energy for our operations, growth rates in certain reportable segments, product margins within our Construction Solutions Group segment, share repurchases, legal proceedings, construction activity, international trade, the impact of geopolitical conditions, the effects of CBAM and other EU trade measures on European demand and pricing, capital expenditures, tax credits, the timing, amount and recurrence of CO2 or emissions-related credits, our liquidity and our ability to satisfy future liquidity requirements, our ability to achieve our stated deleveraging target within the anticipated timeframe, estimated contractual obligations, the expected capabilities and benefits of new facilities, anticipated benefits and the timeline for execution of our growth plan and initiatives, including our Transform, Advance and Grow (“TAG”) operational and commercial excellence program, our long-term financial targets and expectations for future financial performance and our expectations or beliefs concerning future events. The statements in this presentation that are not historical statements, are forward-looking statements. These forward-looking statements can generally be identified by phrases such as we or our management “expects,” “anticipates,” “believes,” “estimates,” “intends,” “may,” “plans to,” “ought,” “could,” “will,” “should,” “likely,” “appears,” “projects,” “forecasts,” “outlook” or other similar words or phrases, as well as by discussions of strategy, plans or intentions. Our forward-looking statements are based on management’s expectations and beliefs as of the date of this presentation. Although we believe that our expectations are reasonable, we can give no assurance that these expectations will prove to have been correct, and actual results may vary materially. Except as required by law, we undertake no obligation to update, amend or clarify any forward-looking statements to reflect changed assumptions, the occurrence of anticipated or unanticipated events, new information or circumstances or any other changes. Important factors that could cause actual results to differ materially from our expectations include those described in our filings with the Securities and Exchange Commission, including, but not limited to, in Part I, Item 1A, “Risk Factors” of our annual report on Form 10-K for the fiscal year ended August 31, 2025, as well as the following: changes in economic conditions which affect demand for our products or construction activity generally, and the impact of such changes on the highly cyclical steel industry; rapid and significant changes in the price of metals, potentially impairing our inventory values due to declines in commodity prices or reducing the profitability of downstream contracts within our vertically integrated steel operations due to rising commodity pricing; excess capacity in our industry, particularly in China, and product availability from competing steel mills and other steel suppliers including import quantities and pricing; the impact of additional steelmaking capacity expected to come online from a number of electric arc furnace projects in the U.S.; the impact of geopolitical conditions, including political turmoil and volatility, regional conflicts, terrorism and war on the global economy, inflation, energy supplies and raw materials; increased attention to environmental, social and governance (“ESG”) matters, including any targets or other ESG, environmental justice or regulatory initiatives; operating and startup risks, as well as market risks associated with the commissioning of new projects could prevent us from realizing anticipated benefits and could result in a loss of all or a substantial part of our investments; impacts from global public health crises on the economy, demand for our products, global supply chain and on our operations; compliance with and changes in existing and future laws, regulations and other legal requirements and judicial decisions that govern our business, including increased environmental regulations associated with climate change and greenhouse gas emissions; involvement in various environmental matters that may result in fines, penalties or judgments; evolving remediation technology, changing regulations, possible third-party contributions, the inherent uncertainties of the estimation process and other factors that may impact amounts accrued for environmental liabilities; potential limitations in our or our customers' abilities to access credit and non-compliance with their contractual obligations, including payment obligations; activity in repurchasing shares of our common stock under our share repurchase program; financial and non-financial covenants and restrictions on the operation of our business contained in agreements governing our debt; our ability to successfully identify, consummate and integrate acquisitions and realize any or all of the anticipated synergies or other benefits of acquisitions; the effects that acquisitions may have on our financial leverage; risks associated with acquisitions generally, such as the inability to obtain, or delays in obtaining, required approvals under applicable antitrust legislation and other regulatory and third-party consents and approvals; lower than expected future levels of revenues and higher than expected future costs; failure or inability to implement growth strategies in a timely manner; the impact of goodwill or other indefinite-lived intangible asset impairment charges; the impact of long-lived asset impairment charges; currency fluctuations; global factors, such as trade measures, military conflicts and political uncertainties, including changes to current trade regulations, such as Section 232 trade tariffs and quotas, tax legislation and other regulations which might adversely impact our business; availability and pricing of electricity, electrodes and natural gas for mill operations; our ability to hire and retain key executives and other employees; competition from other materials or from competitors that have a lower cost structure or access to greater financial resources; information technology interruptions and breaches in security; our ability to make necessary capital expenditures; availability and pricing of raw materials and other items over which we exert little influence, including scrap metal, energy and insurance; unexpected equipment failures; losses or limited potential gains due to hedging transactions; litigation claims and settlements, court decisions, regulatory rulings and legal compliance risks, including risks related to the unfavorable judgment against us in the Pacific Steel Group (“PSG”) litigation; risk of injury or death to employees, customers or other visitors to our operations; and civil unrest, protests and riots. This presentation includes illustrative financial information with respect to the Company’s precast concrete and concrete pipe products business (together, the “precast platform”), which information is estimated based on historical results of CP&P and Foley. This information is presented for illustrative purposes only and is based on available information and certain assumptions and estimates that we believe are reasonable. The illustrative precast platform financial information presented herein has not been prepared and presented in accordance with the requirements of Regulation S-X. The assumptions and estimates underlying the precast platform financial information are inherently uncertain and are subject to a variety of significant business, economic and competitive risks and uncertainties that could cause actual results to differ materially from those contained in the illustrative financial information, including the risks and uncertainties described above. The illustrative precast platform financial information may not necessarily reflect what the precast platform’s results of operations and financial position will be in the future. The Company’s auditors have not audited, reviewed, compiled or performed any procedures with respect to the illustrative precast platform financial information. 2 0 2 6 I N V E S T O R D A Y 2
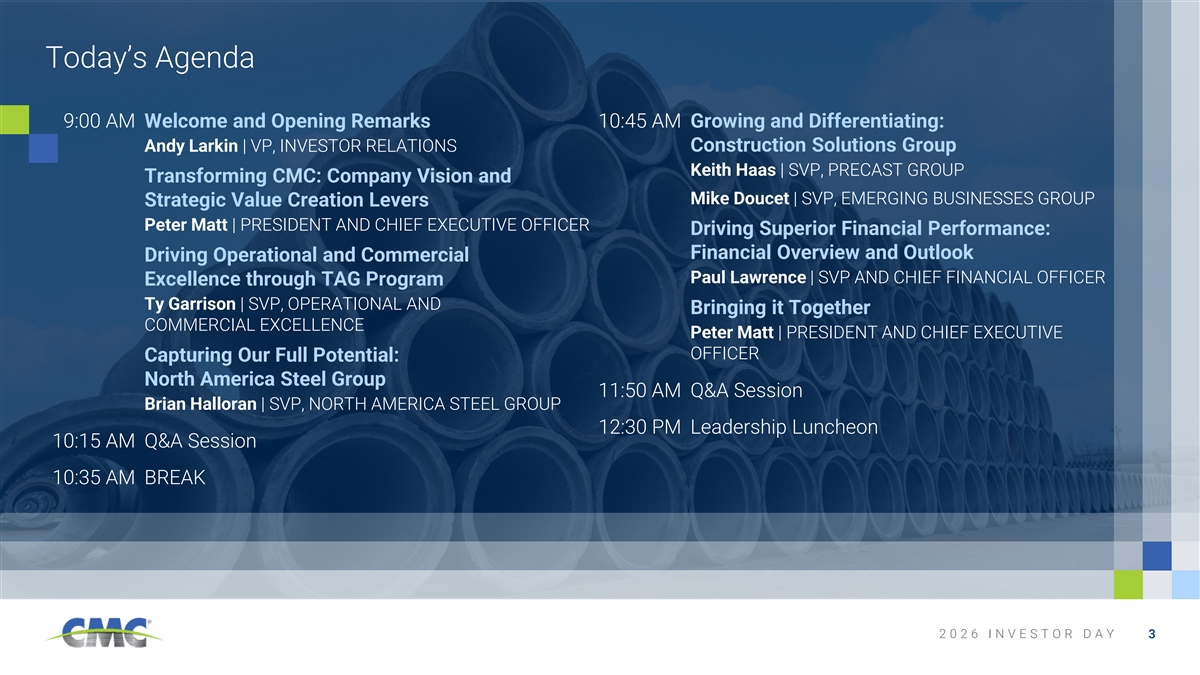
Today’s Agenda 9:00 AM Welcome and Opening Remarks 10:45 AM Growing and Differentiating: Construction Solutions Group Andy Larkin | VP, INVESTOR RELATIONS Keith Haas | SVP, PRECAST GROUP Transforming CMC: Company Vision and Mike Doucet | SVP, EMERGING BUSINESSES GROUP Strategic Value Creation Levers Peter Matt | PRESIDENT AND CHIEF EXECUTIVE OFFICER Driving Superior Financial Performance: Financial Overview and Outlook Driving Operational and Commercial Paul Lawrence | SVP AND CHIEF FINANCIAL OFFICER Excellence through TAG Program Ty Garrison | SVP, OPERATIONAL AND Bringing it Together COMMERCIAL EXCELLENCE Peter Matt | PRESIDENT AND CHIEF EXECUTIVE OFFICER Capturing Our Full Potential: North America Steel Group 11:50 AM Q&A Session Brian Halloran | SVP, NORTH AMERICA STEEL GROUP 12:30 PM Leadership Luncheon 10:15 AM Q&A Session 10:35 AM BREAK 2 0 2 6 I N V E S T O R D A Y 3
CMC Sizzle Reel 2 0 2 6 I N V E S T O R D A Y 4
Transforming CMC: Company Vision and Strategic Value Creation Levers Peter Matt | PRESIDENT AND CHIEF EXECUTIVE OFFICER 2 0 2 6 I N V E S T O R D A Y
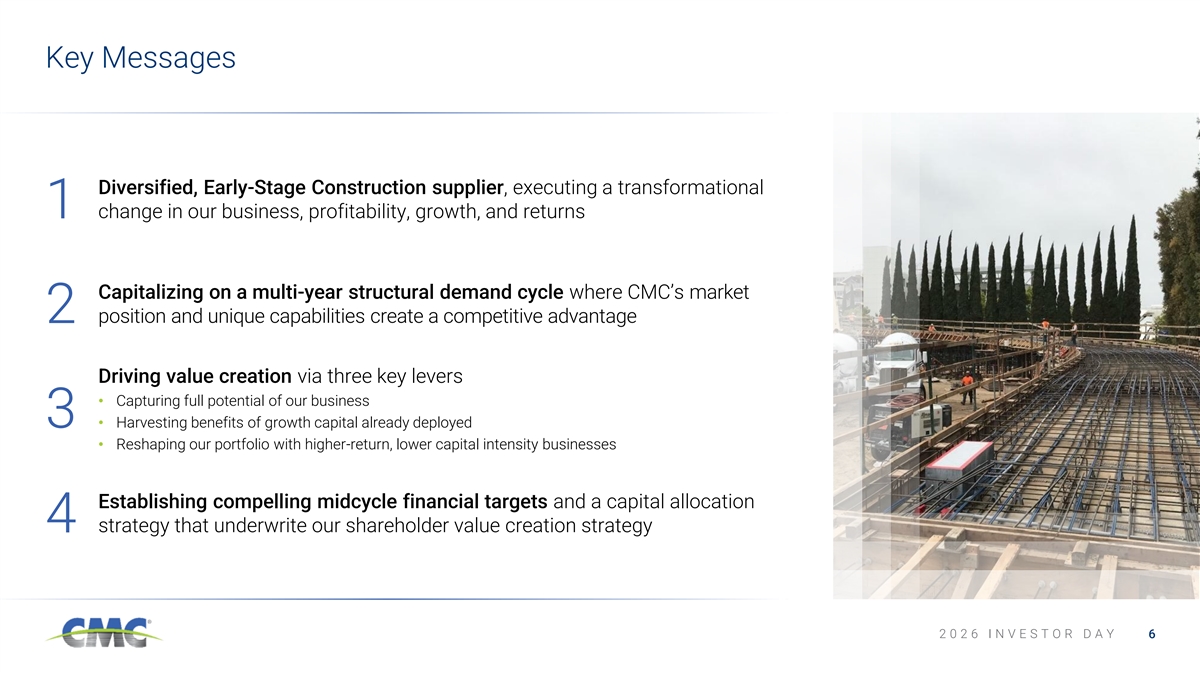
Key Messages Diversified, Early-Stage Construction supplier, executing a transformational 1 change in our business, profitability, growth, and returns Capitalizing on a multi-year structural demand cycle where CMC’s market position and unique capabilities create a competitive advantage 2 Driving value creation via three key levers • Capturing full potential of our business 3• Harvesting benefits of growth capital already deployed • Reshaping our portfolio with higher-return, lower capital intensity businesses Establishing compelling midcycle financial targets and a capital allocation 4 strategy that underwrite our shareholder value creation strategy 2 0 2 6 I N V E S T O R D A Y 6
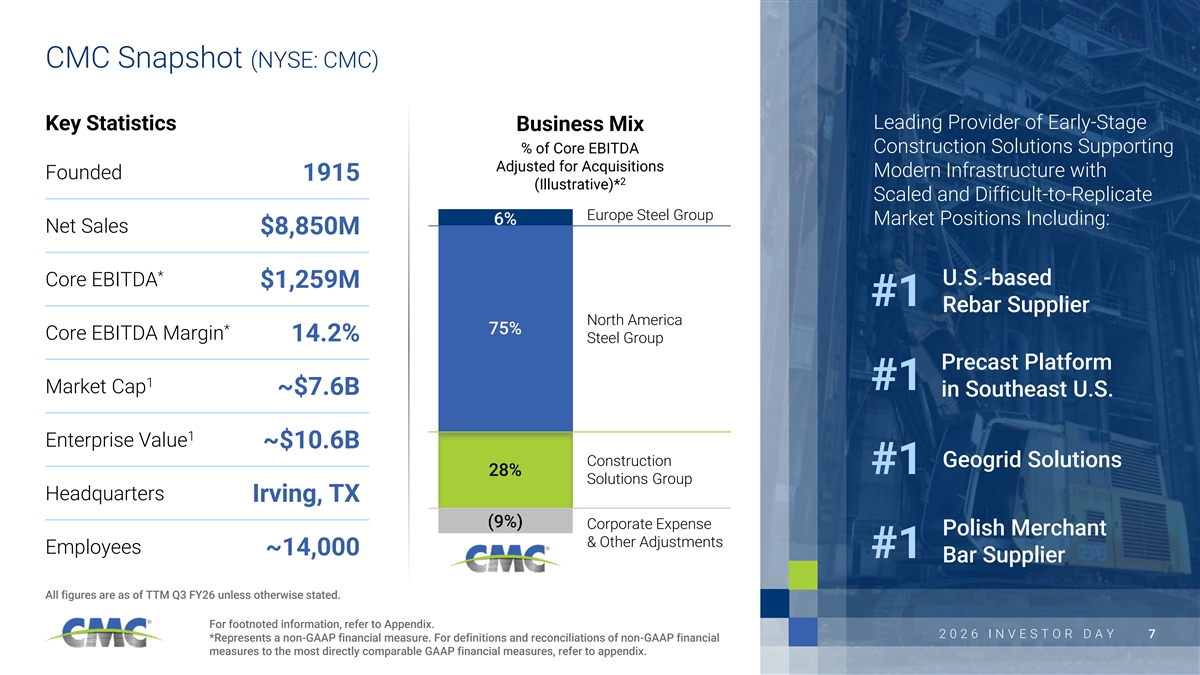
CMC Snapshot (NYSE: CMC) Leading Provider of Early-Stage Key Statistics Business Mix % of Core EBITDA Construction Solutions Supporting Adjusted for Acquisitions Modern Infrastructure with Founded 1915 2 (Illustrative)* Scaled and Difficult-to-Replicate Europe Steel Group 6% Market Positions Including: Net Sales $8,850M * U.S.-based Core EBITDA $1,259M #1 Rebar Supplier North America * 75% Core EBITDA Margin 14.2% Steel Group Precast Platform 1 #1 Market Cap ~$7.6B in Southeast U.S. 1 Enterprise Value ~$10.6B Construction Geogrid Solutions #1 28% Solutions Group Headquarters Irving, TX Category 1 (9%) Corporate Expense Polish Merchant & Other Adjustments Employees ~14,000 #1 Bar Supplier All figures are as of TTM Q3 FY26 unless otherwise stated. For footnoted information, refer to Appendix. 2 2 0 0 2 2 6 6 I I N N V V E E S S T T O O R R D D A A Y Y 7 *Represents a non-GAAP financial measure. For definitions and reconciliations of non-GAAP financial measures to the most directly comparable GAAP financial measures, refer to appendix.
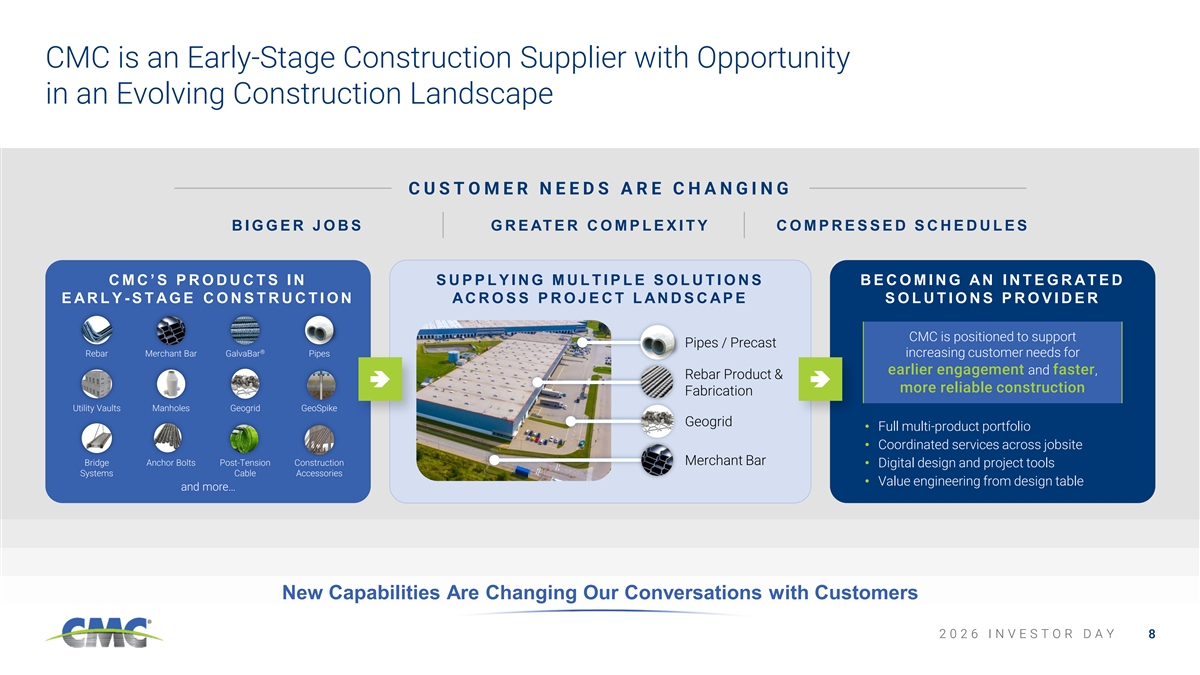
CMC is an Early-Stage Construction Supplier with Opportunity in an Evolving Construction Landscape C U S T O M E R N E E D S A R E C H A N G I N G B I G G E R J O B S G R E AT E R C O M P L E X I T Y C O M P R E S S E D S C H E D U L E S C M C ’ S P R O D U C T S I N S U P P L Y I N G M U L T I P L E S O L U T I O N S B E C O M I N G AN I N T E G R AT E D E AR L Y - S T AG E C O N S T R U C T I O N AC R O S S P R O J E C T L AN D S C AP E S O L U T I O N S P R O V I D E R CMC is positioned to support Pipes / Precast ® Rebar Merchant Bar GalvaBar Pipes increasing customer needs for earlier engagement and faster, Rebar Product & more reliable construction Fabrication Utility Vaults Manholes Geogrid GeoSpike Geogrid • Full multi-product portfolio • Coordinated services across jobsite Merchant Bar Bridge Anchor Bolts Post-Tension Construction • Digital design and project tools Systems Cable Accessories • Value engineering from design table and more… New Capabilities Are Changing Our Conversations with Customers 2 2 0 0 2 2 6 6 I I N N V V E E S S T T O O R R D D A A Y Y 8 8
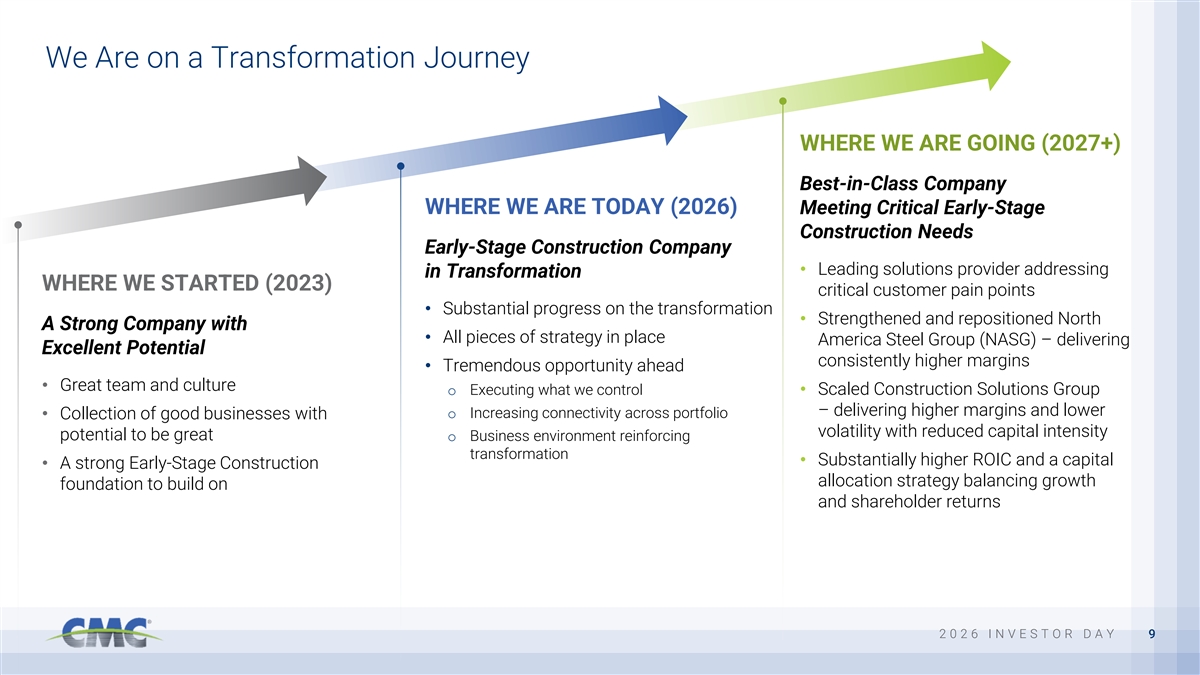
We Are on a Transformation Journey WHERE WE ARE GOING (2027+) Best-in-Class Company WHERE WE ARE TODAY (2026) Meeting Critical Early-Stage Construction Needs Early-Stage Construction Company • Leading solutions provider addressing in Transformation WHERE WE STARTED (2023) critical customer pain points • Substantial progress on the transformation • Strengthened and repositioned North A Strong Company with • All pieces of strategy in place America Steel Group (NASG) – delivering Excellent Potential consistently higher margins • Tremendous opportunity ahead • Great team and culture o Executing what we control• Scaled Construction Solutions Group – delivering higher margins and lower o Increasing connectivity across portfolio • Collection of good businesses with volatility with reduced capital intensity potential to be great o Business environment reinforcing transformation • Substantially higher ROIC and a capital • A strong Early-Stage Construction allocation strategy balancing growth foundation to build on and shareholder returns 2 2 0 0 2 2 6 6 I I N N V V E E S S T T O O R R D D A A Y Y 9
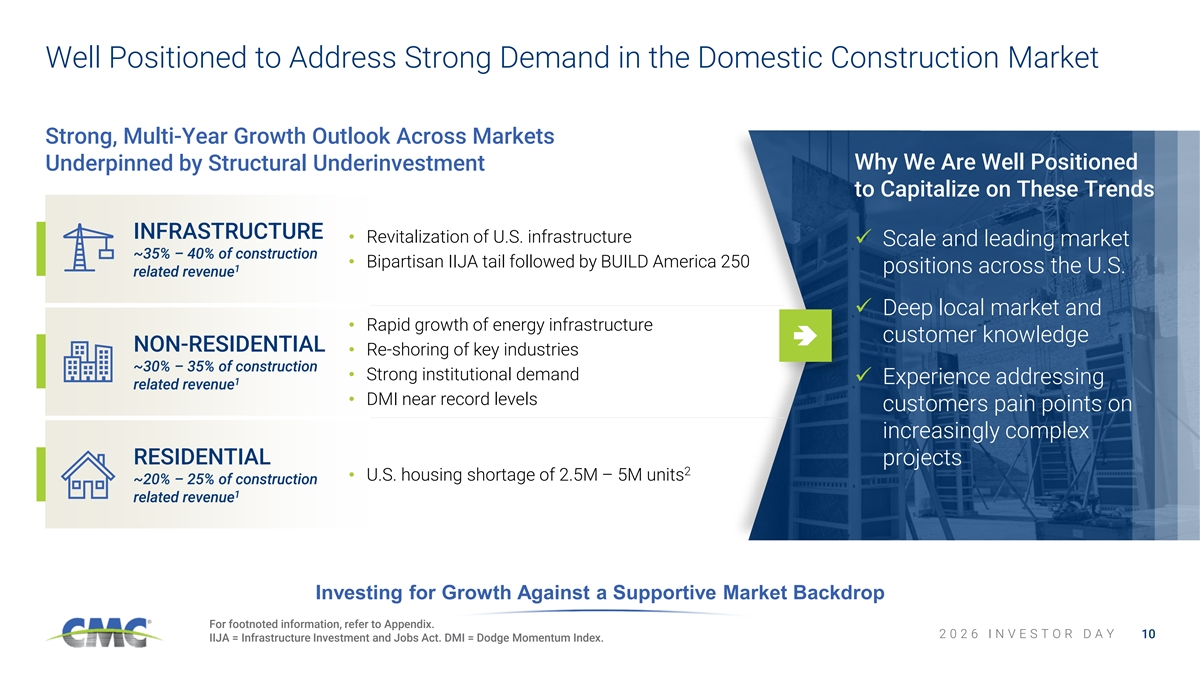
Well Positioned to Address Strong Demand in the Domestic Construction Market Strong, Multi-Year Growth Outlook Across Markets Why We Are Well Positioned Underpinned by Structural Underinvestment to Capitalize on These Trends INFRASTRUCTURE • Revitalization of U.S. infrastructure ✓ Scale and leading market ~35% – 40% of construction • Bipartisan IIJA tail followed by BUILD America 250 1 positions across the U.S. related revenue ✓ Deep local market and • Rapid growth of energy infrastructure customer knowledge NON-RESIDENTIAL • Re-shoring of key industries ~30% – 35% of construction • Strong institutional demand ✓ Experience addressing 1 related revenue • DMI near record levels customers pain points on increasingly complex RESIDENTIAL projects 2 • U.S. housing shortage of 2.5M – 5M units ~20% – 25% of construction 1 related revenue Investing for Growth Against a Supportive Market Backdrop For footnoted information, refer to Appendix. 2 0 2 6 I N V E S T O R D A Y 10 IIJA = Infrastructure Investment and Jobs Act. DMI = Dodge Momentum Index.
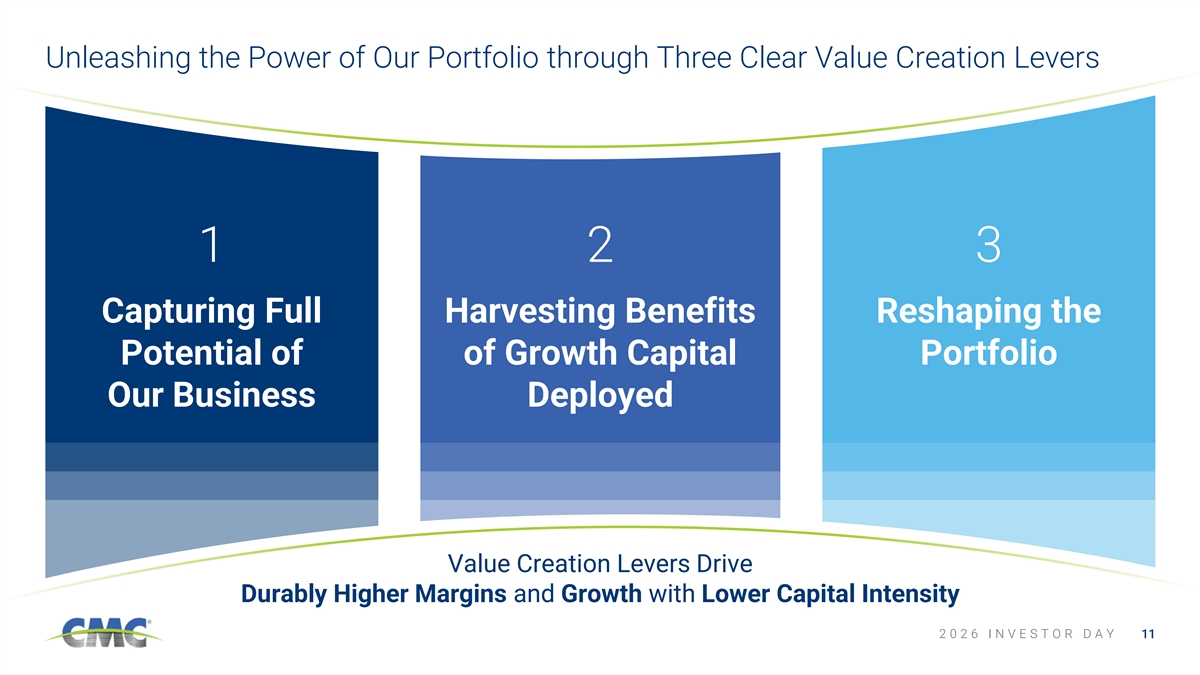
Unleashing the Power of Our Portfolio through Three Clear Value Creation Levers 1 2 3 Capturing Full Harvesting Benefits Reshaping the Potential of of Growth Capital Portfolio Our Business Deployed Value Creation Levers Drive Durably Higher Margins and Growth with Lower Capital Intensity 2 0 2 6 I N V E S T O R D A Y 11
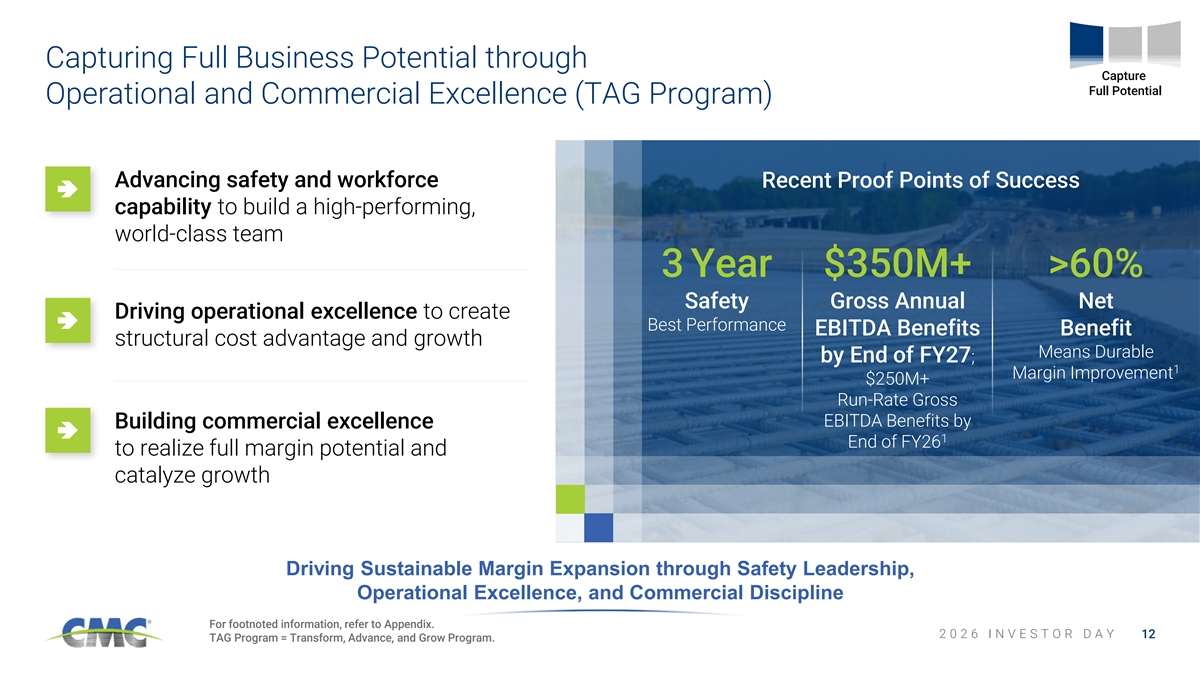
Capturing Full Business Potential through Capture Full Potential Operational and Commercial Excellence (TAG Program) Advancing safety and workforce Recent Proof Points of Success capability to build a high-performing, world-class team 3 Year $350M+ >60% Safety Gross Annual Net Driving operational excellence to create Best Performance EBITDA Benefits Benefit structural cost advantage and growth Means Durable by End of FY27; 1 Margin Improvement $250M+ Run-Rate Gross EBITDA Benefits by Building commercial excellence 1 End of FY26 to realize full margin potential and catalyze growth Driving Sustainable Margin Expansion through Safety Leadership, Operational Excellence, and Commercial Discipline For footnoted information, refer to Appendix. 2 0 2 6 I N V E S T O R D A Y 12 TAG Program = Transform, Advance, and Grow Program.
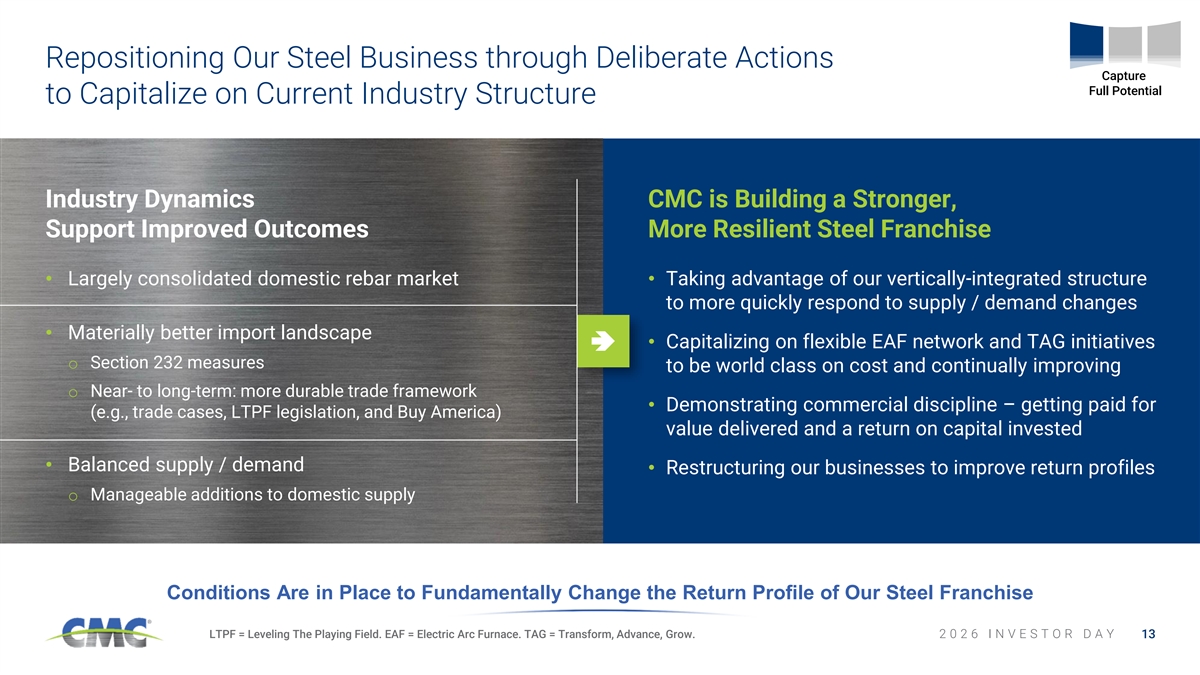
Repositioning Our Steel Business through Deliberate Actions Capture Full Potential to Capitalize on Current Industry Structure Industry Dynamics CMC is Building a Stronger, Support Improved Outcomes More Resilient Steel Franchise • Largely consolidated domestic rebar market• Taking advantage of our vertically-integrated structure to more quickly respond to supply / demand changes • Materially better import landscape • Capitalizing on flexible EAF network and TAG initiatives o Section 232 measures to be world class on cost and continually improving o Near- to long-term: more durable trade framework • Demonstrating commercial discipline – getting paid for (e.g., trade cases, LTPF legislation, and Buy America) value delivered and a return on capital invested • Balanced supply / demand • Restructuring our businesses to improve return profiles o Manageable additions to domestic supply Conditions Are in Place to Fundamentally Change the Return Profile of Our Steel Franchise LTPF = Leveling The Playing Field. EAF = Electric Arc Furnace. TAG = Transform, Advance, Grow. 2 0 2 6 I N V E S T O R D A Y 13
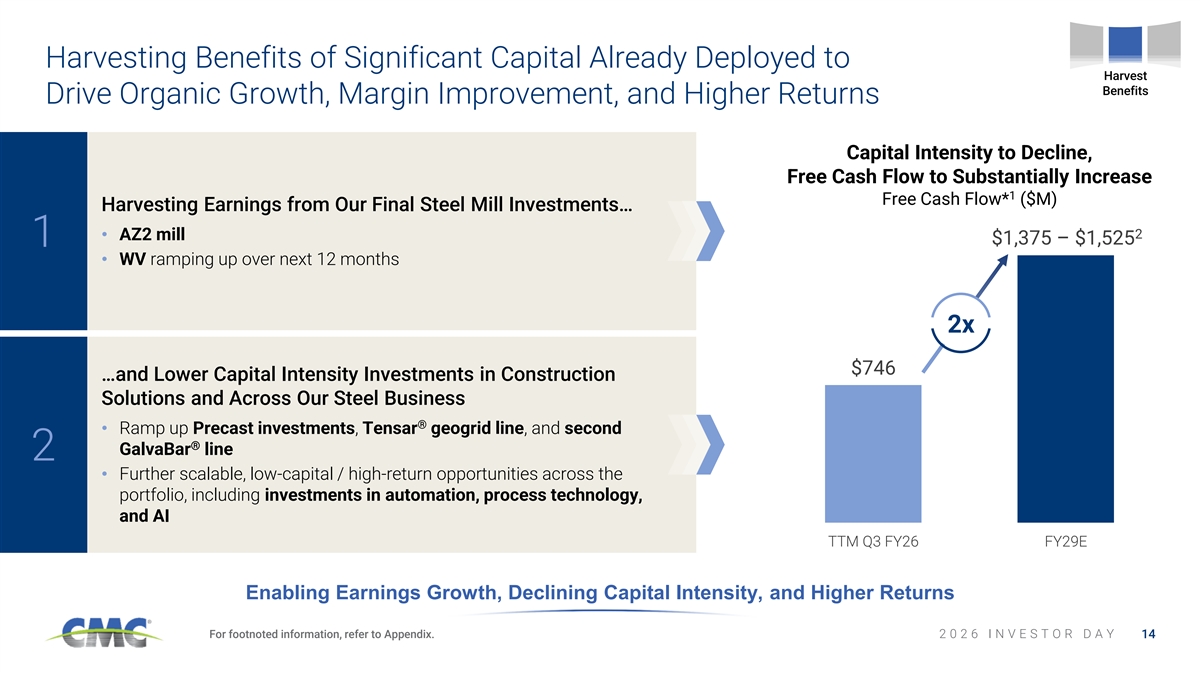
Harvesting Benefits of Significant Capital Already Deployed to Harvest Benefits Drive Organic Growth, Margin Improvement, and Higher Returns Capital Intensity to Decline, Free Cash Flow to Substantially Increase 1 Free Cash Flow* ($M) Harvesting Earnings from Our Final Steel Mill Investments… $1,600 2 • AZ2 mill $1,375 – $1,525 1 • WV ramping up over next 12 months $1,400 $1,200 2x $1,000 $746 $800 …and Lower Capital Intensity Investments in Construction Solutions and Across Our Steel Business $600 ® • Ramp up Precast investments, Tensar geogrid line, and second ® $400 GalvaBar line 2 • Further scalable, low-capital / high-return opportunities across the $200 portfolio, including investments in automation, process technology, and AI $0 TTM Q3 FY26 FY29E Enabling Earnings Growth, Declining Capital Intensity, and Higher Returns For footnoted information, refer to Appendix. 2 0 2 6 I N V E S T O R D A Y 14
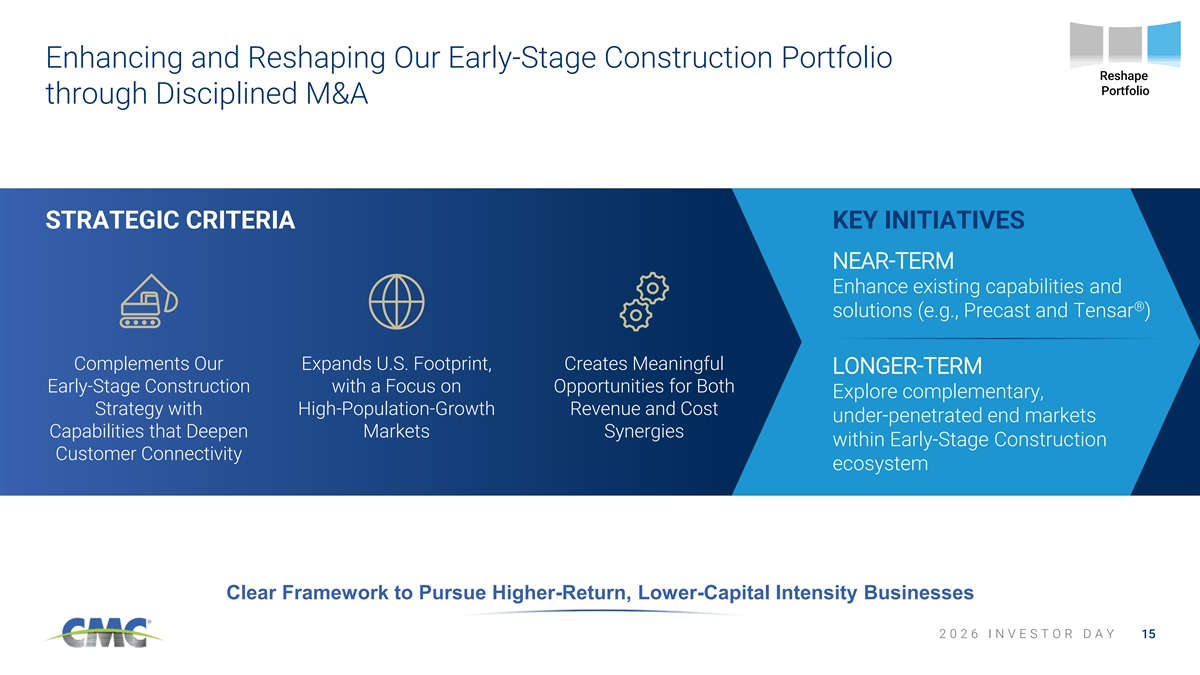
Enhancing and Reshaping Our Early-Stage Construction Portfolio Reshape Portfolio through Disciplined M&A STRATEGIC CRITERIA KEY INITIATIVES NEAR-TERM Enhance existing capabilities and ® solutions (e.g., Precast and Tensar ) Complements Our Expands U.S. Footprint, Creates Meaningful LONGER-TERM Early-Stage Construction with a Focus on Opportunities for Both Explore complementary, Strategy with High-Population-Growth Revenue and Cost under-penetrated end markets Capabilities that Deepen Markets Synergies within Early-Stage Construction Customer Connectivity ecosystem Clear Framework to Pursue Higher-Return, Lower-Capital Intensity Businesses 2 0 2 6 I N V E S T O R D A Y 15
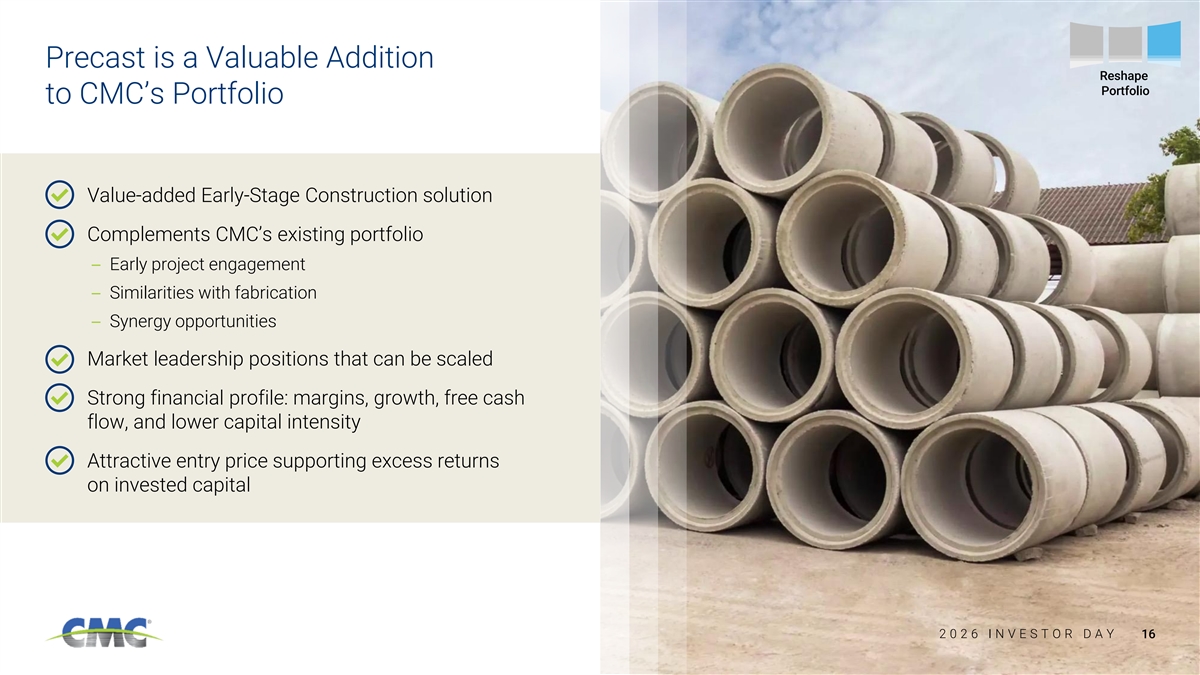
Precast is a Valuable Addition Reshape Portfolio to CMC’s Portfolio Value-added Early-Stage Construction solution Complements CMC’s existing portfolio – Early project engagement – Similarities with fabrication – Synergy opportunities Market leadership positions that can be scaled Strong financial profile: margins, growth, free cash flow, and lower capital intensity Attractive entry price supporting excess returns on invested capital 2 2 0 0 2 2 6 6 I I N N V V E E S S T T O O R R D D A A Y Y 16
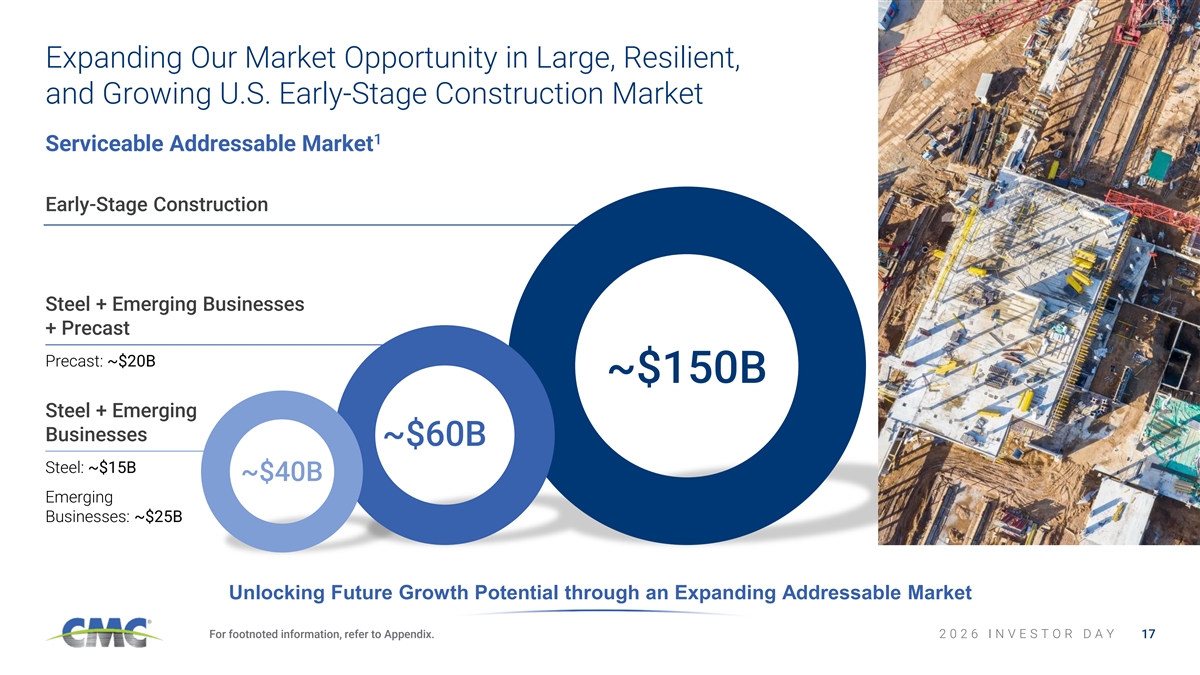
Expanding Our Market Opportunity in Large, Resilient, and Growing U.S. Early-Stage Construction Market 1 Serviceable Addressable Market Early-Stage Construction Steel + Emerging Businesses + Precast Precast: ~$20B ~$150B Steel + Emerging Businesses ~$60B Steel: ~$15B ~$40B Emerging Businesses: ~$25B Unlocking Future Growth Potential through an Expanding Addressable Market For footnoted information, refer to Appendix. 2 0 2 6 I N V E S T O R D A Y 17
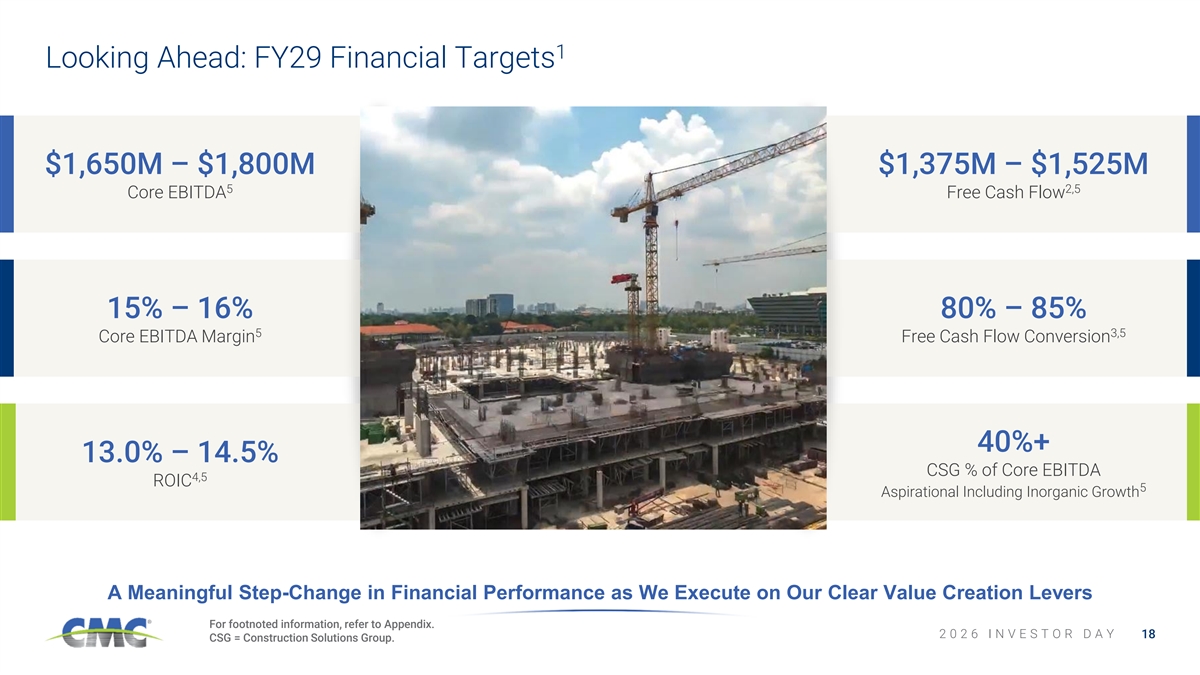
1 Looking Ahead: FY29 Financial Targets $1,650M – $1,800M $1,375M – $1,525M 5 2,5 Core EBITDA Free Cash Flow 15% – 16% 80% – 85% 5 3,5 Core EBITDA Margin Free Cash Flow Conversion 40%+ 13.0% – 14.5% CSG % of Core EBITDA 4,5 ROIC 5 Aspirational Including Inorganic Growth A Meaningful Step-Change in Financial Performance as We Execute on Our Clear Value Creation Levers For footnoted information, refer to Appendix. 2 0 2 6 I N V E S T O R D A Y 18 CSG = Construction Solutions Group.
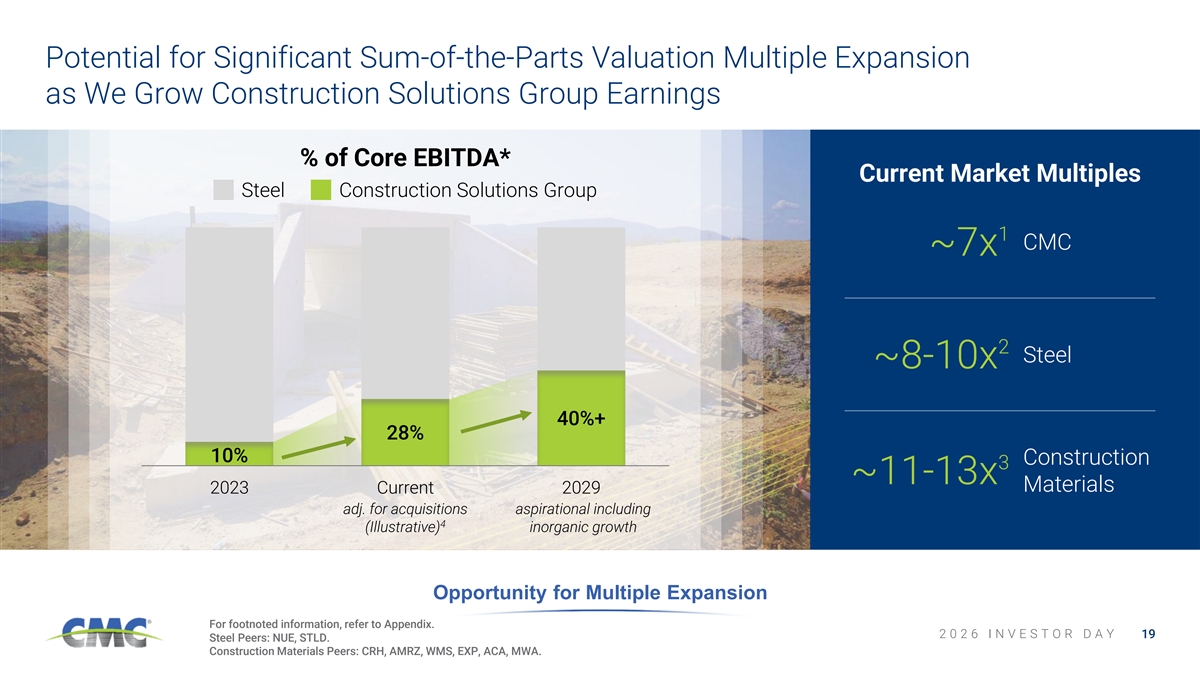
Potential for Significant Sum-of-the-Parts Valuation Multiple Expansion as We Grow Construction Solutions Group Earnings % of Core EBITDA* Current Market Multiples Steel Construction Solutions Group 1 CMC ~7x 2 Steel ~8-10x 40%+ 28% 10% Construction 3 ~11-13x Materials 2023 Current 2029 adj. for acquisitions aspirational including 4 (Illustrative) inorganic growth Opportunity for Multiple Expansion For footnoted information, refer to Appendix. 2 0 2 6 I N V E S T O R D A Y 19 Steel Peers: NUE, STLD. Construction Materials Peers: CRH, AMRZ, WMS, EXP, ACA, MWA.
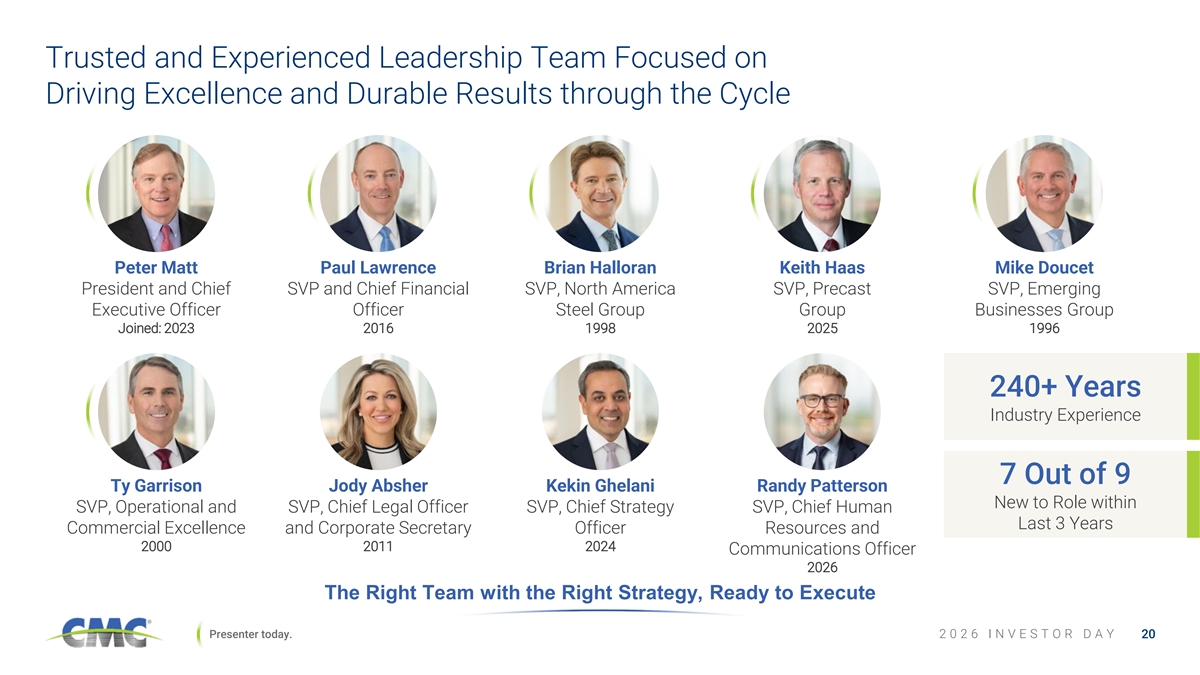
Trusted and Experienced Leadership Team Focused on Driving Excellence and Durable Results through the Cycle Peter Matt Paul Lawrence Brian Halloran Keith Haas Mike Doucet President and Chief SVP and Chief Financial SVP, North America SVP, Precast SVP, Emerging Executive Officer Officer Steel Group Group Businesses Group Joined: 2023 2016 1998 2025 1996 240+ Years Industry Experience 7 Out of 9 Ty Garrison Jody Absher Kekin Ghelani Randy Patterson New to Role within SVP, Operational and SVP, Chief Legal Officer SVP, Chief Strategy SVP, Chief Human Last 3 Years Commercial Excellence and Corporate Secretary Officer Resources and 2000 2011 2024 Communications Officer 2026 The Right Team with the Right Strategy, Ready to Execute Presenter today. 2 0 2 6 I N V E S T O R D A Y 20
Investment Thesis: A Market Leader Driving Significant Stakeholder Value Creation In Early-Stage Construction with leading, difficult-to- Industry Leader replicate positions in attractive markets Undergoing Focused on improving margins / returns and opening exciting, new growth lanes Transformation Driving Durable Supporting step change in profitability through ongoing focus on commercial and operational excellence Margin Expansion Through multi-year demand trends, TAG, organic Growth growth, and portfolio extensions Delivering Strong Enabled by enhanced earnings and cash flow generation with disciplined capital deployment Shareholder Returns Driving Increased ROIC and Capital Returns 2 2 0 0 2 2 6 6 I I N N V V E E S S T T O O R R D D A A Y Y 21
Driving Operational and Commercial Excellence through TAG Program Ty Garrison | SVP, OPERATIONAL AND COMMERCIAL EXCELLENCE 2 0 2 6 I N V E S T O R D A Y
Key Messages Leveraging TAG program as the execution engine to convert opportunity 1 into measurable financial results Building durable operational and commercial excellence capabilities 2 to improve margin and cash flow generation Driving higher ROIC by enhancing capital deployment discipline across 3 the organization 2 0 2 6 I N V E S T O R D A Y 23
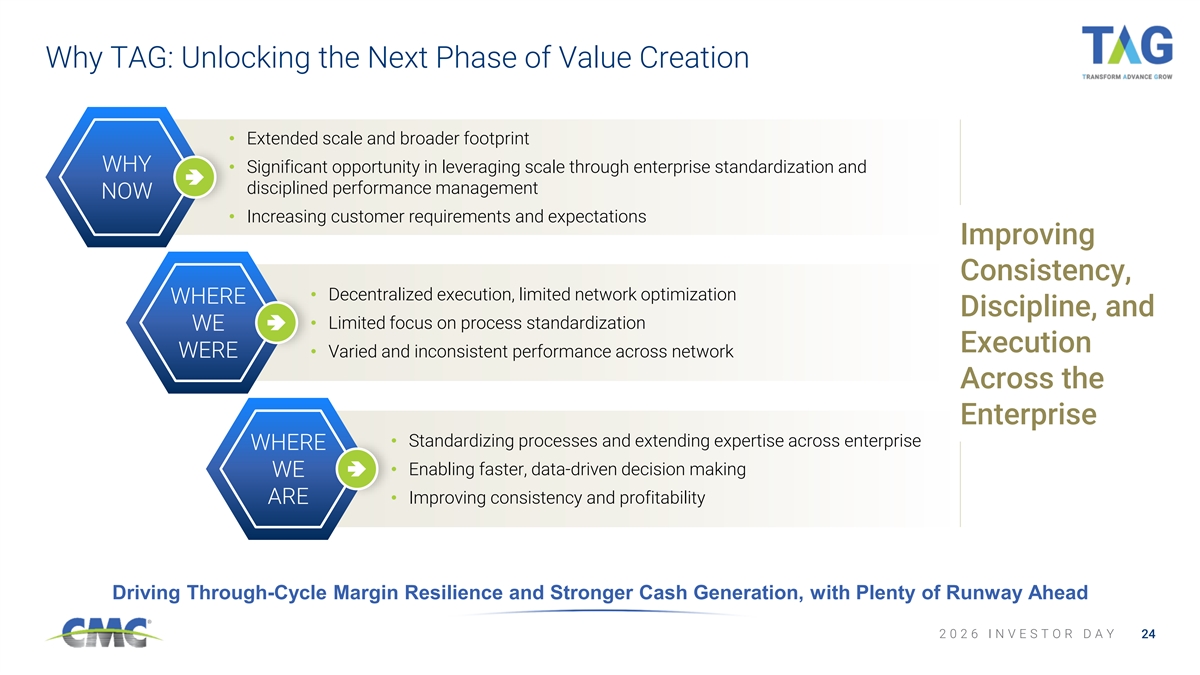
Why TAG: Unlocking the Next Phase of Value Creation • Extended scale and broader footprint WHY • Significant opportunity in leveraging scale through enterprise standardization and disciplined performance management NOW • Increasing customer requirements and expectations Improving Consistency, • Decentralized execution, limited network optimization WHERE Discipline, and • Limited focus on process standardization WE Execution WERE• Varied and inconsistent performance across network Across the Enterprise • Standardizing processes and extending expertise across enterprise WHERE • Enabling faster, data-driven decision making WE ARE• Improving consistency and profitability Driving Through-Cycle Margin Resilience and Stronger Cash Generation, with Plenty of Runway Ahead 2 0 2 6 I N V E S T O R D A Y 24
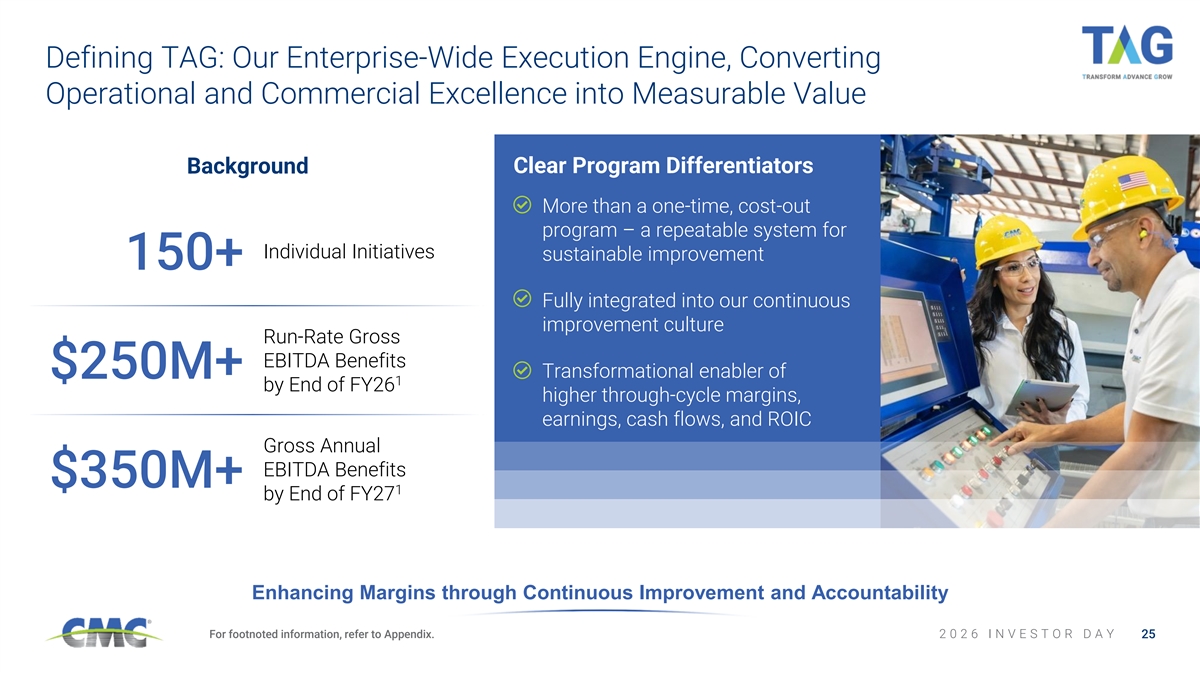
Defining TAG: Our Enterprise-Wide Execution Engine, Converting Operational and Commercial Excellence into Measurable Value Background Clear Program Differentiators More than a one-time, cost-out program – a repeatable system for Individual Initiatives sustainable improvement 150+ Fully integrated into our continuous improvement culture Run-Rate Gross EBITDA Benefits Transformational enabler of $250M+ 1 by End of FY26 higher through-cycle margins, earnings, cash flows, and ROIC Gross Annual EBITDA Benefits $350M+ 1 by End of FY27 Enhancing Margins through Continuous Improvement and Accountability For footnoted information, refer to Appendix. 2 0 2 6 I N V E S T O R D A Y 25
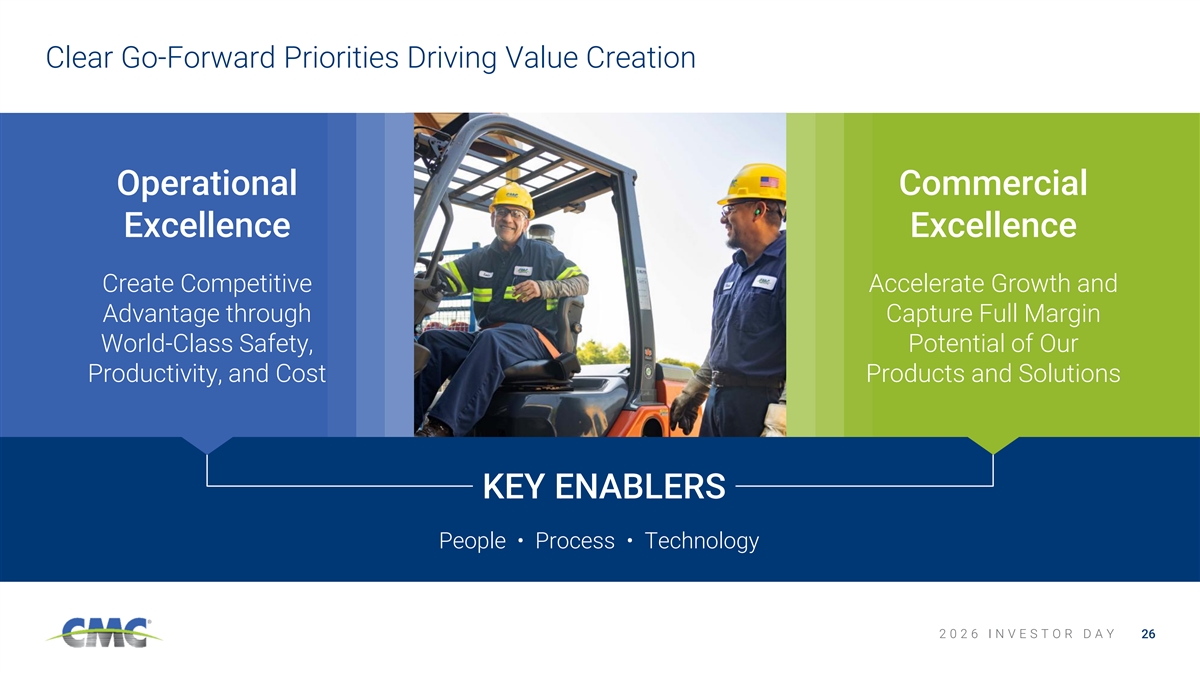
Clear Go-Forward Priorities Driving Value Creation Operational Commercial Excellence Excellence Create Competitive Accelerate Growth and Advantage through Capture Full Margin World-Class Safety, Potential of Our Productivity, and Cost Products and Solutions KEY ENABLERS People • Process • Technology 2 0 2 6 I N V E S T O R D A Y 26
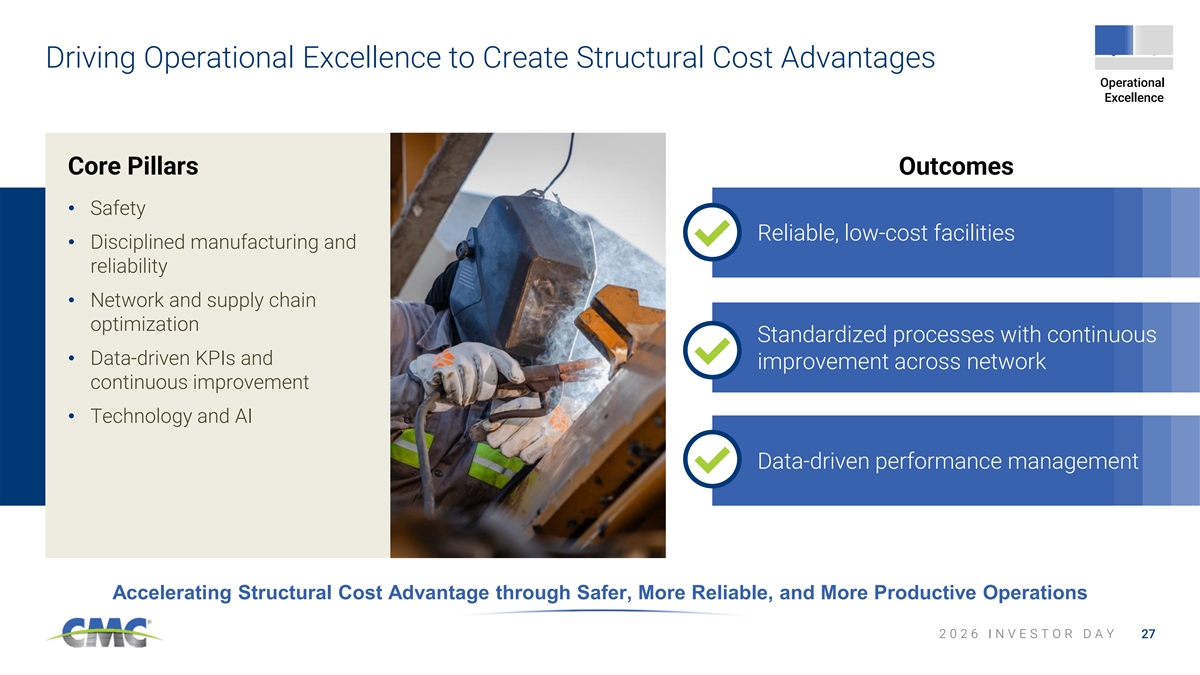
Driving Operational Excellence to Create Structural Cost Advantages Operational Excellence Core Pillars Outcomes • Safety Reliable, low-cost facilities • Disciplined manufacturing and reliability • Network and supply chain optimization Standardized processes with continuous • Data-driven KPIs and improvement across network continuous improvement • Technology and AI Data-driven performance management Accelerating Structural Cost Advantage through Safer, More Reliable, and More Productive Operations 2 0 2 6 I N V E S T O R D A Y 27
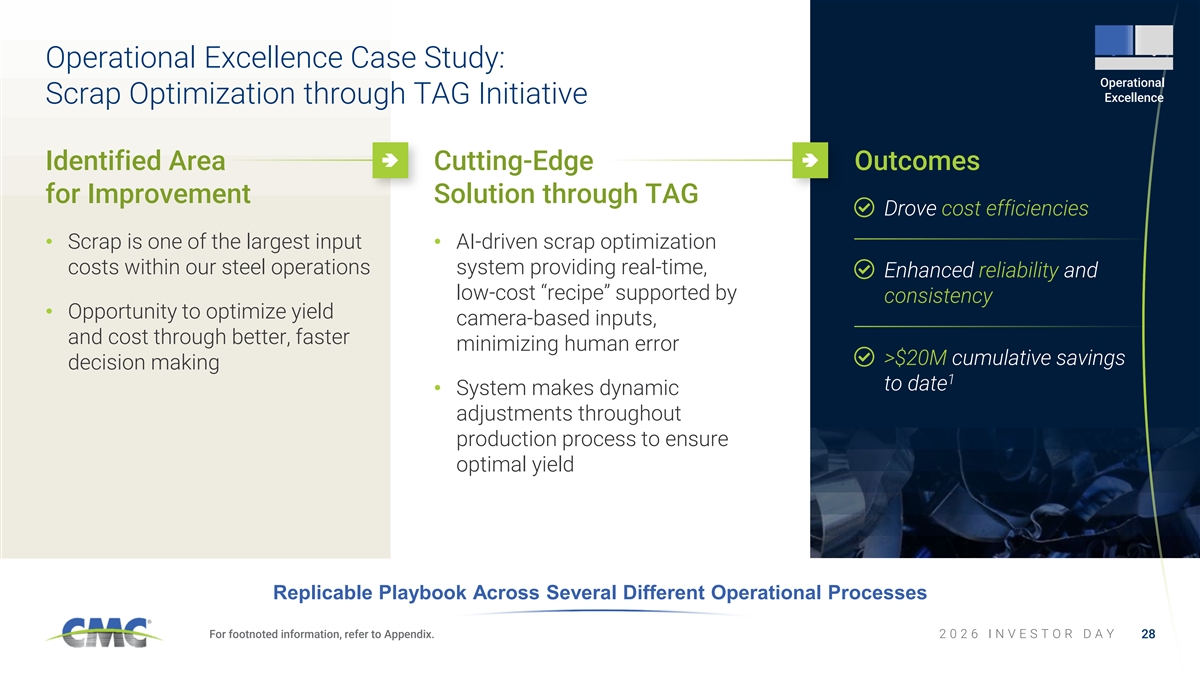
Operational Excellence Case Study: Operational Excellence Scrap Optimization through TAG Initiative Identified Area Cutting-Edge Outcomes for Improvement Solution through TAG Drove cost efficiencies • Scrap is one of the largest input • AI-driven scrap optimization costs within our steel operations system providing real-time, Enhanced reliability and low-cost “recipe” supported by consistency • Opportunity to optimize yield camera-based inputs, and cost through better, faster minimizing human error >$20M cumulative savings decision making 1 to date • System makes dynamic adjustments throughout production process to ensure optimal yield Replicable Playbook Across Several Different Operational Processes For footnoted information, refer to Appendix. 2 0 2 6 I N V E S T O R D A Y 28 28
Operational Excellence in Action Video: Operational Excellence Scrap Optimization through TAG Initiative 2 0 2 6 I N V E S T O R D A Y 29
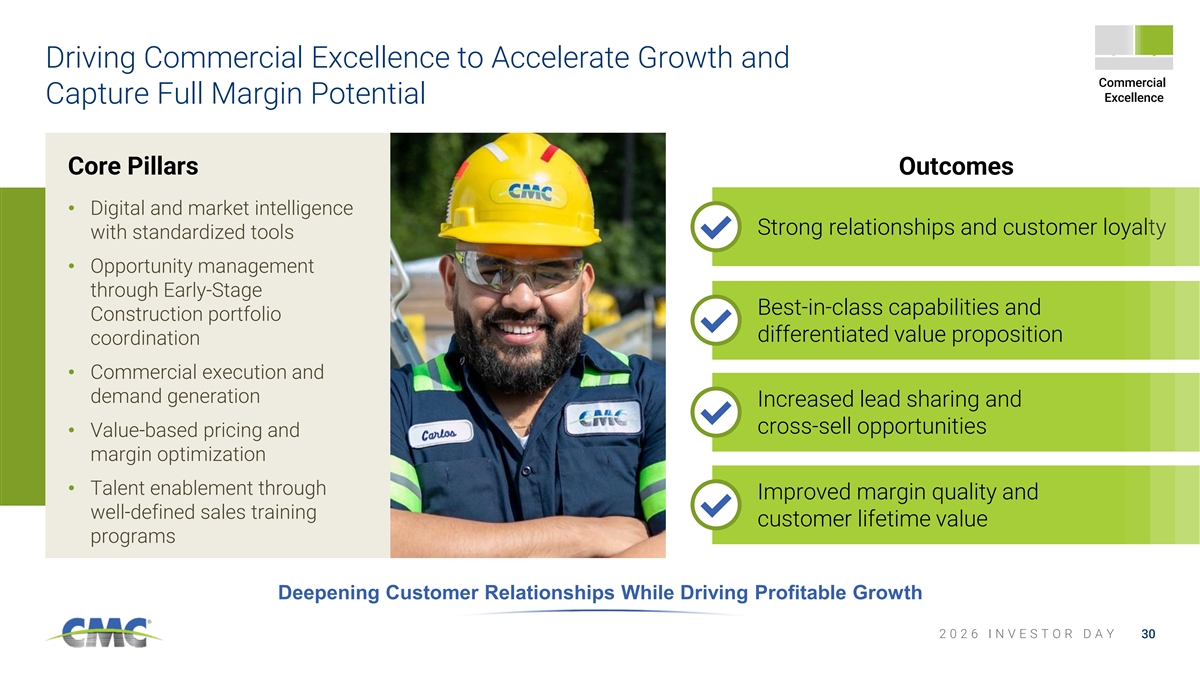
Driving Commercial Excellence to Accelerate Growth and Commercial Excellence Capture Full Margin Potential Core Pillars Outcomes • Digital and market intelligence Strong relationships and customer loyalty with standardized tools • Opportunity management through Early-Stage Best-in-class capabilities and Construction portfolio differentiated value proposition coordination • Commercial execution and demand generation Increased lead sharing and cross-sell opportunities • Value-based pricing and margin optimization • Talent enablement through Improved margin quality and well-defined sales training customer lifetime value programs Deepening Customer Relationships While Driving Profitable Growth 2 0 2 6 I N V E S T O R D A Y 30
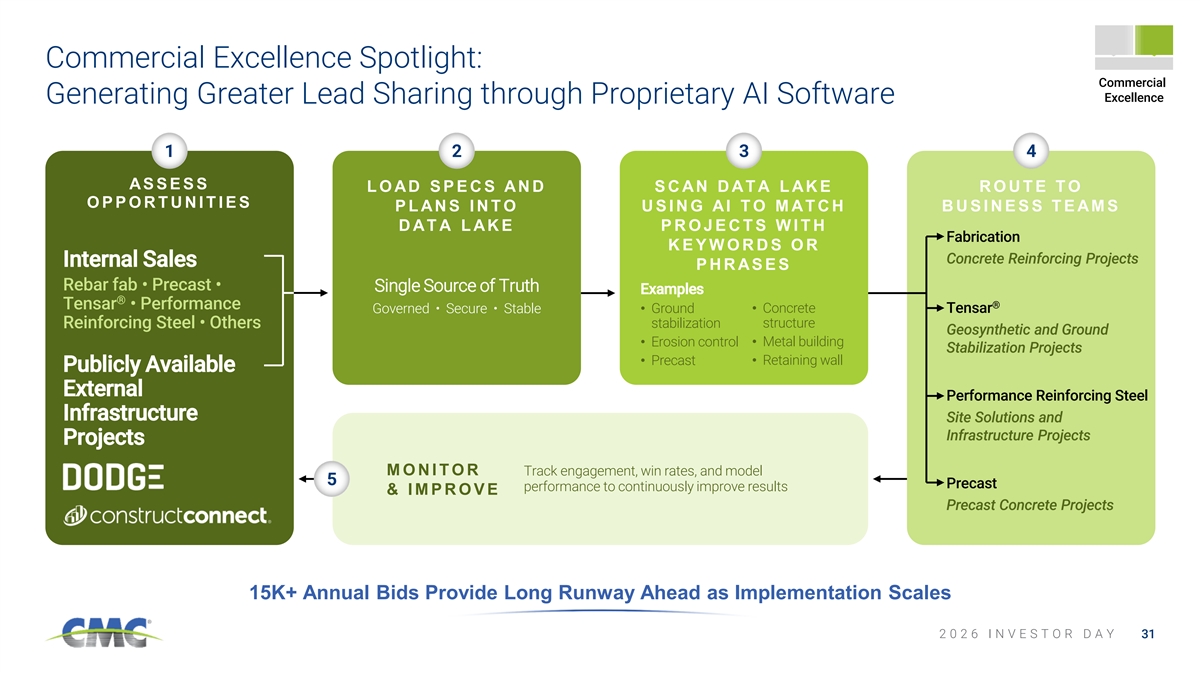
Commercial Excellence Spotlight: Commercial Excellence Generating Greater Lead Sharing through Proprietary AI Software 1 2 3 4 AS S E S S L O AD S P E C S AN D S C AN D AT A L AK E R O U T E T O OPPORTUNITIES P L AN S I N T O U S I N G AI T O M AT C H BUSINESS TEAMS D AT A L AK E PROJECTS WITH Fabrication KEYWORDS OR Concrete Reinforcing Projects Internal Sales P H R AS E S Rebar fab • Precast • Single Source of Truth Examples ® ® Tensar • Performance • Concrete Tensar Governed • Secure • Stable• Ground stabilization structure Reinforcing Steel • Others Geosynthetic and Ground • Erosion control• Metal building Stabilization Projects • Precast• Retaining wall Publicly Available External Performance Reinforcing Steel Infrastructure Site Solutions and Infrastructure Projects Projects M O N I T O R Track engagement, win rates, and model 5 Precast performance to continuously improve results & I M P R O V E Precast Concrete Projects 15K+ Annual Bids Provide Long Runway Ahead as Implementation Scales 2 0 2 6 I N V E S T O R D A Y 31
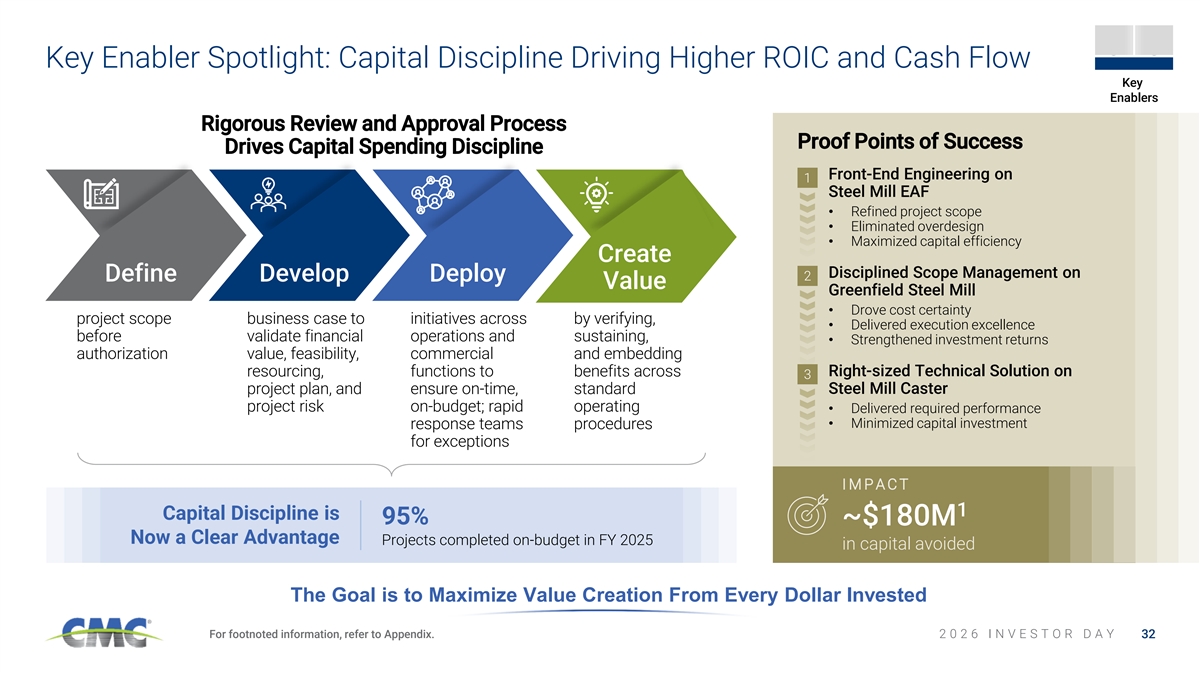
Key Enabler Spotlight: Capital Discipline Driving Higher ROIC and Cash Flow Key Enablers Rigorous Review and Approval Process Proof Points of Success Drives Capital Spending Discipline Front-End Engineering on 1 Steel Mill EAF • Refined project scope • Eliminated overdesign • Maximized capital efficiency Create Disciplined Scope Management on Define Develop Deploy 2 Value Greenfield Steel Mill • Drove cost certainty project scope business case to initiatives across by verifying, • Delivered execution excellence before validate financial operations and sustaining, • Strengthened investment returns authorization value, feasibility, commercial and embedding resourcing, functions to benefits across Right-sized Technical Solution on 3 project plan, and ensure on-time, standard Steel Mill Caster project risk on-budget; rapid operating • Delivered required performance • Minimized capital investment response teams procedures for exceptions I M P A C T 1 Capital Discipline is 95% ~$180M Now a Clear Advantage Projects completed on-budget in FY 2025 in capital avoided The Goal is to Maximize Value Creation From Every Dollar Invested For footnoted information, refer to Appendix. 2 0 2 6 I N V E S T O R D A Y 32
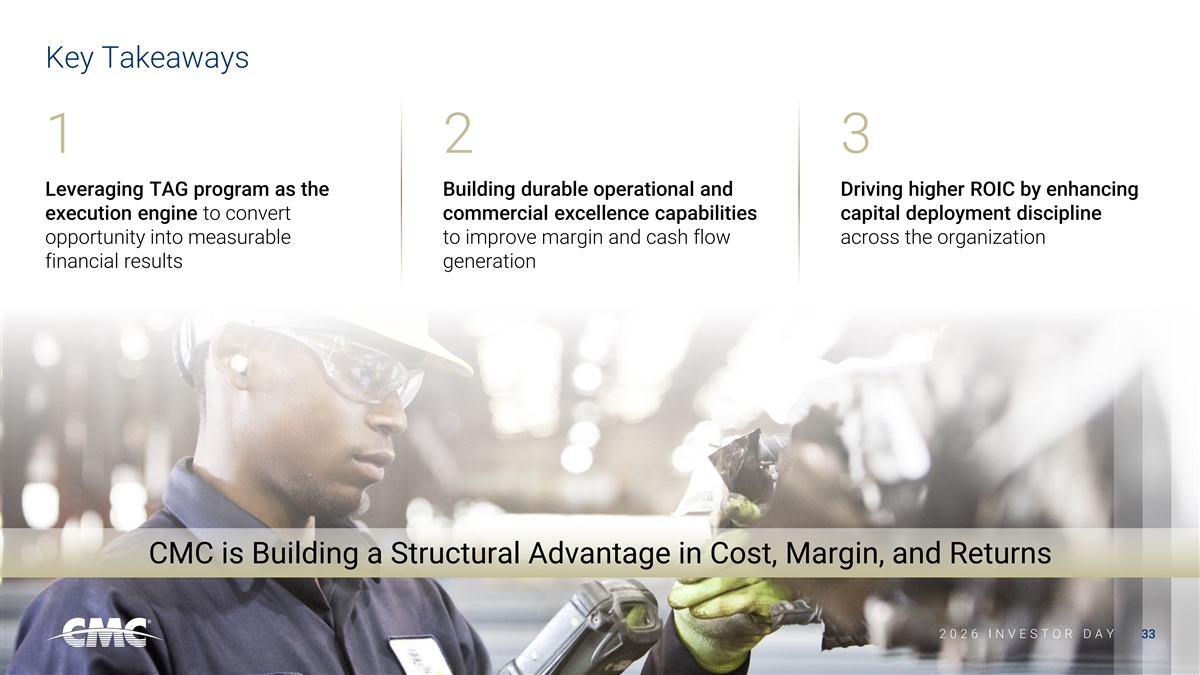
Key Takeaways 1 2 3 Leveraging TAG program as the Building durable operational and Driving higher ROIC by enhancing execution engine to convert commercial excellence capabilities capital deployment discipline opportunity into measurable to improve margin and cash flow across the organization financial results generation CMC is Building a Structural Advantage in Cost, Margin, and Returns 2 2 0 0 2 2 6 6 I I N N V V E E S S T T O O R R D D A A Y Y 33 33 33
Capturing Our Full Potential: North America Steel Group Brian Halloran | SVP, NORTH AMERICA STEEL GROUP 2 0 2 6 I N V E S T O R D A Y
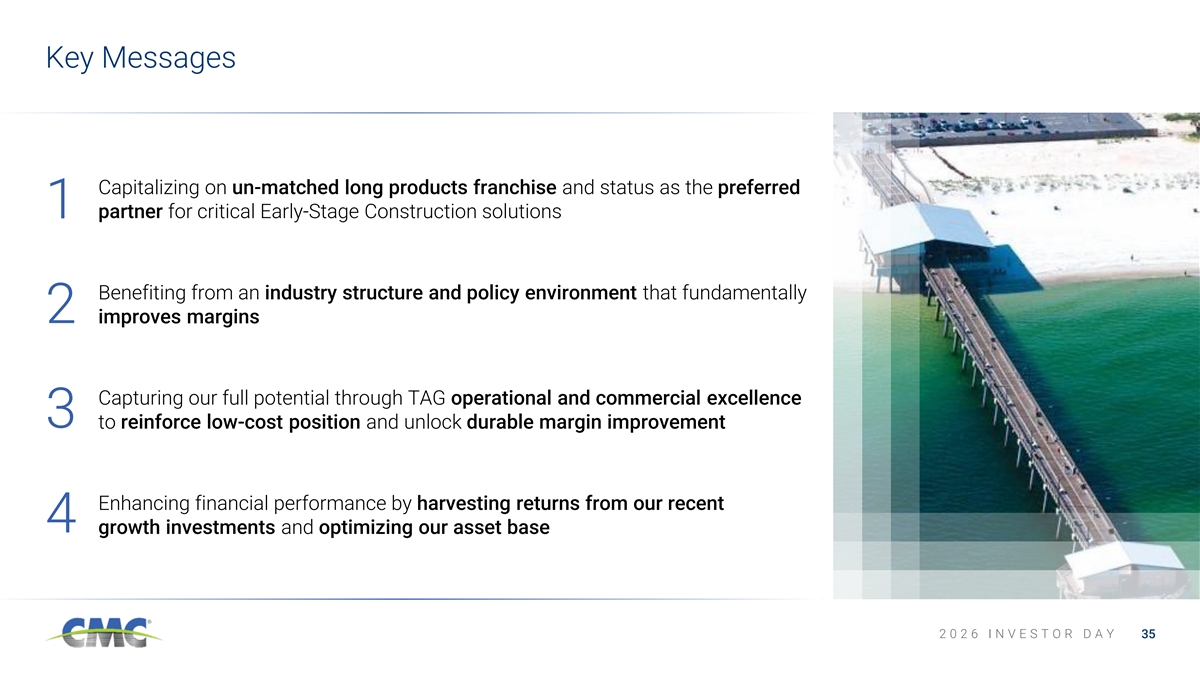
Key Messages Capitalizing on un-matched long products franchise and status as the preferred 1 partner for critical Early-Stage Construction solutions Benefiting from an industry structure and policy environment that fundamentally 2 improves margins Capturing our full potential through TAG operational and commercial excellence 3 to reinforce low-cost position and unlock durable margin improvement Enhancing financial performance by harvesting returns from our recent 4 growth investments and optimizing our asset base 2 0 2 6 I N V E S T O R D A Y 35
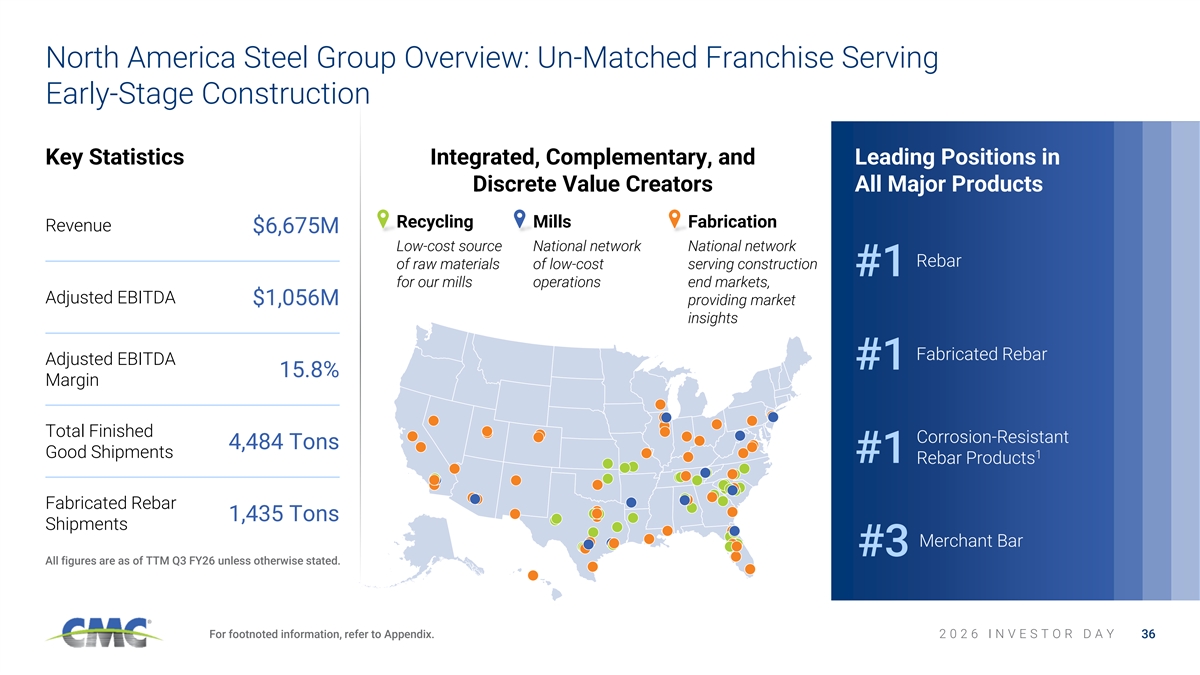
North America Steel Group Overview: Un-Matched Franchise Serving Early-Stage Construction Key Statistics Integrated, Complementary, and Leading Positions in Discrete Value Creators All Major Products Recycling Mills Fabrication Revenue $6,675M Low-cost source National network National network Rebar of raw materials of low-cost serving construction #1 for our mills operations end markets, Adjusted EBITDA $1,056M providing market insights Fabricated Rebar Adjusted EBITDA #1 15.8% Margin Total Finished Corrosion-Resistant 4,484 Tons Good Shipments 1 #1 Rebar Products Fabricated Rebar 1,435 Tons Shipments Merchant Bar #3 All figures are as of TTM Q3 FY26 unless otherwise stated. For footnoted information, refer to Appendix. 2 0 2 6 I N V E S T O R D A Y 36
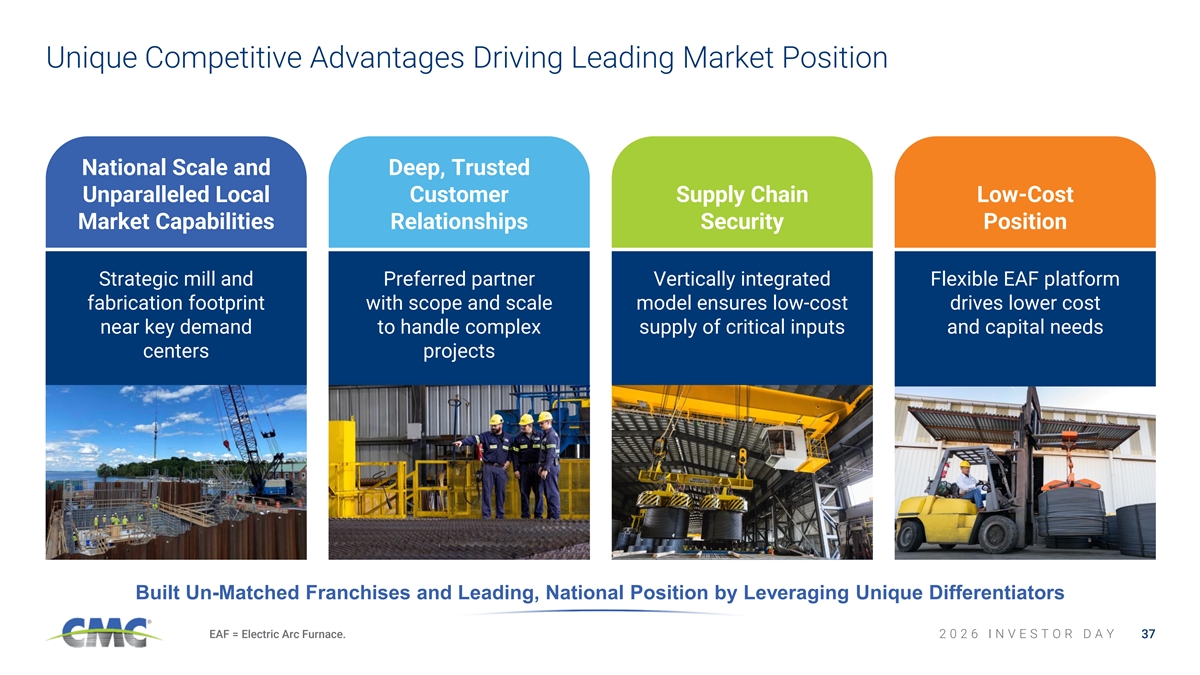
Unique Competitive Advantages Driving Leading Market Position National Scale and Deep, Trusted Unparalleled Local Customer Supply Chain Low-Cost Market Capabilities Relationships Security Position Strategic mill and Preferred partner Vertically integrated Flexible EAF platform fabrication footprint with scope and scale model ensures low-cost drives lower cost near key demand to handle complex supply of critical inputs and capital needs centers projects Built Un-Matched Franchises and Leading, National Position by Leveraging Unique Differentiators EAF = Electric Arc Furnace. 2 0 2 6 I N V E S T O R D A Y 37
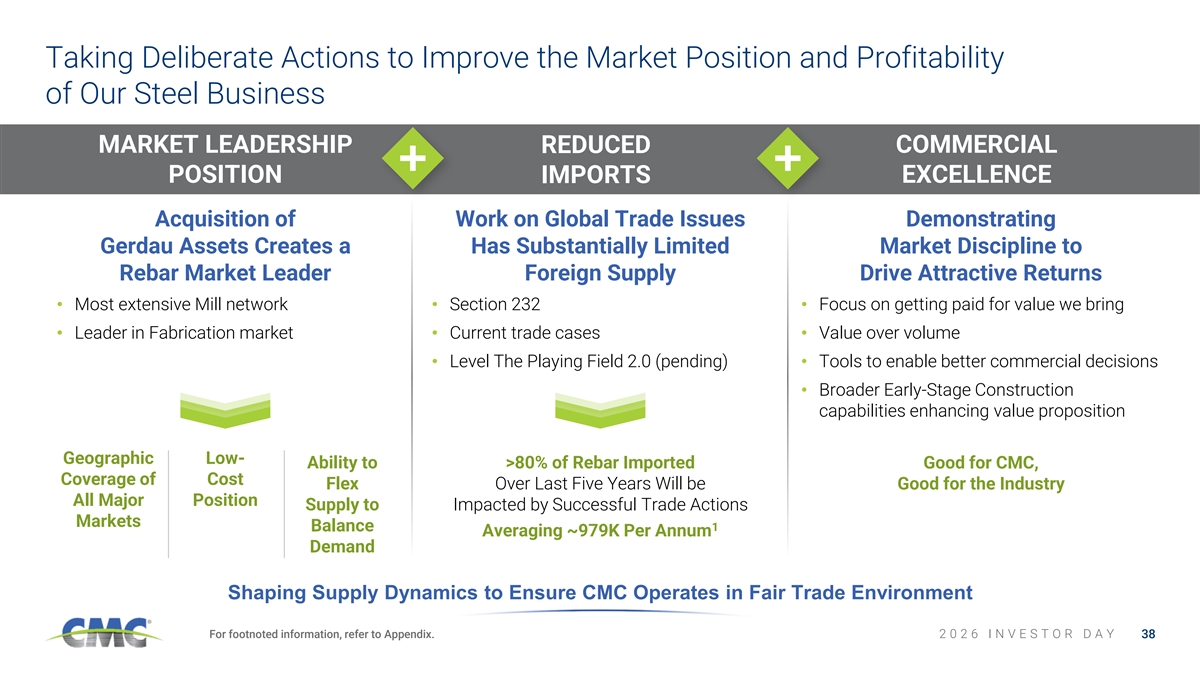
Taking Deliberate Actions to Improve the Market Position and Profitability of Our Steel Business MARKET LEADERSHIP COMMERCIAL REDUCED POSITION EXCELLENCE IMPORTS Acquisition of Work on Global Trade Issues Demonstrating Gerdau Assets Creates a Has Substantially Limited Market Discipline to Rebar Market Leader Foreign Supply Drive Attractive Returns • Most extensive Mill network• Section 232• Focus on getting paid for value we bring • Leader in Fabrication market• Current trade cases• Value over volume • Level The Playing Field 2.0 (pending)• Tools to enable better commercial decisions • Broader Early-Stage Construction capabilities enhancing value proposition Geographic Low- Ability to >80% of Rebar Imported Good for CMC, Coverage of Cost Flex Over Last Five Years Will be Good for the Industry All Major Position Supply to Impacted by Successful Trade Actions Markets Balance 1 Averaging ~979K Per Annum Demand Shaping Supply Dynamics to Ensure CMC Operates in Fair Trade Environment For footnoted information, refer to Appendix. 2 0 2 6 I N V E S T O R D A Y 38
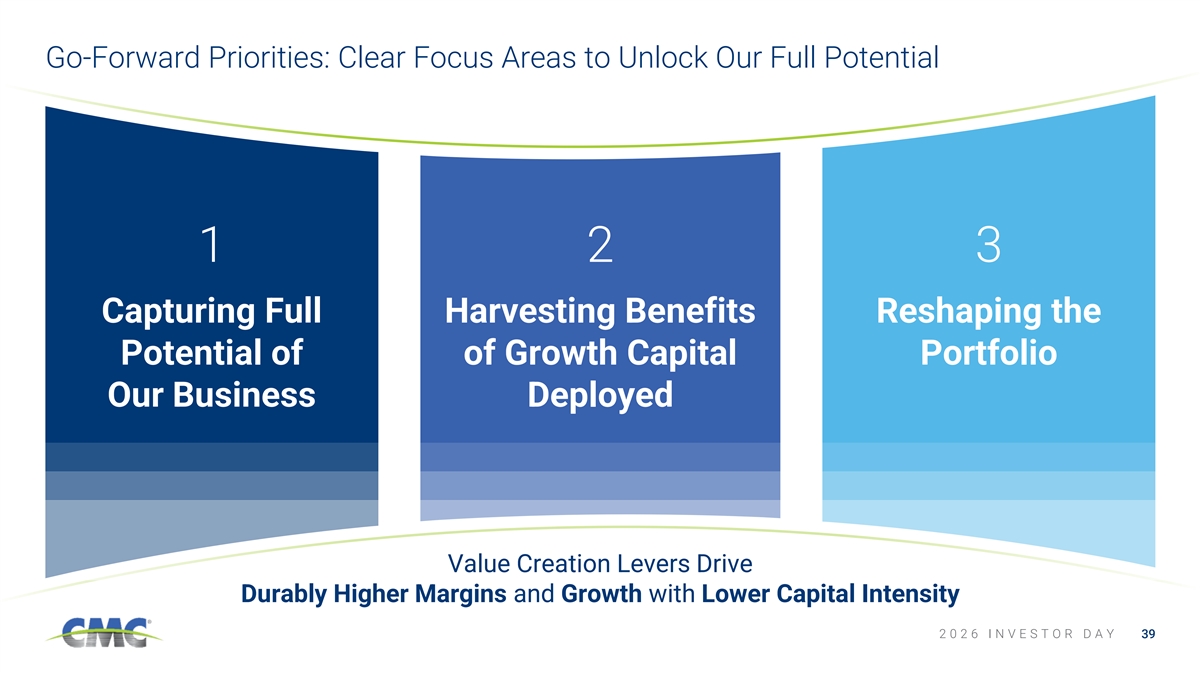
Go-Forward Priorities: Clear Focus Areas to Unlock Our Full Potential 1 2 3 Capturing Full Harvesting Benefits Reshaping the Potential of of Growth Capital Portfolio Our Business Deployed Value Creation Levers Drive Durably Higher Margins and Growth with Lower Capital Intensity 2 0 2 6 I N V E S T O R D A Y 39
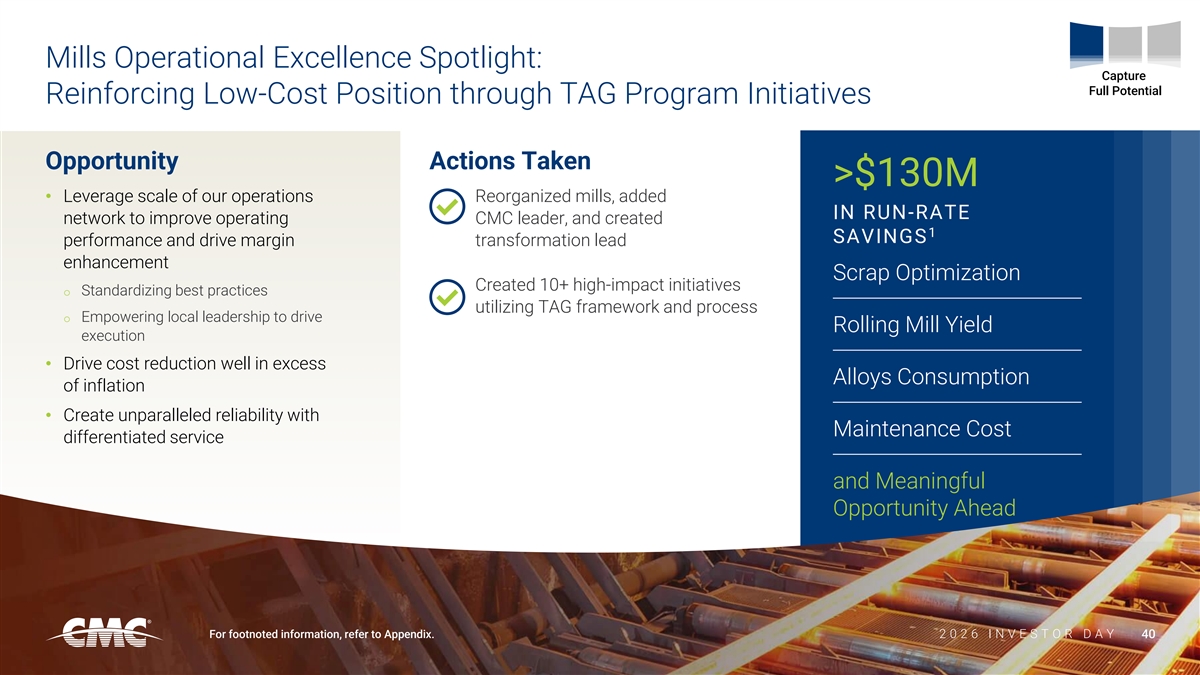
Mills Operational Excellence Spotlight: Capture Full Potential Reinforcing Low-Cost Position through TAG Program Initiatives Opportunity Actions Taken >$130M • Leverage scale of our operations Reorganized mills, added IN RUN-RATE network to improve operating CMC leader, and created 1 SAVINGS performance and drive margin transformation lead enhancement Scrap Optimization Created 10+ high-impact initiatives o Standardizing best practices utilizing TAG framework and process o Empowering local leadership to drive Rolling Mill Yield execution • Drive cost reduction well in excess Alloys Consumption of inflation • Create unparalleled reliability with Maintenance Cost differentiated service and Meaningful Opportunity Ahead For footnoted information, refer to Appendix. 2 2 0 0 2 2 6 6 I I N N V V E E S S T T O O R R D D A A Y Y 40 40
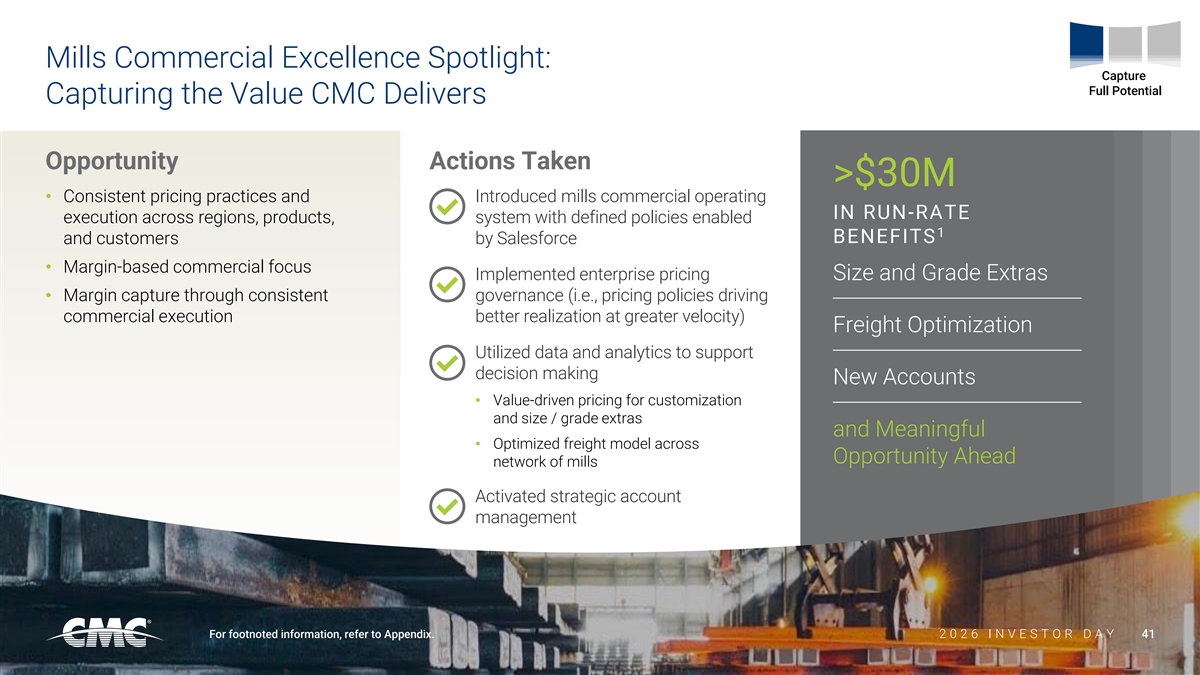
Mills Commercial Excellence Spotlight: Capture Full Potential Capturing the Value CMC Delivers Opportunity Actions Taken >$30M • Consistent pricing practices and Introduced mills commercial operating IN RUN-RATE execution across regions, products, system with defined policies enabled 1 and customers by Salesforce BENEFITS • Margin-based commercial focus Implemented enterprise pricing Size and Grade Extras • Margin capture through consistent governance (i.e., pricing policies driving commercial execution better realization at greater velocity) Freight Optimization Utilized data and analytics to support decision making New Accounts • Value-driven pricing for customization and size / grade extras and Meaningful • Optimized freight model across Opportunity Ahead network of mills Activated strategic account management For footnoted information, refer to Appendix. 2 2 0 0 2 2 6 6 I I N N V V E E S S T T O O R R D D A A Y Y 41 41
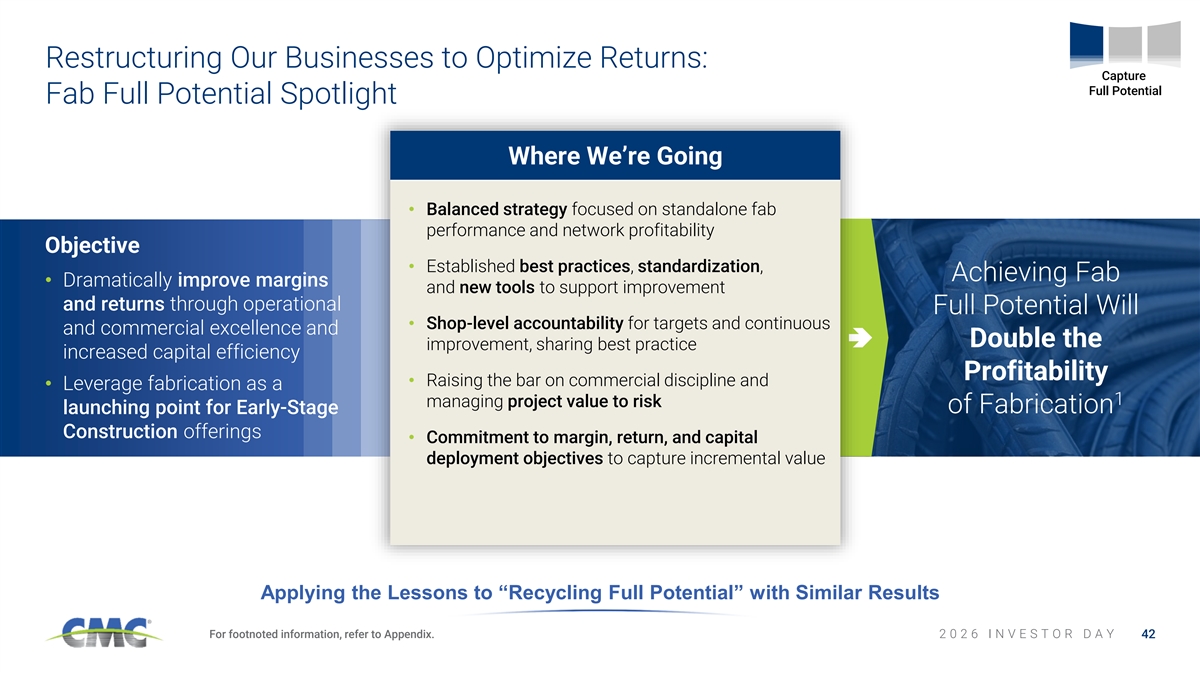
Restructuring Our Businesses to Optimize Returns: Capture Full Potential Fab Full Potential Spotlight Where We’re Going • Balanced strategy focused on standalone fab performance and network profitability Objective • Established best practices, standardization, Achieving Fab • Dramatically improve margins and new tools to support improvement and returns through operational Full Potential Will • Shop-level accountability for targets and continuous and commercial excellence and Double the improvement, sharing best practice increased capital efficiency Profitability • Raising the bar on commercial discipline and • Leverage fabrication as a 1 managing project value to risk launching point for Early-Stage of Fabrication Construction offerings • Commitment to margin, return, and capital deployment objectives to capture incremental value Applying the Lessons to “Recycling Full Potential” with Similar Results For footnoted information, refer to Appendix. 2 0 2 6 I N V E S T O R D A Y 42
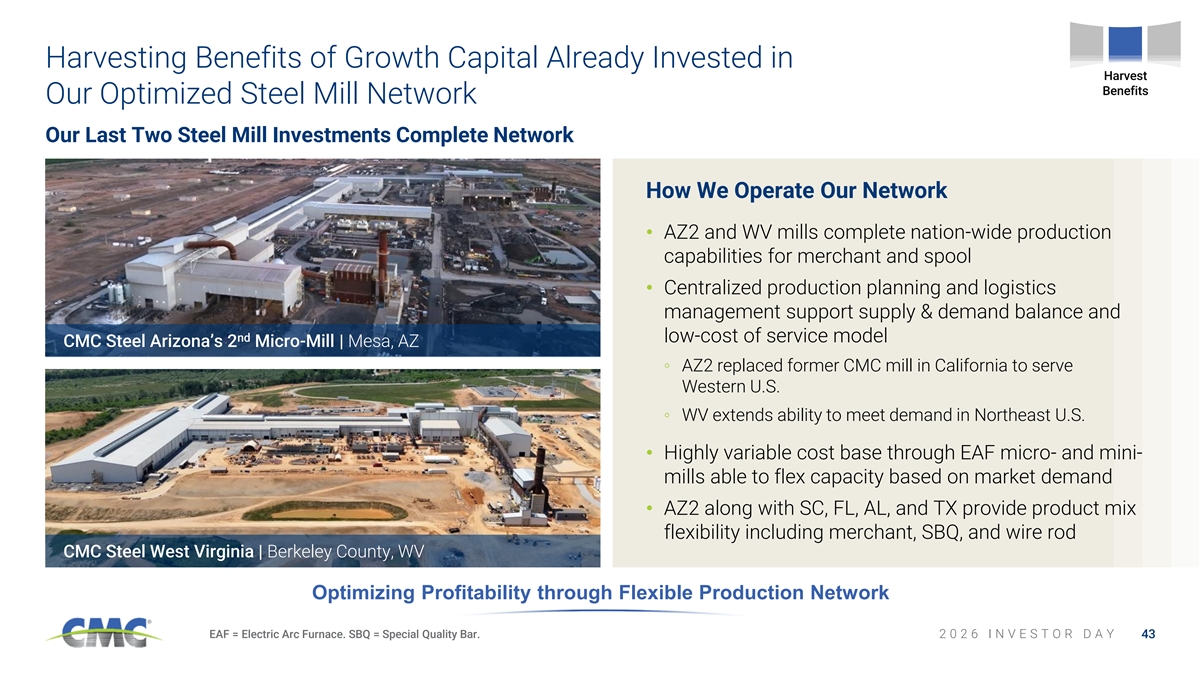
Harvesting Benefits of Growth Capital Already Invested in Harvest Benefits Our Optimized Steel Mill Network Our Last Two Steel Mill Investments Complete Network How We Operate Our Network • AZ2 and WV mills complete nation-wide production capabilities for merchant and spool • Centralized production planning and logistics management support supply & demand balance and nd low-cost of service model CMC Steel Arizona’s 2 Micro-Mill | Mesa, AZ ◦ AZ2 replaced former CMC mill in California to serve Western U.S. ◦ WV extends ability to meet demand in Northeast U.S. • Highly variable cost base through EAF micro- and mini- mills able to flex capacity based on market demand • AZ2 along with SC, FL, AL, and TX provide product mix flexibility including merchant, SBQ, and wire rod CMC Steel West Virginia | Berkeley County, WV Optimizing Profitability through Flexible Production Network EAF = Electric Arc Furnace. SBQ = Special Quality Bar. 2 0 2 6 I N V E S T O R D A Y 43
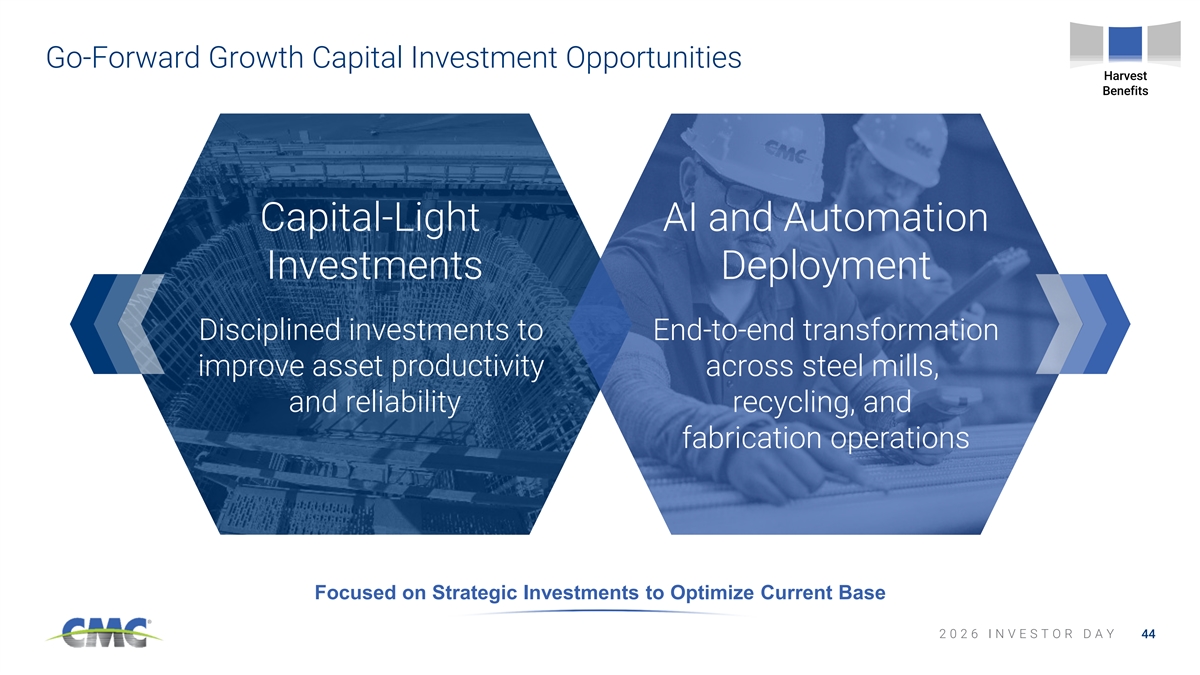
Go-Forward Growth Capital Investment Opportunities Harvest Benefits Capital-Light AI and Automation Investments Deployment Disciplined investments to End-to-end transformation improve asset productivity across steel mills, and reliability recycling, and fabrication operations Focused on Strategic Investments to Optimize Current Base 2 0 2 6 I N V E S T O R D A Y 44
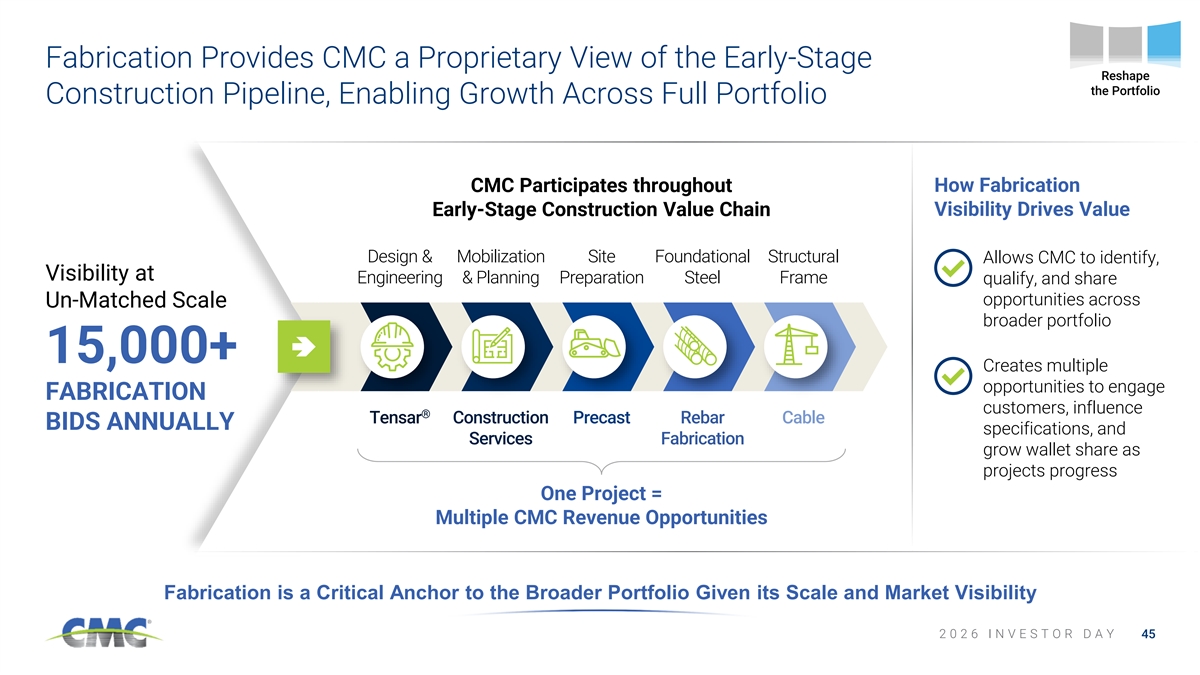
Fabrication Provides CMC a Proprietary View of the Early-Stage Reshape the Portfolio Construction Pipeline, Enabling Growth Across Full Portfolio CMC Participates throughout How Fabrication Early-Stage Construction Value Chain Visibility Drives Value Design & Mobilization Site Foundational Structural Allows CMC to identify, Visibility at Engineering & Planning Preparation Steel Frame qualify, and share opportunities across Un-Matched Scale broader portfolio 15,000+ Creates multiple opportunities to engage FABRICATION customers, influence ® Tensar Construction Precast Rebar Cable BIDS ANNUALLY specifications, and Services Fabrication grow wallet share as projects progress One Project = Multiple CMC Revenue Opportunities Fabrication is a Critical Anchor to the Broader Portfolio Given its Scale and Market Visibility 2 0 2 6 I N V E S T O R D A Y 45
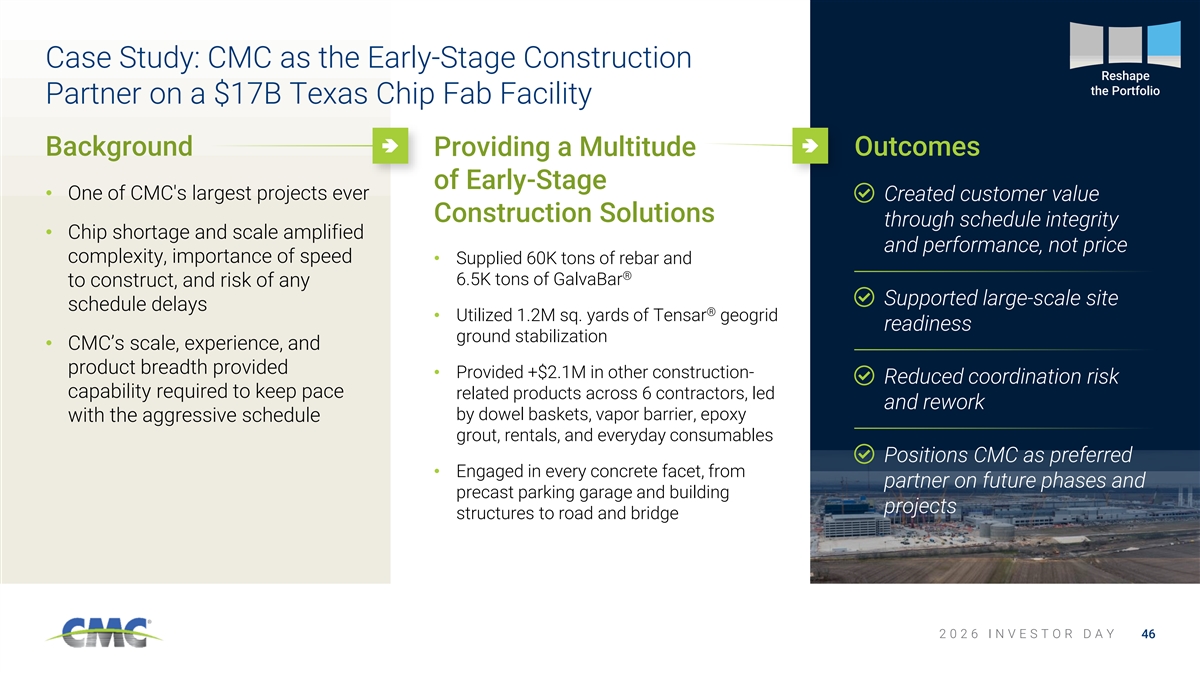
Case Study: CMC as the Early-Stage Construction Reshape the Portfolio Partner on a $17B Texas Chip Fab Facility Background Providing a Multitude Outcomes of Early-Stage • One of CMC's largest projects ever Created customer value Construction Solutions through schedule integrity • Chip shortage and scale amplified and performance, not price complexity, importance of speed • Supplied 60K tons of rebar and ® 6.5K tons of GalvaBar to construct, and risk of any Supported large-scale site schedule delays ® • Utilized 1.2M sq. yards of Tensar geogrid readiness ground stabilization • CMC’s scale, experience, and product breadth provided • Provided +$2.1M in other construction- Reduced coordination risk capability required to keep pace related products across 6 contractors, led and rework by dowel baskets, vapor barrier, epoxy with the aggressive schedule grout, rentals, and everyday consumables Positions CMC as preferred • Engaged in every concrete facet, from partner on future phases and precast parking garage and building projects structures to road and bridge 2 0 2 6 I N V E S T O R D A Y 46
Key Takeaways 1 2 3 4 Capitalizing on un-matched Benefiting from an industry Capturing our full potential Enhancing financial performance long products franchise and structure and policy through TAG operational and by harvesting returns from our status as the preferred partner environment that fundamentally commercial excellence to recent growth investments and for critical Early-Stage improves margins reinforce low-cost position optimizing our asset base Construction solutions and unlock durable margin improvement 2 2 0 0 2 2 6 6 I I N N V V E E S S T T O O R R D D A A Y Y 47 47
Q&A Session 2 0 2 6 I N V E S T O R D A Y
Break 2 0 2 6 I N V E S T O R D A Y
Growing and Differentiating: Construction Solutions Group Keith Haas Mike Doucet SVP, PRECAST SVP, EMERGING GROUP BUSINESSES GROUP 2 0 2 6 I N V E S T O R D A Y
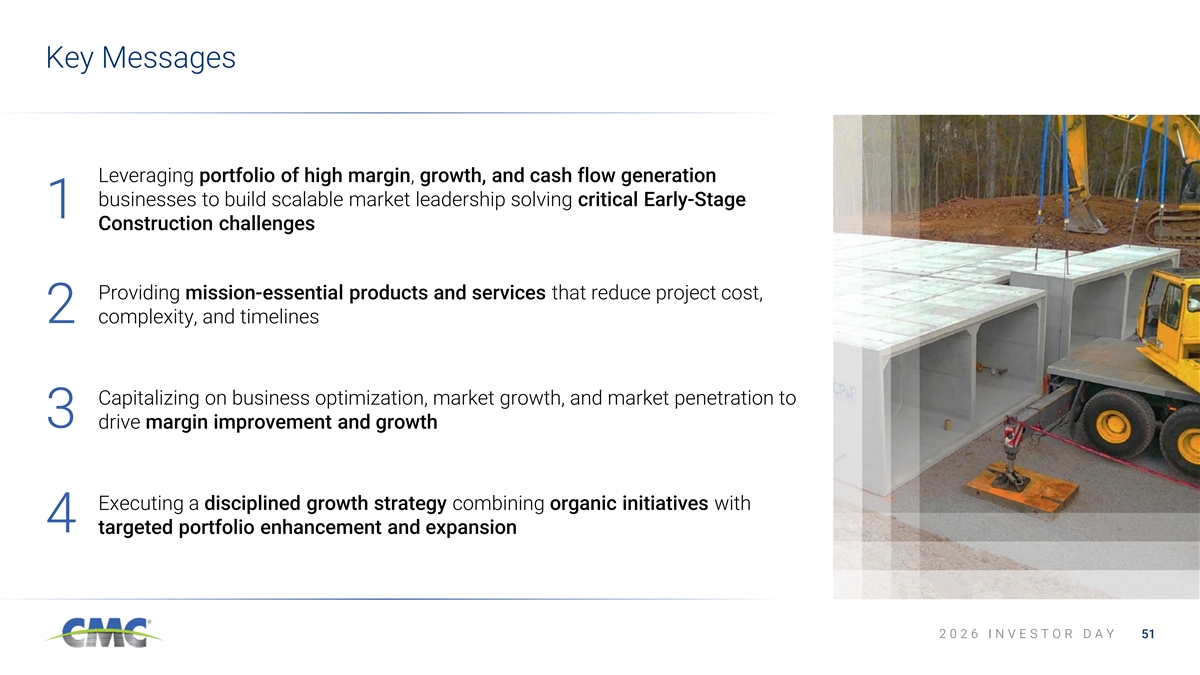
Key Messages Leveraging portfolio of high margin, growth, and cash flow generation businesses to build scalable market leadership solving critical Early-Stage 1 Construction challenges Providing mission-essential products and services that reduce project cost, 2 complexity, and timelines Capitalizing on business optimization, market growth, and market penetration to 3 drive margin improvement and growth Executing a disciplined growth strategy combining organic initiatives with 4 targeted portfolio enhancement and expansion 2 0 2 6 I N V E S T O R D A Y 51
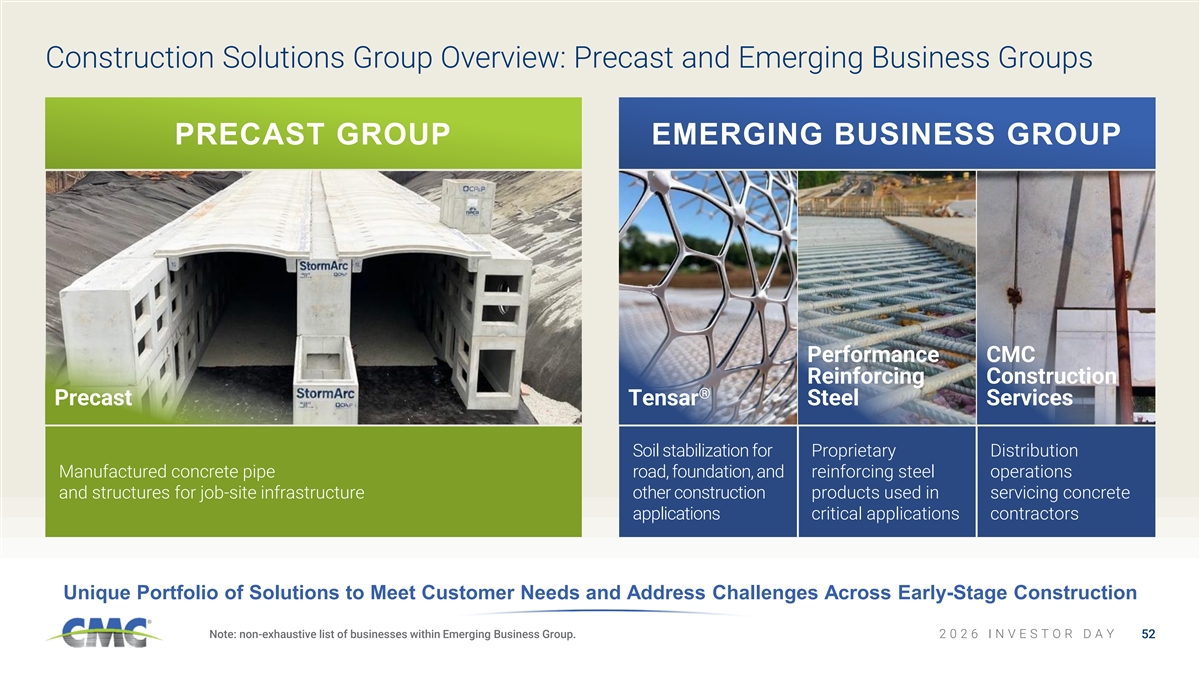
Construction Solutions Group Overview: Precast and Emerging Business Groups PRECAST GROUP EMERGING BUSINESS GROUP Performance CMC Reinforcing Construction ® Precast Tensar Steel Services Soil stabilization for Proprietary Distribution Manufactured concrete pipe road, foundation, and reinforcing steel operations and structures for job-site infrastructure other construction products used in servicing concrete applications critical applications contractors Unique Portfolio of Solutions to Meet Customer Needs and Address Challenges Across Early-Stage Construction Note: non-exhaustive list of businesses within Emerging Business Group. 2 0 2 6 I N V E S T O R D A Y 52
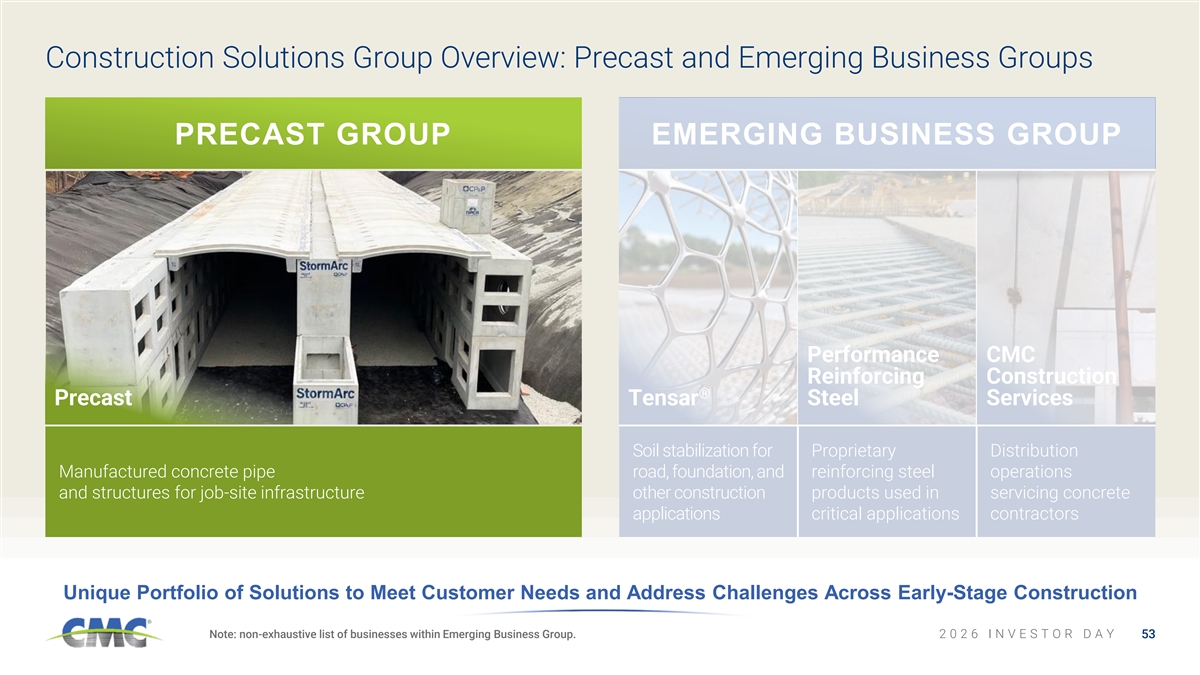
Construction Solutions Group Overview: Precast and Emerging Business Groups PRECAST GROUP EMERGING BUSINESS GROUP Performance CMC Reinforcing Construction ® Precast Tensar Steel Services Soil stabilization for Proprietary Distribution Manufactured concrete pipe road, foundation, and reinforcing steel operations and structures for job-site infrastructure other construction products used in servicing concrete applications critical applications contractors Unique Portfolio of Solutions to Meet Customer Needs and Address Challenges Across Early-Stage Construction Note: non-exhaustive list of businesses within Emerging Business Group. 2 0 2 6 I N V E S T O R D A Y 53
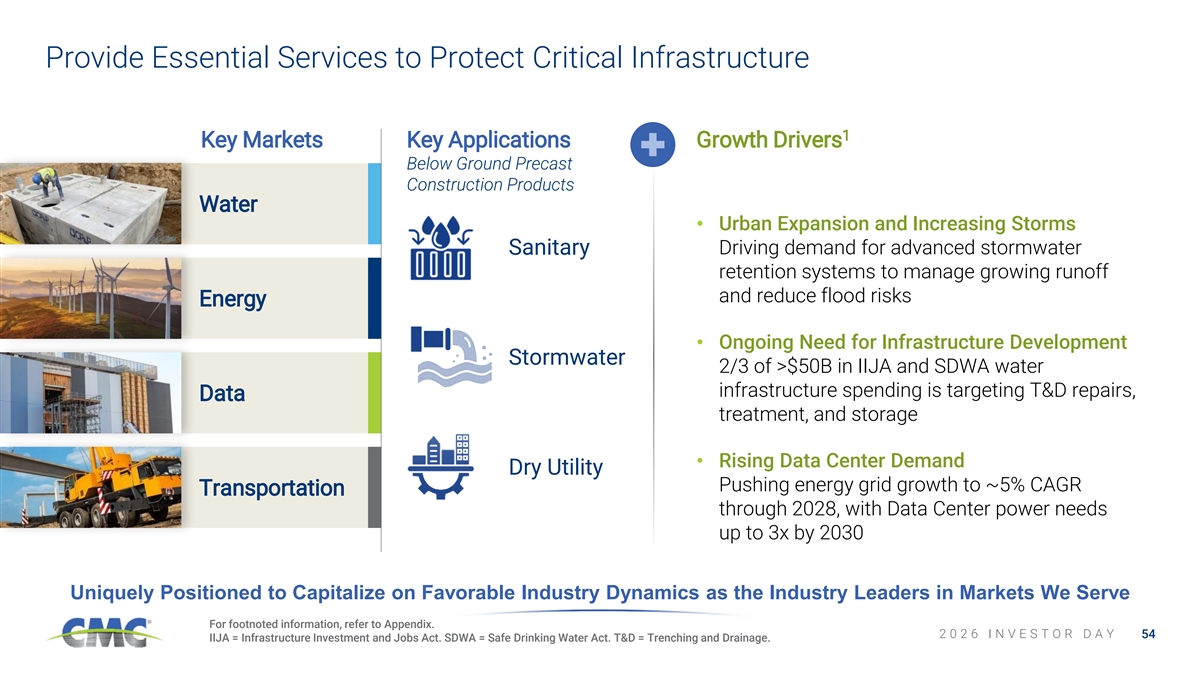
Provide Essential Services to Protect Critical Infrastructure 1 Key Markets Key Applications Growth Drivers Below Ground Precast Construction Products Water • Urban Expansion and Increasing Storms Sanitary Driving demand for advanced stormwater retention systems to manage growing runoff and reduce flood risks Energy • Ongoing Need for Infrastructure Development Stormwater 2/3 of >$50B in IIJA and SDWA water infrastructure spending is targeting T&D repairs, Data treatment, and storage • Rising Data Center Demand Dry Utility Pushing energy grid growth to ~5% CAGR Transportation through 2028, with Data Center power needs up to 3x by 2030 Uniquely Positioned to Capitalize on Favorable Industry Dynamics as the Industry Leaders in Markets We Serve For footnoted information, refer to Appendix. 2 0 2 6 I N V E S T O R D A Y 54 IIJA = Infrastructure Investment and Jobs Act. SDWA = Safe Drinking Water Act. T&D = Trenching and Drainage.
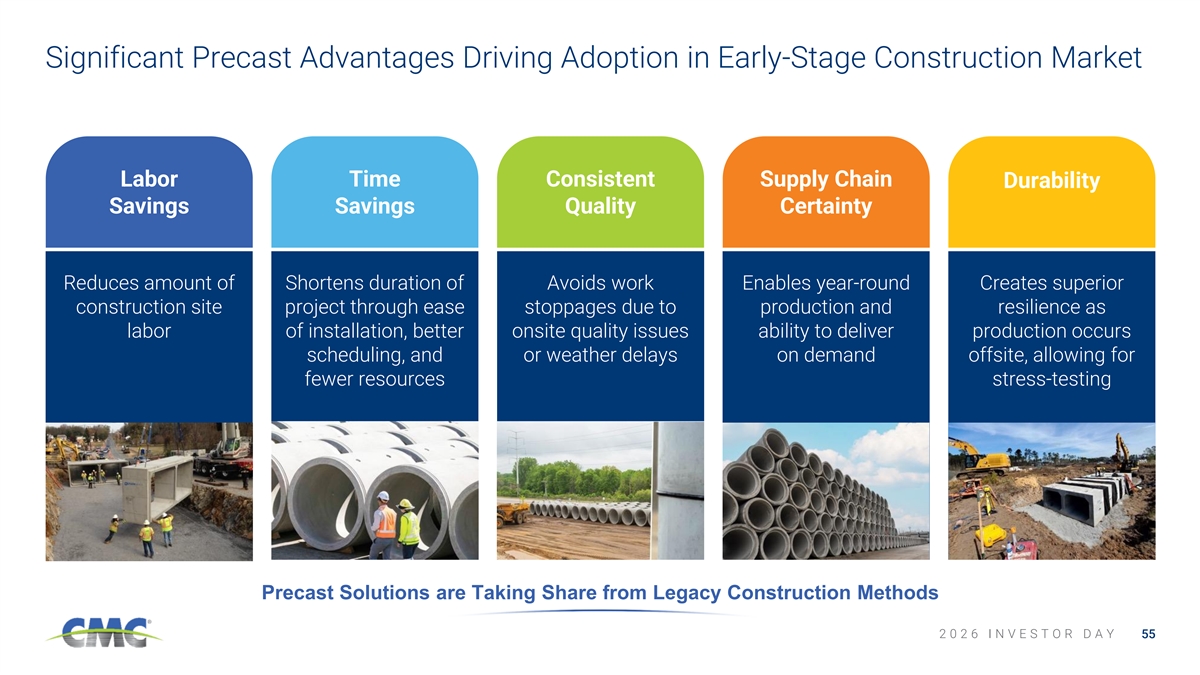
Significant Precast Advantages Driving Adoption in Early-Stage Construction Market Labor Time Consistent Supply Chain Durability Savings Savings Quality Certainty Reduces amount of Shortens duration of Avoids work Enables year-round Creates superior construction site project through ease stoppages due to production and resilience as labor of installation, better onsite quality issues ability to deliver production occurs scheduling, and or weather delays on demand offsite, allowing for fewer resources stress-testing Precast Solutions are Taking Share from Legacy Construction Methods 2 0 2 6 I N V E S T O R D A Y 55
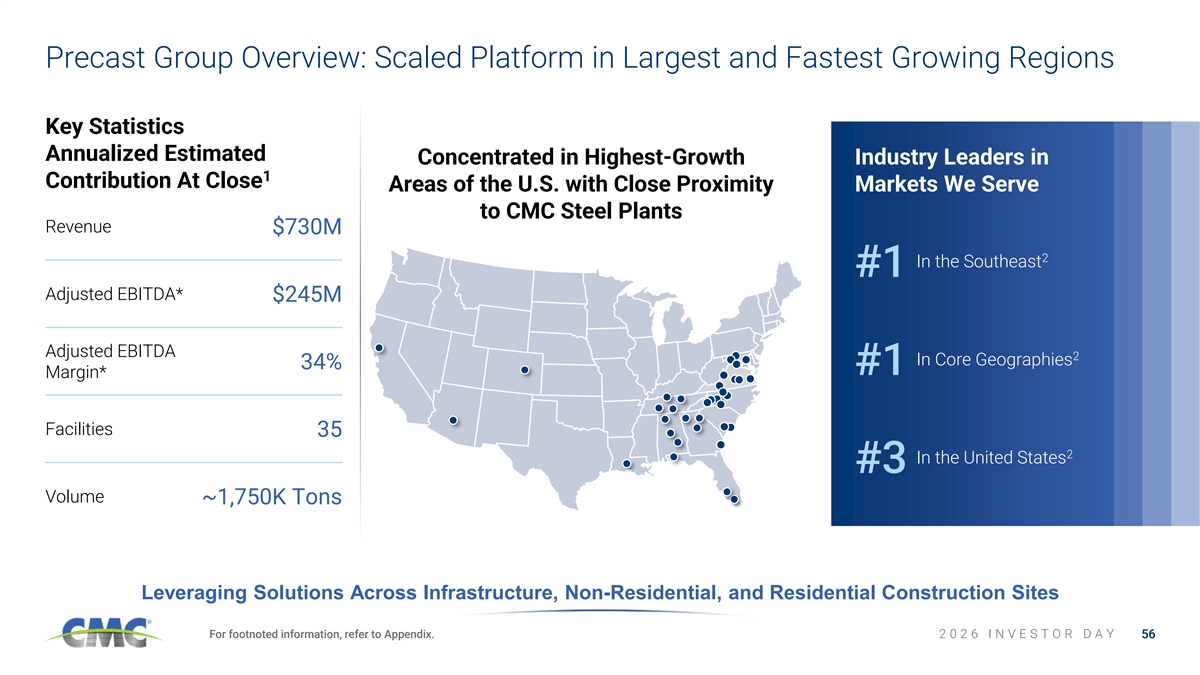
Precast Group Overview: Scaled Platform in Largest and Fastest Growing Regions Key Statistics Annualized Estimated Concentrated in Highest-Growth Industry Leaders in 1 Contribution At Close Areas of the U.S. with Close Proximity Markets We Serve to CMC Steel Plants Revenue $730M 2 In the Southeast #1 Adjusted EBITDA* $245M Adjusted EBITDA 2 In Core Geographies 34% #1 Margin* Facilities 35 2 In the United States #3 Volume ~1,750K Tons Leveraging Solutions Across Infrastructure, Non-Residential, and Residential Construction Sites For footnoted information, refer to Appendix. 2 0 2 6 I N V E S T O R D A Y 56 56
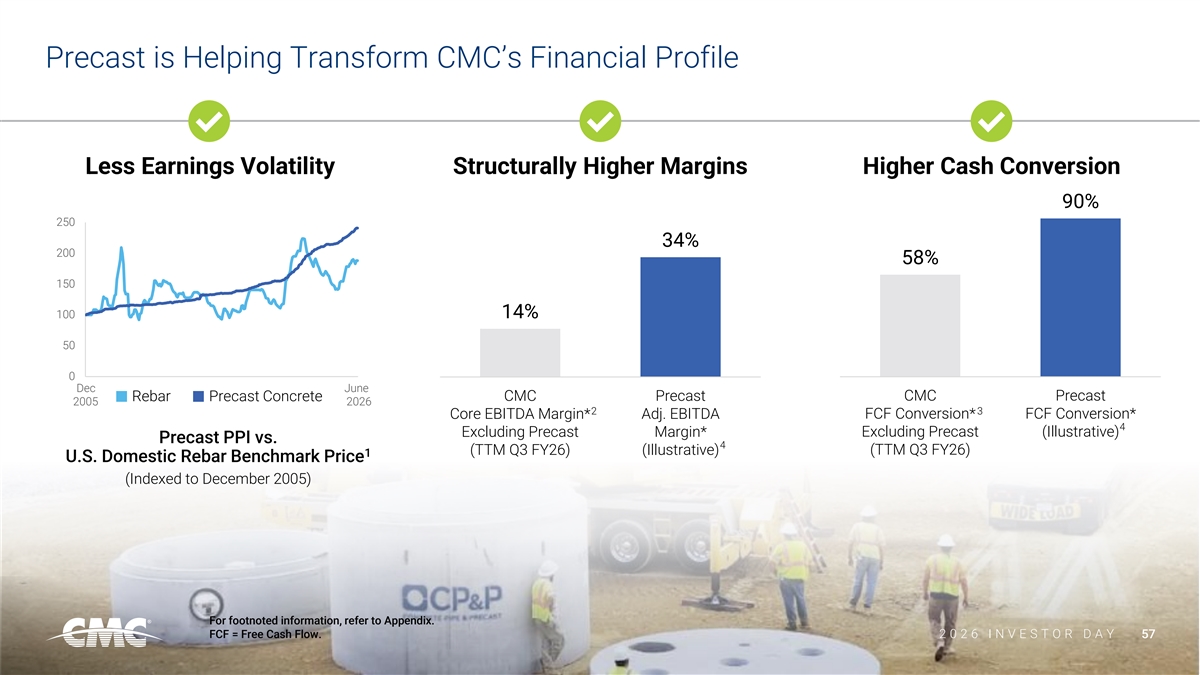
Precast is Helping Transform CMC’s Financial Profile Less Earnings Volatility Structurally Higher Margins Higher Cash Conversion 90% 250 34% 200 58% 150 100 14% 50 0 Dec June Rebar Precast Concrete CMC Precast CMC Precast 2005 2026 2 3 Core EBITDA Margin* Adj. EBITDA FCF Conversion* FCF Conversion* 4 Excluding Precast (Illustrative) Excluding Precast Margin* Precast PPI vs. 4 (TTM Q3 FY26) (Illustrative) (TTM Q3 FY26) 1 U.S. Domestic Rebar Benchmark Price (Indexed to December 2005) For footnoted information, refer to Appendix. FCF = Free Cash Flow. 2 2 0 0 2 2 6 6 I I N N V V E E S S T T O O R R D D A A Y Y 57
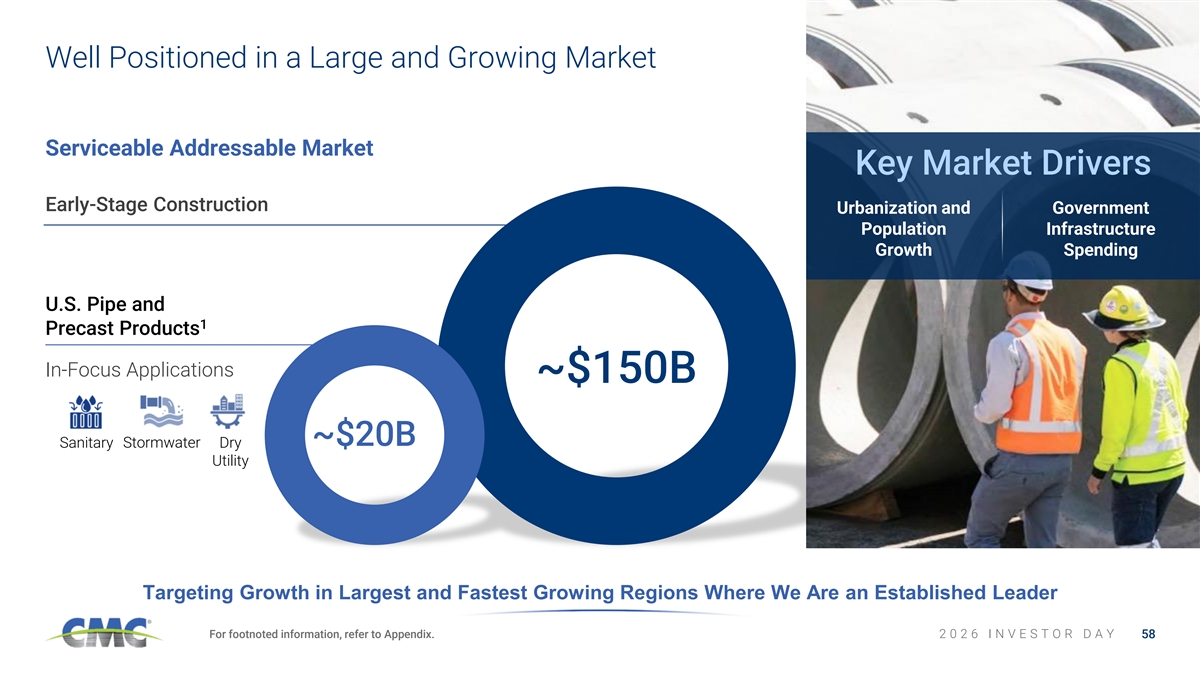
Well Positioned in a Large and Growing Market Serviceable Addressable Market Key Market Drivers Early-Stage Construction Urbanization and Government Population Infrastructure Growth Spending U.S. Pipe and 1 Precast Products In-Focus Applications ~$150B ~$20B Sanitary Stormwater Dry Utility Targeting Growth in Largest and Fastest Growing Regions Where We Are an Established Leader For footnoted information, refer to Appendix. 2 0 2 6 I N V E S T O R D A Y 58
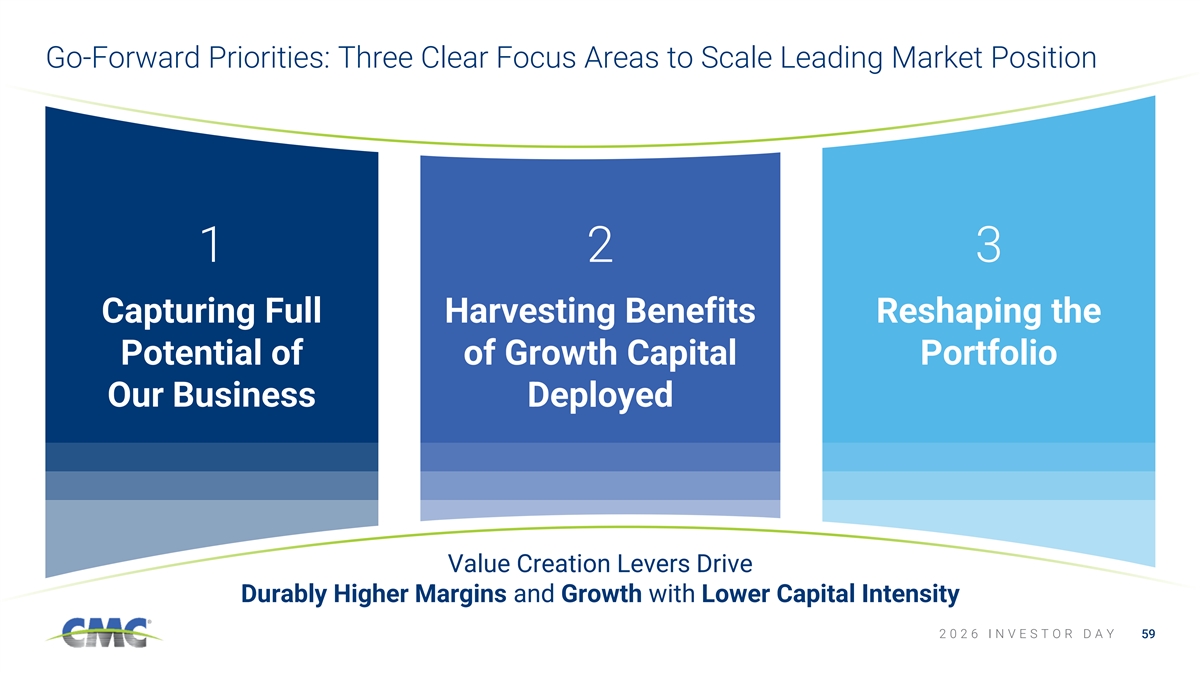
Go-Forward Priorities: Three Clear Focus Areas to Scale Leading Market Position 1 2 3 Capturing Full Harvesting Benefits Reshaping the Potential of of Growth Capital Portfolio Our Business Deployed Value Creation Levers Drive Durably Higher Margins and Growth with Lower Capital Intensity 2 0 2 6 I N V E S T O R D A Y 59
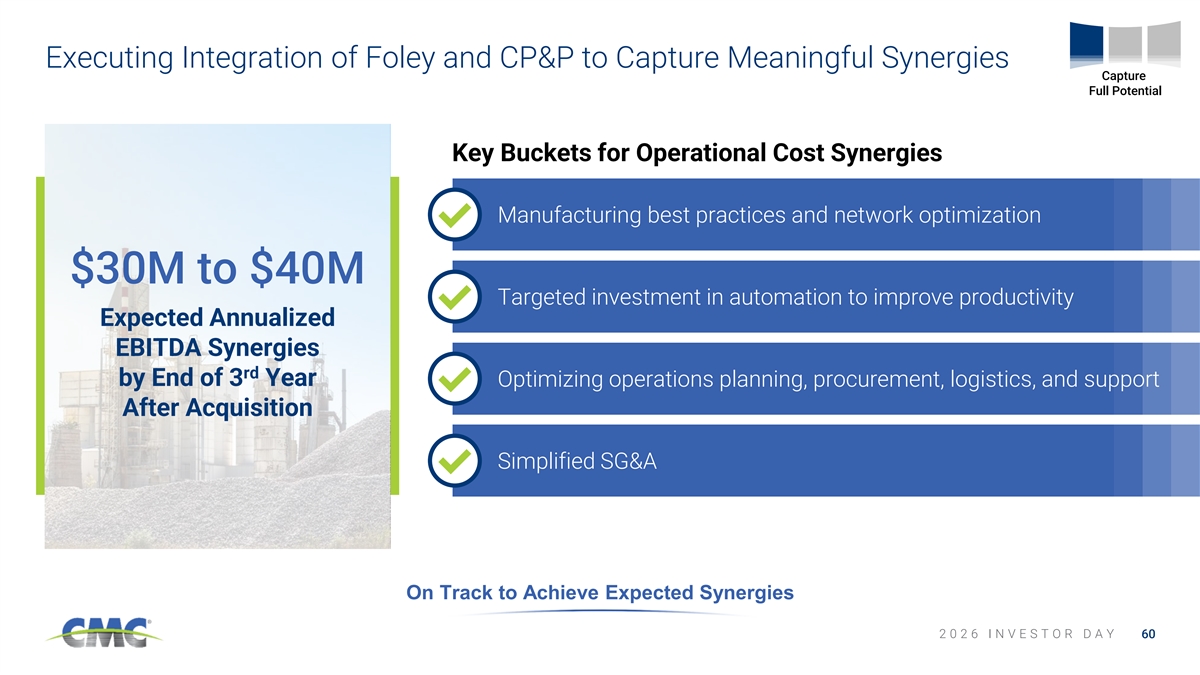
Executing Integration of Foley and CP&P to Capture Meaningful Synergies Capture Full Potential Key Buckets for Operational Cost Synergies Manufacturing best practices and network optimization $30M to $40M Targeted investment in automation to improve productivity Expected Annualized EBITDA Synergies rd by End of 3 Year Optimizing operations planning, procurement, logistics, and support After Acquisition Simplified SG&A On Track to Achieve Expected Synergies 2 0 2 6 I N V E S T O R D A Y 60
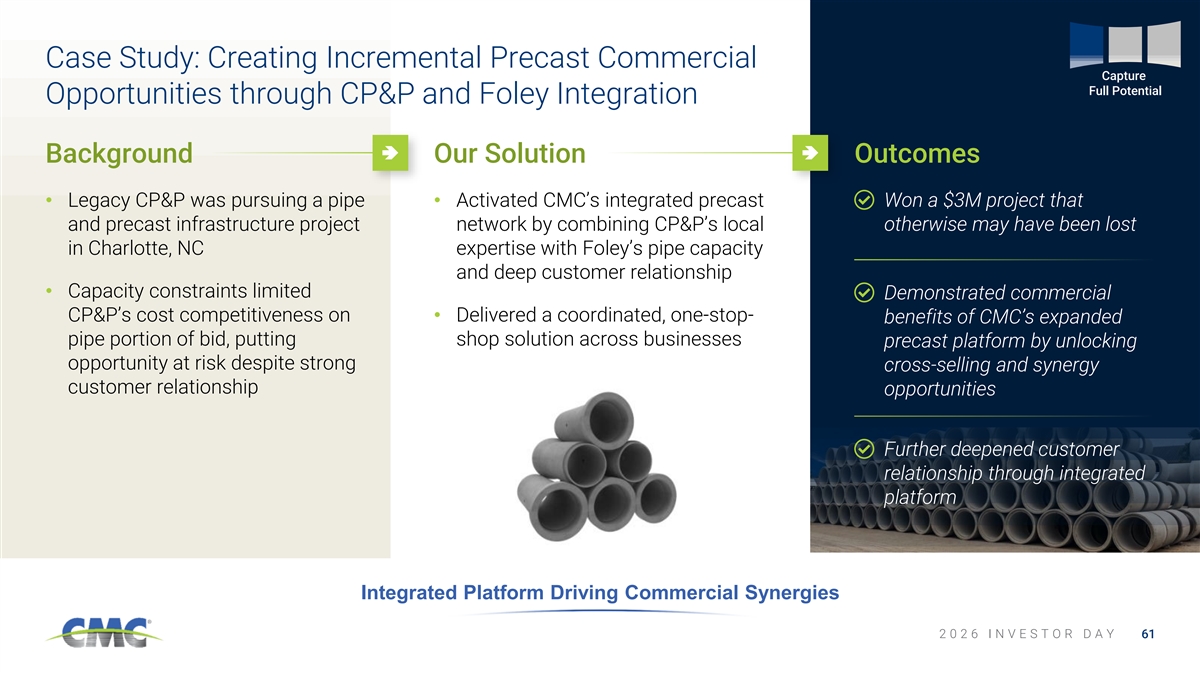
Case Study: Creating Incremental Precast Commercial Capture Full Potential Opportunities through CP&P and Foley Integration Background Our Solution Outcomes • Legacy CP&P was pursuing a pipe • Activated CMC’s integrated precast Won a $3M project that and precast infrastructure project network by combining CP&P’s local otherwise may have been lost in Charlotte, NC expertise with Foley’s pipe capacity and deep customer relationship • Capacity constraints limited Demonstrated commercial CP&P’s cost competitiveness on • Delivered a coordinated, one-stop- benefits of CMC’s expanded pipe portion of bid, putting shop solution across businesses precast platform by unlocking opportunity at risk despite strong cross-selling and synergy customer relationship opportunities Further deepened customer relationship through integrated platform Integrated Platform Driving Commercial Synergies 2 0 2 6 I N V E S T O R D A Y 61
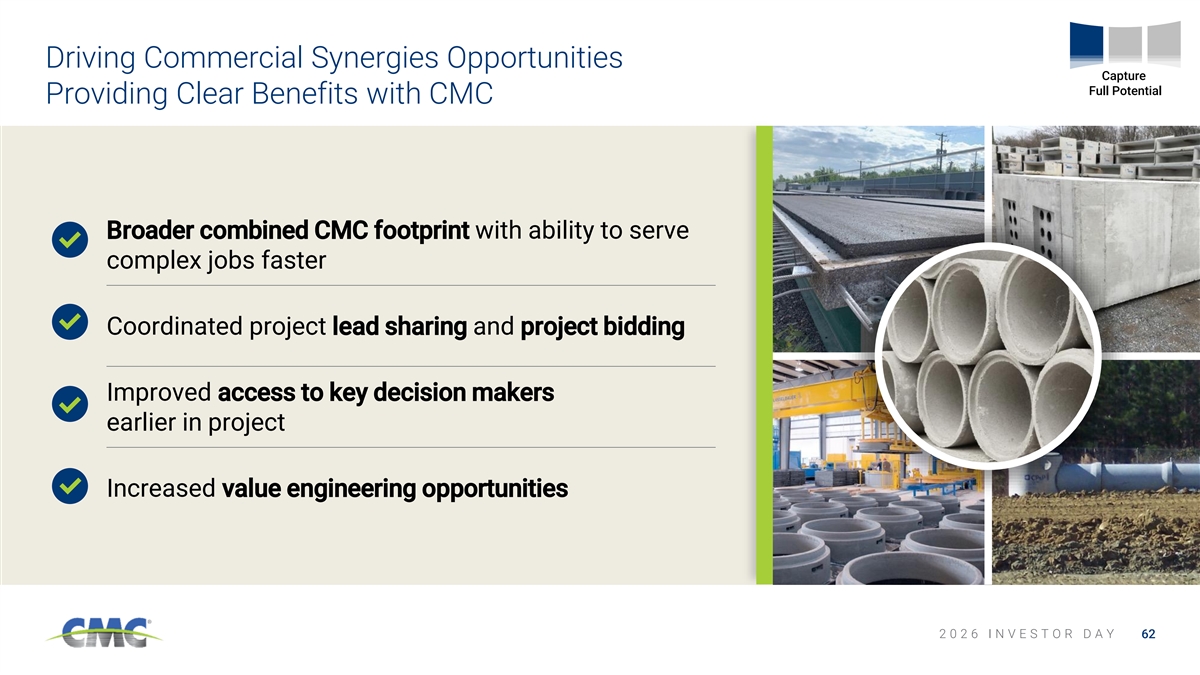
Driving Commercial Synergies Opportunities Capture Full Potential Providing Clear Benefits with CMC Broader combined CMC footprint with ability to serve complex jobs faster Coordinated project lead sharing and project bidding Improved access to key decision makers earlier in project Increased value engineering opportunities 2 0 2 6 I N V E S T O R D A Y 62
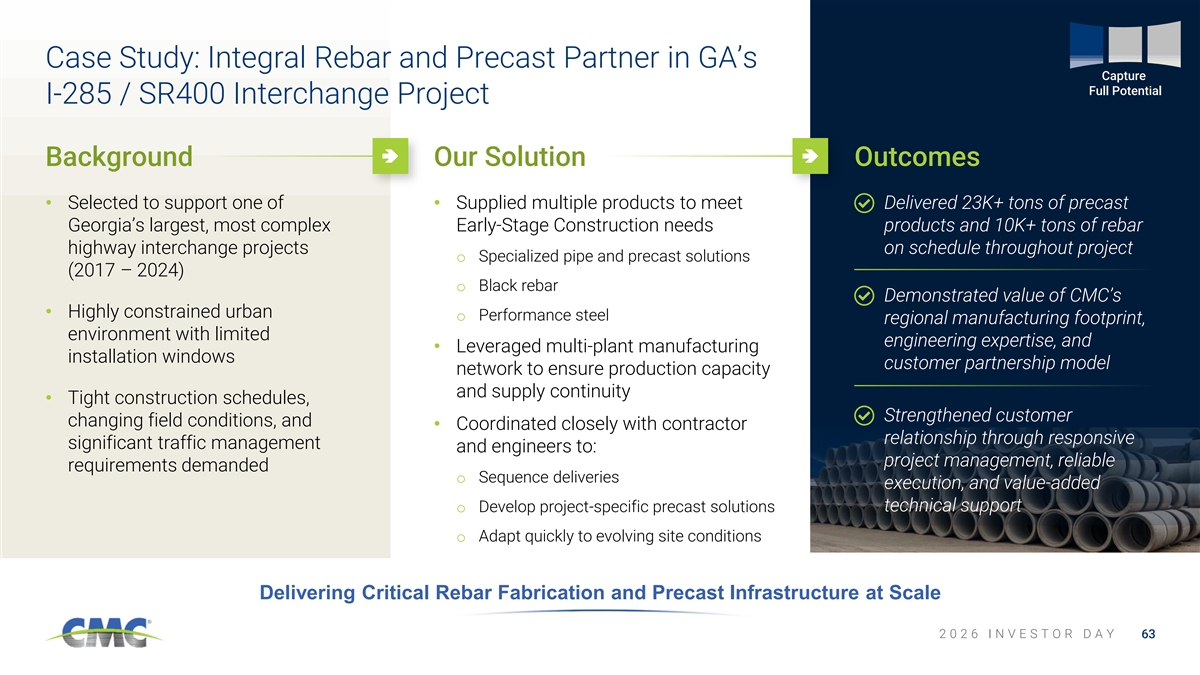
Case Study: Integral Rebar and Precast Partner in GA’s Capture Full Potential I-285 / SR400 Interchange Project Background Our Solution Outcomes • Selected to support one of • Supplied multiple products to meet Delivered 23K+ tons of precast Georgia’s largest, most complex Early-Stage Construction needs products and 10K+ tons of rebar highway interchange projects on schedule throughout project o Specialized pipe and precast solutions (2017 – 2024) o Black rebar Demonstrated value of CMC’s • Highly constrained urban o Performance steel regional manufacturing footprint, environment with limited engineering expertise, and • Leveraged multi-plant manufacturing installation windows customer partnership model network to ensure production capacity and supply continuity • Tight construction schedules, Strengthened customer changing field conditions, and • Coordinated closely with contractor relationship through responsive significant traffic management and engineers to: project management, reliable requirements demanded o Sequence deliveries execution, and value-added technical support o Develop project-specific precast solutions o Adapt quickly to evolving site conditions Delivering Critical Rebar Fabrication and Precast Infrastructure at Scale 2 0 2 6 I N V E S T O R D A Y 63
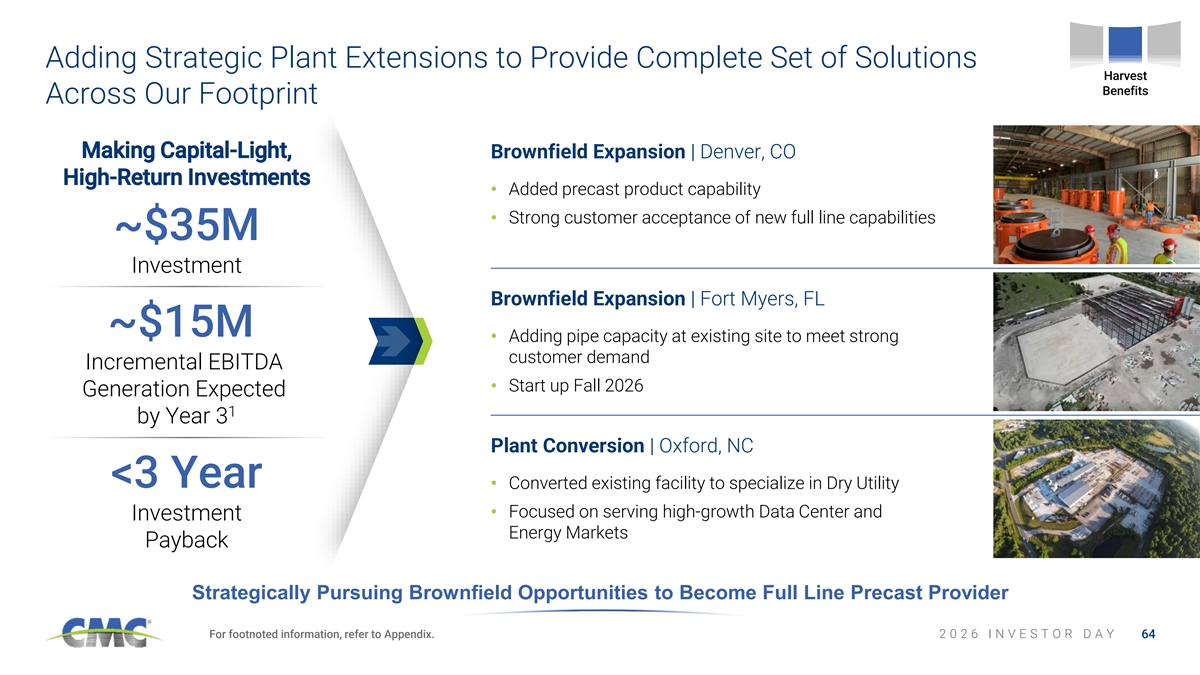
Adding Strategic Plant Extensions to Provide Complete Set of Solutions Harvest Benefits Across Our Footprint Making Capital-Light, Brownfield Expansion | Denver, CO High-Return Investments • Added precast product capability • Strong customer acceptance of new full line capabilities ~$35M Investment Brownfield Expansion | Fort Myers, FL ~$15M • Adding pipe capacity at existing site to meet strong customer demand Incremental EBITDA • Start up Fall 2026 Generation Expected 1 by Year 3 Plant Conversion | Oxford, NC <3 Year • Converted existing facility to specialize in Dry Utility • Focused on serving high-growth Data Center and Investment Energy Markets Payback Strategically Pursuing Brownfield Opportunities to Become Full Line Precast Provider For footnoted information, refer to Appendix. 2 0 2 6 I N V E S T O R D A Y 64
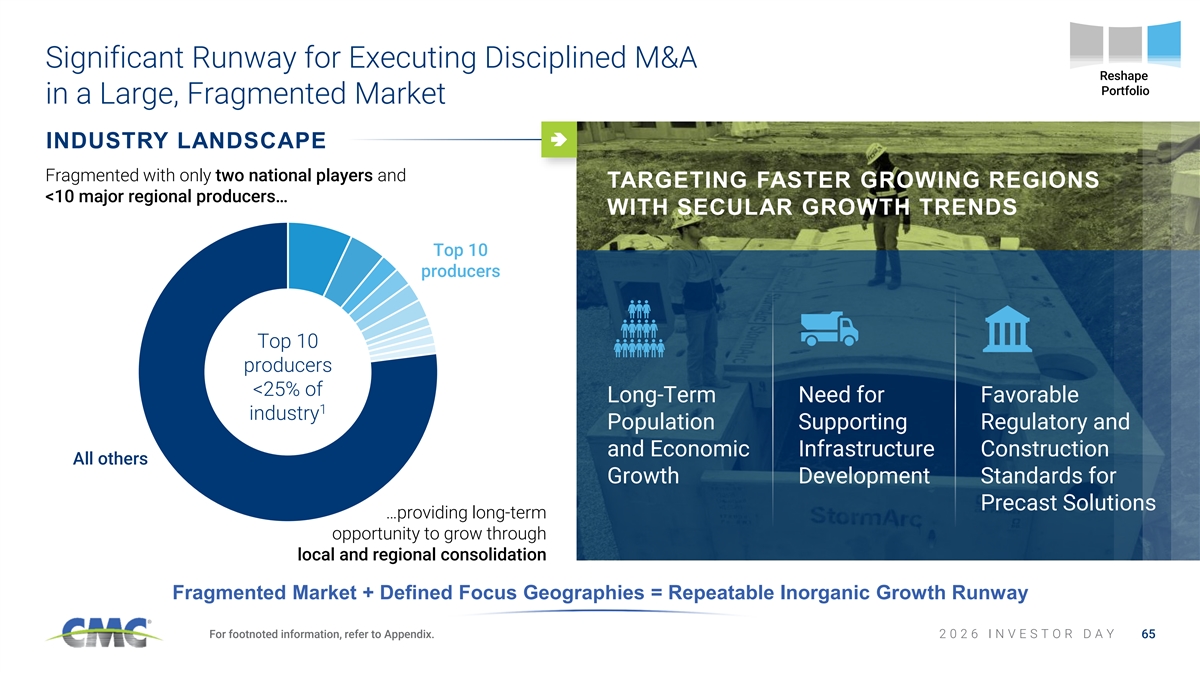
Significant Runway for Executing Disciplined M&A Reshape Portfolio in a Large, Fragmented Market INDUSTRY LANDSCAPE Fragmented with only two national players and TARGETING FASTER GROWING REGIONS <10 major regional producers… WITH SECULAR GROWTH TRENDS Top 10 producers Top 10 producers <25% of Long-Term Need for Favorable 1 industry Population Supporting Regulatory and and Economic Infrastructure Construction All others Growth Development Standards for Precast Solutions …providing long-term opportunity to grow through local and regional consolidation Fragmented Market + Defined Focus Geographies = Repeatable Inorganic Growth Runway For footnoted information, refer to Appendix. 2 0 2 6 I N V E S T O R D A Y 65
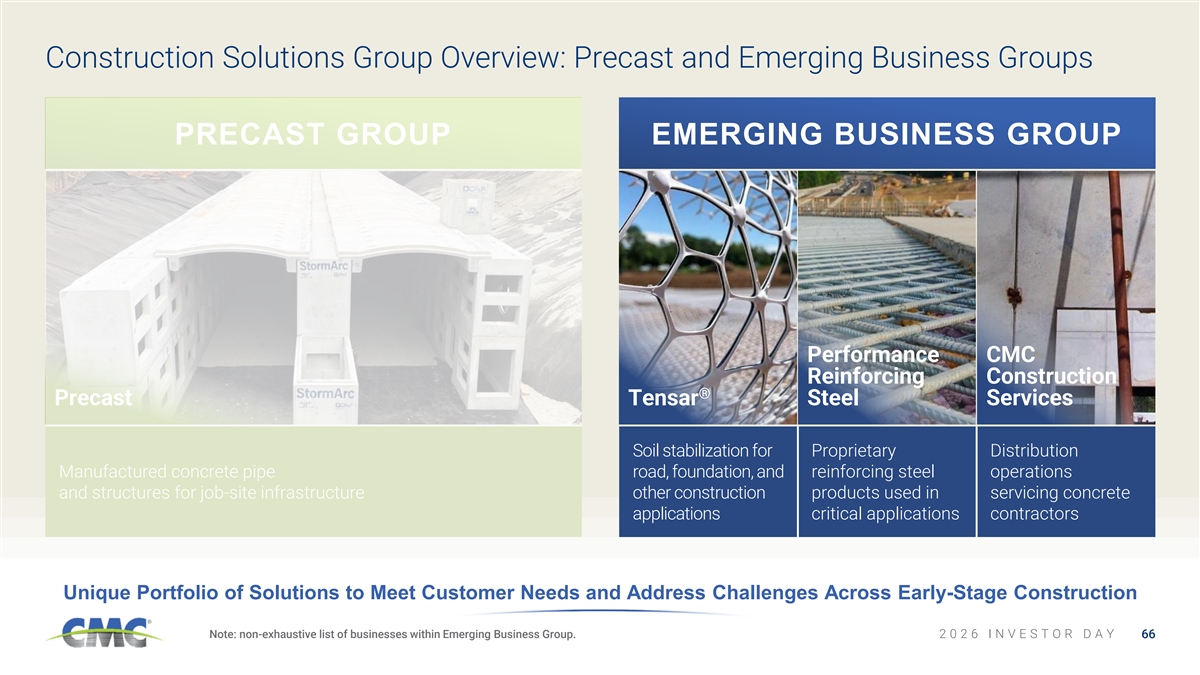
Construction Solutions Group Overview: Precast and Emerging Business Groups PRECAST GROUP EMERGING BUSINESS GROUP Performance CMC Reinforcing Construction ® Precast Tensar Steel Services Soil stabilization for Proprietary Distribution Manufactured concrete pipe road, foundation, and reinforcing steel operations and structures for job-site infrastructure other construction products used in servicing concrete applications critical applications contractors Unique Portfolio of Solutions to Meet Customer Needs and Address Challenges Across Early-Stage Construction Note: non-exhaustive list of businesses within Emerging Business Group. 2 0 2 6 I N V E S T O R D A Y 66
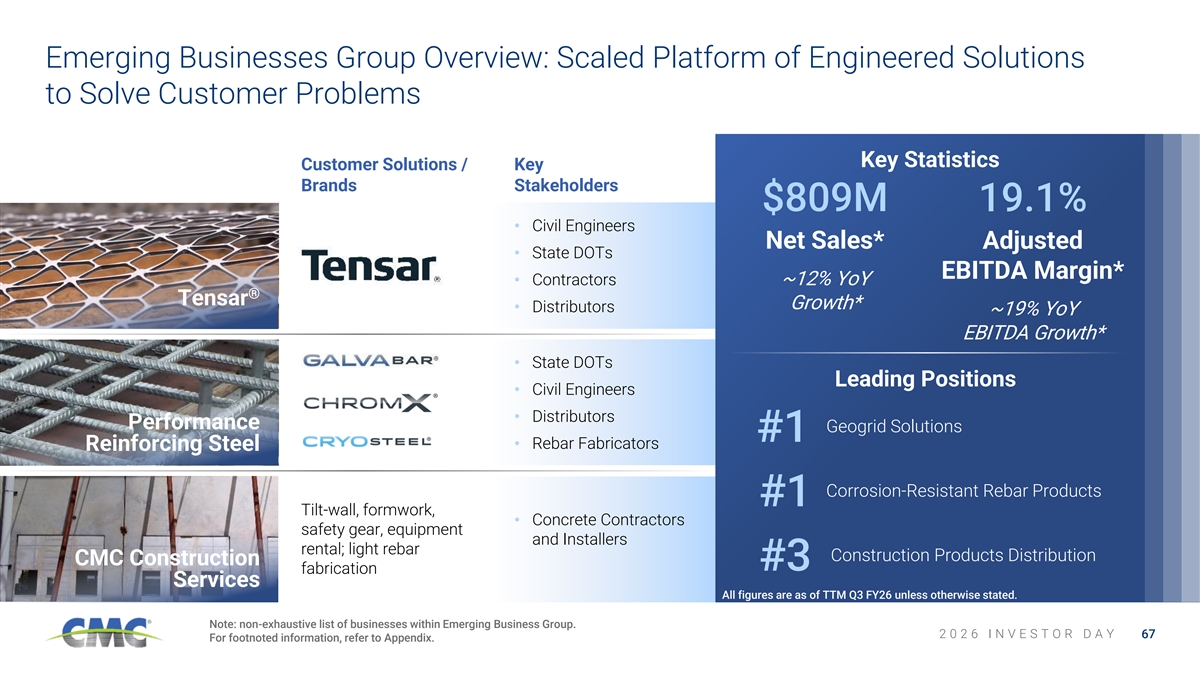
Emerging Businesses Group Overview: Scaled Platform of Engineered Solutions to Solve Customer Problems Key Statistics Customer Solutions / Key Brands Stakeholders $809M 19.1% • Civil Engineers Net Sales* Adjusted • State DOTs EBITDA Margin* • Contractors ~12% YoY ® Tensar Growth* • Distributors ~19% YoY EBITDA Growth* • State DOTs Leading Positions • Civil Engineers • Distributors Performance Geogrid Solutions #1 • Rebar Fabricators Reinforcing Steel Corrosion-Resistant Rebar Products #1 Tilt-wall, formwork, • Concrete Contractors safety gear, equipment and Installers rental; light rebar Construction Products Distribution CMC Construction #3 fabrication Services All figures are as of TTM Q3 FY26 unless otherwise stated. Note: non-exhaustive list of businesses within Emerging Business Group. 2 0 2 6 I N V E S T O R D A Y 67 For footnoted information, refer to Appendix.
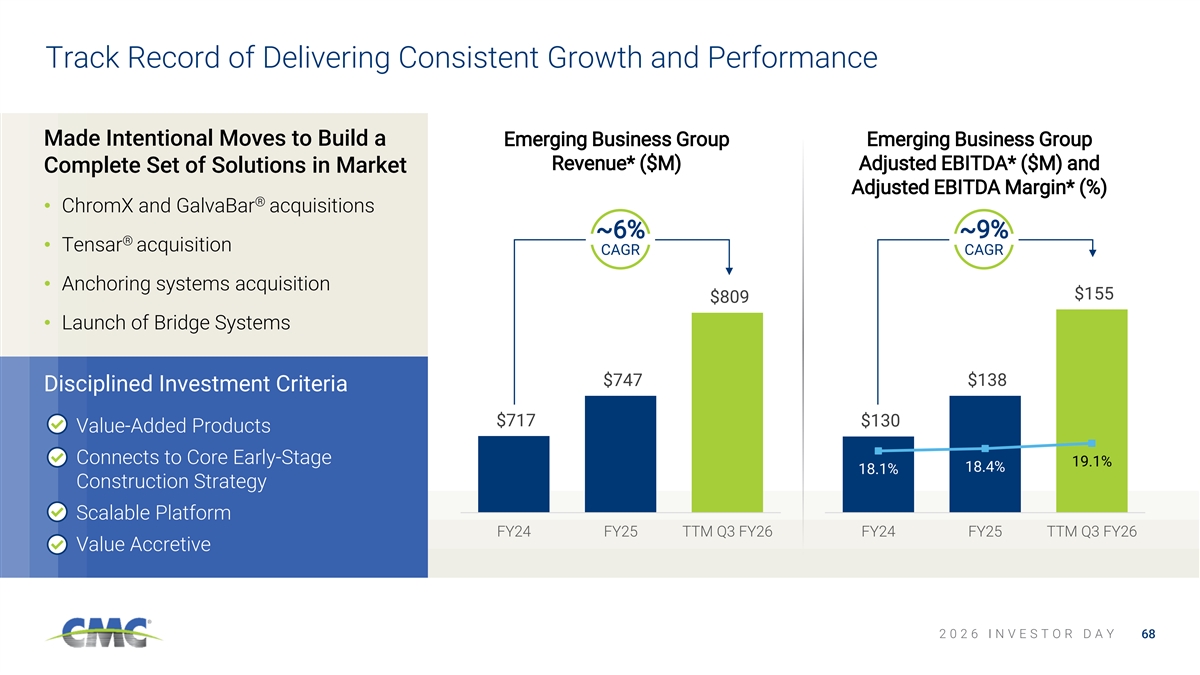
Track Record of Delivering Consistent Growth and Performance Made Intentional Moves to Build a Emerging Business Group Emerging Business Group Revenue* ($M) Adjusted EBITDA* ($M) and Complete Set of Solutions in Market Adjusted EBITDA Margin* (%) ® • ChromX and GalvaBar acquisitions ~6% ~9% ® • Tensar acquisition CAGR CAGR $160 40.0% • Anchoring systems acquisition $155 $809 $155 35.0% • Launch of Bridge Systems $150 $145 30.0% $747 $140 $138 Disciplined Investment Criteria 25.0% $135 $717 $130 Value-Added Products $130 20.0% $125 Connects to Core Early-Stage 19.1% 18.4% 18.1% 15.0% $120 Construction Strategy $115 10.0% Scalable Platform FY24 FY25 TTM Q3 FY26 FY24 FY25 TTM Q3 FY26 Value Accretive 2 0 2 6 I N V E S T O R D A Y 68
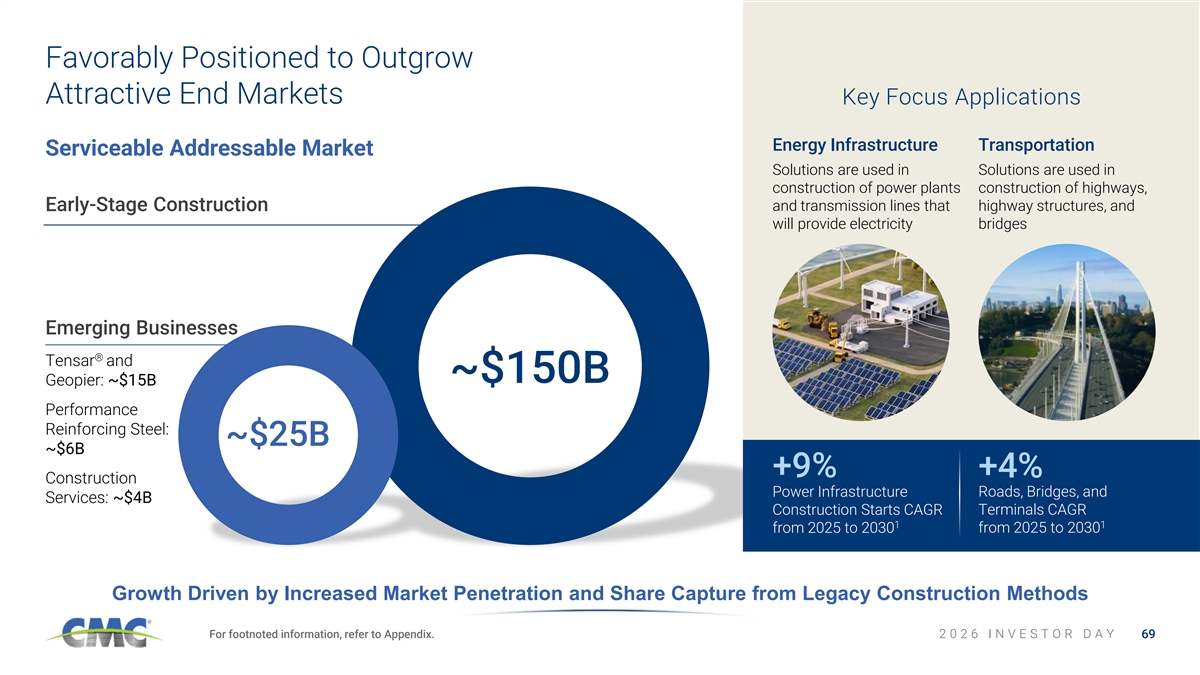
Favorably Positioned to Outgrow Attractive End Markets Key Focus Applications Energy Infrastructure Transportation Serviceable Addressable Market Solutions are used in Solutions are used in construction of power plants construction of highways, Early-Stage Construction and transmission lines that highway structures, and will provide electricity bridges Emerging Businesses ® Tensar and ~$150B Geopier: ~$15B Performance Reinforcing Steel: ~$25B ~$6B +9% +4% Construction Roads, Bridges, and Power Infrastructure Services: ~$4B Construction Starts CAGR Terminals CAGR 1 1 from 2025 to 2030 from 2025 to 2030 Growth Driven by Increased Market Penetration and Share Capture from Legacy Construction Methods For footnoted information, refer to Appendix. 2 0 2 6 I N V E S T O R D A Y 69
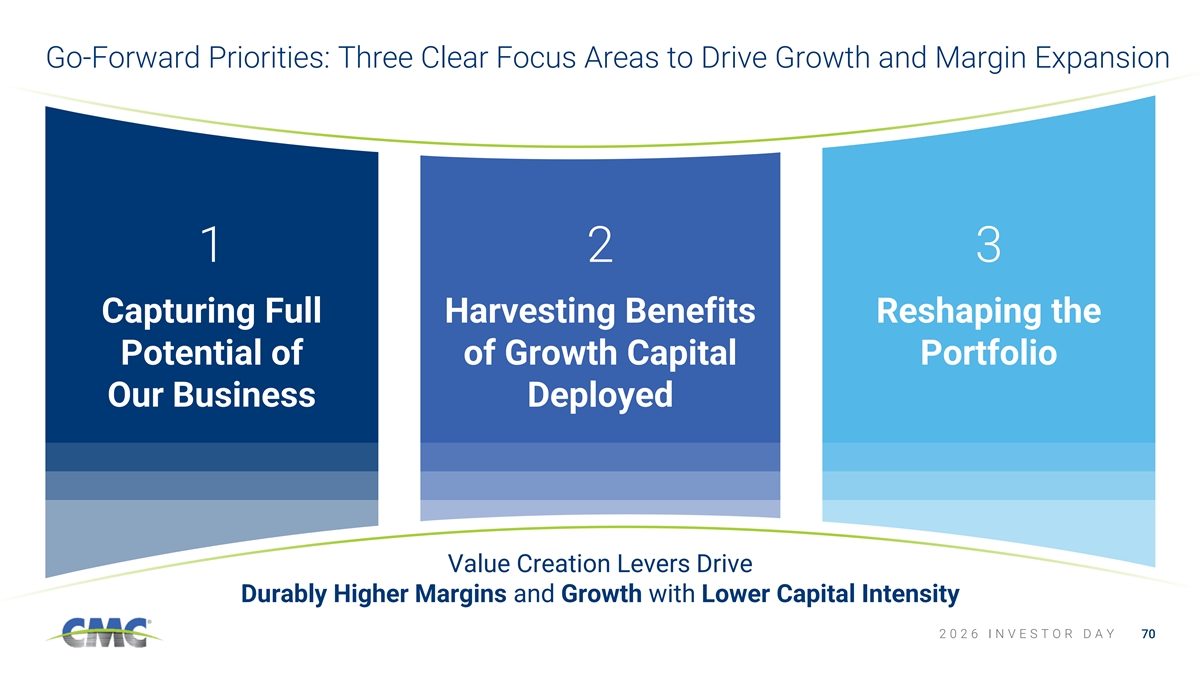
Go-Forward Priorities: Three Clear Focus Areas to Drive Growth and Margin Expansion 1 2 3 Capturing Full Harvesting Benefits Reshaping the Potential of of Growth Capital Portfolio Our Business Deployed Value Creation Levers Drive Durably Higher Margins and Growth with Lower Capital Intensity 2 0 2 6 I N V E S T O R D A Y 70
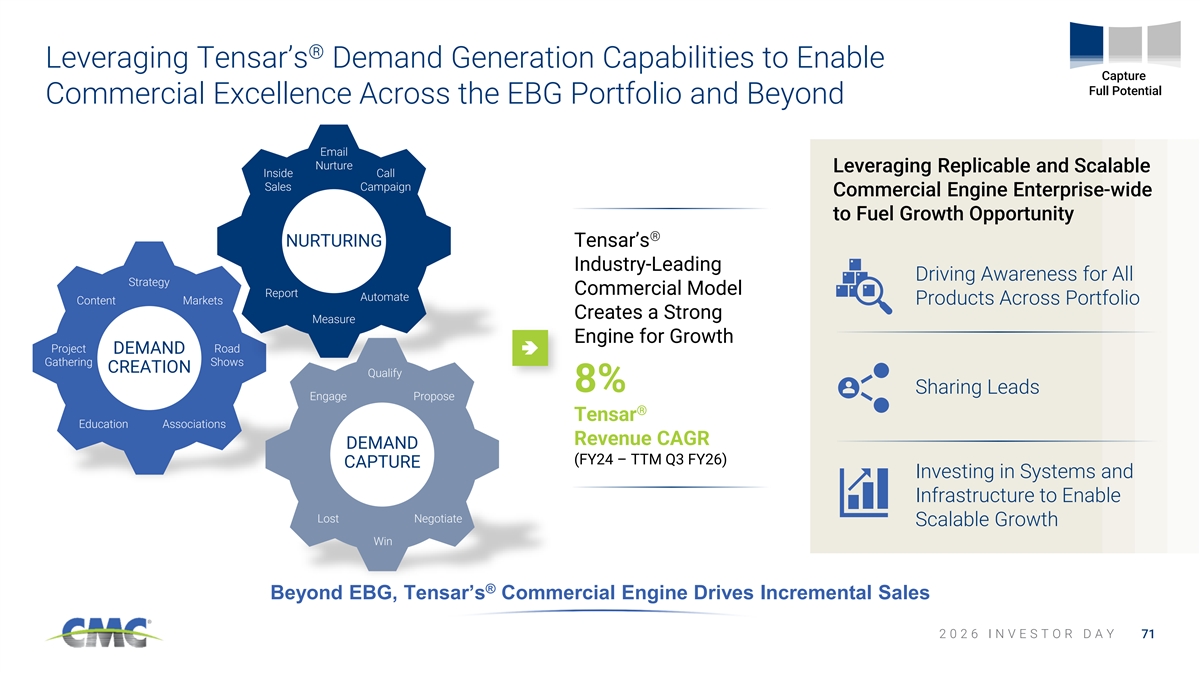
® Leveraging Tensar’s Demand Generation Capabilities to Enable Capture Full Potential Commercial Excellence Across the EBG Portfolio and Beyond Email Nurture Leveraging Replicable and Scalable Inside Call Sales Campaign Commercial Engine Enterprise-wide to Fuel Growth Opportunity ® NURTURING Tensar’s Industry-Leading Driving Awareness for All Strategy Commercial Model Report Automate Content Markets Products Across Portfolio Creates a Strong Measure Engine for Growth Project Road DEMAND Gathering Shows CREATION Qualify 8% Sharing Leads Engage Propose ® Tensar Education Associations Revenue CAGR DEMAND (FY24 – TTM Q3 FY26) CAPTURE Investing in Systems and Infrastructure to Enable Lost Negotiate Scalable Growth Win ® Beyond EBG, Tensar’s Commercial Engine Drives Incremental Sales 2 0 2 6 I N V E S T O R D A Y 71
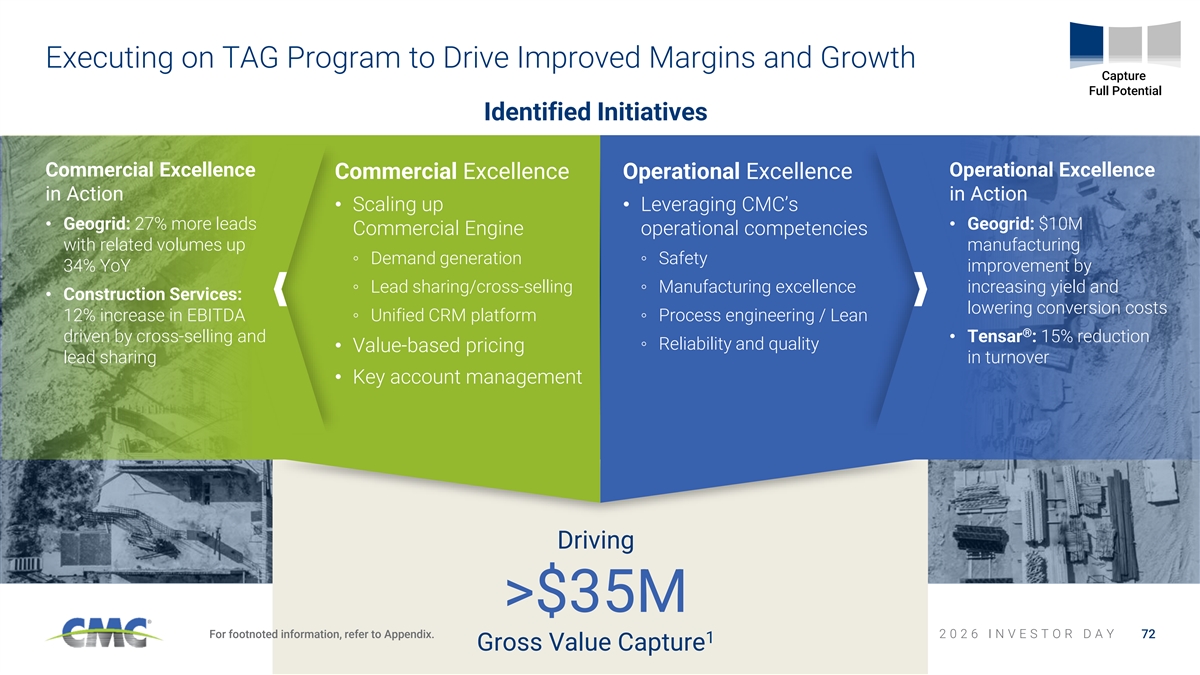
Executing on TAG Program to Drive Improved Margins and Growth Capture Full Potential Identified Initiatives Commercial Excellence Operational Excellence Commercial Excellence Operational Excellence in Action in Action • Scaling up • Leveraging CMC’s • Geogrid: 27% more leads • Geogrid: $10M Commercial Engine operational competencies with related volumes up manufacturing ◦ Demand generation◦ Safety 34% YoY improvement by ◦ Lead sharing/cross-selling◦ Manufacturing excellence increasing yield and • Construction Services: lowering conversion costs 12% increase in EBITDA ◦ Unified CRM platform◦ Process engineering / Lean ® driven by cross-selling and • Tensar : 15% reduction ◦ Reliability and quality • Value-based pricing lead sharing in turnover • Key account management Driving >$35M For footnoted information, refer to Appendix. 2 0 2 6 I N V E S T O R D A Y 72 1 Gross Value Capture
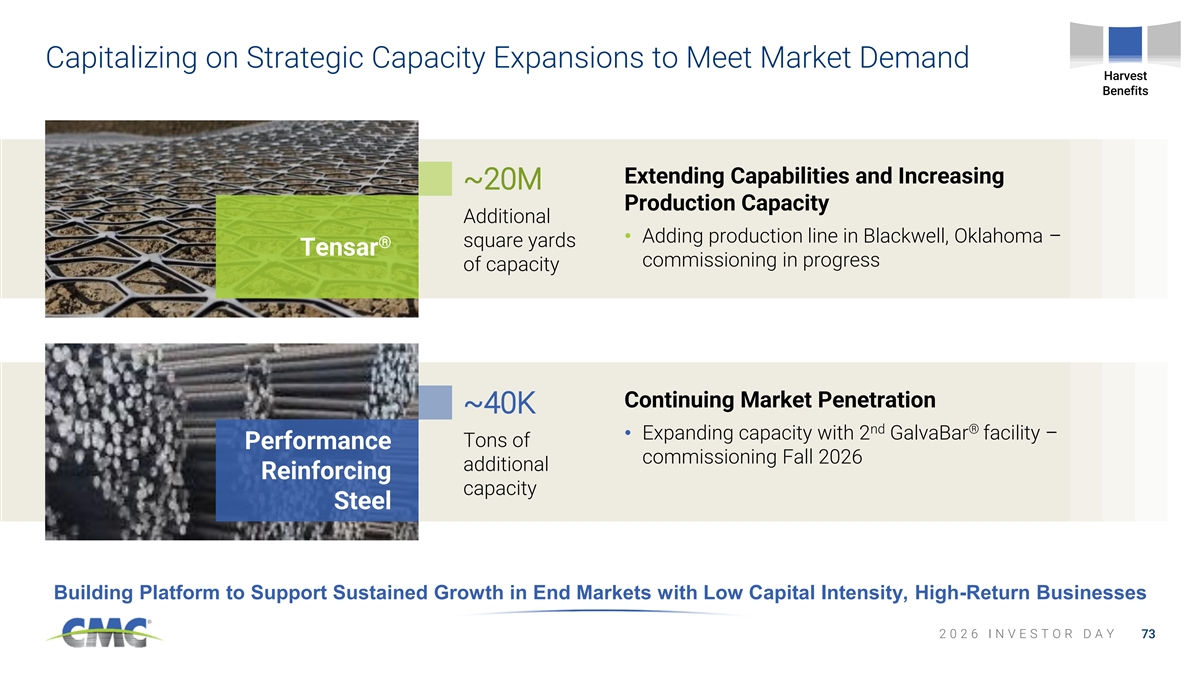
Capitalizing on Strategic Capacity Expansions to Meet Market Demand Harvest Benefits Extending Capabilities and Increasing ~20M Production Capacity Additional • Adding production line in Blackwell, Oklahoma – square yards ® Tensar commissioning in progress of capacity Continuing Market Penetration ~40K nd ® • Expanding capacity with 2 GalvaBar facility – Tons of Performance commissioning Fall 2026 additional Reinforcing capacity Steel Building Platform to Support Sustained Growth in End Markets with Low Capital Intensity, High-Return Businesses 2 0 2 6 I N V E S T O R D A Y 73
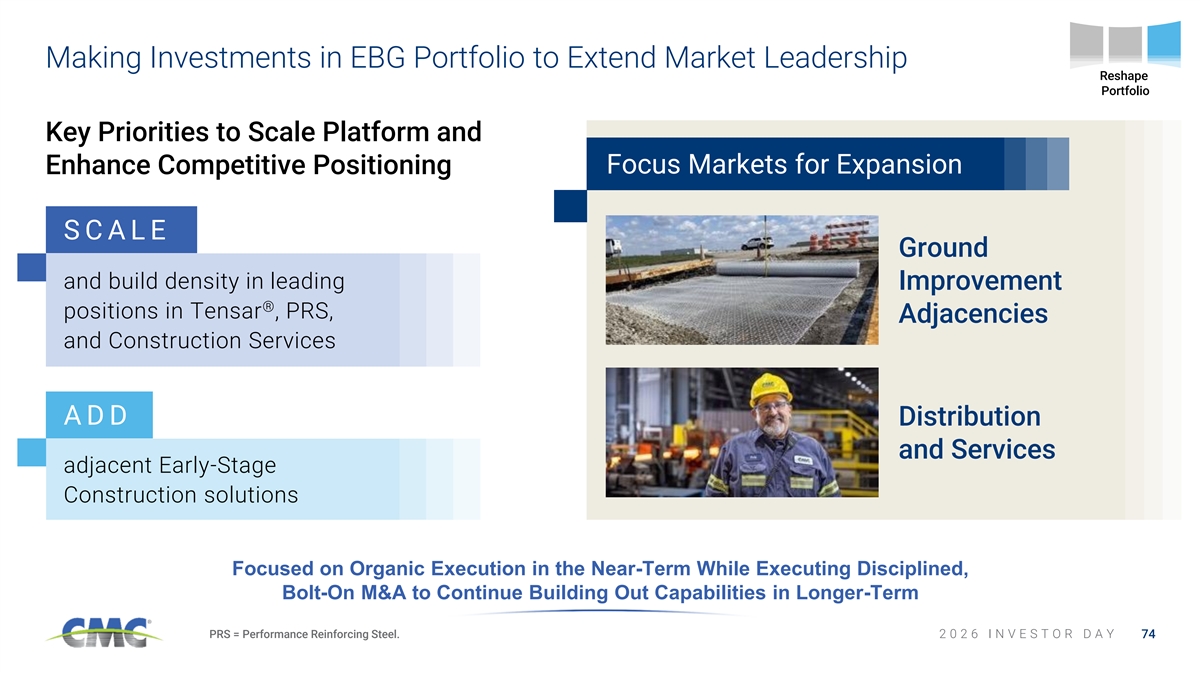
Making Investments in EBG Portfolio to Extend Market Leadership Reshape Portfolio Key Priorities to Scale Platform and Focus Markets for Expansion Enhance Competitive Positioning S C A L E Ground and build density in leading Improvement ® positions in Tensar , PRS, Adjacencies and Construction Services A D D Distribution and Services adjacent Early-Stage Construction solutions Focused on Organic Execution in the Near-Term While Executing Disciplined, Bolt-On M&A to Continue Building Out Capabilities in Longer-Term PRS = Performance Reinforcing Steel. 2 0 2 6 I N V E S T O R D A Y 74
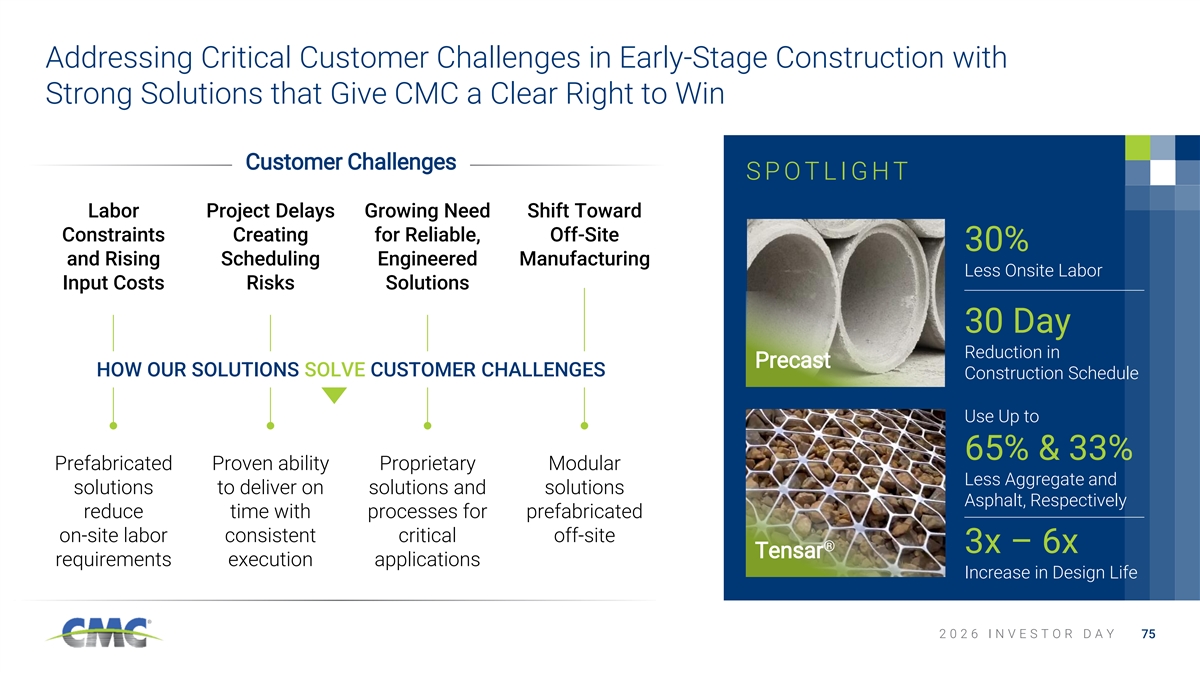
Addressing Critical Customer Challenges in Early-Stage Construction with Strong Solutions that Give CMC a Clear Right to Win Customer Challenges S P O T L I G H T Labor Project Delays Growing Need Shift Toward Constraints Creating for Reliable, Off-Site 30% and Rising Scheduling Engineered Manufacturing Less Onsite Labor Input Costs Risks Solutions 30 Day Reduction in Precast HOW OUR SOLUTIONS SOLVE CUSTOMER CHALLENGES Construction Schedule Use Up to 65% & 33% Prefabricated Proven ability Proprietary Modular Less Aggregate and solutions to deliver on solutions and solutions Asphalt, Respectively reduce time with processes for prefabricated on-site labor consistent critical off-site ® 3x – 6x Tensar requirements execution applications Increase in Design Life 2 0 2 6 I N V E S T O R D A Y 75
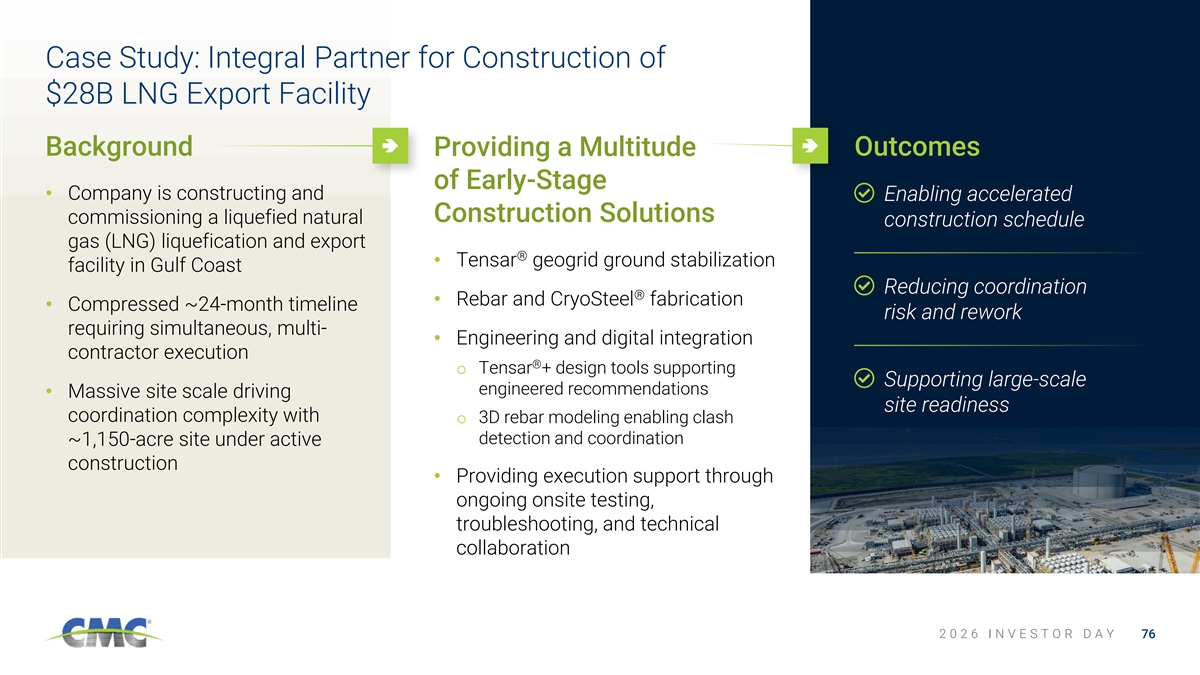
Case Study: Integral Partner for Construction of $28B LNG Export Facility Background Providing a Multitude Outcomes of Early-Stage • Company is constructing and Enabling accelerated Construction Solutions commissioning a liquefied natural construction schedule gas (LNG) liquefication and export ® • Tensar geogrid ground stabilization facility in Gulf Coast Reducing coordination ® • Rebar and CryoSteel fabrication • Compressed ~24-month timeline risk and rework requiring simultaneous, multi- • Engineering and digital integration contractor execution ® o Tensar + design tools supporting Supporting large-scale engineered recommendations • Massive site scale driving site readiness coordination complexity with o 3D rebar modeling enabling clash detection and coordination ~1,150-acre site under active construction • Providing execution support through ongoing onsite testing, troubleshooting, and technical collaboration 2 0 2 6 I N V E S T O R D A Y 76
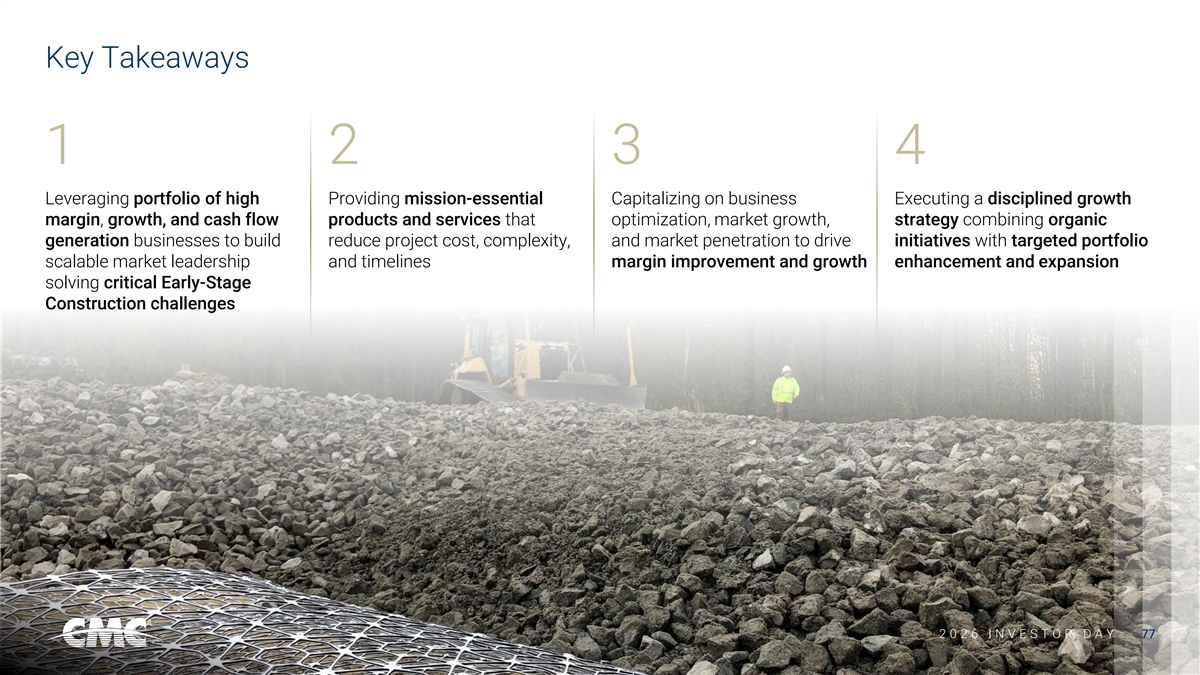
Key Takeaways 1 2 3 4 Leveraging portfolio of high Providing mission-essential Capitalizing on business Executing a disciplined growth margin, growth, and cash flow products and services that optimization, market growth, strategy combining organic generation businesses to build reduce project cost, complexity, and market penetration to drive initiatives with targeted portfolio scalable market leadership and timelines margin improvement and growth enhancement and expansion solving critical Early-Stage Construction challenges 2 2 0 0 2 2 6 6 I I N N V V E E S S T T O O R R D D A A Y Y 77 77
Driving Superior Financial Performance: Financial Overview and Outlook Paul Lawrence | SVP AND CHIEF FINANCIAL OFFICER 2 0 2 6 I N V E S T O R D A Y
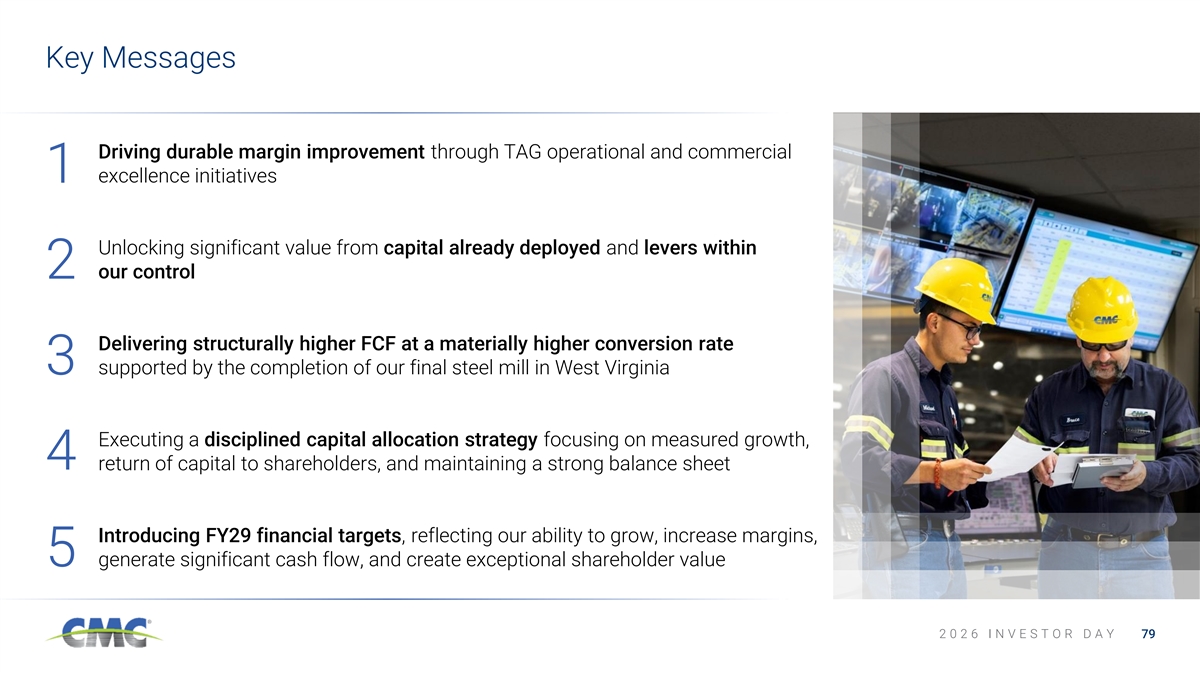
Key Messages Driving durable margin improvement through TAG operational and commercial 1 excellence initiatives Unlocking significant value from capital already deployed and levers within 2 our control Delivering structurally higher FCF at a materially higher conversion rate 3 supported by the completion of our final steel mill in West Virginia Executing a disciplined capital allocation strategy focusing on measured growth, 4 return of capital to shareholders, and maintaining a strong balance sheet Introducing FY29 financial targets, reflecting our ability to grow, increase margins, 5 generate significant cash flow, and create exceptional shareholder value 2 0 2 6 I N V E S T O R D A Y 79
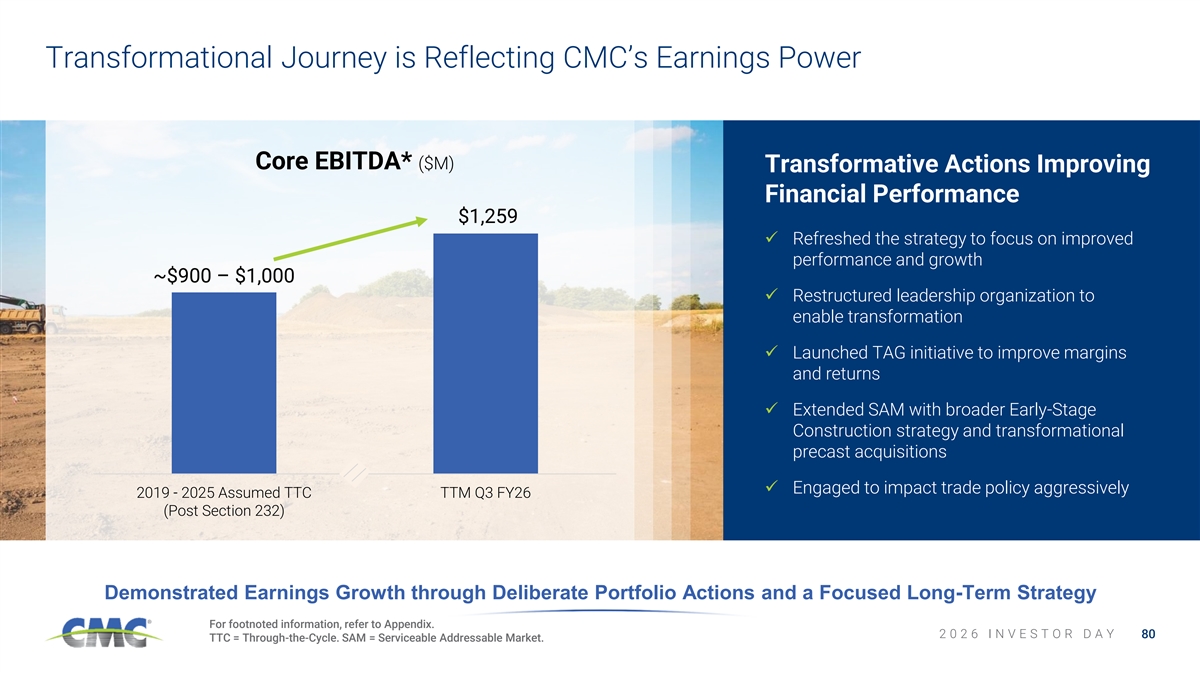
Transformational Journey is Reflecting CMC’s Earnings Power Core EBITDA* ($M) Transformative Actions Improving Financial Performance $1,400 $1,259 $1,200✓ Refreshed the strategy to focus on improved performance and growth ~$900 – $1,000 $1,000 ✓ Restructured leadership organization to $800 enable transformation ✓ Launched TAG initiative to improve margins $600 and returns $400 ✓ Extended SAM with broader Early-Stage $200 Construction strategy and transformational precast acquisitions $- ✓ Engaged to impact trade policy aggressively 2019 - 2025 Assumed TTC TTM Q3 FY26 (Post Section 232) Demonstrated Earnings Growth through Deliberate Portfolio Actions and a Focused Long-Term Strategy For footnoted information, refer to Appendix. 2 0 2 6 I N V E S T O R D A Y 80 TTC = Through-the-Cycle. SAM = Serviceable Addressable Market.
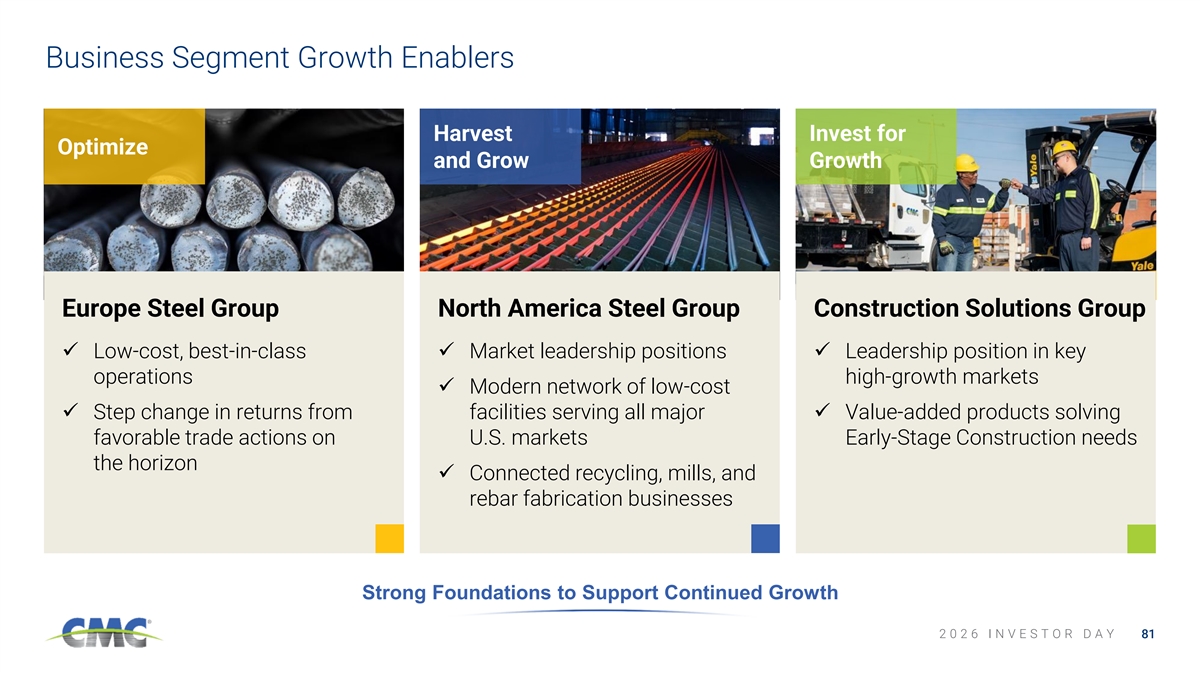
Business Segment Growth Enablers Harvest Invest for Optimize and Grow Growth Europe Steel Group North America Steel Group Construction Solutions Group ✓ Low-cost, best-in-class ✓ Market leadership positions✓ Leadership position in key operations high-growth markets ✓ Modern network of low-cost ✓ Step change in returns from facilities serving all major ✓ Value-added products solving favorable trade actions on U.S. markets Early-Stage Construction needs the horizon ✓ Connected recycling, mills, and rebar fabrication businesses Strong Foundations to Support Continued Growth 2 0 2 6 I N V E S T O R D A Y 81
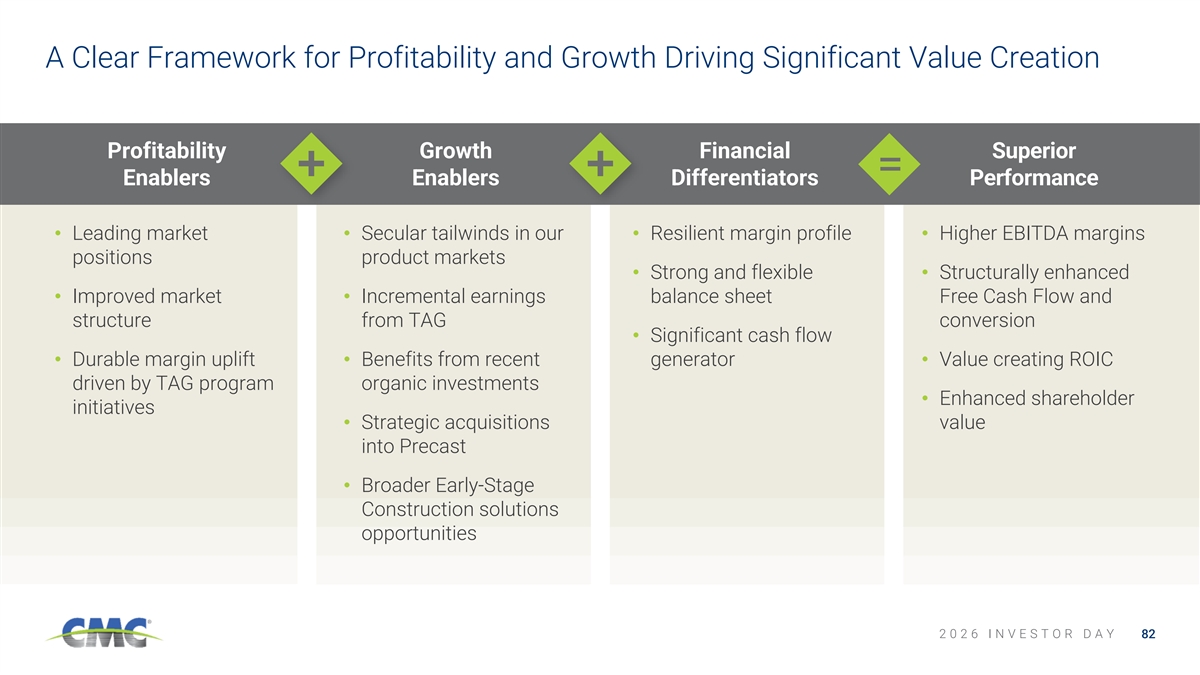
A Clear Framework for Profitability and Growth Driving Significant Value Creation Profitability Growth Financial Superior Enablers Enablers Differentiators Performance • Leading market • Secular tailwinds in our • Resilient margin profile• Higher EBITDA margins positions product markets • Strong and flexible • Structurally enhanced • Improved market • Incremental earnings balance sheet Free Cash Flow and structure from TAG conversion • Significant cash flow • Durable margin uplift • Benefits from recent generator• Value creating ROIC driven by TAG program organic investments • Enhanced shareholder initiatives • Strategic acquisitions value into Precast • Broader Early-Stage Construction solutions opportunities 2 0 2 6 I N V E S T O R D A Y 82
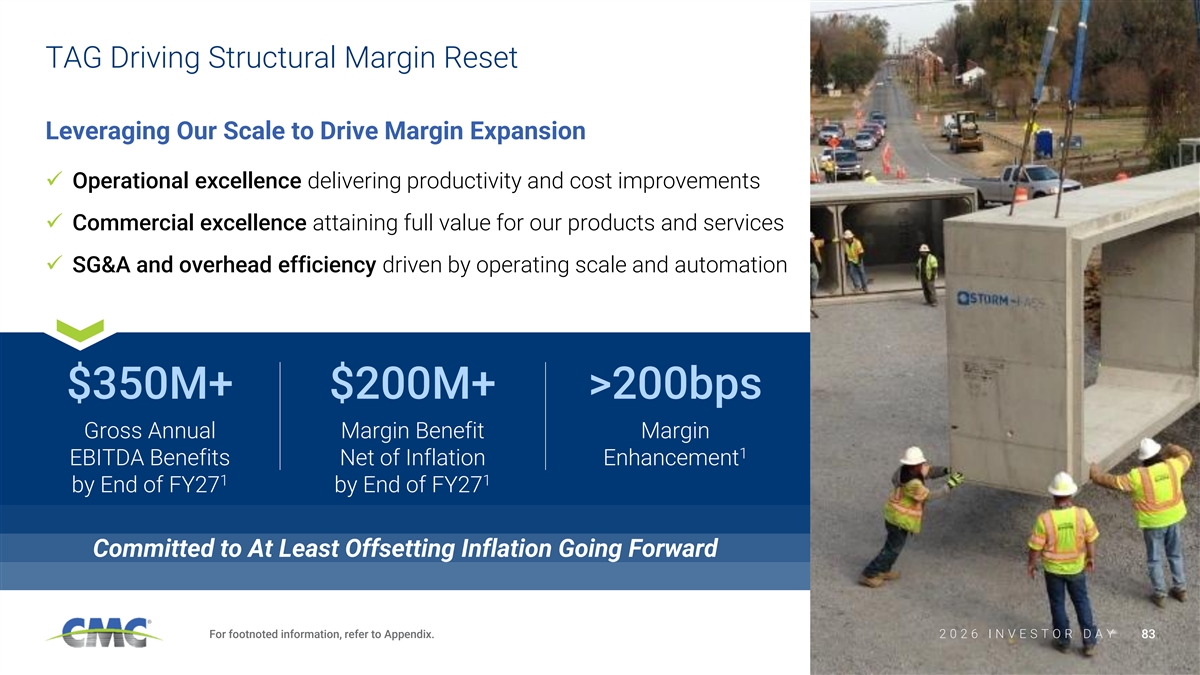
TAG Driving Structural Margin Reset Leveraging Our Scale to Drive Margin Expansion ✓ Operational excellence delivering productivity and cost improvements ✓ Commercial excellence attaining full value for our products and services ✓ SG&A and overhead efficiency driven by operating scale and automation $350M+ $200M+ >200bps Gross Annual Margin Benefit Margin 1 EBITDA Benefits Net of Inflation Enhancement 1 1 by End of FY27 by End of FY27 Committed to At Least Offsetting Inflation Going Forward For footnoted information, refer to Appendix. 2 2 0 0 2 2 6 6 I I N N V V E E S S T T O O R R D D A A Y Y 83
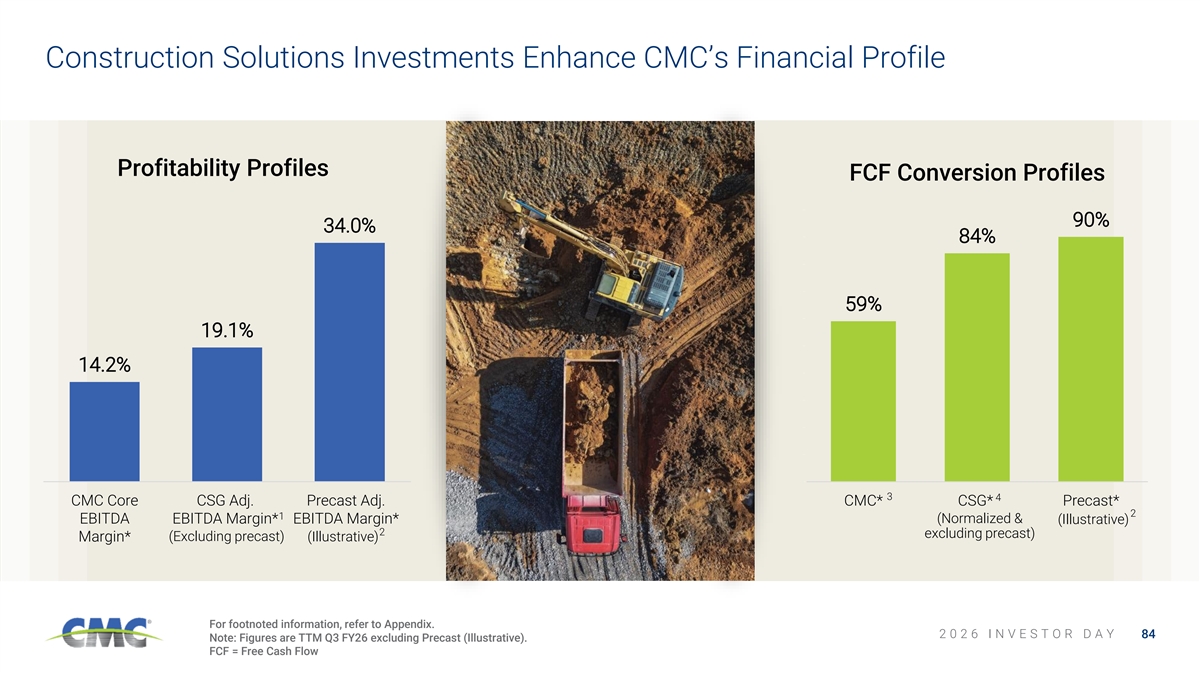
Construction Solutions Investments Enhance CMC’s Financial Profile Profitability Profiles FCF Conversion Profiles 40.0% 100% 90% 34.0% 35.0% 90% 84% 80% 30.0% 70% 25.0% 59% 60% 19.1% 20.0% 50% 14.2% 40% 15.0% 30% 10.0% 20% 5.0% 10% 0.0% 0% 3 4 CMC Core CSG Adj. Precast Adj. CMC* CSG* Precast* 2 1 EBITDA EBITDA Margin* EBITDA Margin* (Normalized & (Illustrative) 2 excluding precast) Margin* (Excluding precast) (Illustrative) For footnoted information, refer to Appendix. 2 0 2 6 I N V E S T O R D A Y 84 Note: Figures are TTM Q3 FY26 excluding Precast (Illustrative). FCF = Free Cash Flow
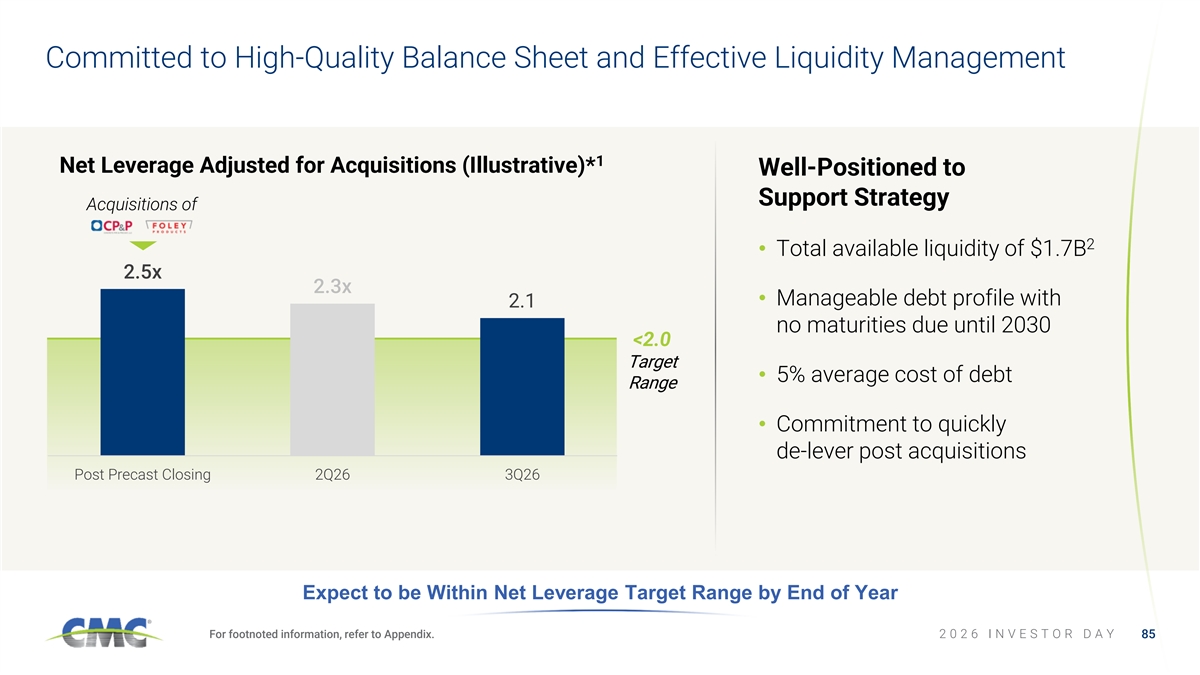
Committed to High-Quality Balance Sheet and Effective Liquidity Management 1 Net Leverage Adjusted for Acquisitions (Illustrative)* Well-Positioned to Support Strategy Acquisitions of 2 • Total available liquidity of $1.7B 2.5x 2.3x • Manageable debt profile with 2.1 no maturities due until 2030 <2.0 Target • 5% average cost of debt Range • Commitment to quickly de-lever post acquisitions Post Precast Closing 2Q26 3Q26 Expect to be Within Net Leverage Target Range by End of Year For footnoted information, refer to Appendix. 2 0 2 6 I N V E S T O R D A Y 85
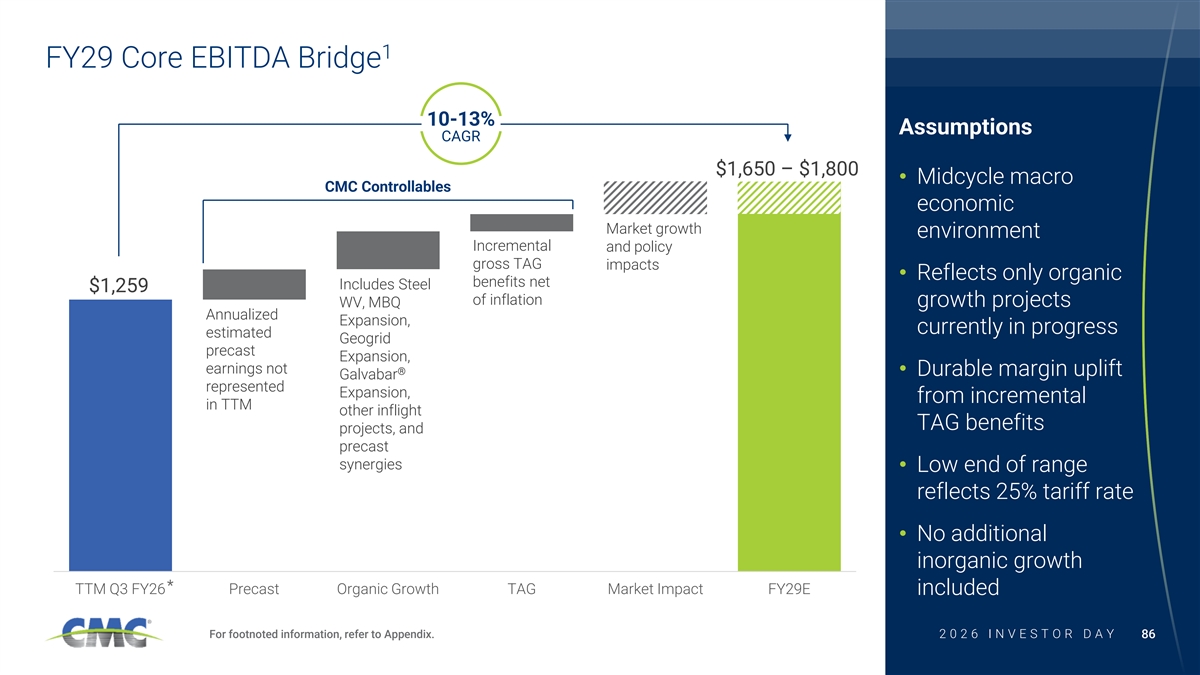
1 FY29 Core EBITDA Bridge 10-13% Assumptions CAGR $1,650 – $1,800 • Midcycle macro CMC Controllables economic Market growth environment Incremental and policy gross TAG impacts • Reflects only organic benefits net Includes Steel $1,259 of inflation WV, MBQ growth projects Annualized Expansion, currently in progress estimated Geogrid precast Expansion, earnings not ® • Durable margin uplift Galvabar represented Expansion, from incremental in TTM other inflight TAG benefits projects, and precast synergies • Low end of range reflects 25% tariff rate • No additional inorganic growth * TTM Q3 FY26 Precast Organic Growth TAG Market Impact FY29E included For footnoted information, refer to Appendix. 2 2 0 0 2 2 6 6 I I N N V V E E S S T T O O R R D D A A Y Y 86
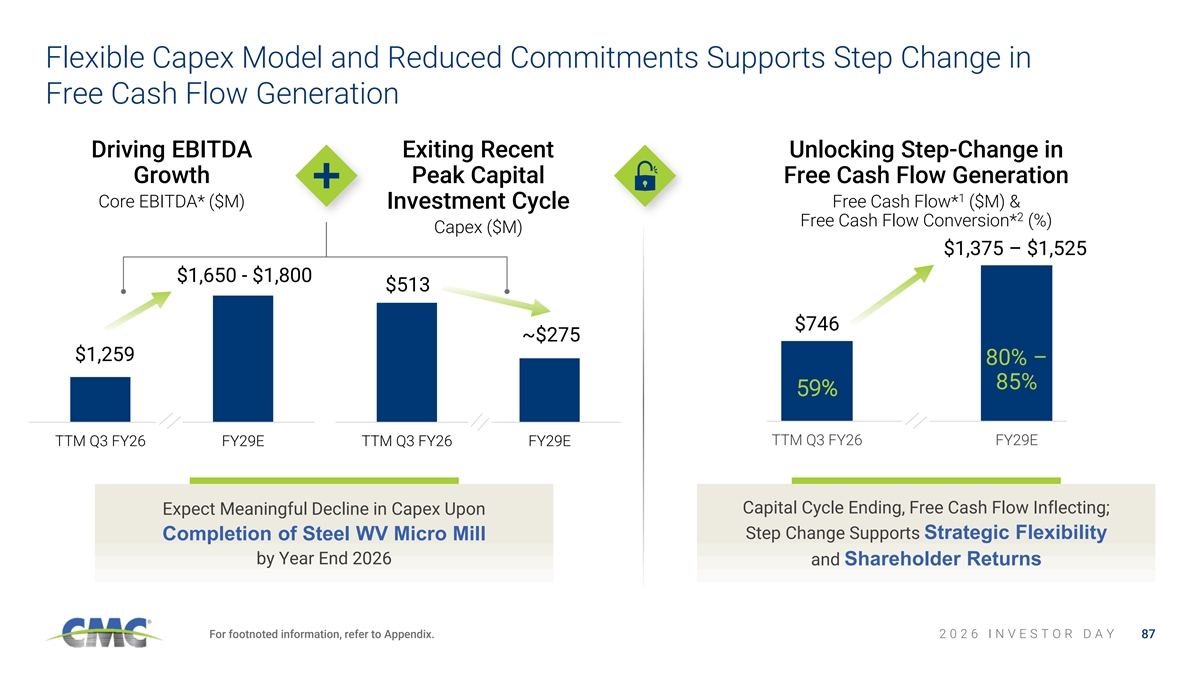
Flexible Capex Model and Reduced Commitments Supports Step Change in Free Cash Flow Generation Driving EBITDA Exiting Recent Unlocking Step-Change in Growth Peak Capital Free Cash Flow Generation 1 Core EBITDA* ($M) Free Cash Flow* ($M) & Investment Cycle 2 Free Cash Flow Conversion* (%) Capex ($M) $1,600 900% $1,375 – $1,525 800% $1,400 $1,650 - $1,800 700% $513 $1,200 600% $1,000 500% $746 $800 ~$275 400% $600 $1,259 80% – 300% $400 200% 85% 59% $200 100% $0 0% TTM Q3 FY26 FY29E TTM Q3 FY26 FY29E TTM Q3 FY26 FY29E Capital Cycle Ending, Free Cash Flow Inflecting; Expect Meaningful Decline in Capex Upon Step Change Supports Strategic Flexibility Completion of Steel WV Micro Mill by Year End 2026 and Shareholder Returns For footnoted information, refer to Appendix. 2 0 2 6 I N V E S T O R D A Y 87
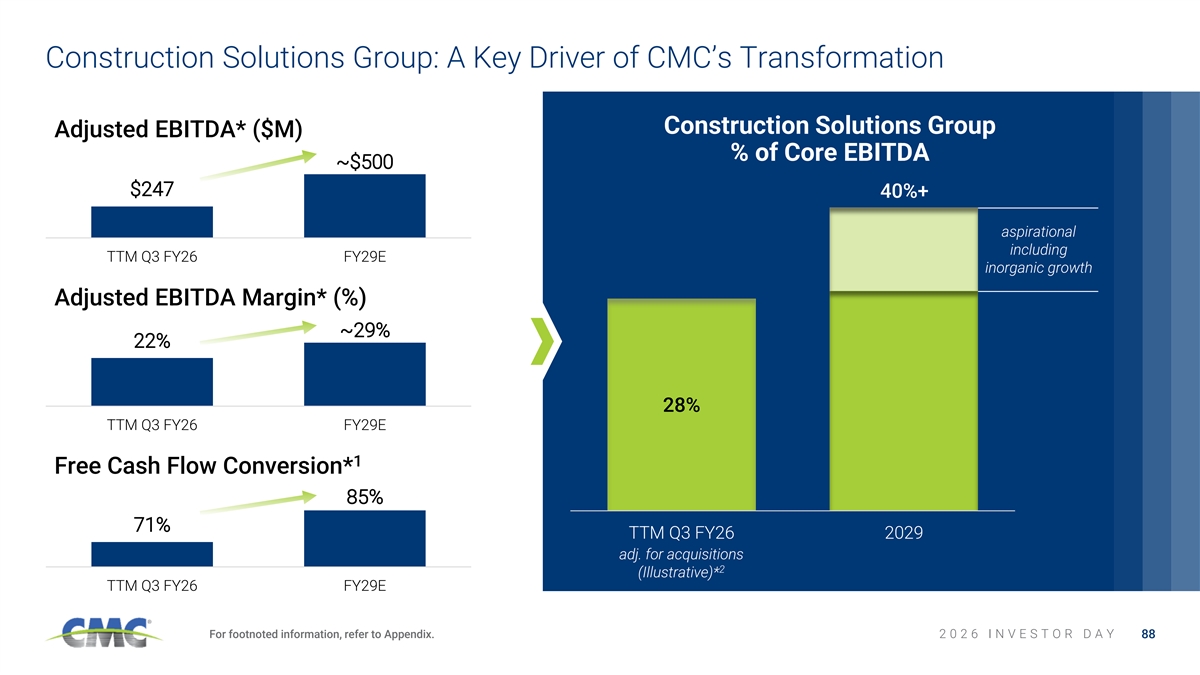
Construction Solutions Group: A Key Driver of CMC’s Transformation Construction Solutions Group Adjusted EBITDA* ($M) % of Core EBITDA 600 ~$500 500 400 $247 40%+ 300 200 100 aspirational 0 including TTM Q3 FY26 FY29E inorganic growth Adjusted EBITDA Margin* (%) 35.0% ~29% 30.0% 22% 25.0% 20.0% 15.0% 10.0% 5.0% 0.0% 28% TTM Q3 FY26 FY29E 1 Free Cash Flow Conversion* 90% 85% 85% 80% 71% 75% TTM Q3 FY26 2029 70% 65% adj. for acquisitions 60% 2 (Illustrative)* TTM Q3 FY26 FY29E For footnoted information, refer to Appendix. 2 0 2 6 I N V E S T O R D A Y 88
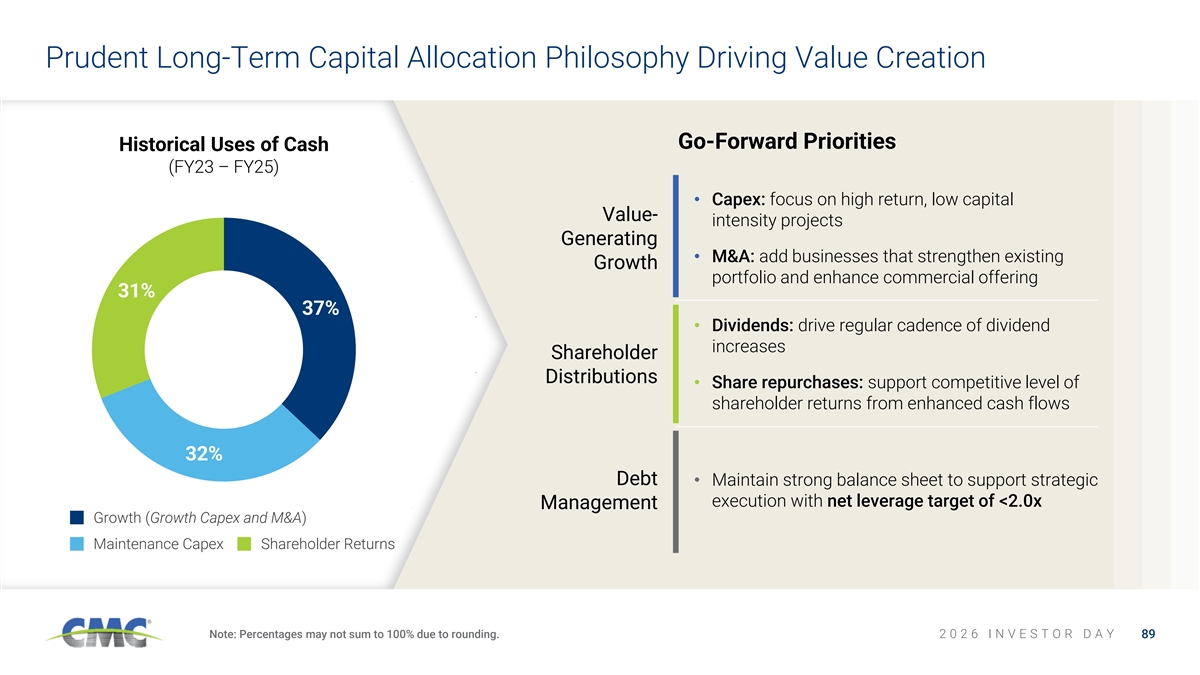
Prudent Long-Term Capital Allocation Philosophy Driving Value Creation Go-Forward Priorities Historical Uses of Cash (FY23 – FY25) • Capex: focus on high return, low capital Value- intensity projects Generating • M&A: add businesses that strengthen existing Growth portfolio and enhance commercial offering 31% 37% • Dividends: drive regular cadence of dividend increases Shareholder Distributions • Share repurchases: support competitive level of shareholder returns from enhanced cash flows 32% Debt • Maintain strong balance sheet to support strategic execution with net leverage target of <2.0x Management Growth (Growth Capex and M&A) Maintenance Capex Shareholder Returns Note: Percentages may not sum to 100% due to rounding. 2 0 2 6 I N V E S T O R D A Y 89
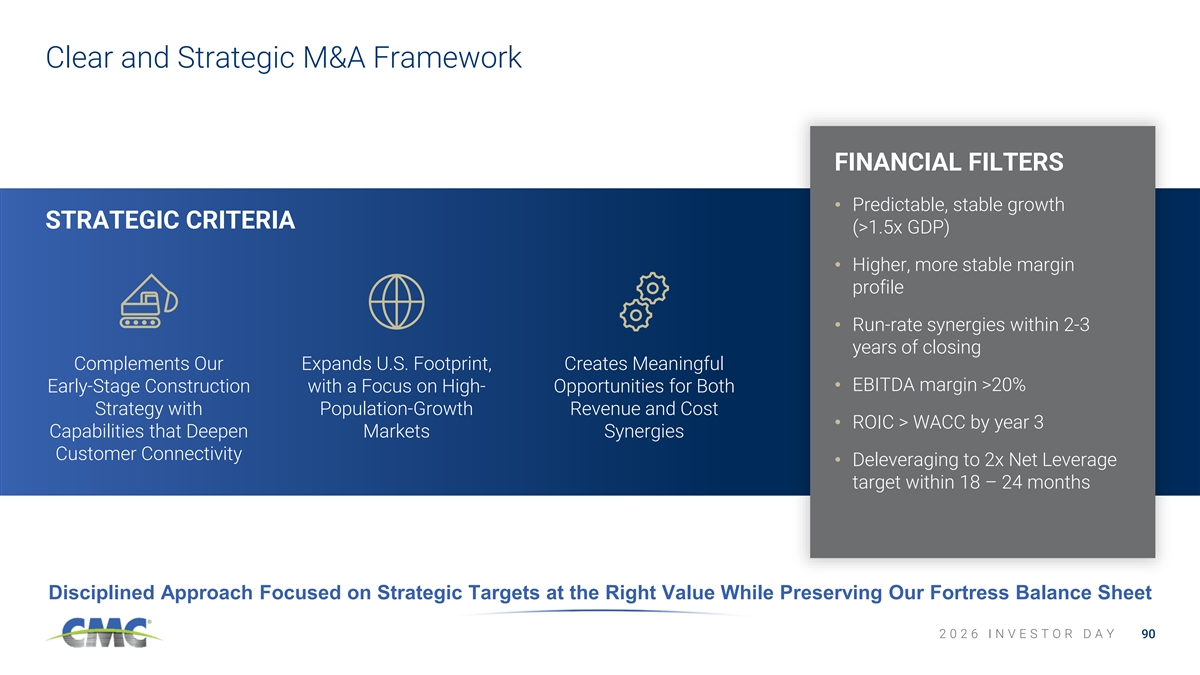
Clear and Strategic M&A Framework FINANCIAL FILTERS • Predictable, stable growth STRATEGIC CRITERIA (>1.5x GDP) • Higher, more stable margin profile • Run-rate synergies within 2-3 years of closing Complements Our Expands U.S. Footprint, Creates Meaningful • EBITDA margin >20% Early-Stage Construction with a Focus on High- Opportunities for Both Strategy with Population-Growth Revenue and Cost • ROIC > WACC by year 3 Capabilities that Deepen Markets Synergies Customer Connectivity • Deleveraging to 2x Net Leverage target within 18 – 24 months Disciplined Approach Focused on Strategic Targets at the Right Value While Preserving Our Fortress Balance Sheet 2 0 2 6 I N V E S T O R D A Y 90
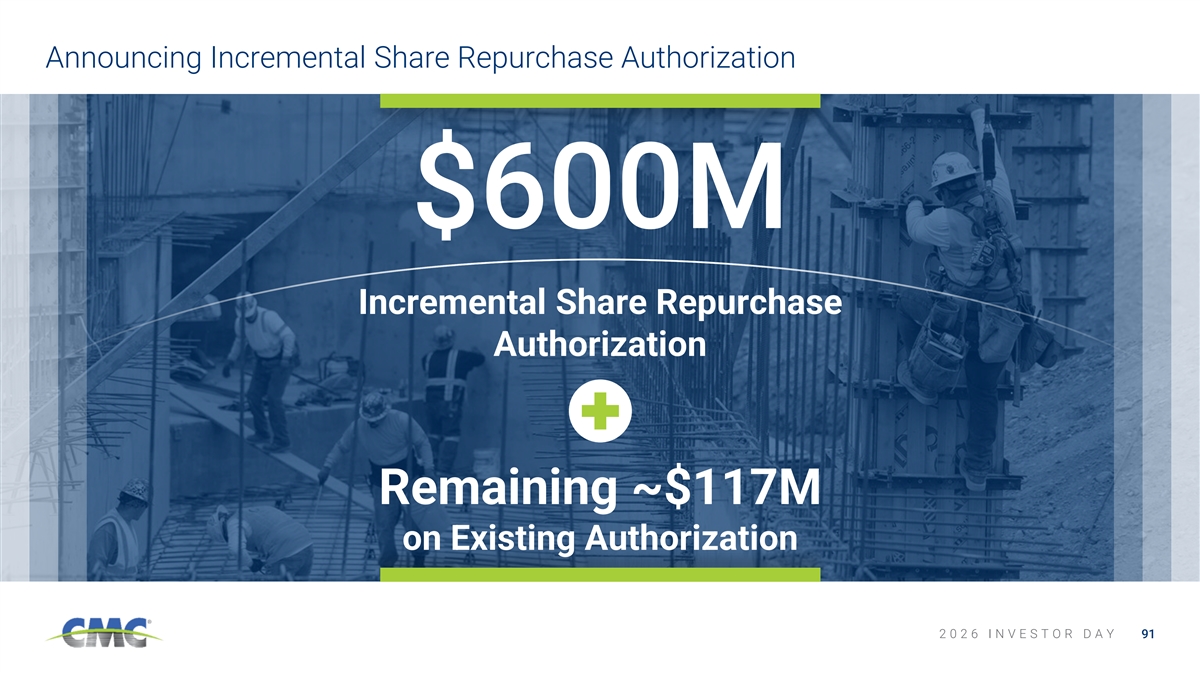
Announcing Incremental Share Repurchase Authorization $600M Incremental Share Repurchase Authorization Remaining ~$117M on Existing Authorization 2 0 2 6 I N V E S T O R D A Y 91
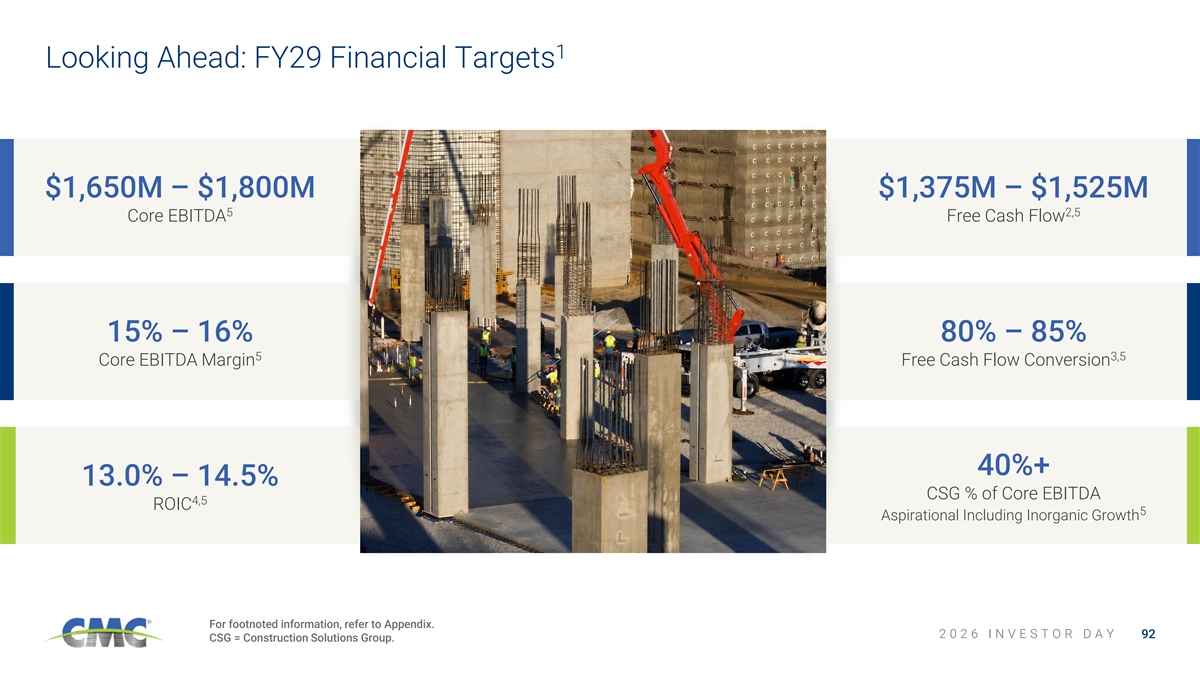
1 Looking Ahead: FY29 Financial Targets $1,650M – $1,800M $1,375M – $1,525M 5 2,5 Core EBITDA Free Cash Flow 15% – 16% 80% – 85% 5 3,5 Core EBITDA Margin Free Cash Flow Conversion 40%+ 13.0% – 14.5% CSG % of Core EBITDA 4,5 ROIC 5 Aspirational Including Inorganic Growth For footnoted information, refer to Appendix. 2 0 2 6 I N V E S T O R D A Y 92 CSG = Construction Solutions Group.
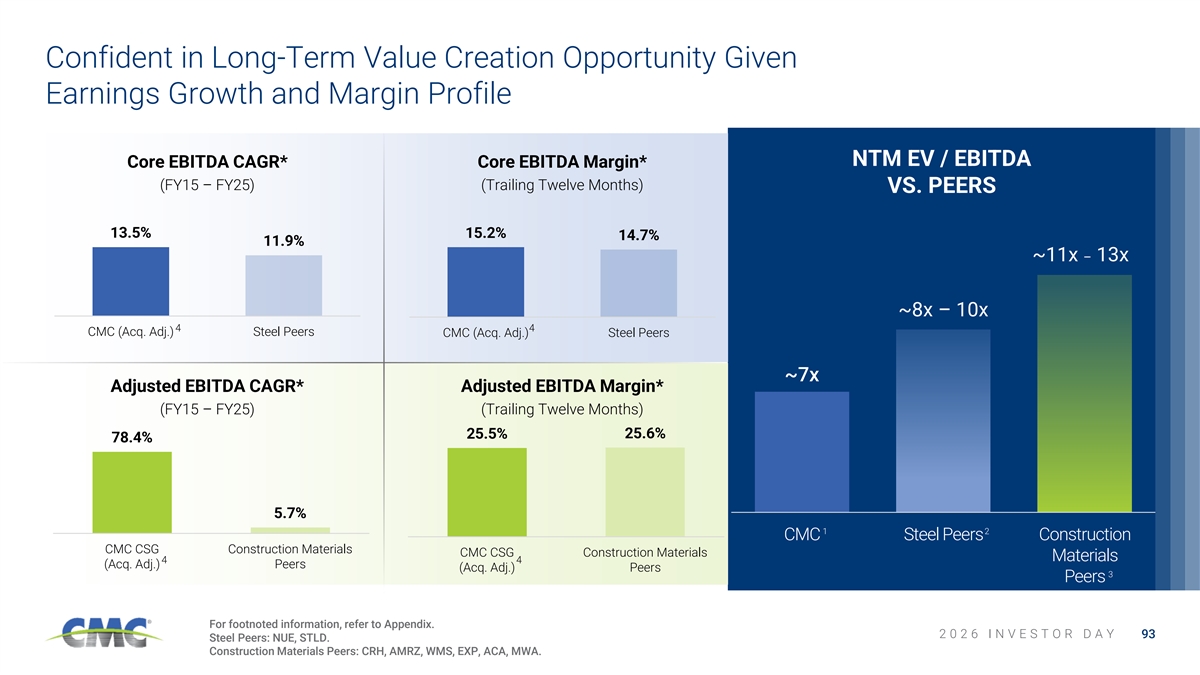
Confident in Long-Term Value Creation Opportunity Given Earnings Growth and Margin Profile NTM EV / EBITDA Core EBITDA CAGR* Core EBITDA Margin* (FY15 – FY25) (Trailing Twelve Months) VS. PEERS 13.5% 15.2% 14.7% 11.9% ~11x – 13x ~8x – 10x 4 4 CMC (Acq. Adj.) Steel Peers CMC (Acq. Adj.) Steel Peers ~7x Adjusted EBITDA CAGR* Adjusted EBITDA Margin* (FY15 – FY25) (Trailing Twelve Months) 25.5% 25.6% 78.4% 5.7% 1 2 CMC Steel Peers Construction CMC CSG Construction Materials CMC CSG Construction Materials Materials 4 4 (Acq. Adj.) Peers (Acq. Adj.) Peers 3 Peers For footnoted information, refer to Appendix. 2 0 2 6 I N V E S T O R D A Y 93 Steel Peers: NUE, STLD. Construction Materials Peers: CRH, AMRZ, WMS, EXP, ACA, MWA.
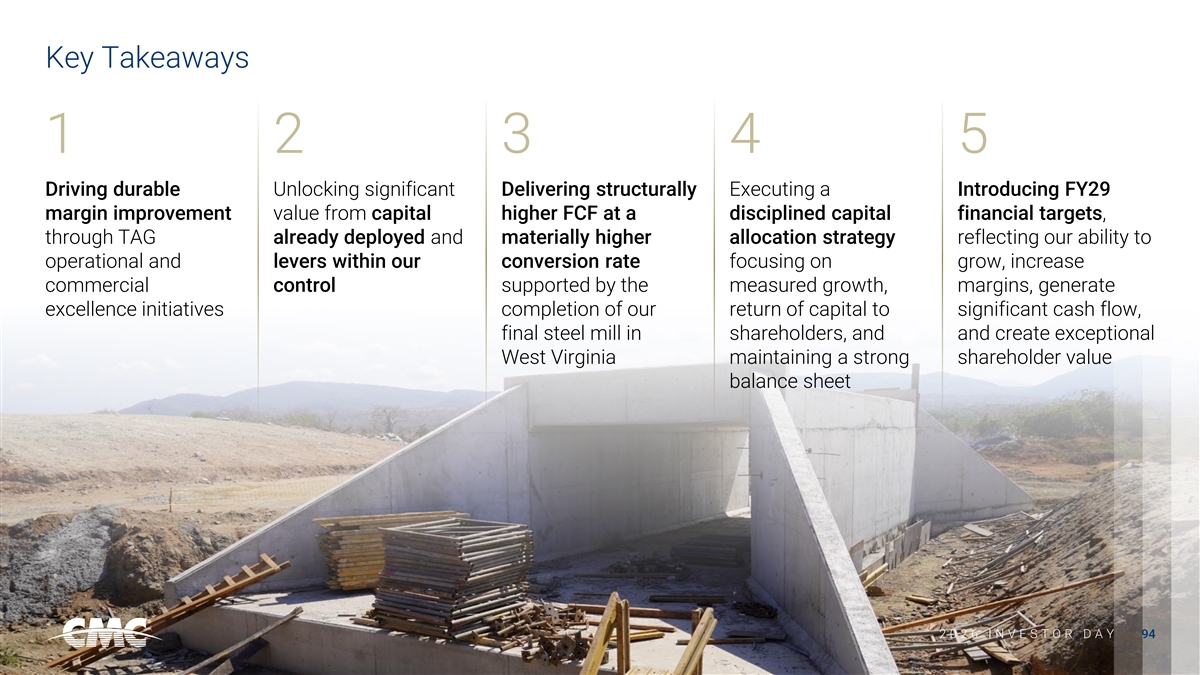
Key Takeaways 1 2 3 4 5 Driving durable Unlocking significant Delivering structurally Executing a Introducing FY29 margin improvement value from capital higher FCF at a disciplined capital financial targets, through TAG already deployed and materially higher allocation strategy reflecting our ability to operational and levers within our conversion rate focusing on grow, increase commercial control supported by the measured growth, margins, generate excellence initiatives completion of our return of capital to significant cash flow, final steel mill in shareholders, and and create exceptional West Virginia maintaining a strong shareholder value balance sheet 2 2 0 0 2 2 6 6 I I N N V V E E S S T T O O R R D D A A Y Y 94

Bringing it Together Peter Matt | PRESIDENT AND CHIEF EXECUTIVE OFFICER 2 0 2 6 I N V E S T O R D A Y
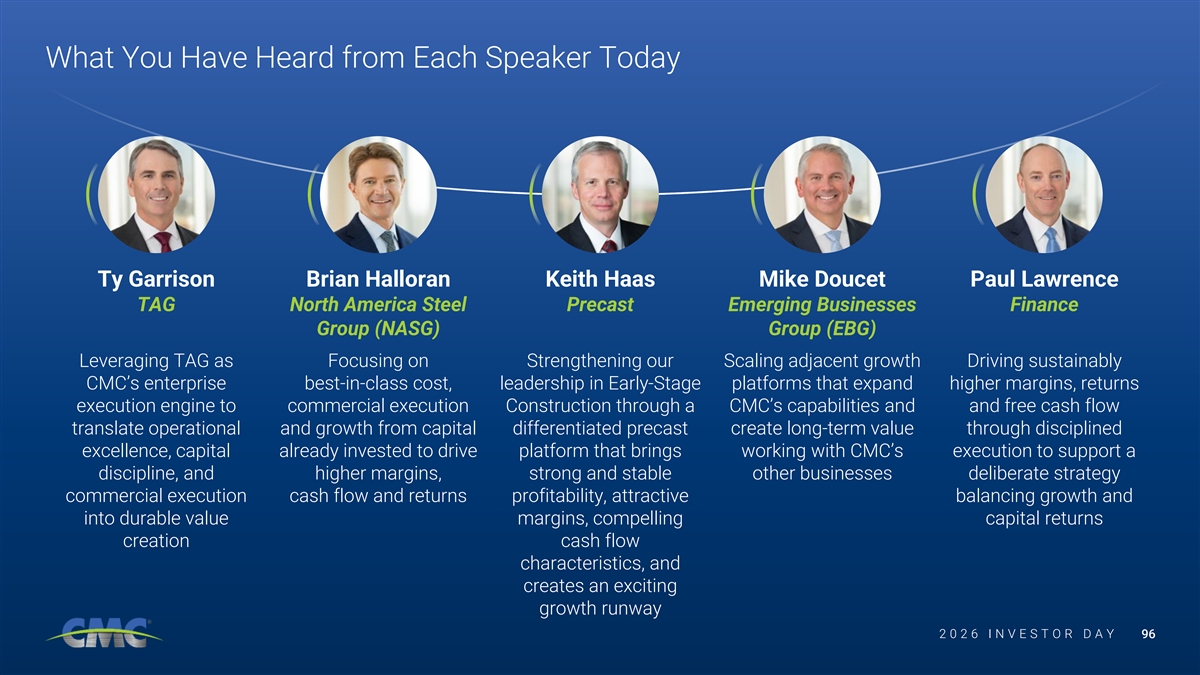
What You Have Heard from Each Speaker Today Ty Garrison Brian Halloran Keith Haas Mike Doucet Paul Lawrence TAG North America Steel Precast Emerging Businesses Finance Group (NASG) Group (EBG) Leveraging TAG as Focusing on Strengthening our Scaling adjacent growth Driving sustainably CMC’s enterprise best-in-class cost, leadership in Early-Stage platforms that expand higher margins, returns execution engine to commercial execution Construction through a CMC’s capabilities and and free cash flow translate operational and growth from capital differentiated precast create long-term value through disciplined excellence, capital already invested to drive platform that brings working with CMC’s execution to support a discipline, and higher margins, strong and stable other businesses deliberate strategy commercial execution cash flow and returns profitability, attractive balancing growth and into durable value margins, compelling capital returns creation cash flow characteristics, and creates an exciting growth runway 2 2 0 0 2 2 6 6 I I N N V V E E S S T T O O R R D D A A Y Y 96
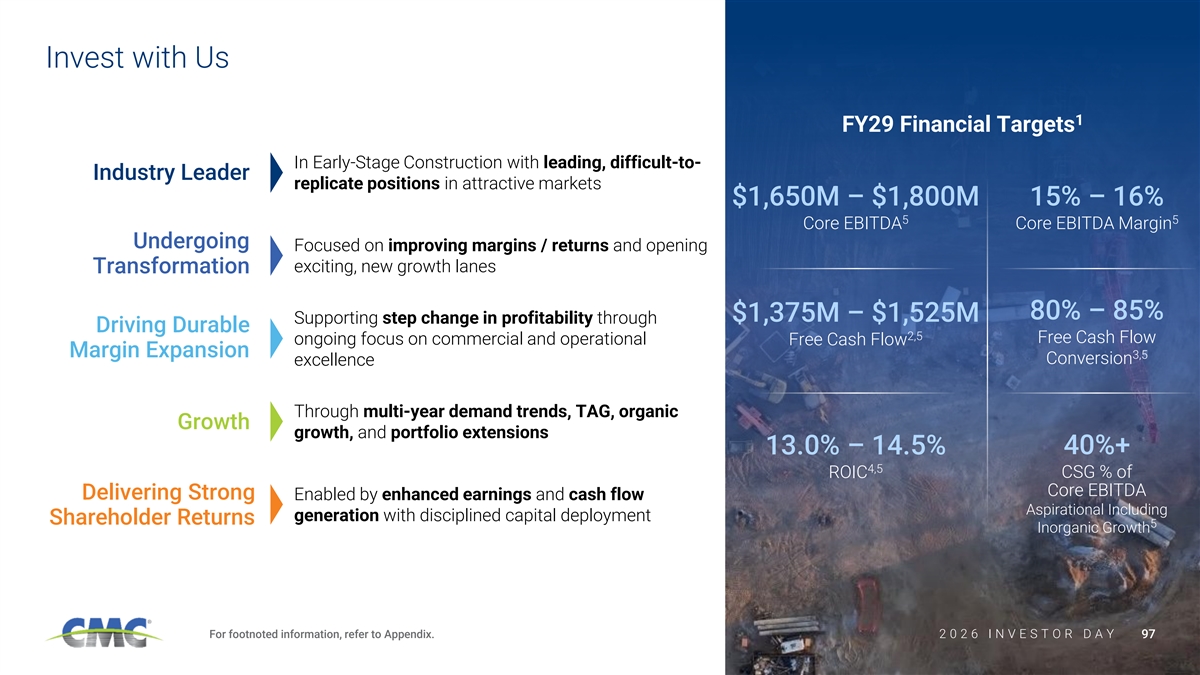
Invest with Us 1 FY29 Financial Targets In Early-Stage Construction with leading, difficult-to- Industry Leader replicate positions in attractive markets $1,650M – $1,800M 15% – 16% 5 5 Core EBITDA Core EBITDA Margin Undergoing Focused on improving margins / returns and opening exciting, new growth lanes Transformation 80% – 85% $1,375M – $1,525M Supporting step change in profitability through Driving Durable 2,5 Free Cash Flow ongoing focus on commercial and operational Free Cash Flow Margin Expansion 3,5 Conversion excellence Through multi-year demand trends, TAG, organic Growth growth, and portfolio extensions 13.0% – 14.5% 40%+ 4,5 CSG % of ROIC Core EBITDA Delivering Strong Enabled by enhanced earnings and cash flow Aspirational Including generation with disciplined capital deployment Shareholder Returns 5 Inorganic Growth For footnoted information, refer to Appendix. 2 2 0 0 2 2 6 6 I I N N V V E E S S T T O O R R D D A A Y Y 97
Q&A Session 2 0 2 6 I N V E S T O R D A Y
Appendix 2 0 2 6 I N V E S T O R D A Y
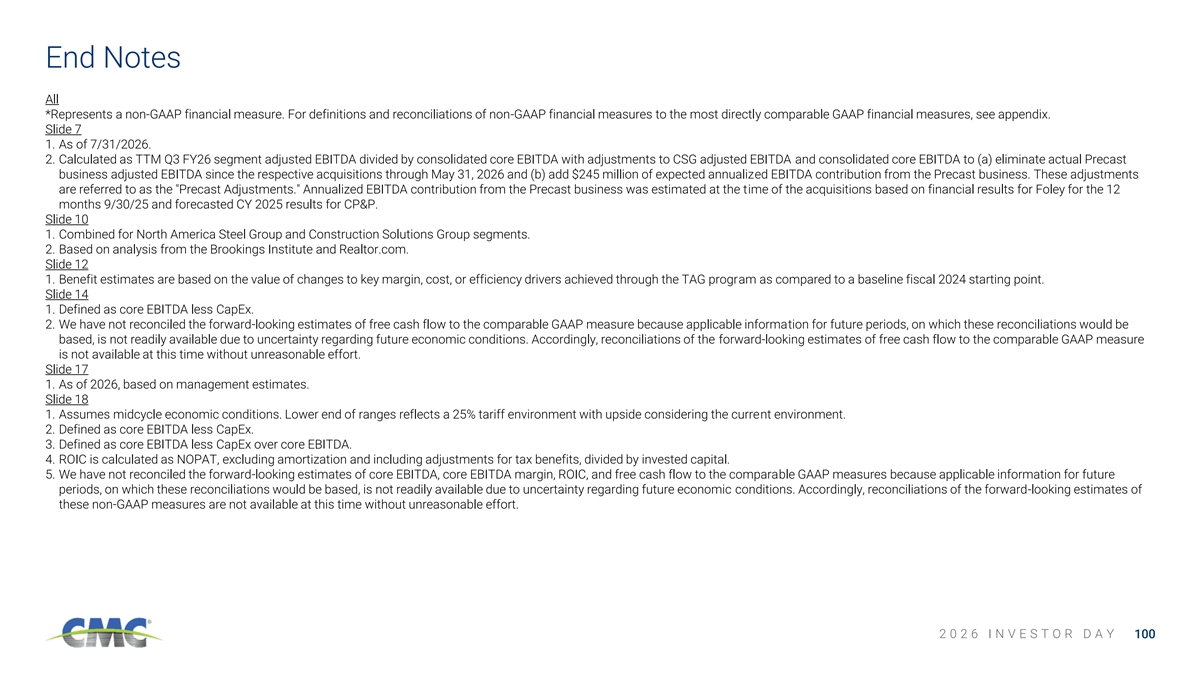
End Notes All *Represents a non-GAAP financial measure. For definitions and reconciliations of non-GAAP financial measures to the most directly comparable GAAP financial measures, see appendix. Slide 7 1. As of 7/31/2026. 2. Calculated as TTM Q3 FY26 segment adjusted EBITDA divided by consolidated core EBITDA with adjustments to CSG adjusted EBITDA and consolidated core EBITDA to (a) eliminate actual Precast business adjusted EBITDA since the respective acquisitions through May 31, 2026 and (b) add $245 million of expected annualized EBITDA contribution from the Precast business. These adjustments are referred to as the Precast Adjustments. Annualized EBITDA contribution from the Precast business was estimated at the time of the acquisitions based on financial results for Foley for the 12 months 9/30/25 and forecasted CY 2025 results for CP&P. Slide 10 1. Combined for North America Steel Group and Construction Solutions Group segments. 2. Based on analysis from the Brookings Institute and Realtor.com. Slide 12 1. Benefit estimates are based on the value of changes to key margin, cost, or efficiency drivers achieved through the TAG program as compared to a baseline fiscal 2024 starting point. Slide 14 1. Defined as core EBITDA less CapEx. 2. We have not reconciled the forward-looking estimates of free cash flow to the comparable GAAP measure because applicable information for future periods, on which these reconciliations would be based, is not readily available due to uncertainty regarding future economic conditions. Accordingly, reconciliations of the forward-looking estimates of free cash flow to the comparable GAAP measure is not available at this time without unreasonable effort. Slide 17 1. As of 2026, based on management estimates. Slide 18 1. Assumes midcycle economic conditions. Lower end of ranges reflects a 25% tariff environment with upside considering the current environment. 2. Defined as core EBITDA less CapEx. 3. Defined as core EBITDA less CapEx over core EBITDA. 4. ROIC is calculated as NOPAT, excluding amortization and including adjustments for tax benefits, divided by invested capital. 5. We have not reconciled the forward-looking estimates of core EBITDA, core EBITDA margin, ROIC, and free cash flow to the comparable GAAP measures because applicable information for future periods, on which these reconciliations would be based, is not readily available due to uncertainty regarding future economic conditions. Accordingly, reconciliations of the forward-looking estimates of these non-GAAP measures are not available at this time without unreasonable effort. 2 0 2 6 I N V E S T O R D A Y 100
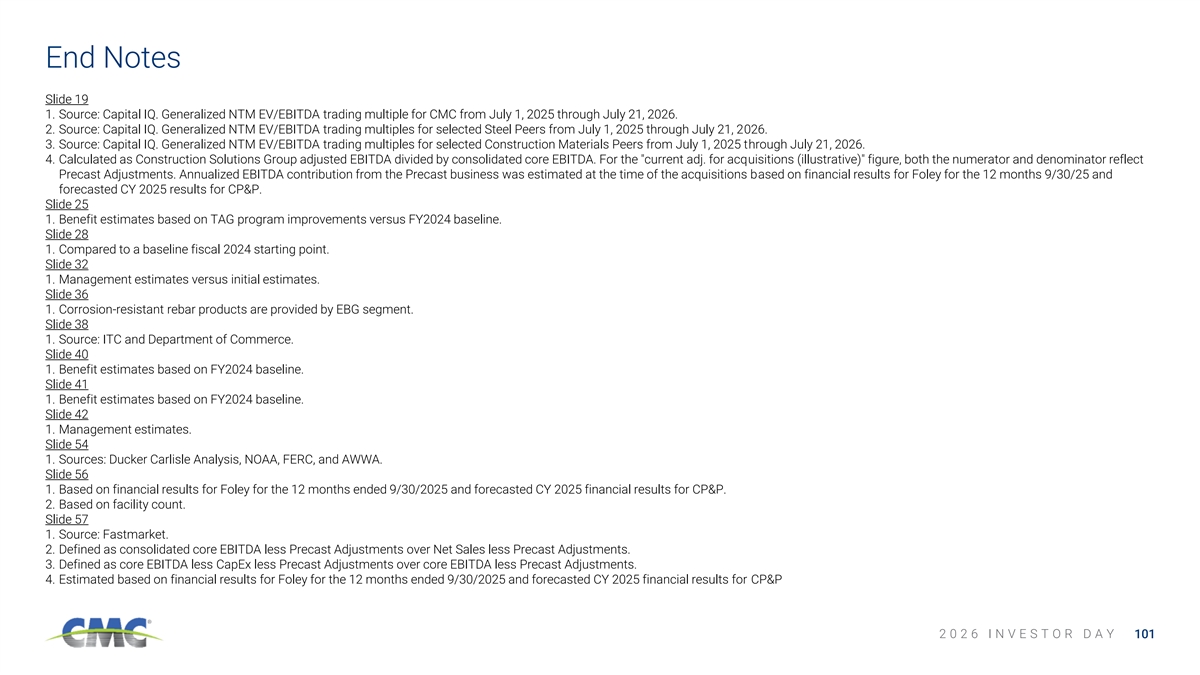
End Notes Slide 19 1. Source: Capital IQ. Generalized NTM EV/EBITDA trading multiple for CMC from July 1, 2025 through July 21, 2026. 2. Source: Capital IQ. Generalized NTM EV/EBITDA trading multiples for selected Steel Peers from July 1, 2025 through July 21, 2026. 3. Source: Capital IQ. Generalized NTM EV/EBITDA trading multiples for selected Construction Materials Peers from July 1, 2025 through July 21, 2026. 4. Calculated as Construction Solutions Group adjusted EBITDA divided by consolidated core EBITDA. For the current adj. for acquisitions (illustrative) figure, both the numerator and denominator reflect Precast Adjustments. Annualized EBITDA contribution from the Precast business was estimated at the time of the acquisitions based on financial results for Foley for the 12 months 9/30/25 and forecasted CY 2025 results for CP&P. Slide 25 1. Benefit estimates based on TAG program improvements versus FY2024 baseline. Slide 28 1. Compared to a baseline fiscal 2024 starting point. Slide 32 1. Management estimates versus initial estimates. Slide 36 1. Corrosion-resistant rebar products are provided by EBG segment. Slide 38 1. Source: ITC and Department of Commerce. Slide 40 1. Benefit estimates based on FY2024 baseline. Slide 41 1. Benefit estimates based on FY2024 baseline. Slide 42 1. Management estimates. Slide 54 1. Sources: Ducker Carlisle Analysis, NOAA, FERC, and AWWA. Slide 56 1. Based on financial results for Foley for the 12 months ended 9/30/2025 and forecasted CY 2025 financial results for CP&P. 2. Based on facility count. Slide 57 1. Source: Fastmarket. 2. Defined as consolidated core EBITDA less Precast Adjustments over Net Sales less Precast Adjustments. 3. Defined as core EBITDA less CapEx less Precast Adjustments over core EBITDA less Precast Adjustments. 4. Estimated based on financial results for Foley for the 12 months ended 9/30/2025 and forecasted CY 2025 financial results for CP&P 2 0 2 6 I N V E S T O R D A Y 101
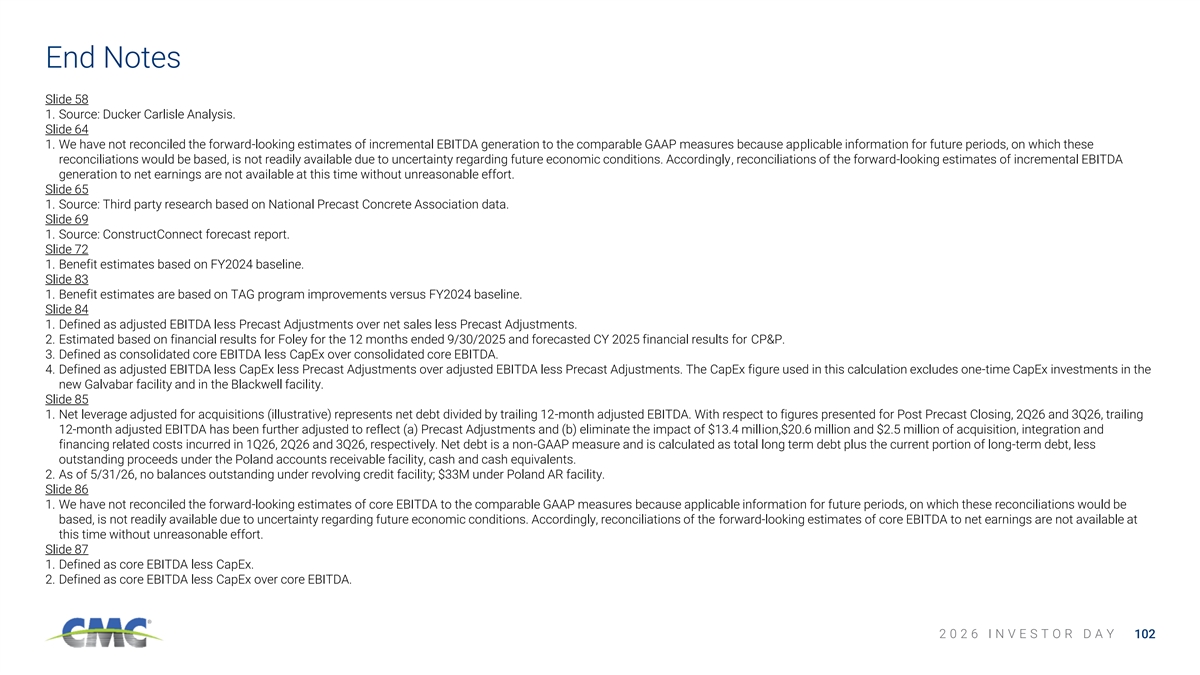
End Notes Slide 58 1. Source: Ducker Carlisle Analysis. Slide 64 1. We have not reconciled the forward-looking estimates of incremental EBITDA generation to the comparable GAAP measures because applicable information for future periods, on which these reconciliations would be based, is not readily available due to uncertainty regarding future economic conditions. Accordingly, reconciliations of the forward-looking estimates of incremental EBITDA generation to net earnings are not available at this time without unreasonable effort. Slide 65 1. Source: Third party research based on National Precast Concrete Association data. Slide 69 1. Source: ConstructConnect forecast report. Slide 72 1. Benefit estimates based on FY2024 baseline. Slide 83 1. Benefit estimates are based on TAG program improvements versus FY2024 baseline. Slide 84 1. Defined as adjusted EBITDA less Precast Adjustments over net sales less Precast Adjustments. 2. Estimated based on financial results for Foley for the 12 months ended 9/30/2025 and forecasted CY 2025 financial results for CP&P. 3. Defined as consolidated core EBITDA less CapEx over consolidated core EBITDA. 4. Defined as adjusted EBITDA less CapEx less Precast Adjustments over adjusted EBITDA less Precast Adjustments. The CapEx figure used in this calculation excludes one-time CapEx investments in the new Galvabar facility and in the Blackwell facility. Slide 85 1. Net leverage adjusted for acquisitions (illustrative) represents net debt divided by trailing 12-month adjusted EBITDA. With respect to figures presented for Post Precast Closing, 2Q26 and 3Q26, trailing 12-month adjusted EBITDA has been further adjusted to reflect (a) Precast Adjustments and (b) eliminate the impact of $13.4 million,$20.6 million and $2.5 million of acquisition, integration and financing related costs incurred in 1Q26, 2Q26 and 3Q26, respectively. Net debt is a non-GAAP measure and is calculated as total long term debt plus the current portion of long-term debt, less outstanding proceeds under the Poland accounts receivable facility, cash and cash equivalents. 2. As of 5/31/26, no balances outstanding under revolving credit facility; $33M under Poland AR facility. Slide 86 1. We have not reconciled the forward-looking estimates of core EBITDA to the comparable GAAP measures because applicable information for future periods, on which these reconciliations would be based, is not readily available due to uncertainty regarding future economic conditions. Accordingly, reconciliations of the forward-looking estimates of core EBITDA to net earnings are not available at this time without unreasonable effort. Slide 87 1. Defined as core EBITDA less CapEx. 2. Defined as core EBITDA less CapEx over core EBITDA. 2 0 2 6 I N V E S T O R D A Y 102
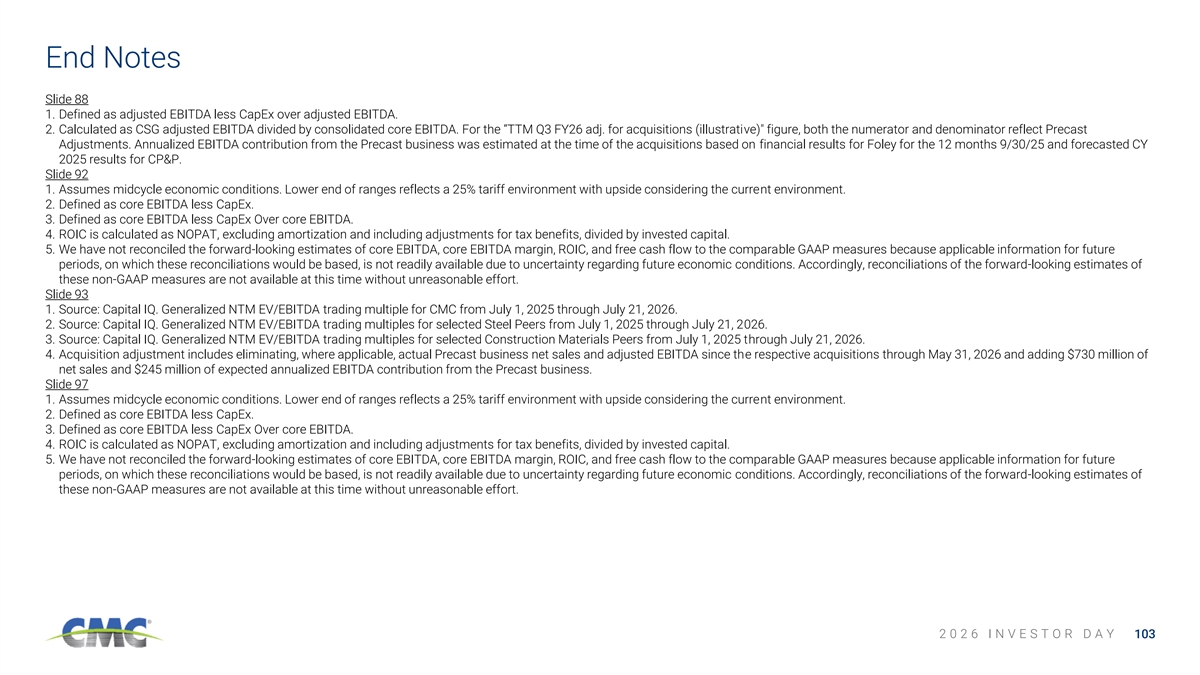
End Notes Slide 88 1. Defined as adjusted EBITDA less CapEx over adjusted EBITDA. 2. Calculated as CSG adjusted EBITDA divided by consolidated core EBITDA. For the “TTM Q3 FY26 adj. for acquisitions (illustrative) figure, both the numerator and denominator reflect Precast Adjustments. Annualized EBITDA contribution from the Precast business was estimated at the time of the acquisitions based on financial results for Foley for the 12 months 9/30/25 and forecasted CY 2025 results for CP&P. Slide 92 1. Assumes midcycle economic conditions. Lower end of ranges reflects a 25% tariff environment with upside considering the current environment. 2. Defined as core EBITDA less CapEx. 3. Defined as core EBITDA less CapEx Over core EBITDA. 4. ROIC is calculated as NOPAT, excluding amortization and including adjustments for tax benefits, divided by invested capital. 5. We have not reconciled the forward-looking estimates of core EBITDA, core EBITDA margin, ROIC, and free cash flow to the comparable GAAP measures because applicable information for future periods, on which these reconciliations would be based, is not readily available due to uncertainty regarding future economic conditions. Accordingly, reconciliations of the forward-looking estimates of these non-GAAP measures are not available at this time without unreasonable effort. Slide 93 1. Source: Capital IQ. Generalized NTM EV/EBITDA trading multiple for CMC from July 1, 2025 through July 21, 2026. 2. Source: Capital IQ. Generalized NTM EV/EBITDA trading multiples for selected Steel Peers from July 1, 2025 through July 21, 2026. 3. Source: Capital IQ. Generalized NTM EV/EBITDA trading multiples for selected Construction Materials Peers from July 1, 2025 through July 21, 2026. 4. Acquisition adjustment includes eliminating, where applicable, actual Precast business net sales and adjusted EBITDA since the respective acquisitions through May 31, 2026 and adding $730 million of net sales and $245 million of expected annualized EBITDA contribution from the Precast business. Slide 97 1. Assumes midcycle economic conditions. Lower end of ranges reflects a 25% tariff environment with upside considering the current environment. 2. Defined as core EBITDA less CapEx. 3. Defined as core EBITDA less CapEx Over core EBITDA. 4. ROIC is calculated as NOPAT, excluding amortization and including adjustments for tax benefits, divided by invested capital. 5. We have not reconciled the forward-looking estimates of core EBITDA, core EBITDA margin, ROIC, and free cash flow to the comparable GAAP measures because applicable information for future periods, on which these reconciliations would be based, is not readily available due to uncertainty regarding future economic conditions. Accordingly, reconciliations of the forward-looking estimates of these non-GAAP measures are not available at this time without unreasonable effort. 2 0 2 6 I N V E S T O R D A Y 103
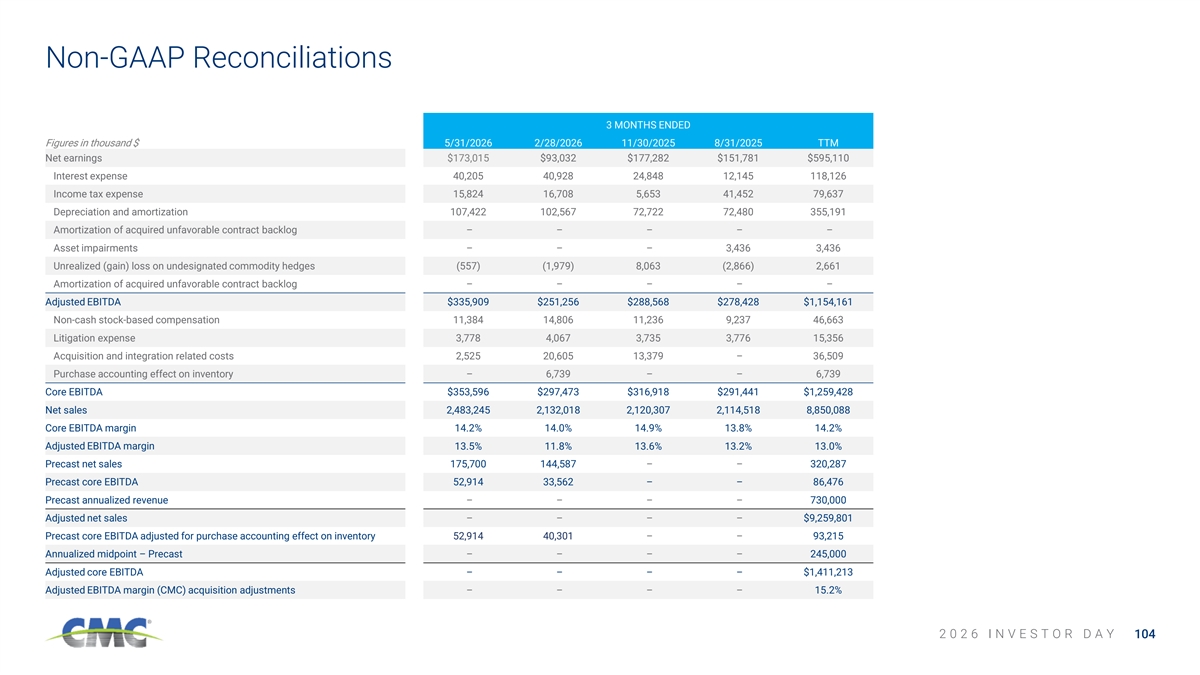
Non-GAAP Reconciliations 3 MONTHS ENDED Figures in thousand $ 5/31/2026 2/28/2026 11/30/2025 8/31/2025 TTM Net earnings $173,015 $93,032 $177,282 $151,781 $595,110 Interest expense 40,205 40,928 24,848 12,145 118,126 Income tax expense 15,824 16,708 5,653 41,452 79,637 Depreciation and amortization 107,422 102,567 72,722 72,480 355,191 Amortization of acquired unfavorable contract backlog– – – – – Asset impairments– – – 3,436 3,436 Unrealized (gain) loss on undesignated commodity hedges (557) (1,979) 8,063 (2,866) 2,661 Amortization of acquired unfavorable contract backlog– – – – – Adjusted EBITDA $335,909 $251,256 $288,568 $278,428 $1,154,161 Non-cash stock-based compensation 11,384 14,806 11,236 9,237 46,663 Litigation expense 3,778 4,067 3,735 3,776 15,356 Acquisition and integration related costs 2,525 20,605 13,379 – 36,509 Purchase accounting effect on inventory– 6,739 – – 6,739 Core EBITDA $353,596 $297,473 $316,918 $291,441 $1,259,428 Net sales 2,483,245 2,132,018 2,120,307 2,114,518 8,850,088 Core EBITDA margin 14.2% 14.0% 14.9% 13.8% 14.2% Adjusted EBITDA margin 13.5% 11.8% 13.6% 13.2% 13.0% Precast net sales 175,700 144,587– – 320,287 Precast core EBITDA 52,914 33,562 – – 86,476 Precast annualized revenue– – – – 730,000 Adjusted net sales– – – – $9,259,801 Precast core EBITDA adjusted for purchase accounting effect on inventory 52,914 40,301 – – 93,215 Annualized midpoint – Precast– – – – 245,000 Adjusted core EBITDA– – – – $1,411,213 Adjusted EBITDA margin (CMC) acquisition adjustments– – – – 15.2% 2 0 2 6 I N V E S T O R D A Y 104
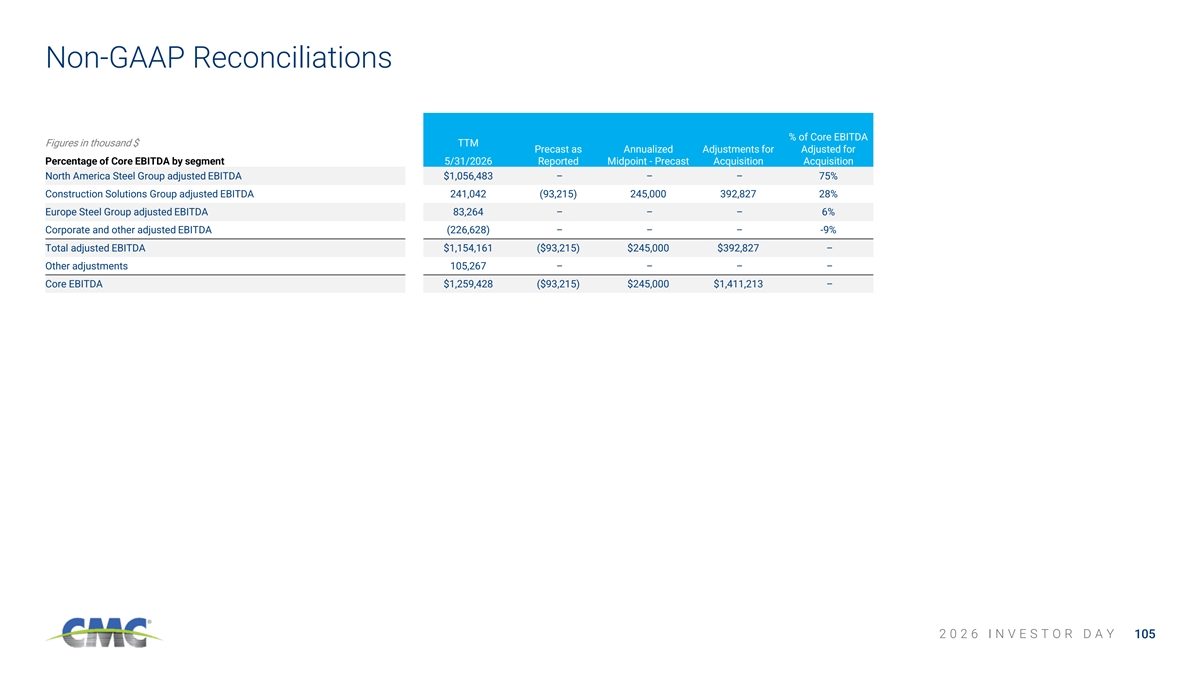
Non-GAAP Reconciliations % of Core EBITDA Figures in thousand $ TTM Precast as Annualized Adjustments for Adjusted for Percentage of Core EBITDA by segment 5/31/2026 Reported Midpoint - Precast Acquisition Acquisition North America Steel Group adjusted EBITDA $1,056,483 – – – 75% Construction Solutions Group adjusted EBITDA 241,042 (93,215) 245,000 392,827 28% Europe Steel Group adjusted EBITDA 83,264 – – – 6% Corporate and other adjusted EBITDA (226,628)– – – -9% Total adjusted EBITDA $1,154,161 ($93,215) $245,000 $392,827 – Other adjustments 105,267 – – – – Core EBITDA $1,259,428 ($93,215) $245,000 $1,411,213 – 2 0 2 6 I N V E S T O R D A Y 105
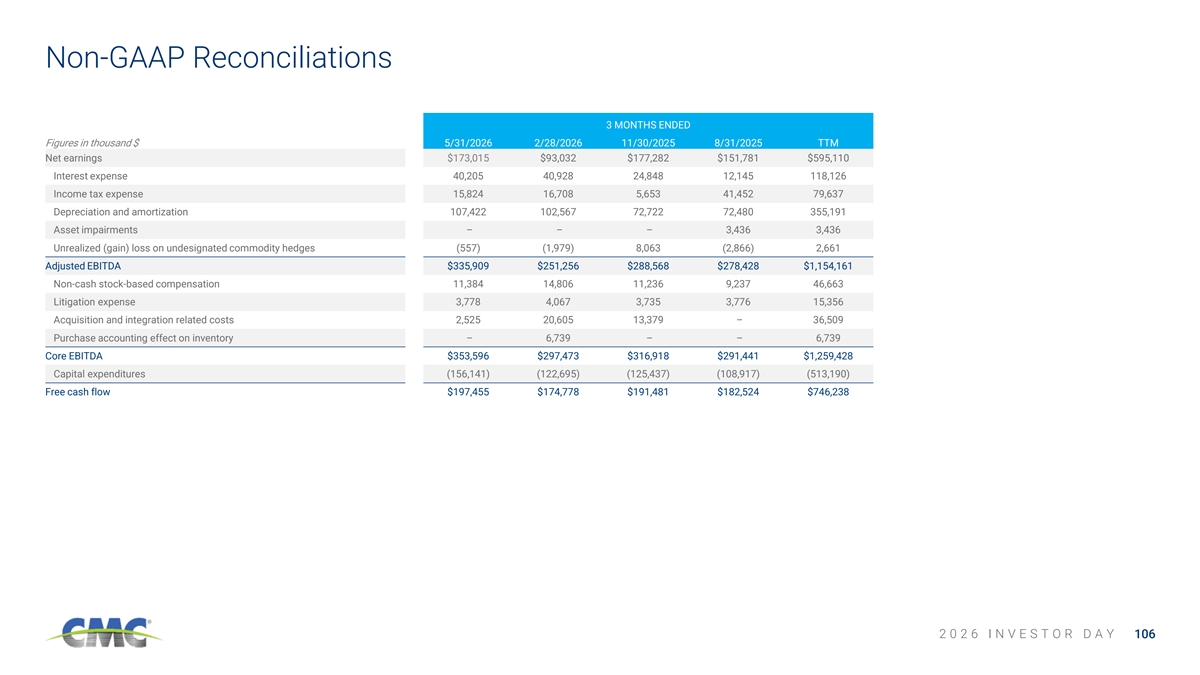
Non-GAAP Reconciliations 3 MONTHS ENDED Figures in thousand $ 5/31/2026 2/28/2026 11/30/2025 8/31/2025 TTM Net earnings $173,015 $93,032 $177,282 $151,781 $595,110 Interest expense 40,205 40,928 24,848 12,145 118,126 Income tax expense 15,824 16,708 5,653 41,452 79,637 Depreciation and amortization 107,422 102,567 72,722 72,480 355,191 Asset impairments– – – 3,436 3,436 Unrealized (gain) loss on undesignated commodity hedges (557) (1,979) 8,063 (2,866) 2,661 Adjusted EBITDA $335,909 $251,256 $288,568 $278,428 $1,154,161 Non-cash stock-based compensation 11,384 14,806 11,236 9,237 46,663 Litigation expense 3,778 4,067 3,735 3,776 15,356 Acquisition and integration related costs 2,525 20,605 13,379 – 36,509 Purchase accounting effect on inventory– 6,739 – – 6,739 Core EBITDA $353,596 $297,473 $316,918 $291,441 $1,259,428 Capital expenditures (156,141) (122,695) (125,437) (108,917) (513,190) Free cash flow $197,455 $174,778 $191,481 $182,524 $746,238 2 0 2 6 I N V E S T O R D A Y 106
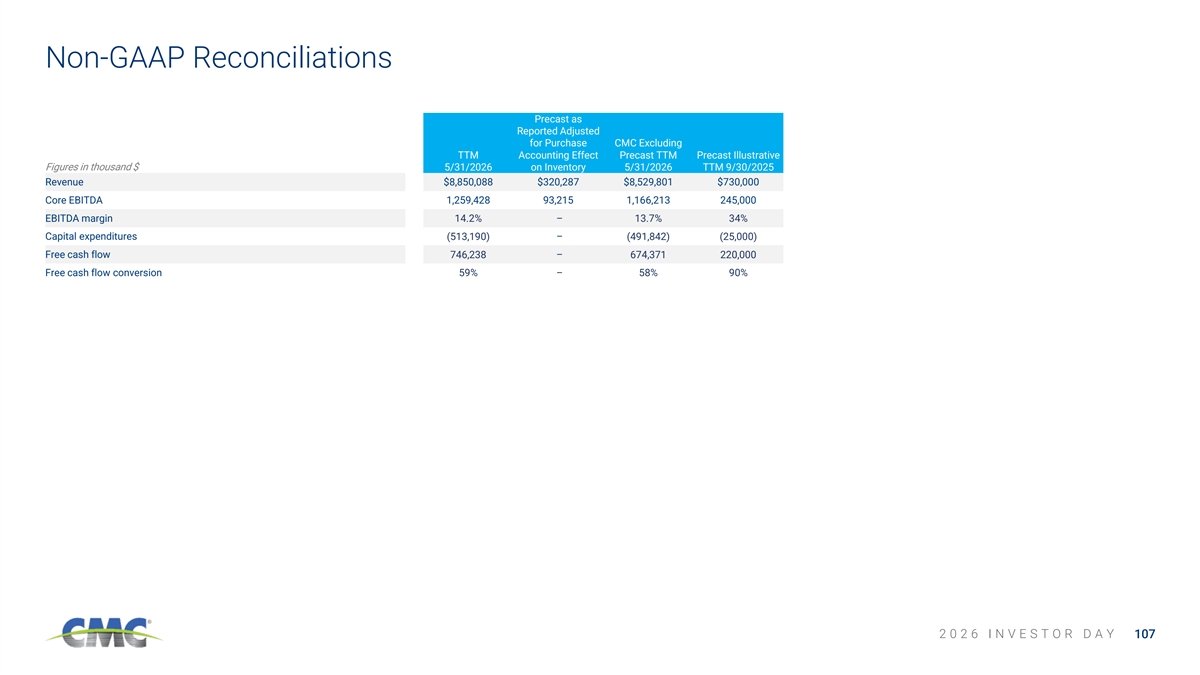
Non-GAAP Reconciliations Precast as Reported Adjusted for Purchase CMC Excluding TTM Accounting Effect Precast TTM Precast Illustrative Figures in thousand $ 5/31/2026 on Inventory 5/31/2026 TTM 9/30/2025 Revenue $8,850,088 $320,287 $8,529,801 $730,000 Core EBITDA 1,259,428 93,215 1,166,213 245,000 EBITDA margin 14.2%– 13.7% 34% Capital expenditures (513,190)– (491,842) (25,000) Free cash flow 746,238 – 674,371 220,000 Free cash flow conversion 59%– 58% 90% 2 0 2 6 I N V E S T O R D A Y 107
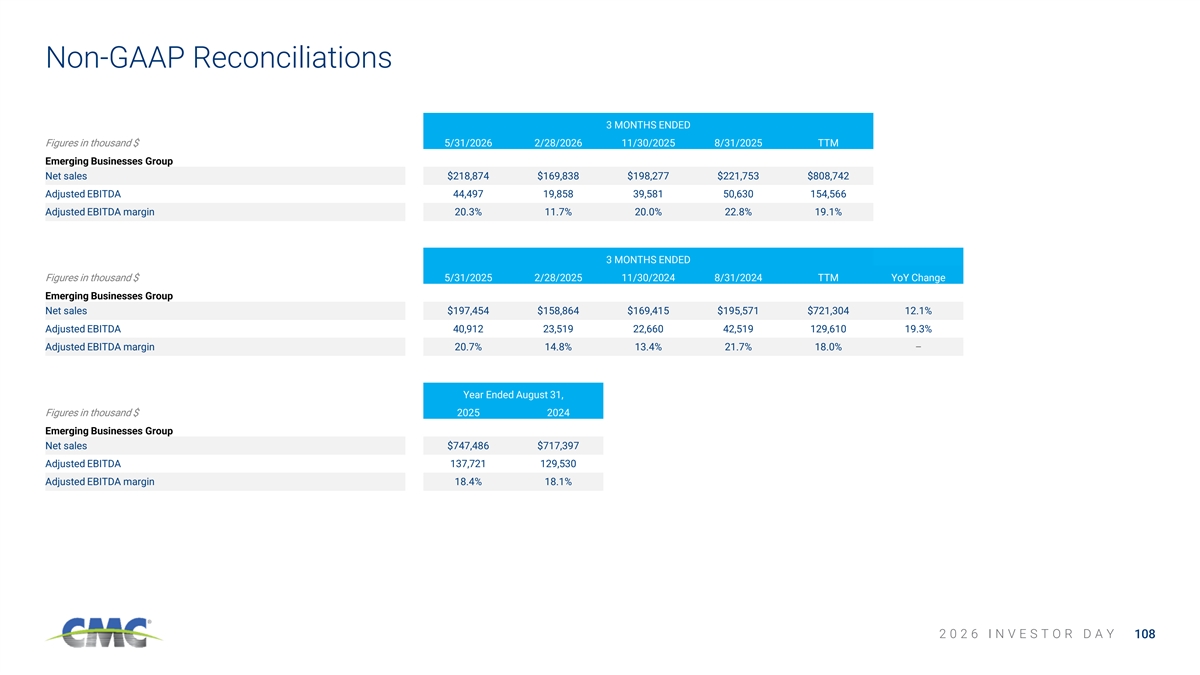
Non-GAAP Reconciliations 3 MONTHS ENDED Figures in thousand $ 5/31/2026 2/28/2026 11/30/2025 8/31/2025 TTM Emerging Businesses Group Net sales $218,874 $169,838 $198,277 $221,753 $808,742 Adjusted EBITDA 44,497 19,858 39,581 50,630 154,566 Adjusted EBITDA margin 20.3% 11.7% 20.0% 22.8% 19.1% 3 MONTHS ENDED Figures in thousand $ 5/31/2025 2/28/2025 11/30/2024 8/31/2024 TTM YoY Change Emerging Businesses Group Net sales $197,454 $158,864 $169,415 $195,571 $721,304 12.1% Adjusted EBITDA 40,912 23,519 22,660 42,519 129,610 19.3% Adjusted EBITDA margin 20.7% 14.8% 13.4% 21.7% 18.0%– Year Ended August 31, Figures in thousand $ 2025 2024 Emerging Businesses Group Net sales $747,486 $717,397 Adjusted EBITDA 137,721 129,530 Adjusted EBITDA margin 18.4% 18.1% 2 0 2 6 I N V E S T O R D A Y 108
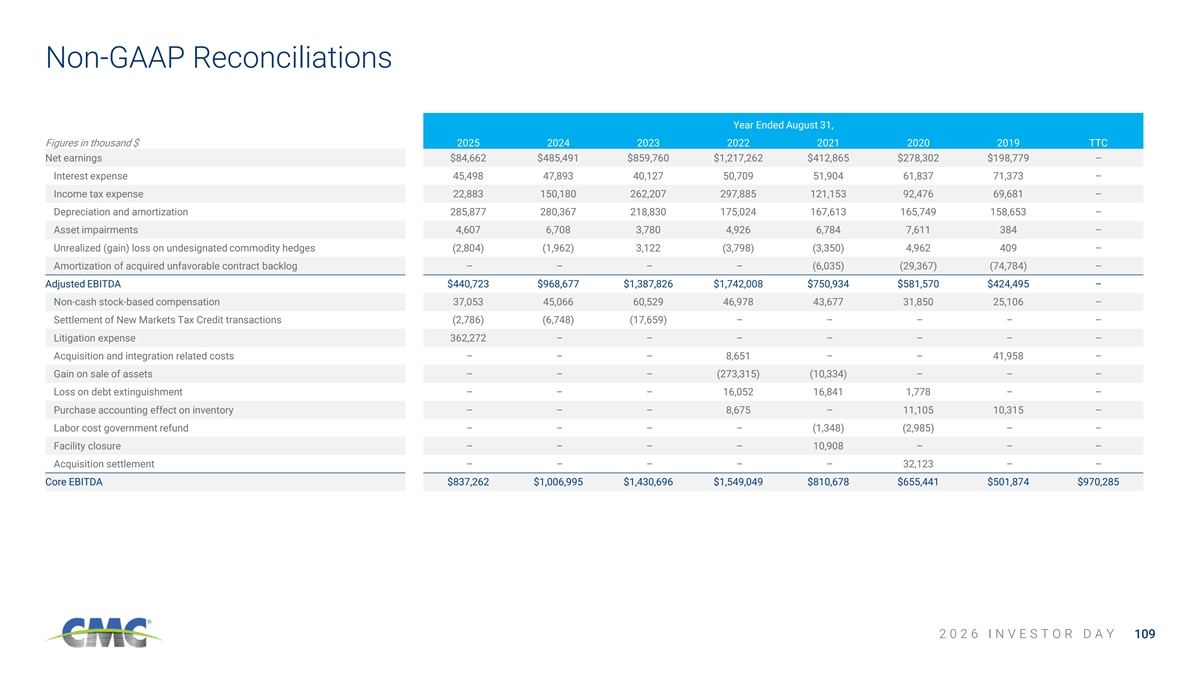
Non-GAAP Reconciliations Year Ended August 31, Figures in thousand $ 2025 2024 2023 2022 2021 2020 2019 TTC Net earnings $84,662 $485,491 $859,760 $1,217,262 $412,865 $278,302 $198,779 – Interest expense 45,498 47,893 40,127 50,709 51,904 61,837 71,373 – Income tax expense 22,883 150,180 262,207 297,885 121,153 92,476 69,681 – Depreciation and amortization 285,877 280,367 218,830 175,024 167,613 165,749 158,653 – Asset impairments 4,607 6,708 3,780 4,926 6,784 7,611 384 – Unrealized (gain) loss on undesignated commodity hedges (2,804) (1,962) 3,122 (3,798) (3,350) 4,962 409 – Amortization of acquired unfavorable contract backlog– – – – (6,035) (29,367) (74,784)– Adjusted EBITDA $440,723 $968,677 $1,387,826 $1,742,008 $750,934 $581,570 $424,495 – Non-cash stock-based compensation 37,053 45,066 60,529 46,978 43,677 31,850 25,106 – Settlement of New Markets Tax Credit transactions (2,786) (6,748) (17,659)– – – – – Litigation expense 362,272 – – – – – – – Acquisition and integration related costs– – – 8,651 – – 41,958 – Gain on sale of assets– – – (273,315) (10,334)– – – Loss on debt extinguishment– – – 16,052 16,841 1,778 – – Purchase accounting effect on inventory– – – 8,675 – 11,105 10,315 – Labor cost government refund– – – – (1,348) (2,985)– – Facility closure– – – – 10,908 – – – Acquisition settlement– – – – – 32,123 – – Core EBITDA $837,262 $1,006,995 $1,430,696 $1,549,049 $810,678 $655,441 $501,874 $970,285 2 0 2 6 I N V E S T O R D A Y 109
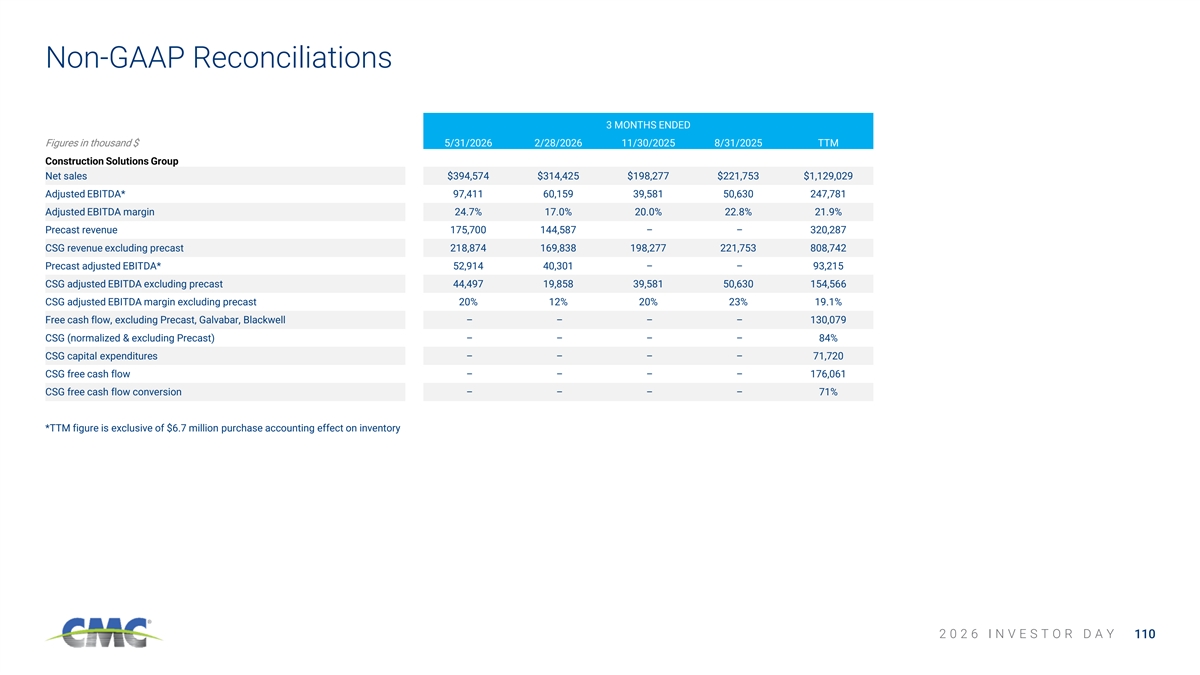
Non-GAAP Reconciliations 3 MONTHS ENDED Figures in thousand $ 5/31/2026 2/28/2026 11/30/2025 8/31/2025 TTM Construction Solutions Group Net sales $394,574 $314,425 $198,277 $221,753 $1,129,029 Adjusted EBITDA* 97,411 60,159 39,581 50,630 247,781 Adjusted EBITDA margin 24.7% 17.0% 20.0% 22.8% 21.9% Precast revenue 175,700 144,587 – – 320,287 CSG revenue excluding precast 218,874 169,838 198,277 221,753 808,742 Precast adjusted EBITDA* 52,914 40,301 – – 93,215 CSG adjusted EBITDA excluding precast 44,497 19,858 39,581 50,630 154,566 CSG adjusted EBITDA margin excluding precast 20% 12% 20% 23% 19.1% Free cash flow, excluding Precast, Galvabar, Blackwell– – – – 130,079 CSG (normalized & excluding Precast)– – – – 84% CSG capital expenditures– – – – 71,720 CSG free cash flow– – – – 176,061 CSG free cash flow conversion– – – – 71% *TTM figure is exclusive of $6.7 million purchase accounting effect on inventory 2 0 2 6 I N V E S T O R D A Y 110
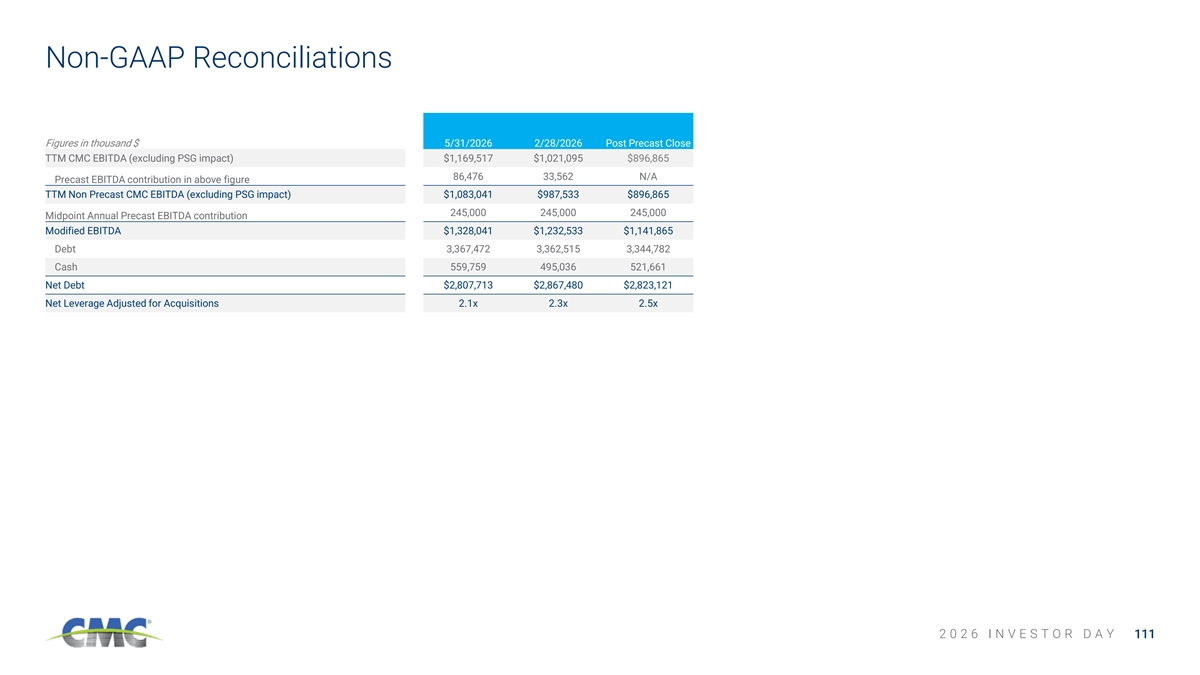
Non-GAAP Reconciliations Figures in thousand $ 5/31/2026 2/28/2026 Post Precast Close TTM CMC EBITDA (excluding PSG impact) $1,169,517 $1,021,095 $896,865 86,476 33,562 N/A Precast EBITDA contribution in above figure TTM Non Precast CMC EBITDA (excluding PSG impact) $1,083,041 $987,533 $896,865 245,000 245,000 245,000 Midpoint Annual Precast EBITDA contribution Modified EBITDA $1,328,041 $1,232,533 $1,141,865 Debt 3,367,472 3,362,515 3,344,782 Cash 559,759 495,036 521,661 Net Debt $2,807,713 $2,867,480 $2,823,121 Net Leverage Adjusted for Acquisitions 2.1x 2.3x 2.5x 2 0 2 6 I N V E S T O R D A Y 111
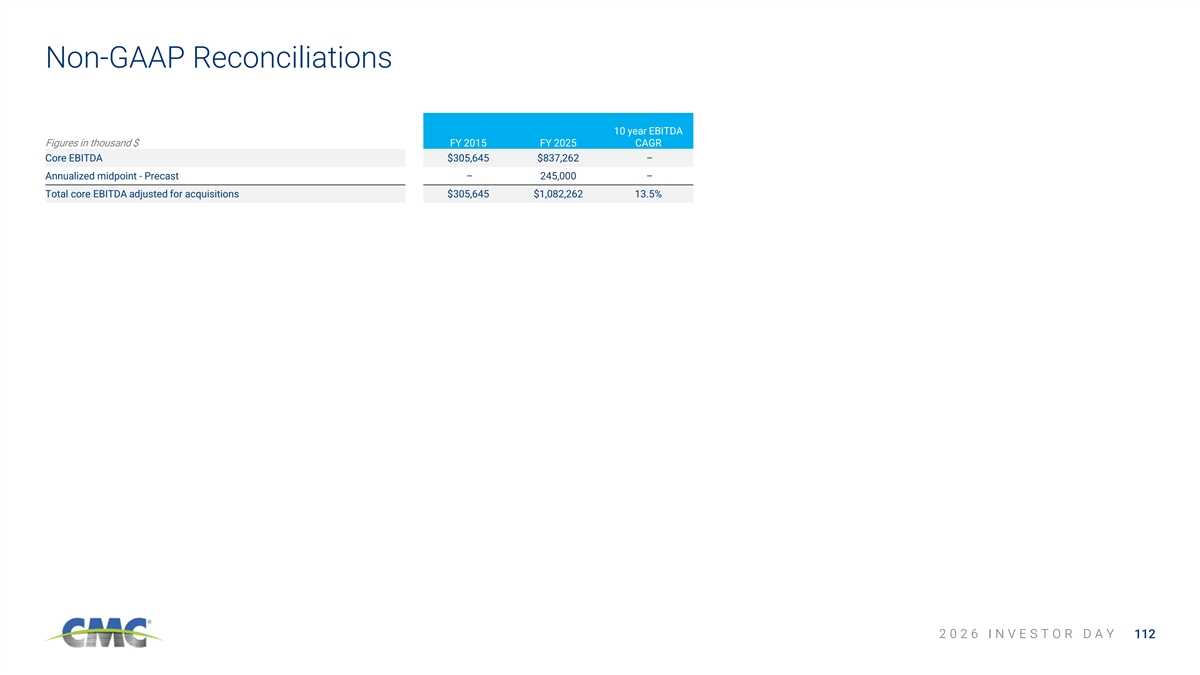
Non-GAAP Reconciliations 10 year EBITDA Figures in thousand $ FY 2015 FY 2025 CAGR Core EBITDA $305,645 $837,262 – Annualized midpoint - Precast– 245,000 – Total core EBITDA adjusted for acquisitions $305,645 $1,082,262 13.5% 2 0 2 6 I N V E S T O R D A Y 112
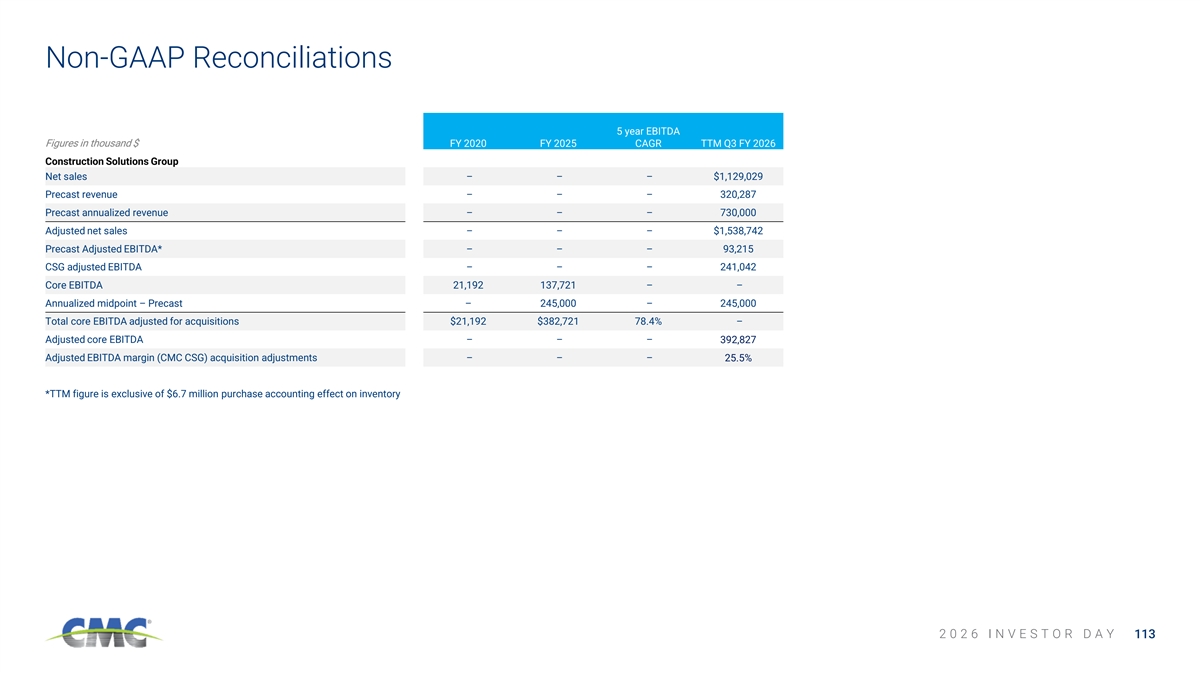
Non-GAAP Reconciliations 5 year EBITDA Figures in thousand $ FY 2020 FY 2025 CAGR TTM Q3 FY 2026 Construction Solutions Group Net sales– – – $1,129,029 Precast revenue– – – 320,287 Precast annualized revenue– – – 730,000 Adjusted net sales– – – $1,538,742 Precast Adjusted EBITDA*– – – 93,215 CSG adjusted EBITDA– – – 241,042 Core EBITDA 21,192 137,721 – – Annualized midpoint – Precast– 245,000 – 245,000 Total core EBITDA adjusted for acquisitions $21,192 $382,721 78.4%– Adjusted core EBITDA– – – 392,827 Adjusted EBITDA margin (CMC CSG) acquisition adjustments– – – 25.5% *TTM figure is exclusive of $6.7 million purchase accounting effect on inventory 2 0 2 6 I N V E S T O R D A Y 113

Speaker Bios 2 0 2 6 I N V E S T O R D A Y
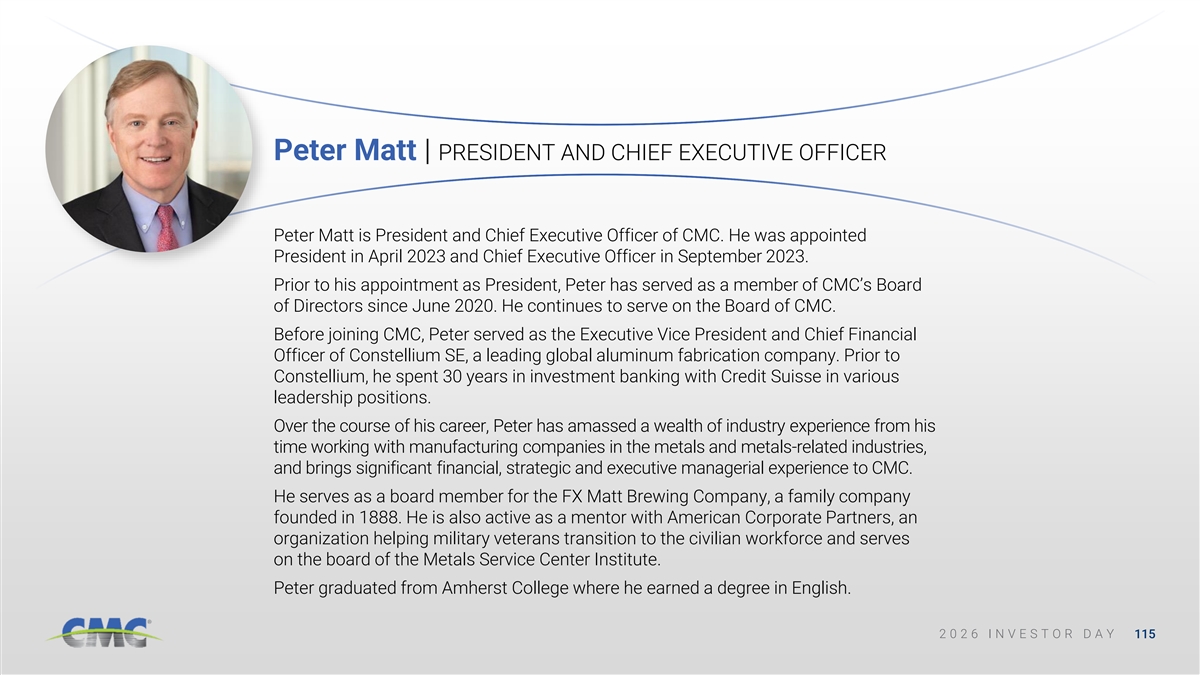
Peter Matt | PRESIDENT AND CHIEF EXECUTIVE OFFICER Peter Matt is President and Chief Executive Officer of CMC. He was appointed President in April 2023 and Chief Executive Officer in September 2023. Prior to his appointment as President, Peter has served as a member of CMC’s Board of Directors since June 2020. He continues to serve on the Board of CMC. Before joining CMC, Peter served as the Executive Vice President and Chief Financial Officer of Constellium SE, a leading global aluminum fabrication company. Prior to Constellium, he spent 30 years in investment banking with Credit Suisse in various leadership positions. Over the course of his career, Peter has amassed a wealth of industry experience from his time working with manufacturing companies in the metals and metals-related industries, and brings significant financial, strategic and executive managerial experience to CMC. He serves as a board member for the FX Matt Brewing Company, a family company founded in 1888. He is also active as a mentor with American Corporate Partners, an organization helping military veterans transition to the civilian workforce and serves on the board of the Metals Service Center Institute. Peter graduated from Amherst College where he earned a degree in English. 2 2 0 0 2 2 6 6 I I N N V V E E S S T T O O R R D D A A Y Y 115
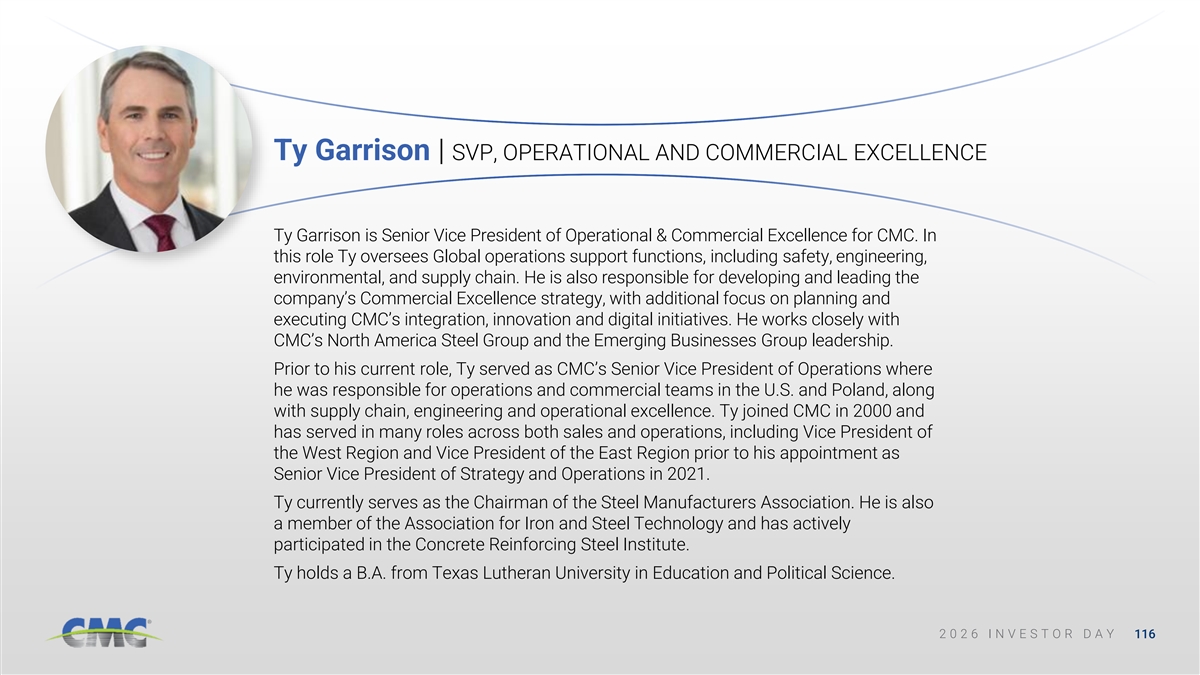
Ty Garrison | SVP, OPERATIONAL AND COMMERCIAL EXCELLENCE Ty Garrison is Senior Vice President of Operational & Commercial Excellence for CMC. In this role Ty oversees Global operations support functions, including safety, engineering, environmental, and supply chain. He is also responsible for developing and leading the company’s Commercial Excellence strategy, with additional focus on planning and executing CMC’s integration, innovation and digital initiatives. He works closely with CMC’s North America Steel Group and the Emerging Businesses Group leadership. Prior to his current role, Ty served as CMC’s Senior Vice President of Operations where he was responsible for operations and commercial teams in the U.S. and Poland, along with supply chain, engineering and operational excellence. Ty joined CMC in 2000 and has served in many roles across both sales and operations, including Vice President of the West Region and Vice President of the East Region prior to his appointment as Senior Vice President of Strategy and Operations in 2021. Ty currently serves as the Chairman of the Steel Manufacturers Association. He is also a member of the Association for Iron and Steel Technology and has actively participated in the Concrete Reinforcing Steel Institute. Ty holds a B.A. from Texas Lutheran University in Education and Political Science. 2 2 0 0 2 2 6 6 I I N N V V E E S S T T O O R R D D A A Y Y 116
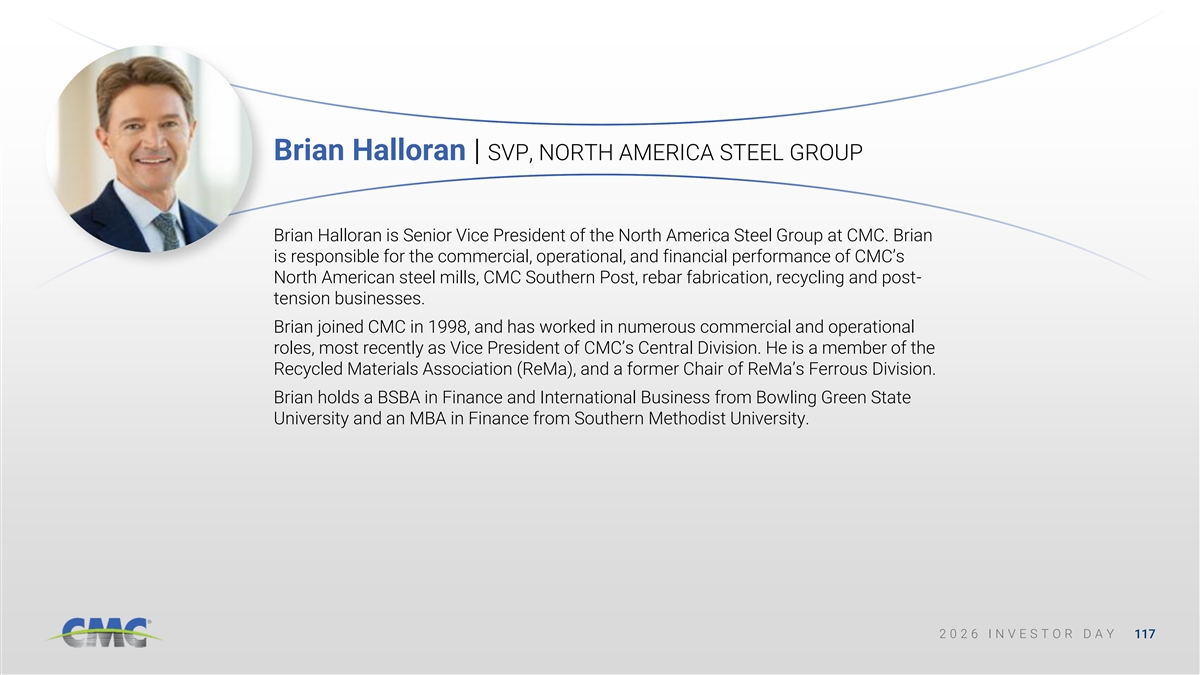
Brian Halloran | SVP, NORTH AMERICA STEEL GROUP Brian Halloran is Senior Vice President of the North America Steel Group at CMC. Brian is responsible for the commercial, operational, and financial performance of CMC’s North American steel mills, CMC Southern Post, rebar fabrication, recycling and post- tension businesses. Brian joined CMC in 1998, and has worked in numerous commercial and operational roles, most recently as Vice President of CMC’s Central Division. He is a member of the Recycled Materials Association (ReMa), and a former Chair of ReMa’s Ferrous Division. Brian holds a BSBA in Finance and International Business from Bowling Green State University and an MBA in Finance from Southern Methodist University. 2 2 0 0 2 2 6 6 I I N N V V E E S S T T O O R R D D A A Y Y 117
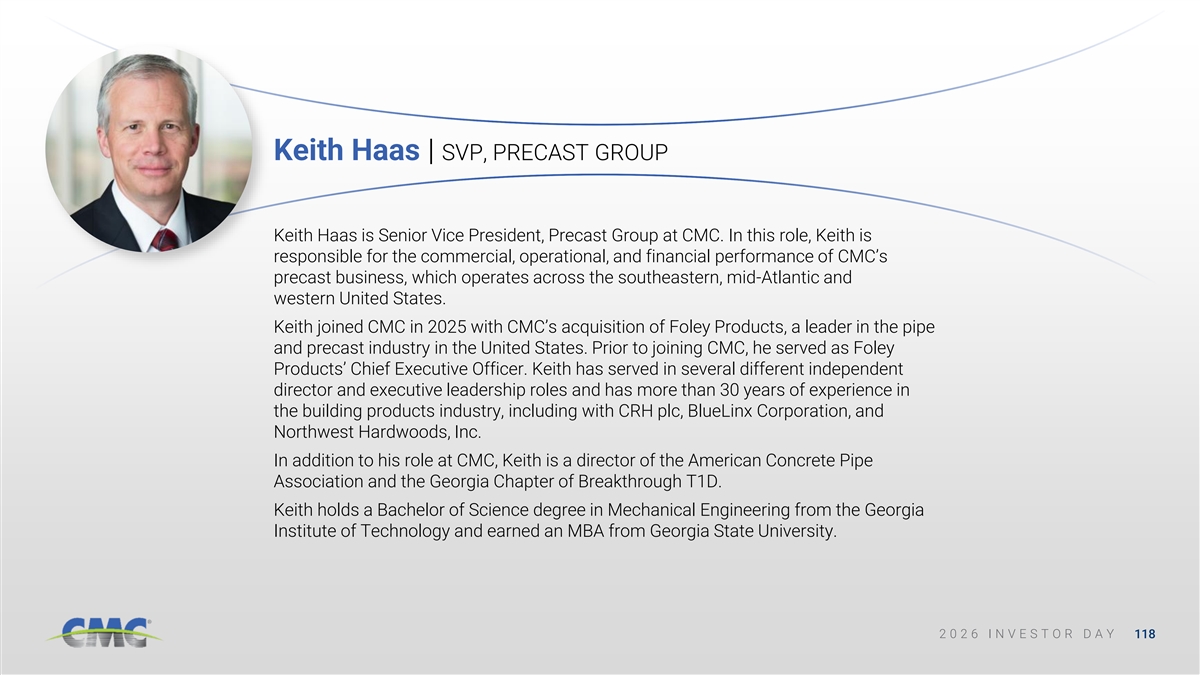
Keith Haas | SVP, PRECAST GROUP Keith Haas is Senior Vice President, Precast Group at CMC. In this role, Keith is responsible for the commercial, operational, and financial performance of CMC’s precast business, which operates across the southeastern, mid-Atlantic and western United States. Keith joined CMC in 2025 with CMC’s acquisition of Foley Products, a leader in the pipe and precast industry in the United States. Prior to joining CMC, he served as Foley Products’ Chief Executive Officer. Keith has served in several different independent director and executive leadership roles and has more than 30 years of experience in the building products industry, including with CRH plc, BlueLinx Corporation, and Northwest Hardwoods, Inc. In addition to his role at CMC, Keith is a director of the American Concrete Pipe Association and the Georgia Chapter of Breakthrough T1D. Keith holds a Bachelor of Science degree in Mechanical Engineering from the Georgia Institute of Technology and earned an MBA from Georgia State University. 2 2 0 0 2 2 6 6 I I N N V V E E S S T T O O R R D D A A Y Y 118
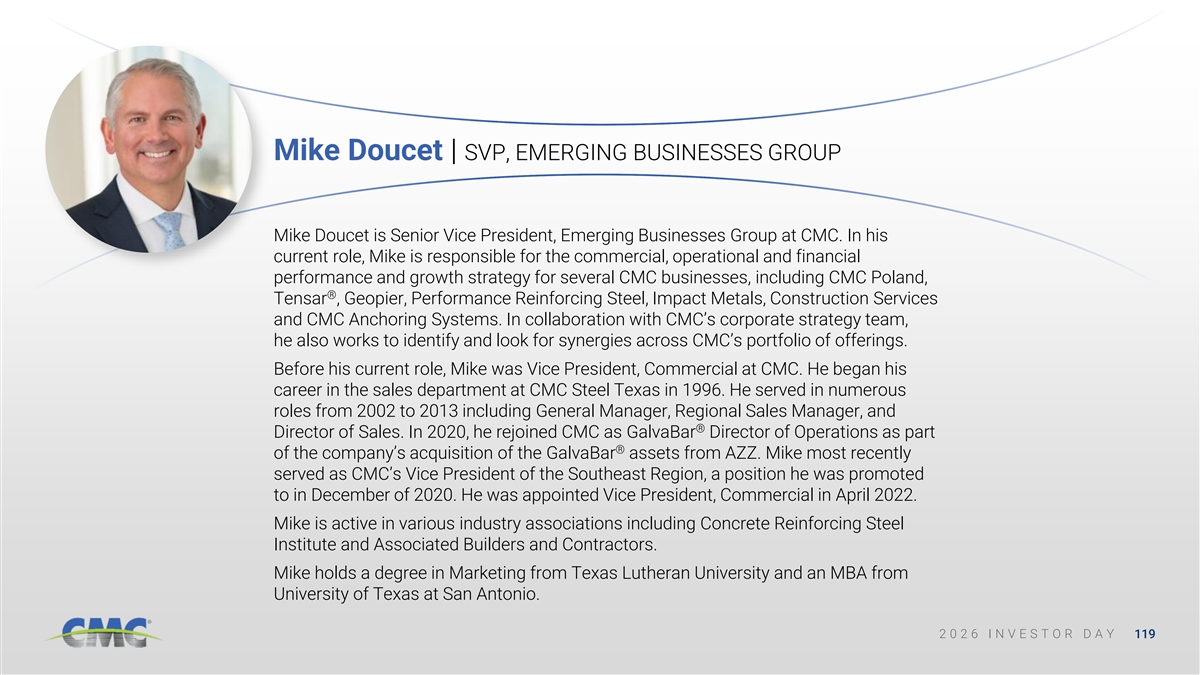
Mike Doucet | SVP, EMERGING BUSINESSES GROUP Mike Doucet is Senior Vice President, Emerging Businesses Group at CMC. In his current role, Mike is responsible for the commercial, operational and financial performance and growth strategy for several CMC businesses, including CMC Poland, ® Tensar , Geopier, Performance Reinforcing Steel, Impact Metals, Construction Services and CMC Anchoring Systems. In collaboration with CMC’s corporate strategy team, he also works to identify and look for synergies across CMC’s portfolio of offerings. Before his current role, Mike was Vice President, Commercial at CMC. He began his career in the sales department at CMC Steel Texas in 1996. He served in numerous roles from 2002 to 2013 including General Manager, Regional Sales Manager, and ® Director of Sales. In 2020, he rejoined CMC as GalvaBar Director of Operations as part ® of the company’s acquisition of the GalvaBar assets from AZZ. Mike most recently served as CMC’s Vice President of the Southeast Region, a position he was promoted to in December of 2020. He was appointed Vice President, Commercial in April 2022. Mike is active in various industry associations including Concrete Reinforcing Steel Institute and Associated Builders and Contractors. Mike holds a degree in Marketing from Texas Lutheran University and an MBA from University of Texas at San Antonio. 2 2 0 0 2 2 6 6 I I N N V V E E S S T T O O R R D D A A Y Y 119
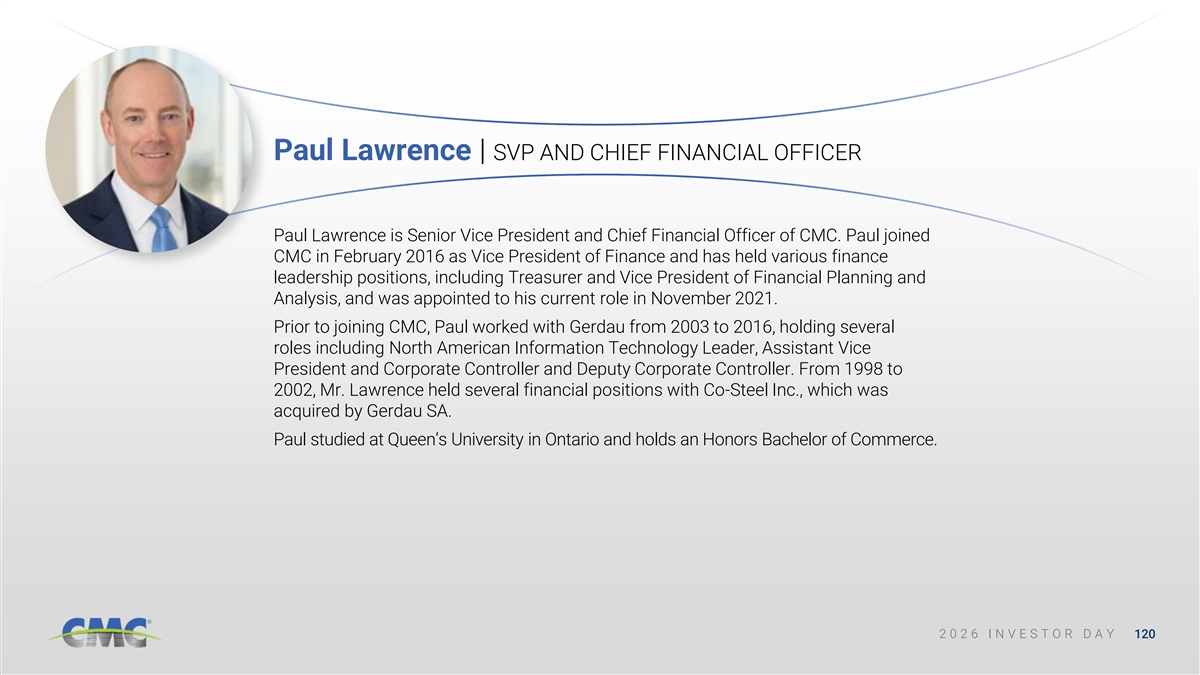
Paul Lawrence | SVP AND CHIEF FINANCIAL OFFICER Paul Lawrence is Senior Vice President and Chief Financial Officer of CMC. Paul joined CMC in February 2016 as Vice President of Finance and has held various finance leadership positions, including Treasurer and Vice President of Financial Planning and Analysis, and was appointed to his current role in November 2021. Prior to joining CMC, Paul worked with Gerdau from 2003 to 2016, holding several roles including North American Information Technology Leader, Assistant Vice President and Corporate Controller and Deputy Corporate Controller. From 1998 to 2002, Mr. Lawrence held several financial positions with Co-Steel Inc., which was acquired by Gerdau SA. Paul studied at Queen’s University in Ontario and holds an Honors Bachelor of Commerce. 2 2 0 0 2 2 6 6 I I N N V V E E S S T T O O R R D D A A Y Y 120