
Second Quarter 2026 Investor Presentation
Trinity Capital Inc. (the “Company”) cautions that this presentation may contain forward-looking statements that are based on current expectations and assumptions about future events, and which are not based in historical fact. The forward-looking statements in this presentation are based on current conditions as of the date of this presentation, and include, but are not limited to, statements regarding our financial objectives, beliefs, strategies, anticipated future operating results and cash flows, operating expenses, investment originations and performance, available capital, and payment of future dividends and stockholder returns. Although our management believes that the expectations reflected in any forward-looking statements are reasonable, actual results could differ materially from those expressed or implied in the forward-looking statements. By their nature, these forward-looking statements involve numerous assumptions, uncertainties and risks, both general and specific. The risk exists that these statements may not be fulfilled. We caution readers of this presentation not to place undue reliance on these forward-looking statements, as a number of factors could cause future Company results to differ materially from these statements. Forward-looking statements may be influenced in particular by factors such as fluctuations in interest rates and stock indices, the effects of competition in the areas in which we operate, and changes in economic, political and regulatory conditions. When relying on forward-looking statements to make decisions, investors should carefully consider the aforementioned factors as well as other uncertainties and events. Historical results discussed in this presentation are not indicative of future results. The information disclosed in this presentation is made as of the date hereof and reflects Trinity Capital Inc.’s current assessment of its financial performance for the most recent period reported. Actual financial results filed with the Securities and Exchange Commission in the future may differ from those contained herein in the event of additional adjustments recorded prior to the filing of its financial statements. The information contained in this presentation should be viewed in conjunction with Trinity Capital Inc.'s most recently filed Quarterly Report on Form 10-Q, Annual Report on Form 10-K or Prospectuses. We undertake no obligation to update the information contained herein to reflect subsequently occurring events or circumstances, except as required by applicable securities laws and regulations. This presentation does not constitute a prospectus and should under no circumstances be understood as an offer to sell or the solicitation of an offer to buy our common stock or any other securities nor will there be any sale of the common stock or any other securities referred to in this presentation in any state or jurisdiction in which such offer, solicitation or sale would be unlawful prior to the registration or qualification under the securities laws of such state or jurisdiction. Nothing in these materials should be construed as a recommendation to invest in any securities that may be issued by Trinity Capital Inc. or as legal, accounting or tax advice. Forward-Looking Statements | Disclaimer

Company Overview
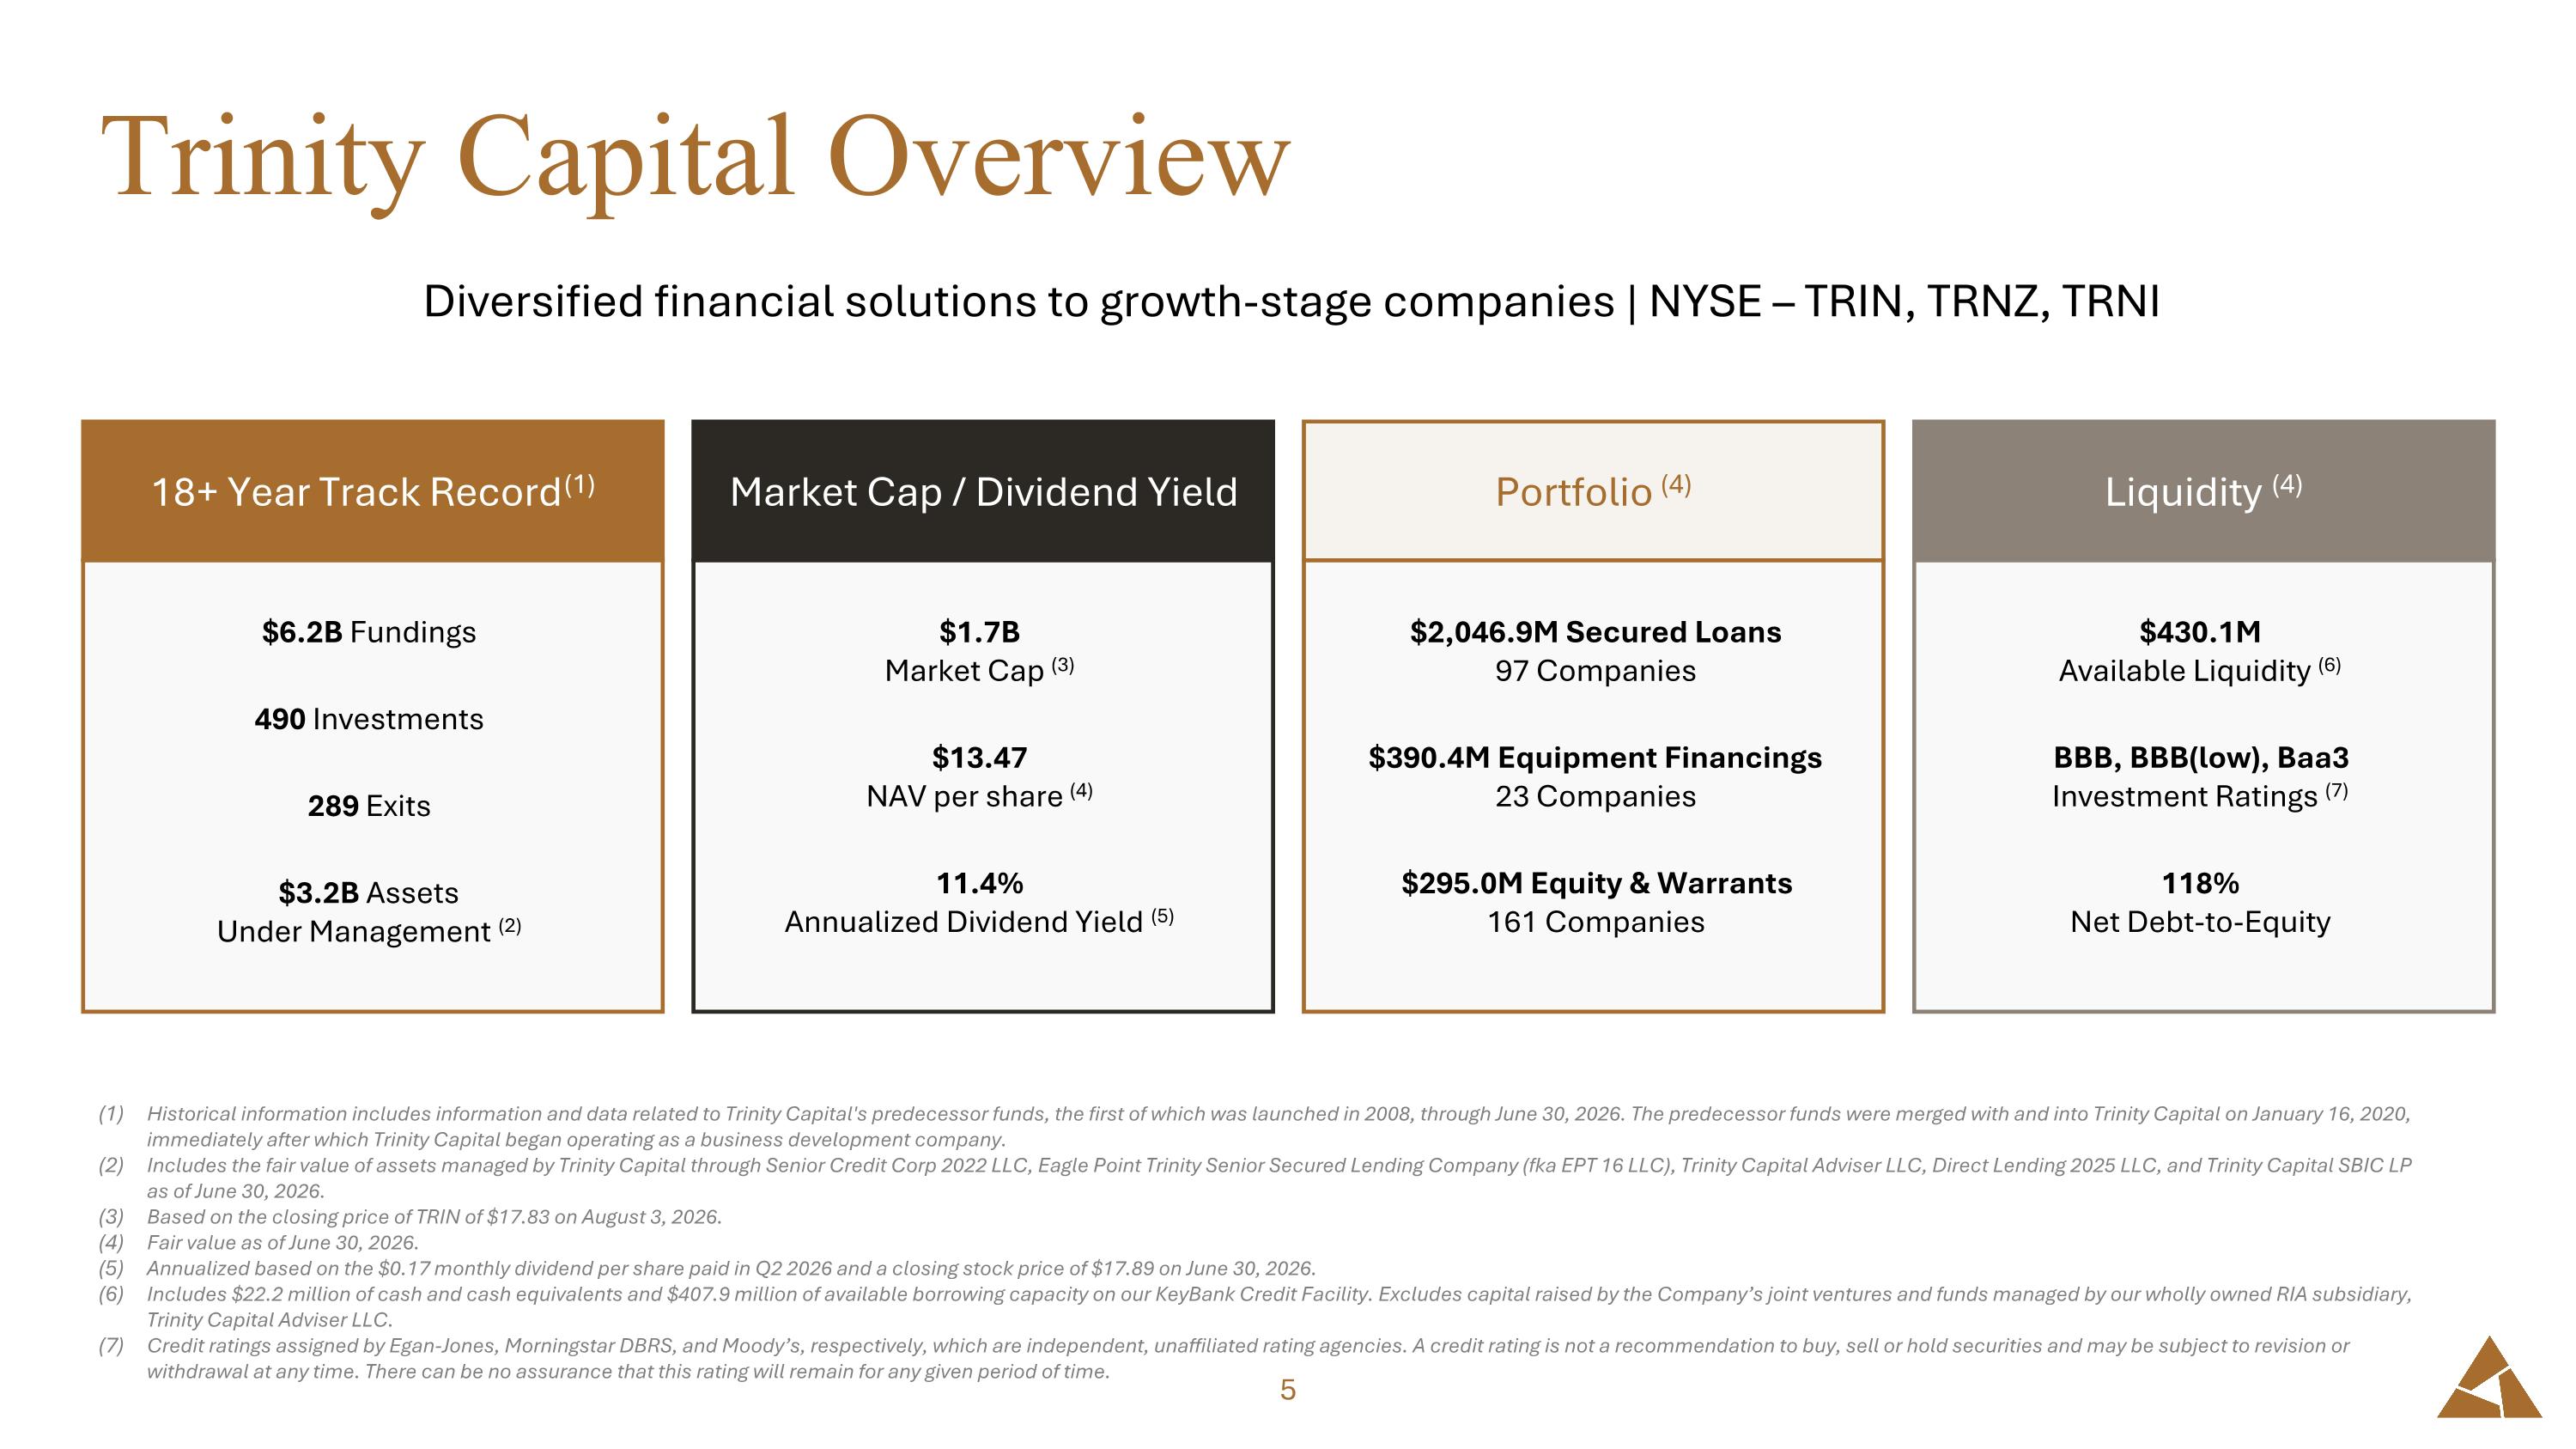
Trinity Capital Overview Historical information includes information and data related to Trinity Capital's predecessor funds, the first of which was launched in 2008, through June 30, 2026. The predecessor funds were merged with and into Trinity Capital on January 16, 2020, immediately after which Trinity Capital began operating as a business development company. Includes the fair value of assets managed by Trinity Capital through Senior Credit Corp 2022 LLC, Eagle Point Trinity Senior Secured Lending Company (fka EPT 16 LLC), Trinity Capital Adviser LLC, Direct Lending 2025 LLC, and Trinity Capital SBIC LP as of June 30, 2026. Based on the closing price of TRIN of $17.83 on August 3, 2026. Fair value as of June 30, 2026. Annualized based on the $0.17 monthly dividend per share paid in Q2 2026 and a closing stock price of $17.89 on June 30, 2026. Includes $22.2 million of cash and cash equivalents and $407.9 million of available borrowing capacity on our KeyBank Credit Facility. Excludes capital raised by the Company’s joint ventures and funds managed by our wholly owned RIA subsidiary, Trinity Capital Adviser LLC. Credit ratings assigned by Egan-Jones, Morningstar DBRS, and Moody’s, respectively, which are independent, unaffiliated rating agencies. A credit rating is not a recommendation to buy, sell or hold securities and may be subject to revision or withdrawal at any time. There can be no assurance that this rating will remain for any given period of time. Diversified financial solutions to growth-stage companies | NYSE – TRIN, TRNZ, TRNI $2,046.9M Secured Loans 97 Companies $390.4M Equipment Financings 23 Companies $295.0M Equity & Warrants 161 Companies Portfolio (4) $430.1M Available Liquidity (6) BBB, BBB(low), Baa3 Investment Ratings (7) 118% Net Debt-to-Equity Liquidity (4) $1.7B Market Cap (3) $13.47 NAV per share (4) 11.4% Annualized Dividend Yield (5) Market Cap / Dividend Yield $6.2B Fundings 490 Investments 289 Exits $3.2B Assets Under Management (2) 18+ Year Track Record (1)
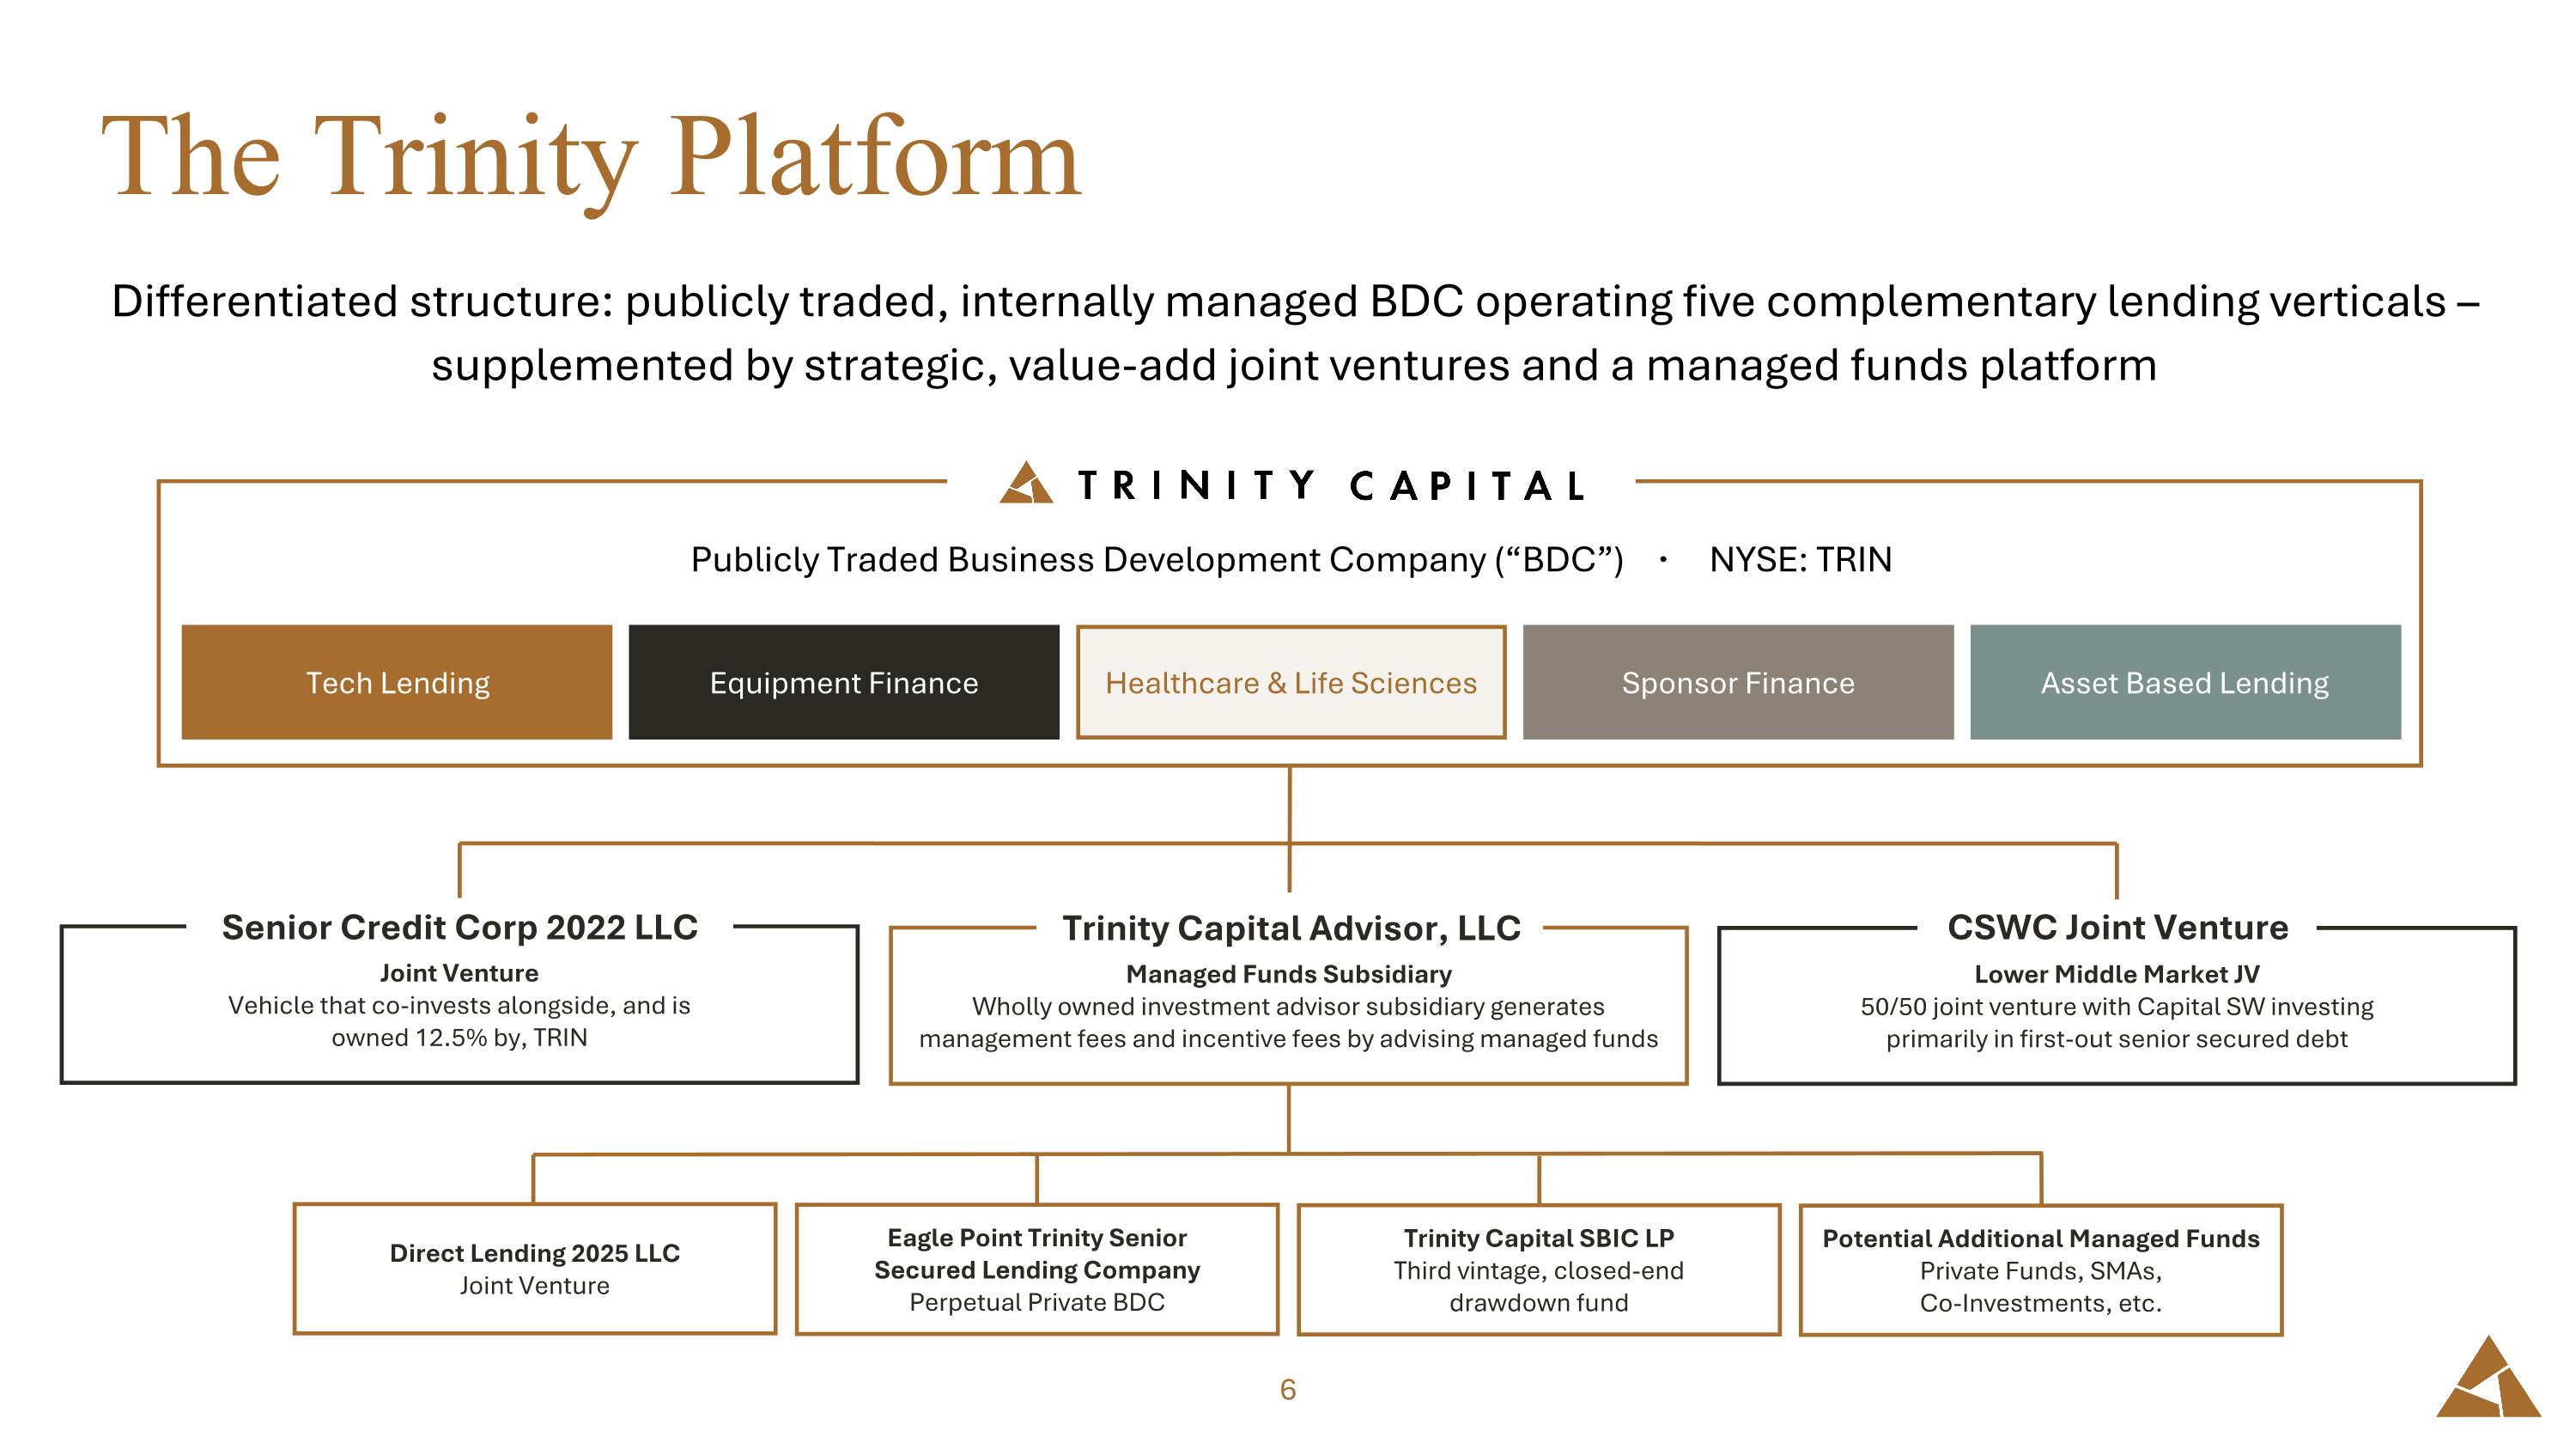
The Trinity Platform Differentiated structure: publicly traded, internally managed BDC operating five complementary lending verticals – supplemented by strategic, value-add joint ventures and a managed funds platform Publicly Traded Business Development Company (“BDC”) · NYSE: TRIN Equipment Finance Tech Lending Healthcare & Life Sciences Sponsor Finance Asset Based Lending Joint Venture Vehicle that co-invests alongside, and is owned 12.5% by, TRIN Senior Credit Corp 2022 LLC Managed Funds Subsidiary Wholly owned investment advisor subsidiary generates management fees and incentive fees by advising managed funds Trinity Capital Advisor, LLC Lower Middle Market JV 50/50 joint venture with Capital SW investing primarily in first-out senior secured debt CSWC Joint Venture Direct Lending 2025 LLC Joint Venture Eagle Point Trinity Senior Secured Lending Company Perpetual Private BDC Trinity Capital SBIC LP Third vintage, closed-end drawdown fund Potential Additional Managed Funds Private Funds, SMAs, Co-Investments, etc.
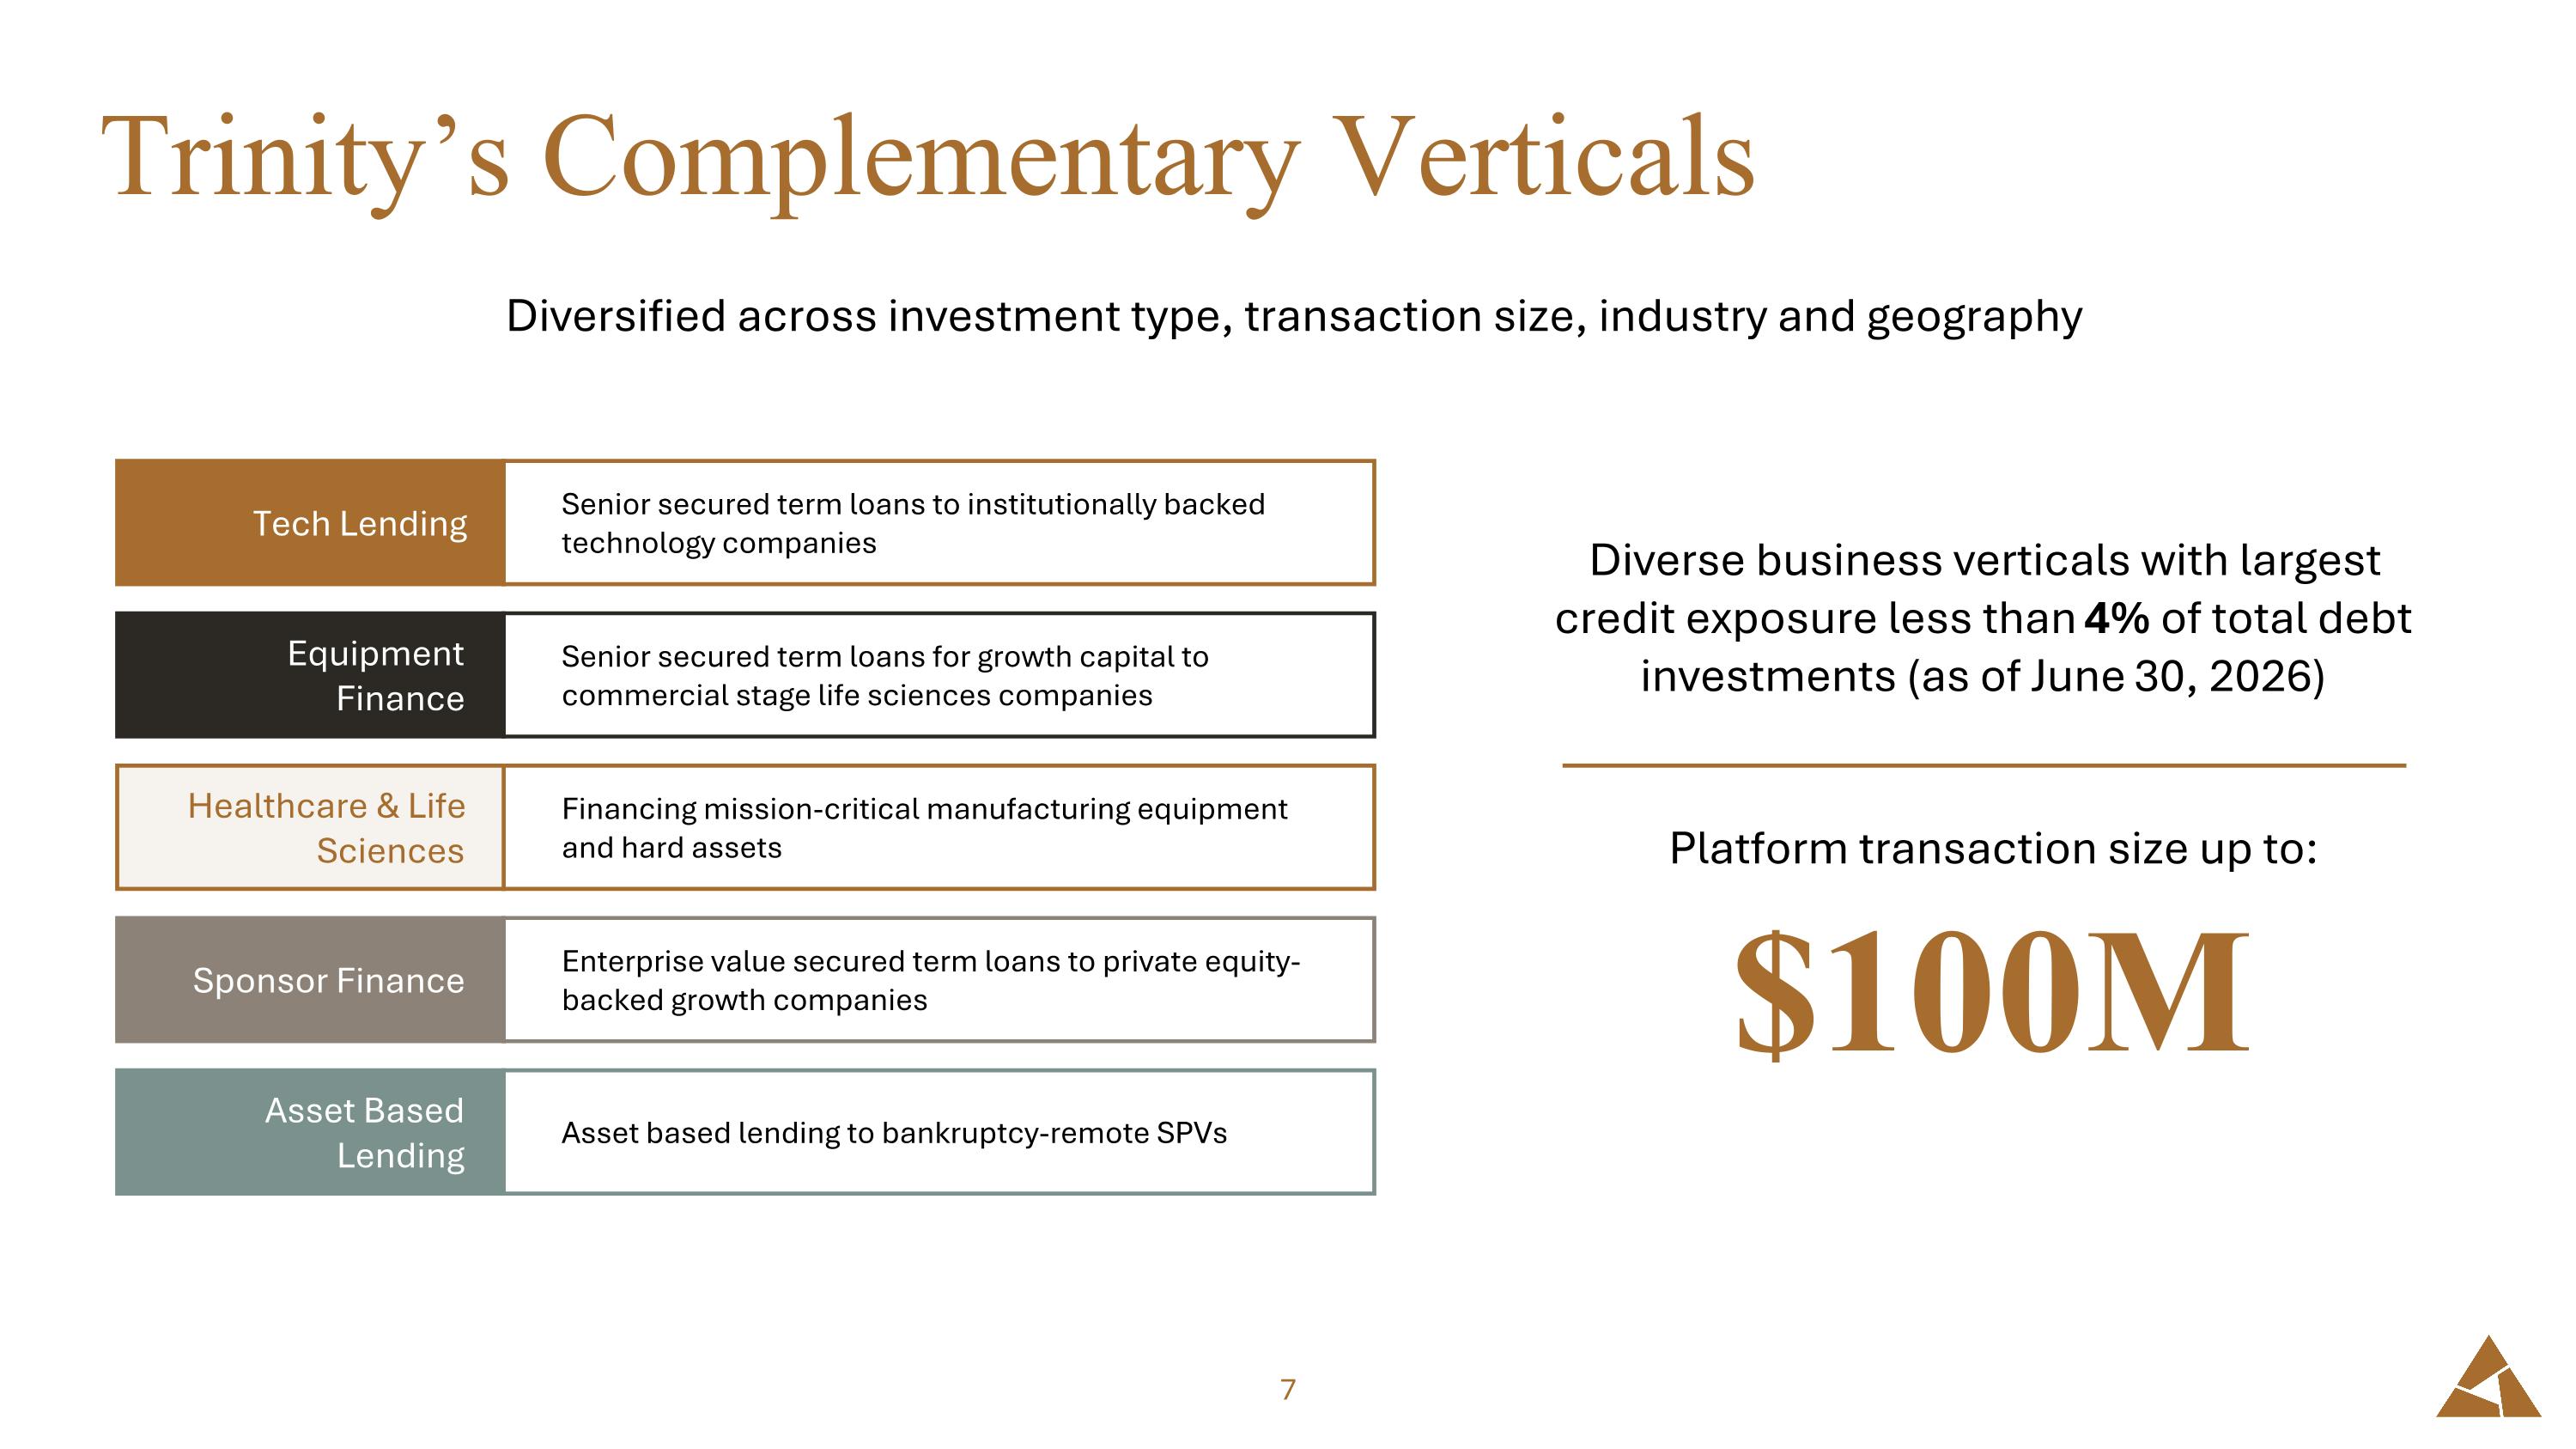
Trinity’s Complementary Verticals Diversified across investment type, transaction size, industry and geography Senior secured term loans to institutionally backed technology companies Tech Lending Senior secured term loans for growth capital to commercial stage life sciences companies Equipment Finance Financing mission-critical manufacturing equipment and hard assets Healthcare & Life Sciences Enterprise value secured term loans to private equity-backed growth companies Sponsor Finance Asset based lending to bankruptcy-remote SPVs Asset Based Lending Diverse business verticals with largest credit exposure less than 4% of total debt investments (as of June 30, 2026) Platform transaction size up to: $100M
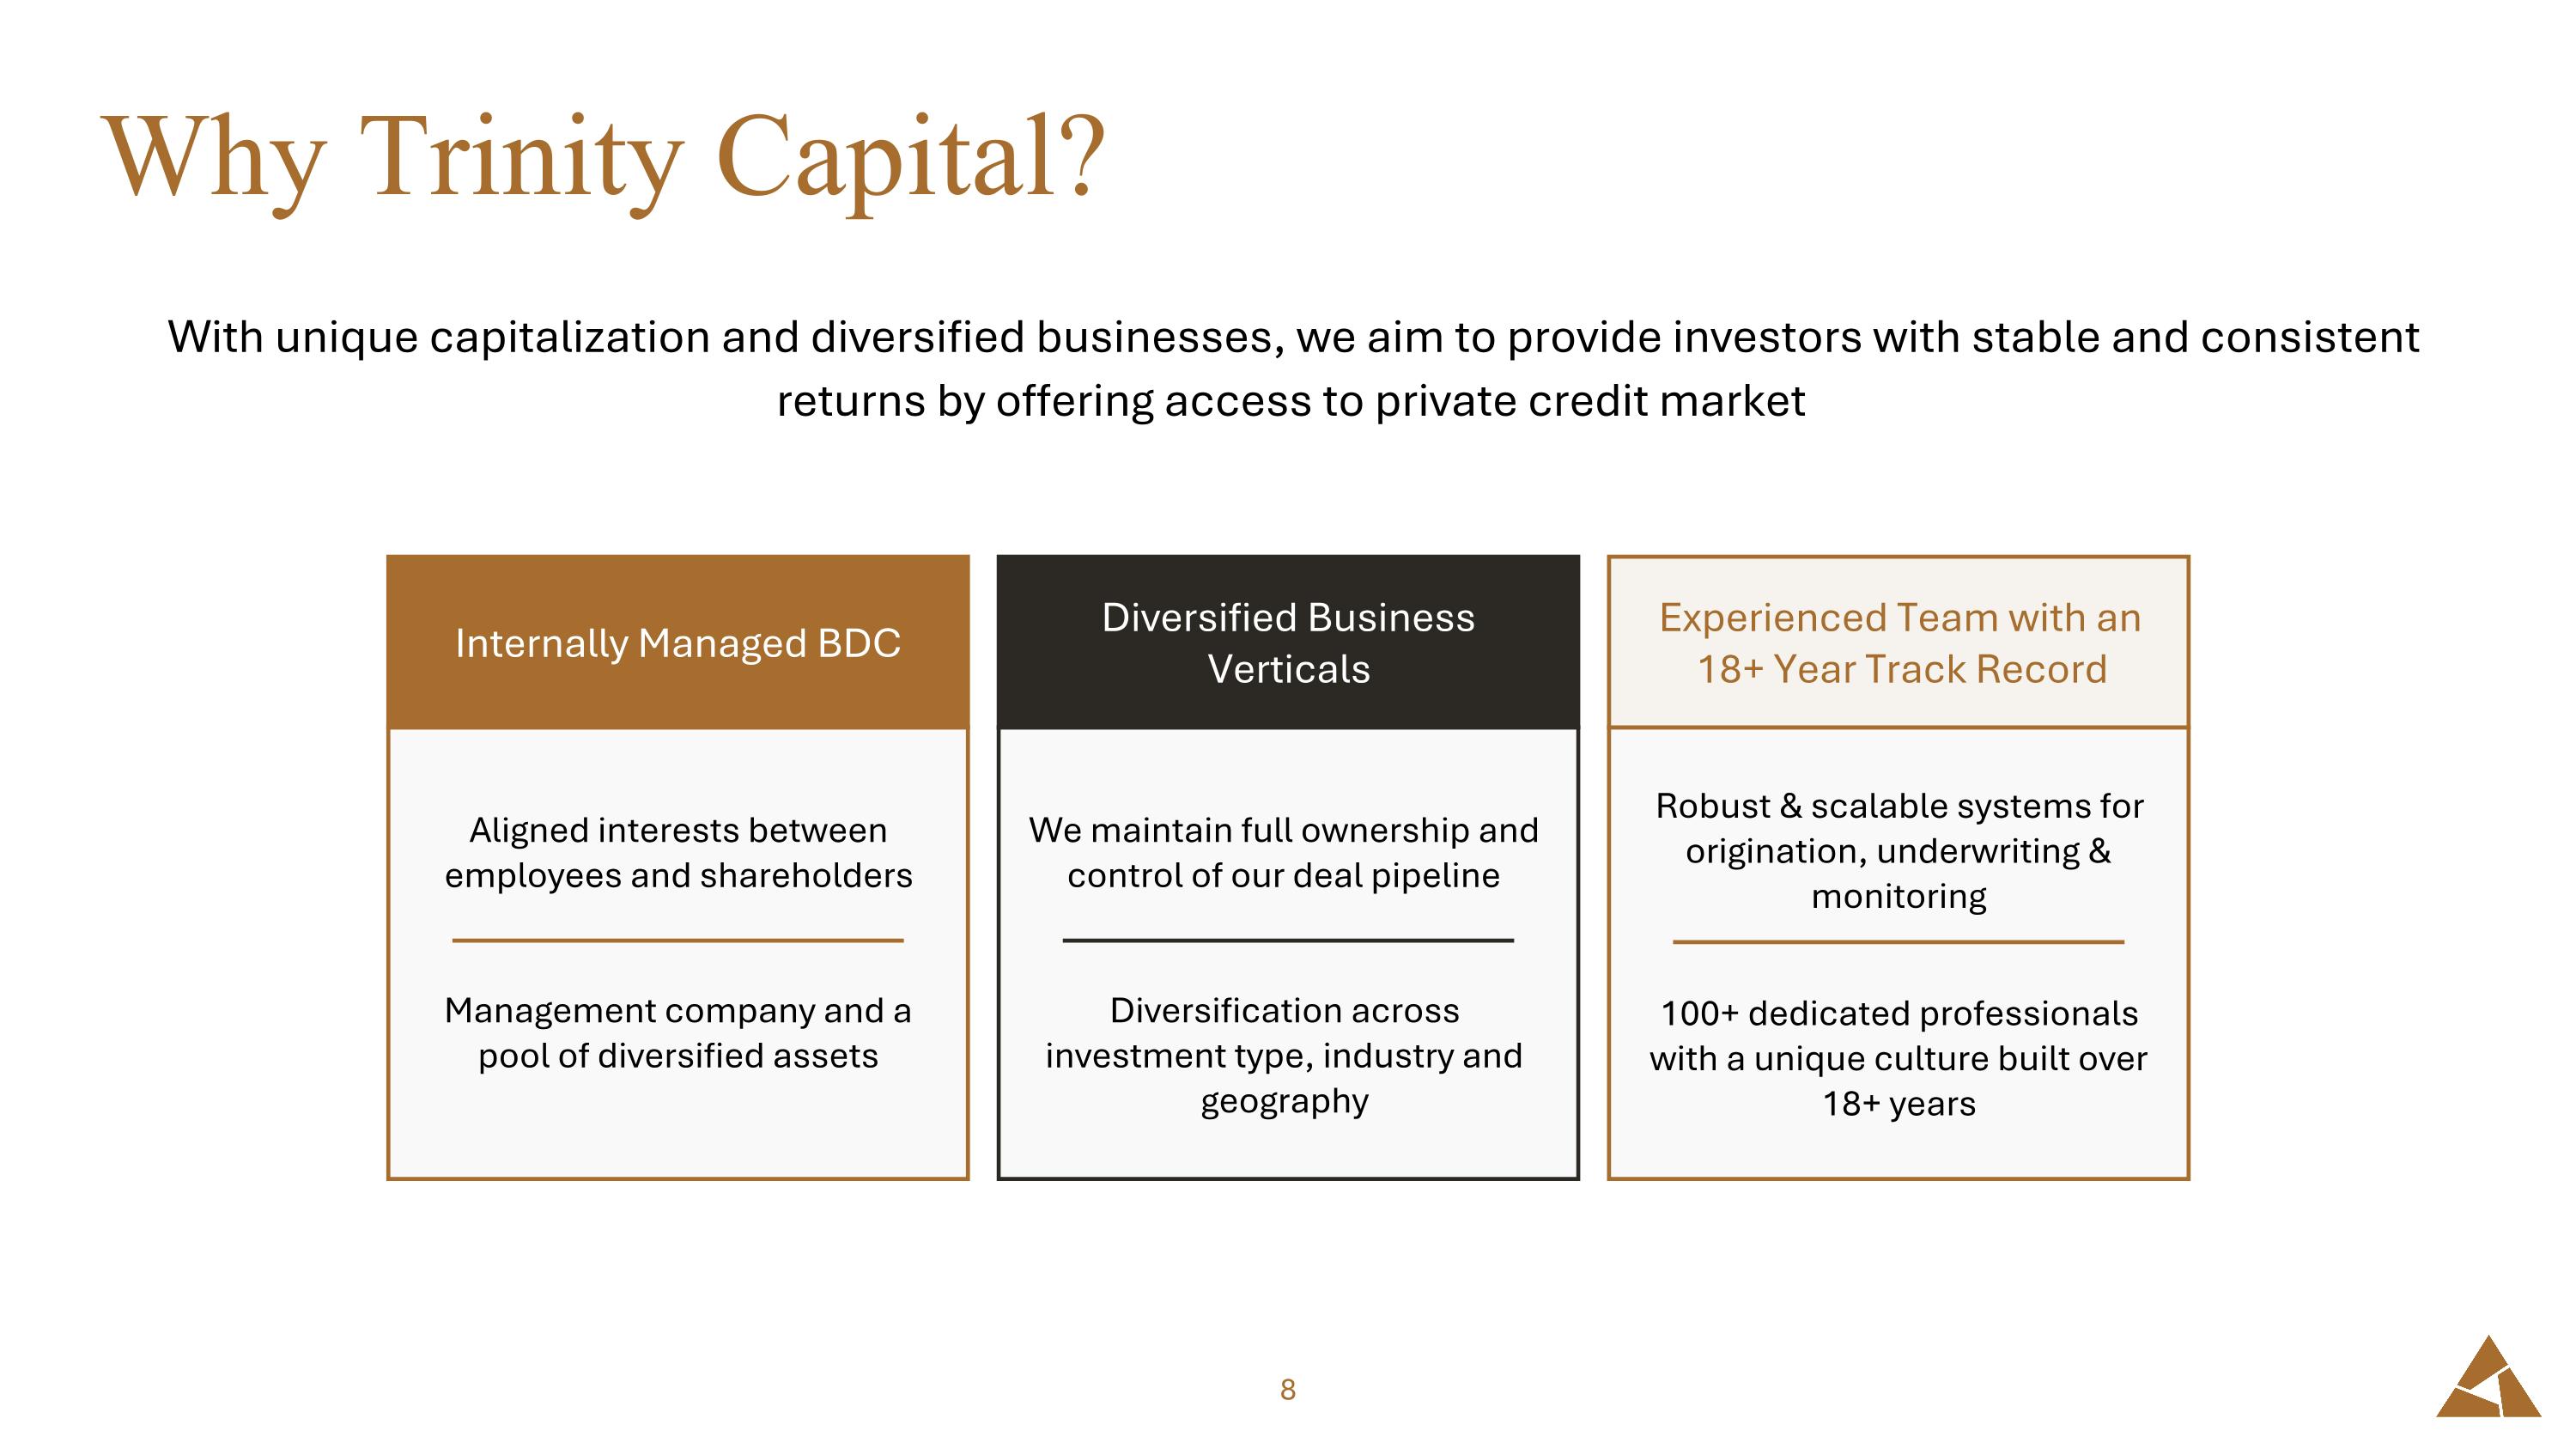
Why Trinity Capital? With unique capitalization and diversified businesses, we aim to provide investors with stable and consistent returns by offering access to private credit market Experienced Team with an 18+ Year Track Record Diversified Business Verticals Aligned interests between employees and shareholders Management company and a pool of diversified assets Internally Managed BDC We maintain full ownership and control of our deal pipeline Diversification across investment type, industry and geography Robust & scalable systems for origination, underwriting & monitoring 100+ dedicated professionals with a unique culture built over 18+ years
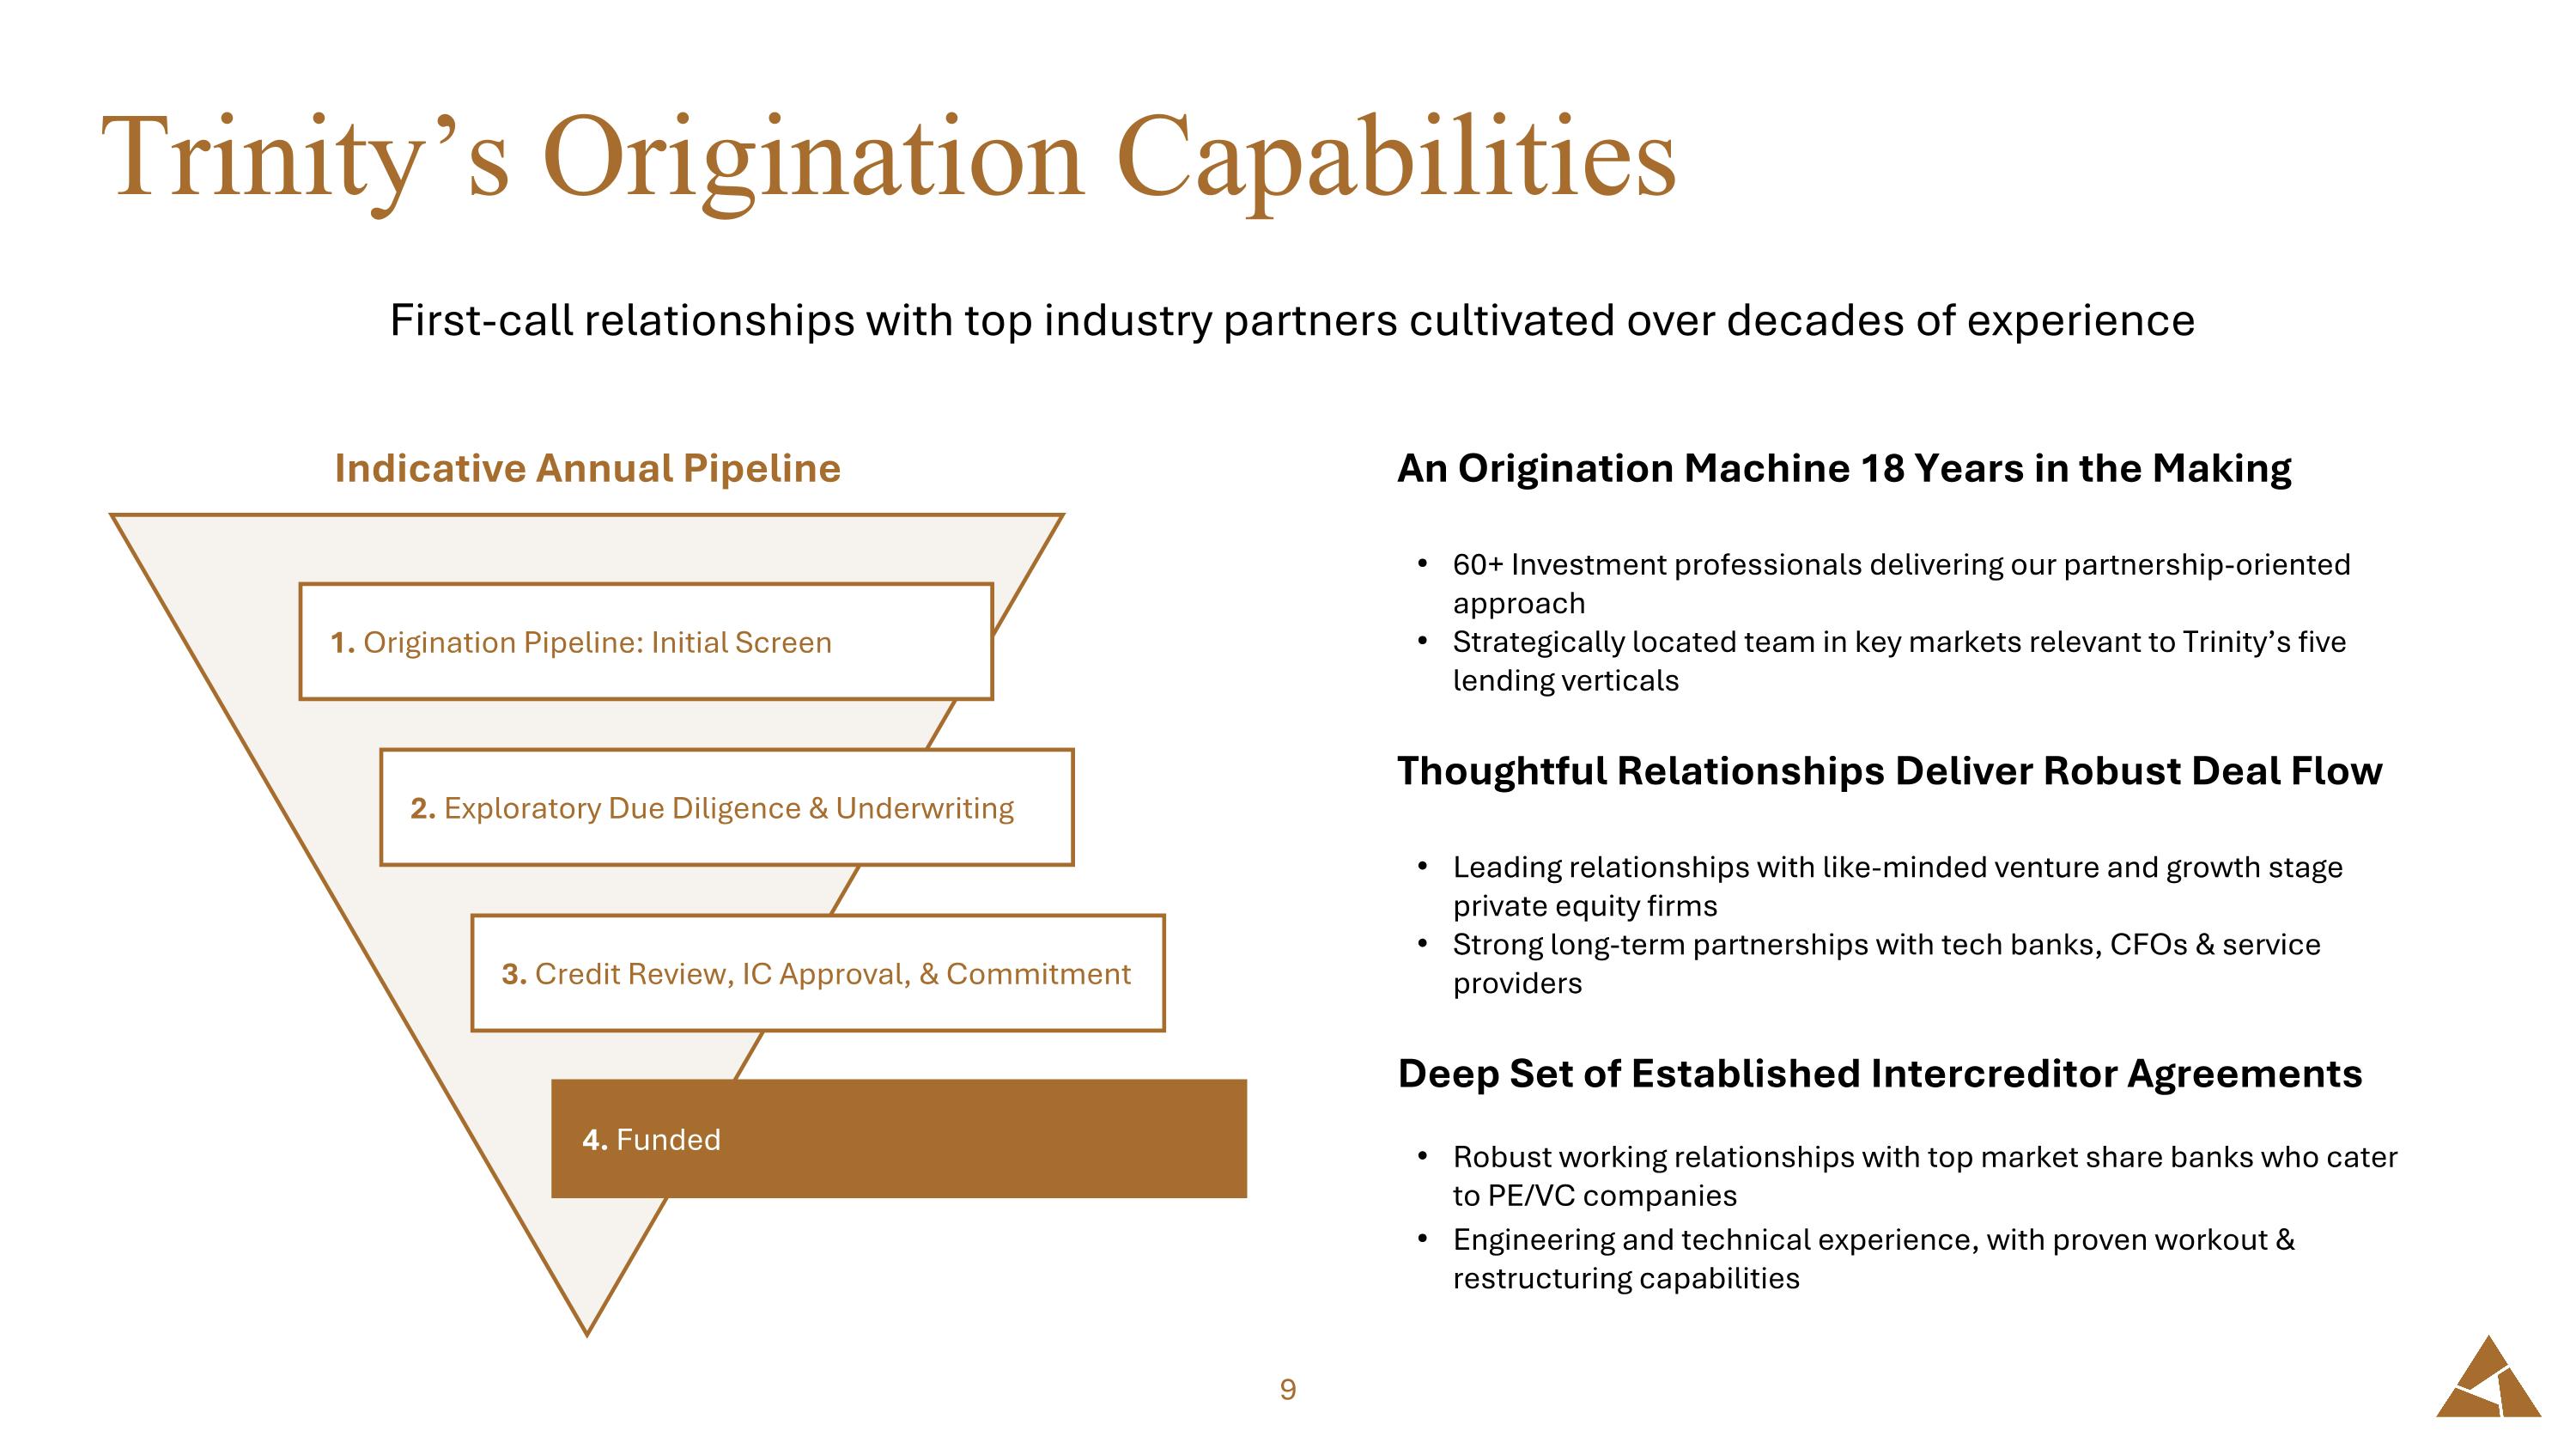
Trinity’s Origination Capabilities First-call relationships with top industry partners cultivated over decades of experience 1. Origination Pipeline: Initial Screen 2. Exploratory Due Diligence & Underwriting 3. Credit Review, IC Approval, & Commitment 4. Funded Indicative Annual Pipeline An Origination Machine 18 Years in the Making 60+ Investment professionals delivering our partnership-oriented approach Strategically located team in key markets relevant to Trinity’s five lending verticals Thoughtful Relationships Deliver Robust Deal Flow Leading relationships with like-minded venture and growth stage private equity firms Strong long-term partnerships with tech banks, CFOs & service providers Deep Set of Established Intercreditor Agreements Robust working relationships with top market share banks who cater to PE/VC companies Engineering and technical experience, with proven workout & restructuring capabilities
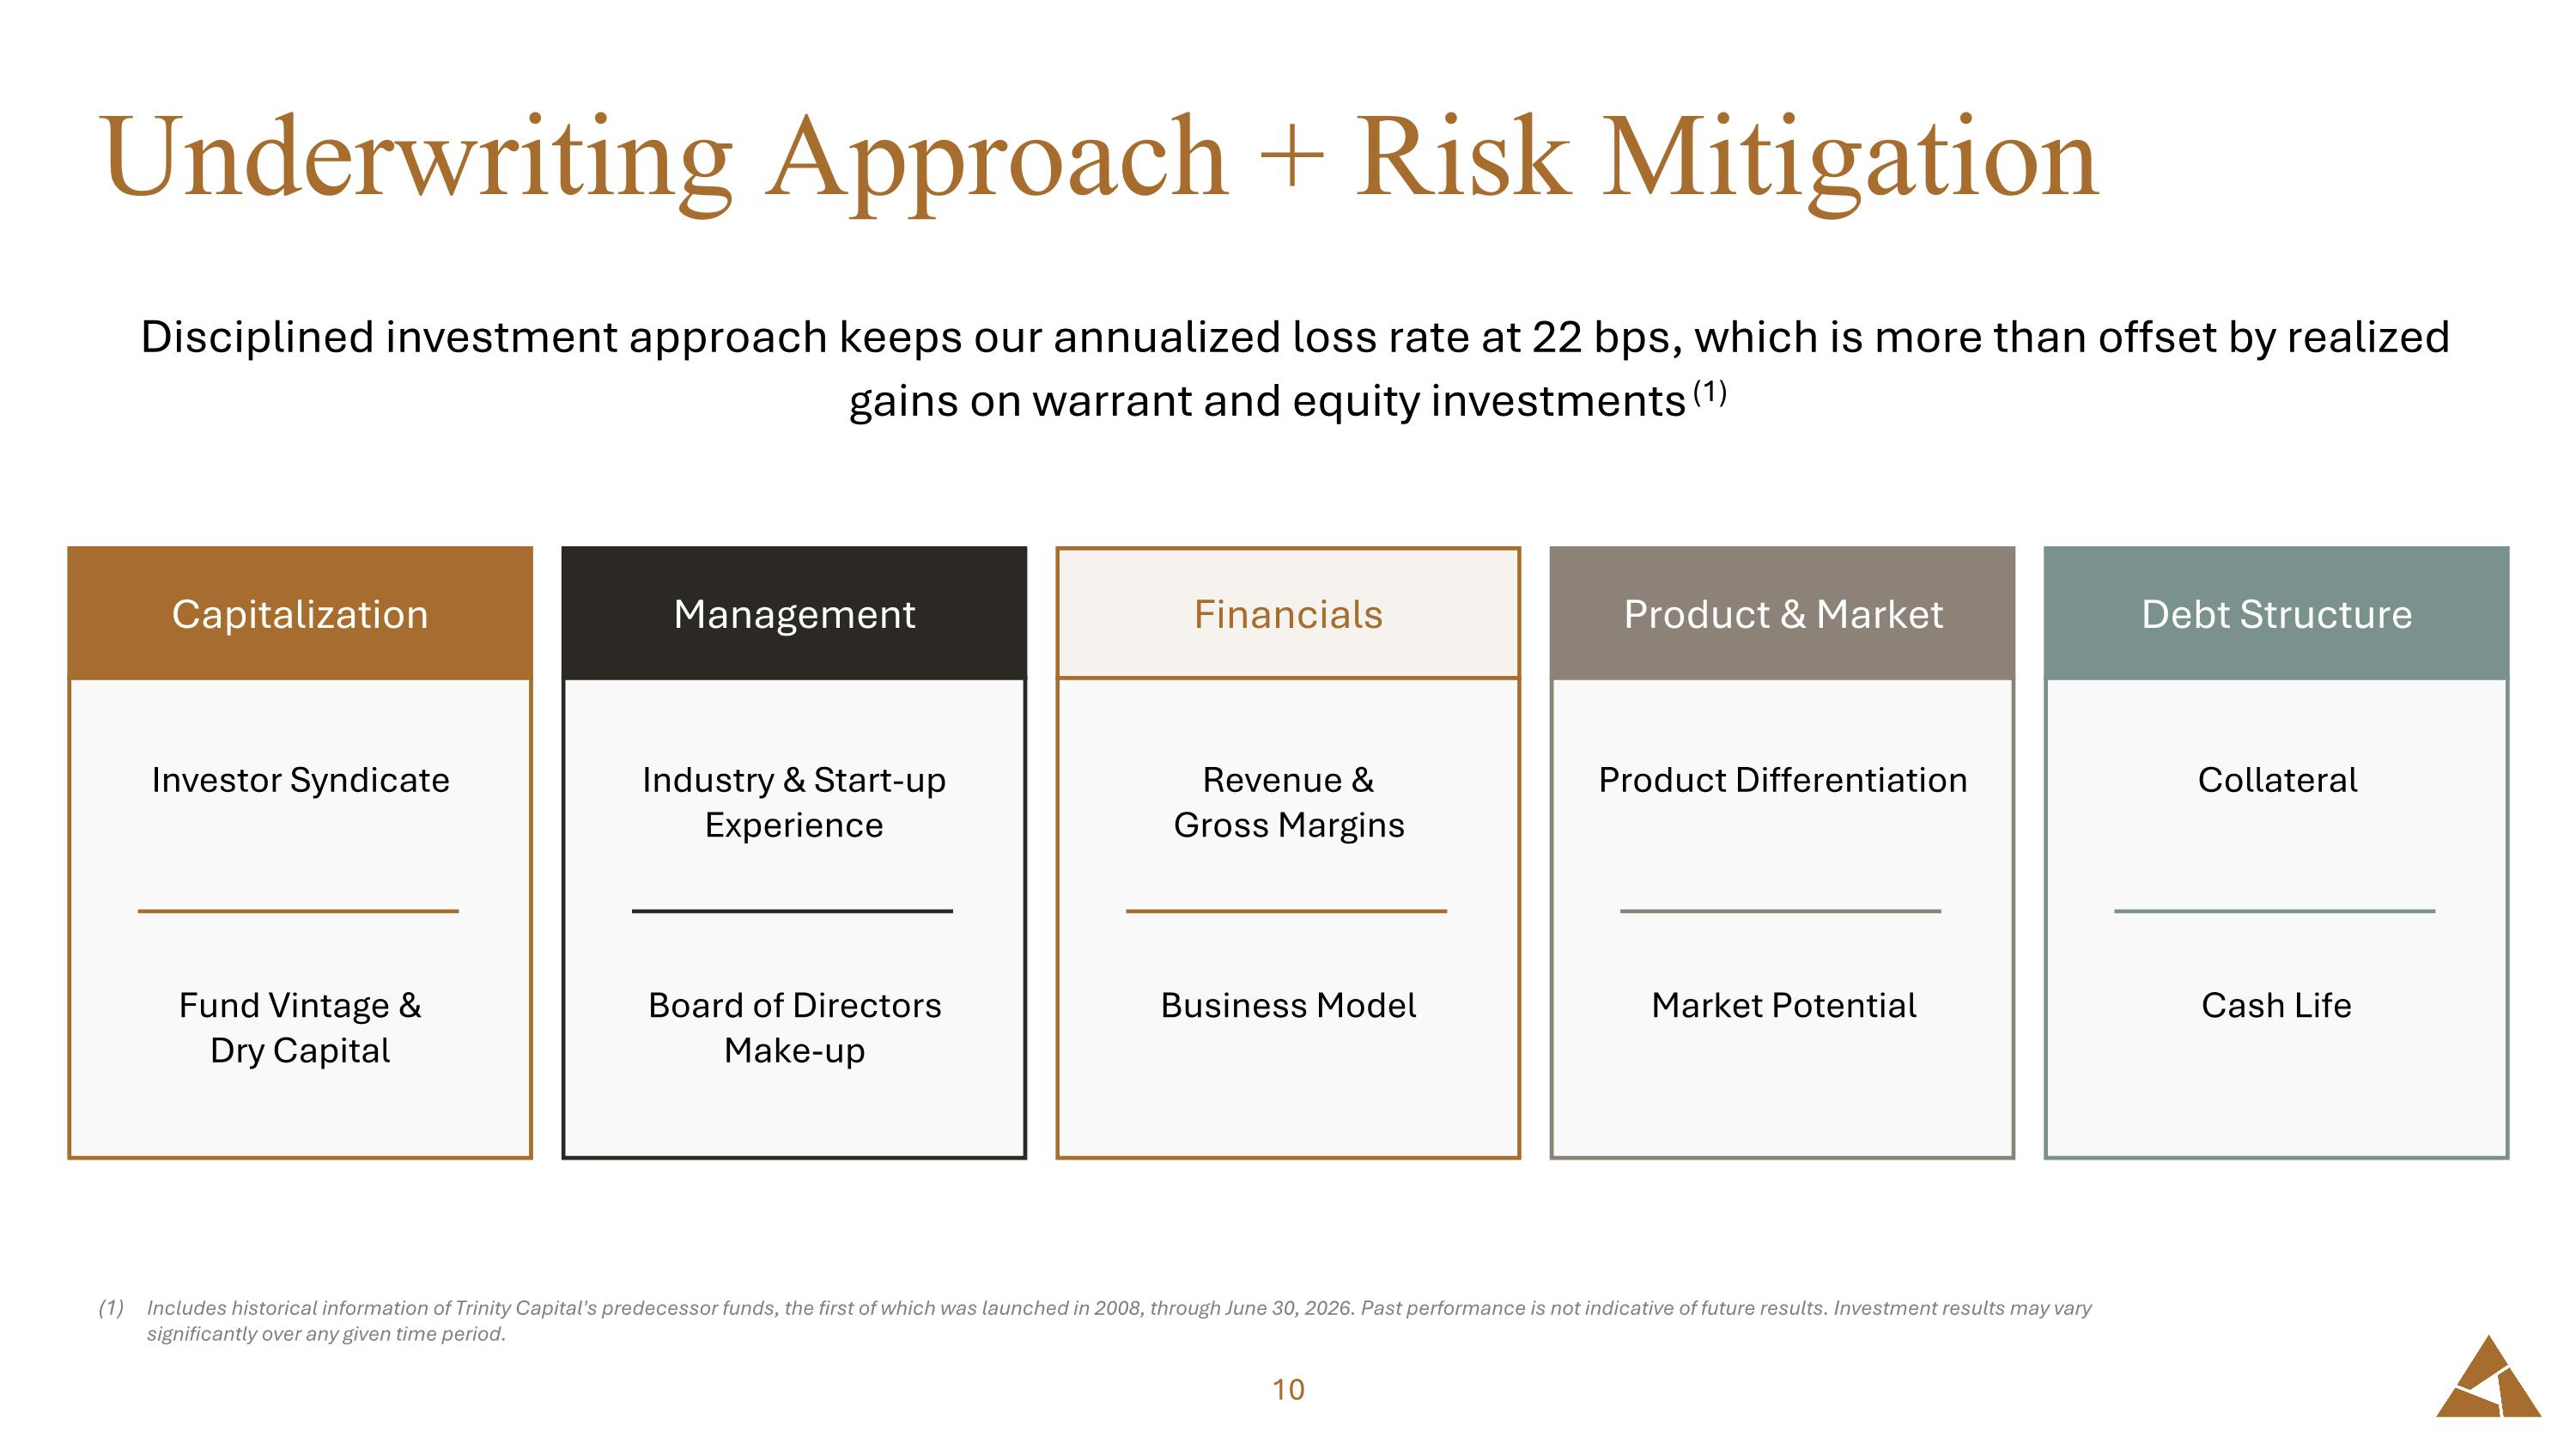
Underwriting Approach + Risk Mitigation Disciplined investment approach keeps our annualized loss rate at 22 bps, which is more than offset by realized gains on warrant and equity investments (1) Includes historical information of Trinity Capital's predecessor funds, the first of which was launched in 2008, through June 30, 2026. Past performance is not indicative of future results. Investment results may vary significantly over any given time period. Revenue & Gross Margins Business Model Financials Product Differentiation Market Potential Product & Market Collateral Cash Life Debt Structure Industry & Start-up Experience Board of Directors Make-up Management Investor Syndicate Fund Vintage & Dry Capital Capitalization
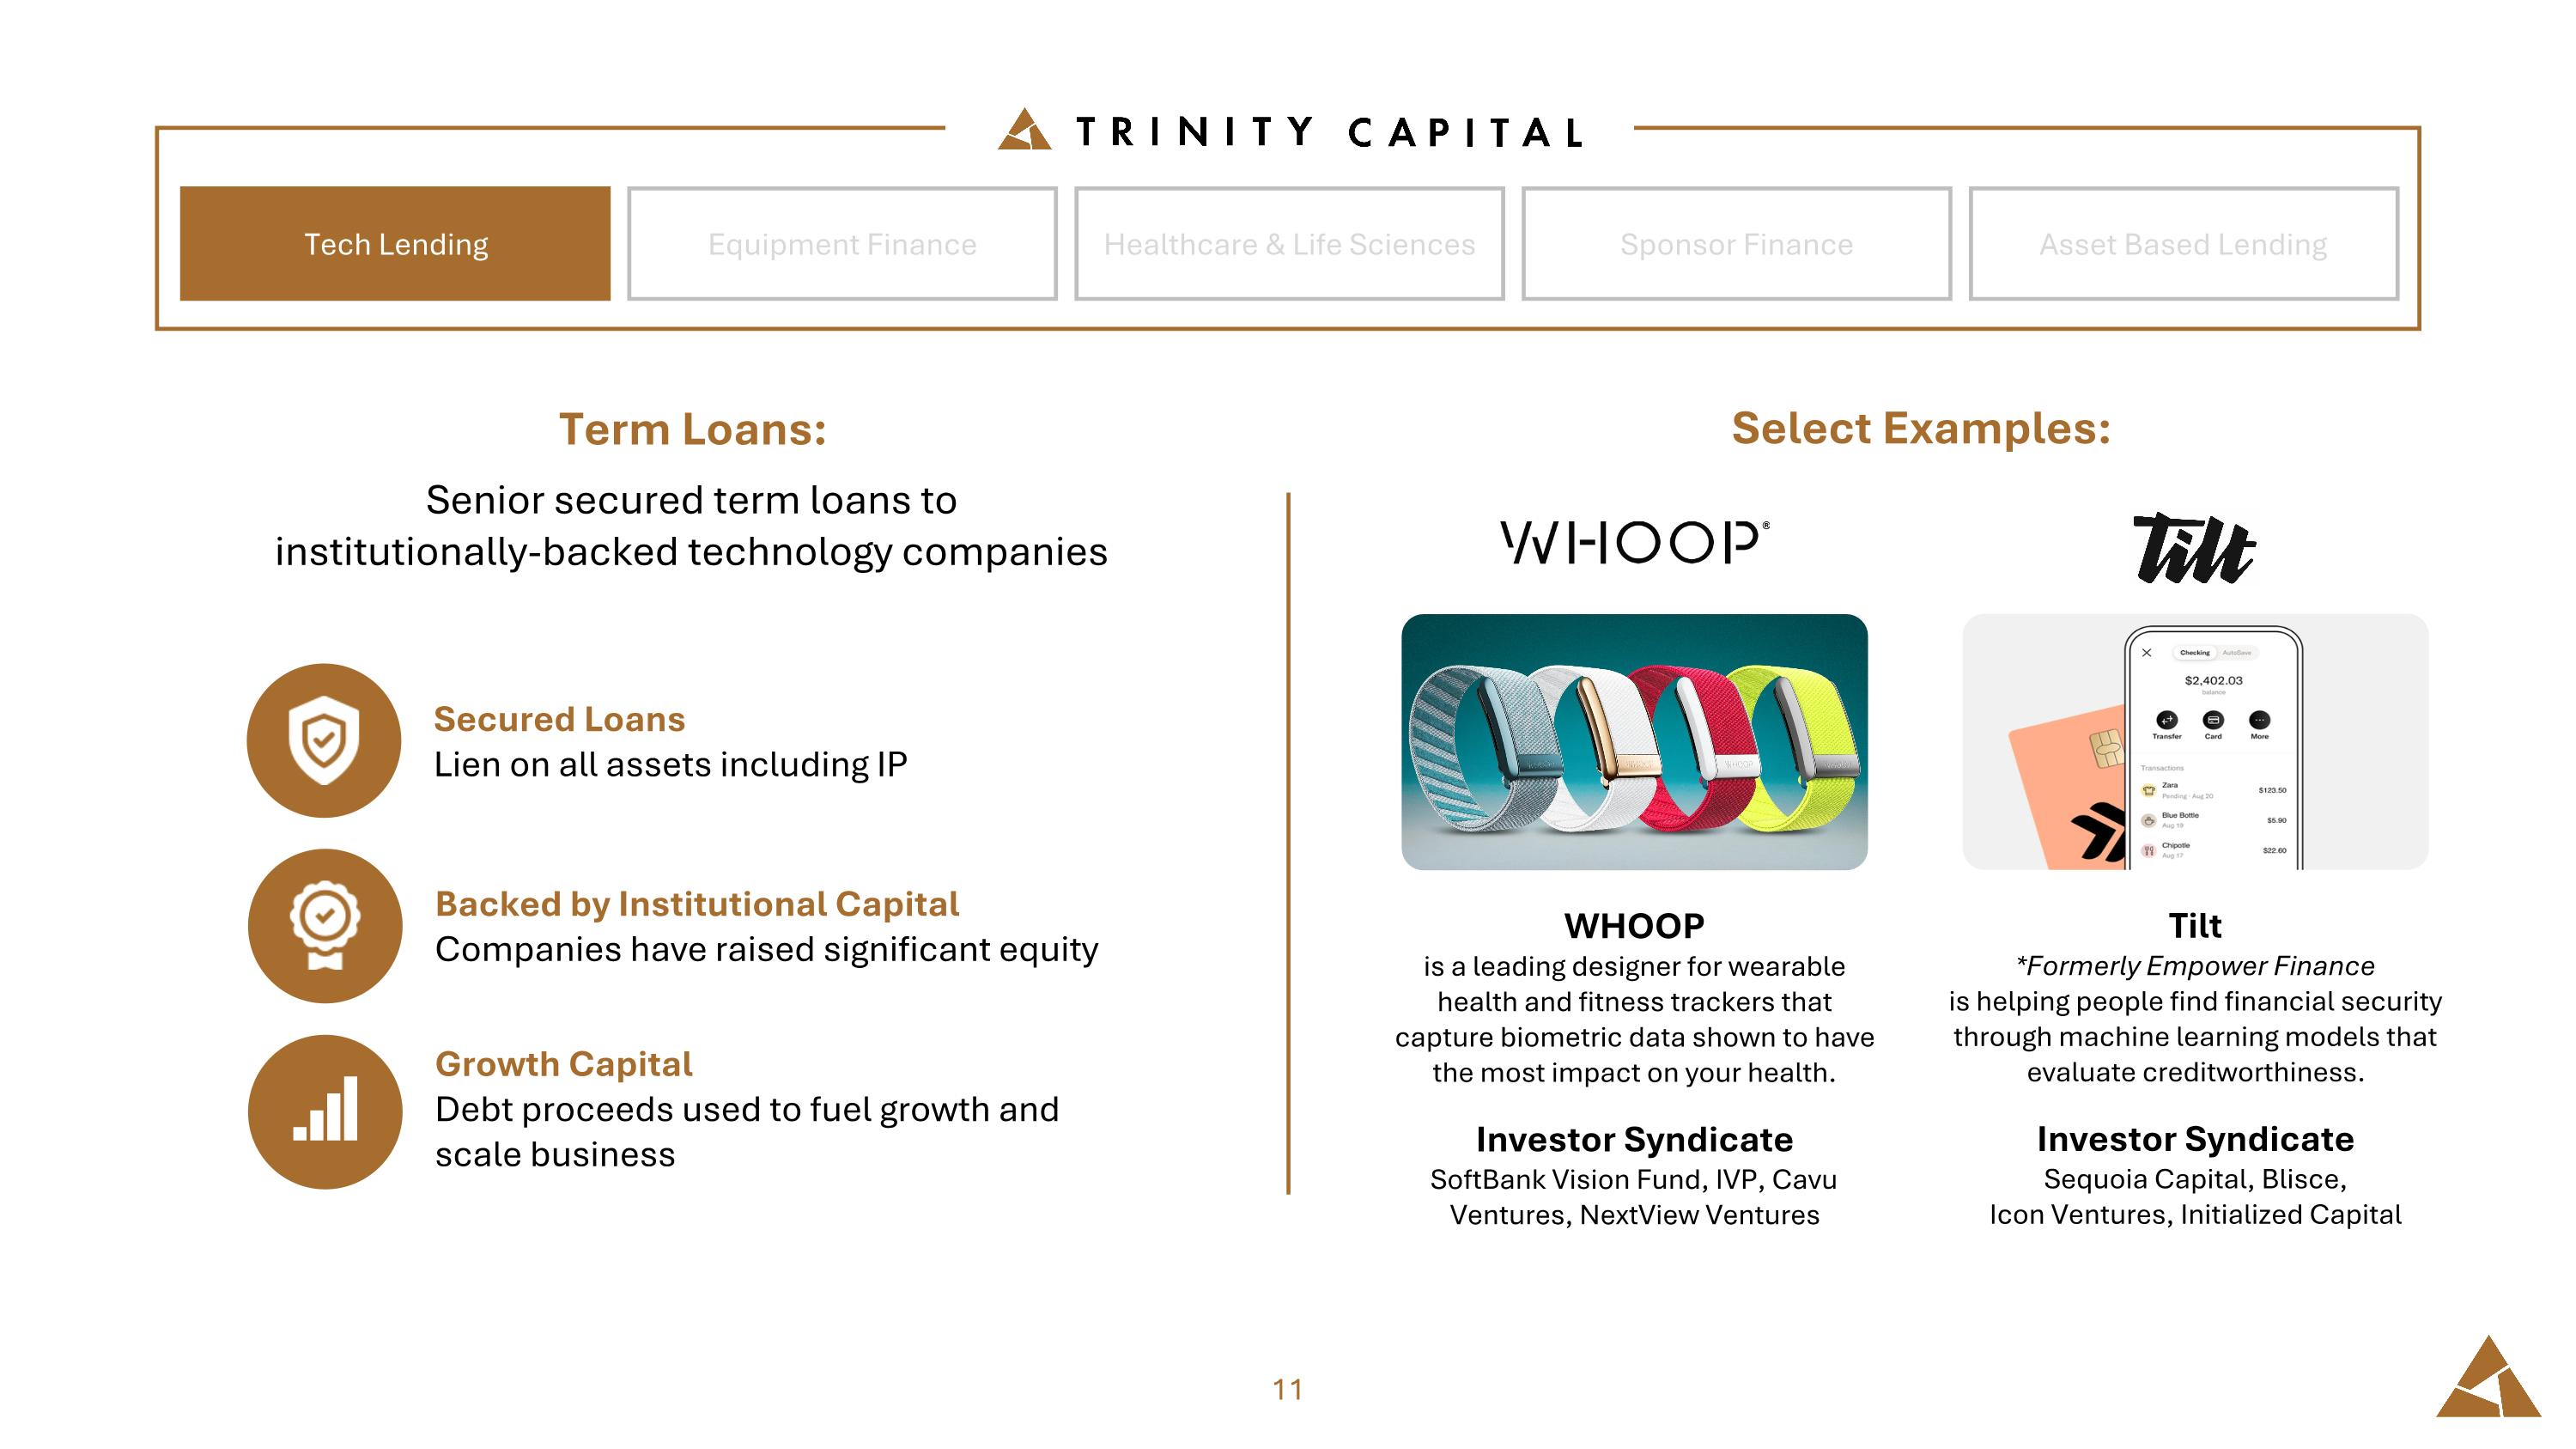
Equipment Finance Tech Lending Healthcare & Life Sciences Sponsor Finance Asset Based Lending Term Loans: Senior secured term loans to institutionally-backed technology companies Secured Loans Lien on all assets including IP Backed by Institutional Capital Companies have raised significant equity Growth Capital Debt proceeds used to fuel growth and scale business WHOOP is a leading designer for wearable health and fitness trackers that capture biometric data shown to have the most impact on your health. Investor Syndicate SoftBank Vision Fund, IVP, Cavu Ventures, NextView Ventures Tilt *Formerly Empower Finance is helping people find financial security through machine learning models that evaluate creditworthiness. Investor Syndicate Sequoia Capital, Blisce, Icon Ventures, Initialized Capital Select Examples:
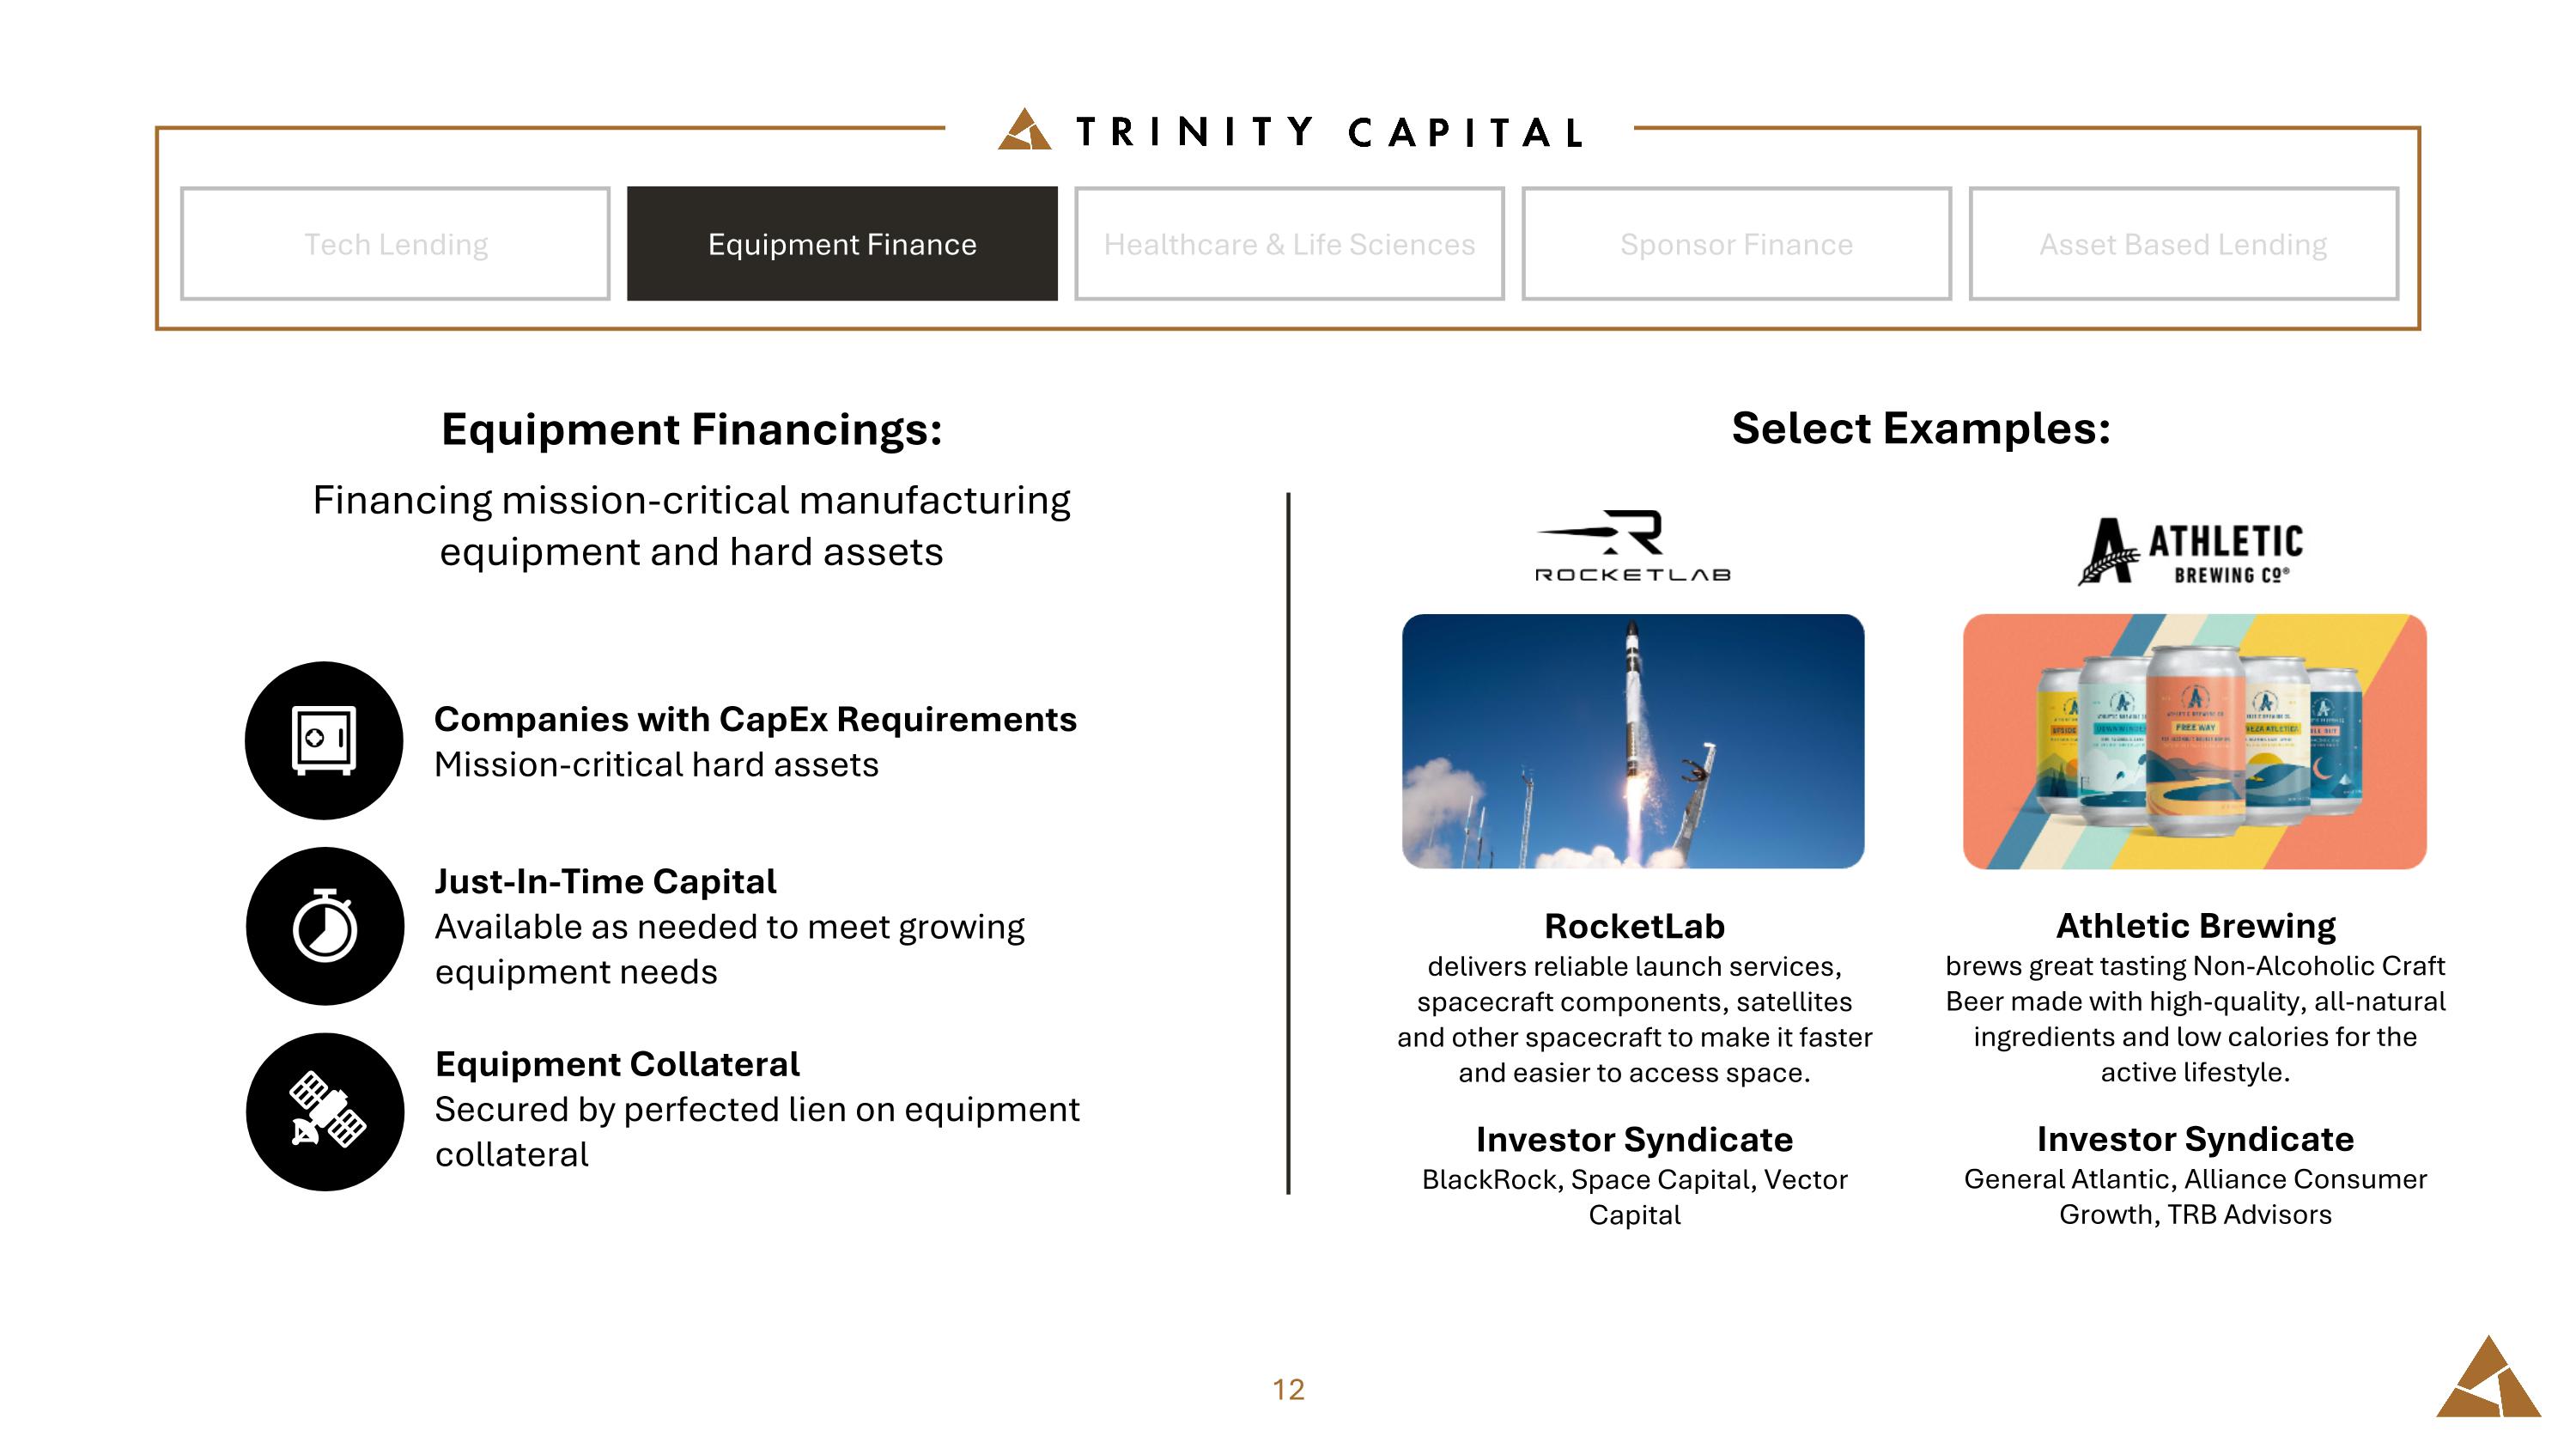
Equipment Finance Tech Lending Healthcare & Life Sciences Sponsor Finance Asset Based Lending Equipment Financings: Financing mission-critical manufacturing equipment and hard assets Companies with CapEx Requirements Mission-critical hard assets Just-In-Time Capital Available as needed to meet growing equipment needs Equipment Collateral Secured by perfected lien on equipment collateral RocketLab delivers reliable launch services, spacecraft components, satellites and other spacecraft to make it faster and easier to access space. Investor Syndicate BlackRock, Space Capital, Vector Capital Athletic Brewing brews great tasting Non-Alcoholic Craft Beer made with high-quality, all-natural ingredients and low calories for the active lifestyle. Investor Syndicate General Atlantic, Alliance Consumer Growth, TRB Advisors Select Examples:
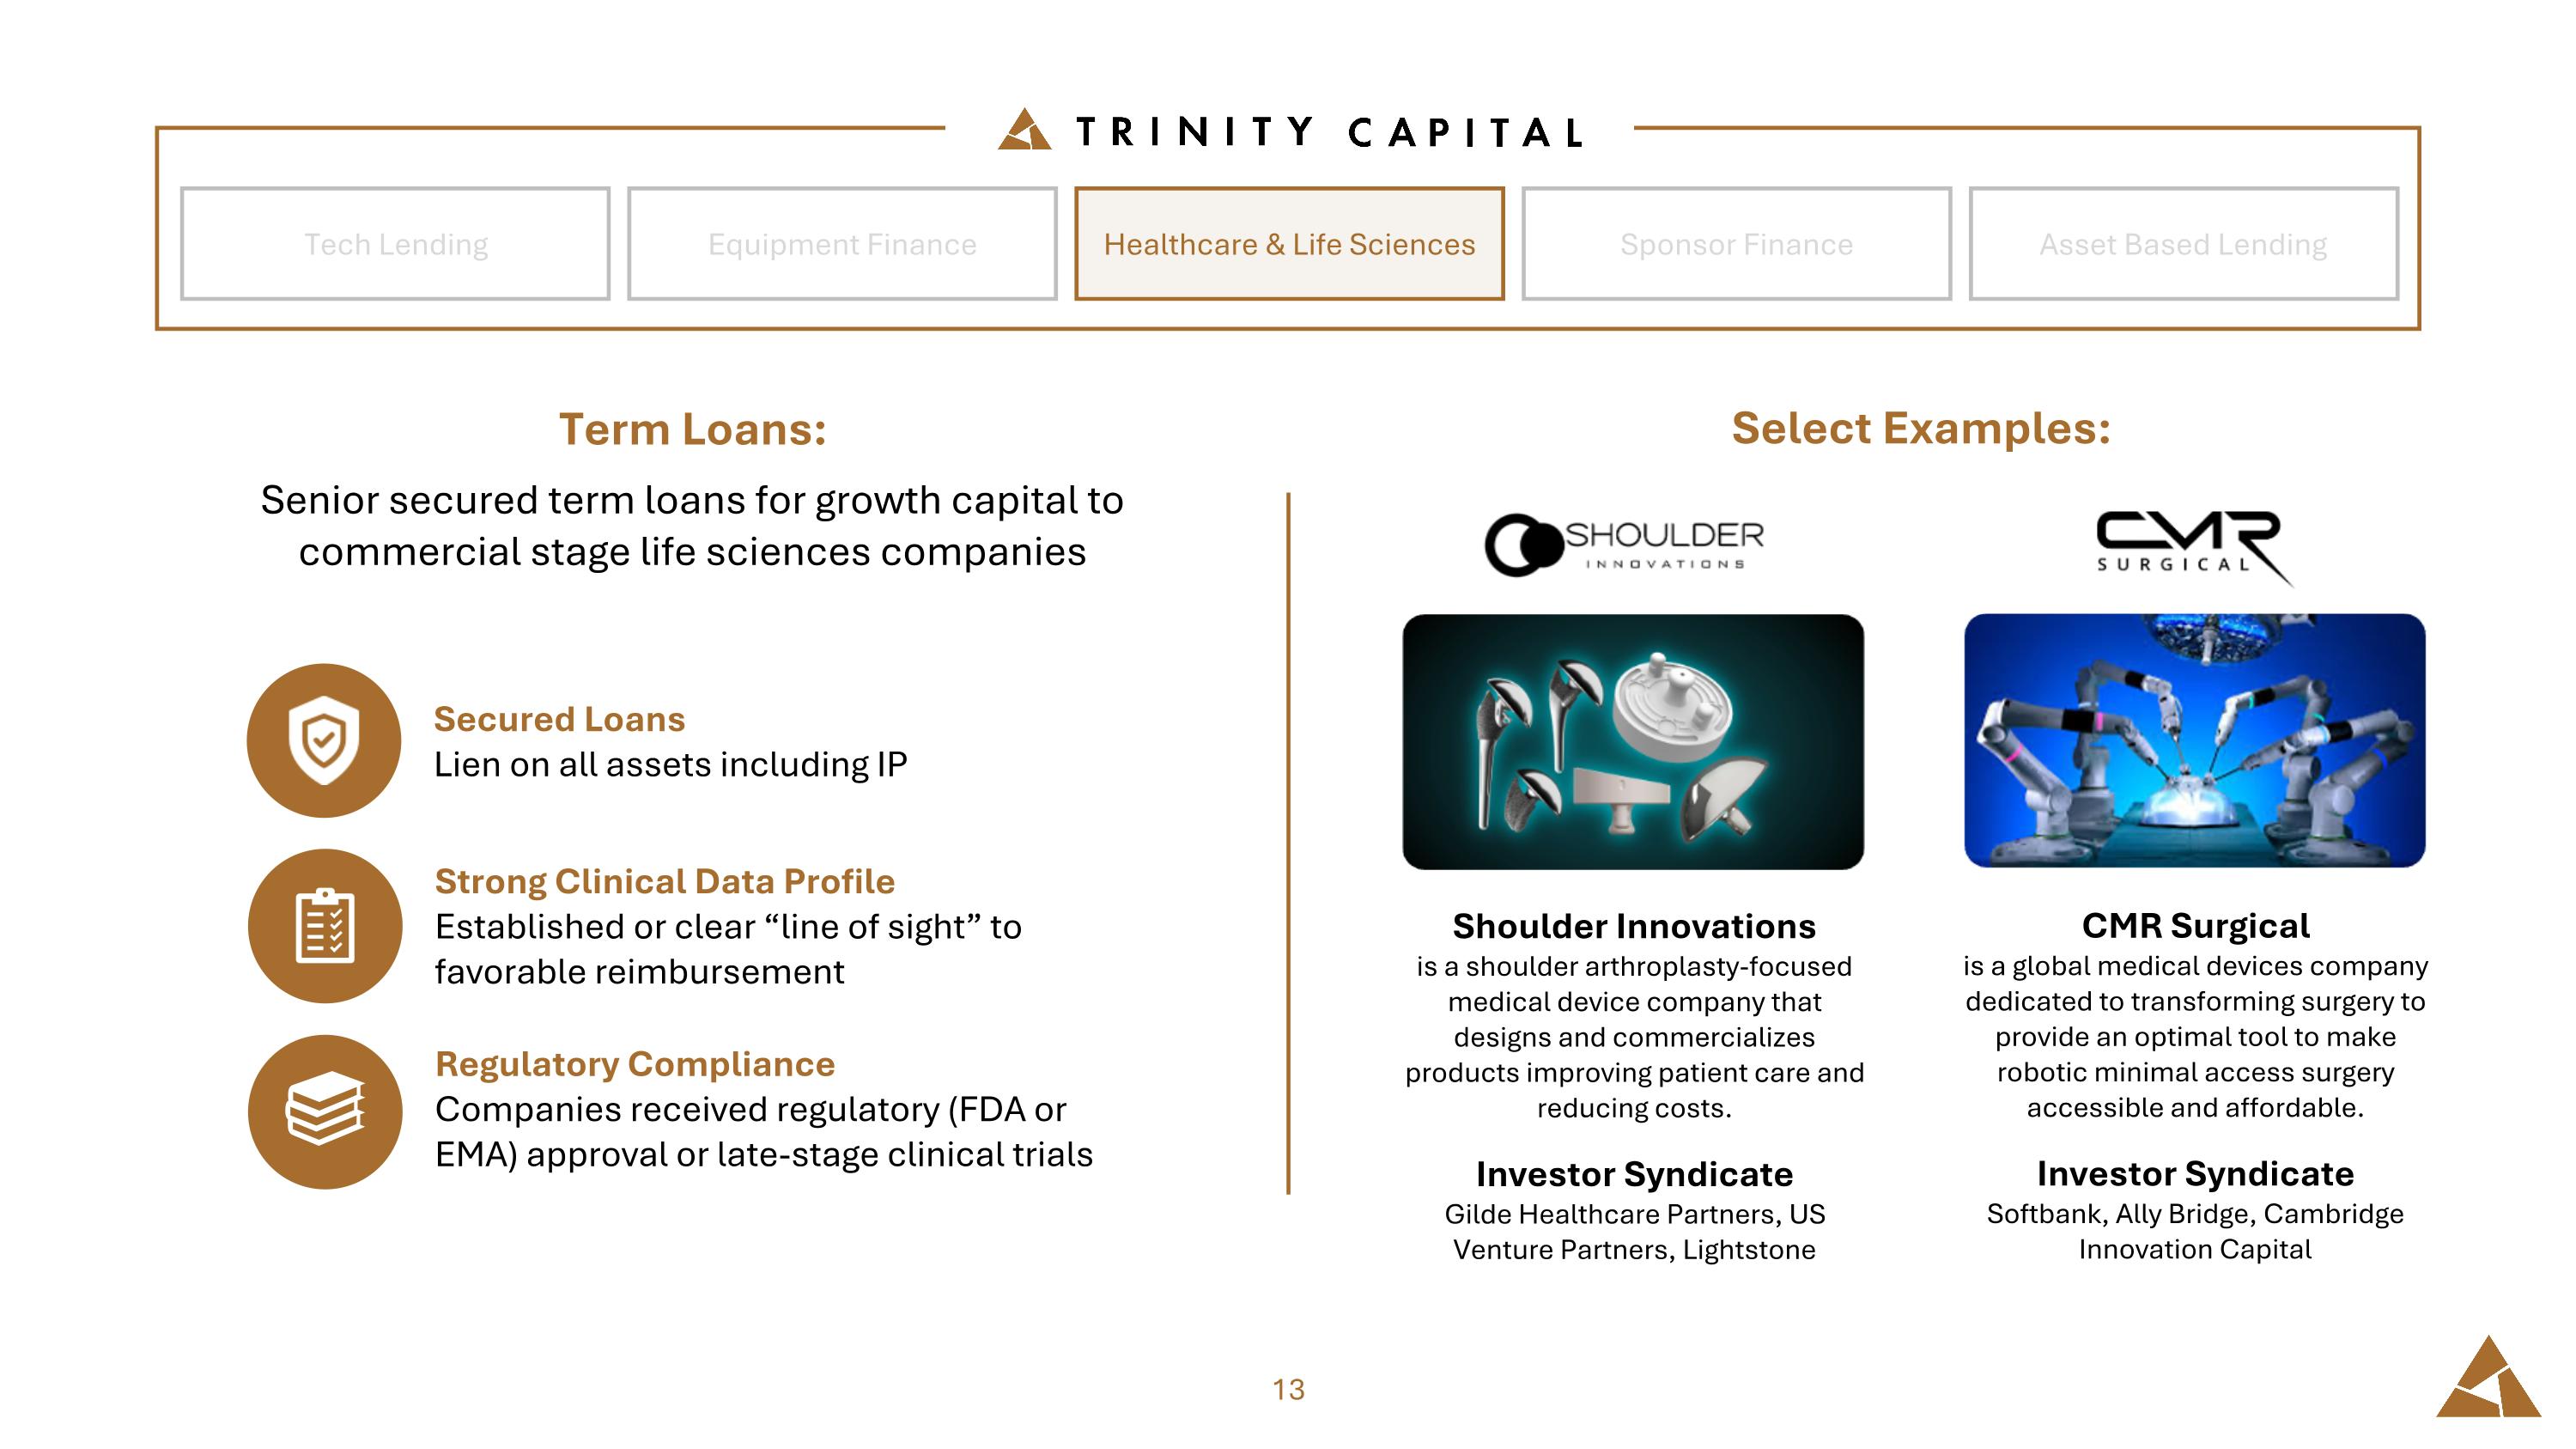
Equipment Finance Tech Lending Healthcare & Life Sciences Sponsor Finance Asset Based Lending Term Loans: Senior secured term loans for growth capital to commercial stage life sciences companies Select Examples: Secured Loans Lien on all assets including IP Strong Clinical Data Profile Established or clear “line of sight” to favorable reimbursement Regulatory Compliance Companies received regulatory (FDA or EMA) approval or late-stage clinical trials Shoulder Innovations is a shoulder arthroplasty-focused medical device company that designs and commercializes products improving patient care and reducing costs. Investor Syndicate Gilde Healthcare Partners, US Venture Partners, Lightstone CMR Surgical is a global medical devices company dedicated to transforming surgery to provide an optimal tool to make robotic minimal access surgery accessible and affordable. Investor Syndicate Softbank, Ally Bridge, Cambridge Innovation Capital
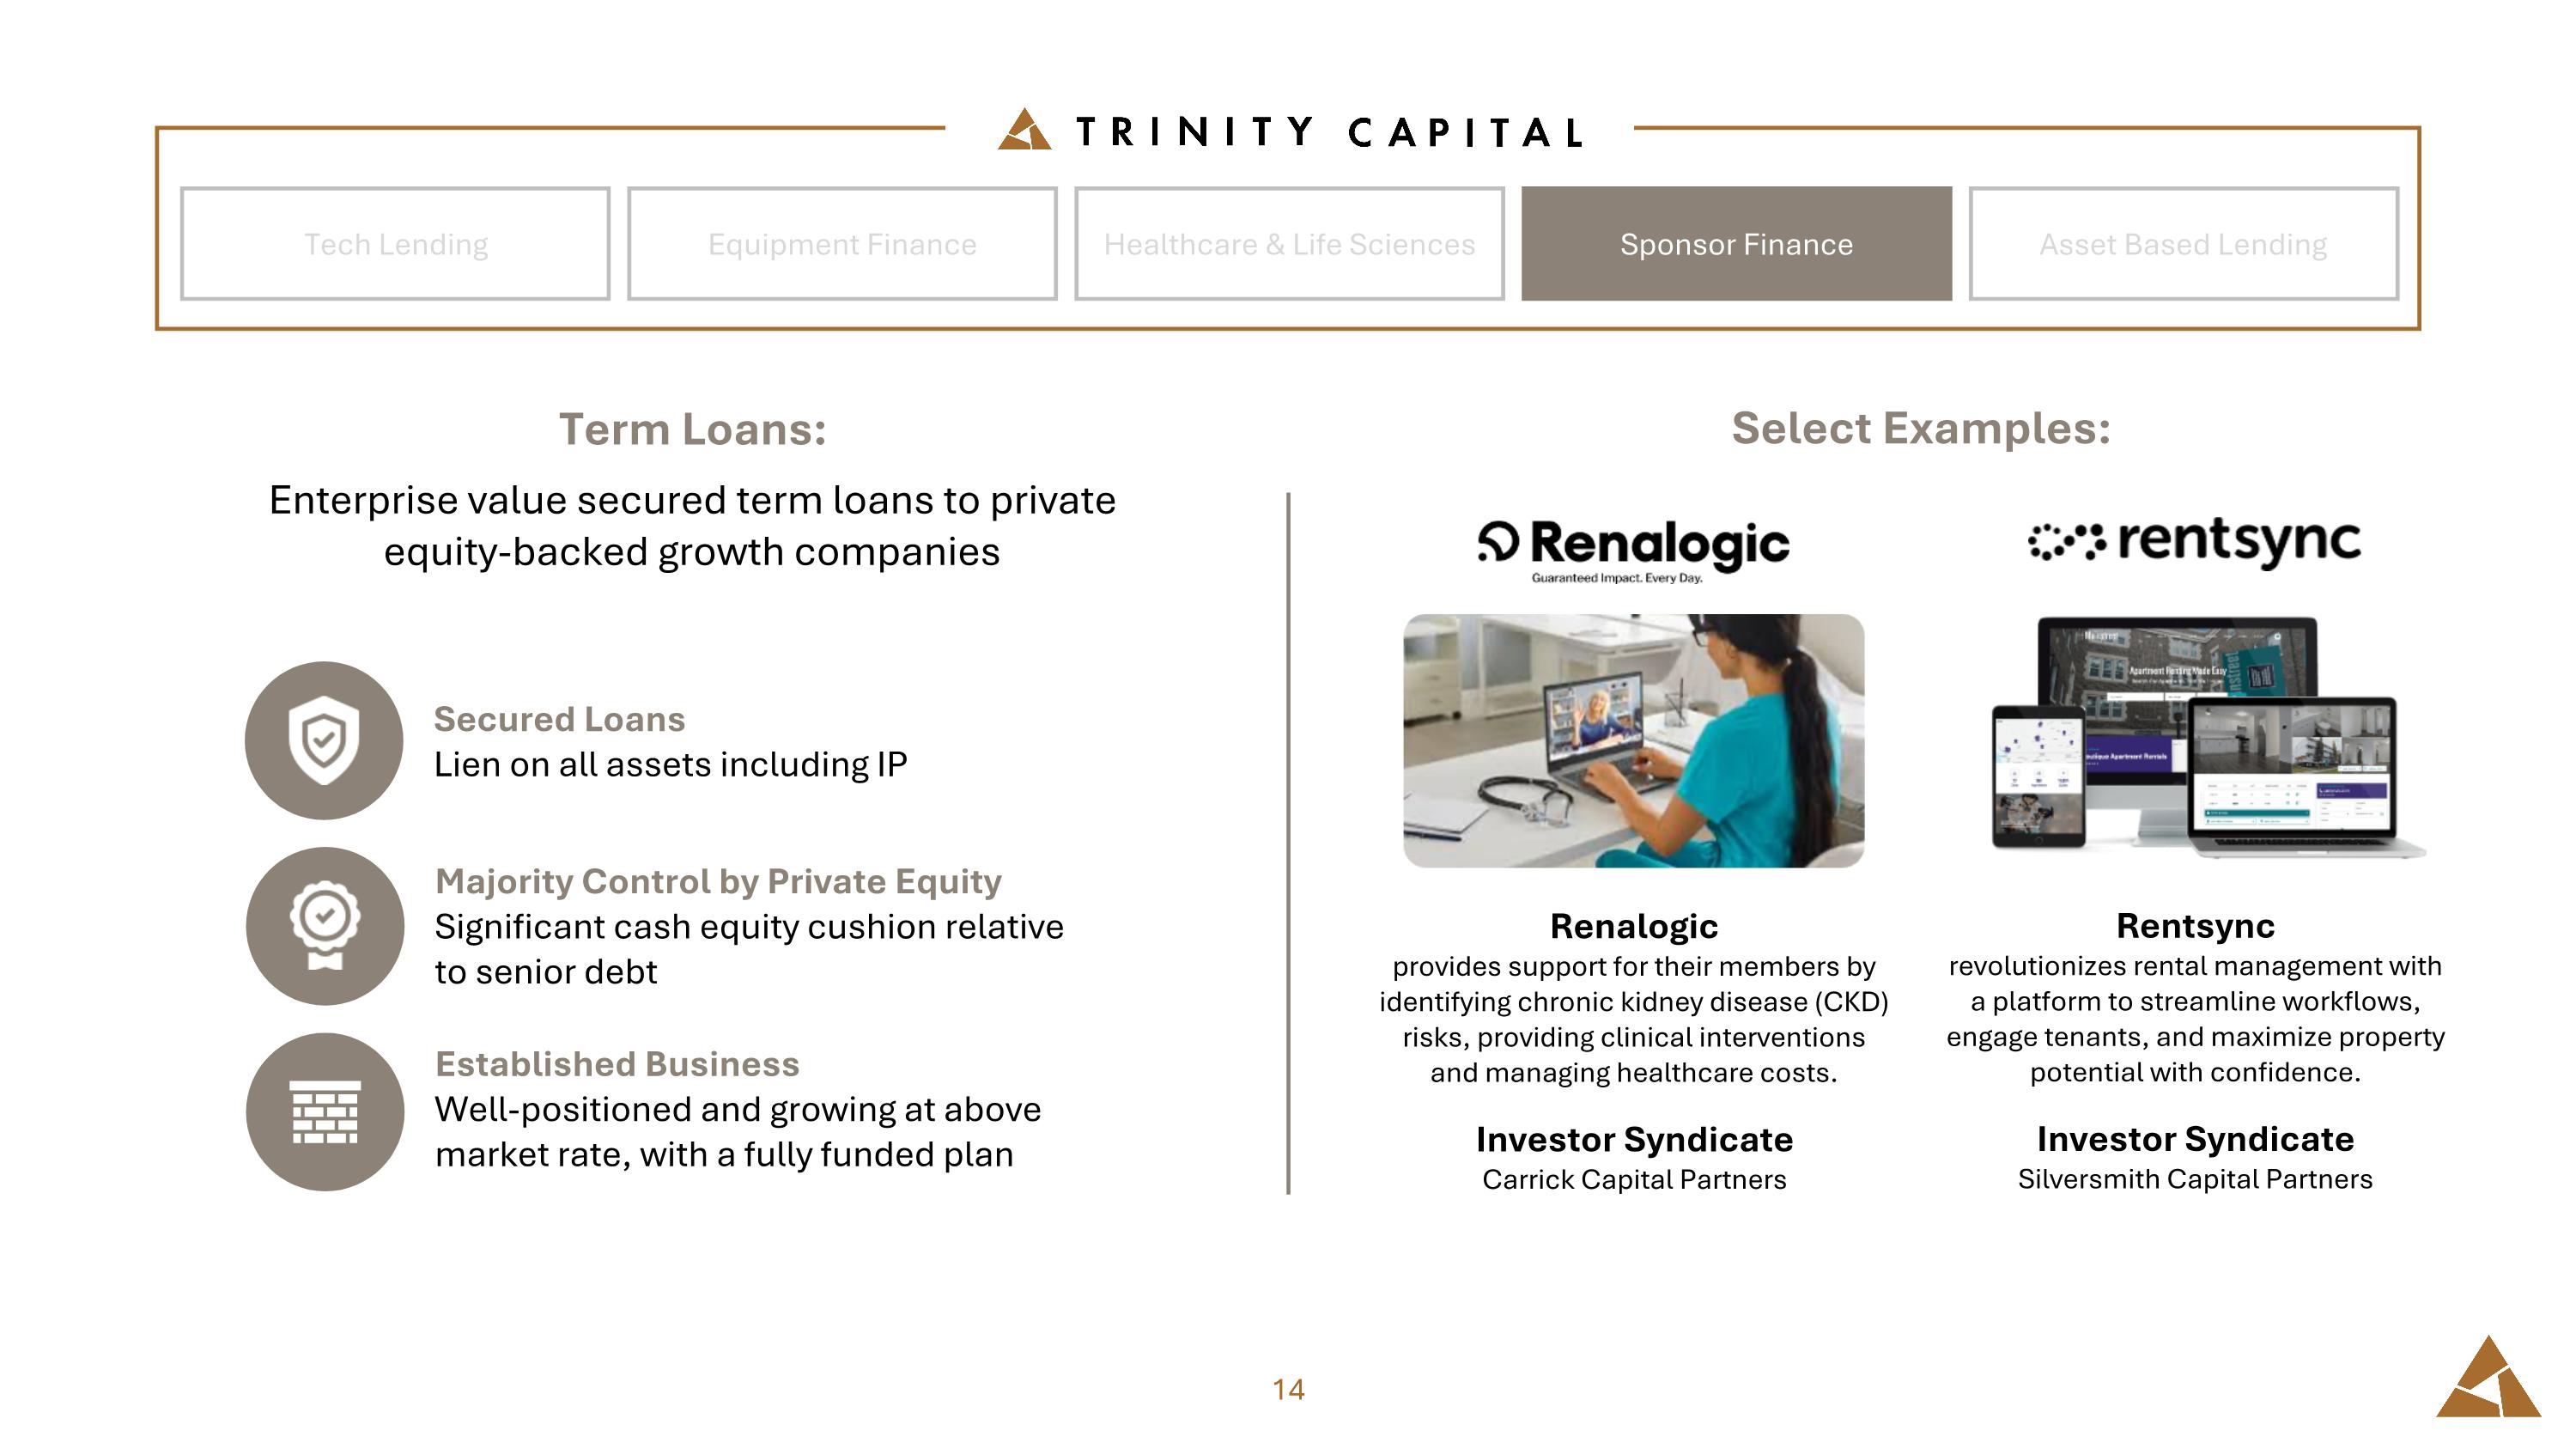
Equipment Finance Tech Lending Healthcare & Life Sciences Sponsor Finance Asset Based Lending Term Loans: Enterprise value secured term loans to private equity-backed growth companies Secured Loans Lien on all assets including IP Majority Control by Private Equity Significant cash equity cushion relative to senior debt Established Business Well-positioned and growing at above market rate, with a fully funded plan Renalogic provides support for their members by identifying chronic kidney disease (CKD) risks, providing clinical interventions and managing healthcare costs. Investor Syndicate Carrick Capital Partners Rentsync revolutionizes rental management with a platform to streamline workflows, engage tenants, and maximize property potential with confidence. Investor Syndicate Silversmith Capital Partners Select Examples:
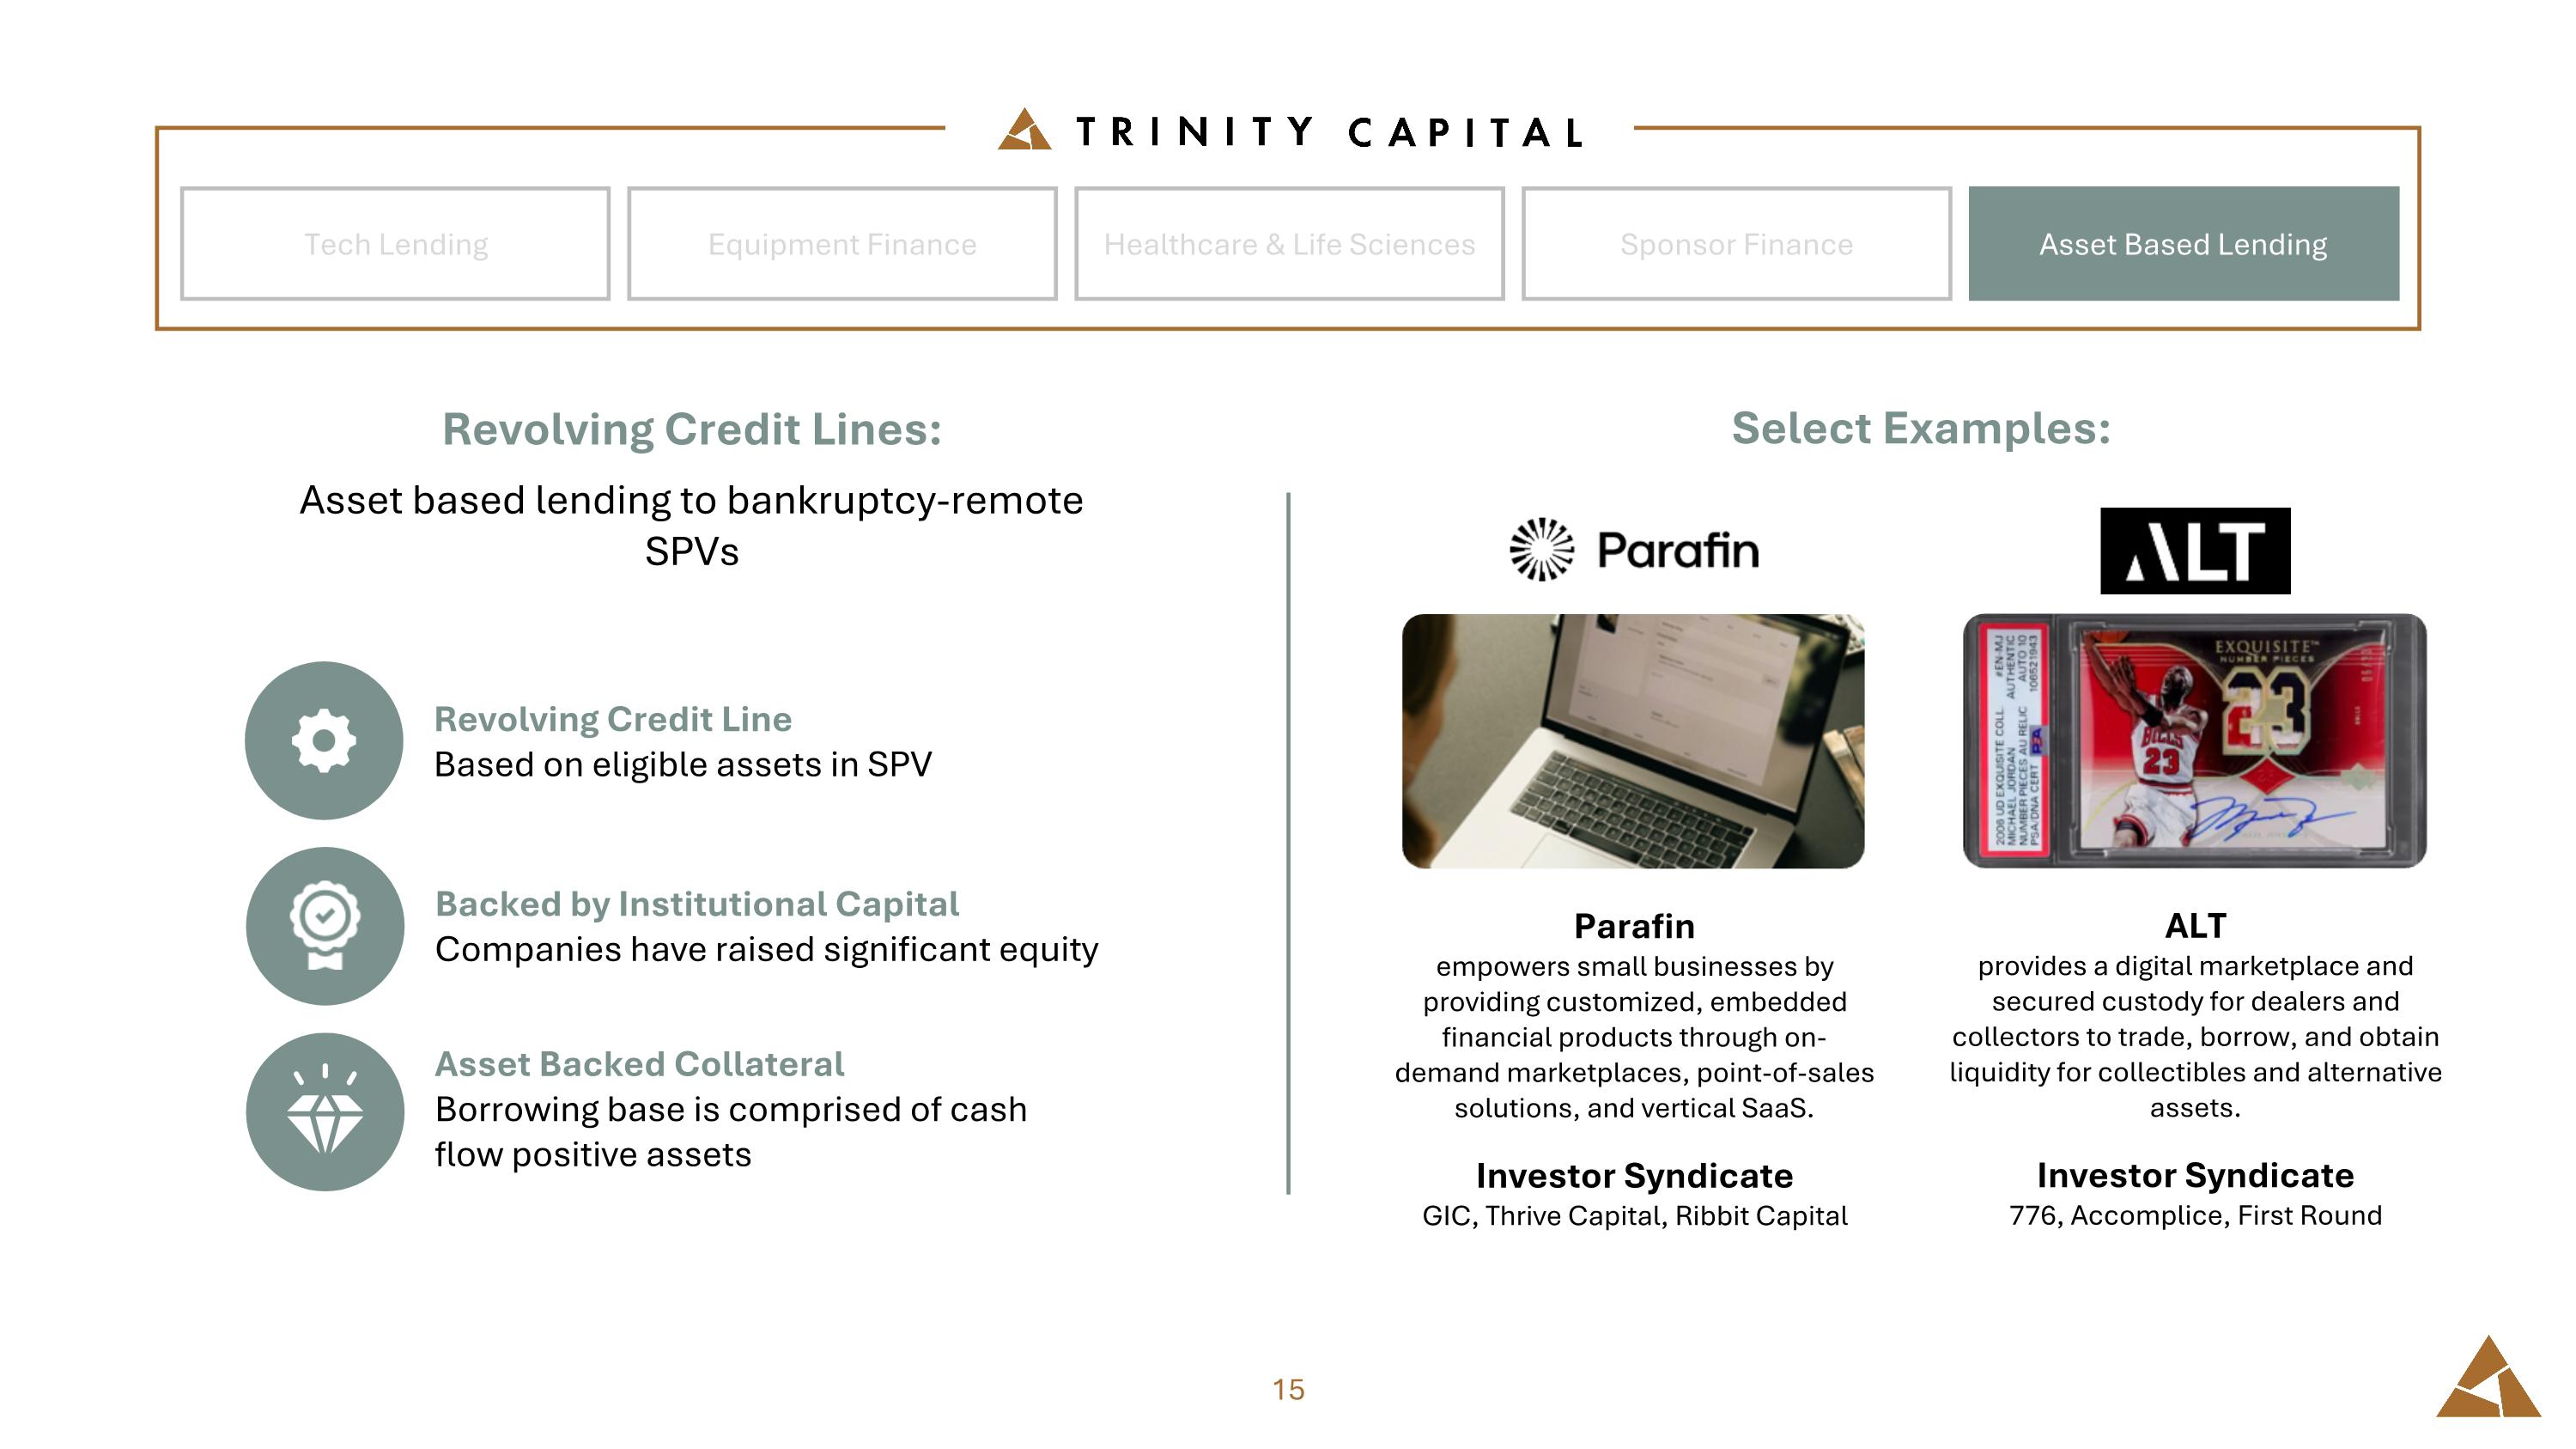
Equipment Finance Tech Lending Healthcare & Life Sciences Sponsor Finance Asset Based Lending Revolving Credit Lines: Asset based lending to bankruptcy-remote SPVs Revolving Credit Line Based on eligible assets in SPV Backed by Institutional Capital Companies have raised significant equity Asset Backed Collateral Borrowing base is comprised of cash flow positive assets Parafin empowers small businesses by providing customized, embedded financial products through on-demand marketplaces, point-of-sales solutions, and vertical SaaS. Investor Syndicate GIC, Thrive Capital, Ribbit Capital ALT provides a digital marketplace and secured custody for dealers and collectors to trade, borrow, and obtain liquidity for collectibles and alternative assets. Investor Syndicate 776, Accomplice, First Round Select Examples:

Financial Highlights
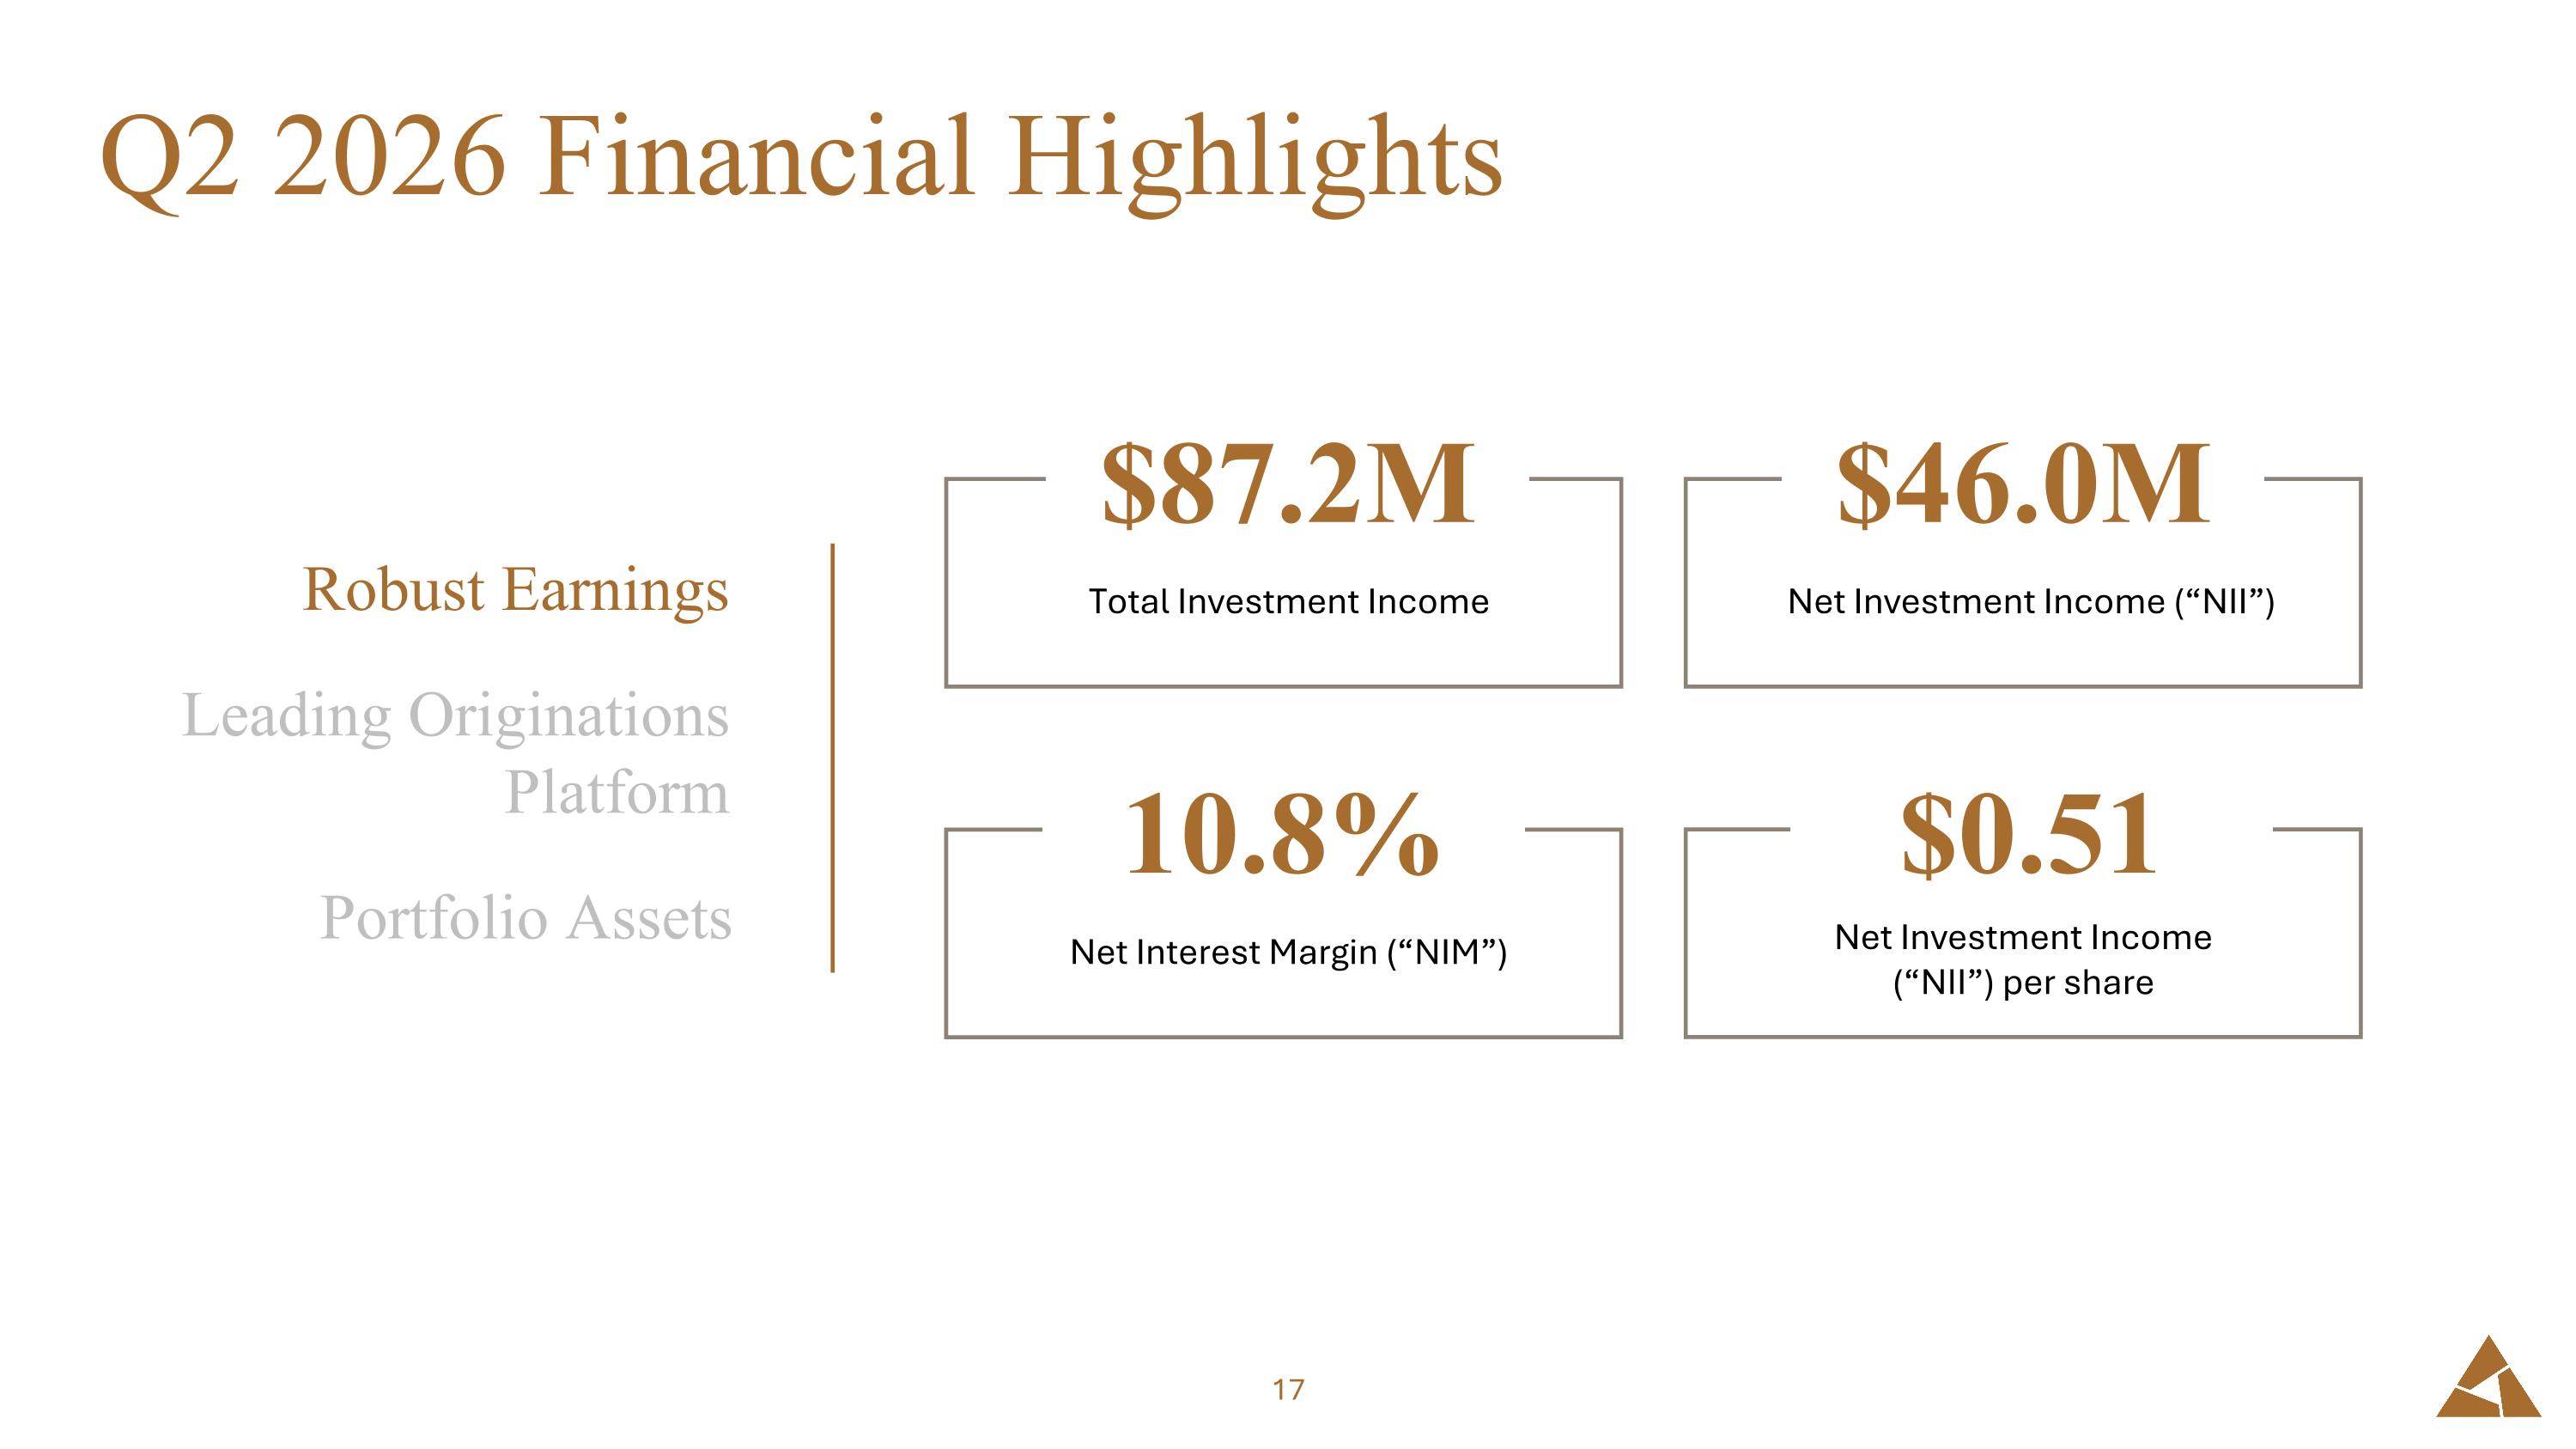
Q2 2026 Financial Highlights $46.0M Net Investment Income (“NII”) $87.2M Total Investment Income 10.8% Net Interest Margin (“NIM”) $0.51 Net Investment Income (“NII”) per share Robust Earnings Leading Originations Platform Portfolio Assets
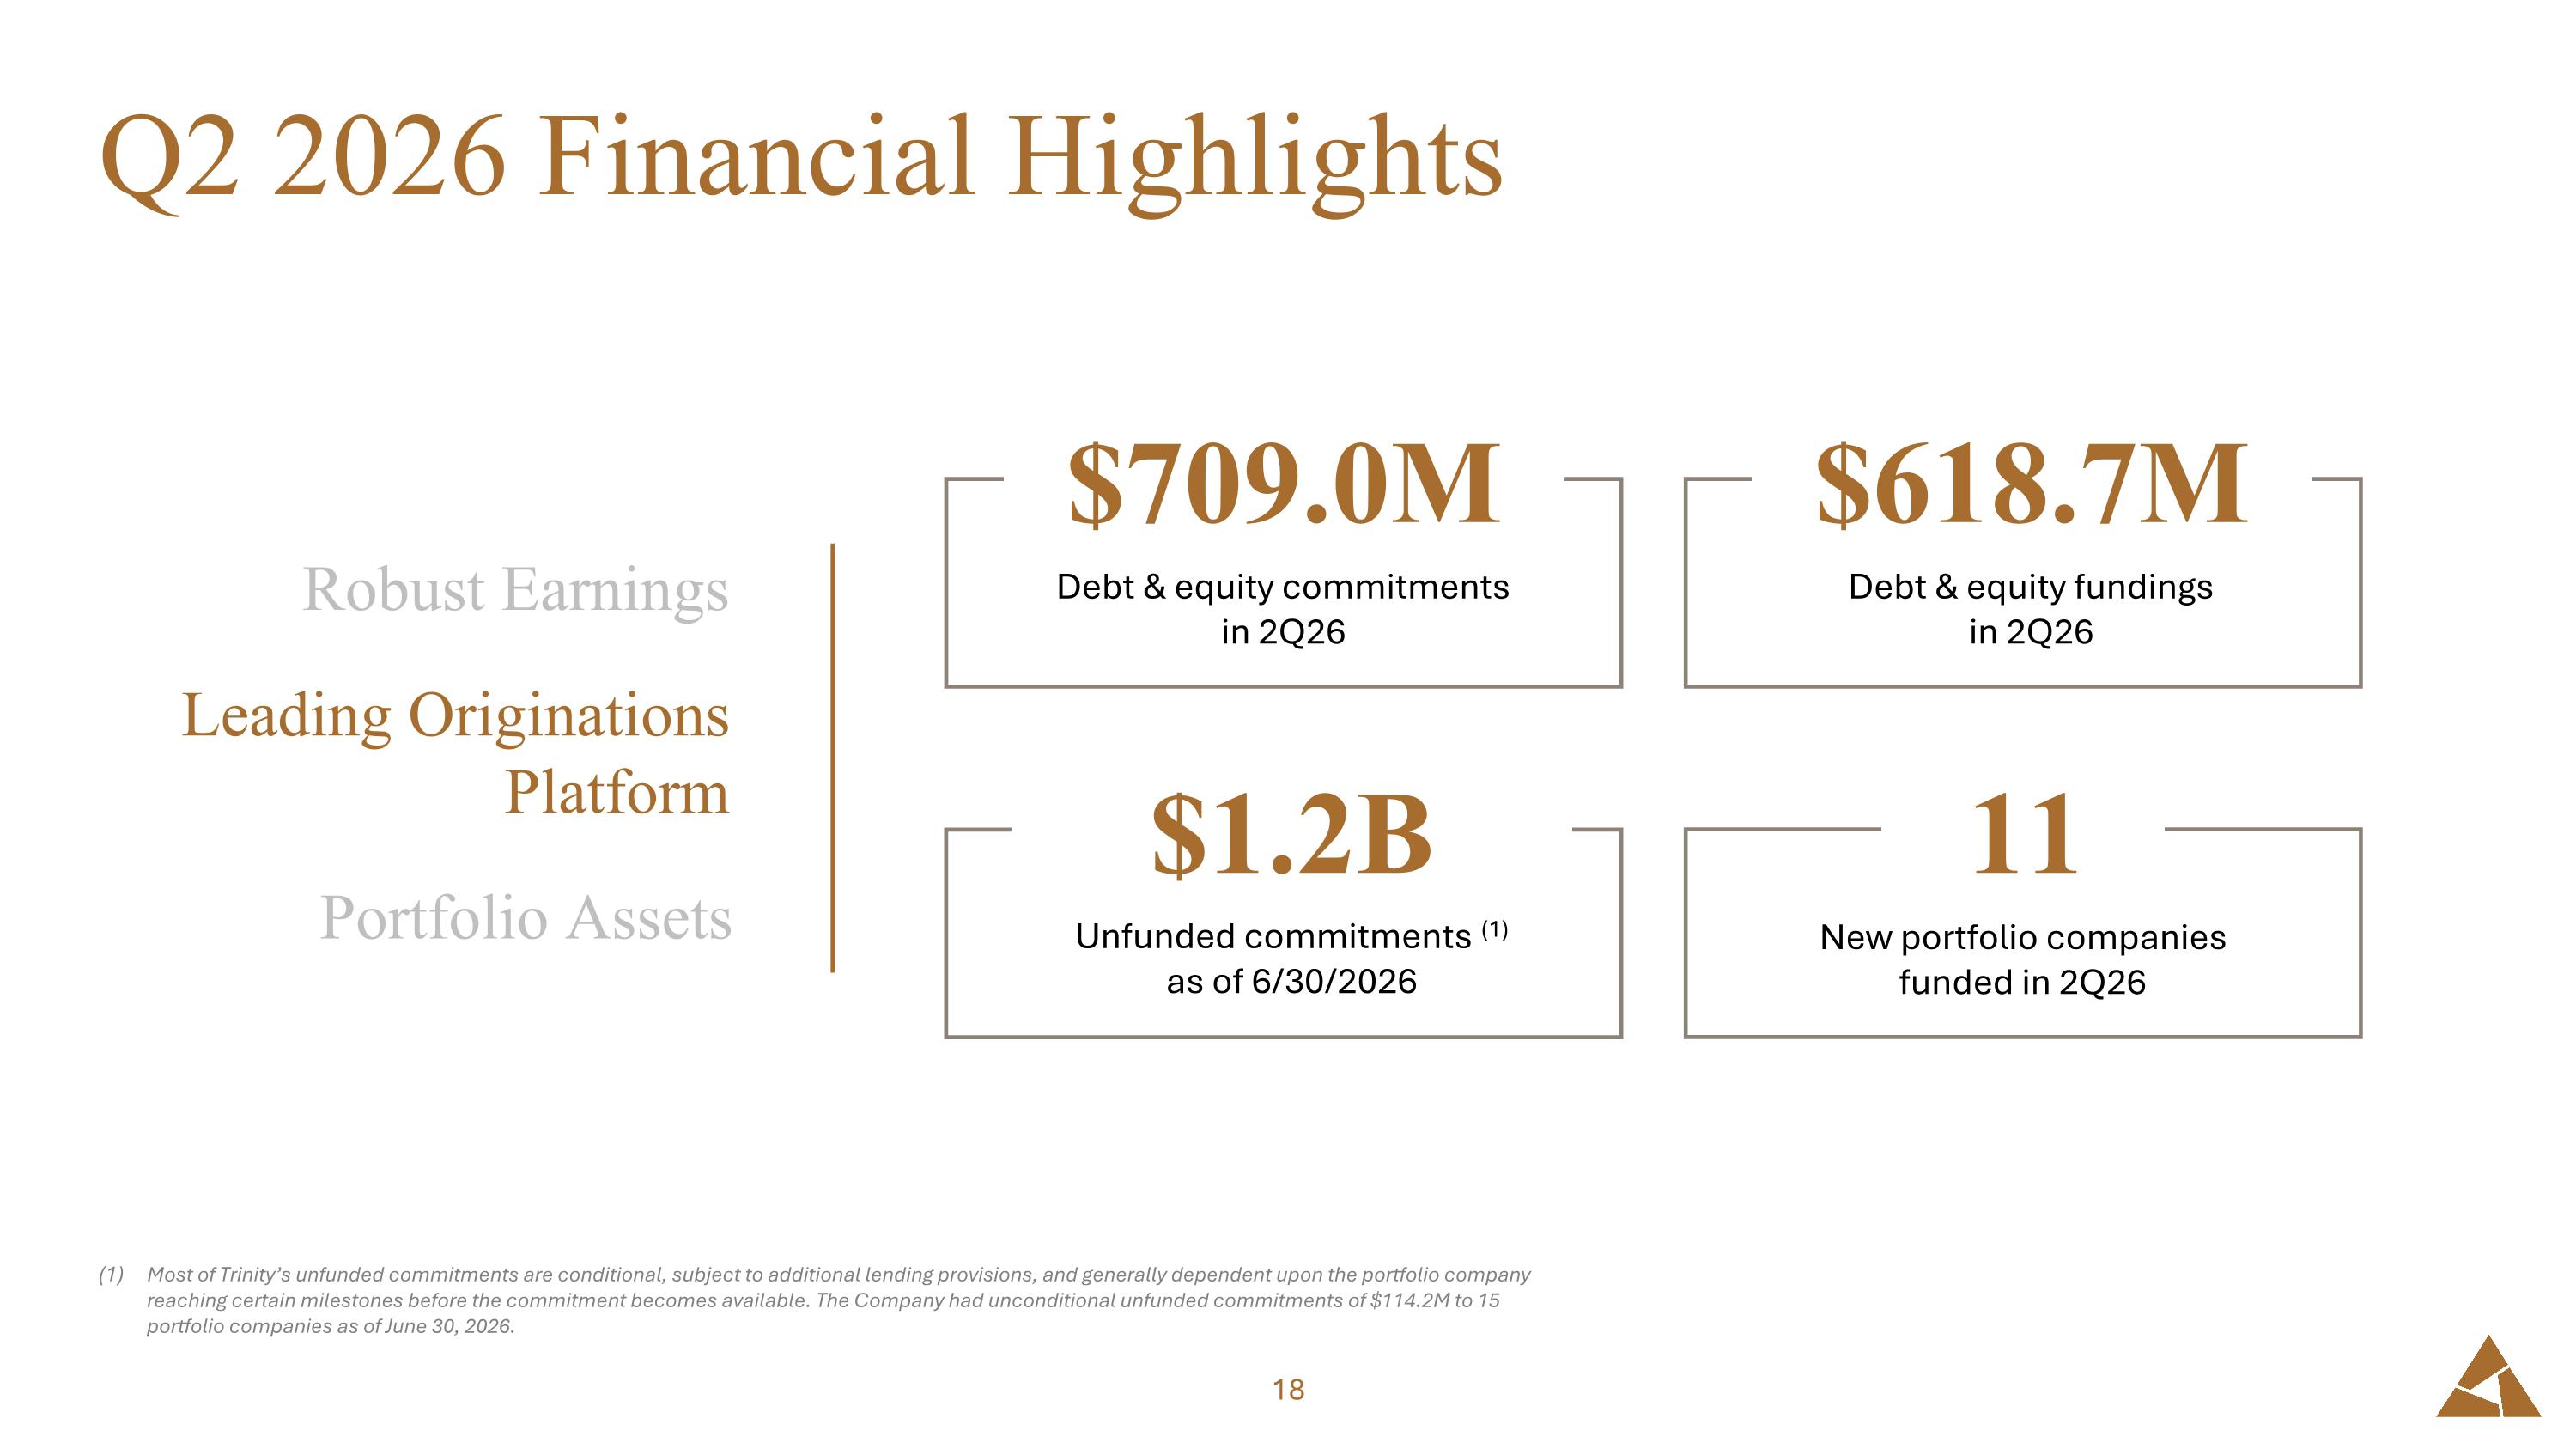
Q2 2026 Financial Highlights Most of Trinity’s unfunded commitments are conditional, subject to additional lending provisions, and generally dependent upon the portfolio company reaching certain milestones before the commitment becomes available. The Company had unconditional unfunded commitments of $114.2M to 15 portfolio companies as of June 30, 2026. $618.7M Debt & equity fundings in 2Q26 $709.0M Debt & equity commitments in 2Q26 $1.2B Unfunded commitments (1) as of 6/30/2026 11 New portfolio companies funded in 2Q26 Robust Earnings Leading Originations Platform Portfolio Assets
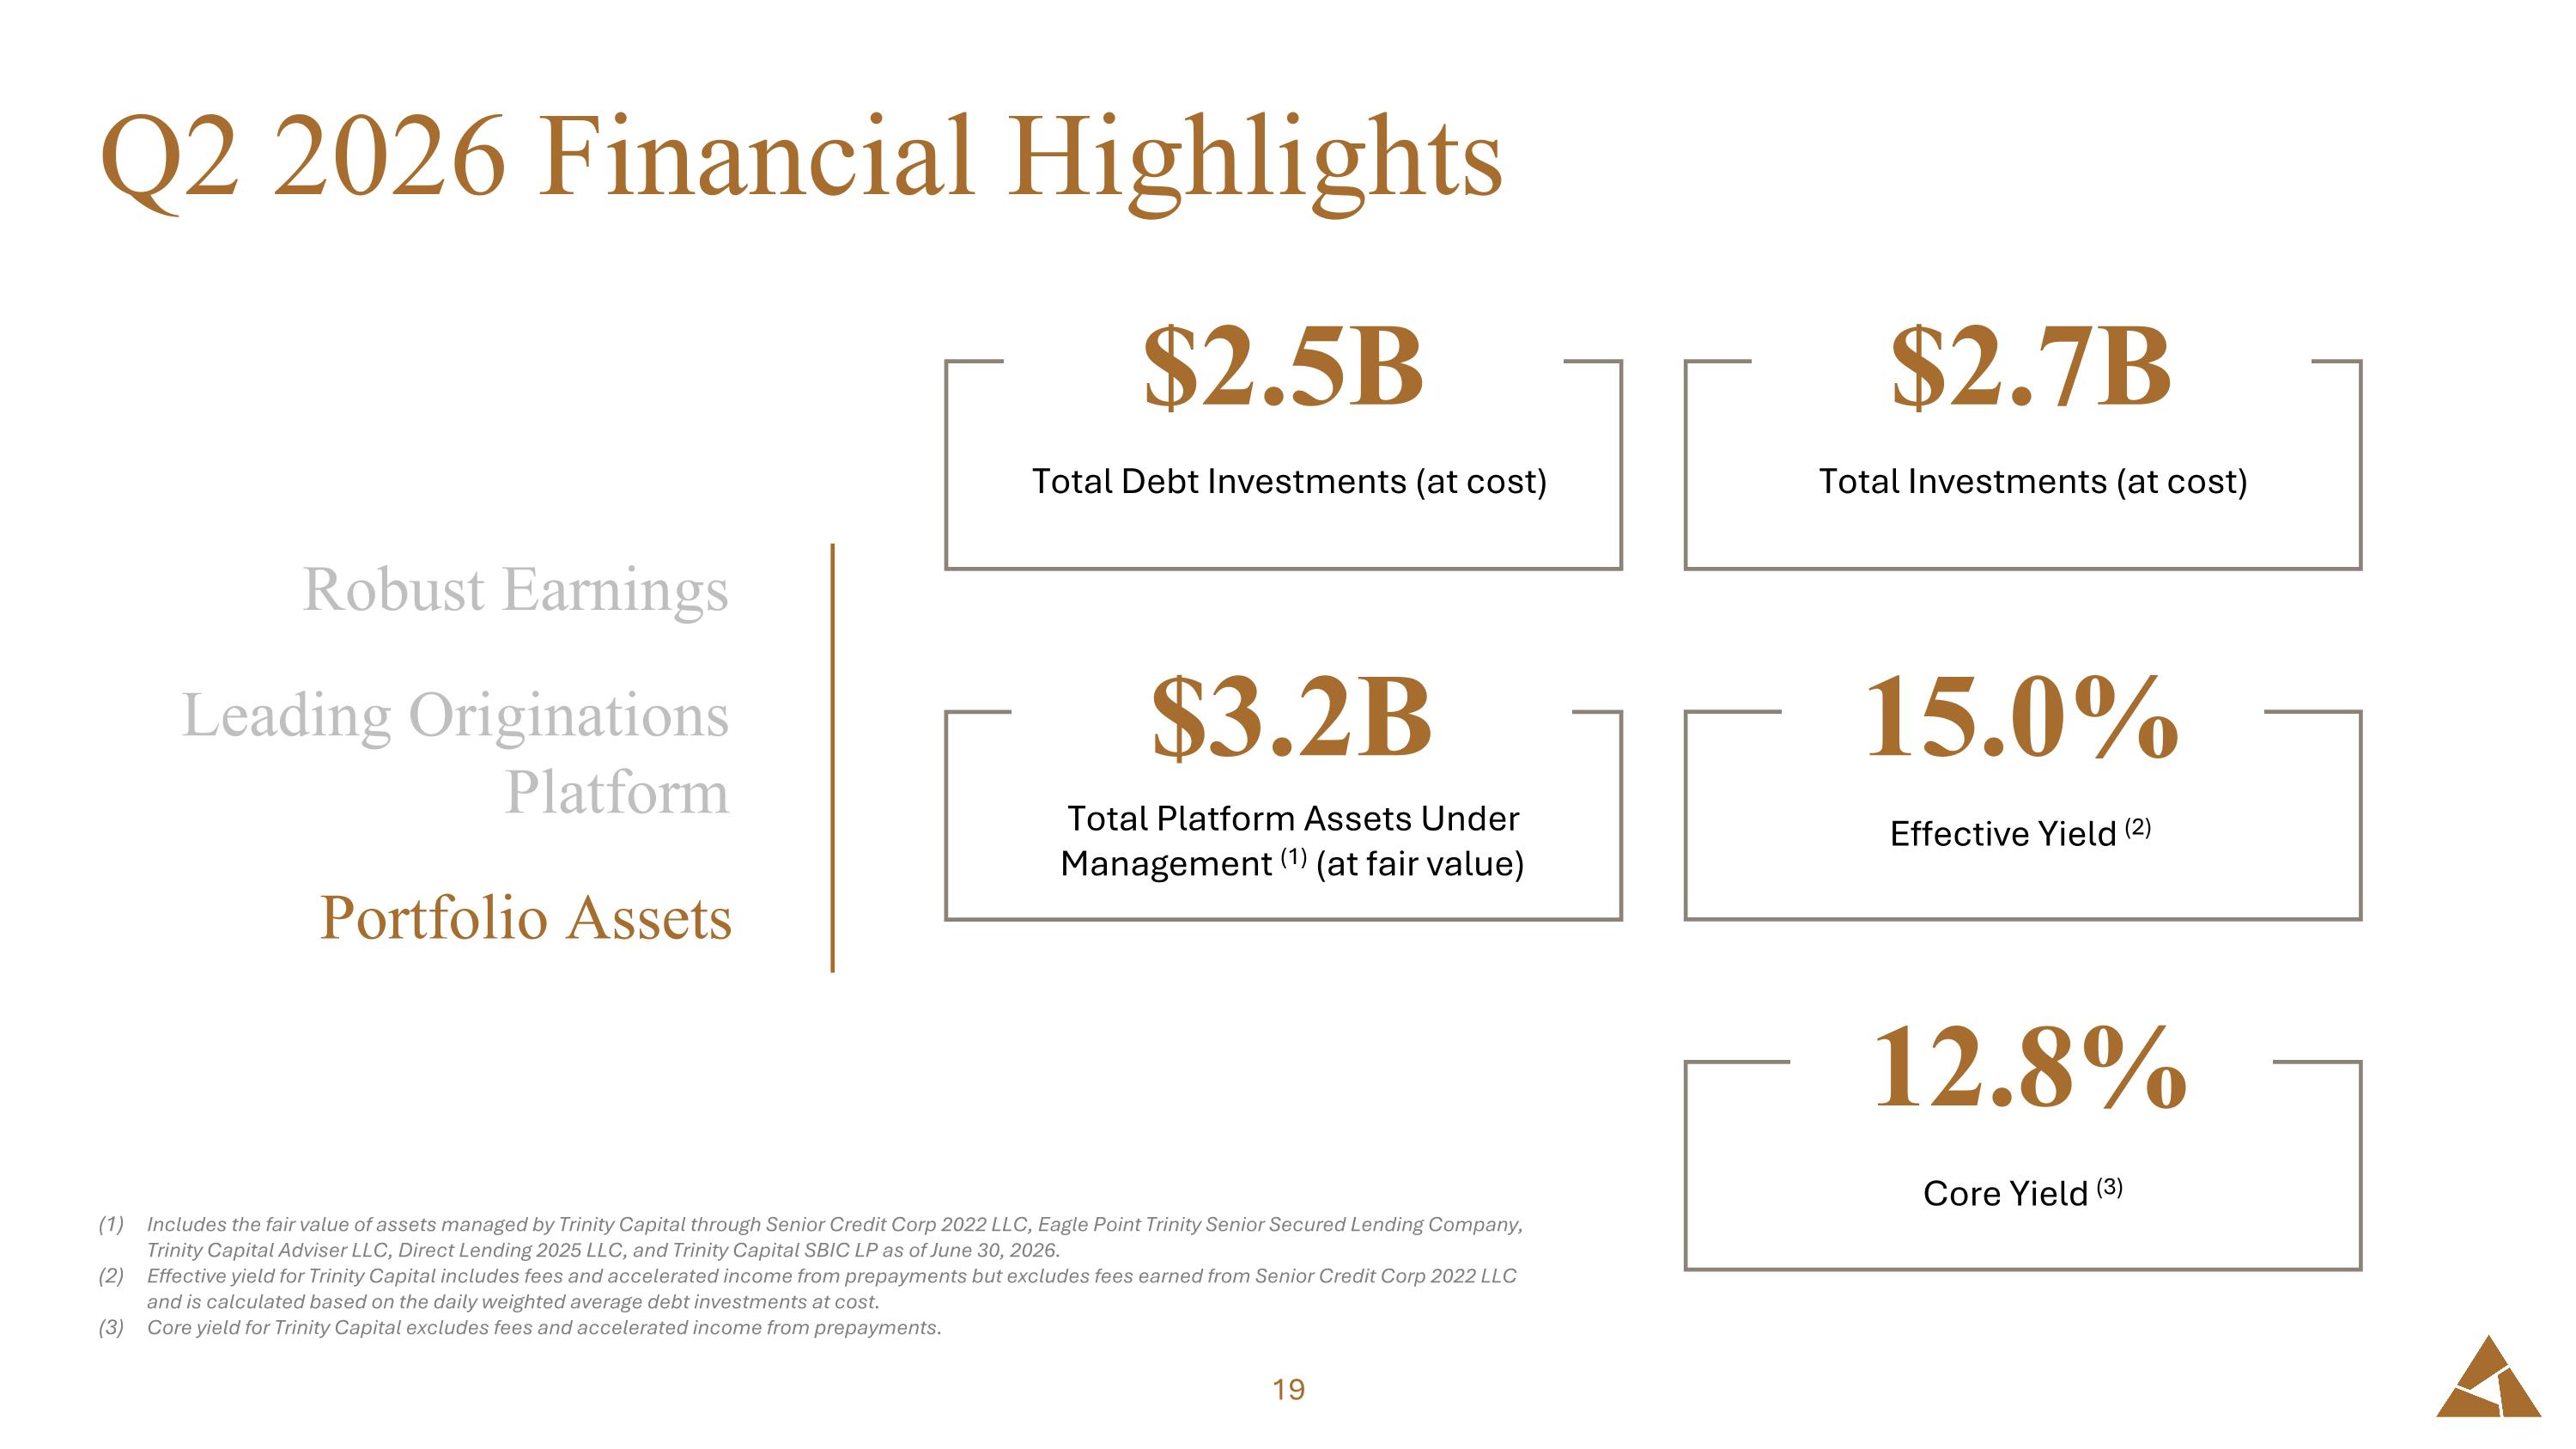
Q2 2026 Financial Highlights Includes the fair value of assets managed by Trinity Capital through Senior Credit Corp 2022 LLC, Eagle Point Trinity Senior Secured Lending Company, Trinity Capital Adviser LLC, Direct Lending 2025 LLC, and Trinity Capital SBIC LP as of June 30, 2026. Effective yield for Trinity Capital includes fees and accelerated income from prepayments but excludes fees earned from Senior Credit Corp 2022 LLC and is calculated based on the daily weighted average debt investments at cost. Core yield for Trinity Capital excludes fees and accelerated income from prepayments. $2.7B Total Investments (at cost) $2.5B Total Debt Investments (at cost) $3.2B Total Platform Assets Under Management (1) (at fair value) 15.0% Effective Yield (2) Robust Earnings Leading Originations Platform Portfolio Assets 12.8% Core Yield (3)
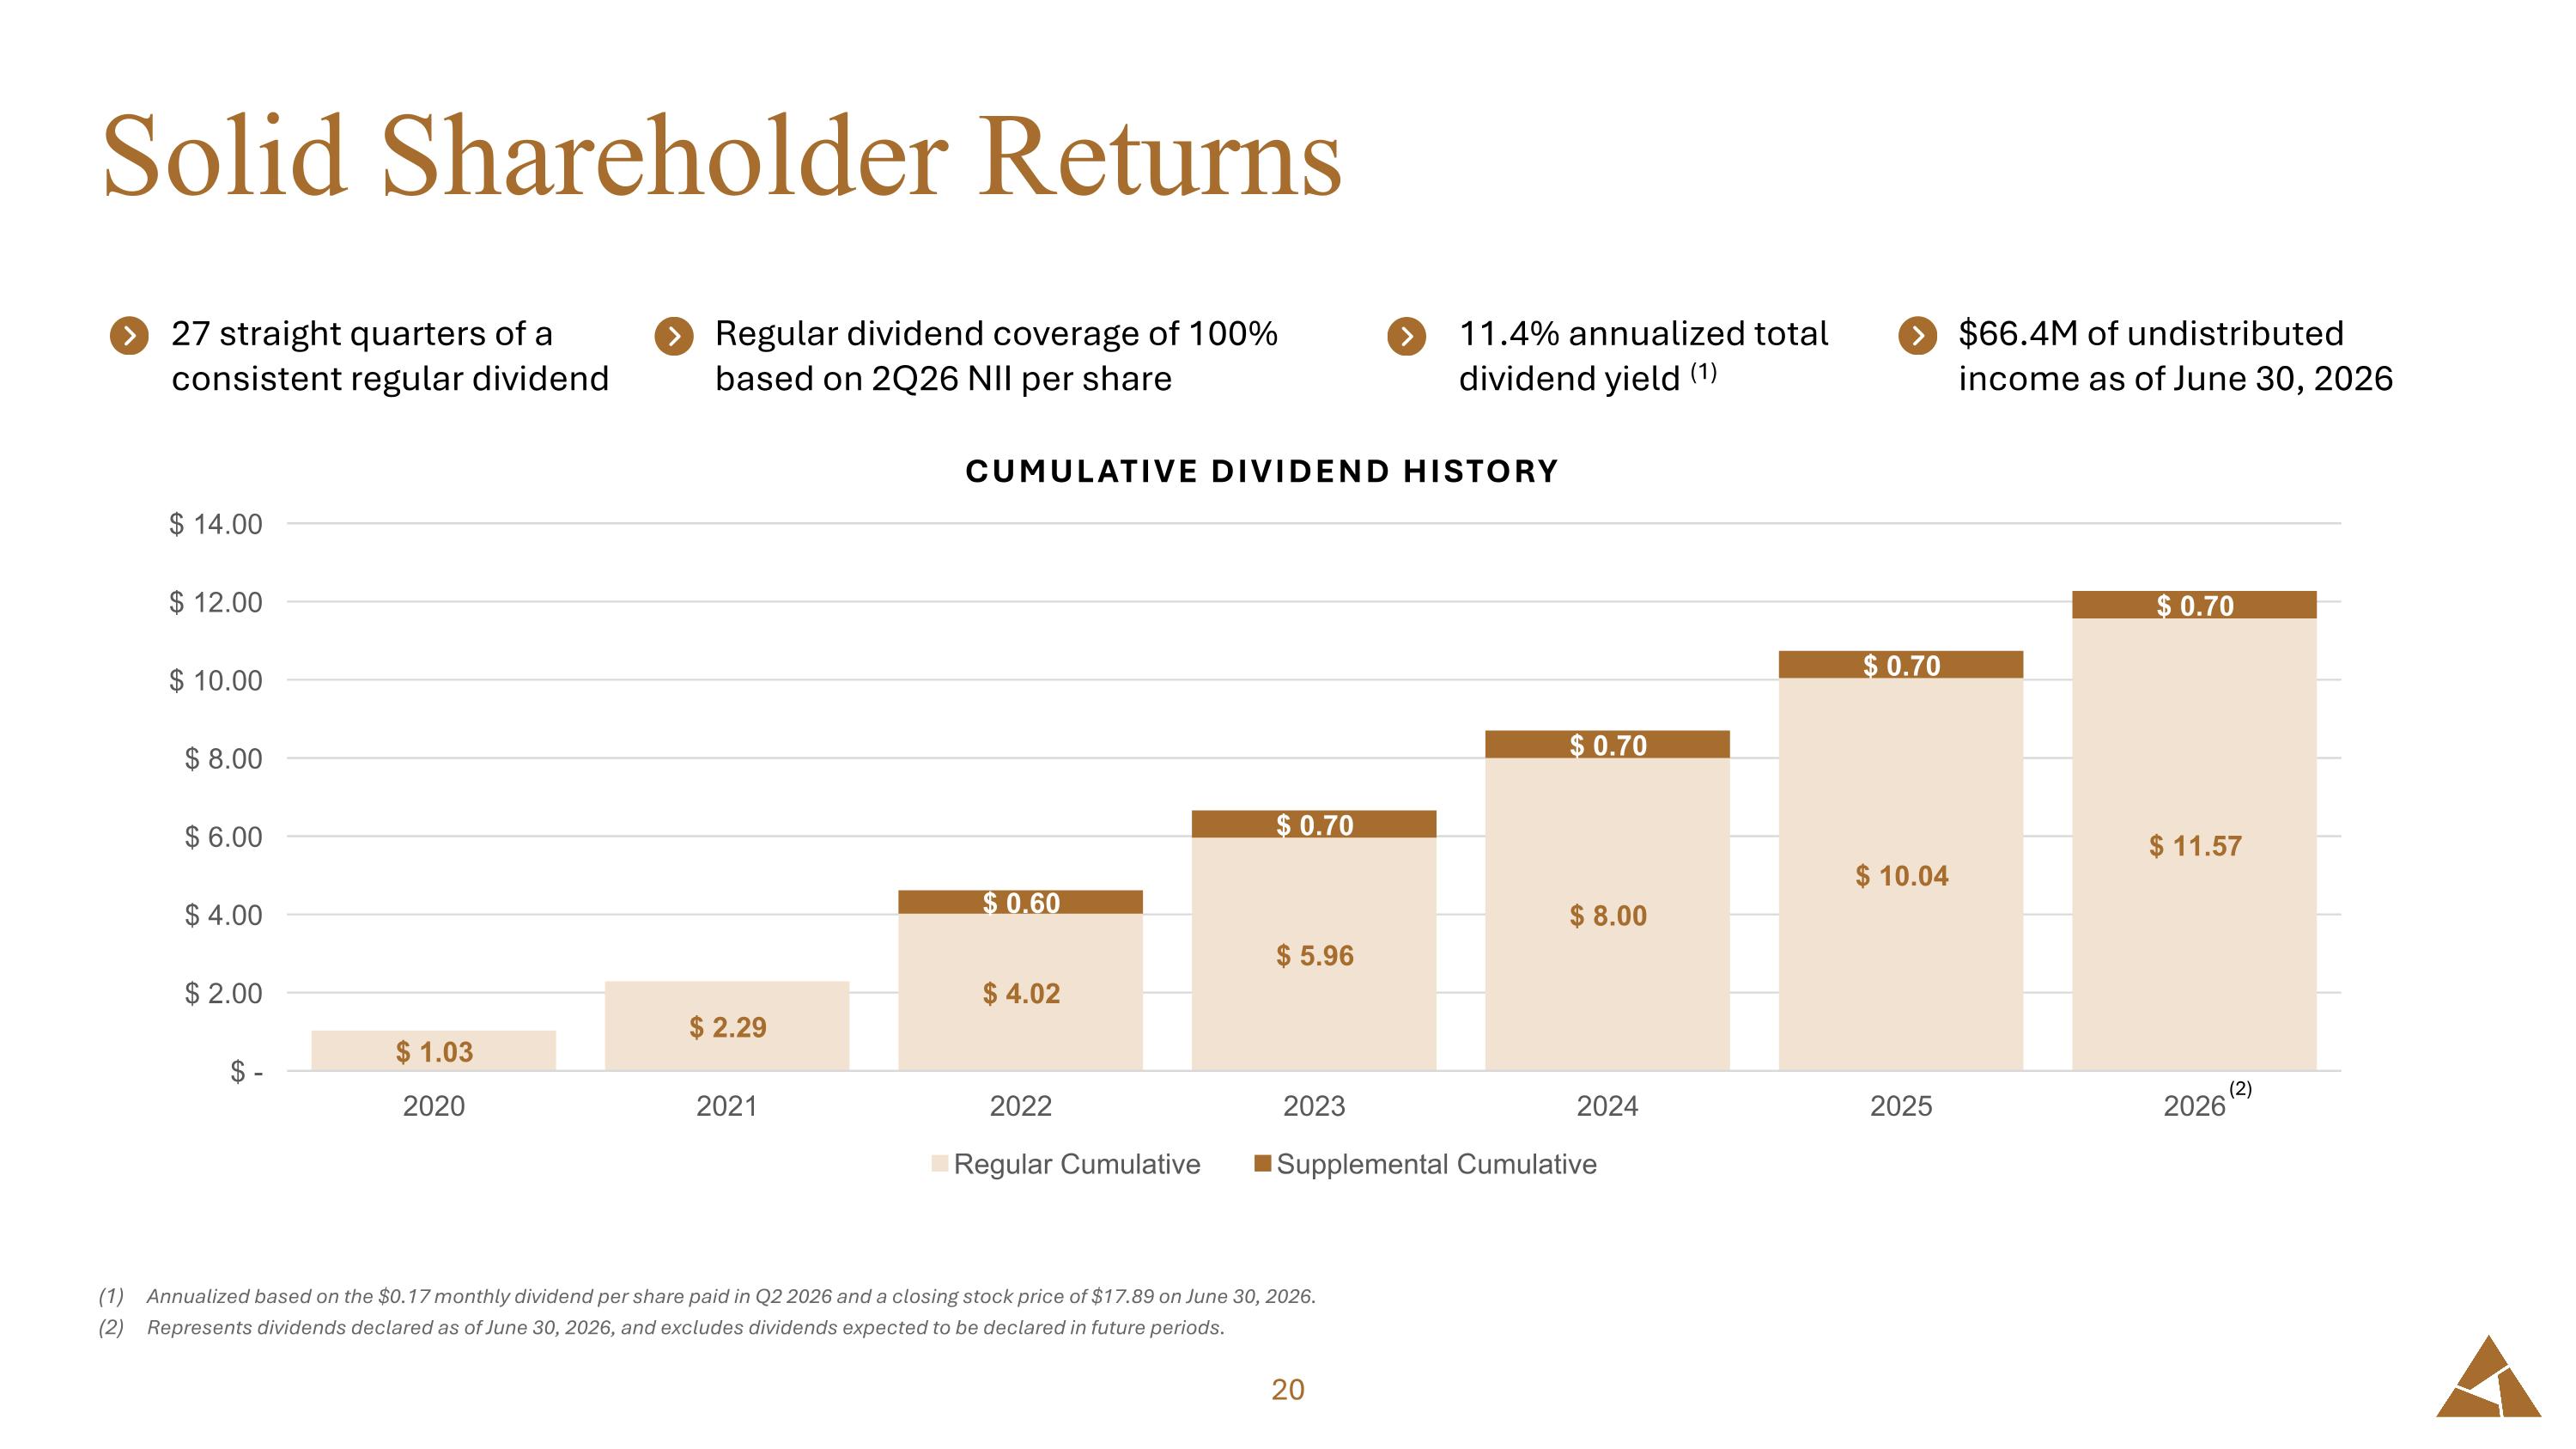
Solid Shareholder Returns Annualized based on the $0.17 monthly dividend per share paid in Q2 2026 and a closing stock price of $17.89 on June 30, 2026. Represents dividends declared as of June 30, 2026, and excludes dividends expected to be declared in future periods. $66.4M of undistributed income as of June 30, 2026 11.4% annualized total dividend yield (1) Regular dividend coverage of 100% based on 2Q26 NII per share 27 straight quarters of a consistent regular dividend (2)
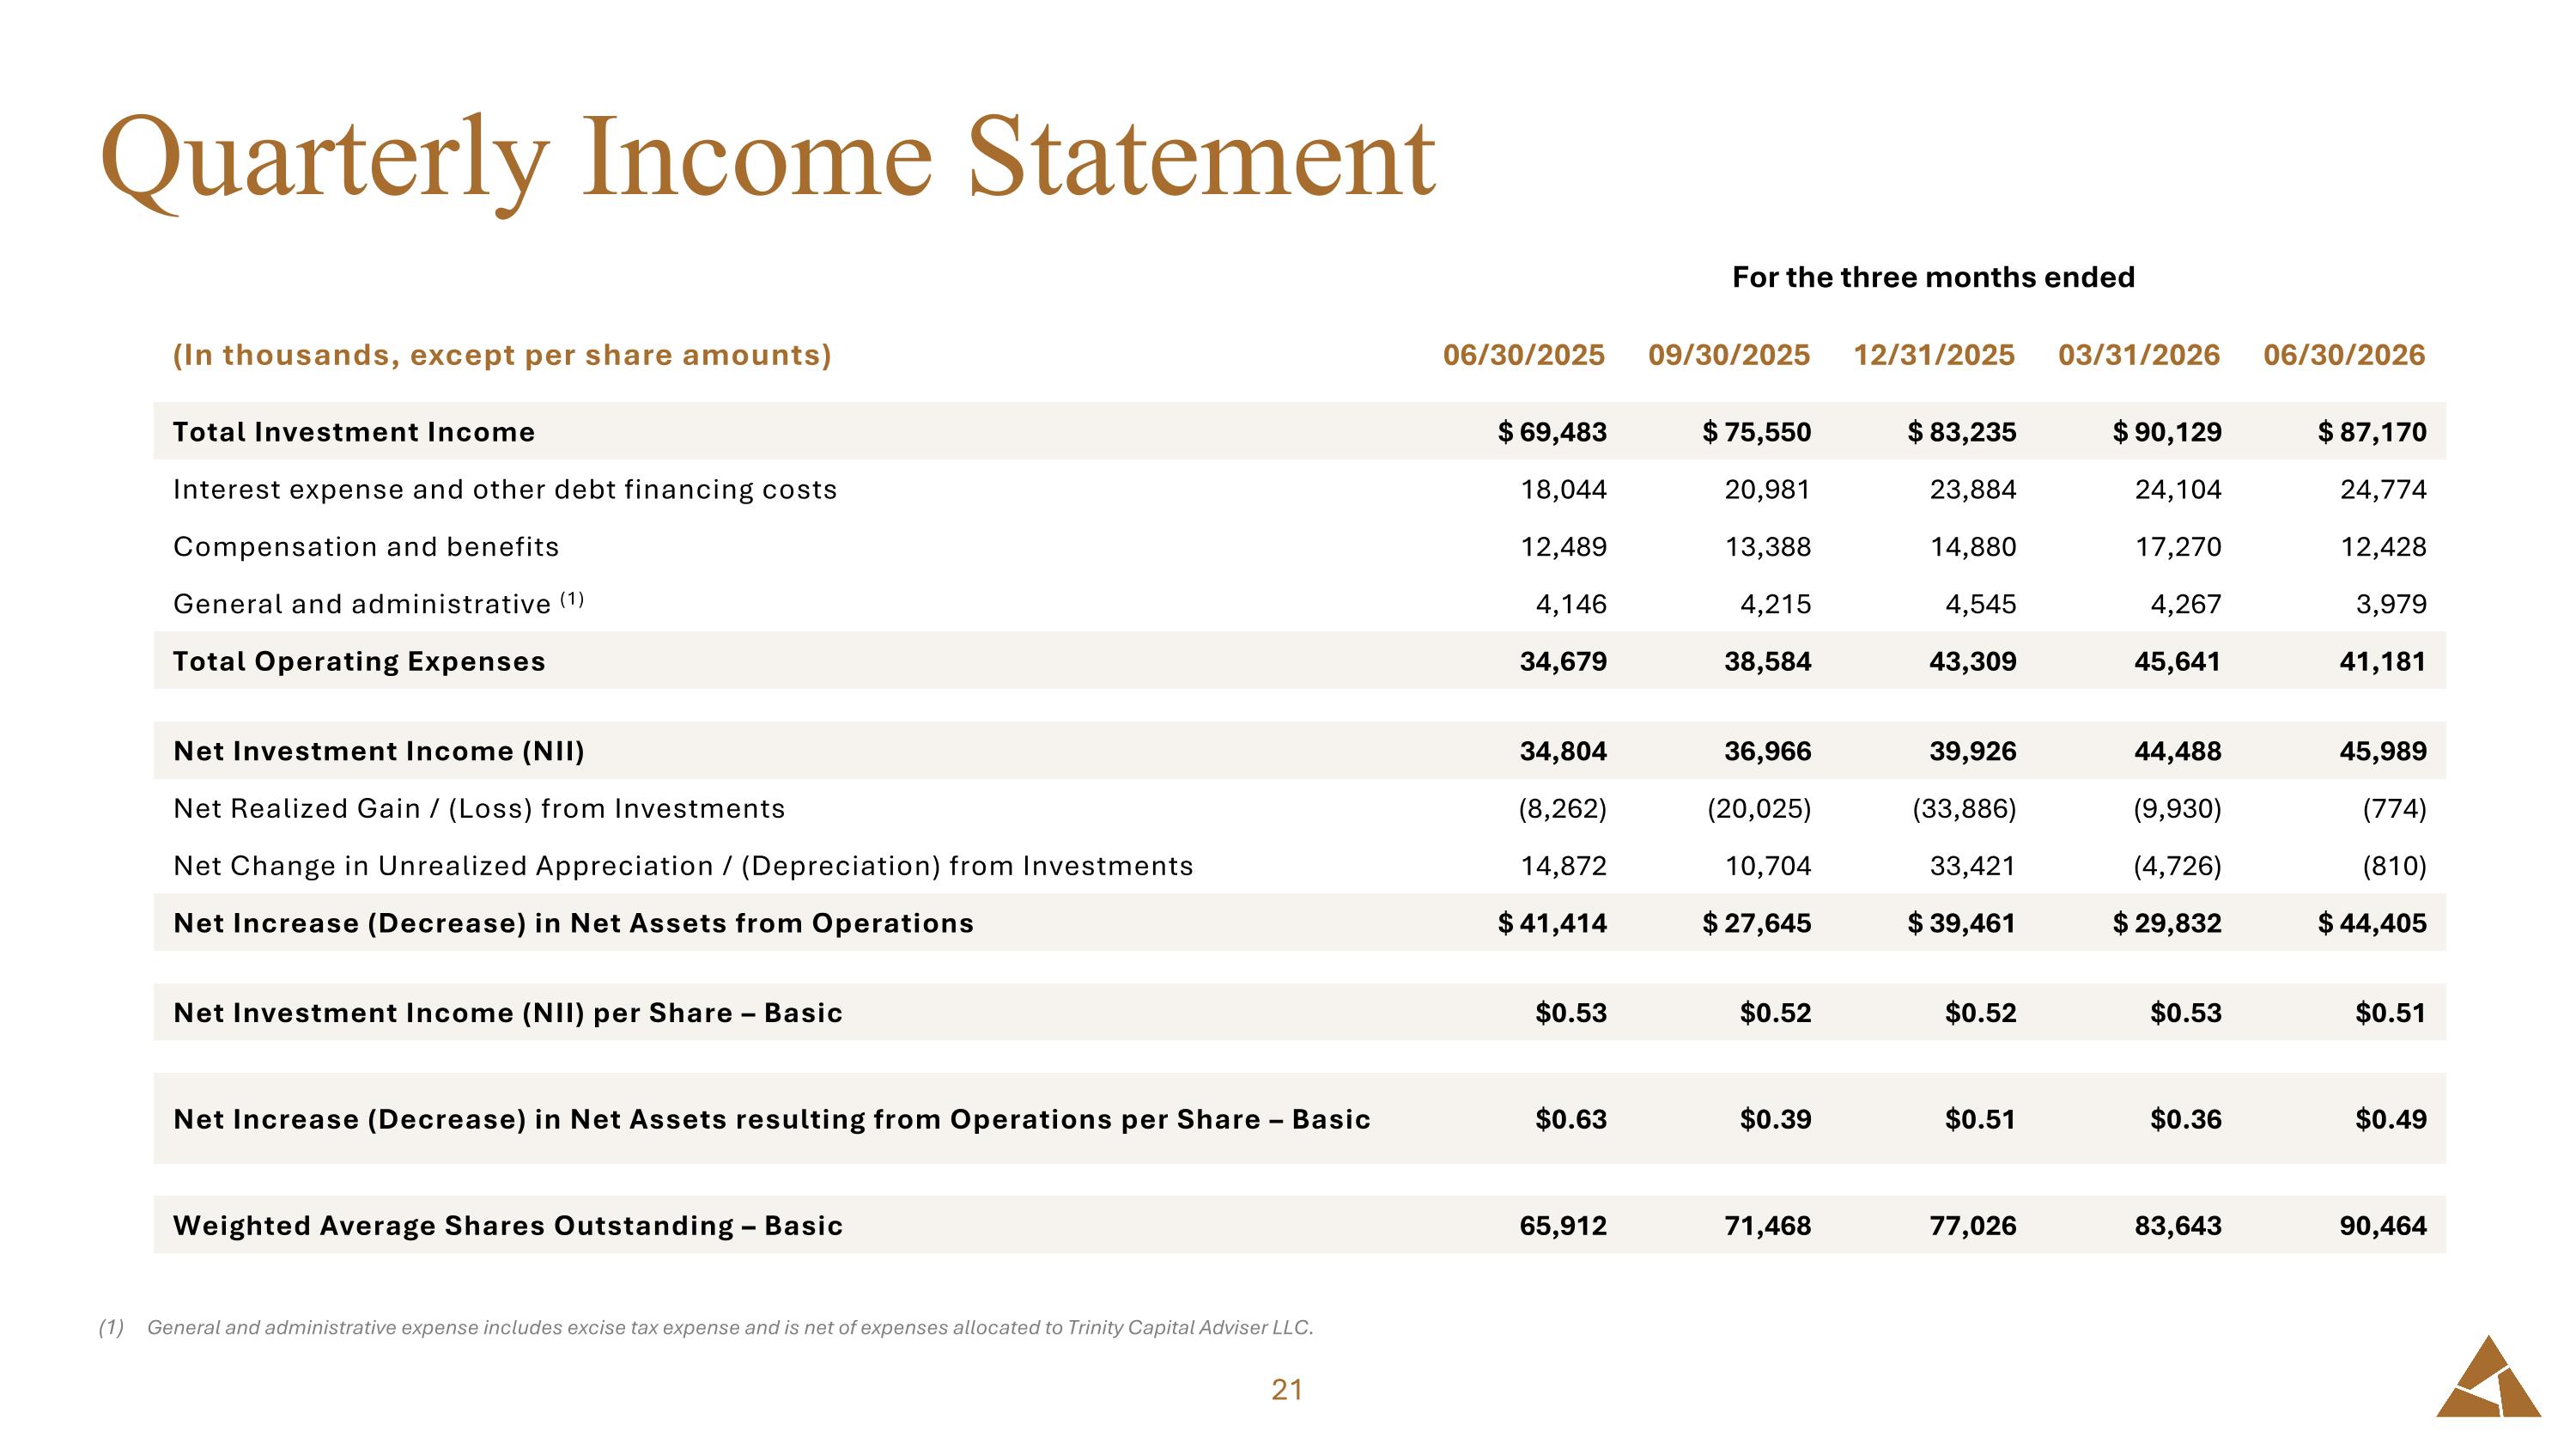
Quarterly Income Statement General and administrative expense includes excise tax expense and is net of expenses allocated to Trinity Capital Adviser LLC. For the three months ended For the three months ended (In thousands, except per share amounts) 06/30/2025 09/30/2025 12/31/2025 03/31/2026 06/30/2026 Total Investment Income $ 69,483 $ 75,550 $ 83,235 $ 90,129 $ 87,170 Interest expense and other debt financing costs 18,044 20,981 23,884 24,104 24,774 Compensation and benefits 12,489 13,388 14,880 17,270 12,428 General and administrative (1) 4,146 4,215 4,545 4,267 3,979 Total Operating Expenses 34,679 38,584 43,309 45,641 41,181 Net Investment Income (NII) 34,804 36,966 39,926 44,488 45,989 Net Realized Gain / (Loss) from Investments (8,262) (20,025) (33,886) (9,930) (774) Net Change in Unrealized Appreciation / (Depreciation) from Investments 14,872 10,704 33,421 (4,726) (810) Net Increase (Decrease) in Net Assets from Operations $ 41,414 $ 27,645 $ 39,461 $ 29,832 $ 44,405 Net Investment Income (NII) per Share – Basic $0.53 $0.52 $0.52 $0.53 $0.51 Net Increase (Decrease) in Net Assets resulting from Operations per Share – Basic $0.63 $0.39 $0.51 $0.36 $0.49 Weighted Average Shares Outstanding – Basic 65,912 71,468 77,026 83,643 90,464
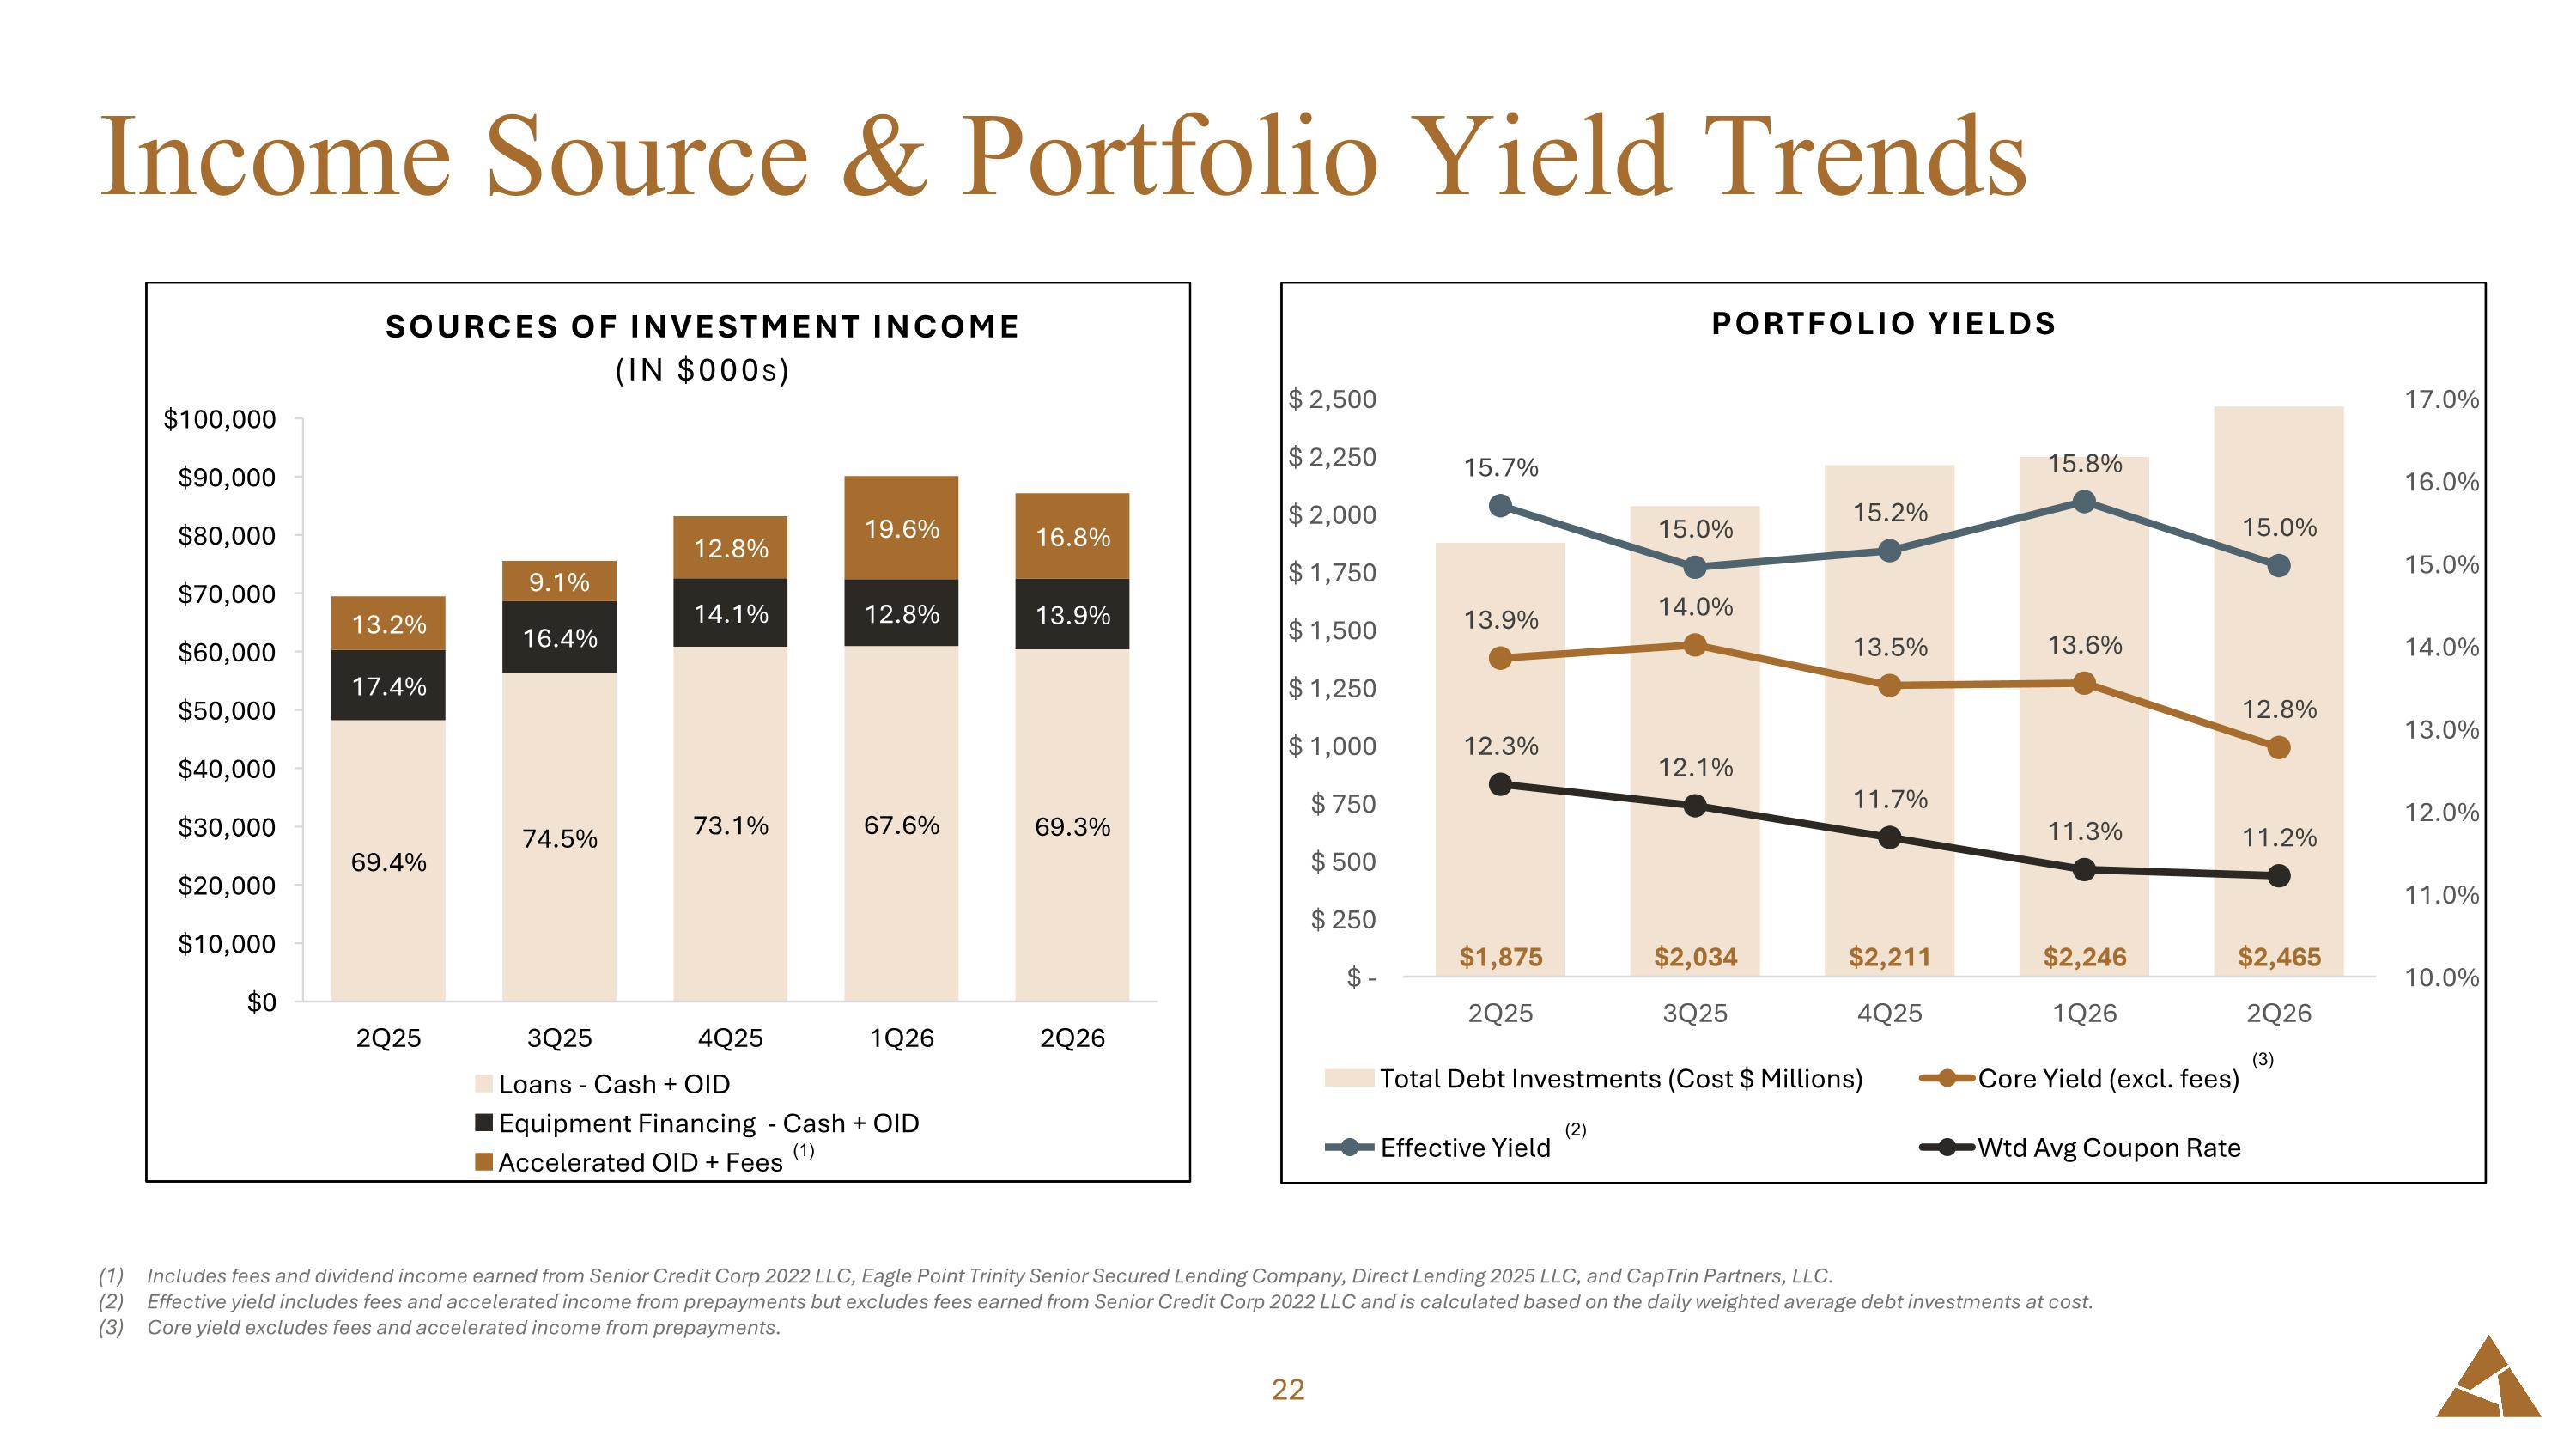
Income Source & Portfolio Yield Trends Includes fees and dividend income earned from Senior Credit Corp 2022 LLC, Eagle Point Trinity Senior Secured Lending Company, Direct Lending 2025 LLC, and CapTrin Partners, LLC. Effective yield includes fees and accelerated income from prepayments but excludes fees earned from Senior Credit Corp 2022 LLC and is calculated based on the daily weighted average debt investments at cost. Core yield excludes fees and accelerated income from prepayments. (2) (3) (1)
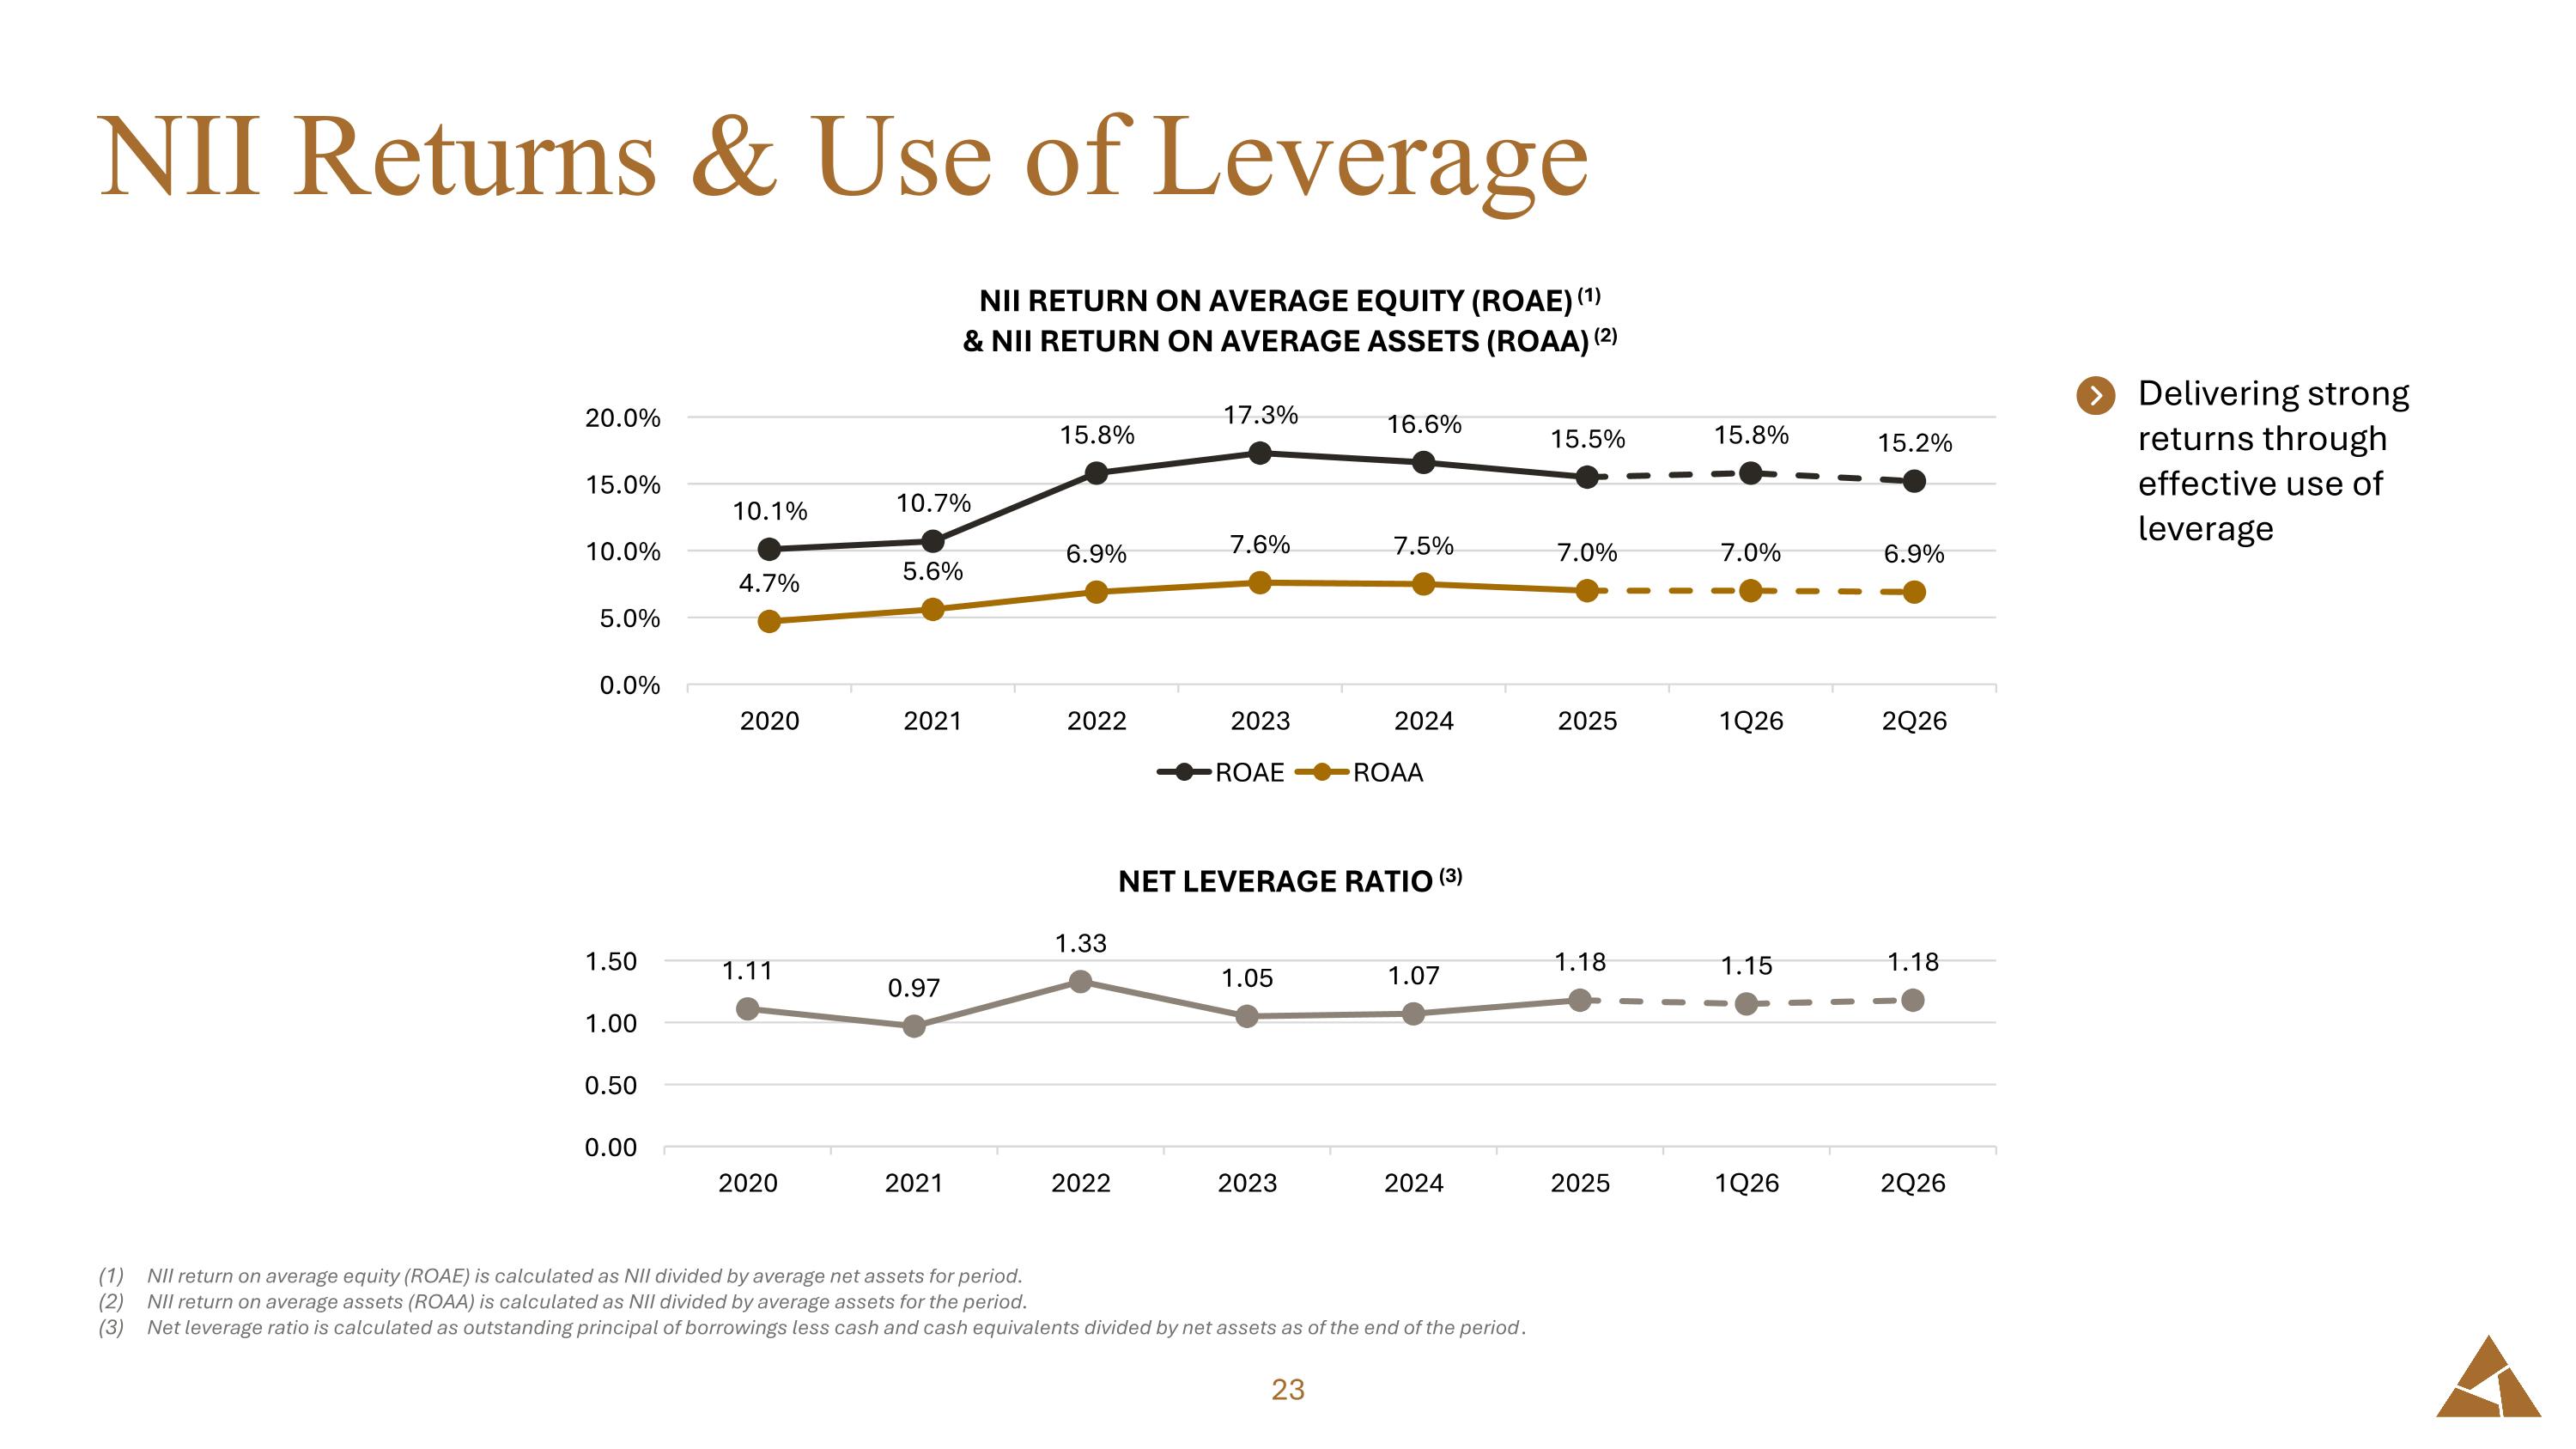
NII Returns & Use of Leverage NII return on average equity (ROAE) is calculated as NII divided by average net assets for period. NII return on average assets (ROAA) is calculated as NII divided by average assets for the period. Net leverage ratio is calculated as outstanding principal of borrowings less cash and cash equivalents divided by net assets as of the end of the period. Delivering strong returns through effective use of leverage
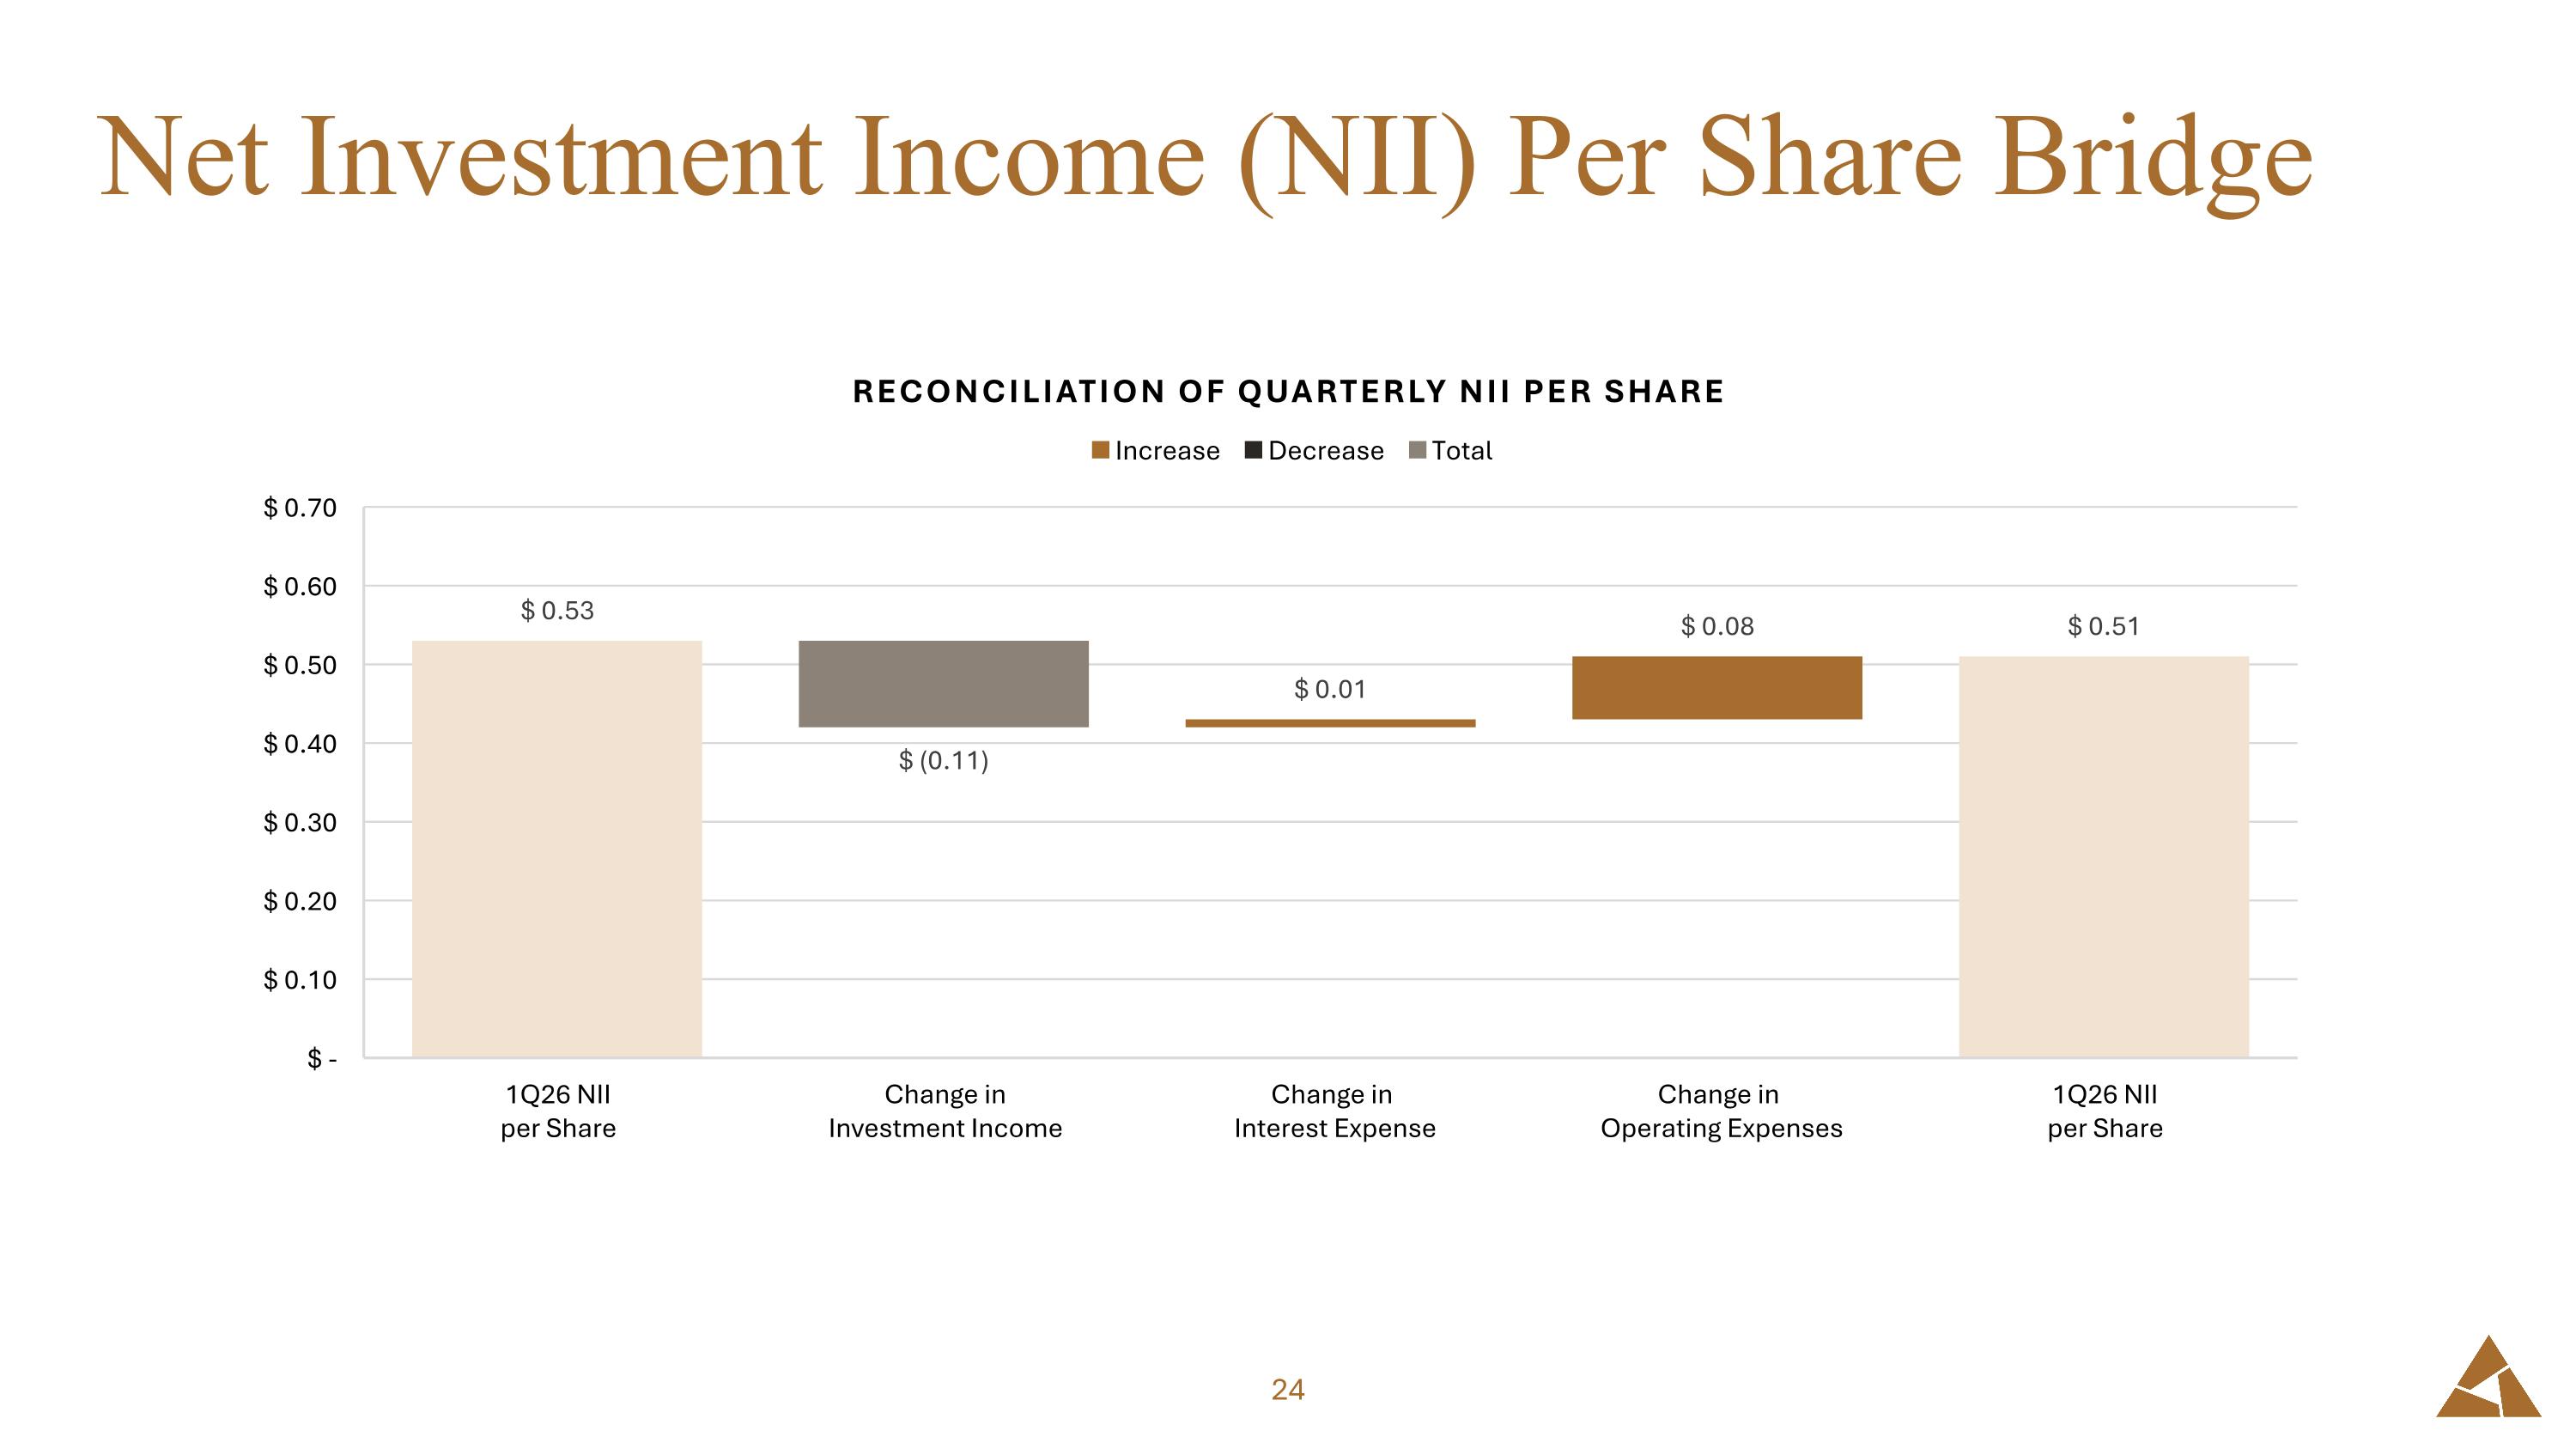
Net Investment Income (NII) Per Share Bridge
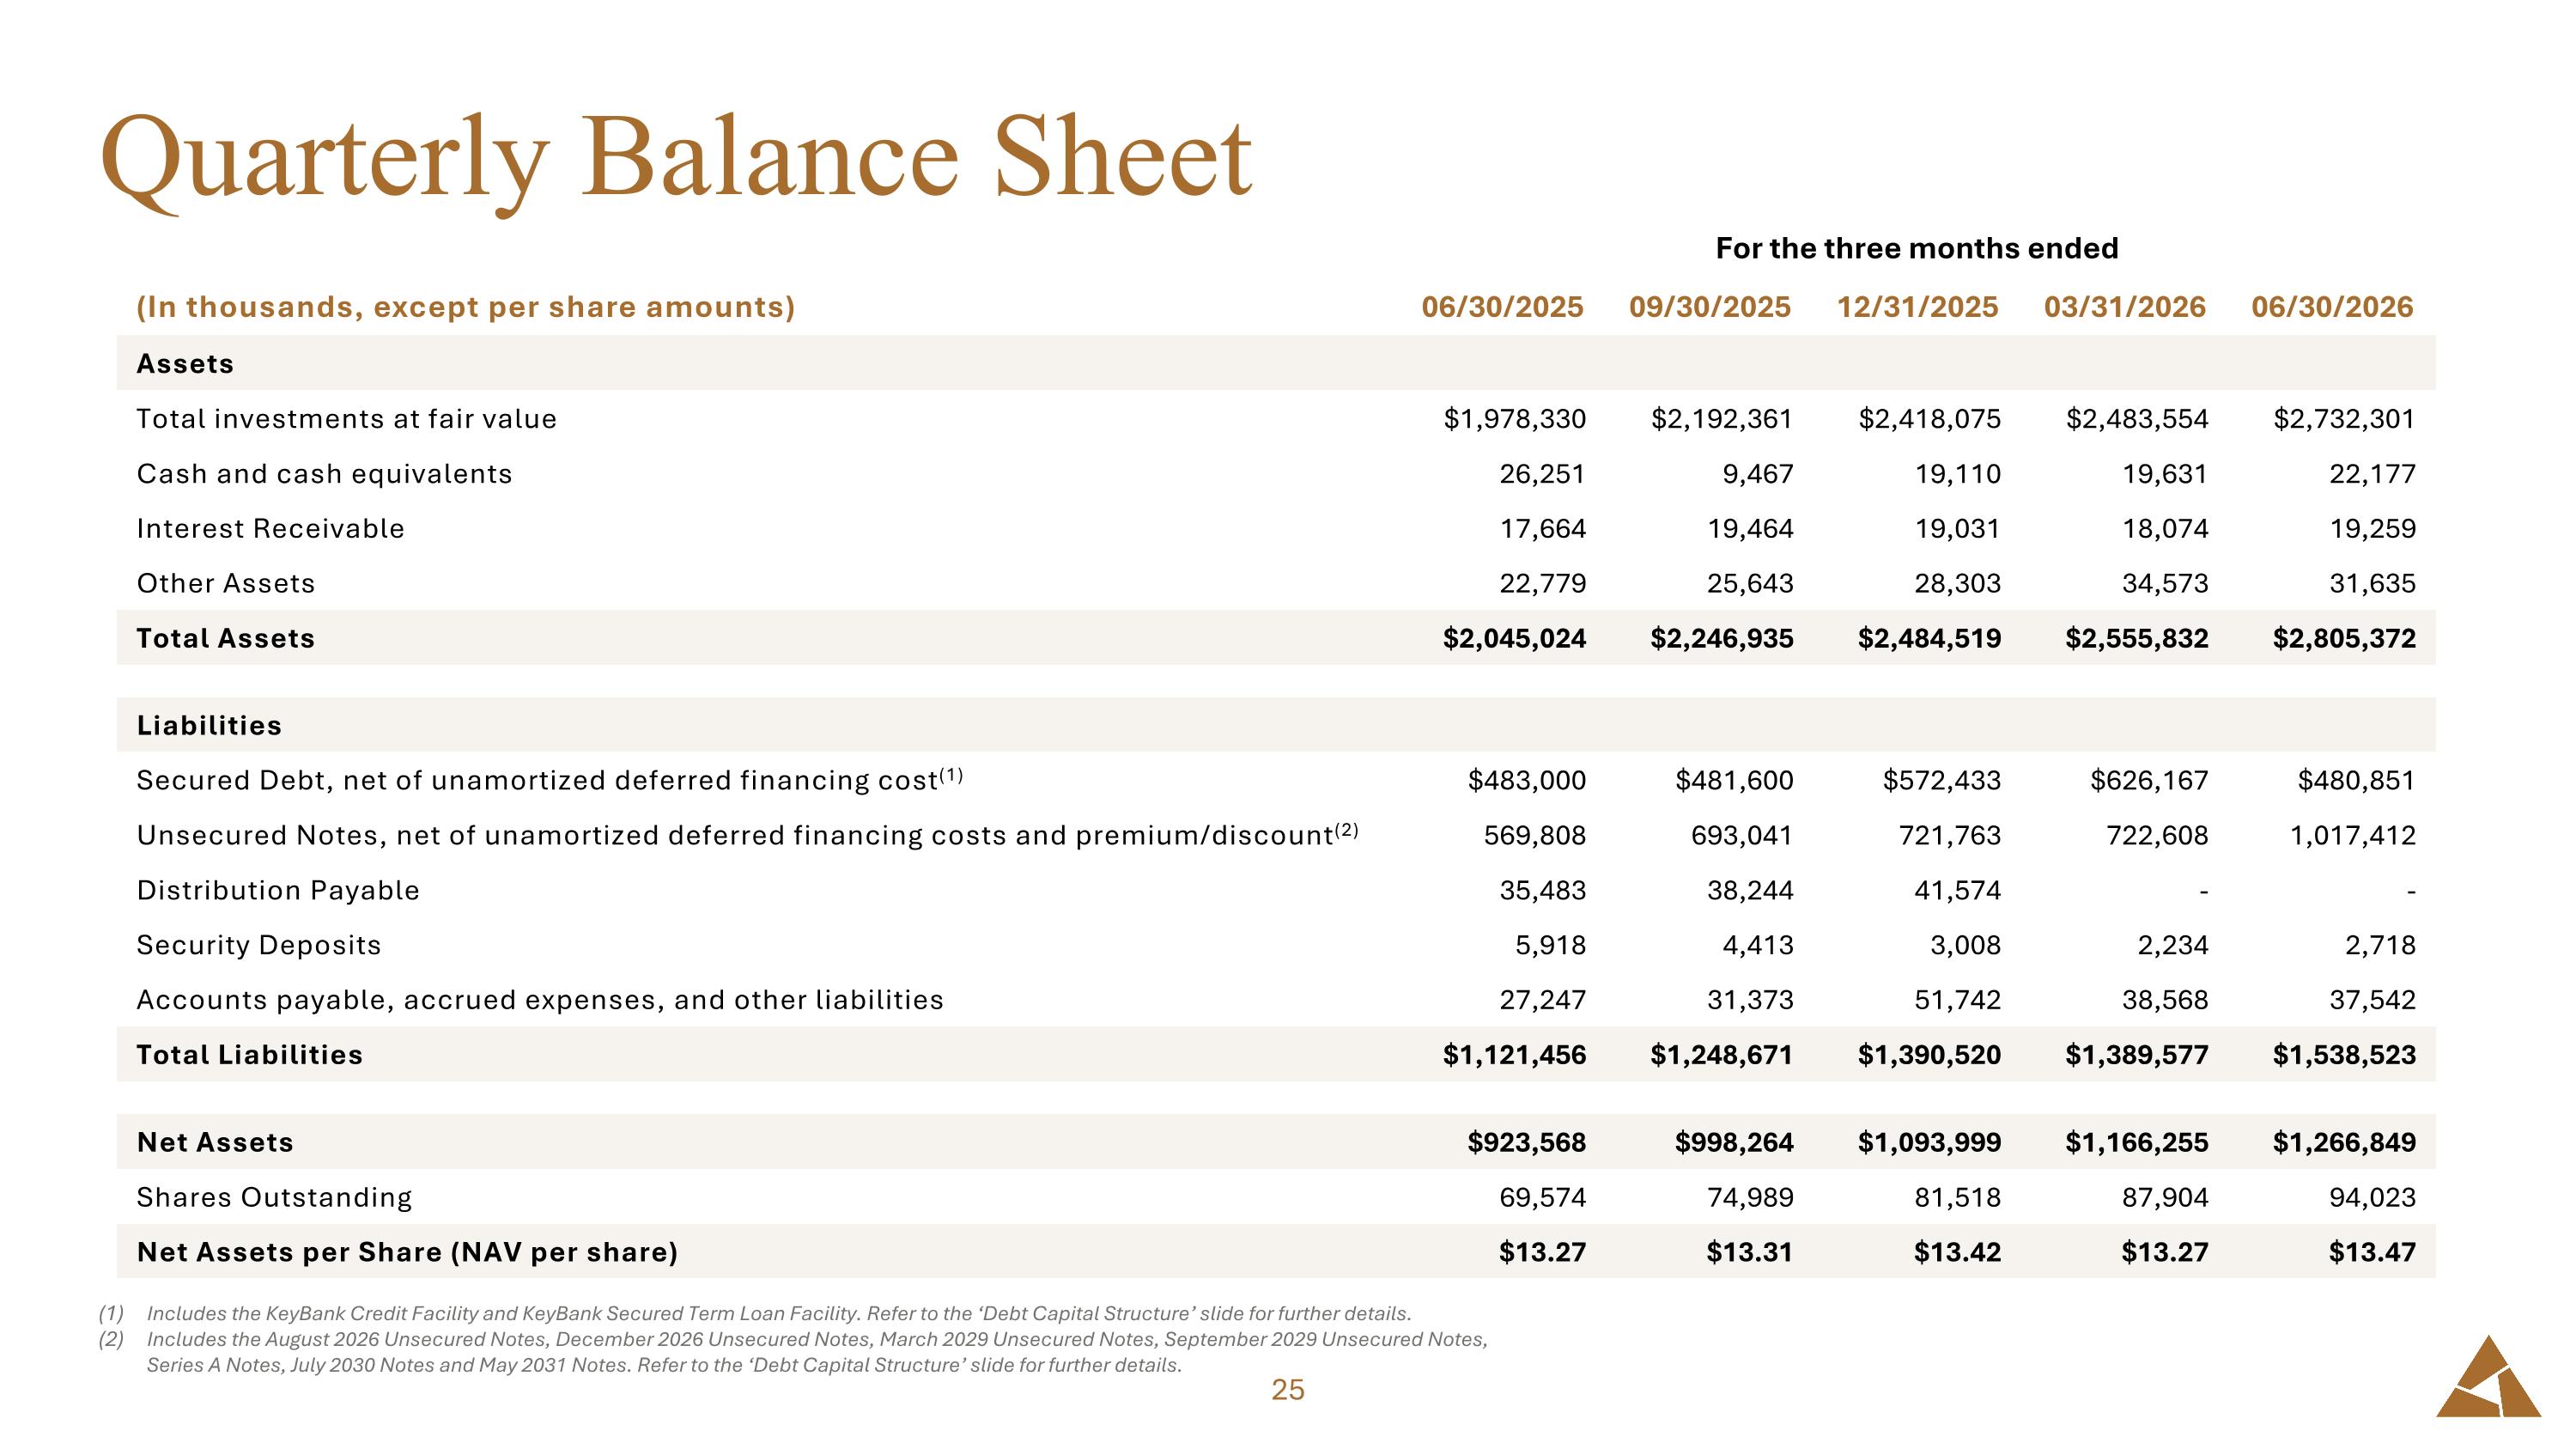
Quarterly Balance Sheet Includes the KeyBank Credit Facility and KeyBank Secured Term Loan Facility. Refer to the ‘Debt Capital Structure’ slide for further details. Includes the August 2026 Unsecured Notes, December 2026 Unsecured Notes, March 2029 Unsecured Notes, September 2029 Unsecured Notes, Series A Notes, July 2030 Notes and May 2031 Notes. Refer to the ‘Debt Capital Structure’ slide for further details. For the three months ended For the three months ended (In thousands, except per share amounts) 06/30/2025 09/30/2025 12/31/2025 03/31/2026 06/30/2026 Assets Total investments at fair value $1,978,330 $2,192,361 $2,418,075 $2,483,554 $2,732,301 Cash and cash equivalents 26,251 9,467 19,110 19,631 22,177 Interest Receivable 17,664 19,464 19,031 18,074 19,259 Other Assets 22,779 25,643 28,303 34,573 31,635 Total Assets $2,045,024 $2,246,935 $2,484,519 $2,555,832 $2,805,372 Liabilities Secured Debt, net of unamortized deferred financing cost(1) $483,000 $481,600 $572,433 $626,167 $480,851 Unsecured Notes, net of unamortized deferred financing costs and premium/discount(2) 569,808 693,041 721,763 722,608 1,017,412 Distribution Payable 35,483 38,244 41,574 - - Security Deposits 5,918 4,413 3,008 2,234 2,718 Accounts payable, accrued expenses, and other liabilities 27,247 31,373 51,742 38,568 37,542 Total Liabilities $1,121,456 $1,248,671 $1,390,520 $1,389,577 $1,538,523 Net Assets $923,568 $998,264 $1,093,999 $1,166,255 $1,266,849 Shares Outstanding 69,574 74,989 81,518 87,904 94,023 Net Assets per Share (NAV per share) $13.27 $13.31 $13.42 $13.27 $13.47
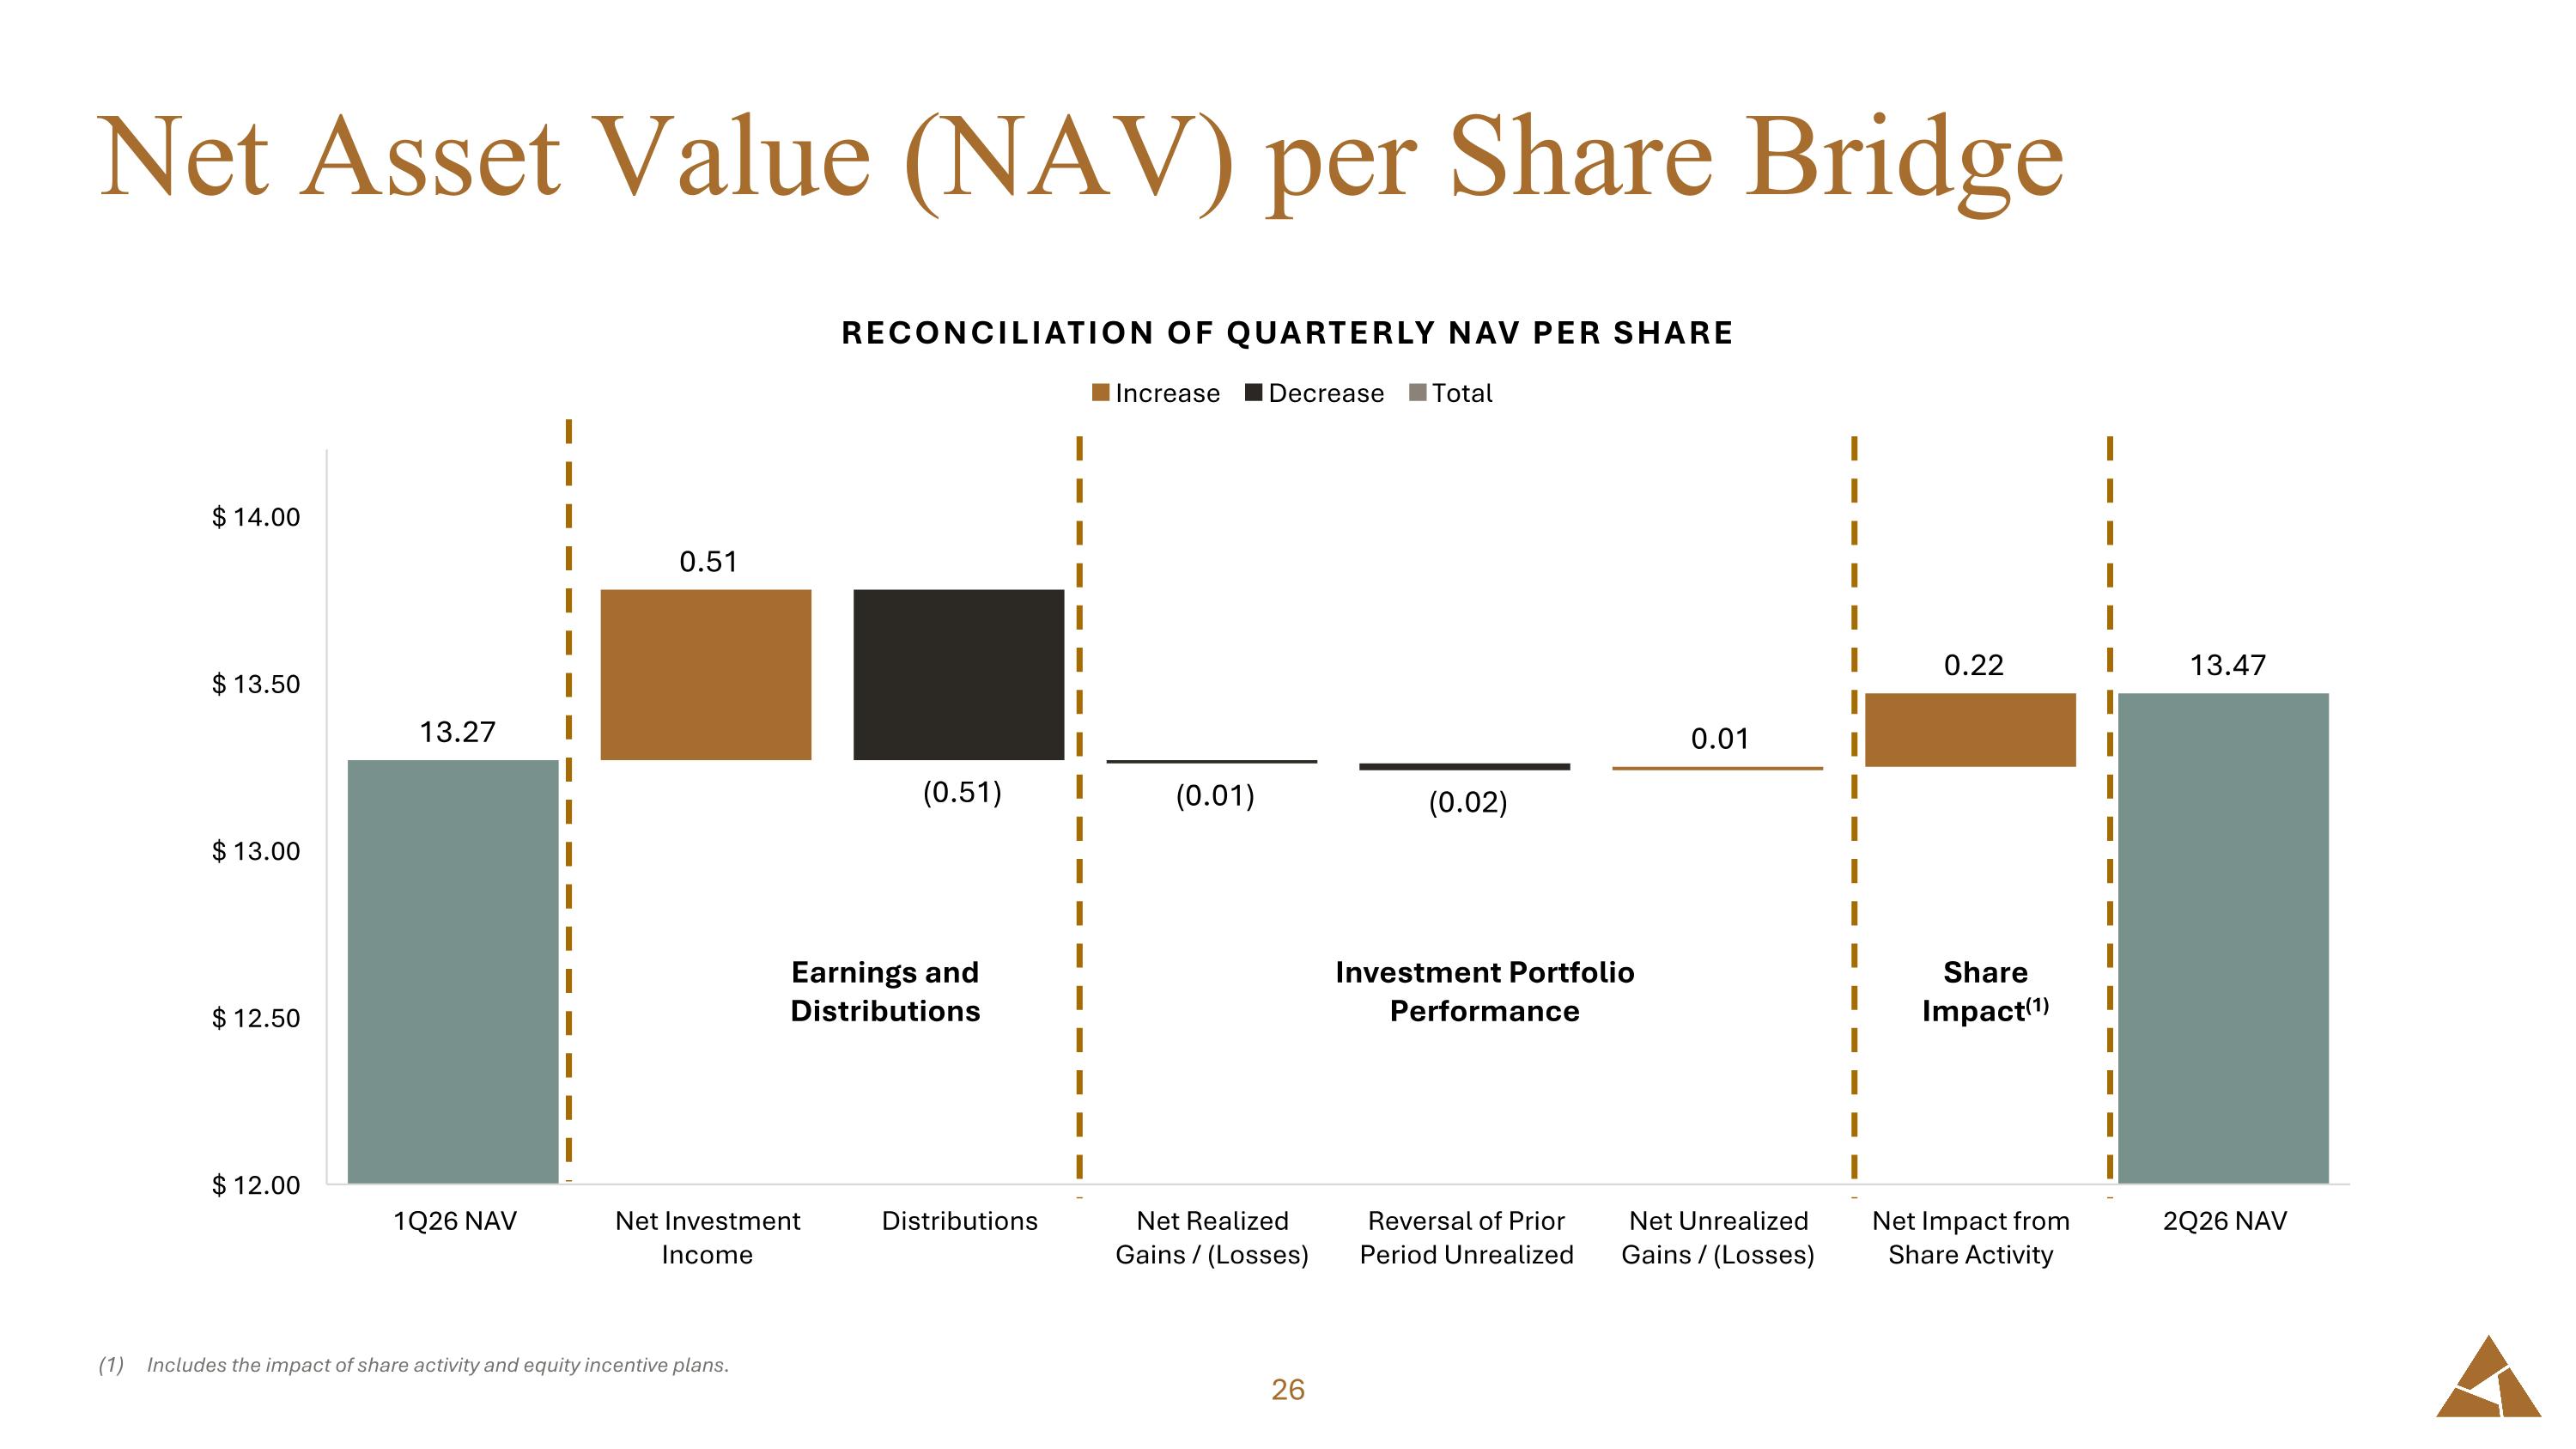
Net Asset Value (NAV) per Share Bridge Includes the impact of share activity and equity incentive plans. Earnings and Distributions Investment Portfolio Performance Share Impact(1)
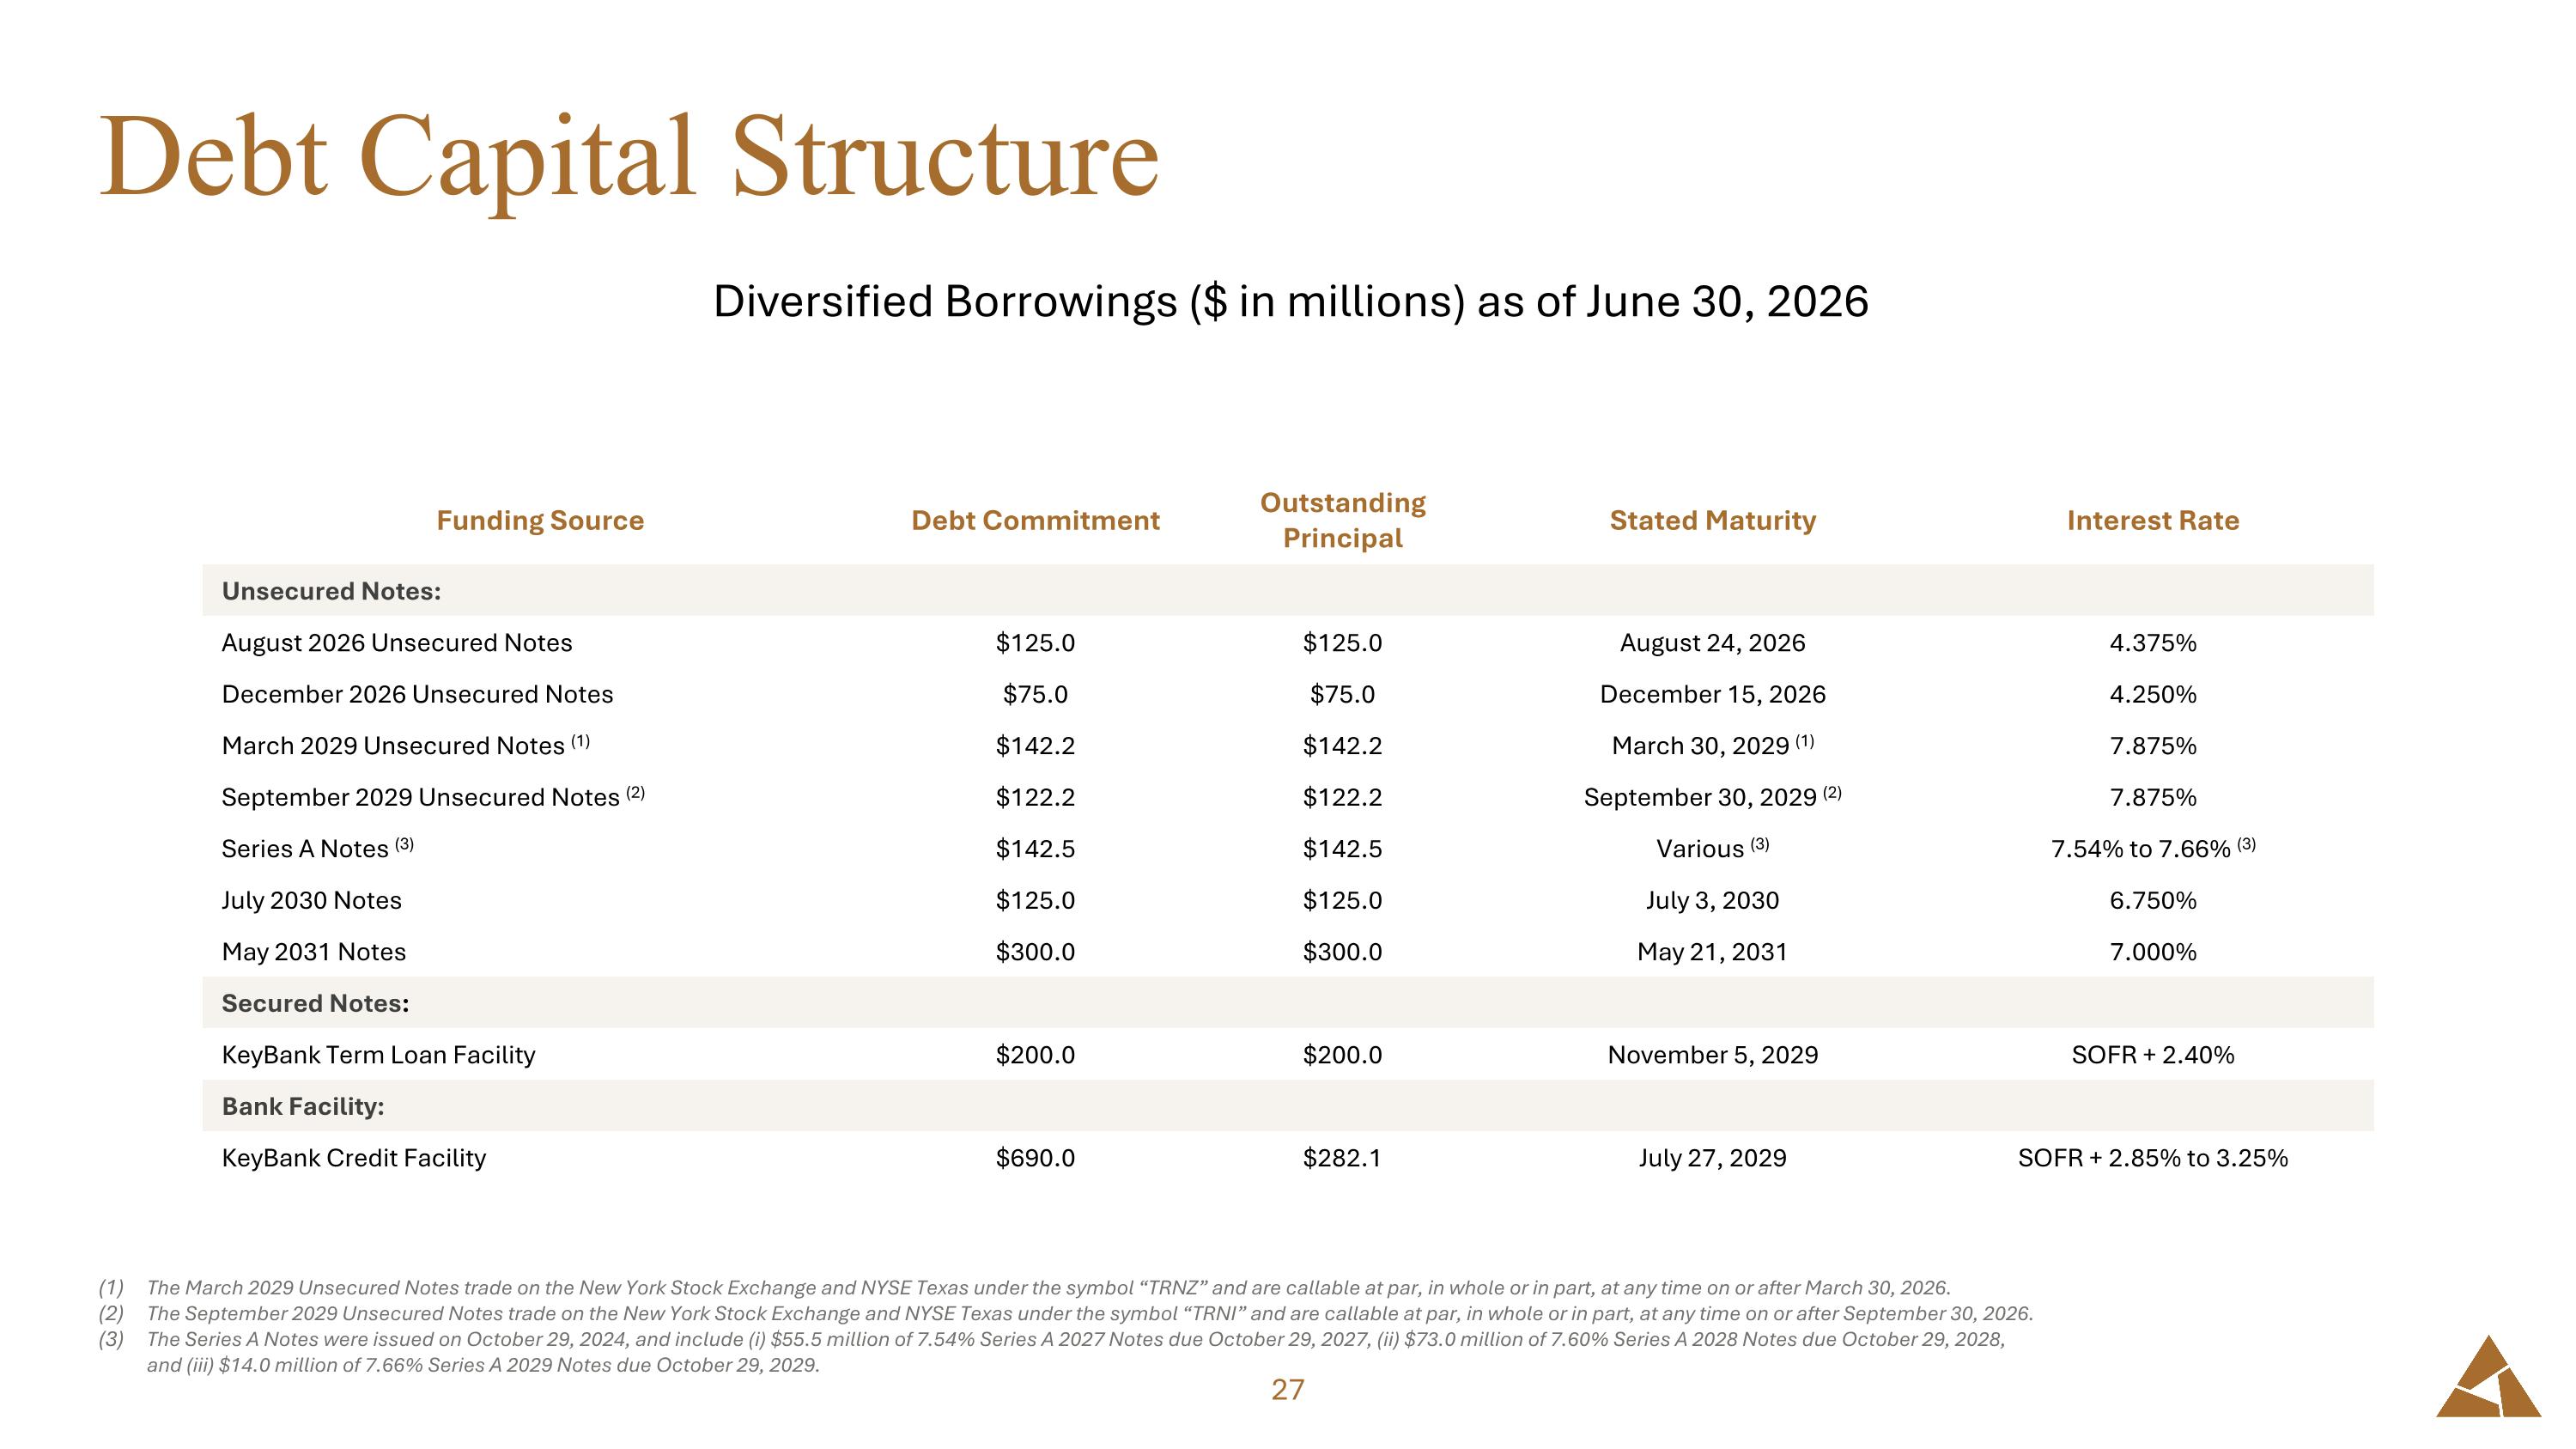
Debt Capital Structure Funding Source Debt Commitment Outstanding Principal Stated Maturity Interest Rate Unsecured Notes: August 2026 Unsecured Notes $125.0 $125.0 August 24, 2026 4.375% December 2026 Unsecured Notes $75.0 $75.0 December 15, 2026 4.250% March 2029 Unsecured Notes (1) $142.2 $142.2 March 30, 2029 (1) 7.875% September 2029 Unsecured Notes (2) $122.2 $122.2 September 30, 2029 (2) 7.875% Series A Notes (3) $142.5 $142.5 Various (3) 7.54% to 7.66% (3) July 2030 Notes $125.0 $125.0 July 3, 2030 6.750% May 2031 Notes $300.0 $300.0 May 21, 2031 7.000% Secured Notes: KeyBank Term Loan Facility $200.0 $200.0 November 5, 2029 SOFR + 2.40% Bank Facility: KeyBank Credit Facility $690.0 $282.1 July 27, 2029 SOFR + 2.85% to 3.25% Diversified Borrowings ($ in millions) as of June 30, 2026 The March 2029 Unsecured Notes trade on the New York Stock Exchange and NYSE Texas under the symbol “TRNZ” and are callable at par, in whole or in part, at any time on or after March 30, 2026. The September 2029 Unsecured Notes trade on the New York Stock Exchange and NYSE Texas under the symbol “TRNI” and are callable at par, in whole or in part, at any time on or after September 30, 2026. The Series A Notes were issued on October 29, 2024, and include (i) $55.5 million of 7.54% Series A 2027 Notes due October 29, 2027, (ii) $73.0 million of 7.60% Series A 2028 Notes due October 29, 2028, and (iii) $14.0 million of 7.66% Series A 2029 Notes due October 29, 2029.
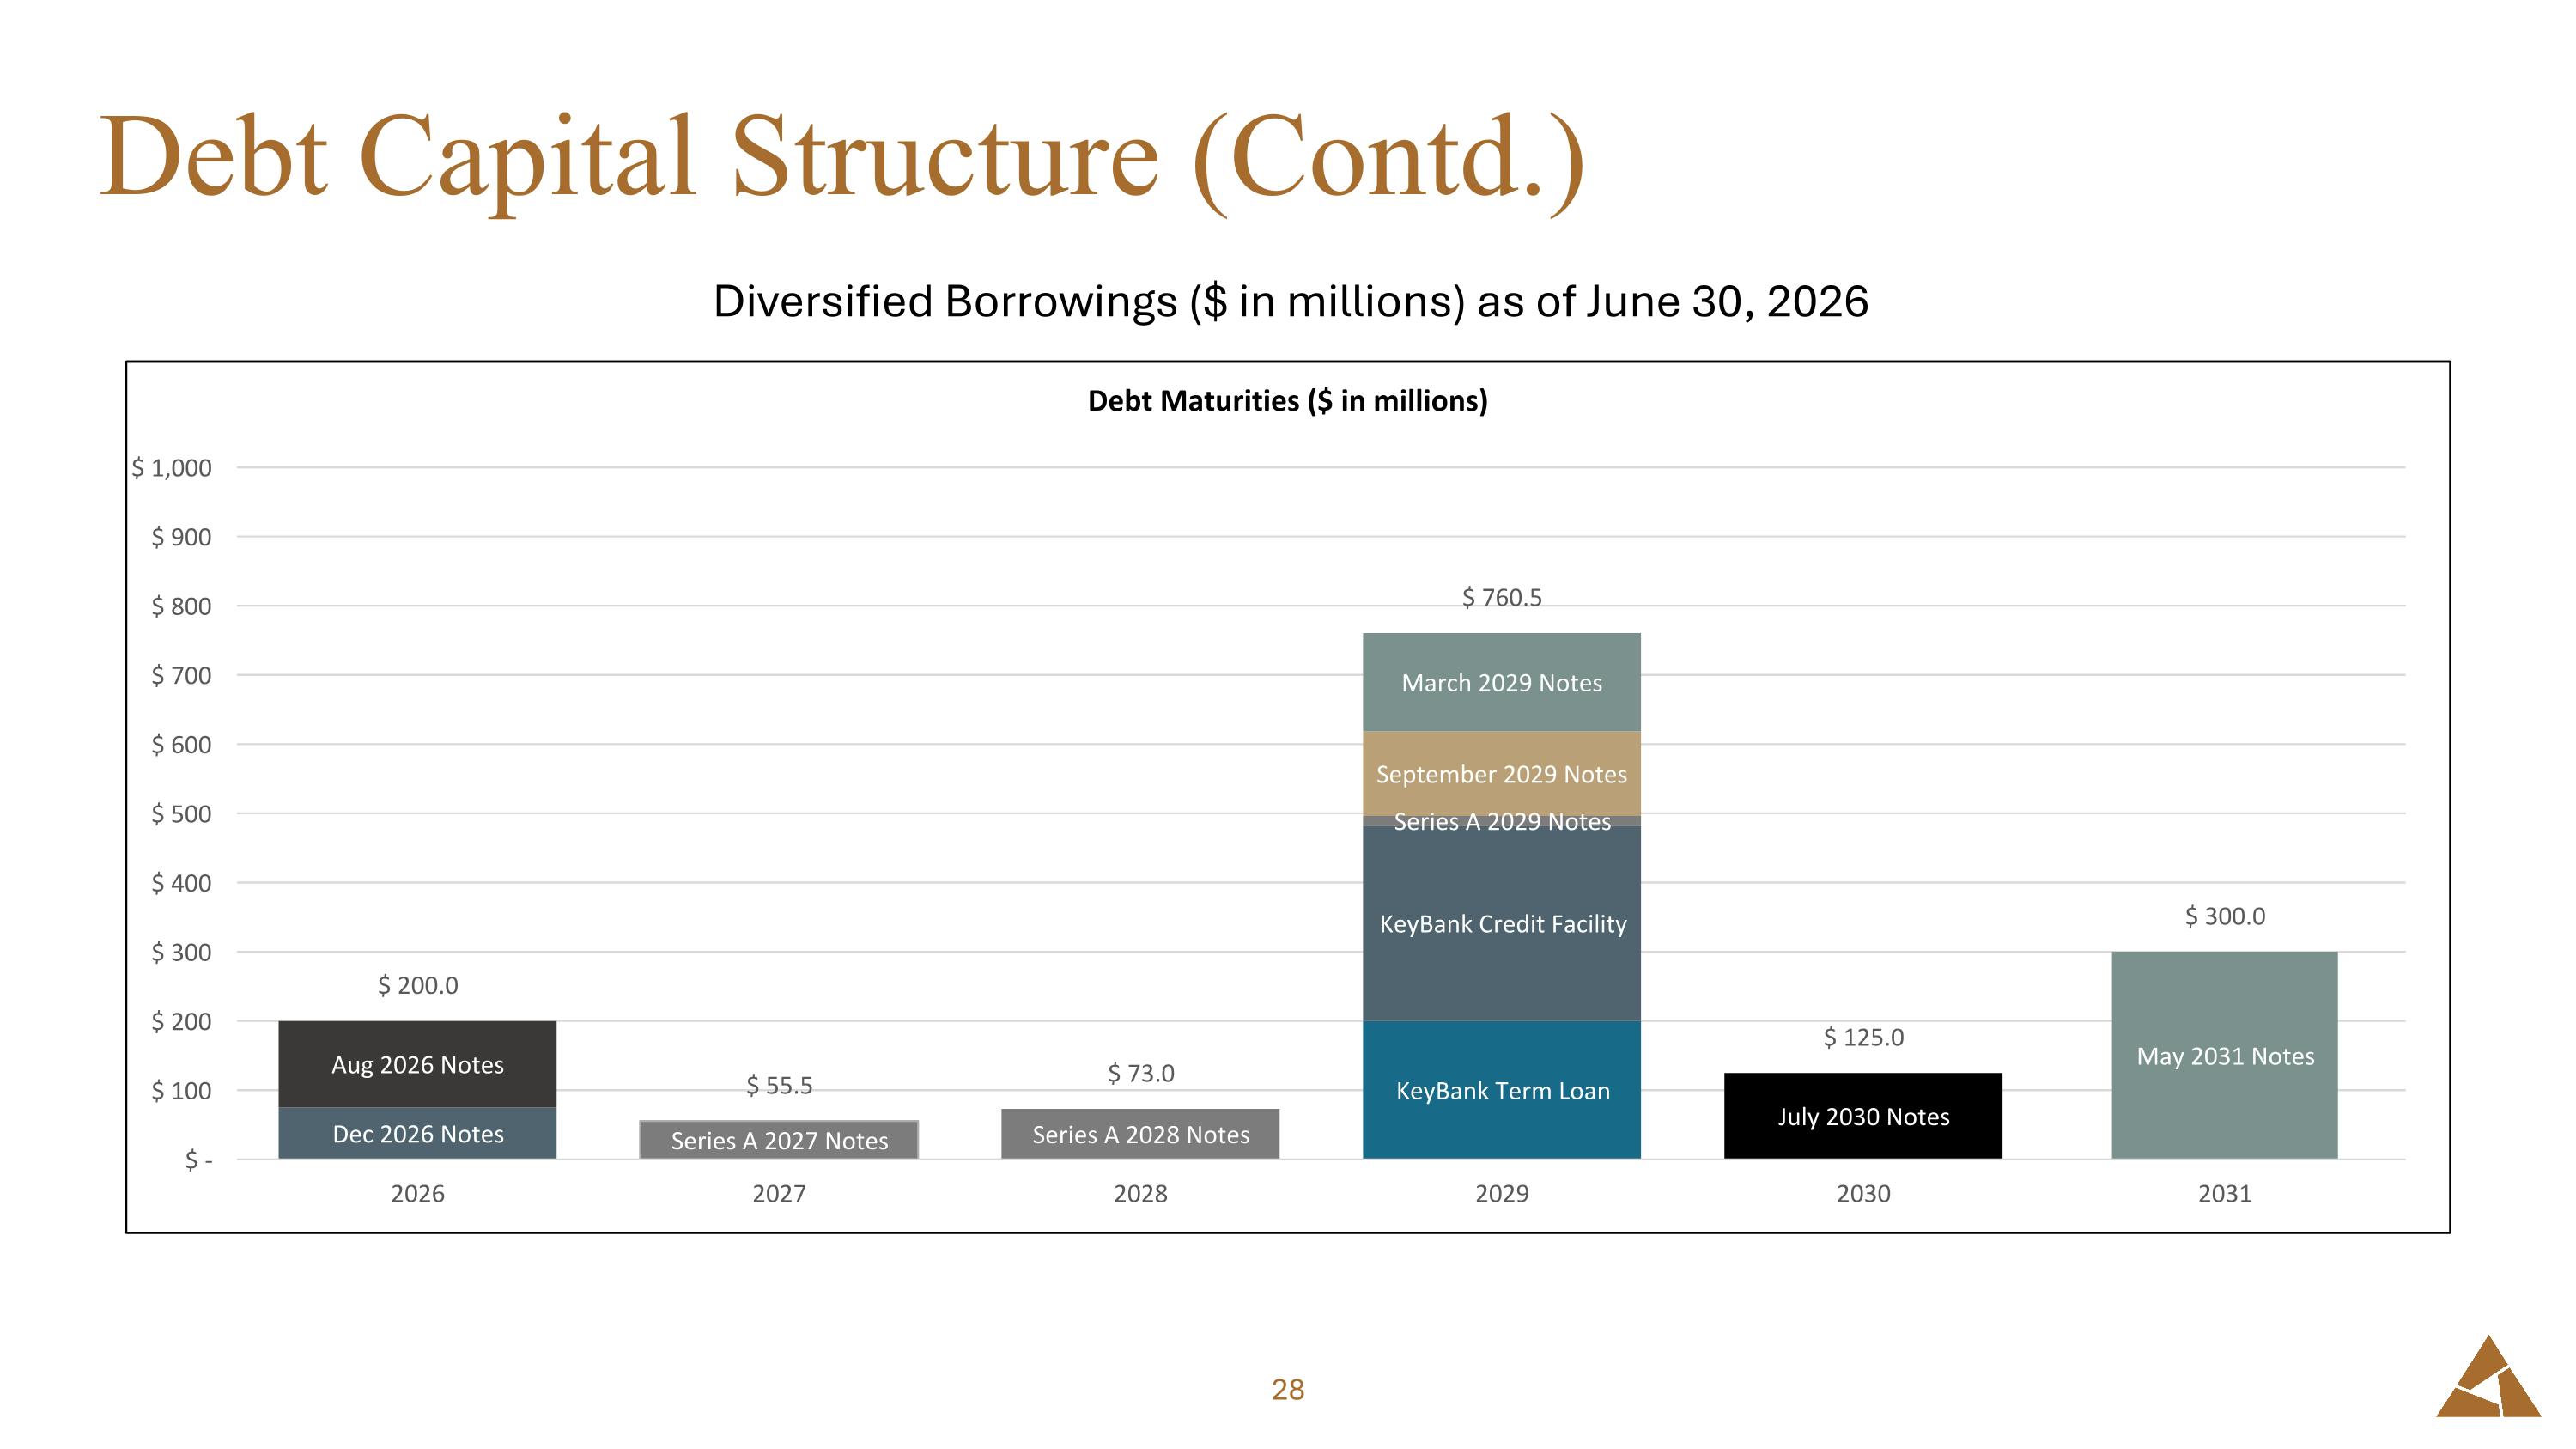
Debt Capital Structure (Contd.) Diversified Borrowings ($ in millions) as of June 30, 2026

Portfolio Highlights
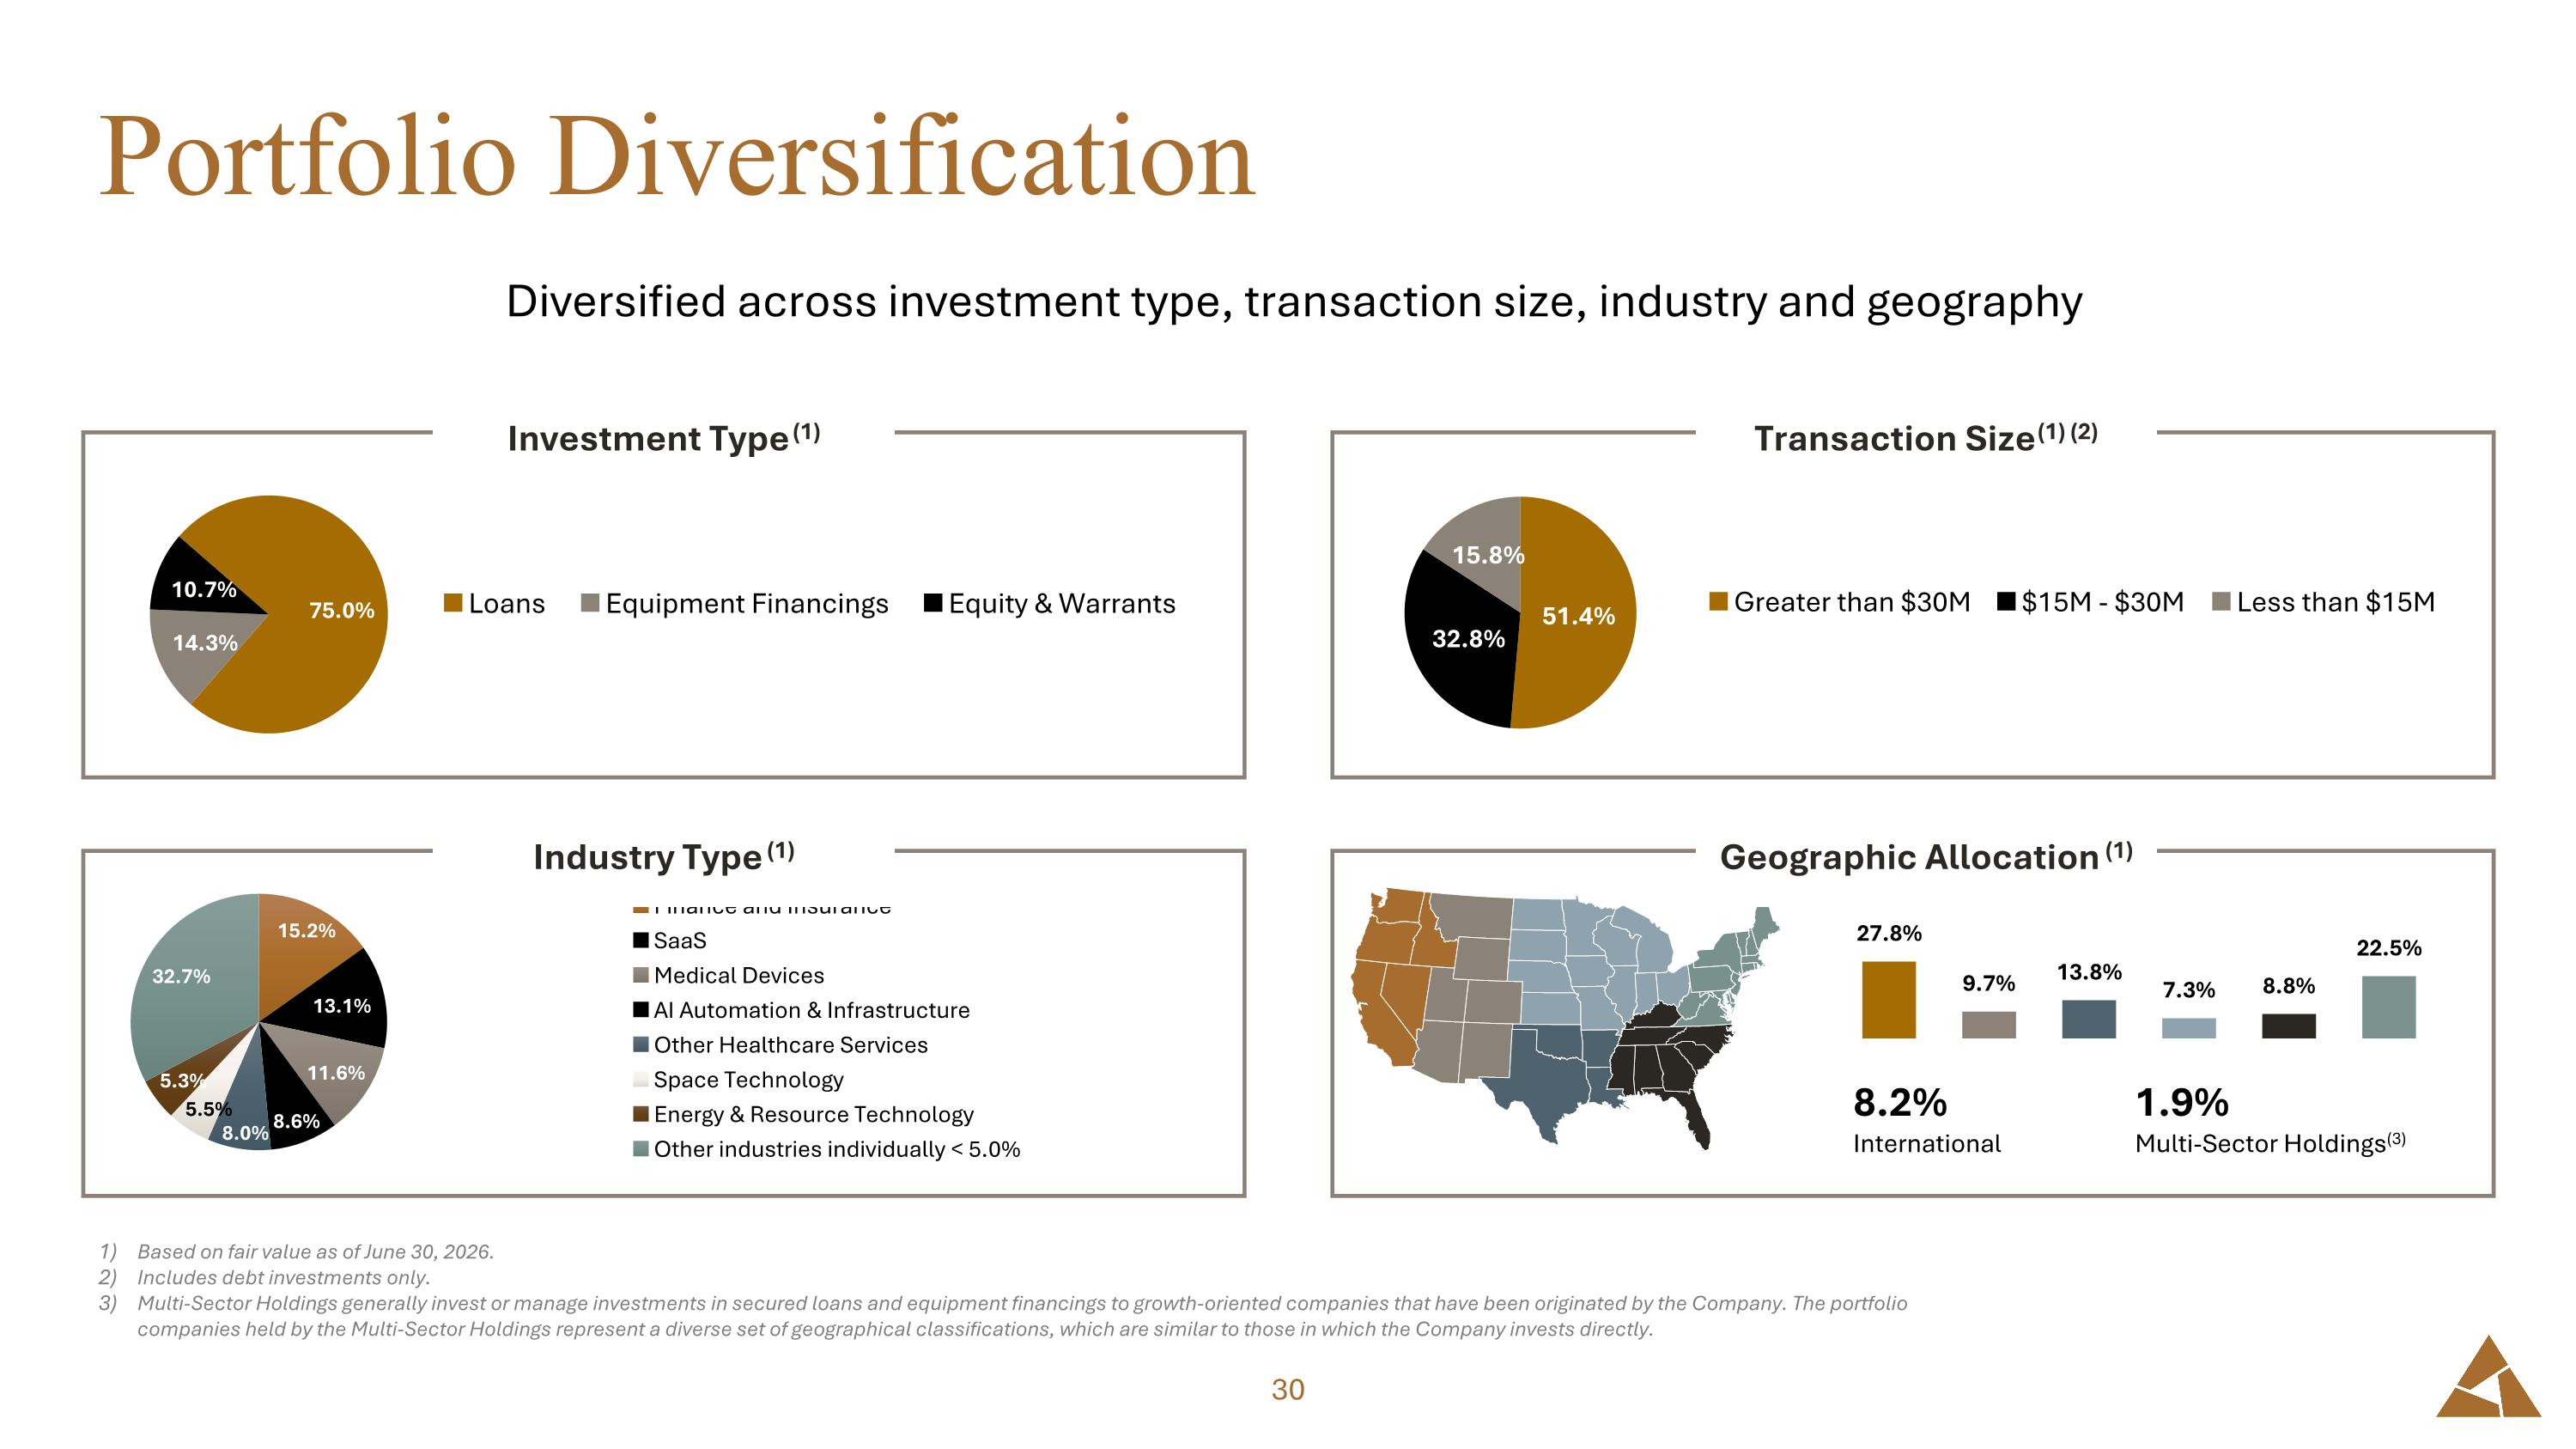
Portfolio Diversification Diversified across investment type, transaction size, industry and geography Based on fair value as of June 30, 2026. Includes debt investments only. Multi-Sector Holdings generally invest or manage investments in secured loans and equipment financings to growth-oriented companies that have been originated by the Company. The portfolio companies held by the Multi-Sector Holdings represent a diverse set of geographical classifications, which are similar to those in which the Company invests directly. Investment Type (1) Industry Type (1) 8.2% International 1.9% Multi-Sector Holdings(3) Transaction Size (1) (2) Geographic Allocation (1)
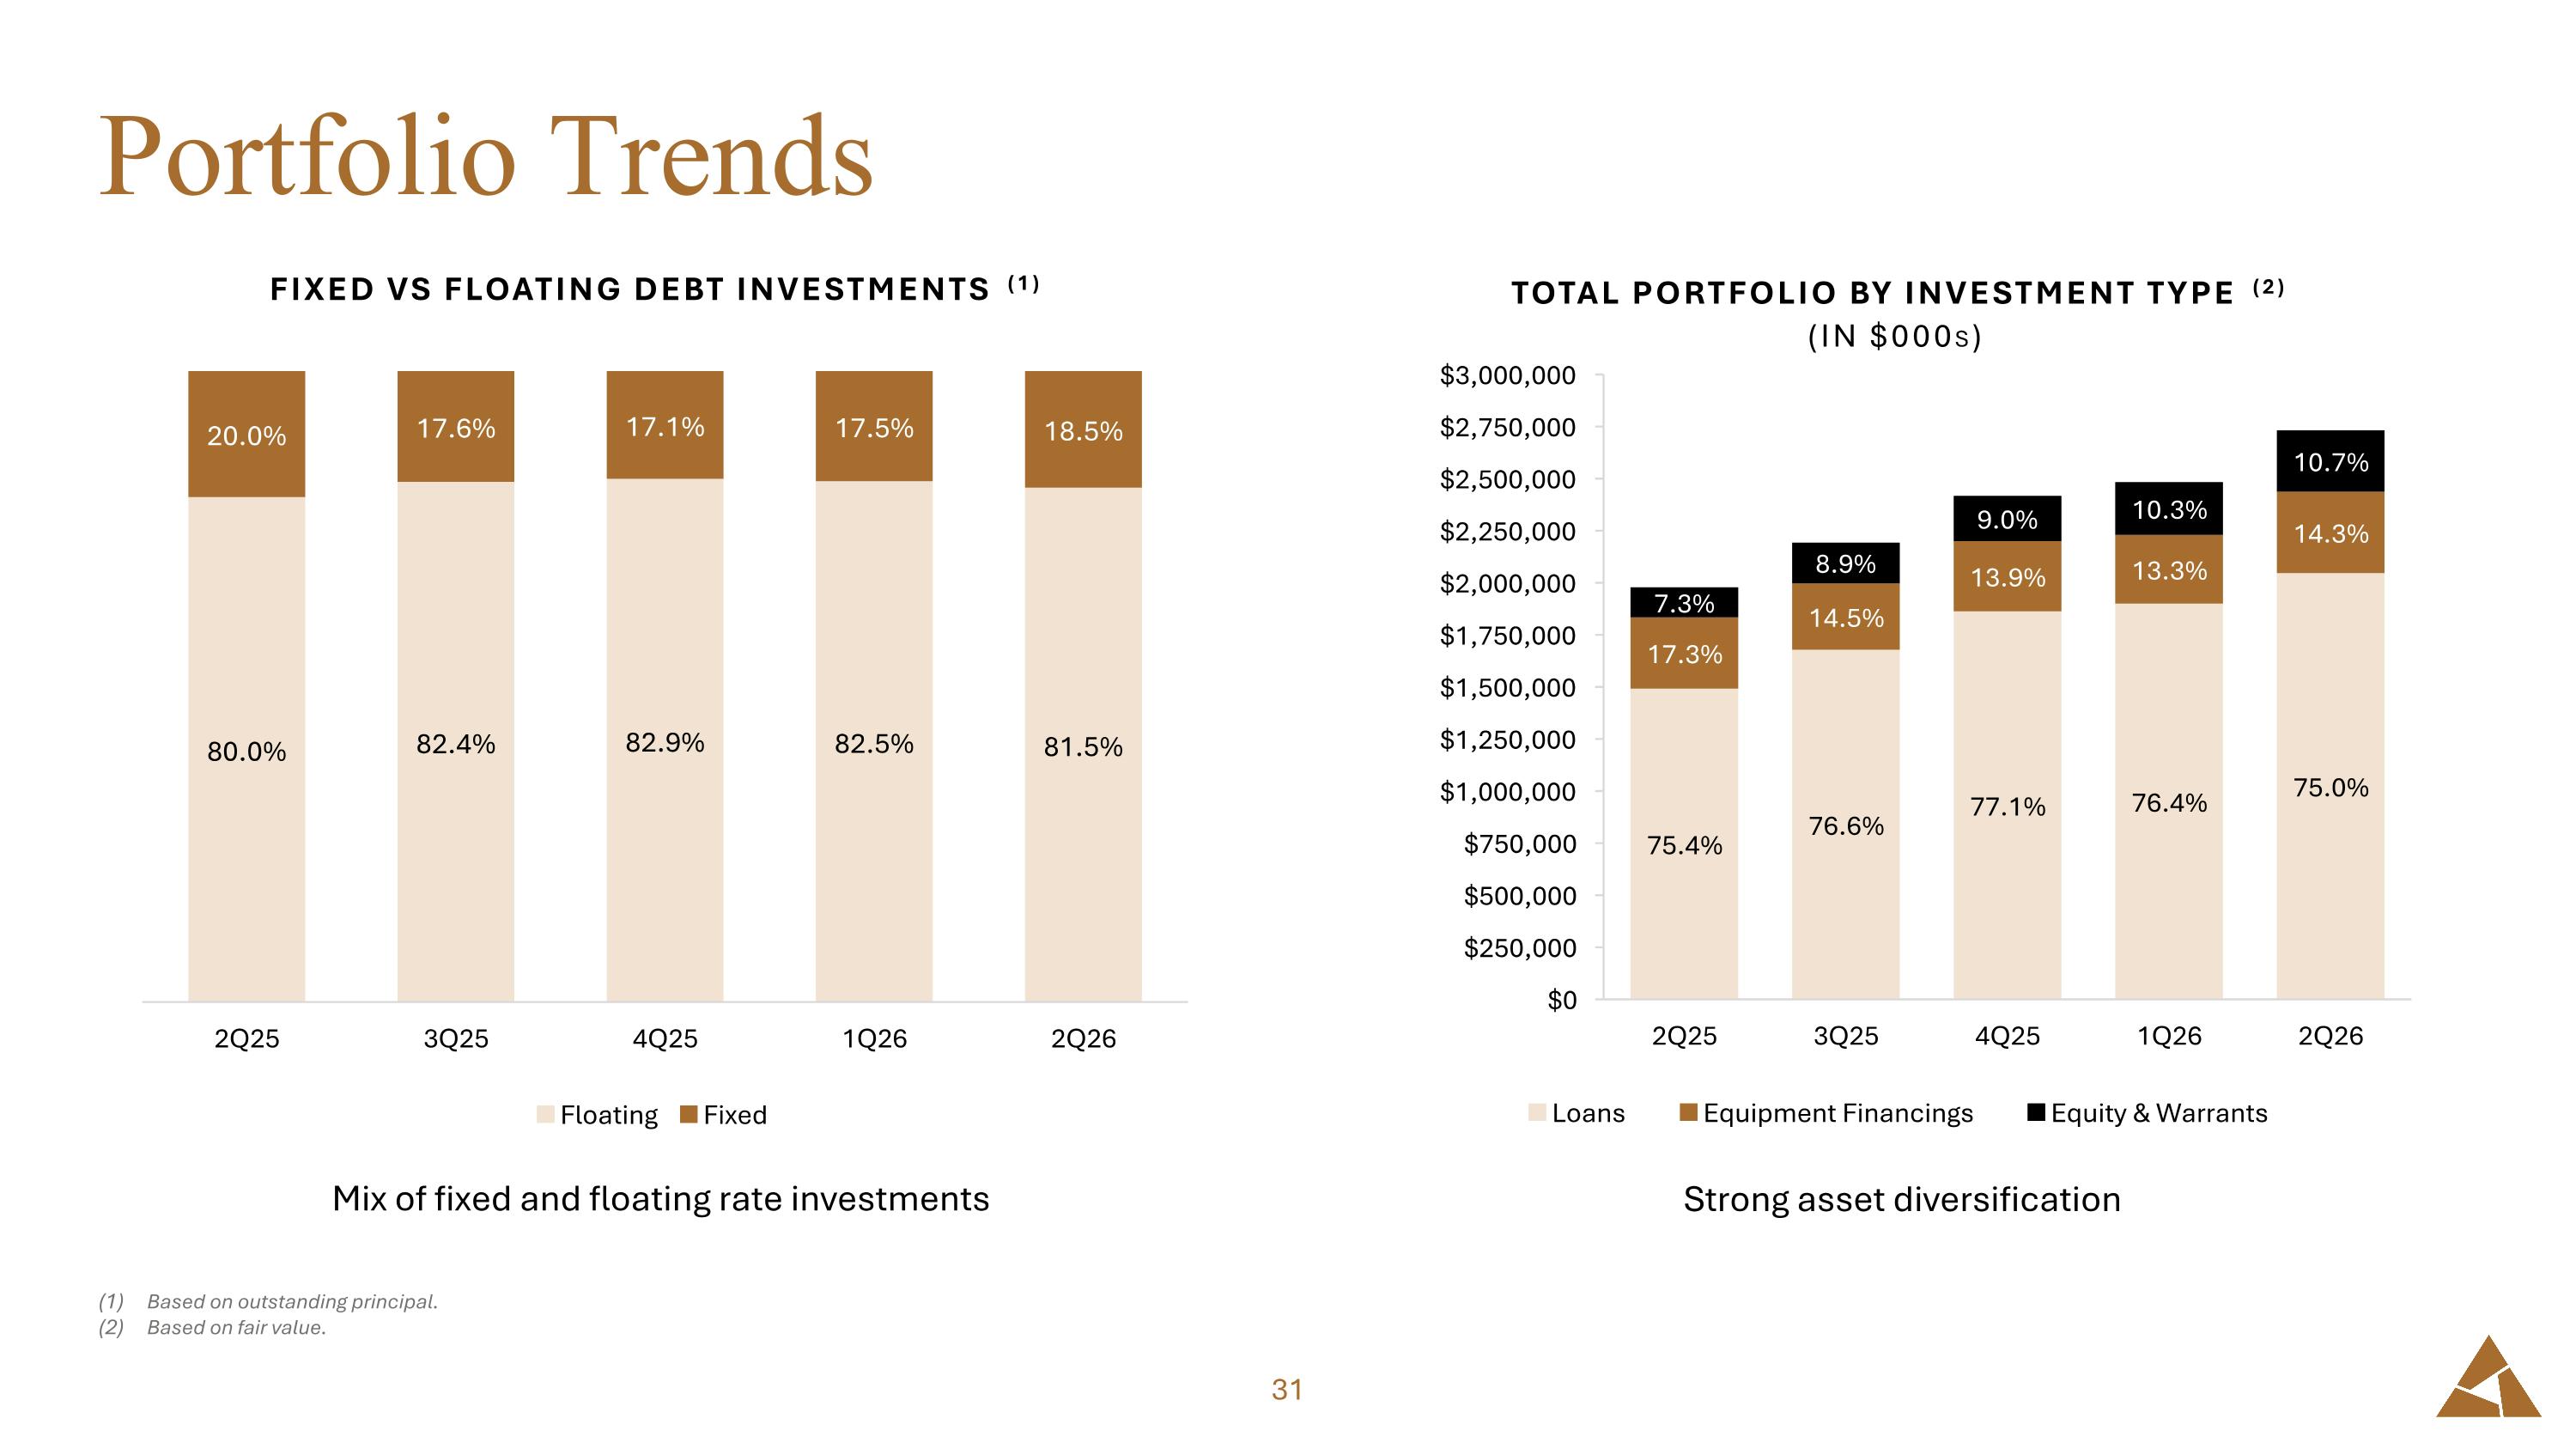
Portfolio Trends Based on outstanding principal. Based on fair value. Mix of fixed and floating rate investments Strong asset diversification
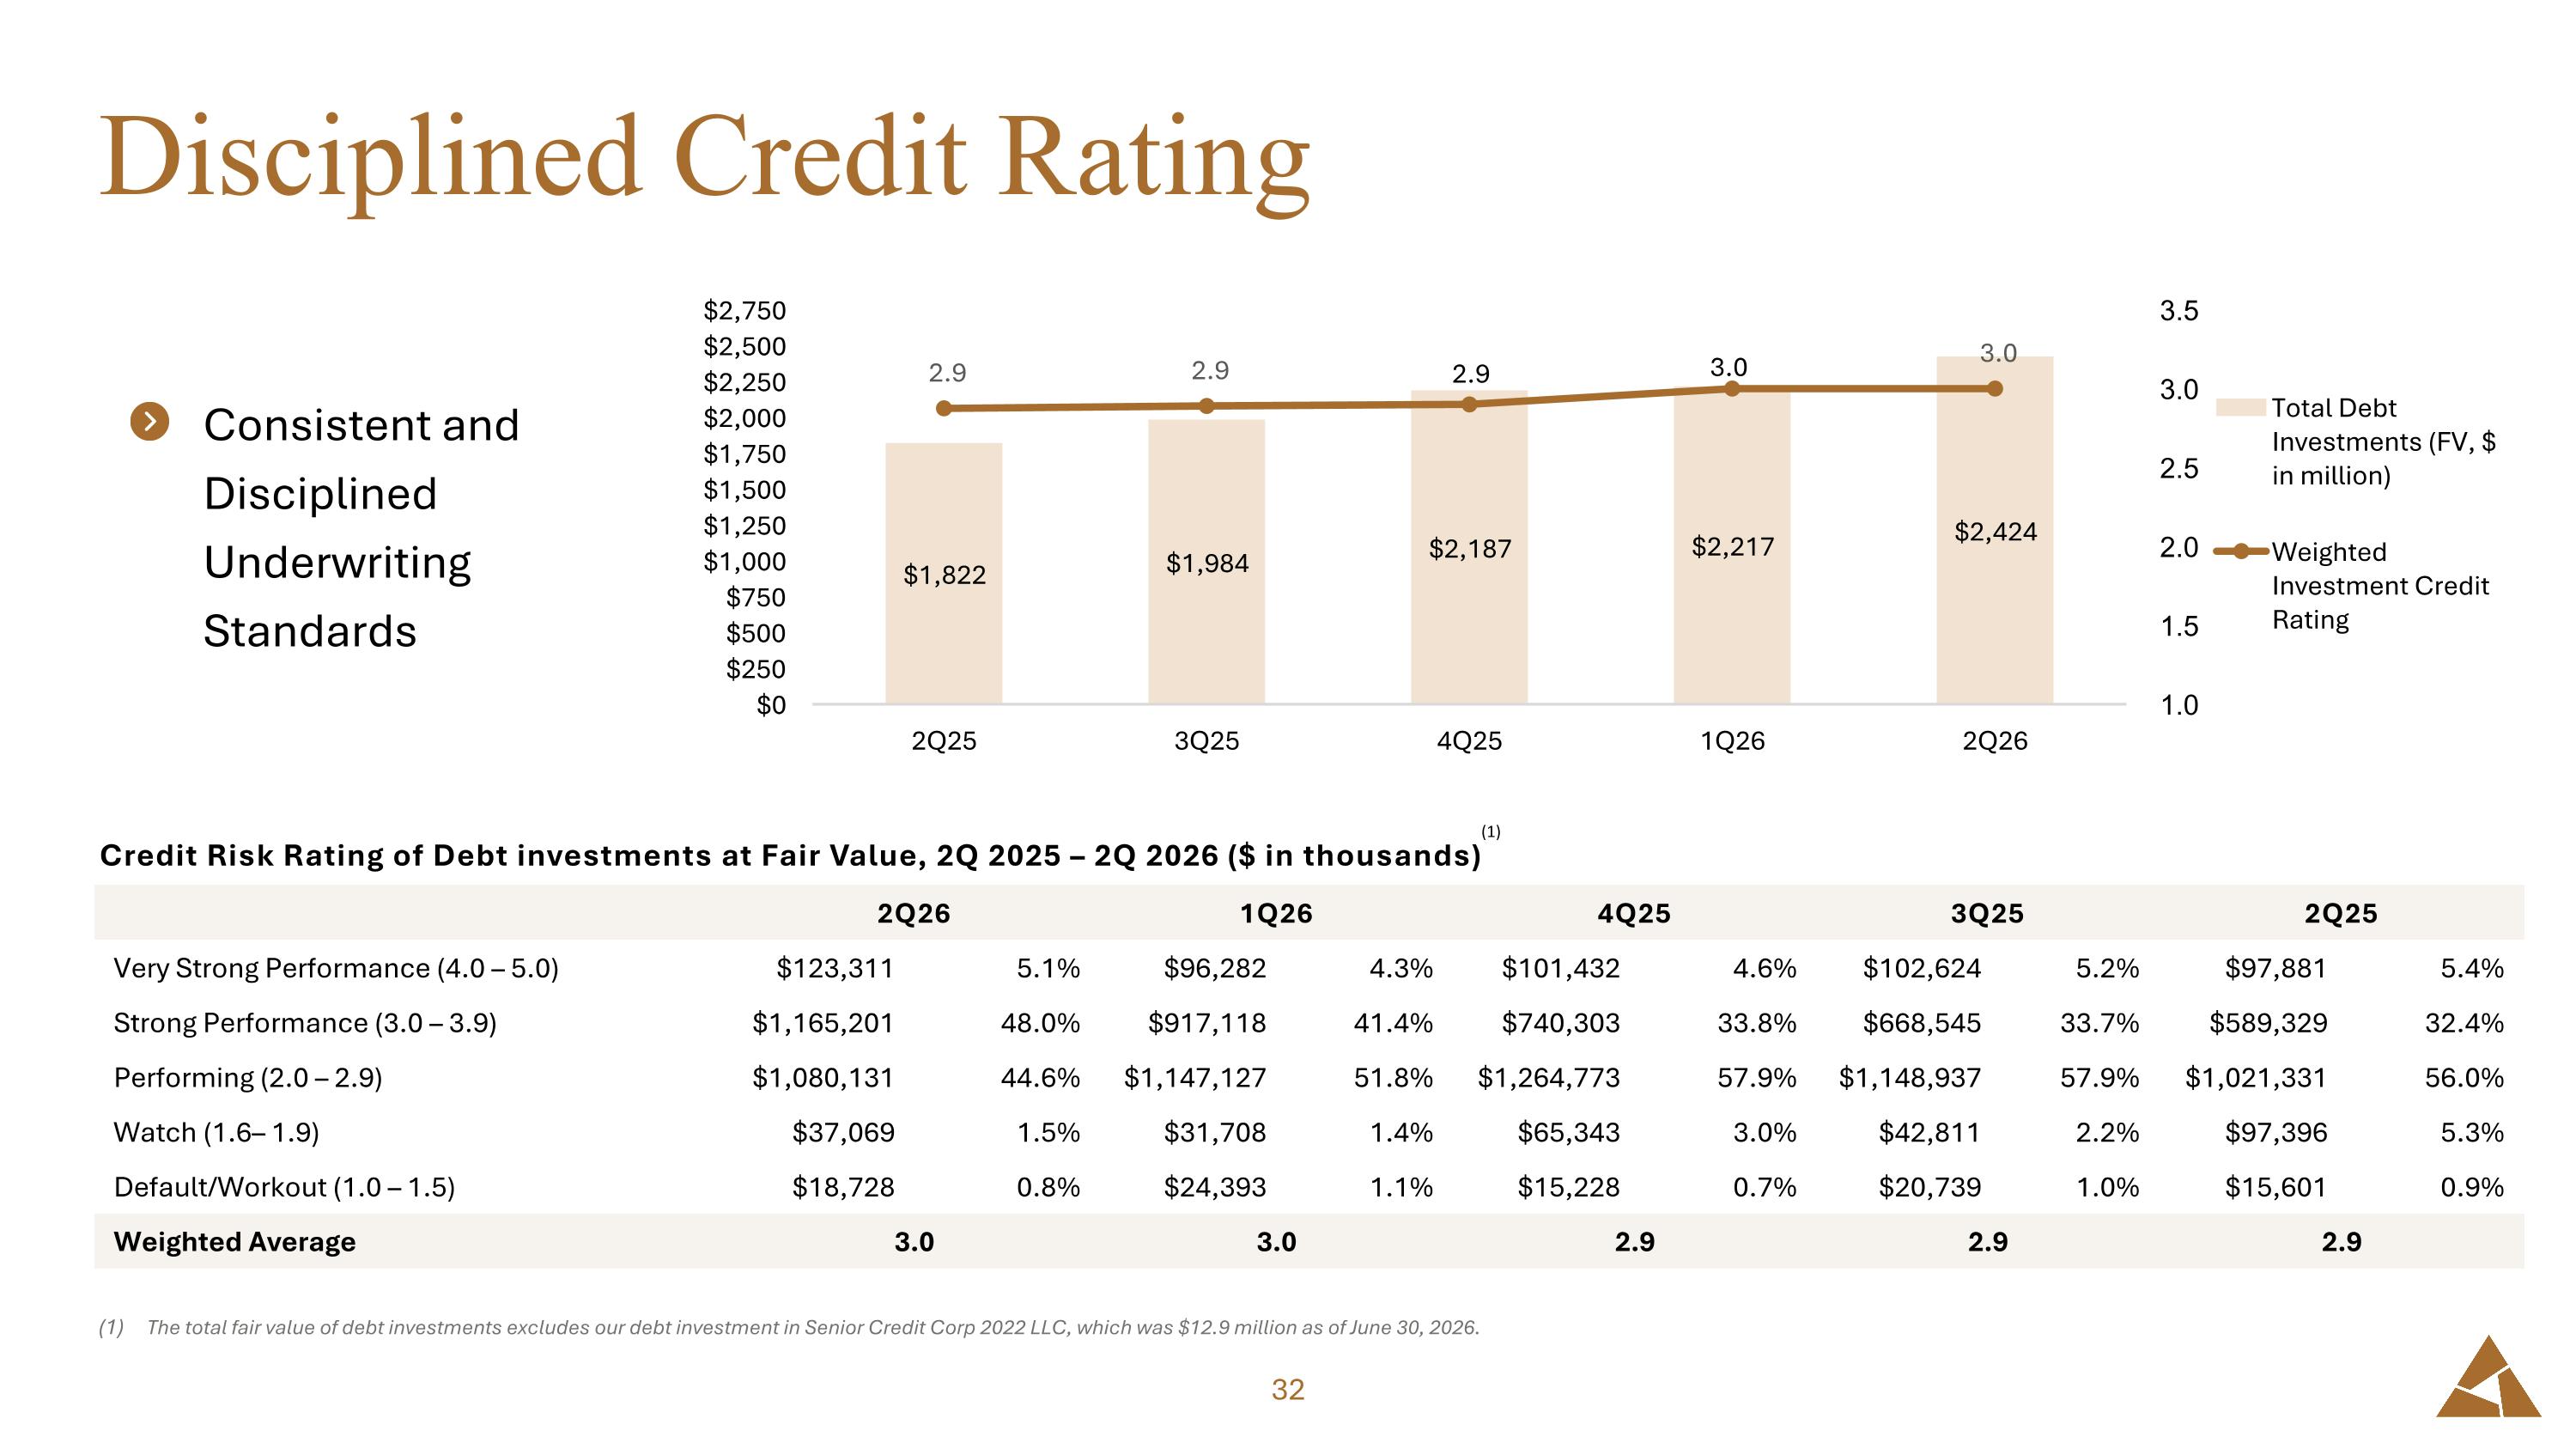
Credit Risk Rating of Debt investments at Fair Value, 2Q 2025 – 2Q 2026 ($ in thousands) Disciplined Credit Rating The total fair value of debt investments excludes our debt investment in Senior Credit Corp 2022 LLC, which was $12.9 million as of June 30, 2026. 2Q26 1Q26 4Q25 3Q25 2Q25 Very Strong Performance (4.0 – 5.0) $123,311 5.1% $96,282 4.3% $101,432 4.6% $102,624 5.2% $97,881 5.4% Strong Performance (3.0 – 3.9) $1,165,201 48.0% $917,118 41.4% $740,303 33.8% $668,545 33.7% $589,329 32.4% Performing (2.0 – 2.9) $1,080,131 44.6% $1,147,127 51.8% $1,264,773 57.9% $1,148,937 57.9% $1,021,331 56.0% Watch (1.6– 1.9) $37,069 1.5% $31,708 1.4% $65,343 3.0% $42,811 2.2% $97,396 5.3% Default/Workout (1.0 – 1.5) $18,728 0.8% $24,393 1.1% $15,228 0.7% $20,739 1.0% $15,601 0.9% Weighted Average 3.0 3.0 2.9 2.9 2.9 Consistent and Disciplined Underwriting Standards (1)
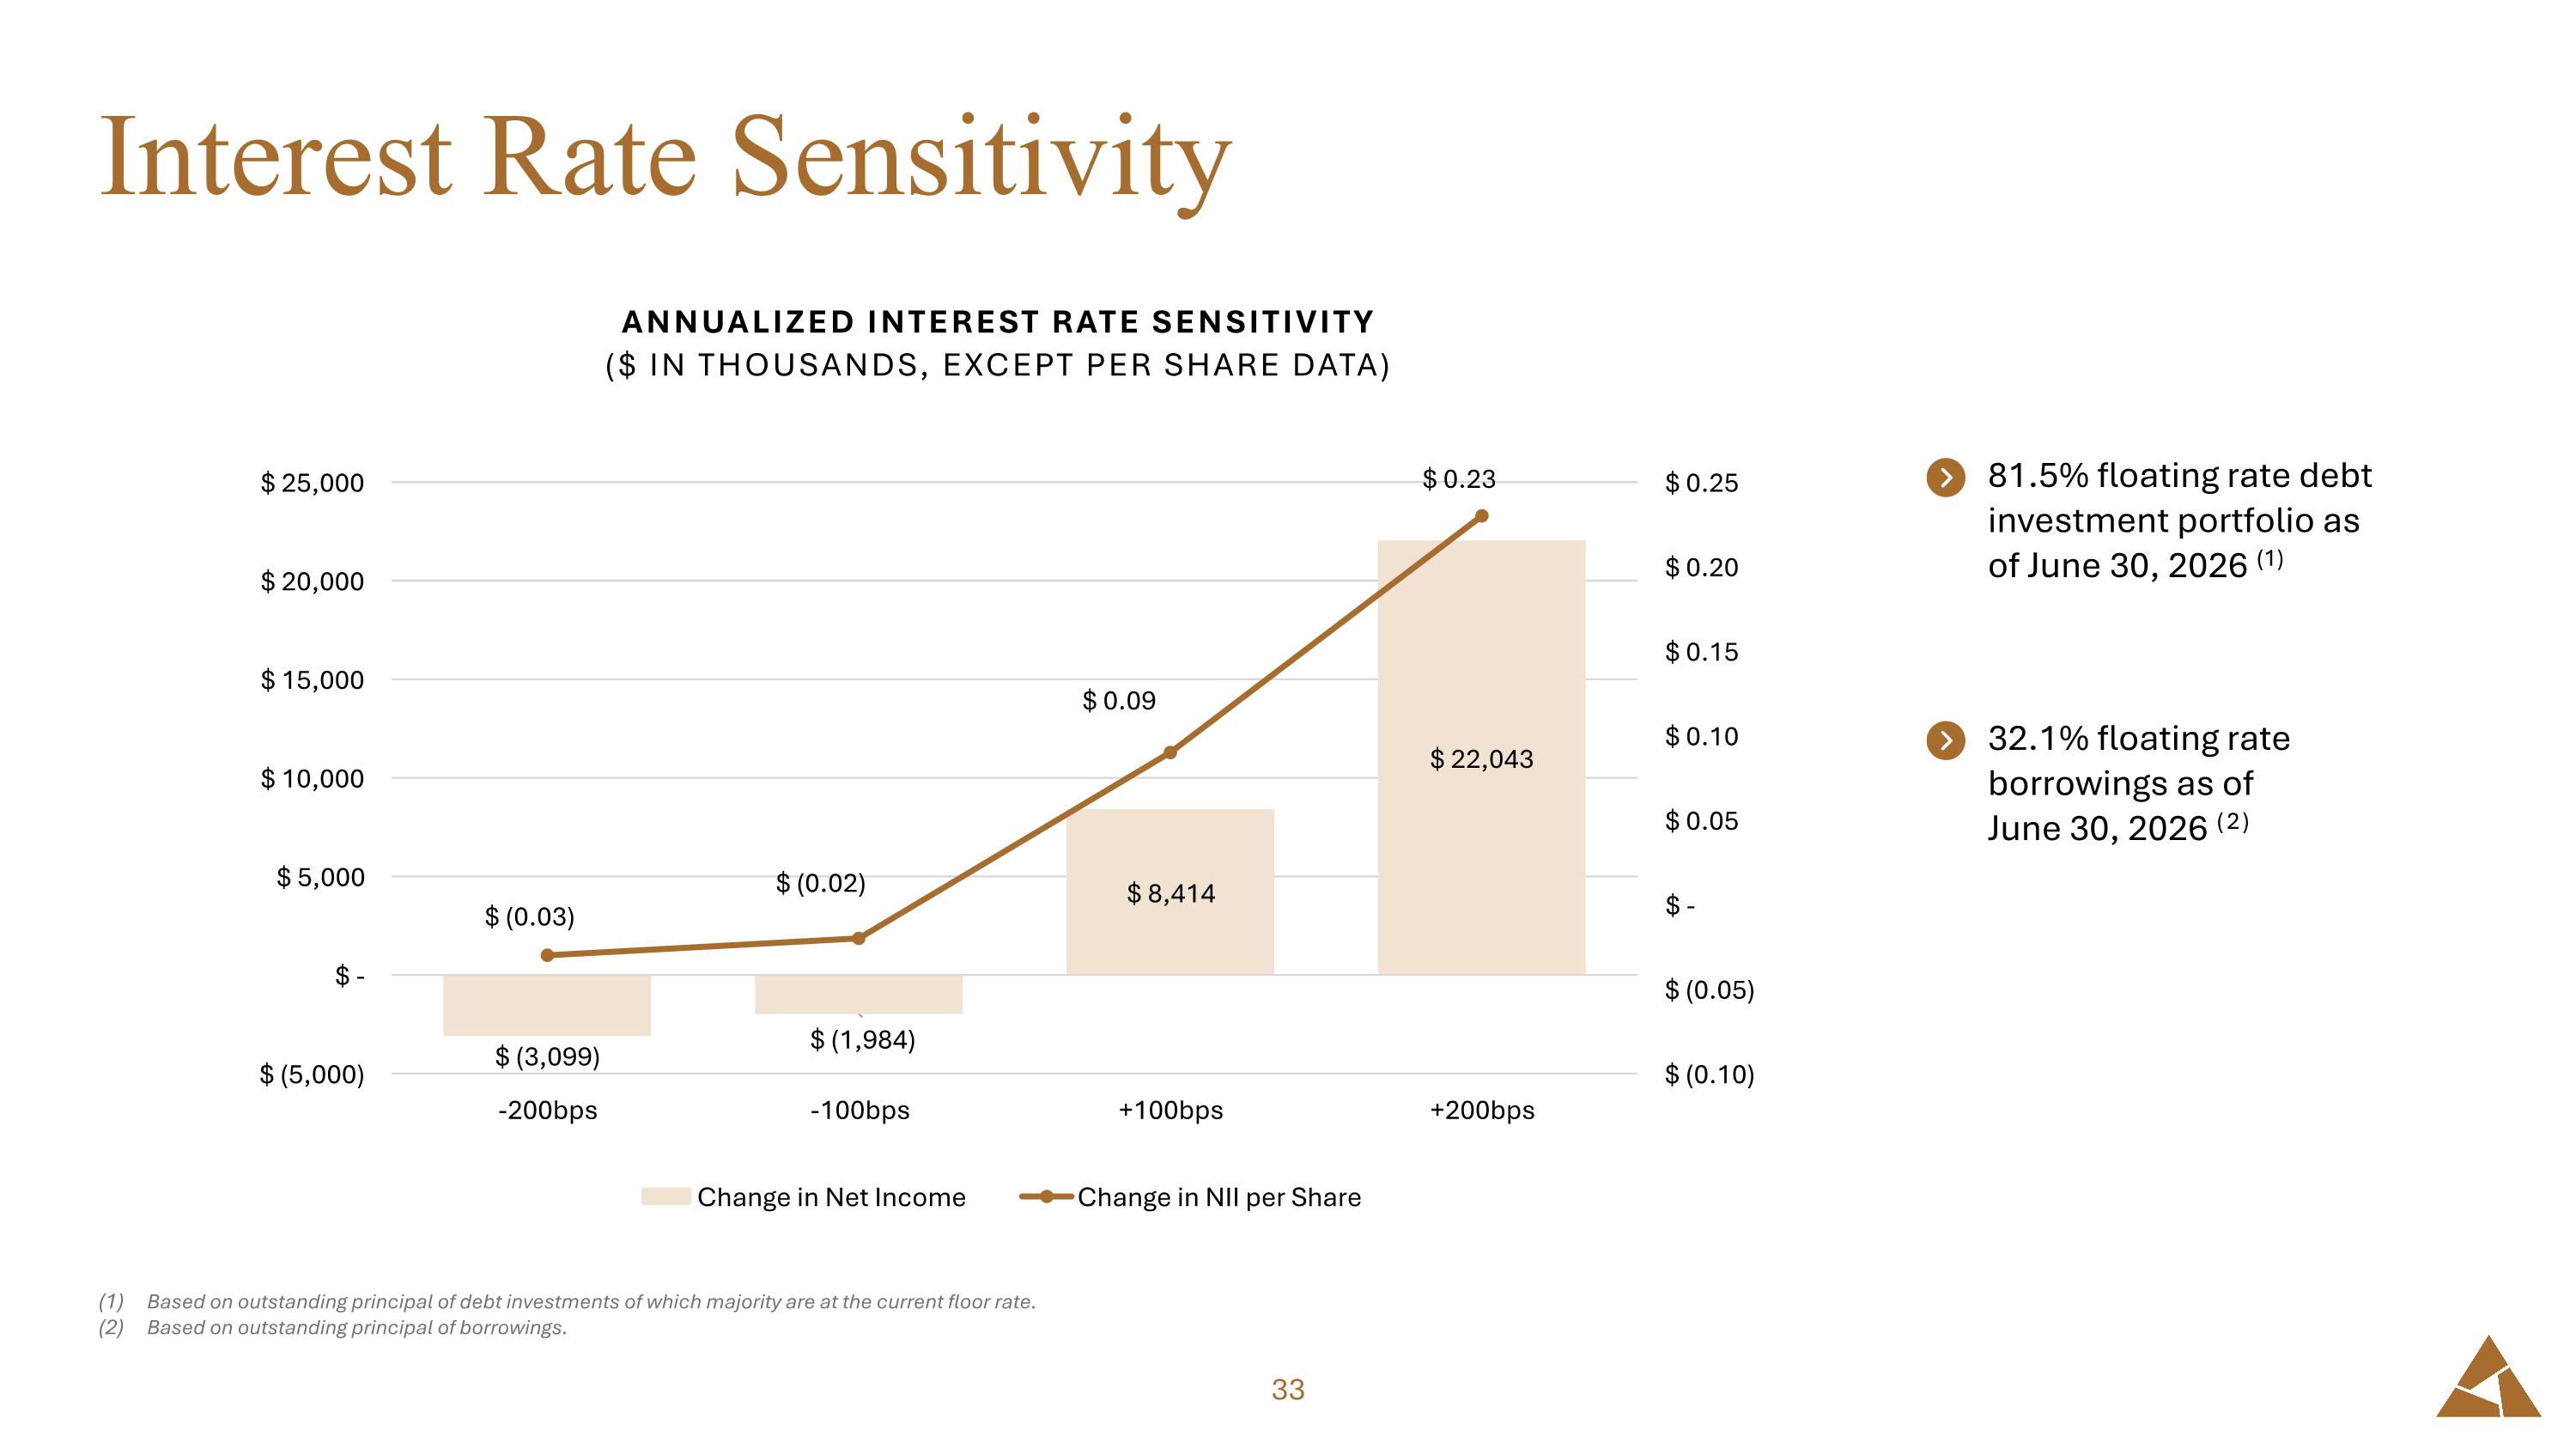
Interest Rate Sensitivity Based on outstanding principal of debt investments of which majority are at the current floor rate. Based on outstanding principal of borrowings. 81.5% floating rate debt investment portfolio as of June 30, 2026 (1) 32.1% floating rate borrowings as of June 30, 2026 (2)
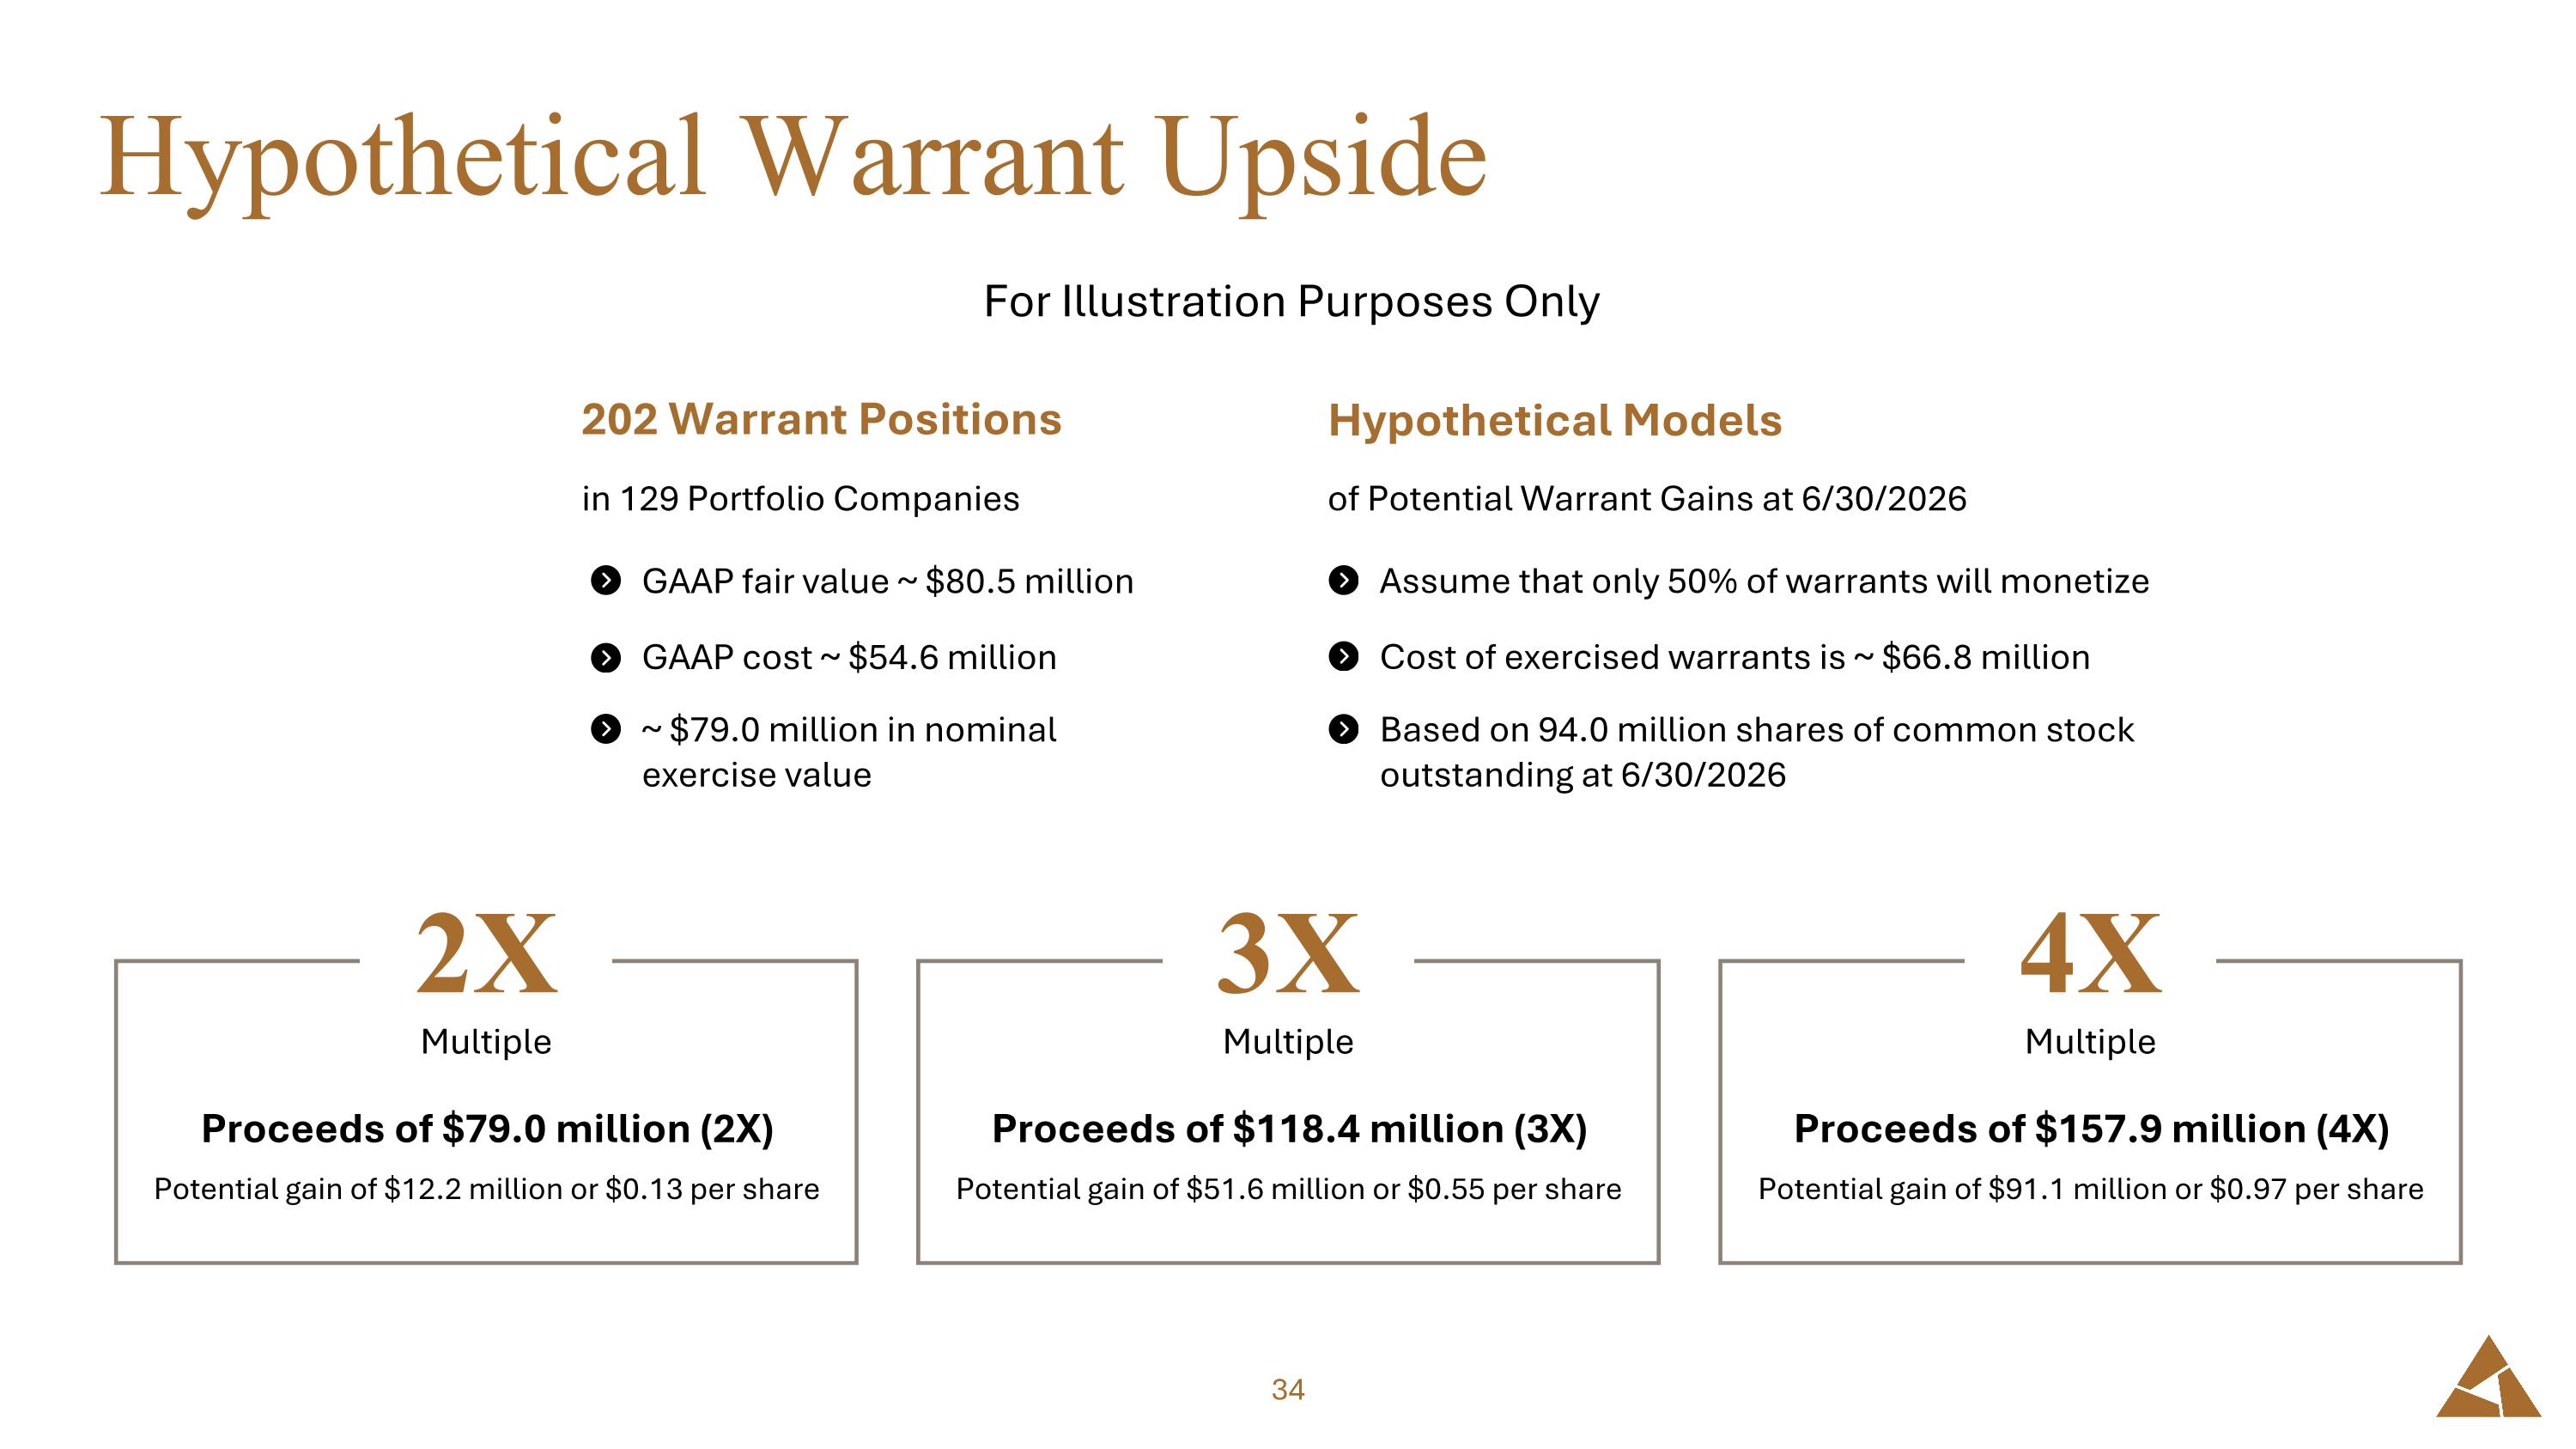
Hypothetical Warrant Upside For Illustration Purposes Only GAAP fair value ~ $80.5 million GAAP cost ~ $54.6 million ~ $79.0 million in nominal exercise value 202 Warrant Positions in 129 Portfolio Companies Assume that only 50% of warrants will monetize Cost of exercised warrants is ~ $66.8 million Based on 94.0 million shares of common stock outstanding at 6/30/2026 Hypothetical Models of Potential Warrant Gains at 6/30/2026 Multiple Proceeds of $79.0 million (2X) Potential gain of $12.2 million or $0.13 per share 2X Multiple Proceeds of $118.4 million (3X) Potential gain of $51.6 million or $0.55 per share 3X Multiple Proceeds of $157.9 million (4X) Potential gain of $91.1 million or $0.97 per share 4X
Diversified Portfolio Select List of Current & Historical Investments

Analyst Coverage
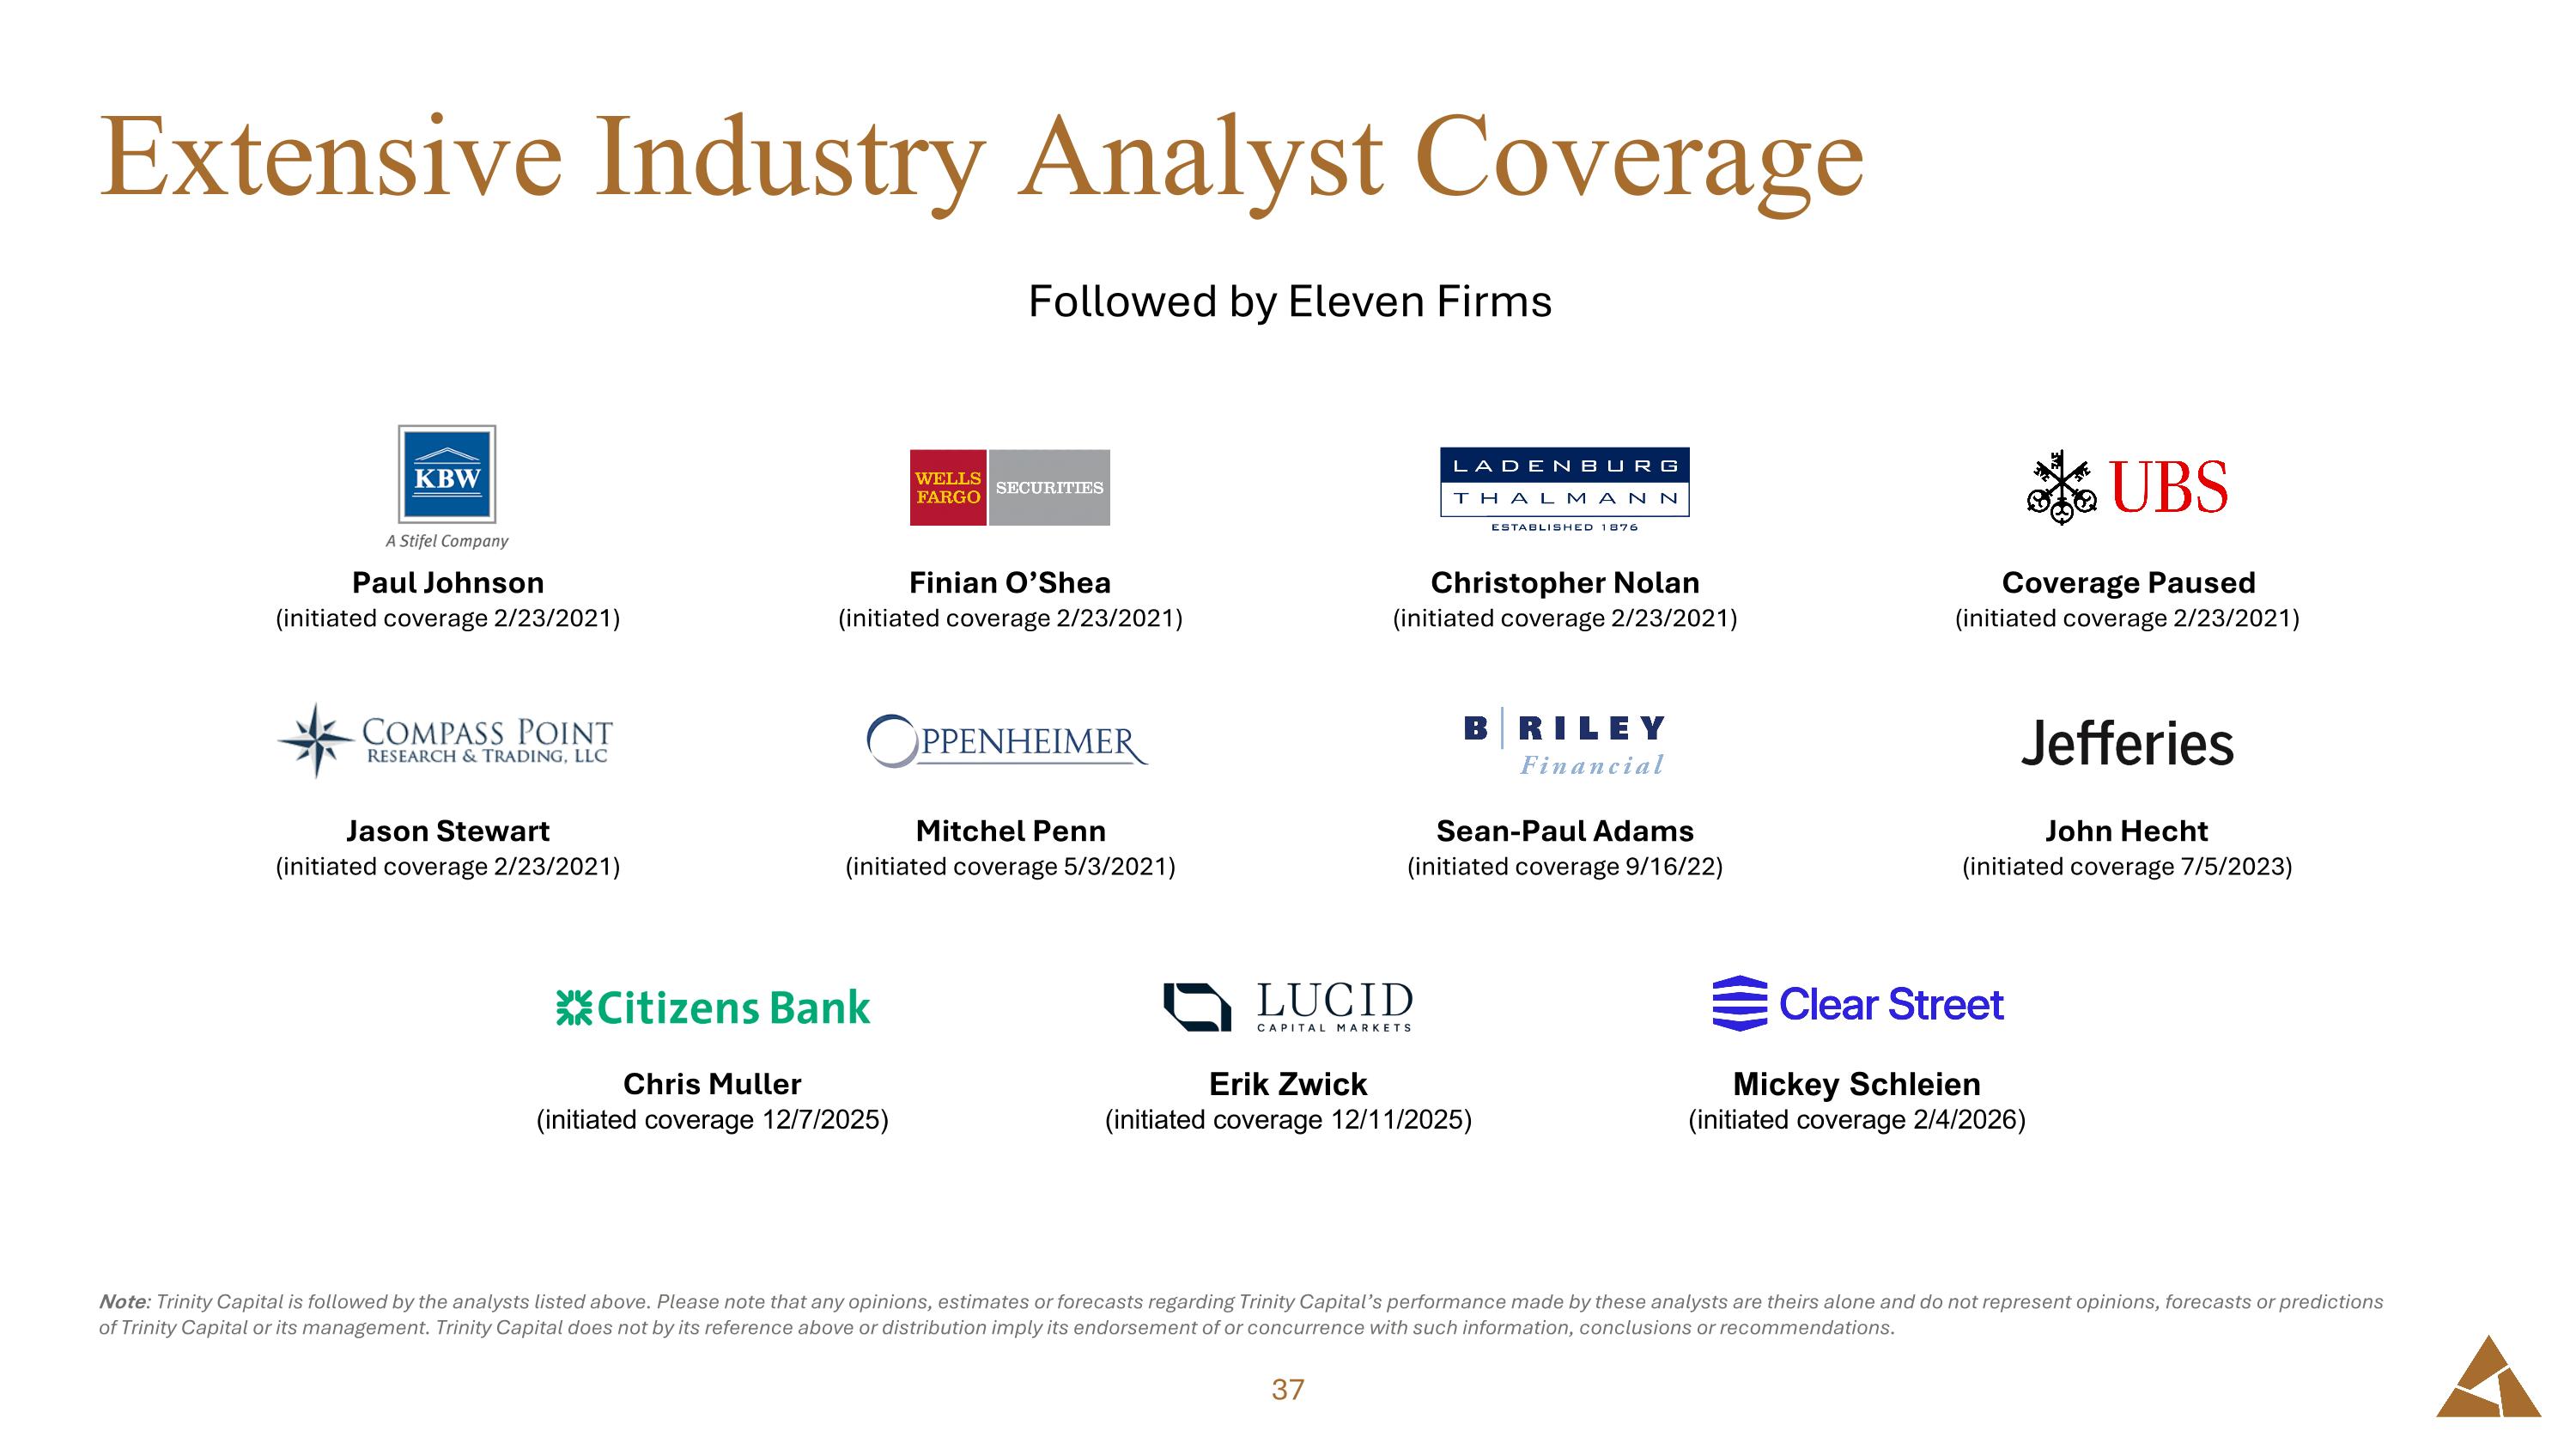
Extensive Industry Analyst Coverage Note: Trinity Capital is followed by the analysts listed above. Please note that any opinions, estimates or forecasts regarding Trinity Capital’s performance made by these analysts are theirs alone and do not represent opinions, forecasts or predictions of Trinity Capital or its management. Trinity Capital does not by its reference above or distribution imply its endorsement of or concurrence with such information, conclusions or recommendations. Christopher Nolan (initiated coverage 2/23/2021) Sean-Paul Adams (initiated coverage 9/16/22) Paul Johnson (initiated coverage 2/23/2021) Jason Stewart (initiated coverage 2/23/2021) Finian O’Shea (initiated coverage 2/23/2021) Mitchel Penn (initiated coverage 5/3/2021) Coverage Paused (initiated coverage 2/23/2021) John Hecht (initiated coverage 7/5/2023) Chris Muller (initiated coverage 12/7/2025) Mickey Schleien (initiated coverage 2/4/2026) Erik Zwick (initiated coverage 12/11/2025) Followed by Eleven Firms

Supplemental Information
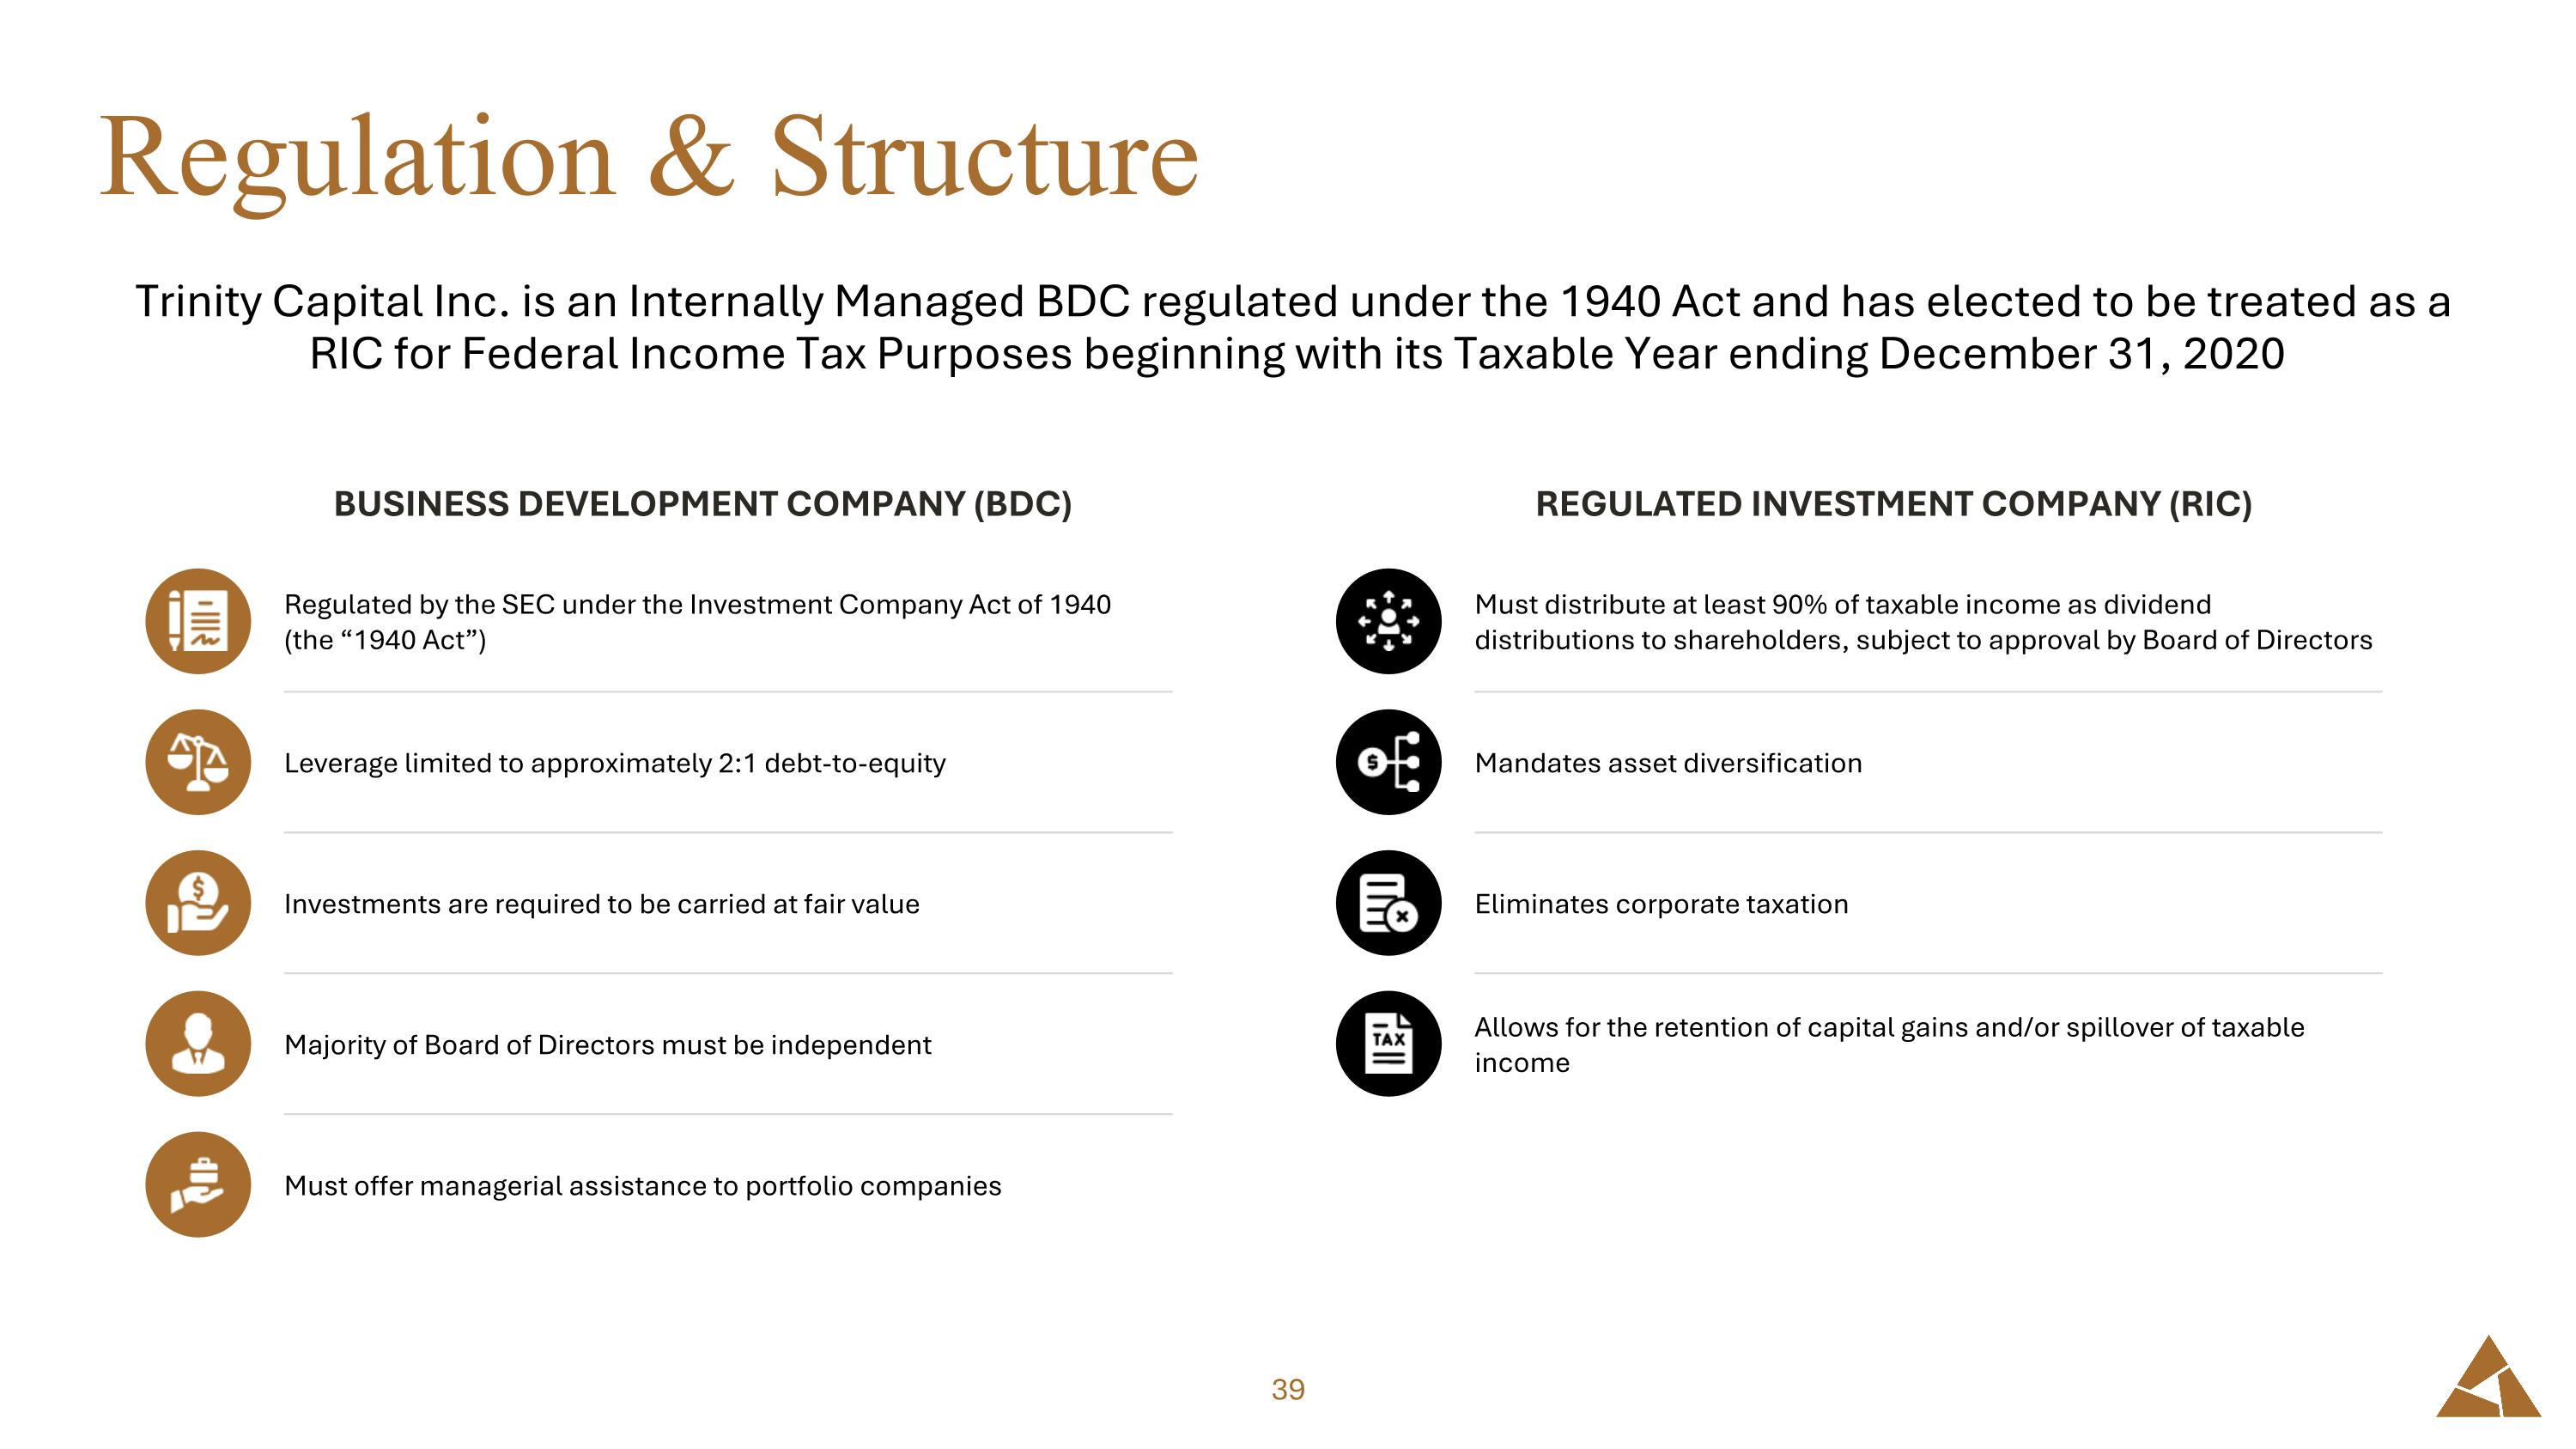
Regulation & Structure Trinity Capital Inc. is an Internally Managed BDC regulated under the 1940 Act and has elected to be treated as a RIC for Federal Income Tax Purposes beginning with its Taxable Year ending December 31, 2020 BUSINESS DEVELOPMENT COMPANY (BDC) REGULATED INVESTMENT COMPANY (RIC) Regulated by the SEC under the Investment Company Act of 1940 (the “1940 Act”) Leverage limited to approximately 2:1 debt-to-equity Investments are required to be carried at fair value Majority of Board of Directors must be independent Must offer managerial assistance to portfolio companies Must distribute at least 90% of taxable income as dividend distributions to shareholders, subject to approval by Board of Directors Mandates asset diversification Eliminates corporate taxation Allows for the retention of capital gains and/or spillover of taxable income