CO PY RI GH T © A BC EL LE RA AUGUST 5, 2026 Q2 2026 BUSINESS UPDATE
These statements involve risks, uncertainties and other factors that may cause actual results, levels of activity, performance, or achievements to be materially different from the information expressed or implied by these forward-looking statements. These risks, uncertainties, other factors, and definition of our business metrics are described under “Risk Factors,” “Management’s Discussion and Analysis of Financial Condition and Results of Operations” and elsewhere in the documents we file with the Securities and Exchange Commission from time to time. We caution you that forward-looking statements are based on a combination of facts and factors currently known by us and our projections of the future, about which we cannot be certain. As a result, the forward-looking statements may not prove to be accurate. The forward-looking statements in this document represent our views as of the date hereof. We undertake no obligation to update any forward-looking statements for any reason, except as required by law. DISCLAIMER This document contains forward-looking statements, including statements made pursuant to the safe harbor provisions of the Private Securities Litigation Reform Act of 1995. The forward-looking statements are based on management’s beliefs and assumptions and on information currently available to management. All statements contained in this document other than statements of historical fact are forward-looking statements, including statements regarding our ability to develop, commercialize and achieve market acceptance of our current and planned products and services, our research and development efforts, and other matters regarding our business strategies, use of capital, results of operations and financial position, plans, objectives for future operations, and the evaluation of our available liquidity to execute on our strategy (including our ability to access our reimbursement based R&D government contributions). The use of certain data derived from cross-study comparisons are not based on any head-to-head clinical trials. Cross-study comparisons are inherently limited and may suggest misleading similarities and differences and are presented for informational purposes. In some cases, you can identify forward-looking statements by the words “may,” “will,” “could,” “would,” “should,” “expect,” “intend,” “plan,” “anticipate,” “believe,” “estimate,” “predict,” “project,” “potential,” “continue,” “ongoing” or the negative of these terms or other comparable terminology, although not all forward-looking statements contain these words. 2 CO PY RI GH T © A BC EL LE RA Q2 2 02 6 B us in es s U pd at e
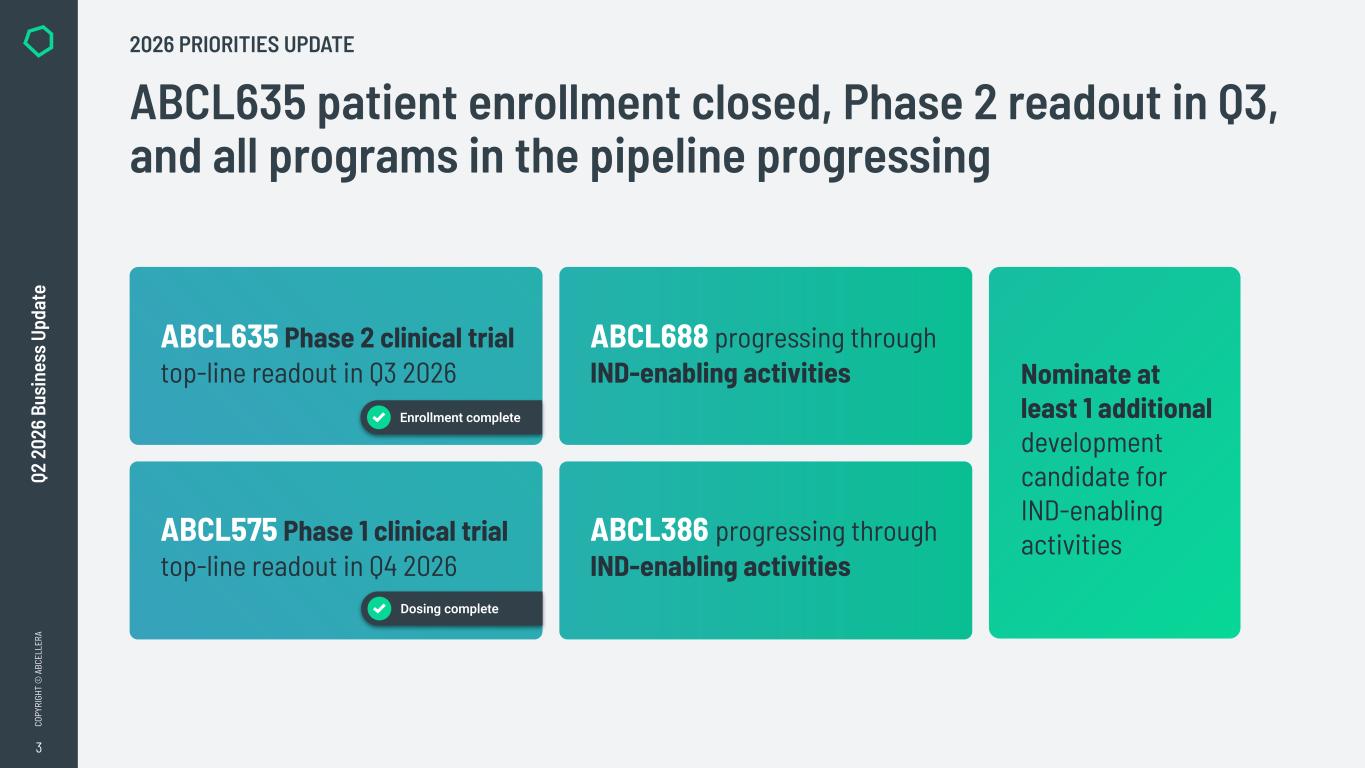
3 CO PY RI GH T © A BC EL LE RA Q2 2 02 6 Bu si ne ss U pd at e ABCL635 patient enrollment closed, Phase 2 readout in Q3, and all programs in the pipeline progressing 2026 PRIORITIES UPDATE Nominate at least 1 additional development candidate for IND-enabling activities ABCL635 Phase 2 clinical trial top-line readout in Q3 2026 ABCL575 Phase 1 clinical trial top-line readout in Q4 2026 ABCL688 progressing through IND-enabling activities ABCL386 progressing through IND-enabling activities Enrollment complete Dosing complete
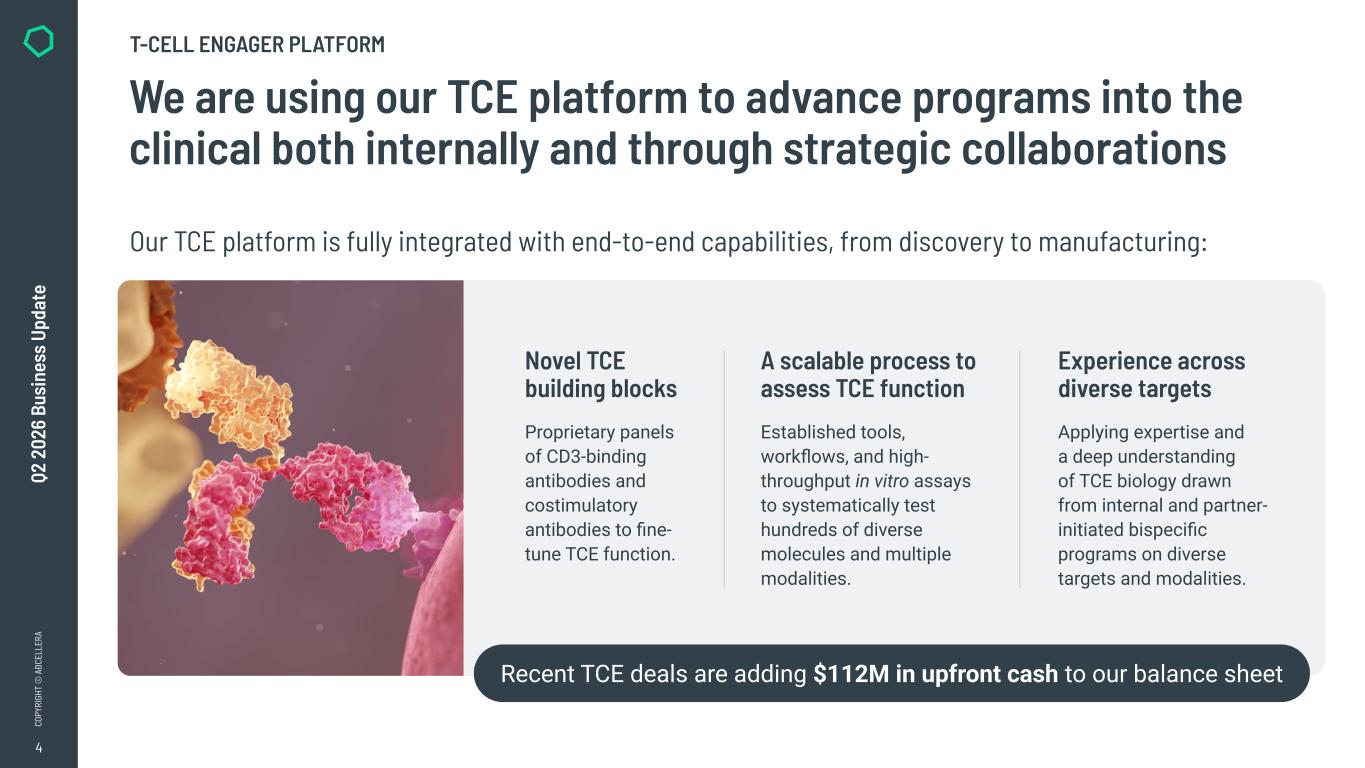
4 CO PY RI GH T © A BC EL LE RA Q2 2 02 6 Bu si ne ss U pd at e We are using our TCE platform to advance programs into the clinical both internally and through strategic collaborations Novel TCE building blocks Proprietary panels of CD3-binding antibodies and costimulatory antibodies to fine- tune TCE function. A scalable process to assess TCE function Established tools, workflows, and high- throughput in vitro assays to systematically test hundreds of diverse molecules and multiple modalities. Experience across diverse targets Applying expertise and a deep understanding of TCE biology drawn from internal and partner- initiated bispecific programs on diverse targets and modalities. 2x1 T-CELL ENGAGER PLATFORM Our TCE platform is fully integrated with end-to-end capabilities, from discovery to manufacturing: Recent TCE deals are adding $112M in upfront cash to our balance sheet
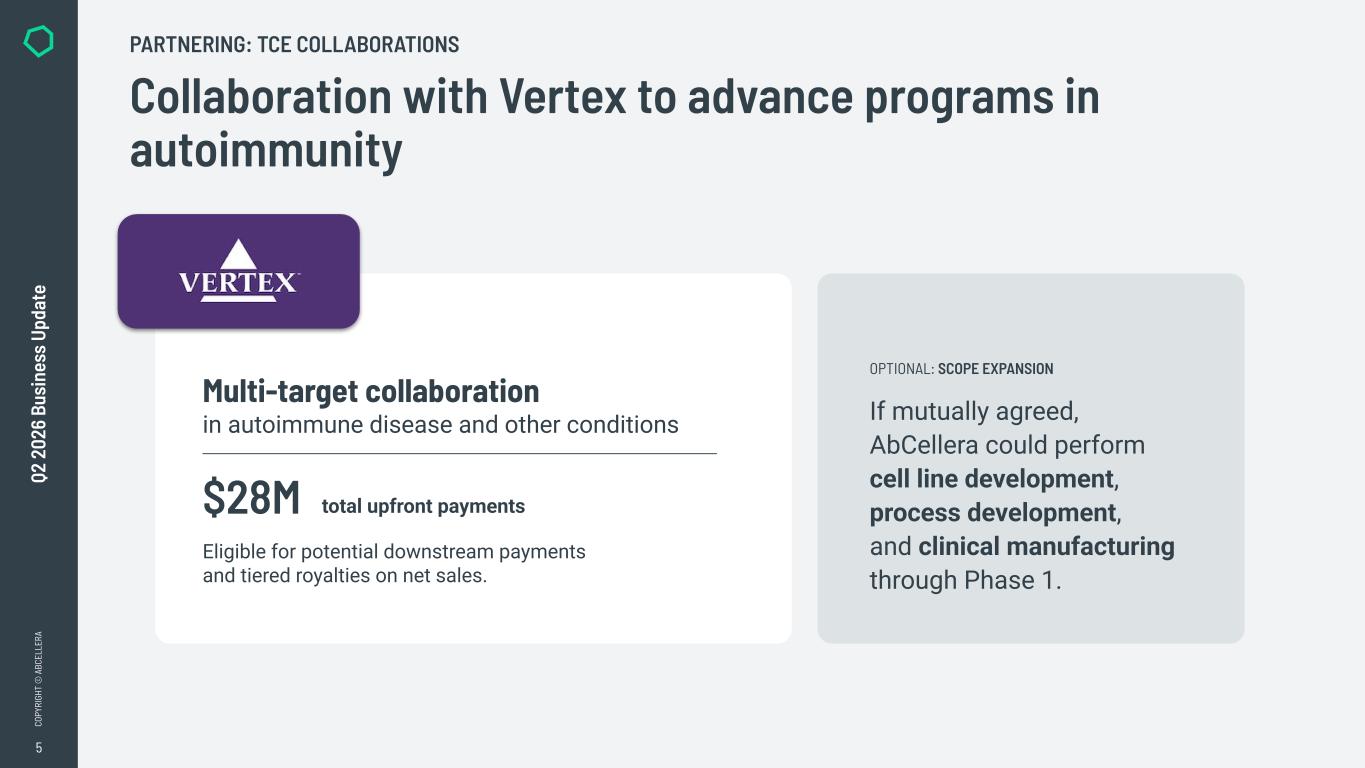
5 CO PY RI GH T © A BC EL LE RA Q2 2 02 6 Bu si ne ss U pd at e Collaboration with Vertex to advance programs in autoimmunity PARTNERING: TCE COLLABORATIONS Multi-target collaboration in autoimmune disease and other conditions $28M Eligible for potential downstream payments and tiered royalties on net sales. total upfront payments OPTIONAL: SCOPE EXPANSION If mutually agreed, AbCellera could perform cell line development, process development, and clinical manufacturing through Phase 1.
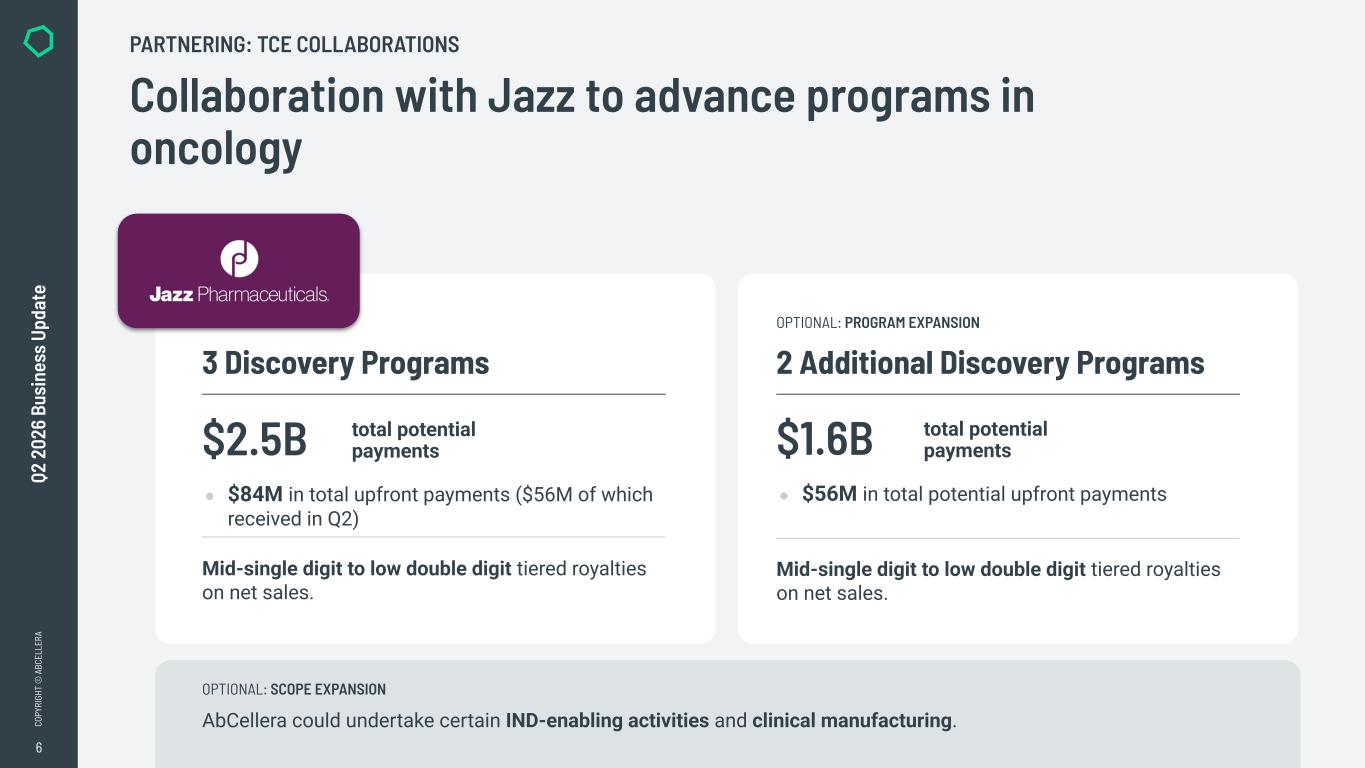
6 CO PY RI GH T © A BC EL LE RA Q2 2 02 6 Bu si ne ss U pd at e Collaboration with Jazz to advance programs in oncology PARTNERING: TCE COLLABORATIONS 3 Discovery Programs OPTIONAL: PROGRAM EXPANSION 2 Additional Discovery Programs $2.5B ● $84M in total upfront payments ($56M of which received in Q2) Mid-single digit to low double digit tiered royalties on net sales. total potential payments $1.6B ● $56M in total potential upfront payments Mid-single digit to low double digit tiered royalties on net sales. total potential payments AbCellera could undertake certain IND-enabling activities and clinical manufacturing. OPTIONAL: SCOPE EXPANSION
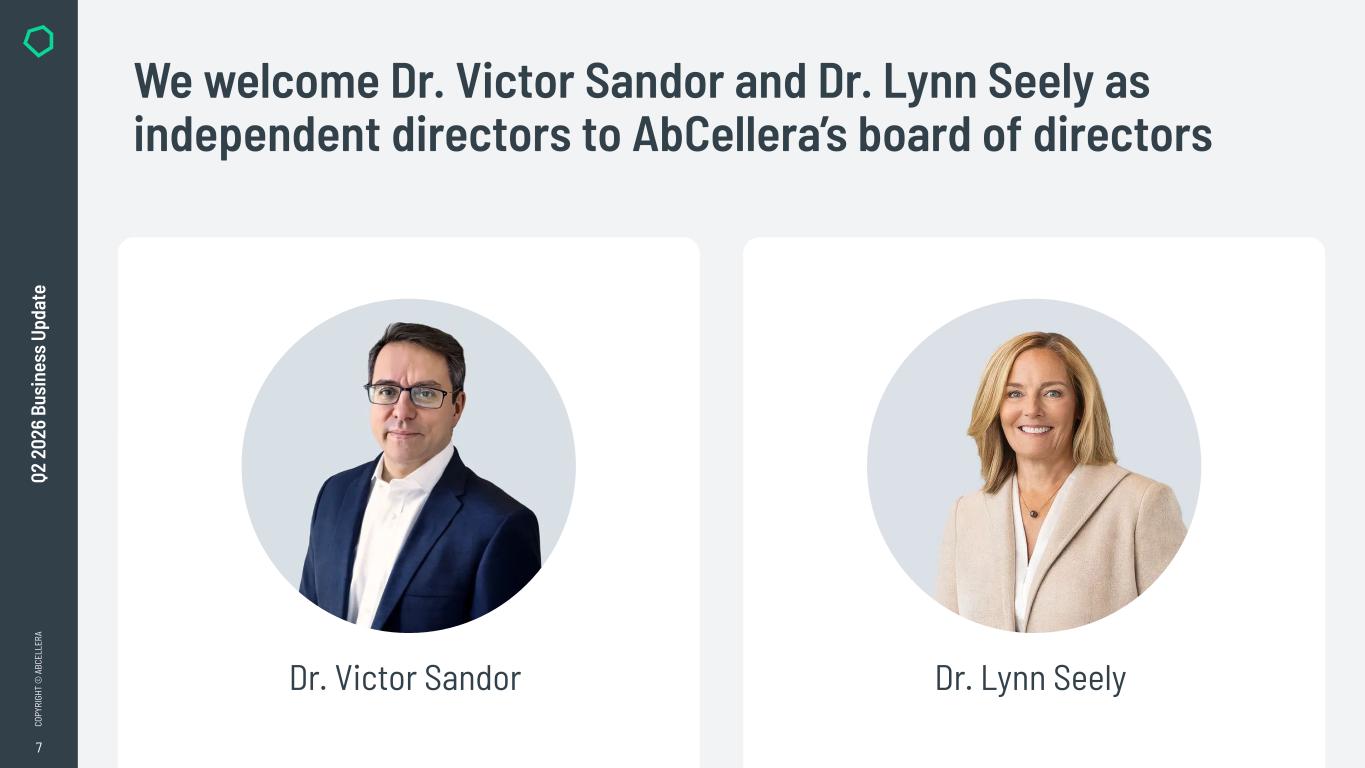
7 CO PY RI GH T © A BC EL LE RA Q2 2 02 6 Bu si ne ss U pd at e We welcome Dr. Victor Sandor and Dr. Lynn Seely as independent directors to AbCellera’s board of directors Dr. Victor Sandor Dr. Lynn Seely

8 CO PY RI GH T © A BC EL LE RA Q2 2 02 6 Bu si ne ss U pd at e Q2 2026 FINANCIALS UPDATE
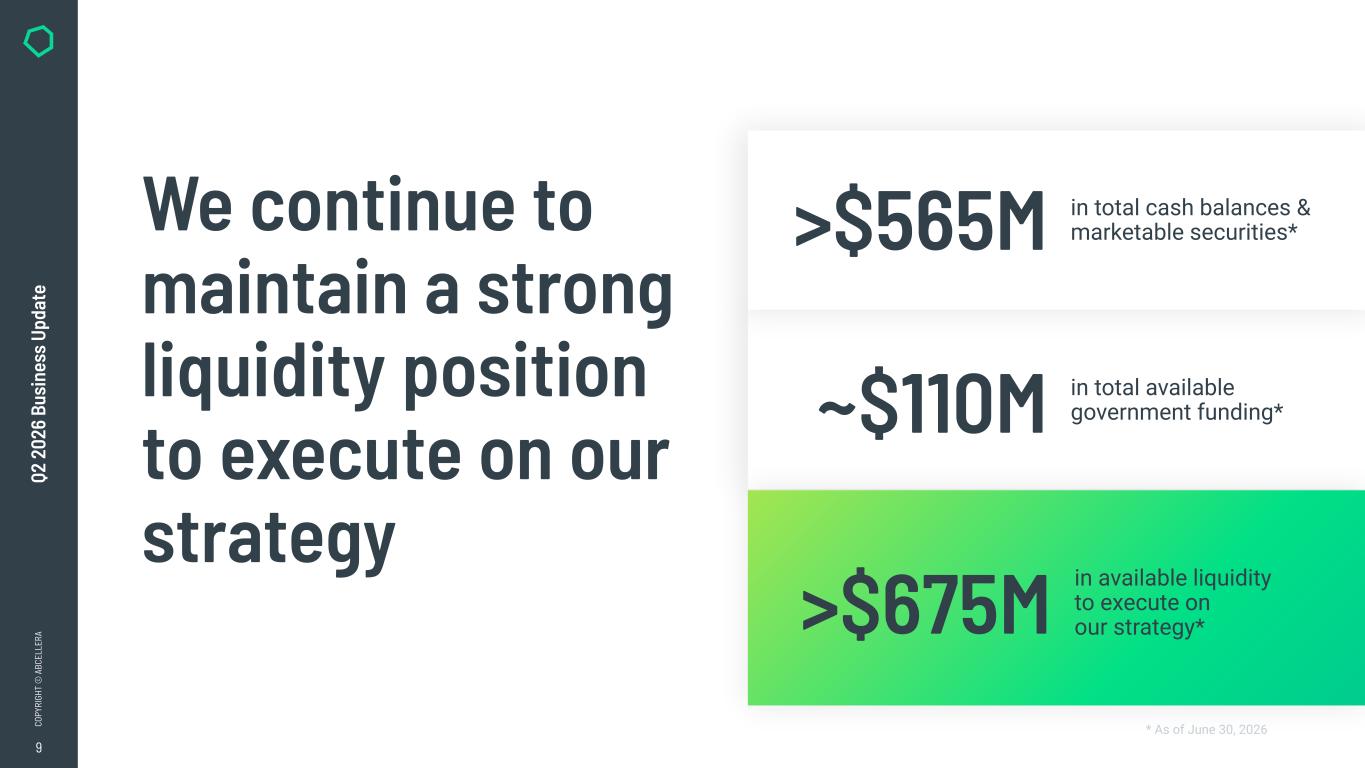
9 CO PY RI GH T © A BC EL LE RA Q2 2 02 6 Bu si ne ss U pd at e We continue to maintain a strong liquidity position to execute on our strategy * As of June 30, 2026 in total available government funding*~$110M in total cash balances & marketable securities*>$565M in available liquidity to execute on our strategy*>$675M
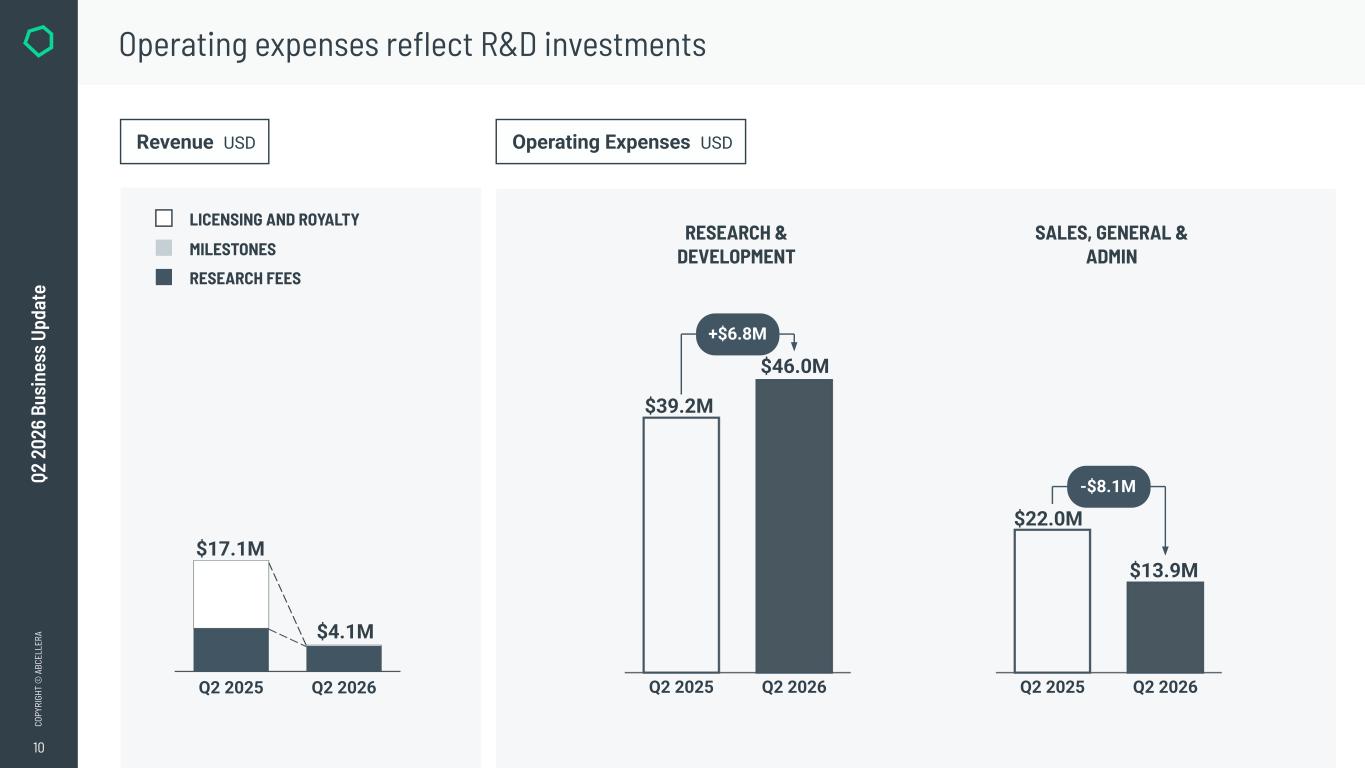
10 CO PY RI GH T © A BC EL LE RA Q2 2 02 6 Bu si ne ss U pd at e RESEARCH & DEVELOPMENT SALES, GENERAL & ADMIN Operating expenses reflect R&D investments Operating Expenses USDRevenue USD MILESTONES RESEARCH FEES LICENSING AND ROYALTY Q2 2025 Q2 2026 $17.1M $4.1M Q2 2025 Q2 2026 $39.2M $46.0M +$6.8M Q2 2025 Q2 2026 $22.0M $13.9M -$8.1M
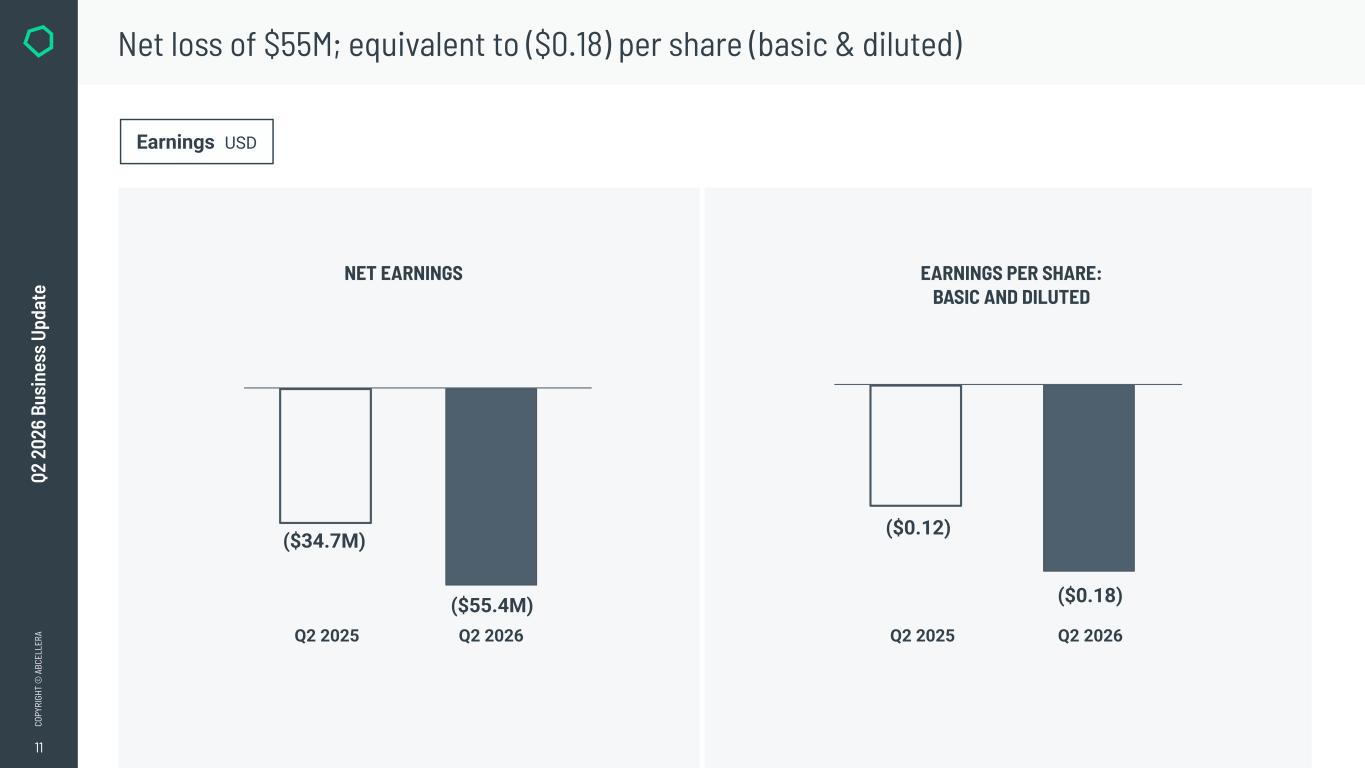
11 CO PY RI GH T © A BC EL LE RA Q2 2 02 6 Bu si ne ss U pd at e Net loss of $55M; equivalent to ($0.18) per share (basic & diluted) Earnings USD NET EARNINGS EARNINGS PER SHARE: BASIC AND DILUTED Q2 2025 Q2 2026 ($34.7M) ($55.4M) Q2 2025 Q2 2026 ($0.12) ($0.18)
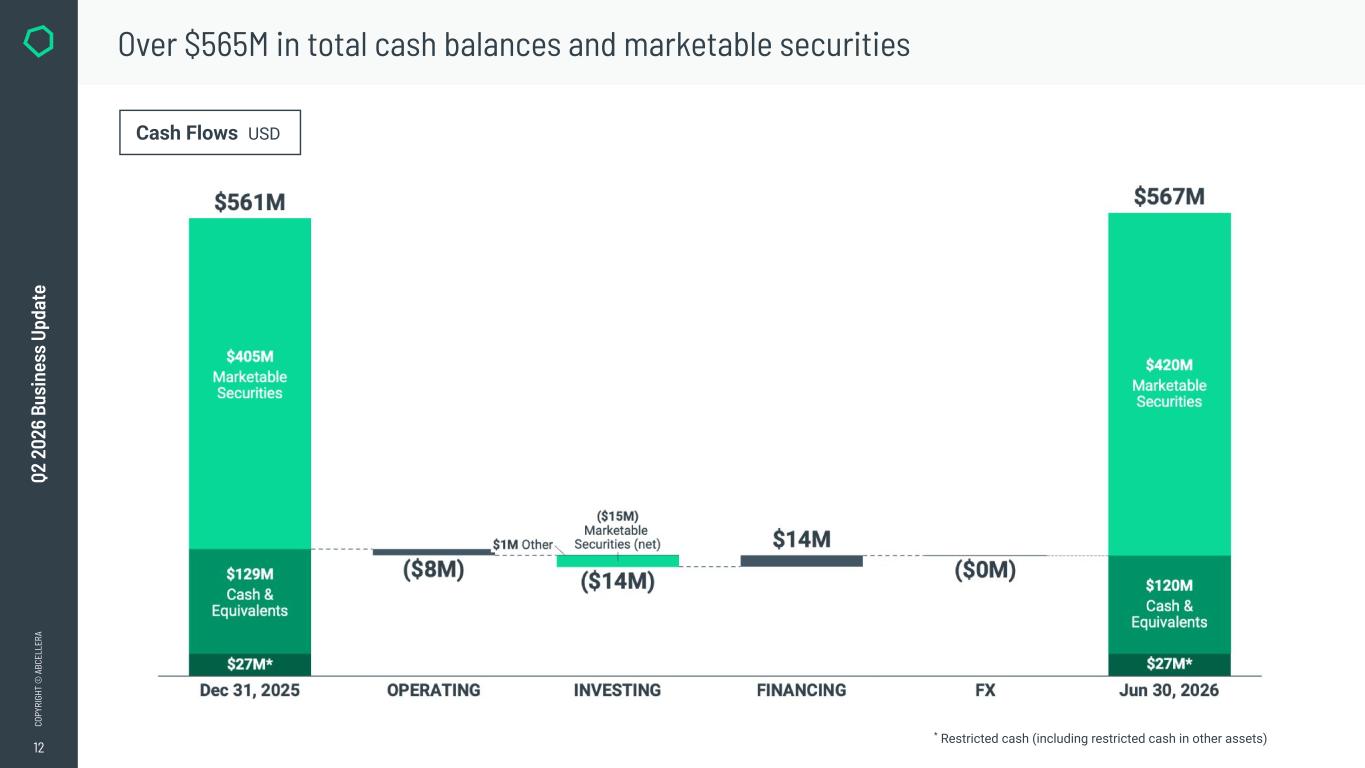
12 CO PY RI GH T © A BC EL LE RA Q2 2 02 6 Bu si ne ss U pd at e Over $565M in total cash balances and marketable securities Cash Flows USD * Restricted cash (including restricted cash in other assets)

13 CO PY RI GH T © A BC EL LE RA Q2 2 02 6 Bu si ne ss U pd at e THANK YOU