
Q2’26 Earnings August 5th, 2026
Disclaimer Forward-Looking Statements Advantage Solutions Inc. (the “Company”) is a provider of outsourced solutions to consumer packaged goods (“CPG”)_brands and retailers. The Company’s Class A common stock is listed on the Nasdaq Global Select Market under the symbol “ADV.” Certain statements in this presentation may be considered forward-looking statements within the meaning of the federal securities laws, including statements regarding the expected future performance of Advantage's business and projected financial results. Forward-looking statements generally relate to future events or Advantage’s future financial or operating performance. These forward-looking statements generally are identified by the words “may”, “should”, “expect”, “intend”, “will”, “would”, “could”, “estimate”, “anticipate”, “believe”, “predict”, “confident”, “potential”, “guidance”, or “continue”, or the negatives of these terms or variations of them or similar terminology. Such forward-looking statements are predictions, projections, and other statements about future events that are based on current expectations and assumptions and, as a result, are subject to risks, uncertainties, and other factors which could cause actual results to differ materially from those expressed or implied by such forward looking statements. These forward-looking statements are based upon estimates and assumptions that, while considered reasonable by Advantage and its management at the time of such statements, are inherently uncertain. Factors that may cause actual results to differ materially from current expectations include, but are not limited to, market-driven wage changes or changes to labor laws or wage or job classification regulations, including minimum wage; developments with respect to retailers that are out of our control; the impact from tariffs; Advantage’s ability to continue to generate significant operating cash flow; client procurement strategies and consolidation of Advantage’s clients’ industries creating pressure on the nature and pricing of its services; consumer goods manufacturers and retailers reviewing and changing their sales, retail, marketing, and technology programs and relationships; Advantage’s ability to successfully develop and maintain relevant omni-channel services for our clients in an evolving industry and to otherwise adapt to significant technological change; a future pandemic or health epidemic; Advantage’s ability to maintain proper and effective internal control over financial reporting in the future; Advantage’s substantial indebtedness and our ability to refinance at favorable rates; and other risks and uncertainties set forth in the section titled “Risk Factors” in the Annual Report on Form 10-K filed by Advantage with the Securities and Exchange Commission (the “SEC”) on March 3, 2026, and in its other filings made from time to time with the SEC. These filings identify and address other important risks and uncertainties that could cause actual events and results to differ materially from those contained in the forward-looking statements. Forward-looking statements speak only as of the date they are made. Readers are cautioned not to put undue reliance on forward-looking statements, and Advantage assumes no obligation and does not intend to update or revise these forward-looking statements, whether as a result of new information, future events or otherwise, except as required by law. Non-GAAP Financial Measures and Related Information This presentation includes certain financial measures not presented in accordance with generally accepted accounting principles (“GAAP”), Adjusted EBITDA, Adjusted EBITDA by Segment, Adjusted EBITDA margin, Revenues net of reimbursable expenses, Net Debt, Adjusted Unlevered Free Cash Flow, and Adjusted Unlevered Free Cash Flow and net debt as a percentage of Last Twelve Months (“LTM”) Adjusted EBITDA. These are not measures of financial performance calculated in accordance with GAAP and may exclude items that are significant in understanding and assessing Advantage’s financial results. Therefore, the measures are in addition to, and not a substitute for or superior to, measures of financial performance prepared in accordance with GAAP, and should not be considered in isolation or as an alternative to net income, cash flows from operations or other measures of profitability, liquidity or performance under GAAP. You should be aware that Advantage’s presentation of these measures may not be comparable to similarly-titled measures used by other companies. Reconciliations of historical non-GAAP measures to their most directly comparable GAAP counterparts are included in this document. Advantage believes these non-GAAP measures provide useful information to management and investors regarding certain financial and business trends relating to Advantage’s financial condition and results of operations. Advantage believes that the use of Adjusted EBITDA by Segment, Adjusted Unlevered Free Cash Flow, and Net Debt provide an additional tool for investors to use in evaluating ongoing operating results and trends and in comparing Advantage’s financial measures with other similar companies, many of which present similar non-GAAP financial measures to investors. Non-GAAP financial measures are subject to inherent limitations as they reflect the exercise of judgments by management about which expense and income are excluded or included in determining these non-GAAP financial measures. Additionally, other companies may calculate non-GAAP measures differently, or may use other measures to calculate their financial performance, and therefore Advantage’s non-GAAP measures may not be directly comparable to similarly titled measures of other companies. Adjusted EBITDA consists of net (loss) income before interest, taxes, depreciation and amortization, further adjusted for (i) non-operating income or expense and (ii) the impact of certain non-cash, nonrecurring or other items included in net (loss) income that we do not consider indicative of our ongoing operating performance, which may include acquisition and divestiture related expenses, gains and losses; gains and losses on extinguishments of debt; litigation expenses, net of recoveries on matters not representative of our ongoing business; impairment charges on goodwill, intangible assets and non-marketable securities; incremental expenses on restructuring and reorganization activities associated with certain transformation programs; further adjusted for the related income tax impact associated with these items. A full listing of adjustments to net (loss) income are provided elsewhere in this document. Adjusted EBITDA by Segment consists of operating income (loss) by segment before interest, taxes, depreciation and amortization, further adjusted for the impact of certain non-cash, nonrecurring or other items included in net (loss) income that we do not consider indicative of our ongoing operating performance, which may include acquisition and divestiture related expenses, gains and losses; gains and losses on extinguishments of debt; litigation expenses, net of recoveries on matters not representative of our ongoing business; impairment charges on goodwill, intangible assets and non-marketable securities; incremental expenses on restructuring and reorganization activities associated with certain transformation programs; further adjusted for the related income tax impact associated with these items. A full listing of adjustments to operating are provided elsewhere in this document. Adjusted EBITDA Margin means Adjusted EBITDA divided by net revenues. Revenues net of reimbursable expenses ("net revenues") and by segment means revenues less reimbursable expenses that are paid by Advantage's clients, including media, product samples, retailer fees, and other marketing and production costs. Net Debt represents the sum of current portion of long-term debt and long-term debt, less cash and cash equivalents. With respect to Net Debt, cash and cash equivalents are subtracted from the GAAP measure, total debt, because they could be used to reduce the debt obligations. We present Net Debt because we believe this non-GAAP measure provides useful information to management and investors regarding certain financial and business trends relating to the Company’s financial condition and to evaluate changes to the Company's capital structure and credit quality assessment. Adjusted Unlevered Free Cash Flow represents net cash provided by (used in) operating activities less purchase of property and equipment as disclosed in the Statements of Cash Flows further adjusted by (i) cash payments for interest, (ii) cash received from interest rate derivatives, (iii) cash paid for income taxes; (iv) cash paid for acquisition and divestiture related expenses, (v) cash paid for restructuring expenses, (vi) cash paid for reorganization expenses, (vii) cash paid for contingent earnout payments included in operating cash flow, (viii) COVID-19 benefits received, (ix) net effect of foreign currency fluctuations on cash, and (x) other adjustments that management believes are helpful in evaluating our operating performance. Adjusted Unlevered Free Cash Flow as a percentage of Adjusted EBITDA means Adjusted Unlevered Free Cash Flow divided by Adjusted EBITDA. Due to rounding, numbers presented throughout this document may not add up precisely to the totals provided and percentages may not precisely reflect the absolute figures. 2
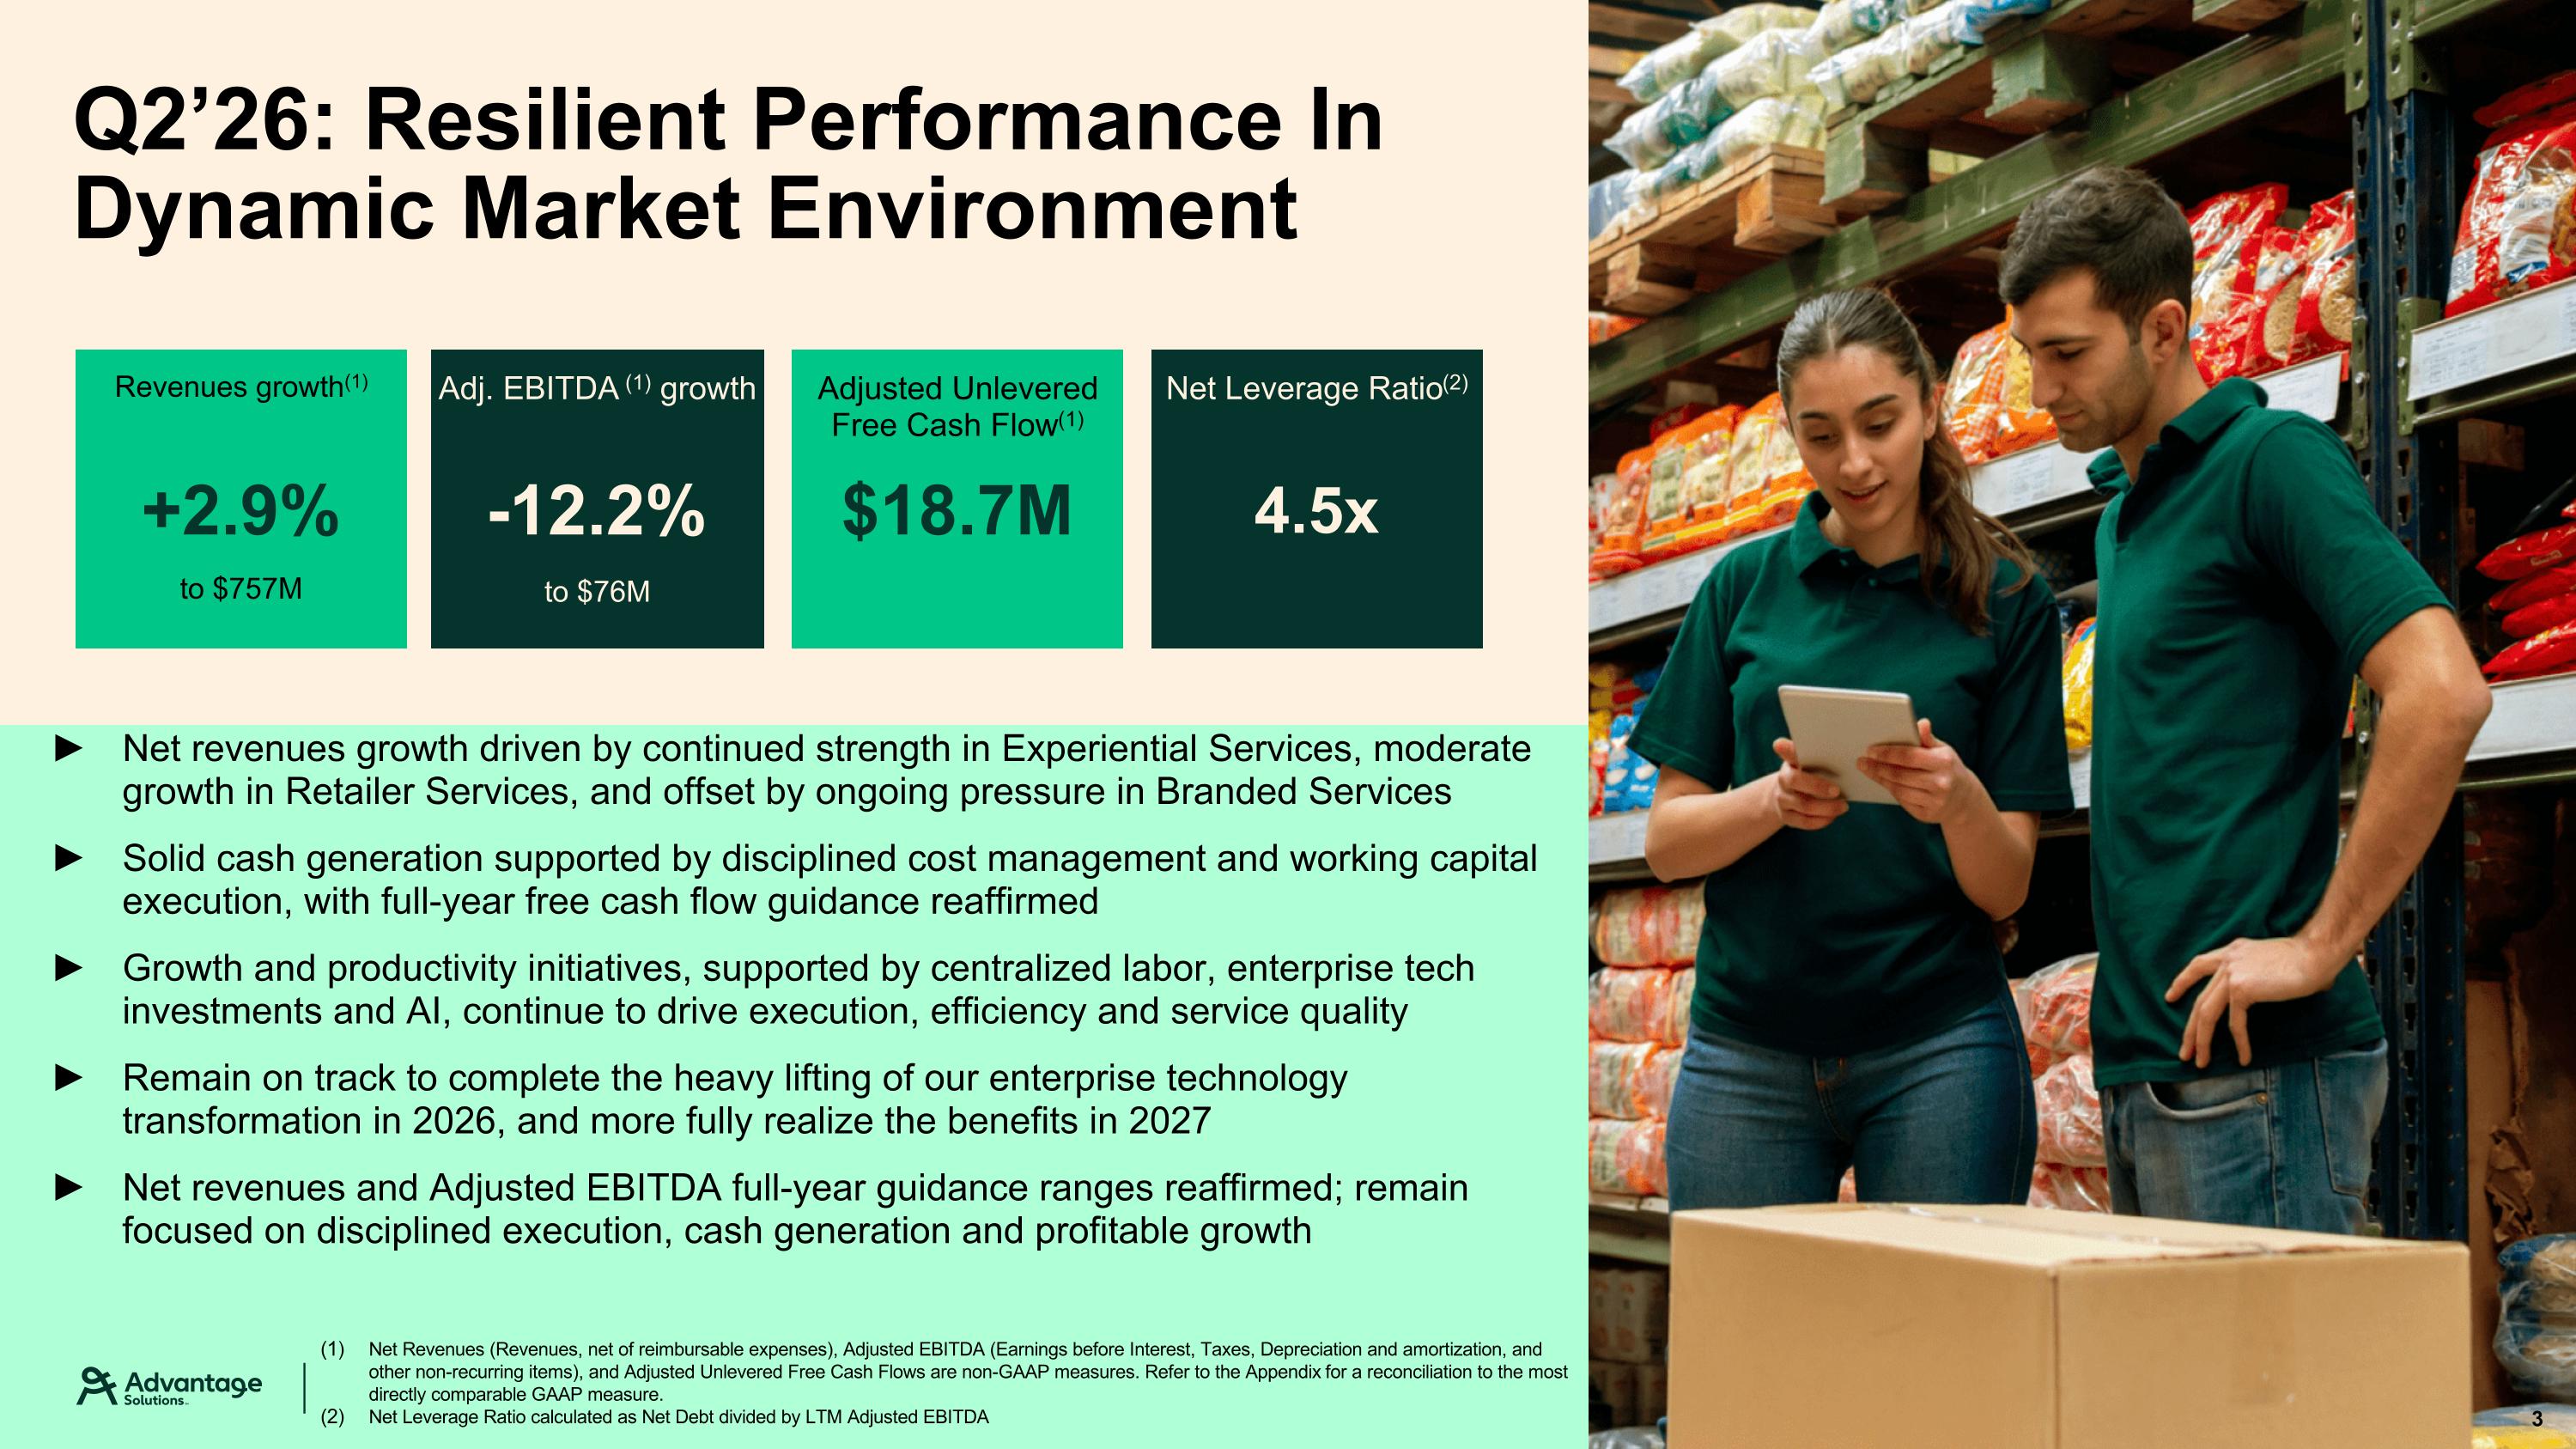
Q2’26: Resilient Performance In Dynamic Market Environment Net revenues growth driven by continued strength in Experiential Services, moderate growth in Retailer Services, and offset by ongoing pressure in Branded Services Solid cash generation supported by disciplined cost management and working capital execution, with full-year free cash flow guidance reaffirmed Growth and productivity initiatives, supported by centralized labor, enterprise tech investments and AI, continue to drive execution, efficiency and service quality Remain on track to complete the heavy lifting of our enterprise technology transformation in 2026, and more fully realize the benefits in 2027 Net revenues and Adjusted EBITDA full-year guidance ranges reaffirmed; remain focused on disciplined execution, cash generation and profitable growth Revenues growth(1) to $757M +2.9% Adj. EBITDA (1) growth to $76M -12.2% Adjusted Unlevered Free Cash Flow(1) $18.7M Net Leverage Ratio(2) 4.5x Net Revenues (Revenues, net of reimbursable expenses), Adjusted EBITDA (Earnings before Interest, Taxes, Depreciation and amortization, and other non-recurring items), and Adjusted Unlevered Free Cash Flows are non-GAAP measures. Refer to the Appendix for a reconciliation to the most directly comparable GAAP measure. Net Leverage Ratio calculated as Net Debt divided by LTM Adjusted EBITDA 3
Disciplined execution of growth and productivity initiatives positions the business for consistent and profitable growth Continued Focus On Growth and Productivity Initiatives For Long Term Value Creation 4 Growth Initiatives Supporting Demand, Scale and Client Value Experiential demand continues to accelerate, with opportunities to expand event volumes across existing clients and support new vendor launches Increasing focus on scalable merchandising programs that deepen client relationships and expand service penetration Pulse™ is improving visibility into on-shelf availability, item velocity and distribution gaps, enabling more targeted field execution Clients continue prioritizing measurable ROI, creating opportunities to expand programs that drive trial, discovery and conversion Productivity Initiatives Driving Execution, Efficiency and Margins Centralized labor planning continues to improve workforce visibility, staffing flexibility and execution quality Enterprise technology transformation continues strengthening data integrity, process discipline and operating visibility across the business Established enterprise AI governance and strategic partnerships to accelerate practical AI adoption, including in recruiting, onboarding, compliance and resource deployment. Expect to increasingly realize the operational and financial benefits of these technology investments beginning in 2027
Business Segment Updates Retailer Services Branded Services Experiential Services More gradual recovery expected as constrained CPG spending, insourcing and select client losses pressure the business Focused on stabilizing revenues with client retention, greater client engagement, and pipeline conversion CPG merchandising projects were a relative bright spot, providing encouraging signs for future commercial activity Prioritizing measurable ROI through data, analytics and execution while investing in talent Delivered another strong quarter, driven by sustained demo demand, expanding event volumes and strong operational execution Demand accelerating across existing clients and new vendor launches, supporting more event volume growth Expanding capacity and strengthening labor readiness to meet demand while upholding execution quality Focused on improving profitability through labor efficiency, stronger training and safety protocols, and higher-return demos Results impacted by difficult prior-year comp and higher execution costs on a merchandising project Expect sequential improvement through 2H as project activity ramps and project-related earnings volatility moderates Encouraging pipeline, supported by growing demand and improving visibility into second-half activity Focused on execution discipline, staffing alignment and operating consistency to better match costs with project activity 5 Experiential Services continues to lead growth, while focused execution is positioning the broader portfolio for improved performance.
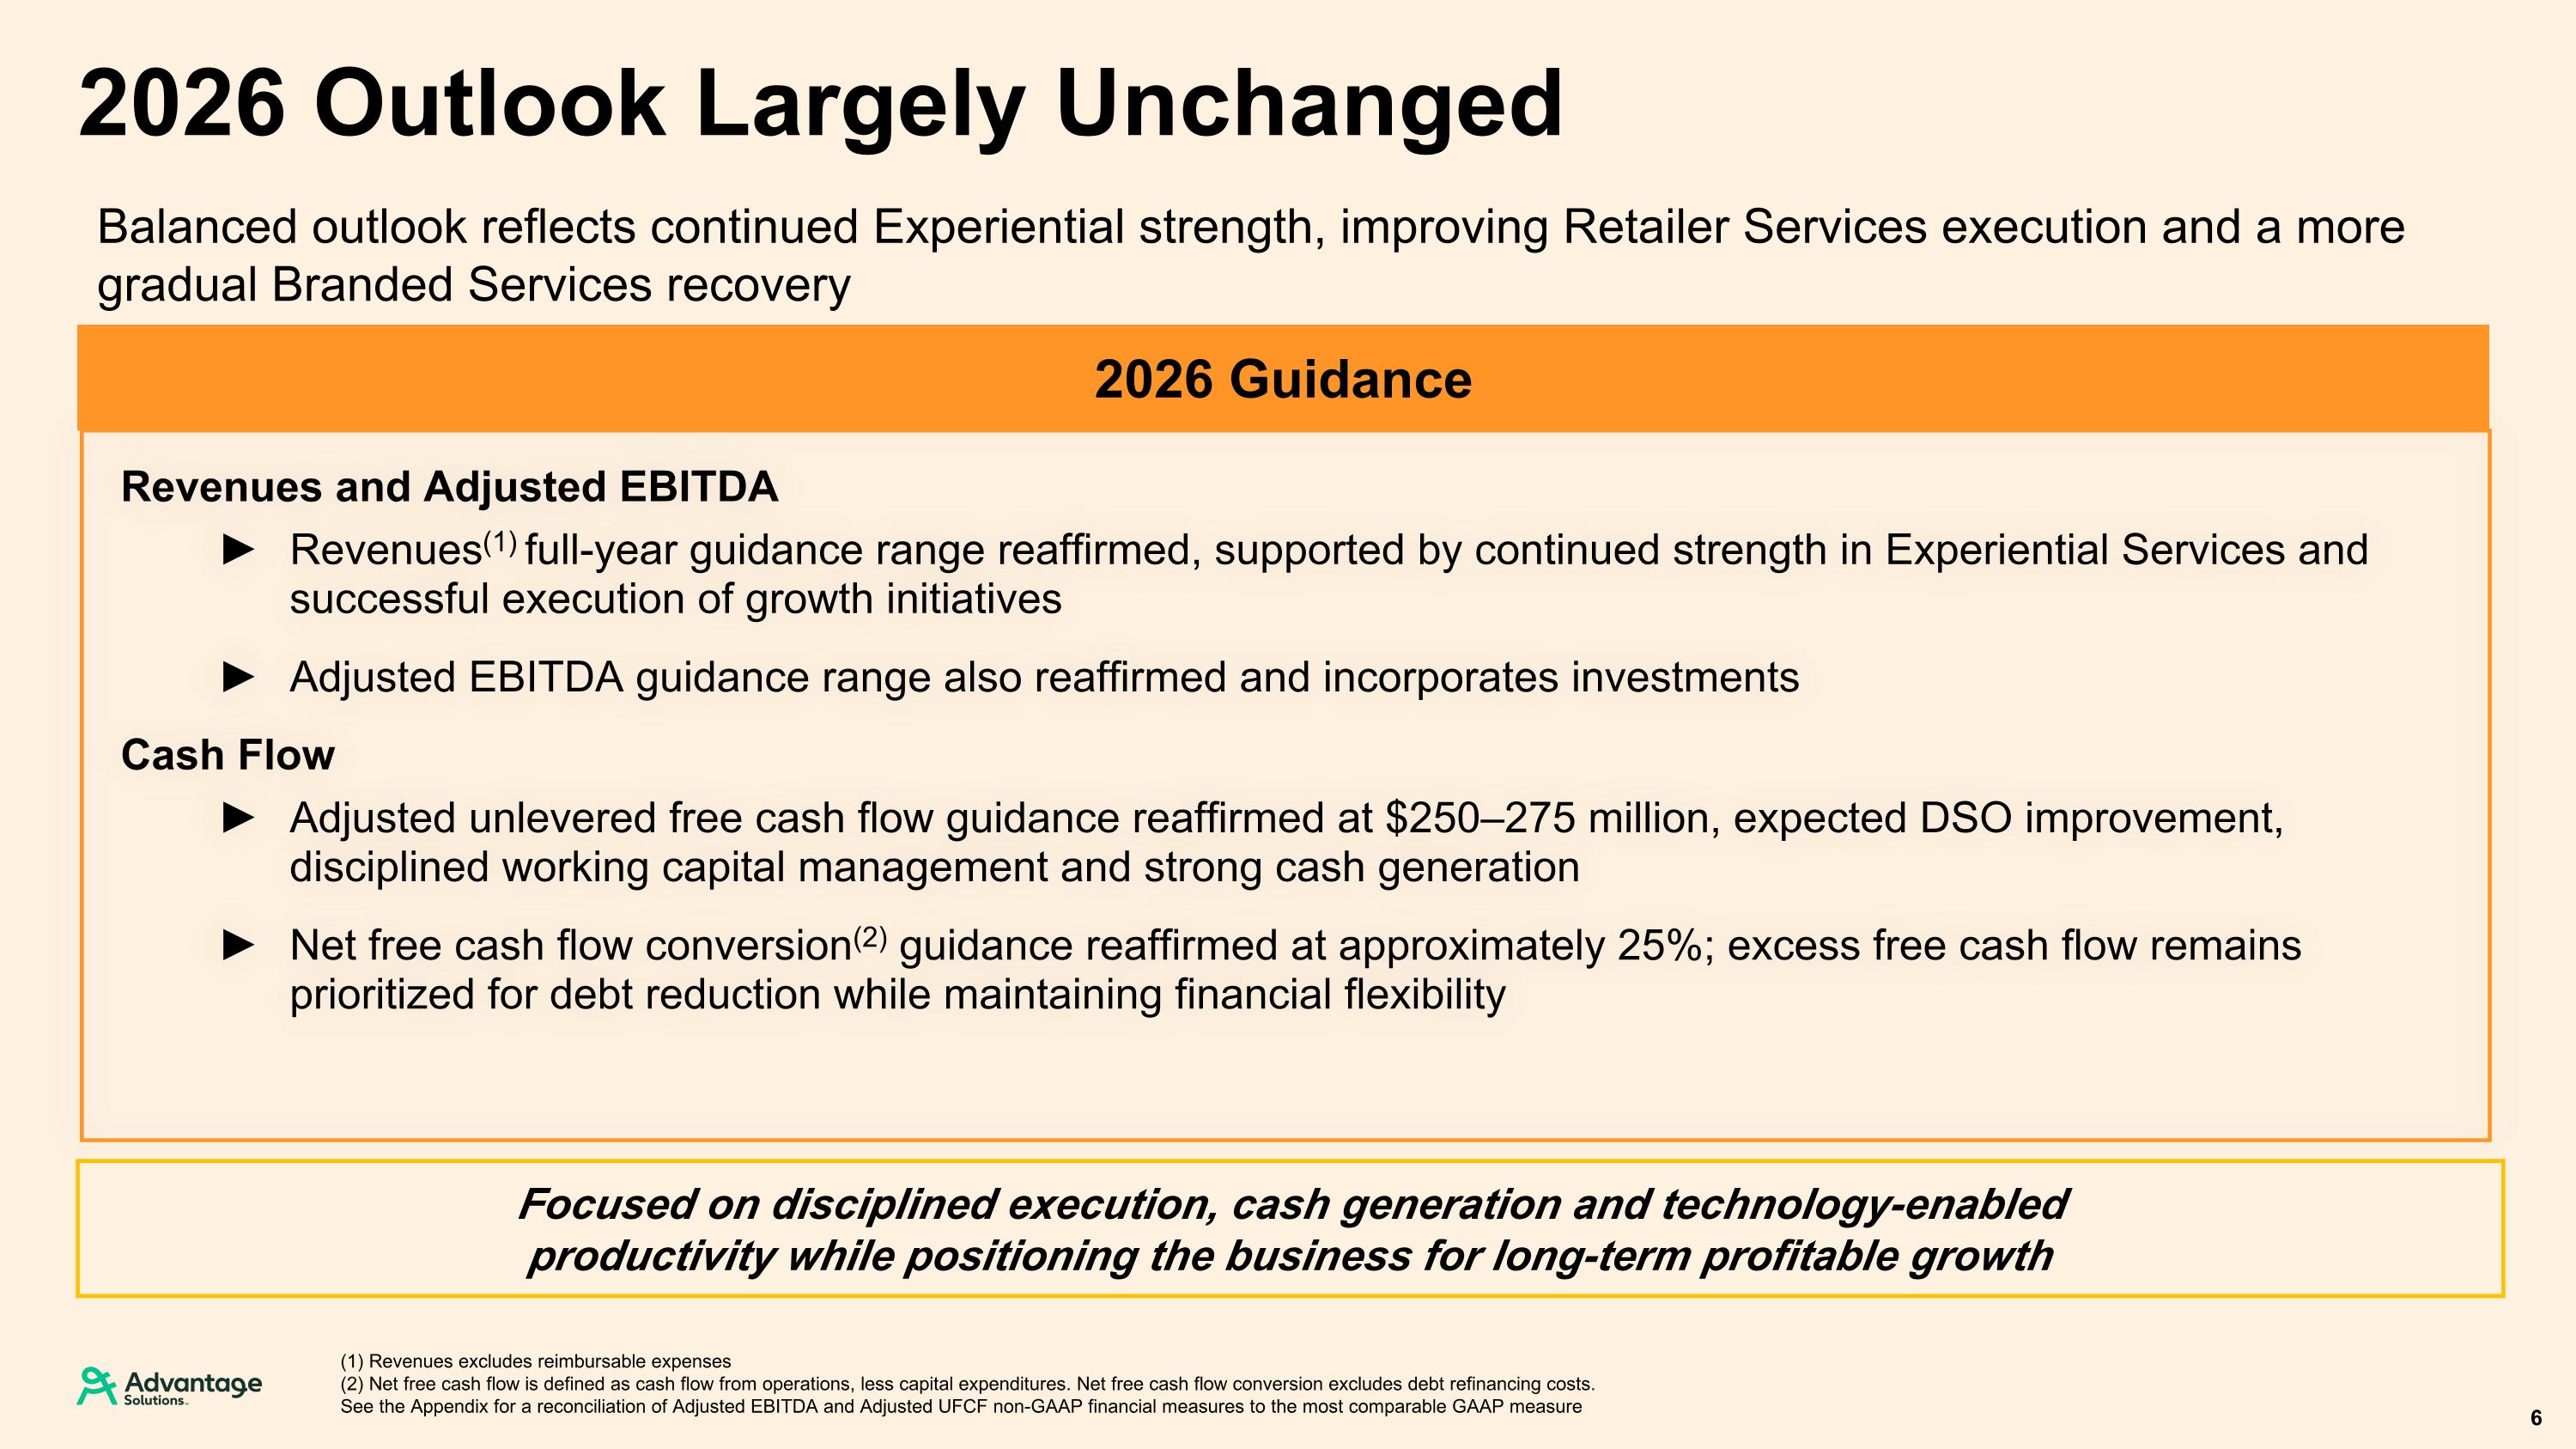
2026 Outlook Largely Unchanged 6 (1) Revenues excludes reimbursable expenses (2) Net free cash flow is defined as cash flow from operations, less capital expenditures. Net free cash flow conversion excludes debt refinancing costs. See the Appendix for a reconciliation of Adjusted EBITDA and Adjusted UFCF non-GAAP financial measures to the most comparable GAAP measure Revenues and Adjusted EBITDA Revenues(1) full-year guidance range reaffirmed, supported by continued strength in Experiential Services and successful execution of growth initiatives Adjusted EBITDA guidance range also reaffirmed and incorporates investments Cash Flow Adjusted unlevered free cash flow guidance reaffirmed at $250–275 million, expected DSO improvement, disciplined working capital management and strong cash generation Net free cash flow conversion(2) guidance reaffirmed at approximately 25%; excess free cash flow remains prioritized for debt reduction while maintaining financial flexibility 2026 Guidance Balanced outlook reflects continued Experiential strength, improving Retailer Services execution and a more gradual Branded Services recovery Focused on disciplined execution, cash generation and technology-enabled productivity while positioning the business for long-term profitable growth
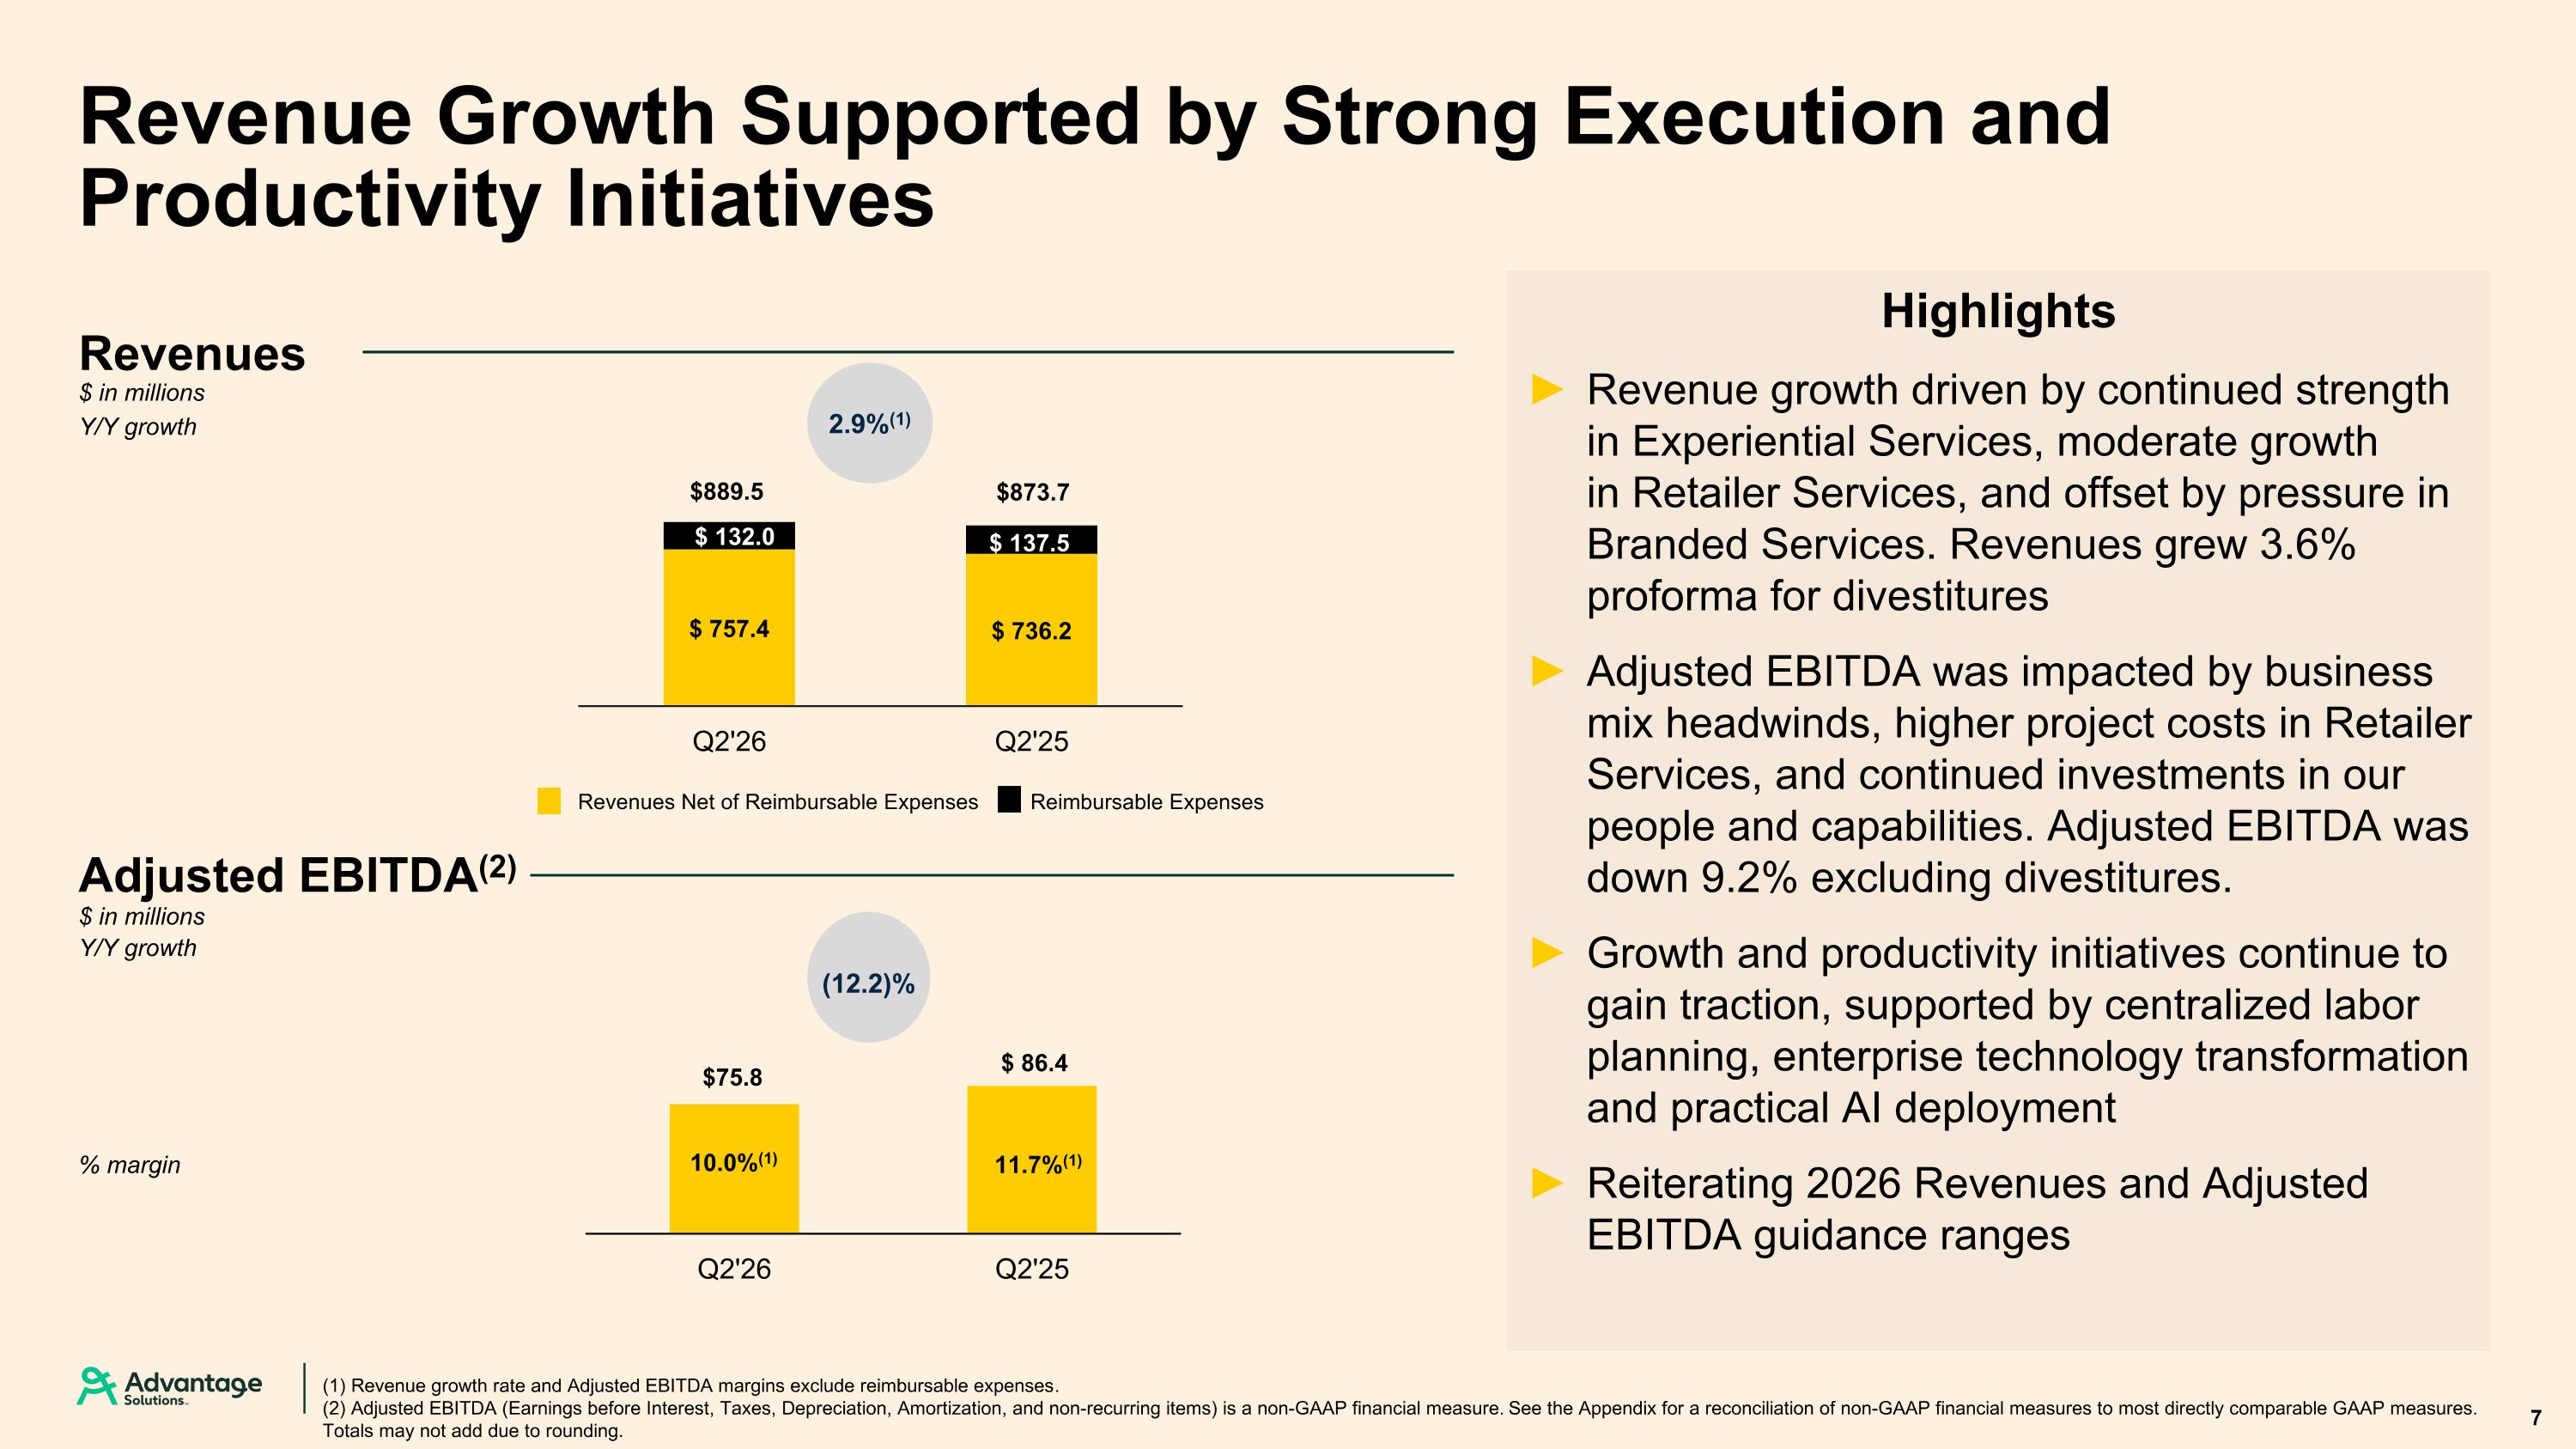
$873.7 Highlights Revenue growth driven by continued strength in Experiential Services, moderate growth in Retailer Services, and offset by pressure in Branded Services. Revenues grew 3.6% proforma for divestitures Adjusted EBITDA was impacted by business mix headwinds, higher project costs in Retailer Services, and continued investments in our people and capabilities. Adjusted EBITDA was down 9.2% excluding divestitures. Growth and productivity initiatives continue to gain traction, supported by centralized labor planning, enterprise technology transformation and practical AI deployment Reiterating 2026 Revenues and Adjusted EBITDA guidance ranges Revenue Growth Supported by Strong Execution and Productivity Initiatives (1) Revenue growth rate and Adjusted EBITDA margins exclude reimbursable expenses. (2) Adjusted EBITDA (Earnings before Interest, Taxes, Depreciation, Amortization, and non-recurring items) is a non-GAAP financial measure. See the Appendix for a reconciliation of non-GAAP financial measures to most directly comparable GAAP measures. Totals may not add due to rounding. (12.2)% Revenues Net of Reimbursable Expenses Reimbursable Expenses 7 2.9%(1) Revenues $ in millions Y/Y growth % margin $ in millions Y/Y growth Adjusted EBITDA(2) $889.5 10.0%(1) 11.7%(1)
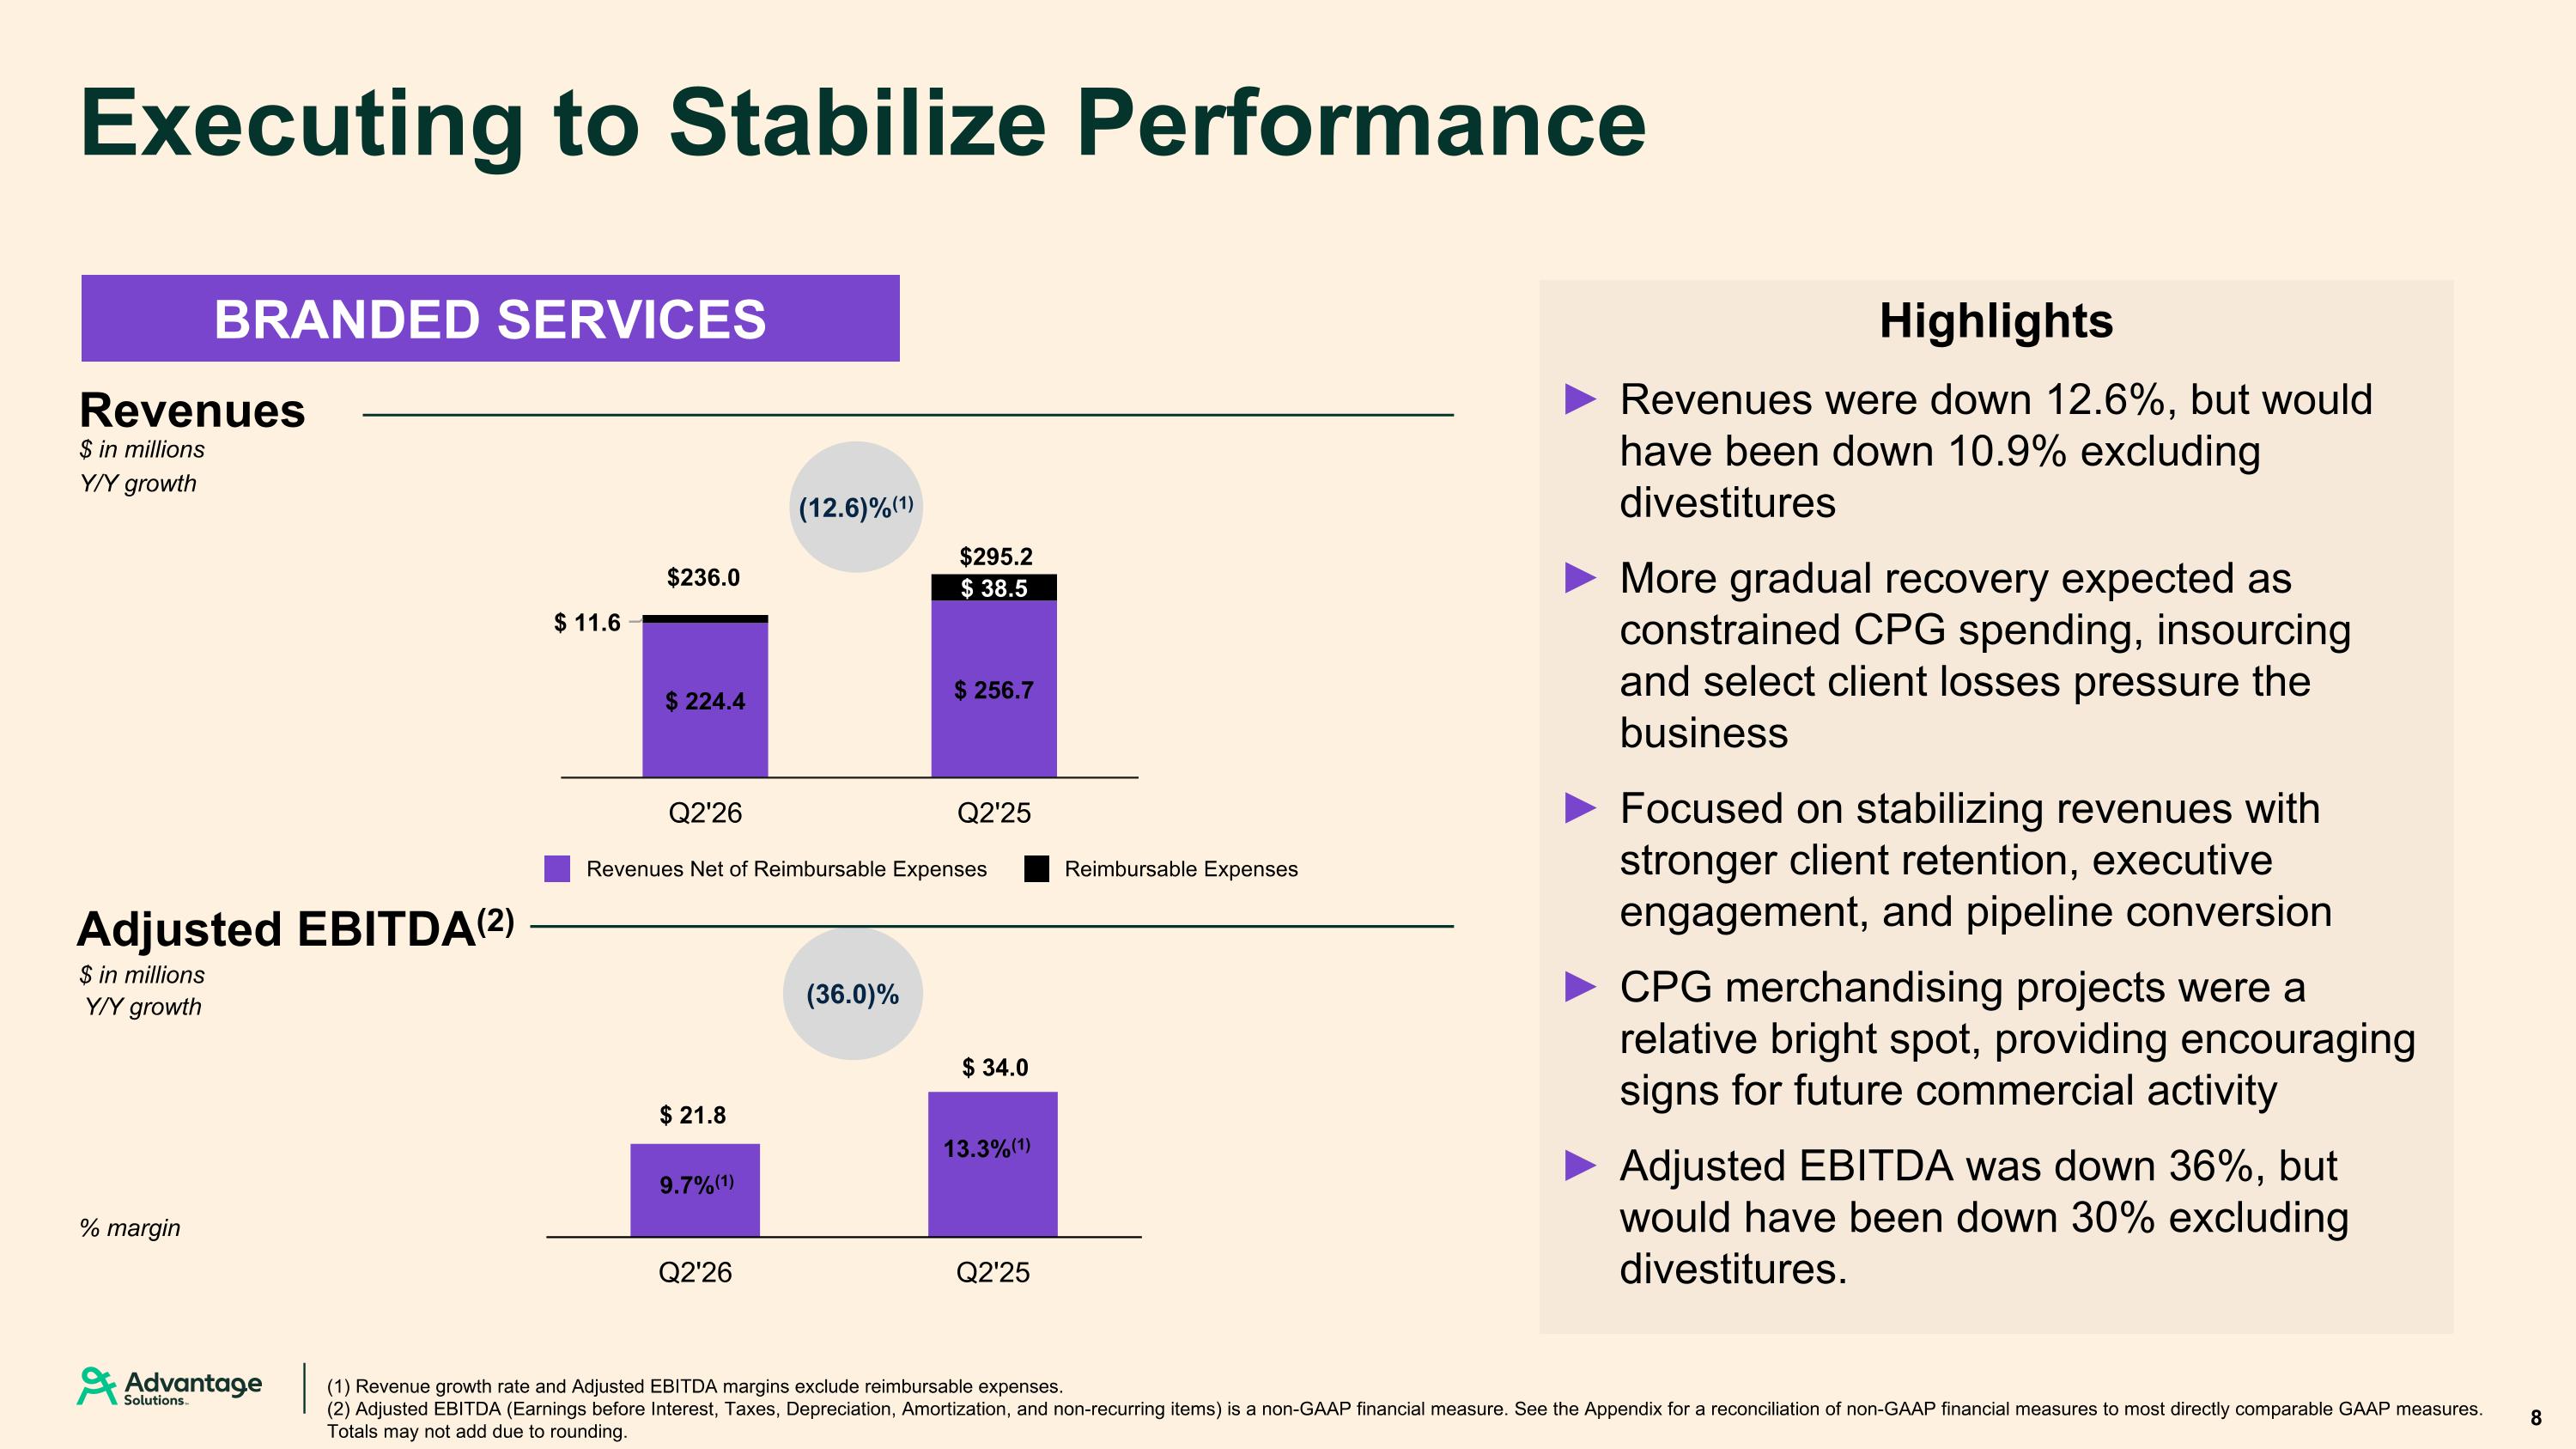
$295.2 (1) Revenue growth rate and Adjusted EBITDA margins exclude reimbursable expenses. (2) Adjusted EBITDA (Earnings before Interest, Taxes, Depreciation, Amortization, and non-recurring items) is a non-GAAP financial measure. See the Appendix for a reconciliation of non-GAAP financial measures to most directly comparable GAAP measures. Totals may not add due to rounding. (36.0)% % margin Executing to Stabilize Performance $ in millions Y/Y growth Adjusted EBITDA(2) BRANDED SERVICES $ in millions Y/Y growth 8 Revenues Revenues Net of Reimbursable Expenses Reimbursable Expenses (12.6)%(1) $236.0 9.7%(1) 13.3%(1) Highlights Revenues were down 12.6%, but would have been down 10.9% excluding divestitures More gradual recovery expected as constrained CPG spending, insourcing and select client losses pressure the business Focused on stabilizing revenues with stronger client retention, executive engagement, and pipeline conversion CPG merchandising projects were a relative bright spot, providing encouraging signs for future commercial activity Adjusted EBITDA was down 36%, but would have been down 30% excluding divestitures.
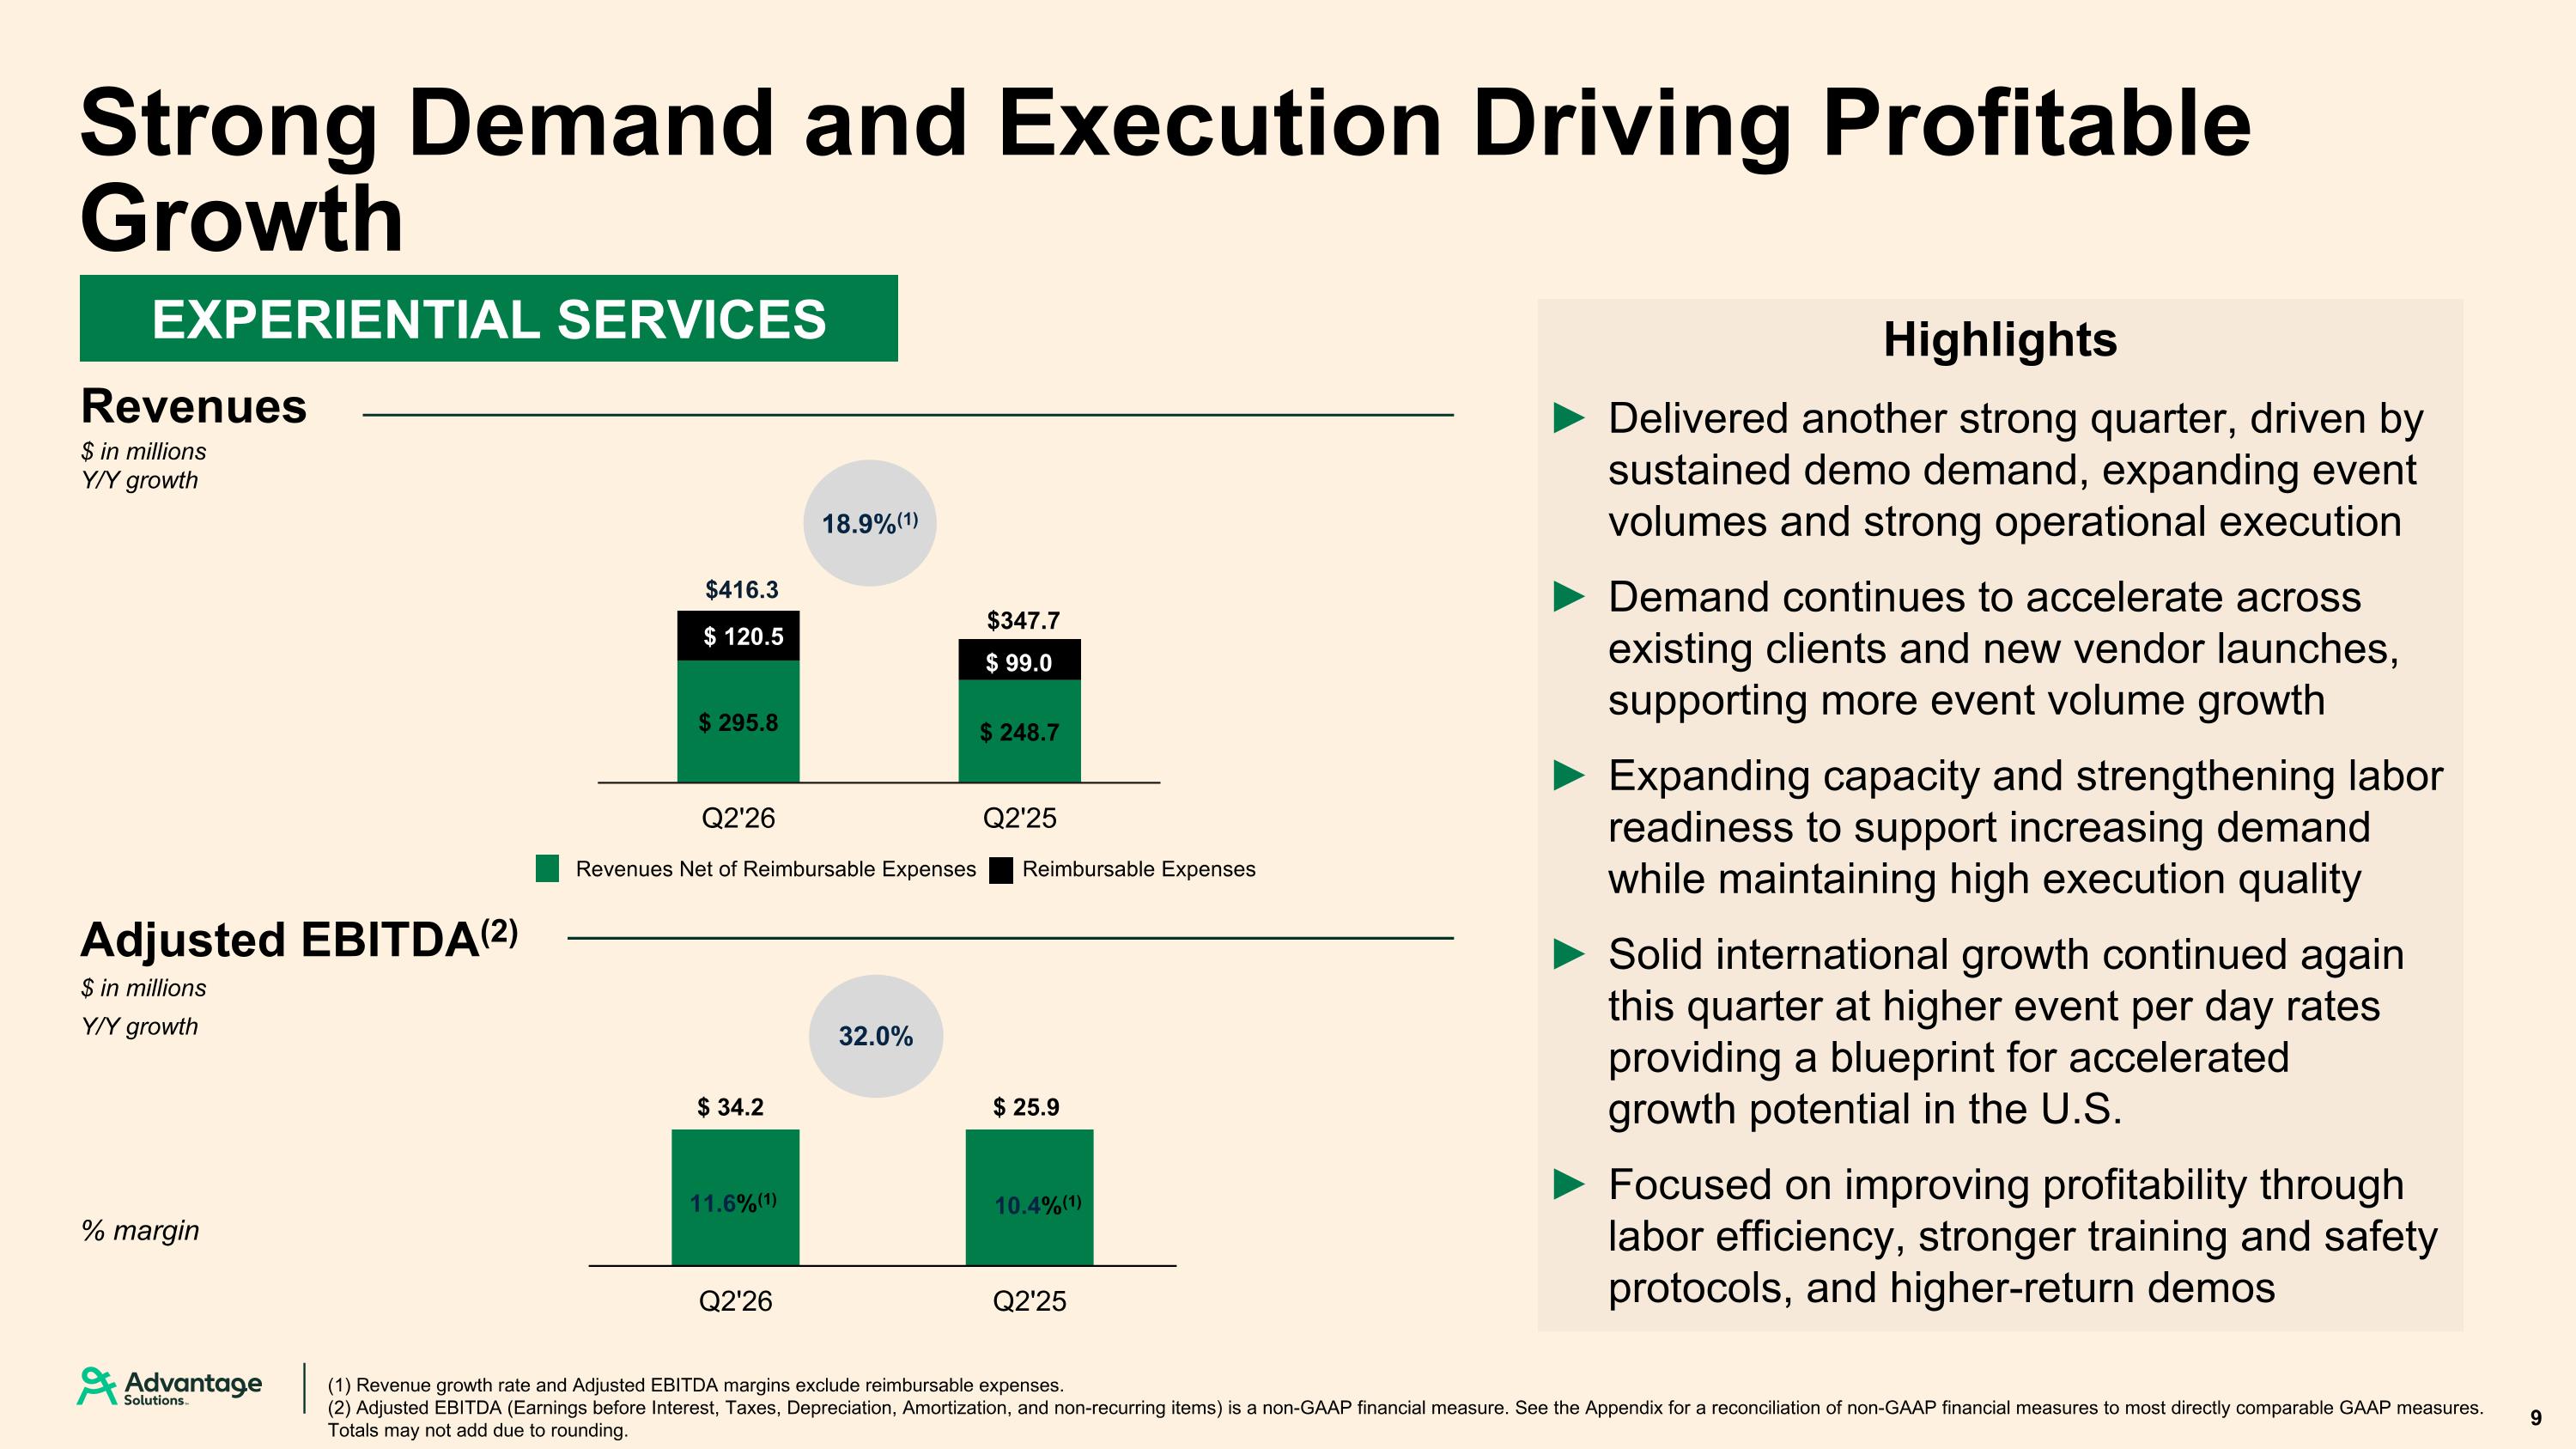
$347.7 (1) Revenue growth rate and Adjusted EBITDA margins exclude reimbursable expenses. (2) Adjusted EBITDA (Earnings before Interest, Taxes, Depreciation, Amortization, and non-recurring items) is a non-GAAP financial measure. See the Appendix for a reconciliation of non-GAAP financial measures to most directly comparable GAAP measures. Totals may not add due to rounding. % margin Strong Demand and Execution Driving Profitable Growth Adjusted EBITDA(2) $ in millions Y/Y growth $ in millions Y/Y growth 9 EXPERIENTIAL SERVICES Revenues Revenues Net of Reimbursable Expenses Reimbursable Expenses 18.9%(1) 32.0% $416.3 11.6%(1) 10.4%(1) Highlights Delivered another strong quarter, driven by sustained demo demand, expanding event volumes and strong operational execution Demand continues to accelerate across existing clients and new vendor launches, supporting more event volume growth Expanding capacity and strengthening labor readiness to support increasing demand while maintaining high execution quality Solid international growth continued again this quarter at higher event per day rates providing a blueprint for accelerated growth potential in the U.S. Focused on improving profitability through labor efficiency, stronger training and safety protocols, and higher-return demos
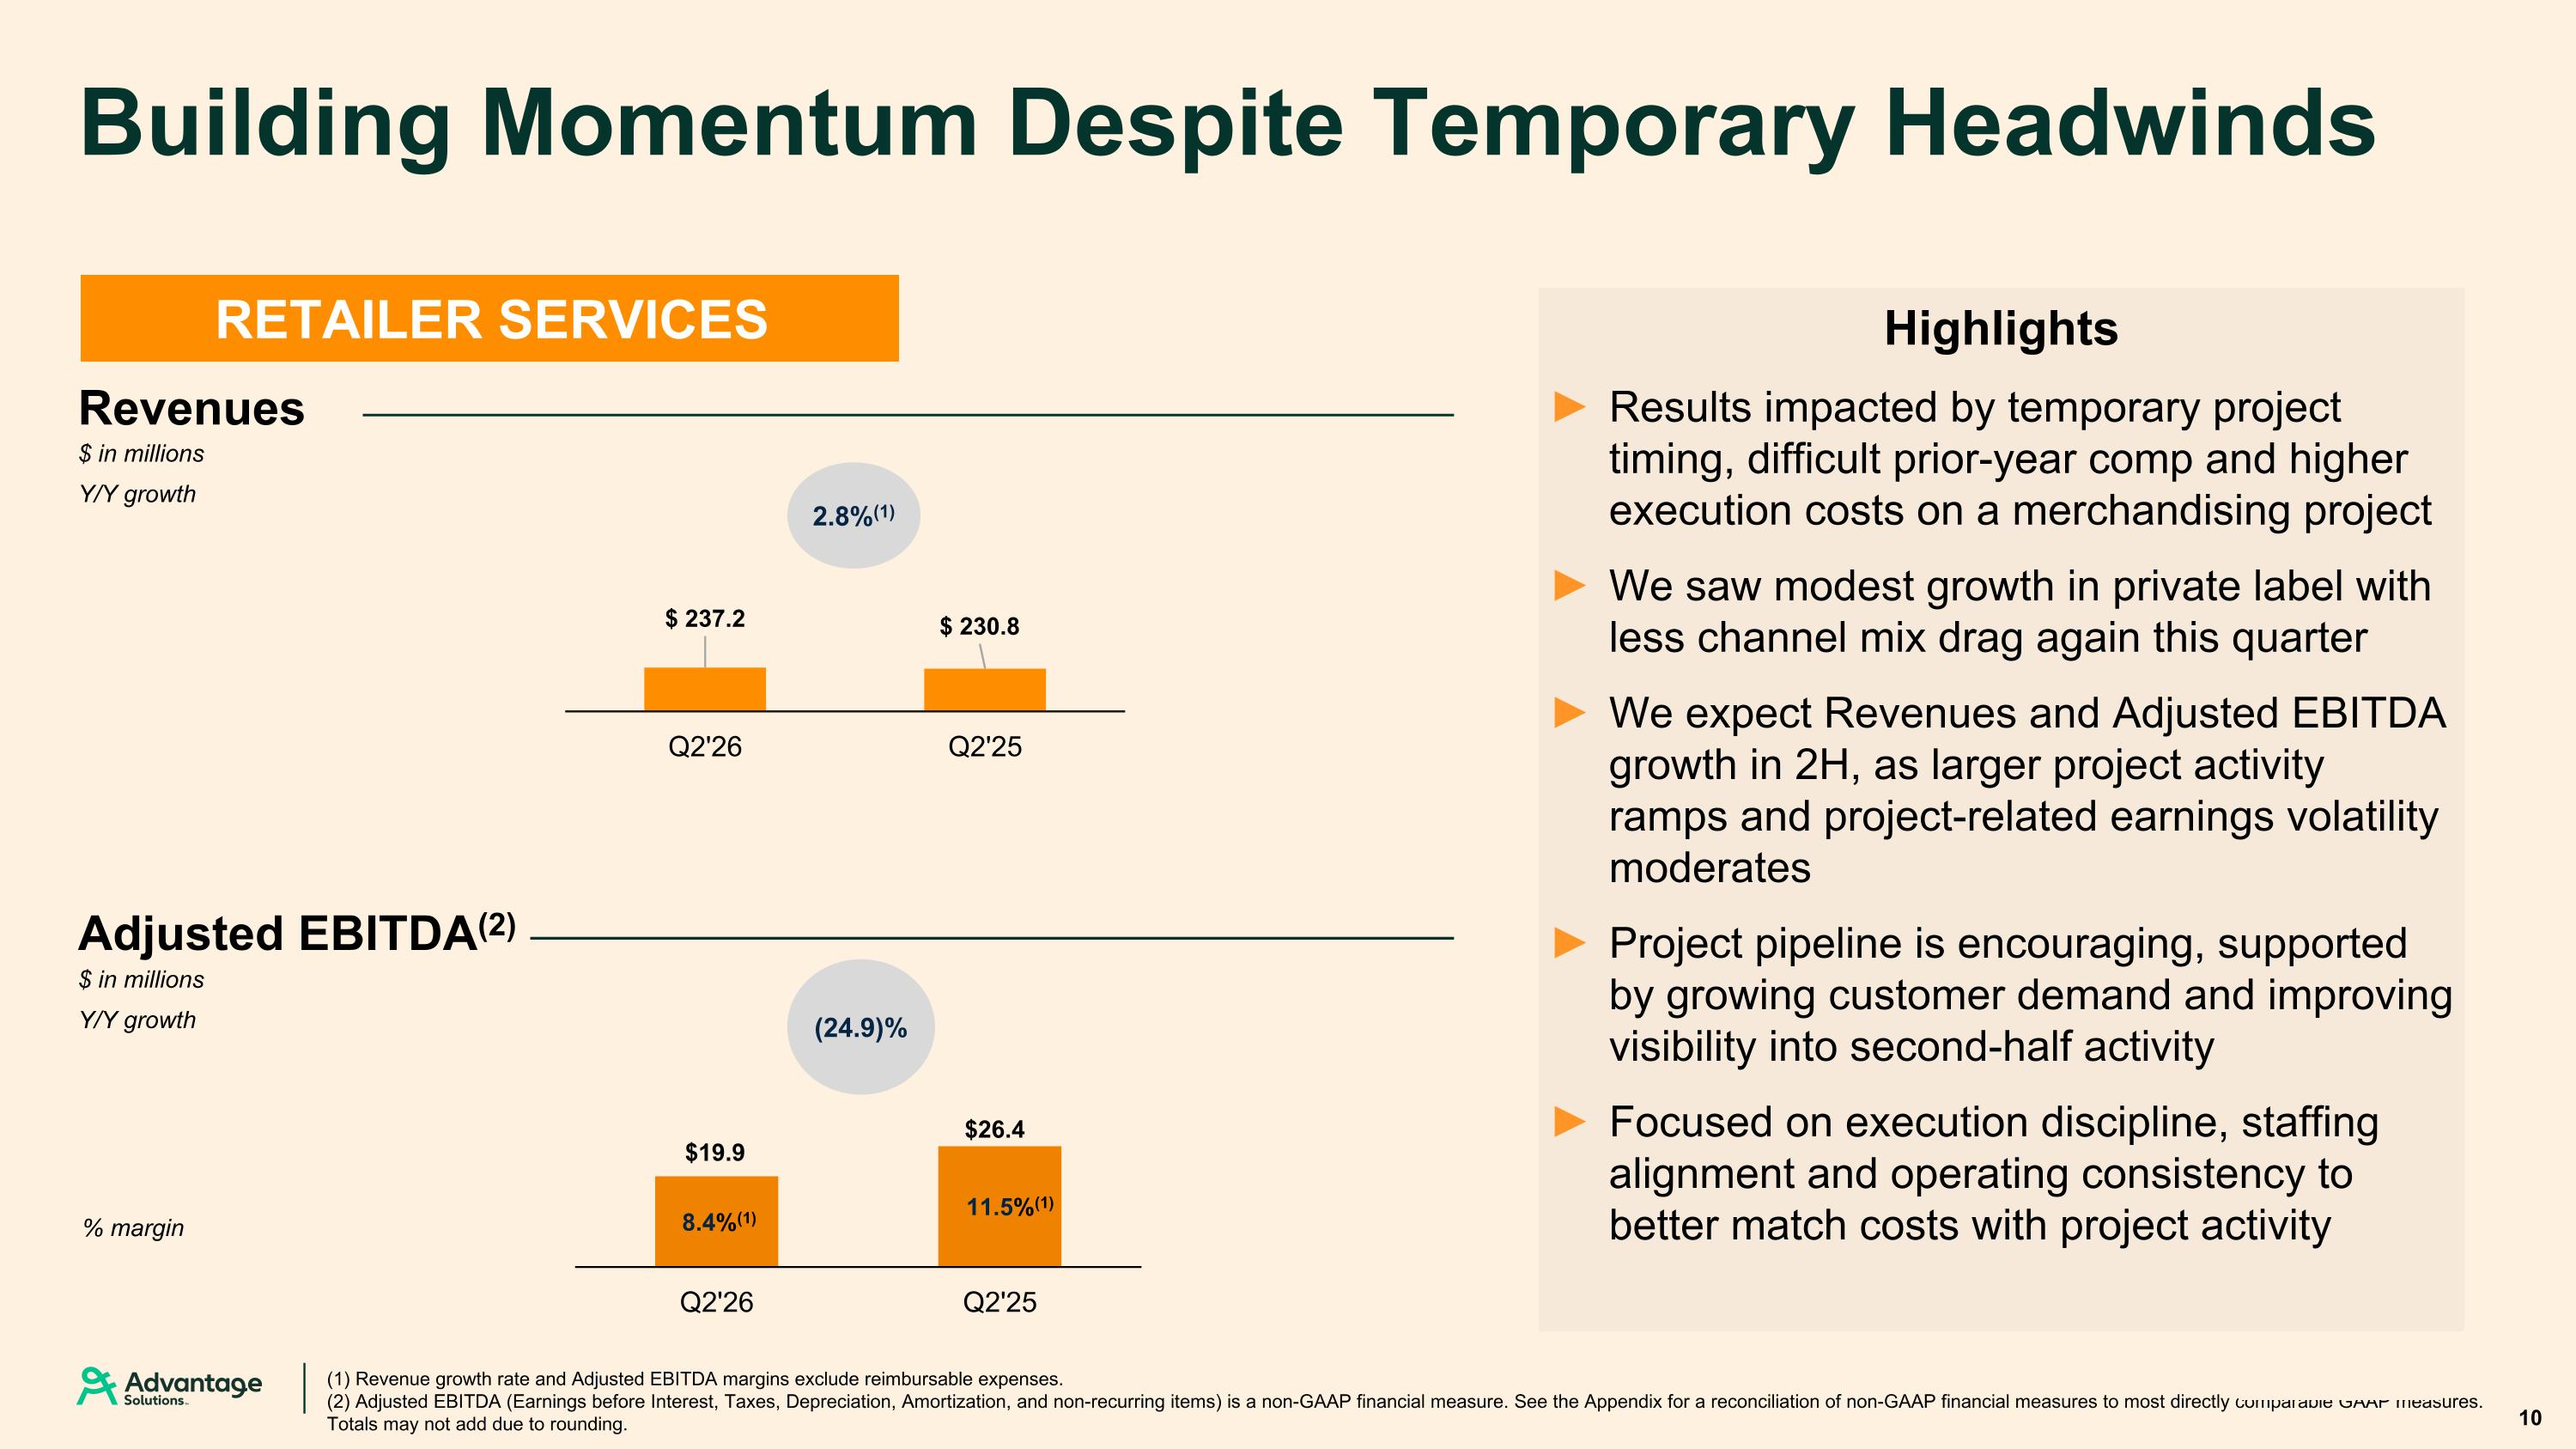
(1) Revenue growth rate and Adjusted EBITDA margins exclude reimbursable expenses. (2) Adjusted EBITDA (Earnings before Interest, Taxes, Depreciation, Amortization, and non-recurring items) is a non-GAAP financial measure. See the Appendix for a reconciliation of non-GAAP financial measures to most directly comparable GAAP measures. Totals may not add due to rounding. 2.8%(1) % margin Building Momentum Despite Temporary Headwinds Adjusted EBITDA(2) 10 $ in millions Y/Y growth $ in millions Y/Y growth RETAILER SERVICES Revenues (24.9)% 8.4%(1) 11.5%(1) Highlights Results impacted by temporary project timing, difficult prior-year comp and higher execution costs on a merchandising project We saw modest growth in private label with less channel mix drag again this quarter We expect Revenues and Adjusted EBITDA growth in 2H, as larger project activity ramps and project-related earnings volatility moderates Project pipeline is encouraging, supported by growing customer demand and improving visibility into second-half activity Focused on execution discipline, staffing alignment and operating consistency to better match costs with project activity
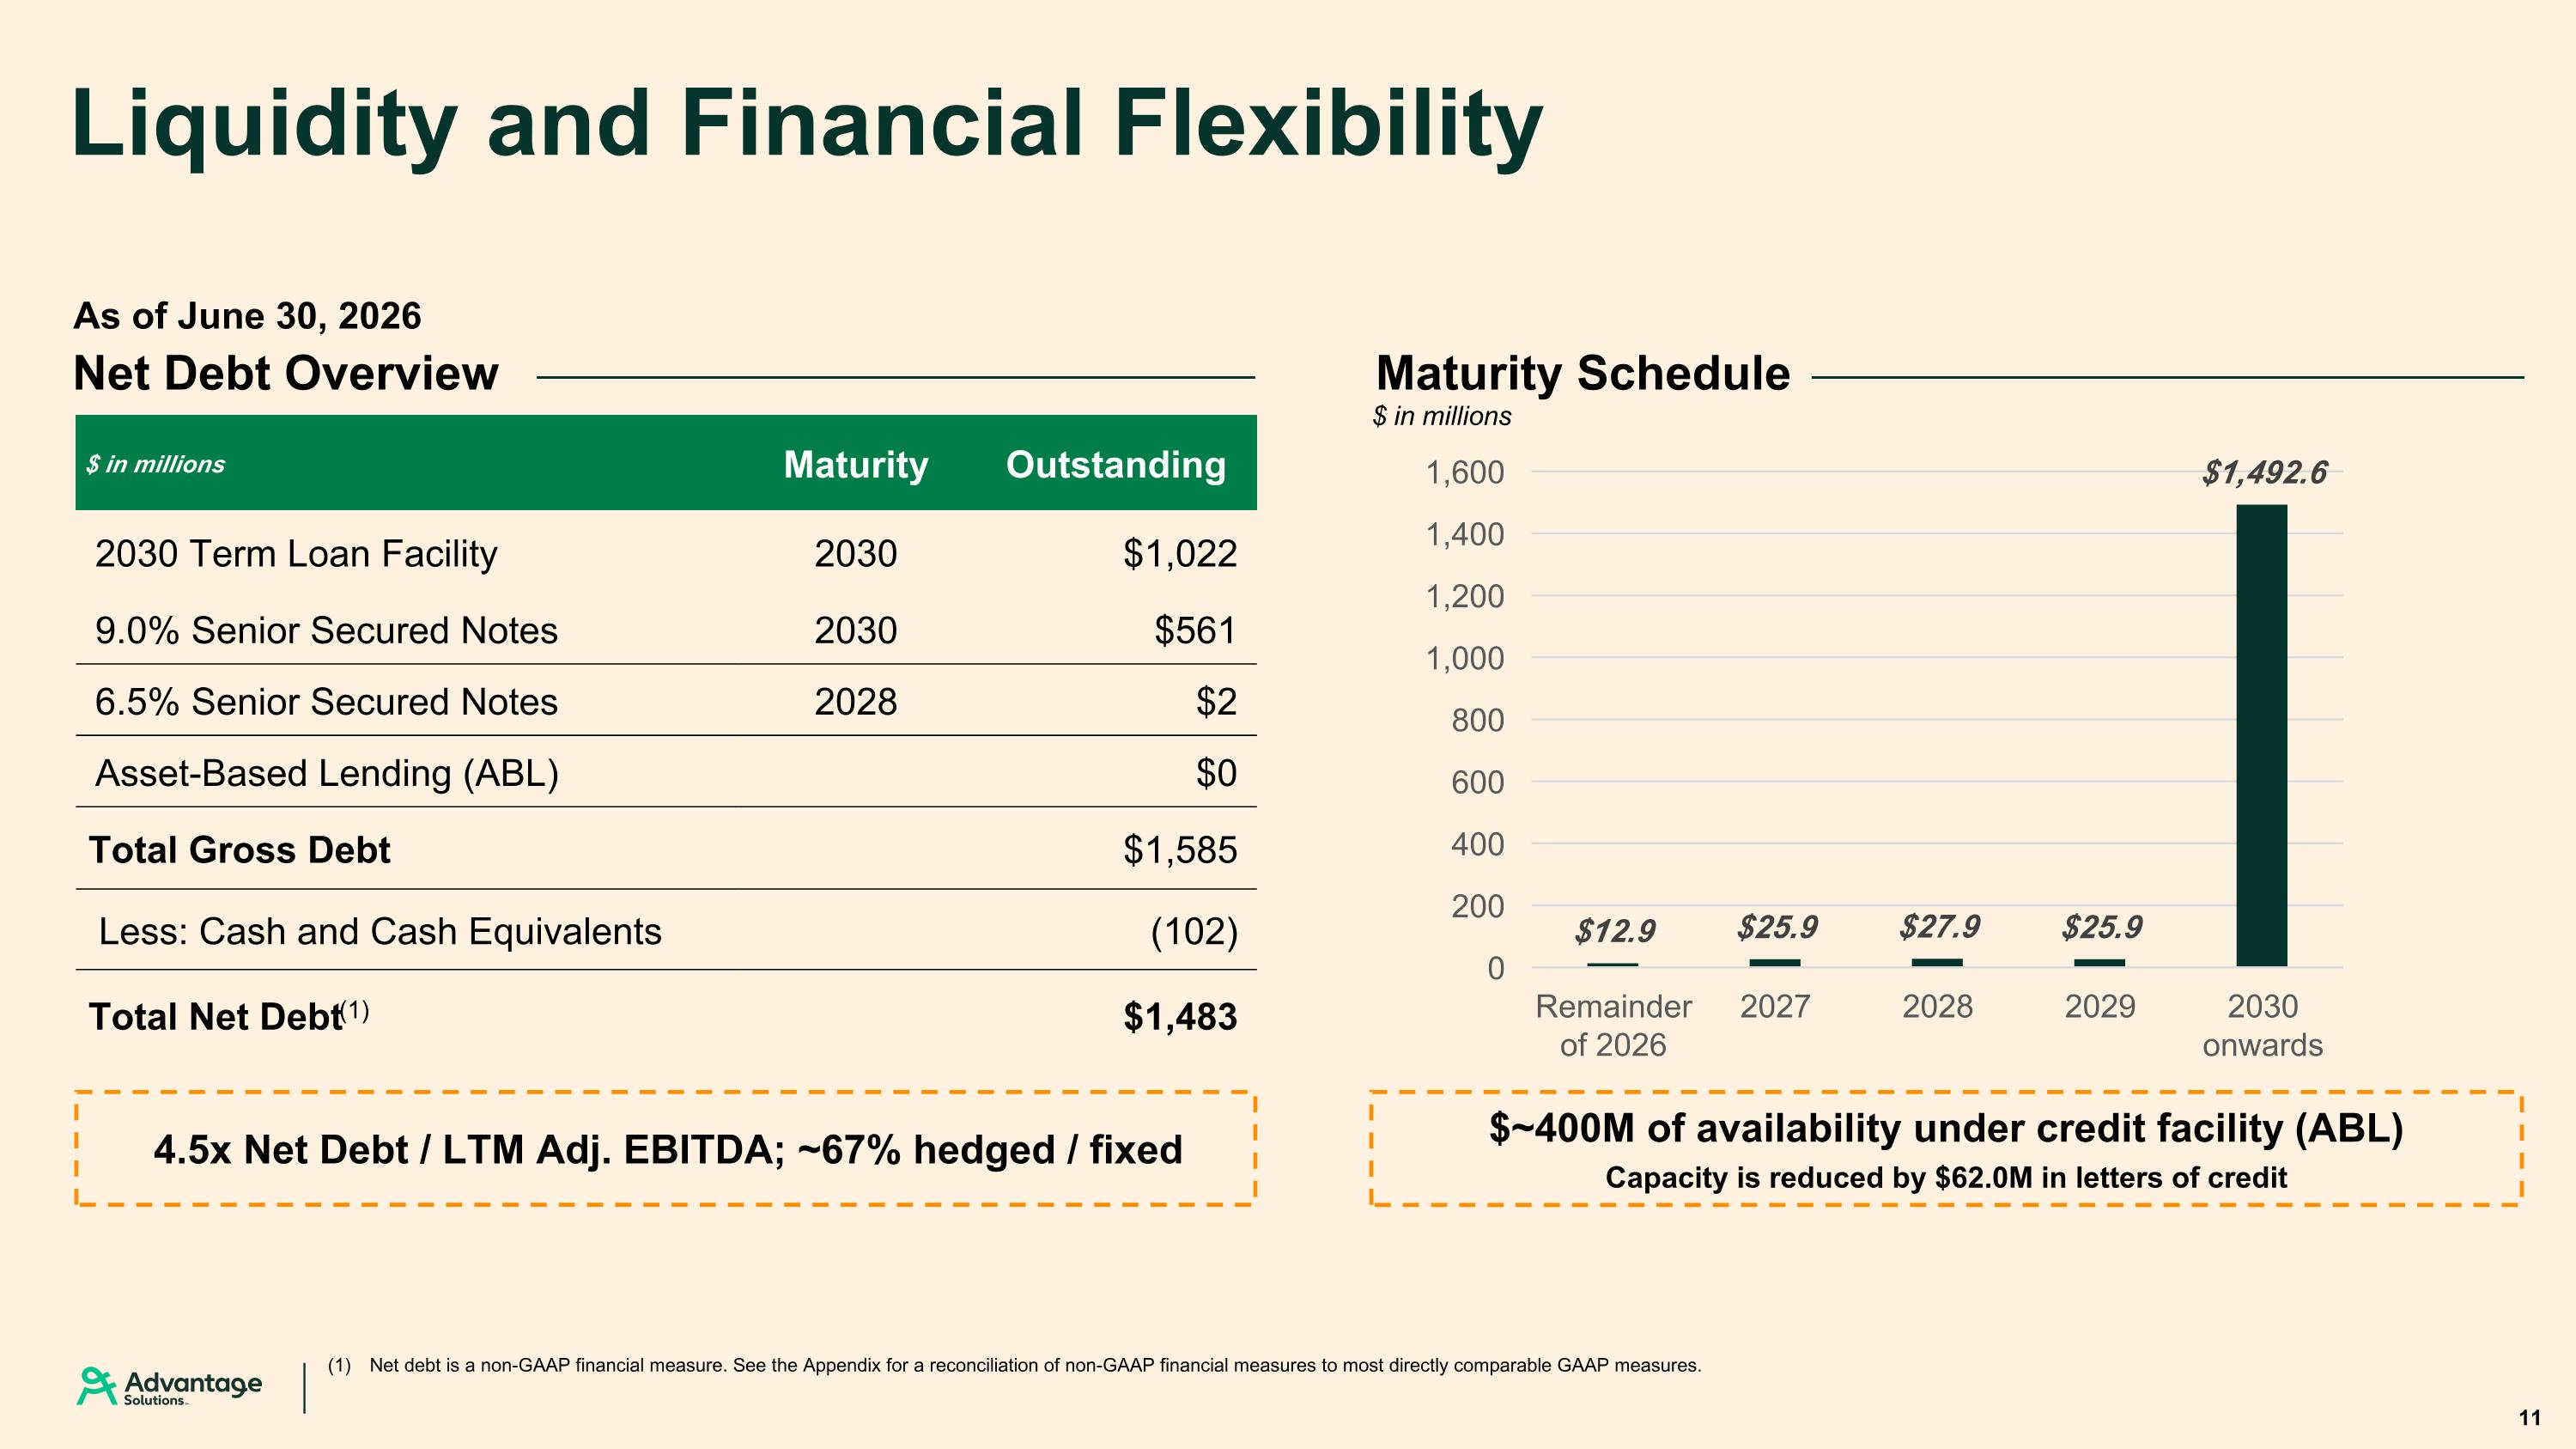
Liquidity and Financial Flexibility As of June 30, 2026 $ in millions Maturity Outstanding 2030 Term Loan Facility 2030 $1,022 9.0% Senior Secured Notes 2030 $561 6.5% Senior Secured Notes 2028 $2 Asset-Based Lending (ABL) $0 Total Gross Debt $1,585 Less: Cash and Cash Equivalents (102) Total Net Debt(1) $1,483 Net Debt Overview Maturity Schedule (1) Net debt is a non-GAAP financial measure. See the Appendix for a reconciliation of non-GAAP financial measures to most directly comparable GAAP measures. 11 $~400M of availability under credit facility (ABL) Capacity is reduced by $62.0M in letters of credit 4.5x Net Debt / LTM Adj. EBITDA; ~67% hedged / fixed $ in millions
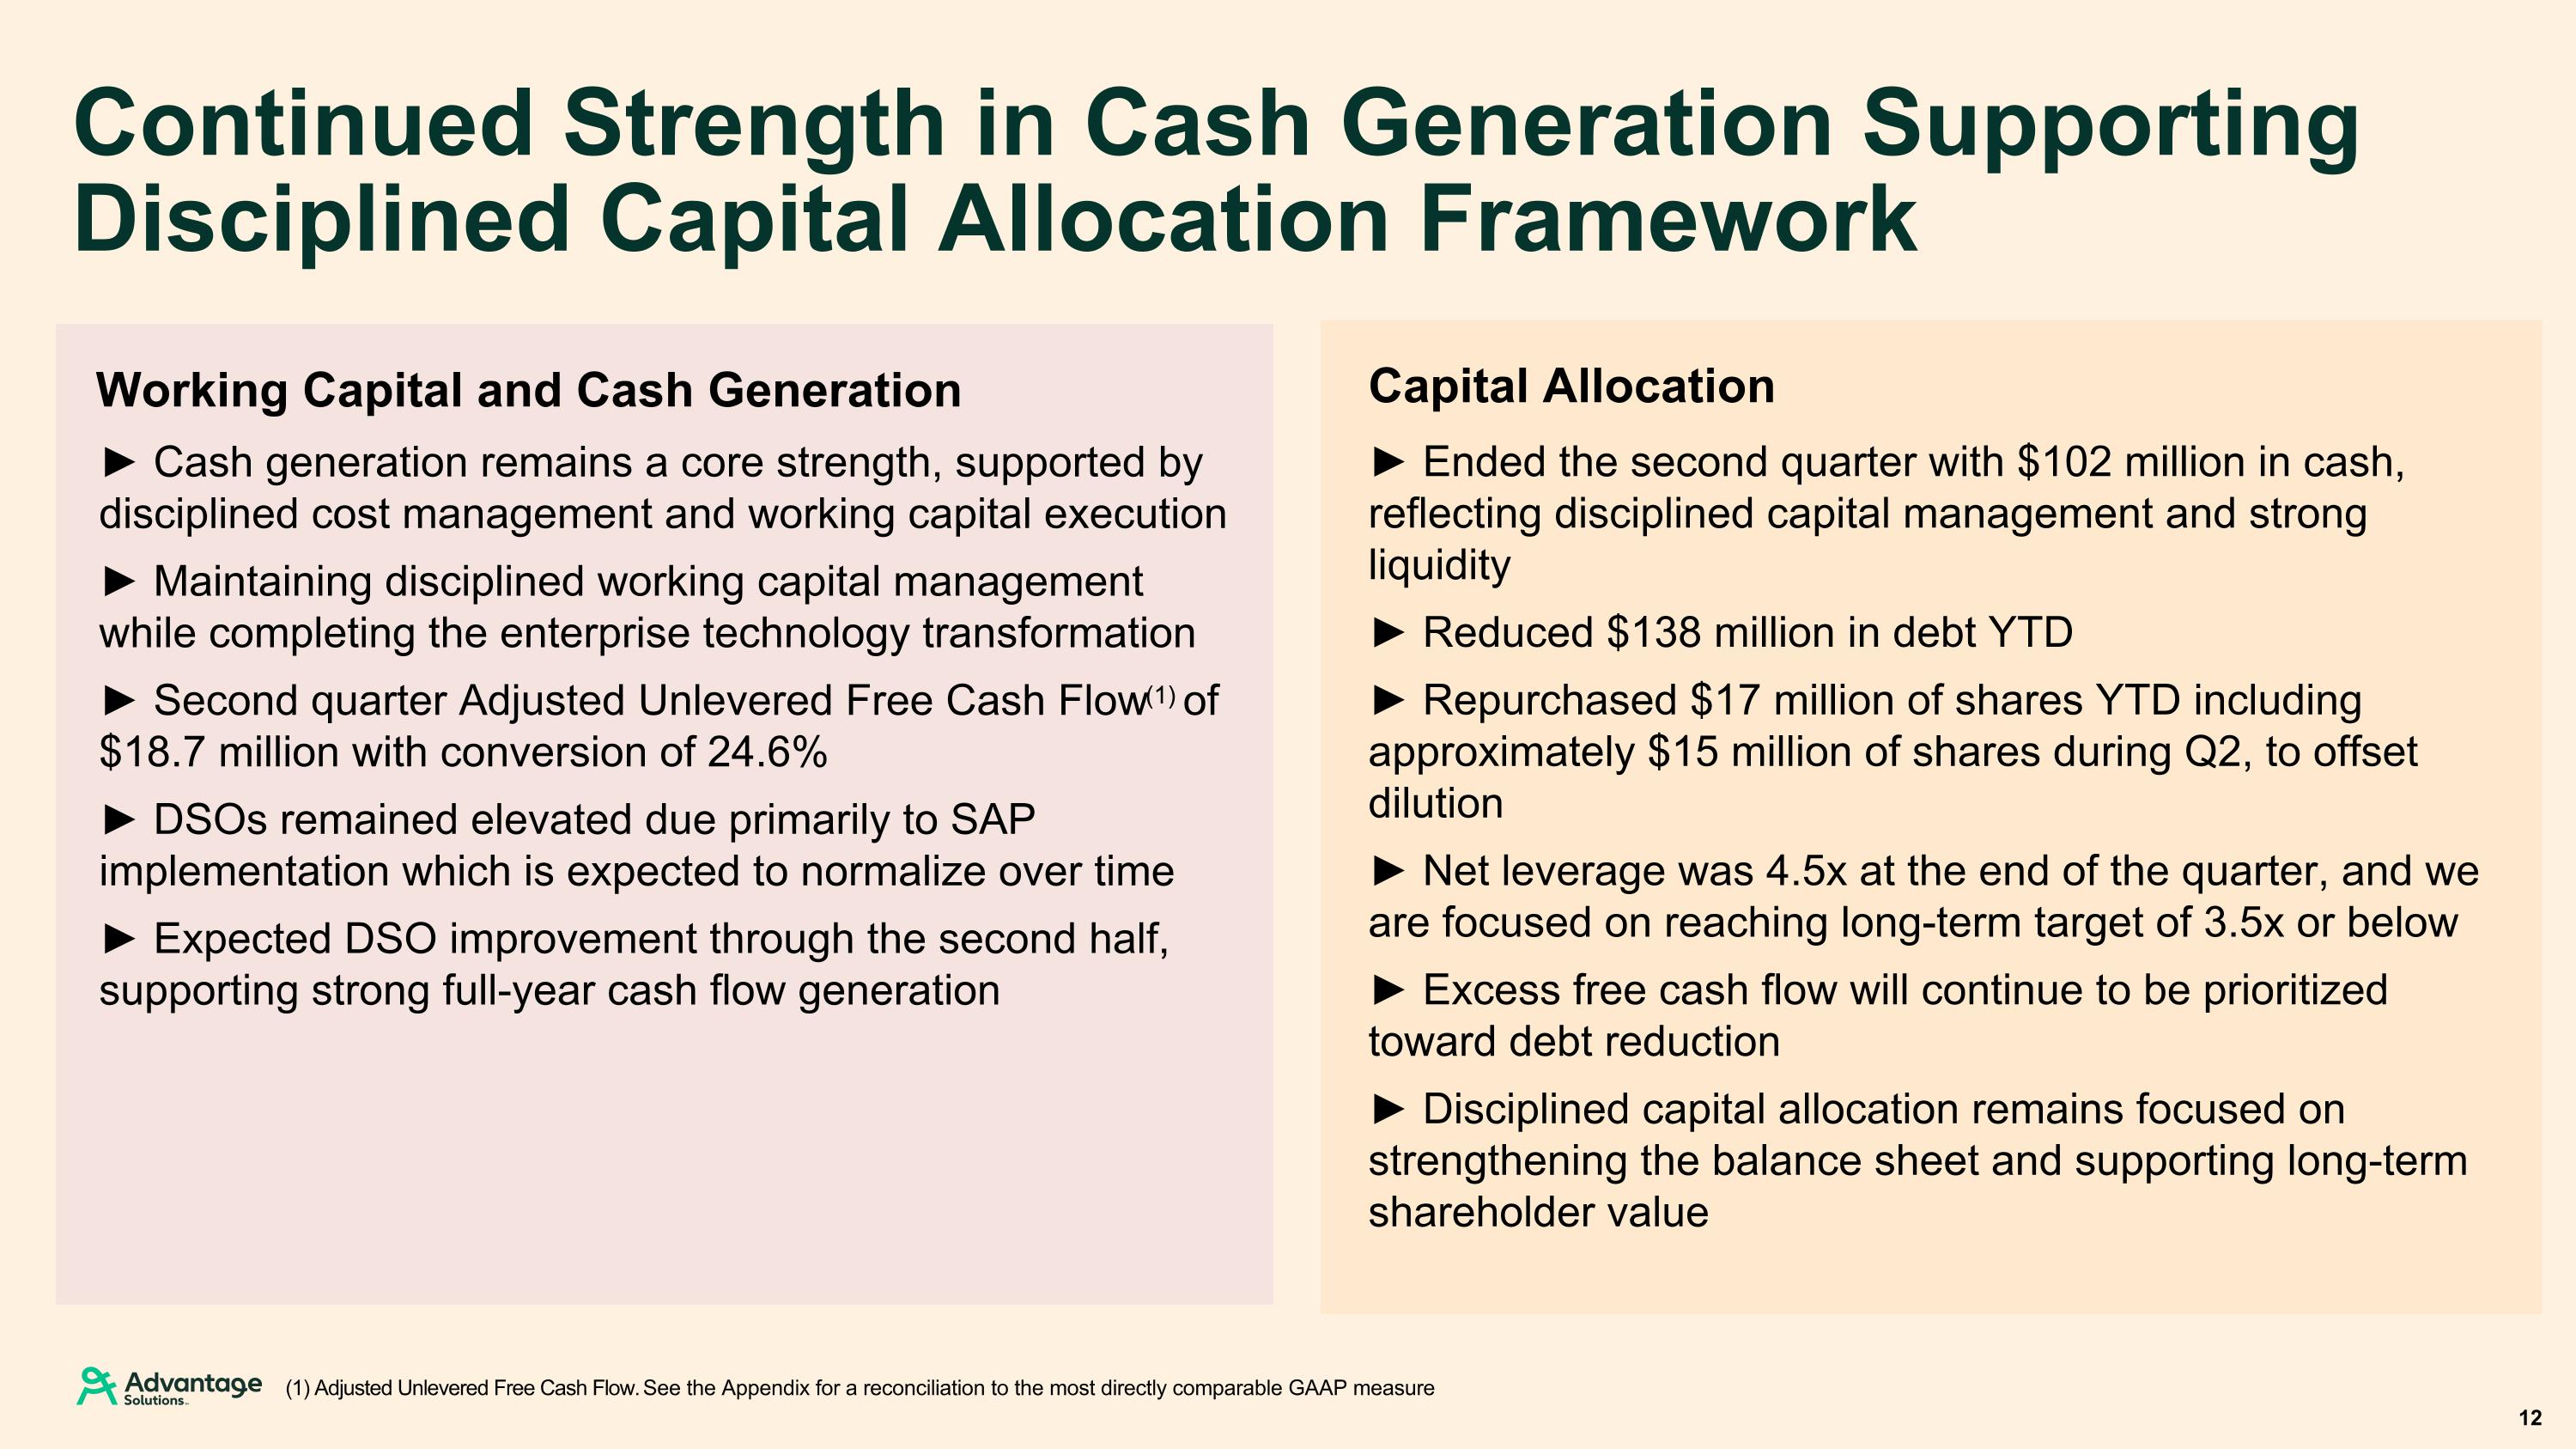
Continued Strength in Cash Generation Supporting Disciplined Capital Allocation Framework Capital Allocation Working Capital and Cash Generation 12 (1) Adjusted Unlevered Free Cash Flow. See the Appendix for a reconciliation to the most directly comparable GAAP measure ► Ended the second quarter with $102 million in cash, reflecting disciplined capital management and strong liquidity ► Reduced $138 million in debt YTD ► Repurchased $17 million of shares YTD including approximately $15 million of shares during Q2, to offset dilution ► Net leverage was 4.5x at the end of the quarter, and we are focused on reaching long-term target of 3.5x or below ► Excess free cash flow will continue to be prioritized toward debt reduction ► Disciplined capital allocation remains focused on strengthening the balance sheet and supporting long-term shareholder value ► Cash generation remains a core strength, supported by disciplined cost management and working capital execution ► Maintaining disciplined working capital management while completing the enterprise technology transformation ► Second quarter Adjusted Unlevered Free Cash Flow(1) of $18.7 million with conversion of 24.6% ► DSOs remained elevated due primarily to SAP implementation which is expected to normalize over time ► Expected DSO improvement through the second half, supporting strong full-year cash flow generation
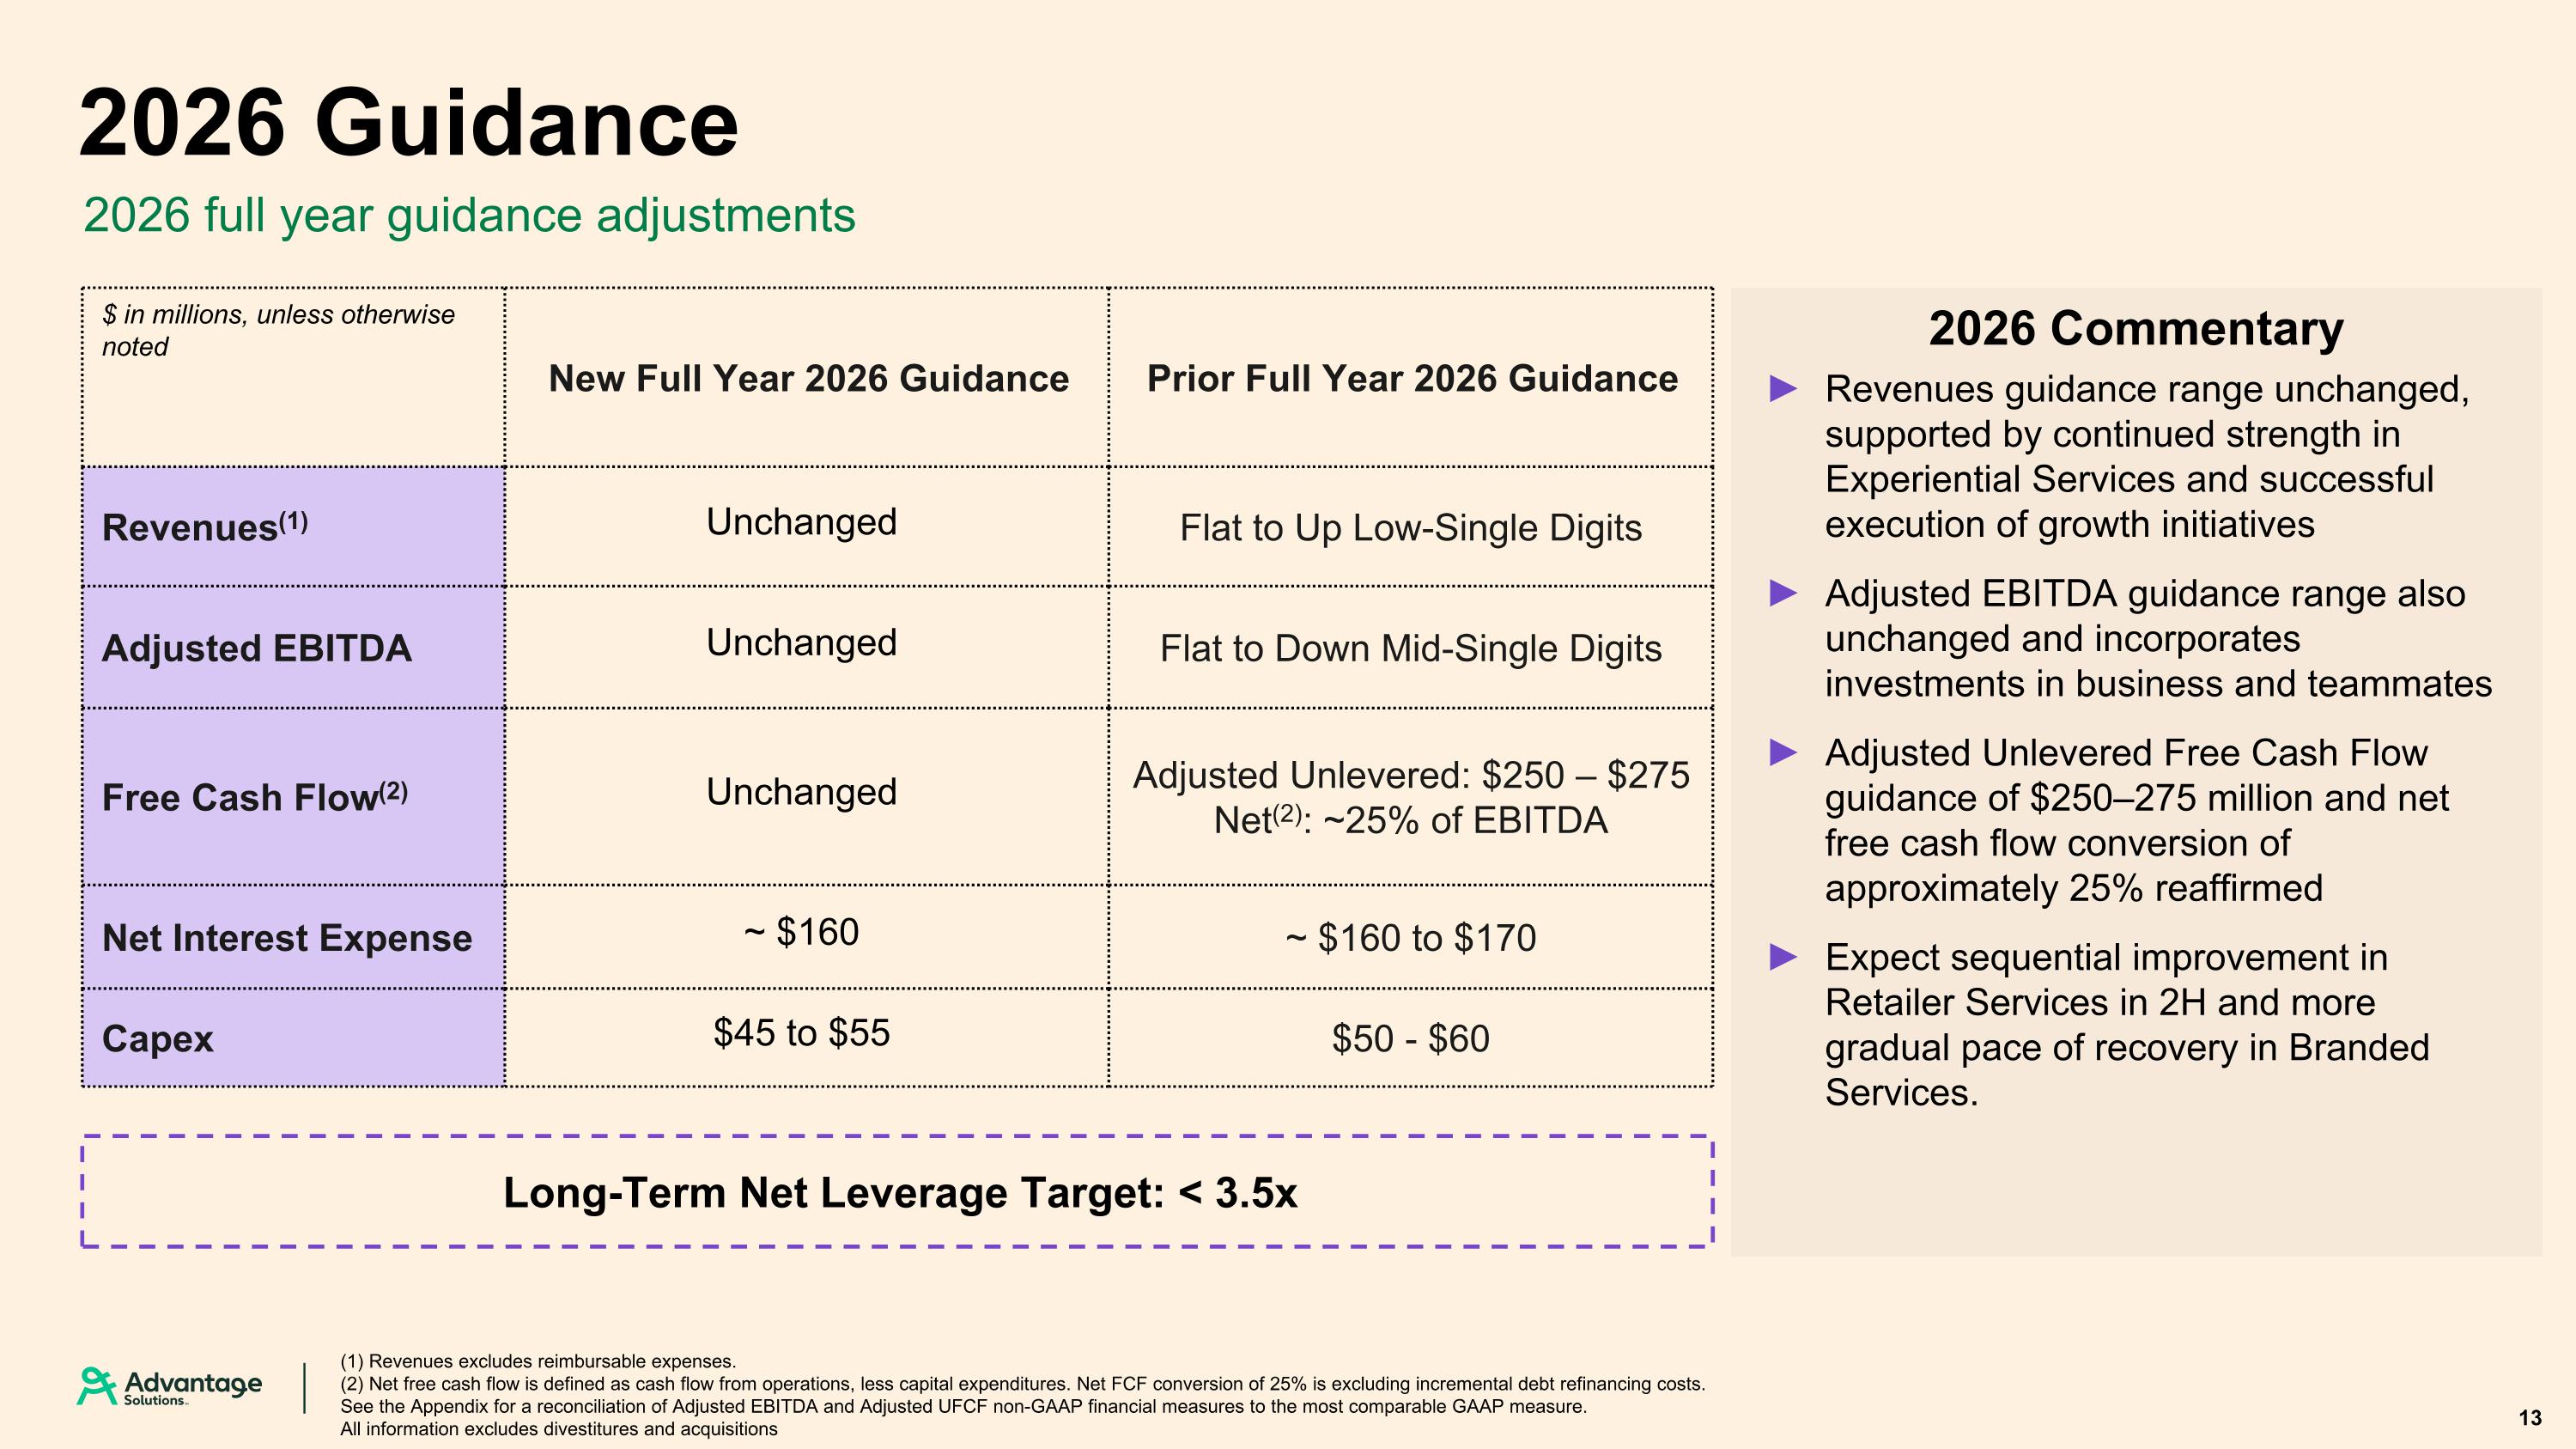
2026 Guidance 2026 full year guidance adjustments $ in millions, unless otherwise noted New Full Year 2026 Guidance Prior Full Year 2026 Guidance Revenues(1) Unchanged Flat to Up Low-Single Digits Adjusted EBITDA Unchanged Flat to Down Mid-Single Digits Free Cash Flow(2) Unchanged Adjusted Unlevered: $250 – $275 Net(2): ~25% of EBITDA Net Interest Expense ~ $160 ~ $160 to $170 Capex $45 to $55 $50 - $60 (1) Revenues excludes reimbursable expenses. (2) Net free cash flow is defined as cash flow from operations, less capital expenditures. Net FCF conversion of 25% is excluding incremental debt refinancing costs. See the Appendix for a reconciliation of Adjusted EBITDA and Adjusted UFCF non-GAAP financial measures to the most comparable GAAP measure. All information excludes divestitures and acquisitions 13 Long-Term Net Leverage Target: < 3.5x 2026 Commentary Revenues guidance range unchanged, supported by continued strength in Experiential Services and successful execution of growth initiatives Adjusted EBITDA guidance range also unchanged and incorporates investments in business and teammates Adjusted Unlevered Free Cash Flow guidance of $250–275 million and net free cash flow conversion of approximately 25% reaffirmed Expect sequential improvement in Retailer Services in 2H and more gradual pace of recovery in Branded Services.

Appendix 14
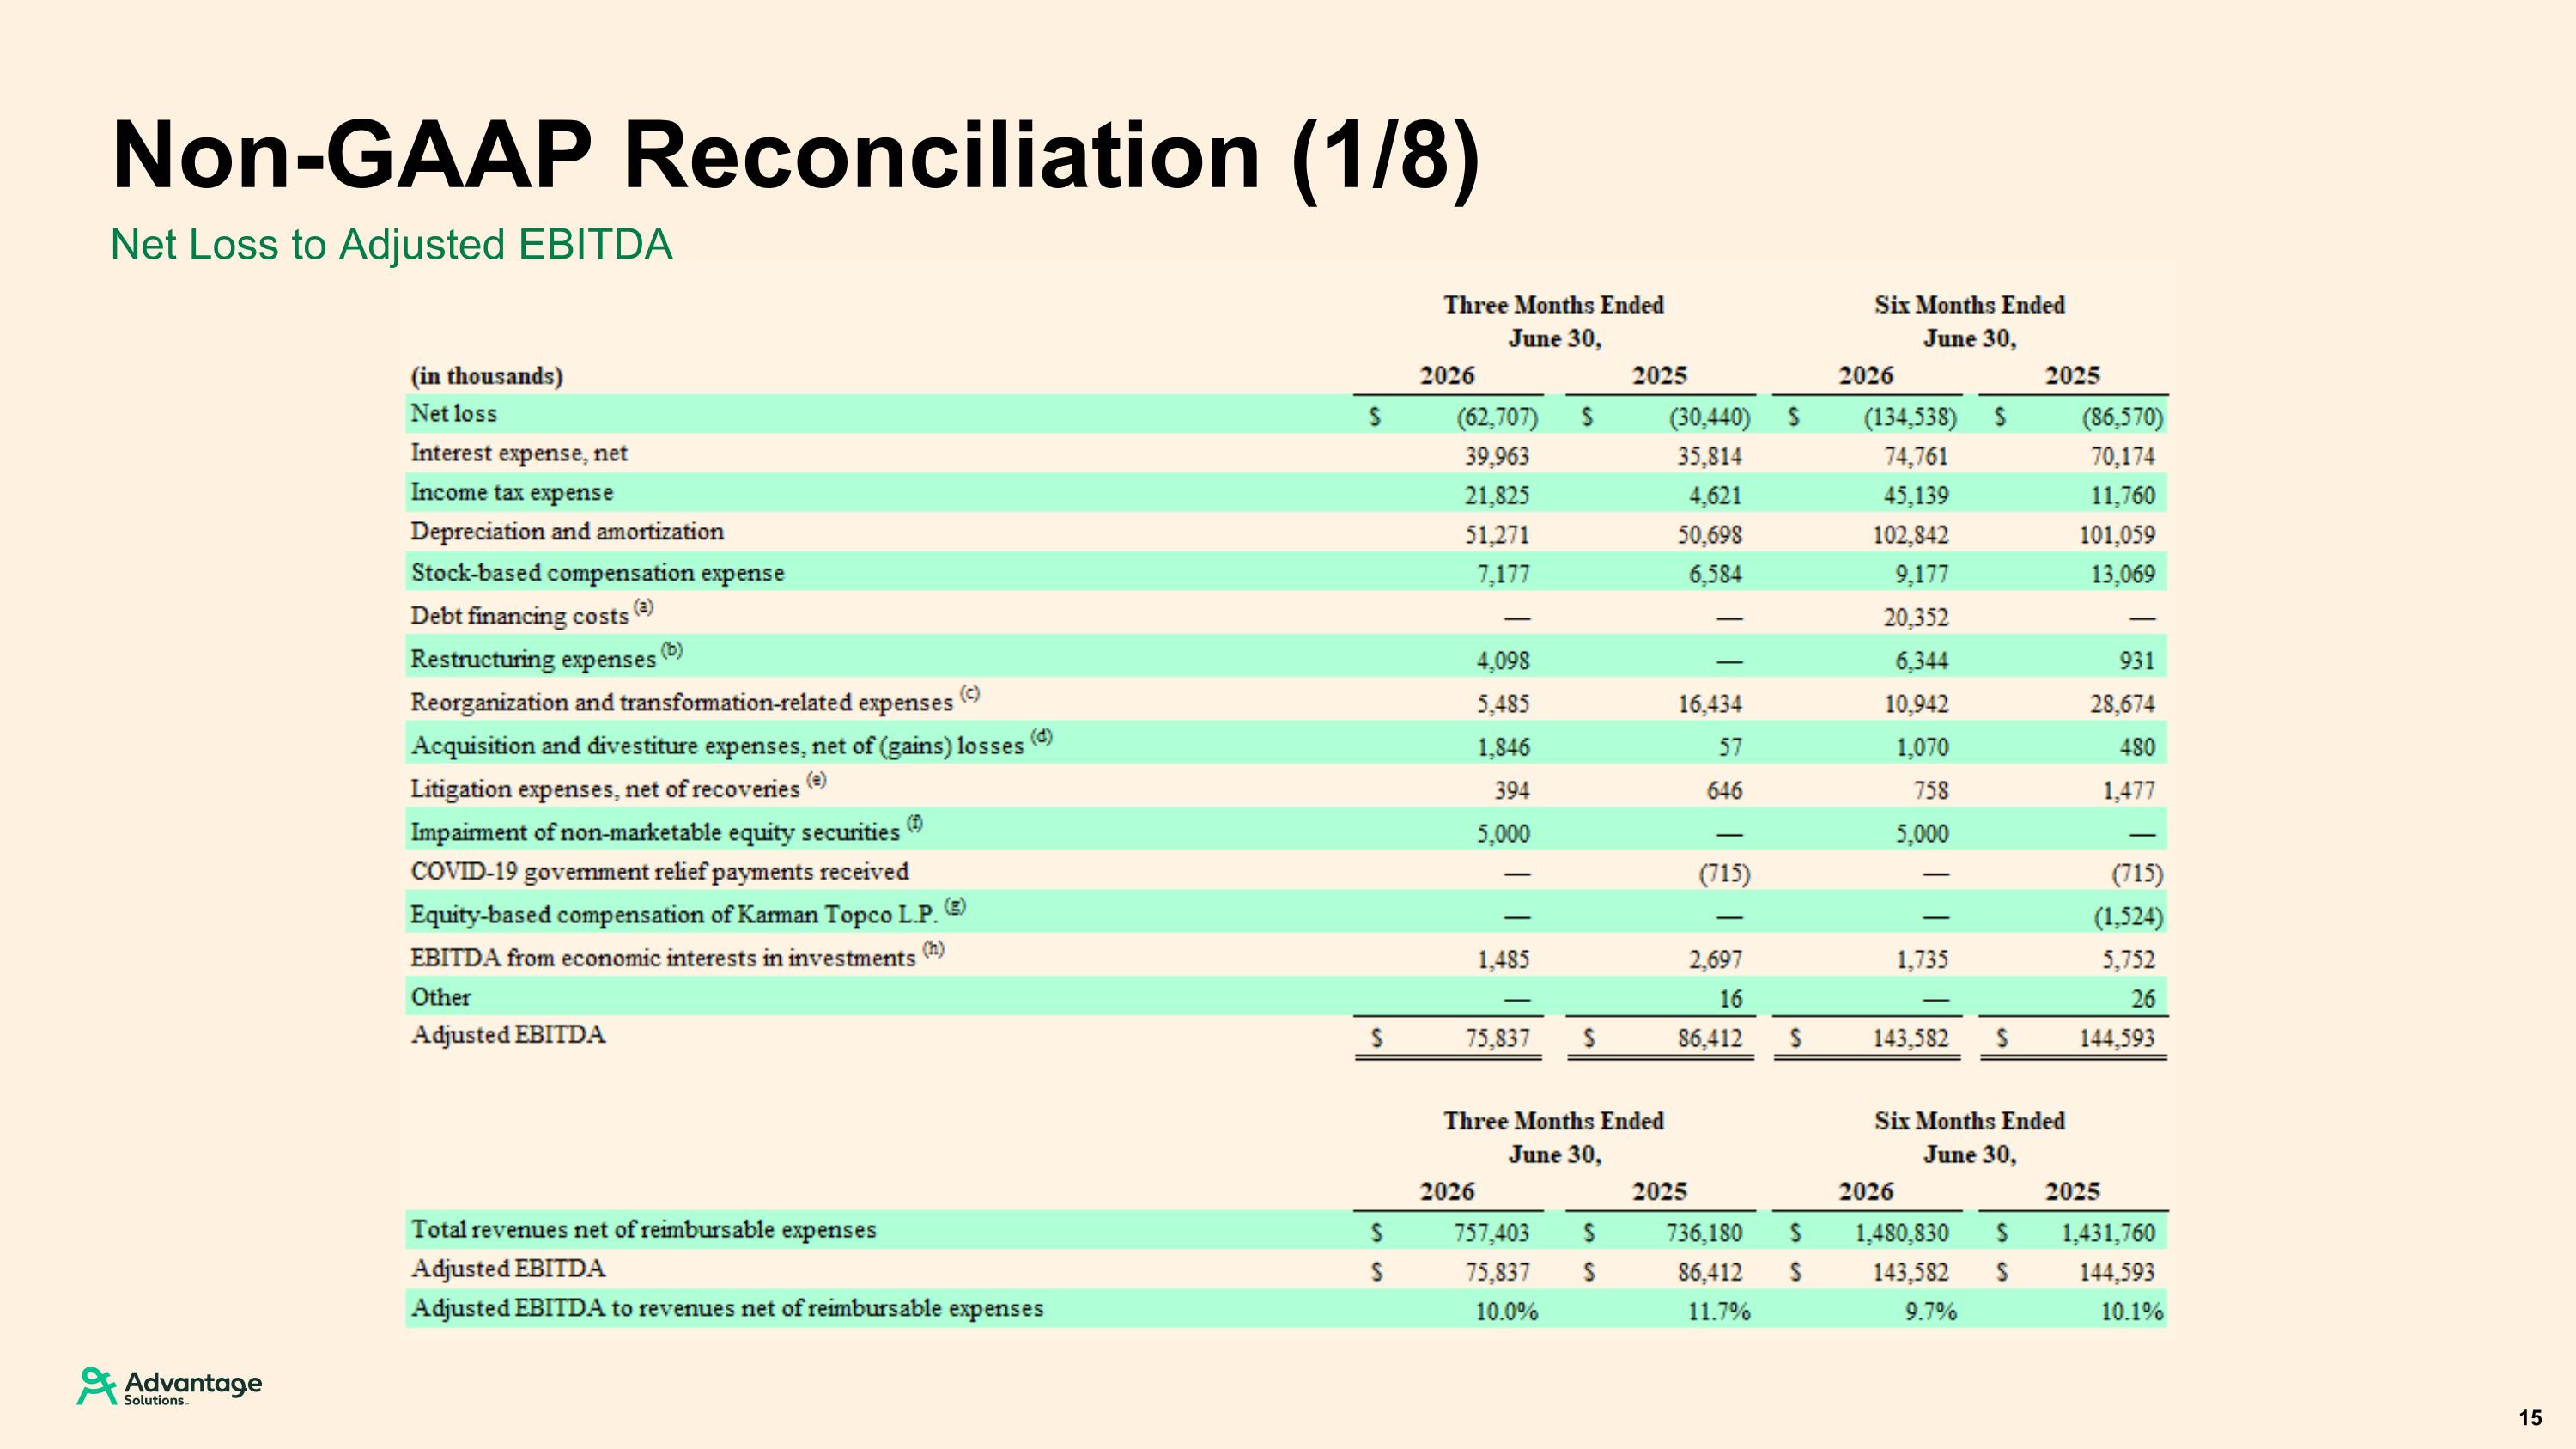
Net Loss to Adjusted EBITDA Non-GAAP Reconciliation (1/8) 15
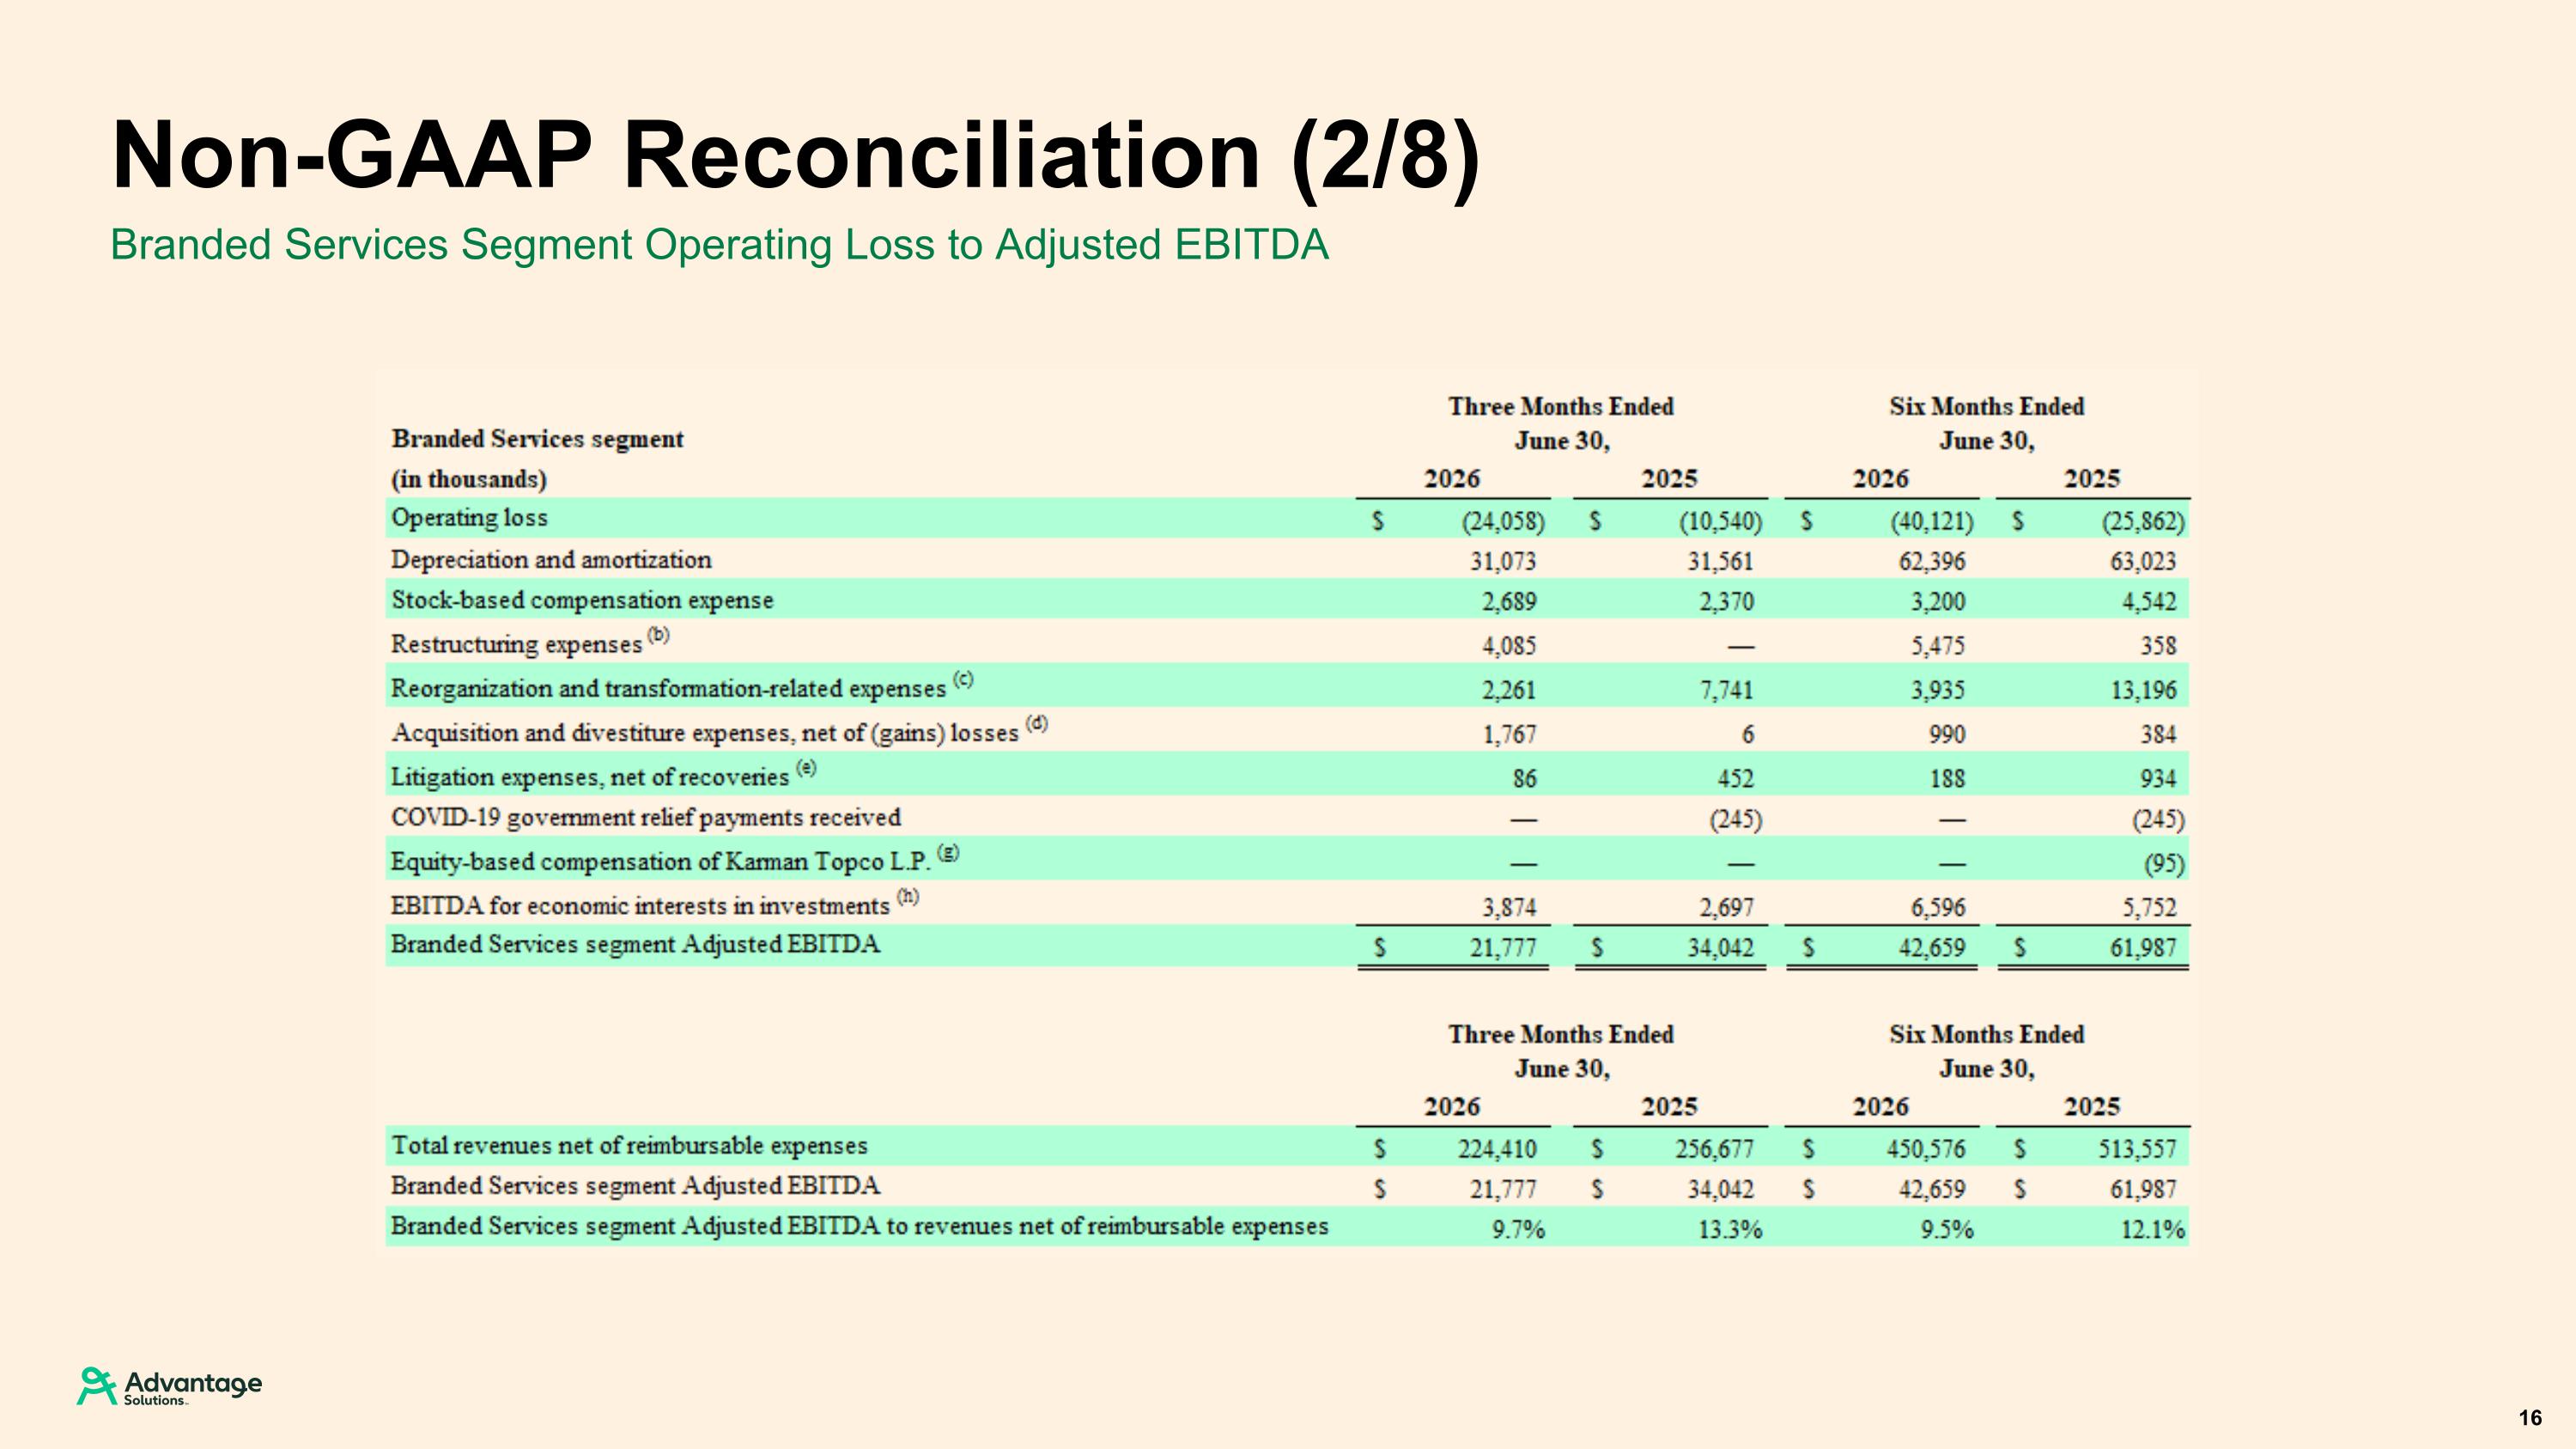
Branded Services Segment Operating Loss to Adjusted EBITDA Non-GAAP Reconciliation (2/8) 16
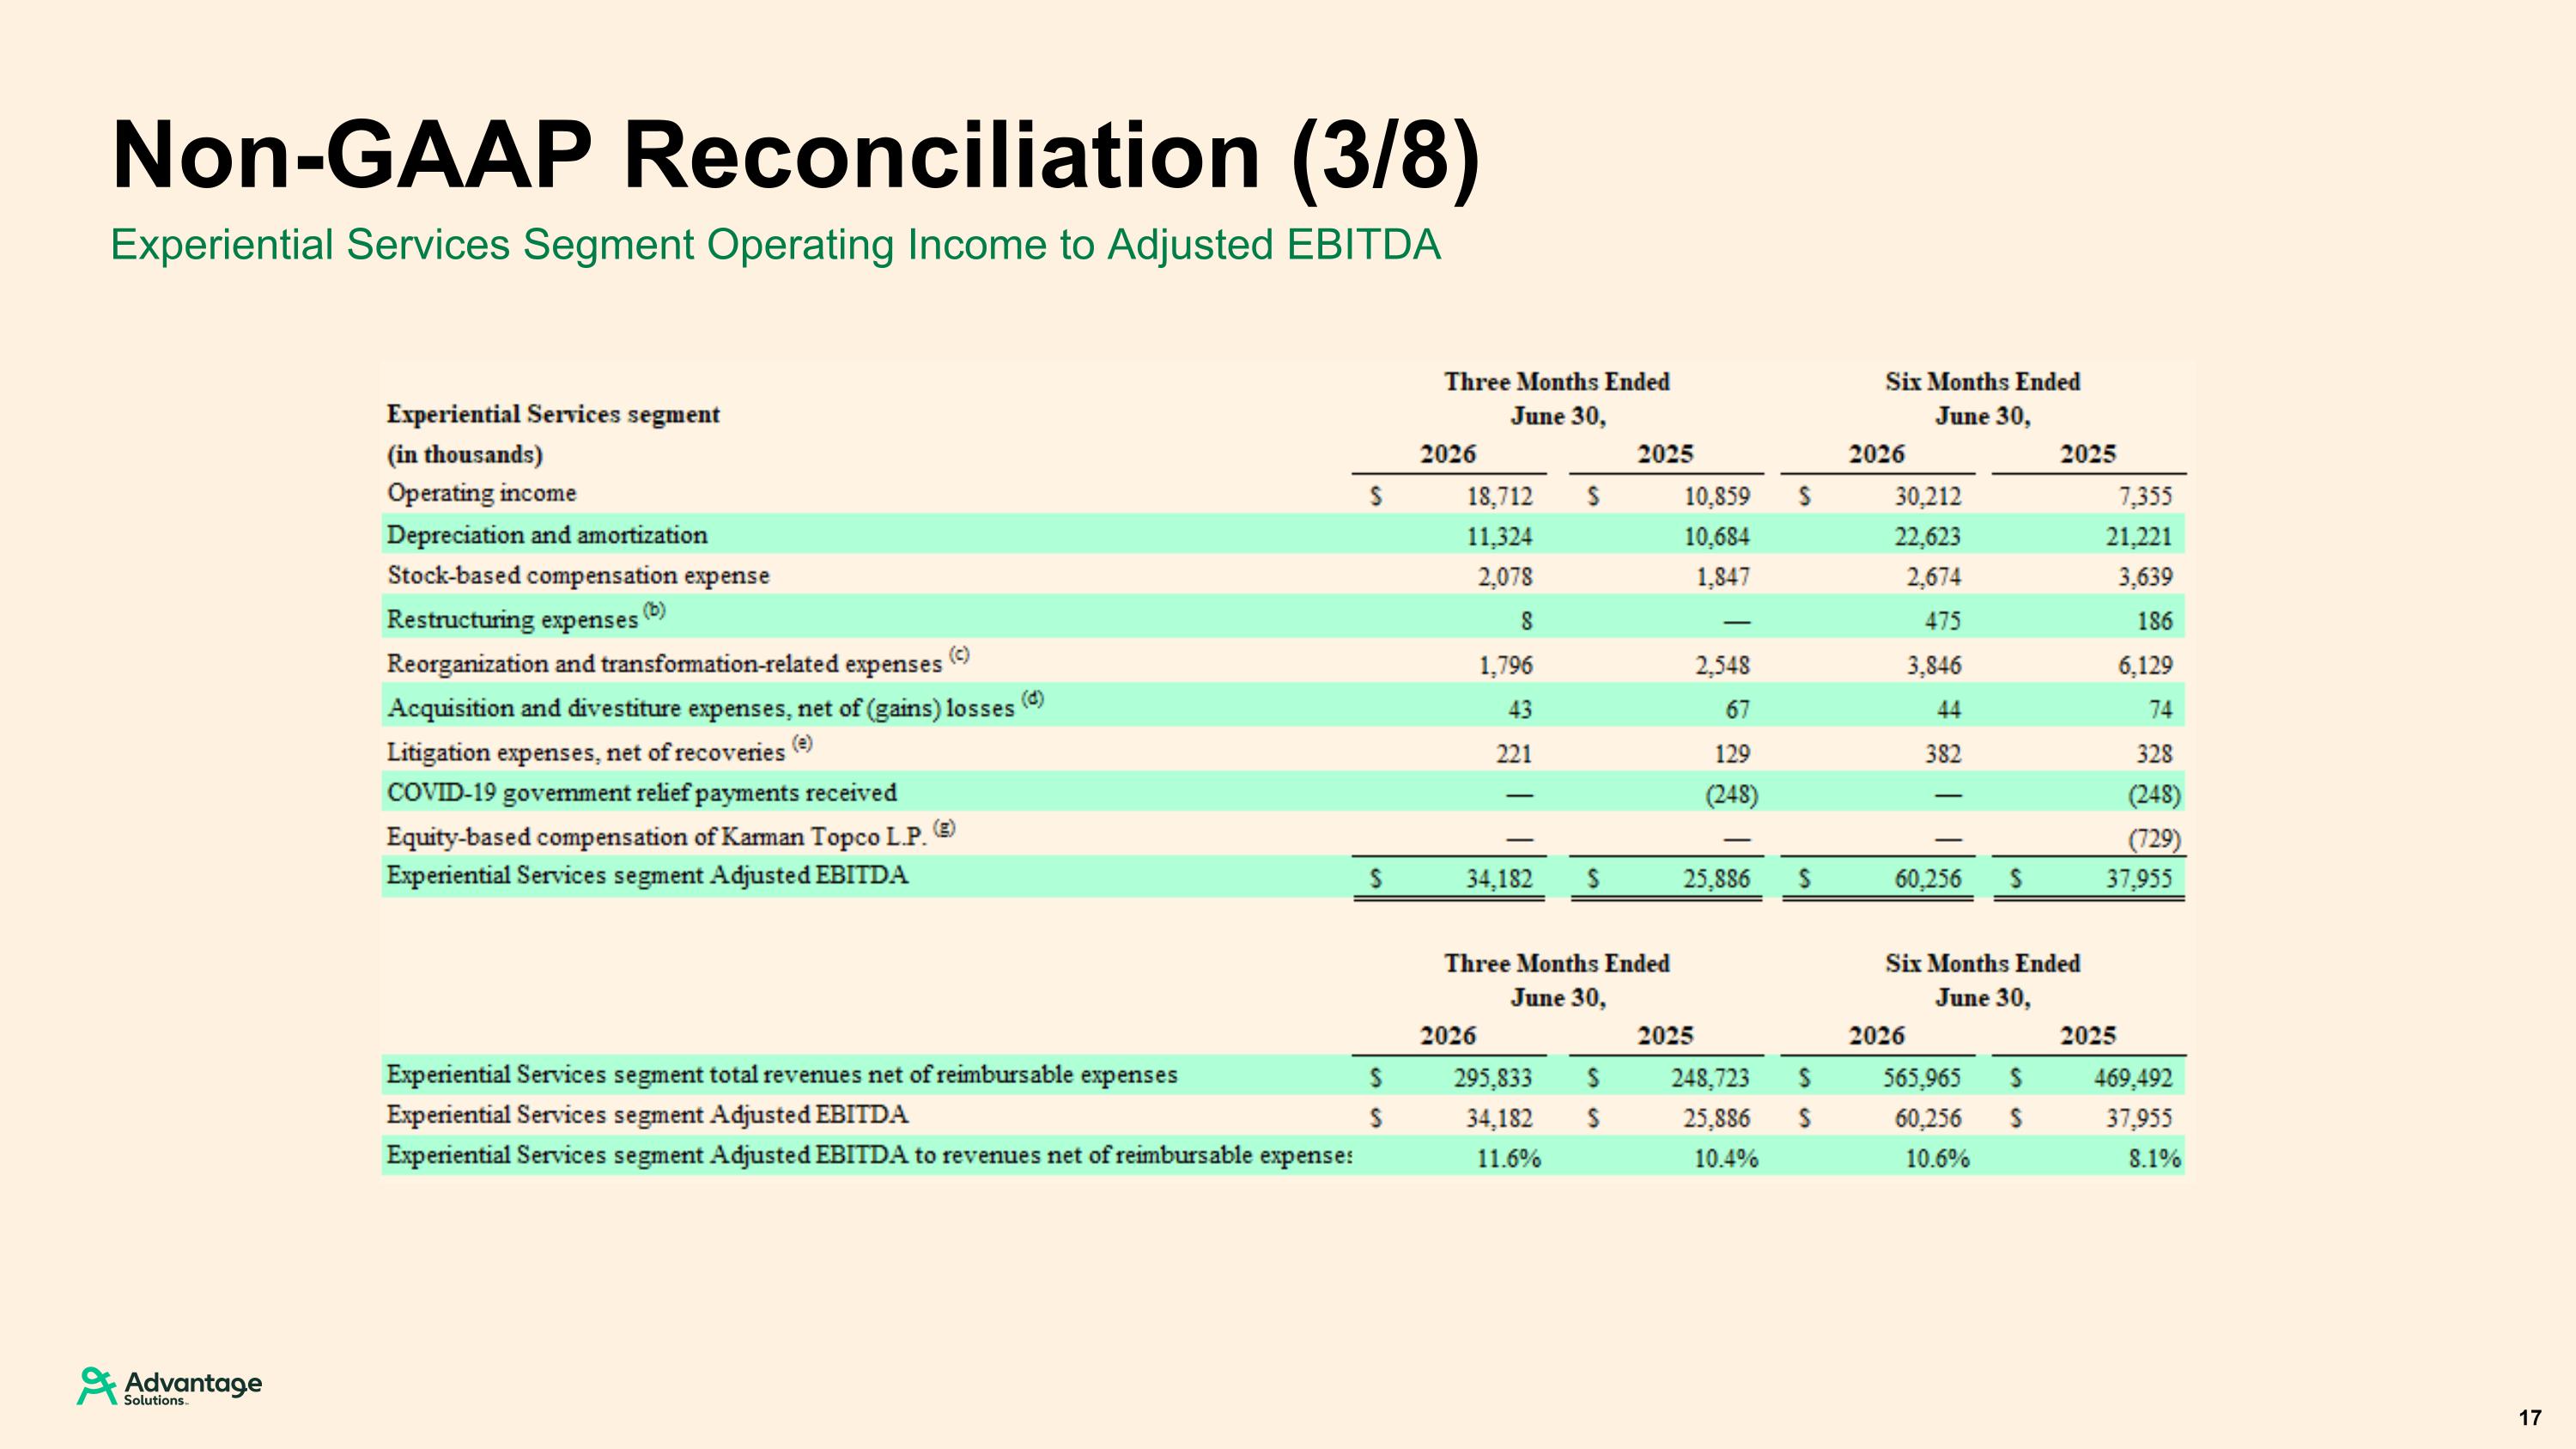
Experiential Services Segment Operating Income to Adjusted EBITDA Non-GAAP Reconciliation (3/8) 17
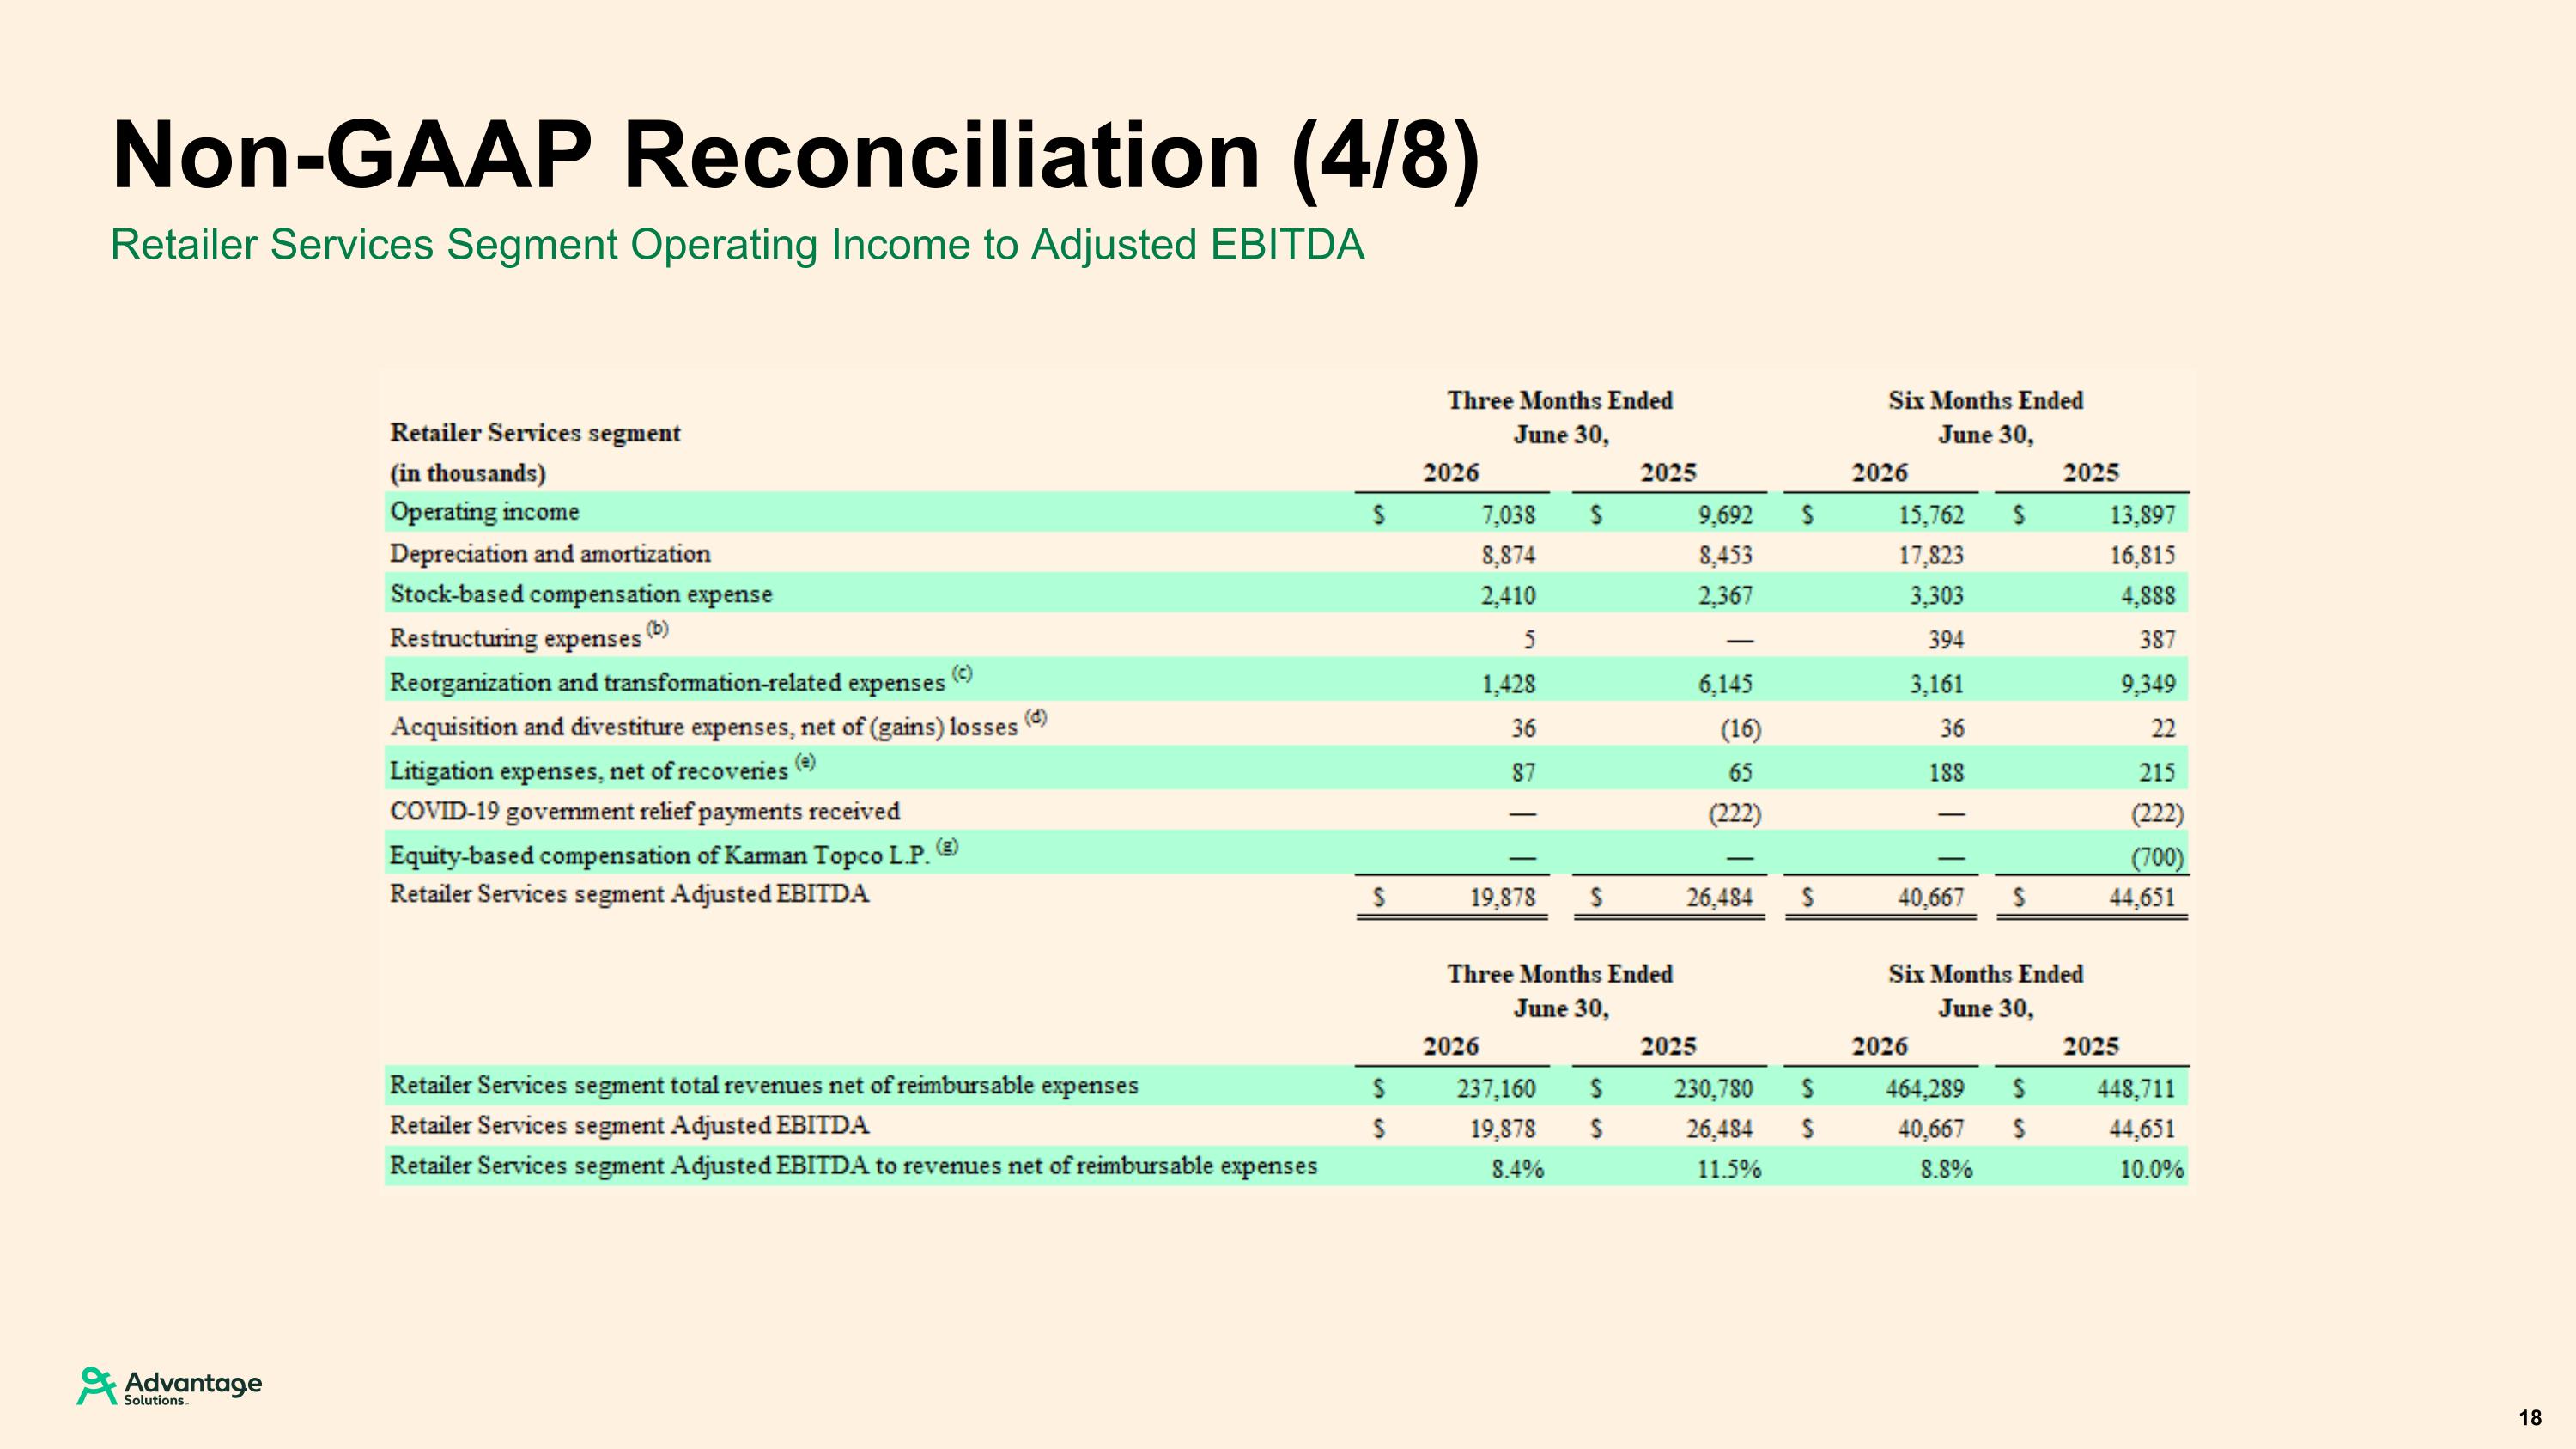
Retailer Services Segment Operating Income to Adjusted EBITDA Non-GAAP Reconciliation (4/8) 18
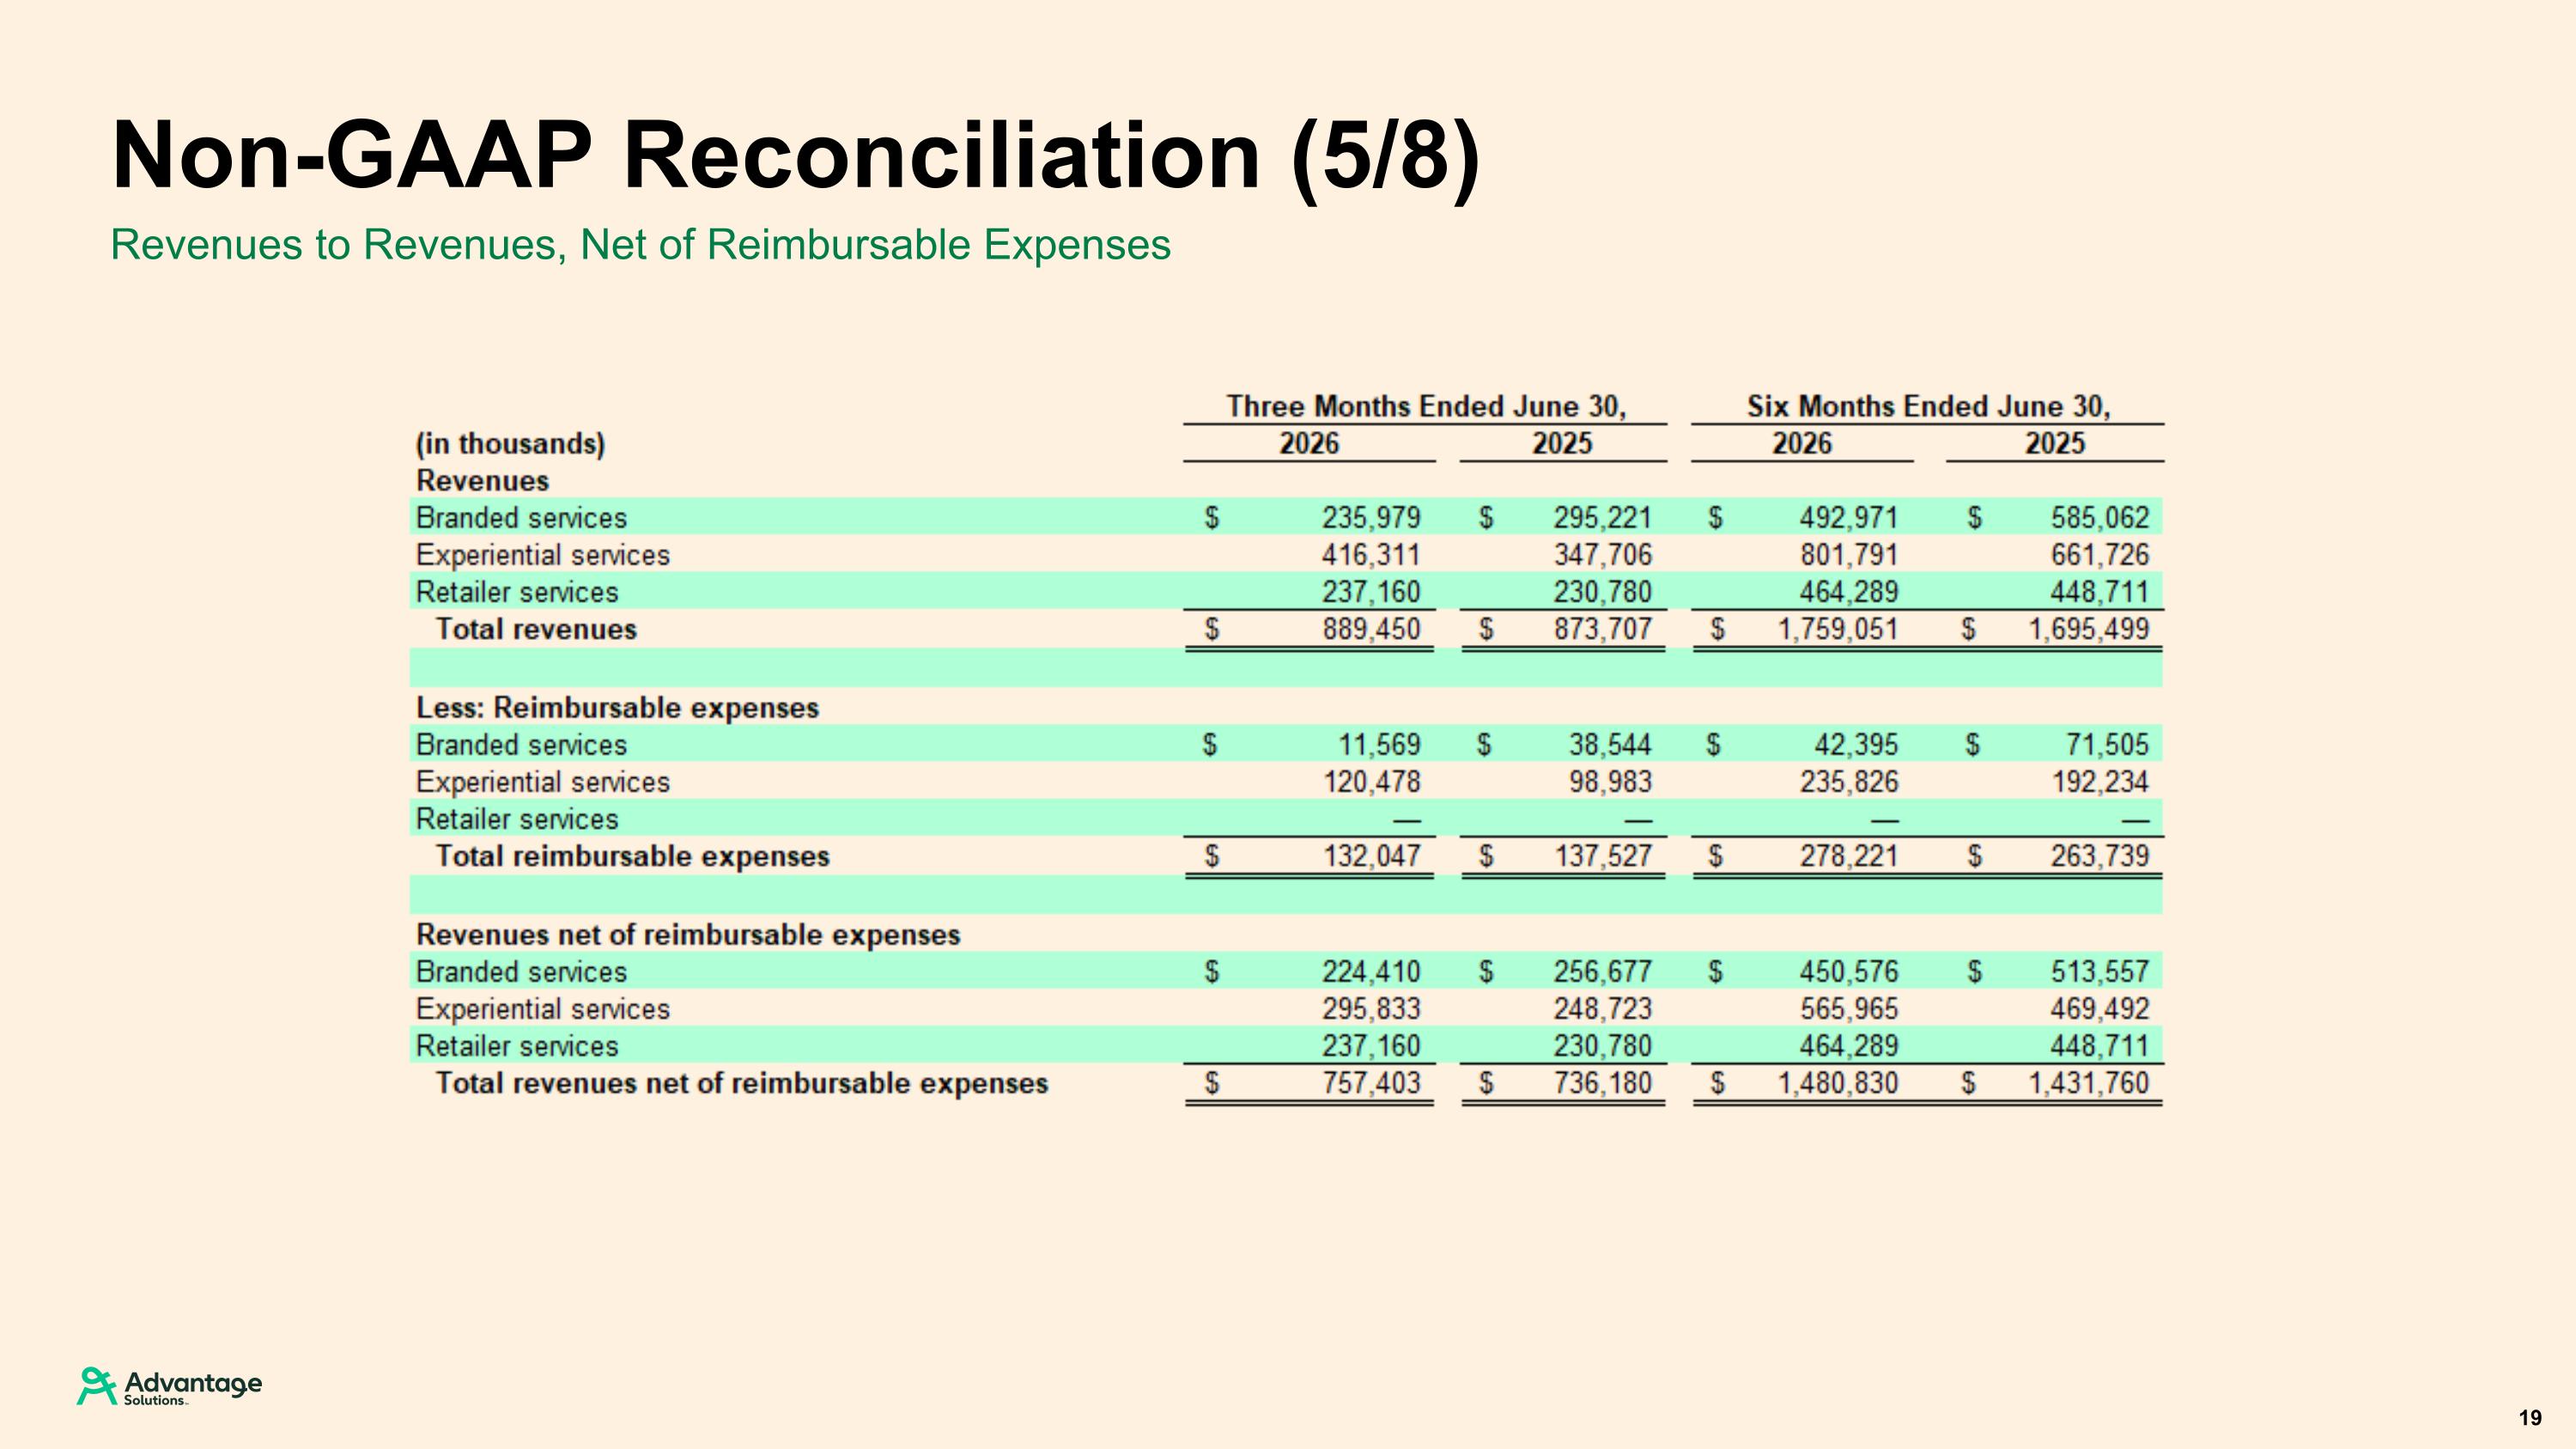
Revenues to Revenues, Net of Reimbursable Expenses Non-GAAP Reconciliation (5/8) 19
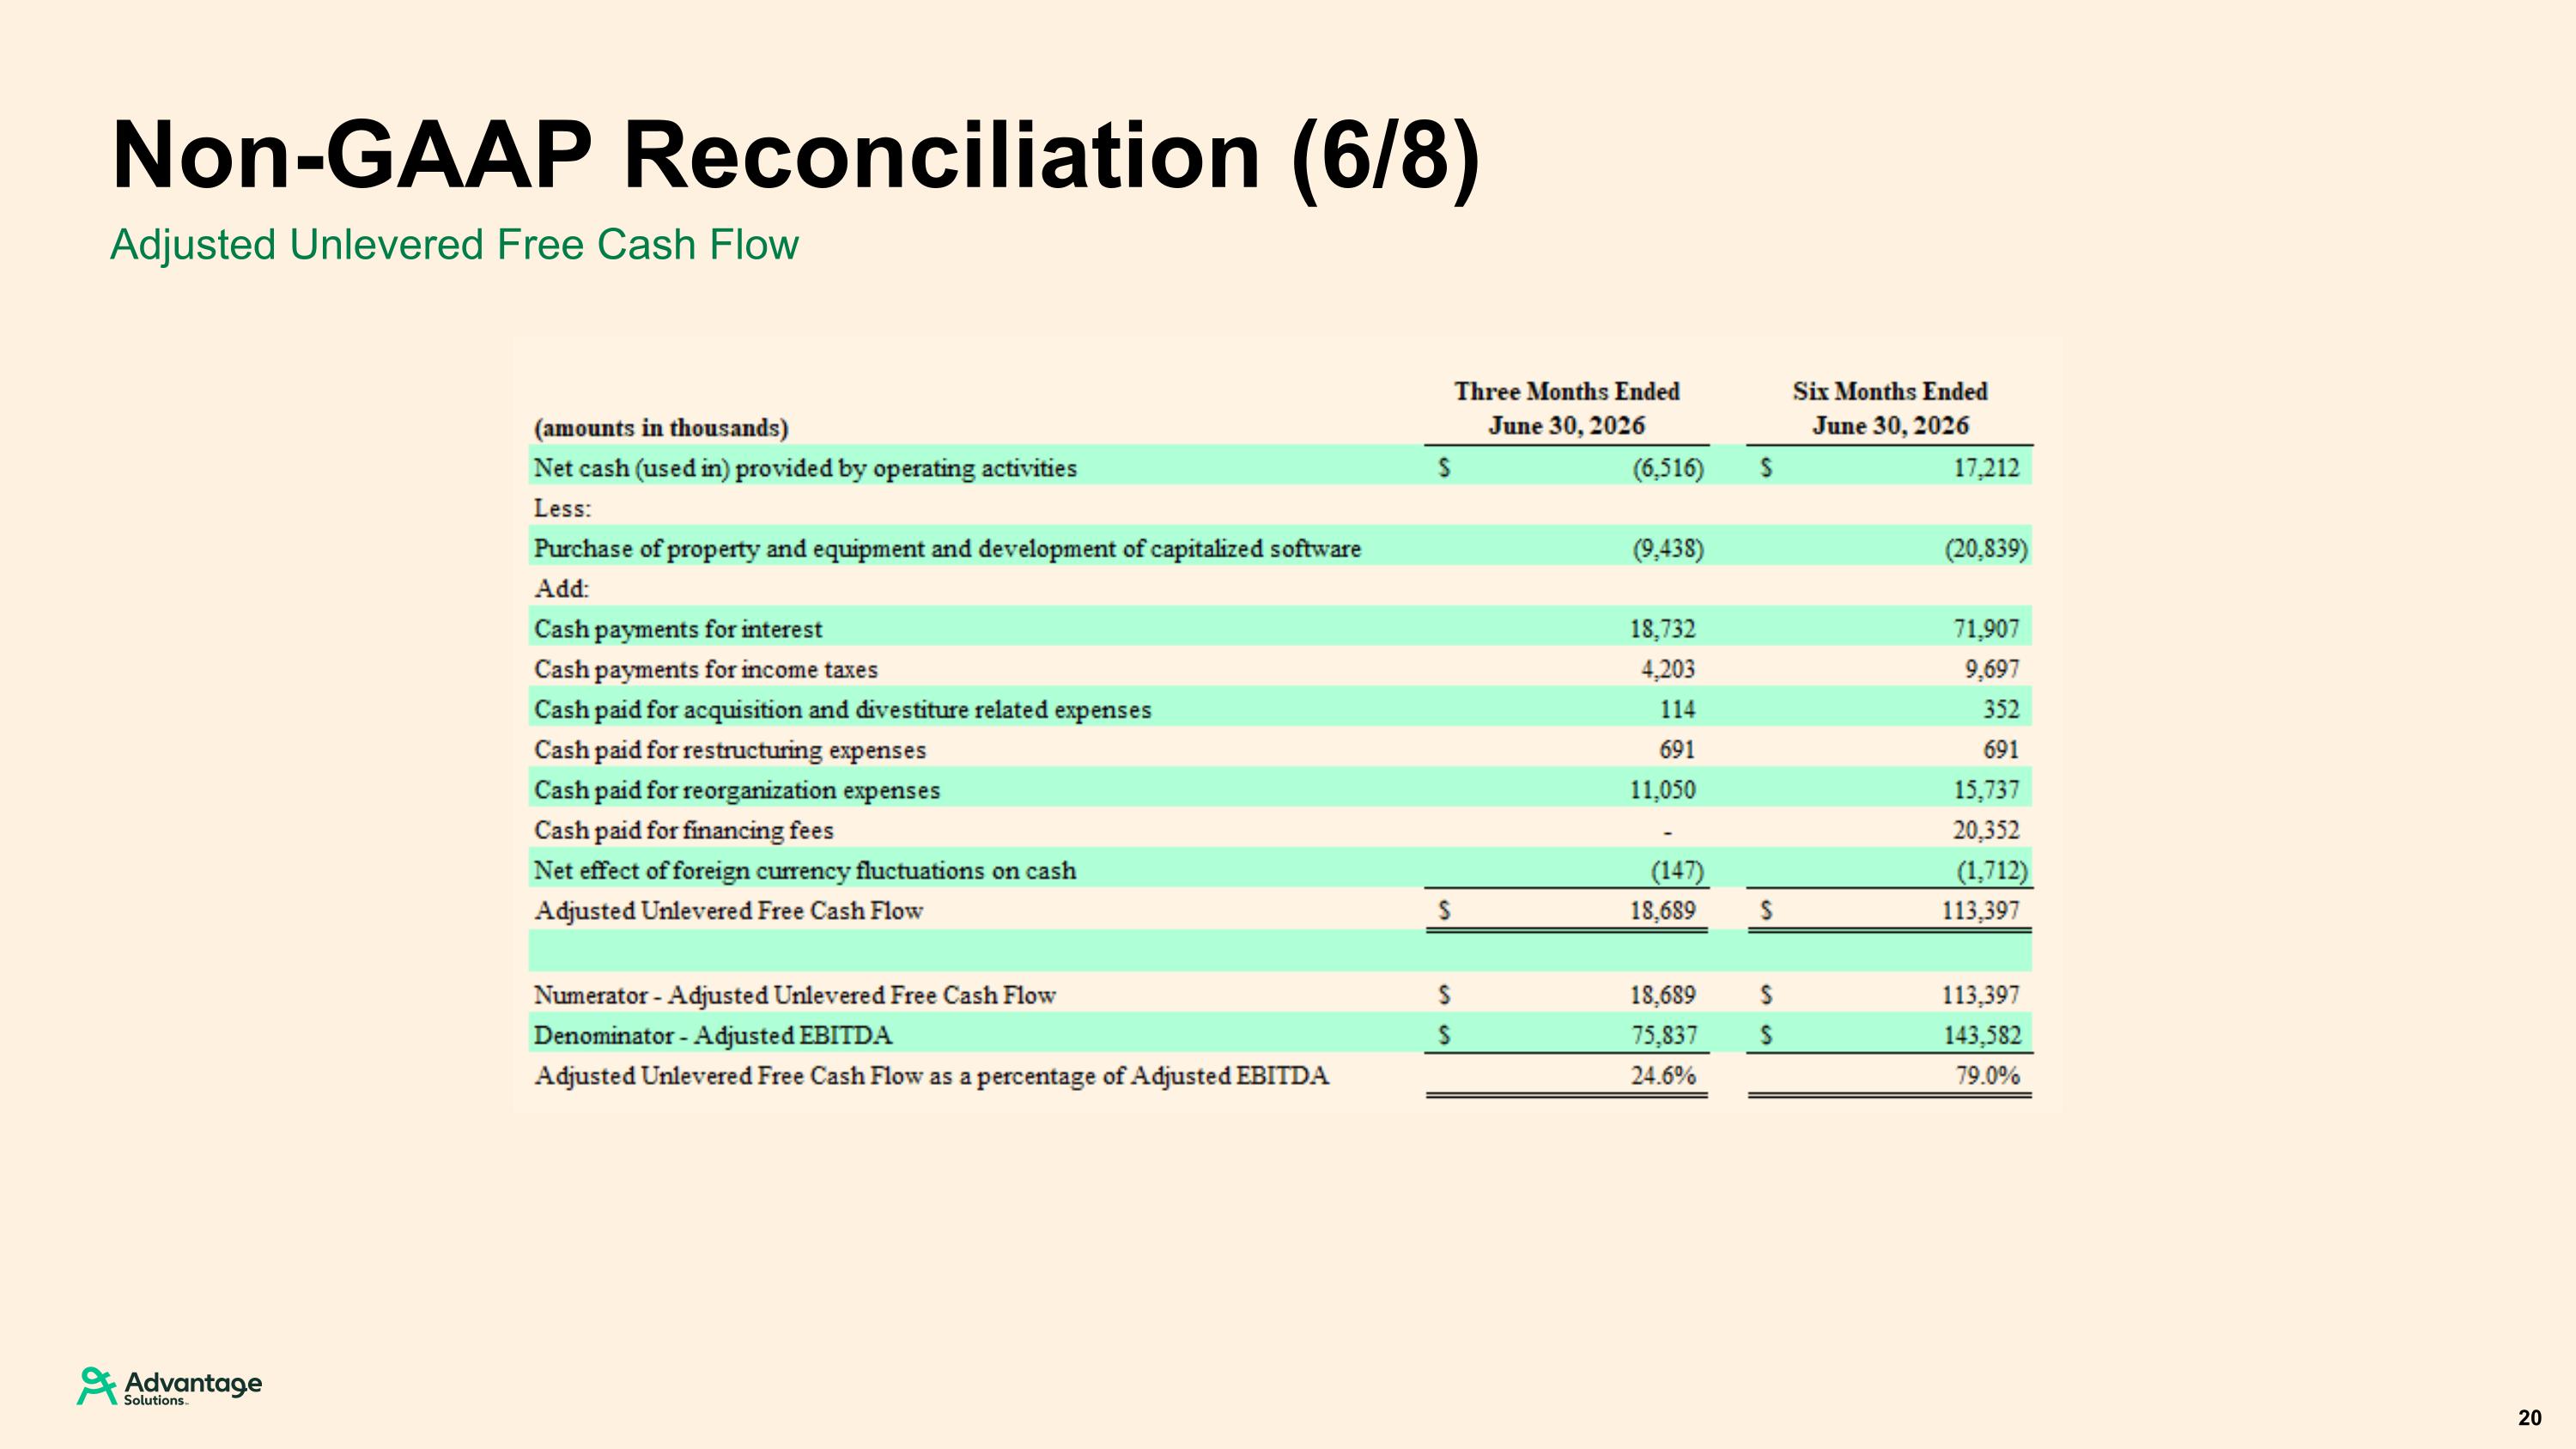
Adjusted Unlevered Free Cash Flow Non-GAAP Reconciliation (6/8) 20
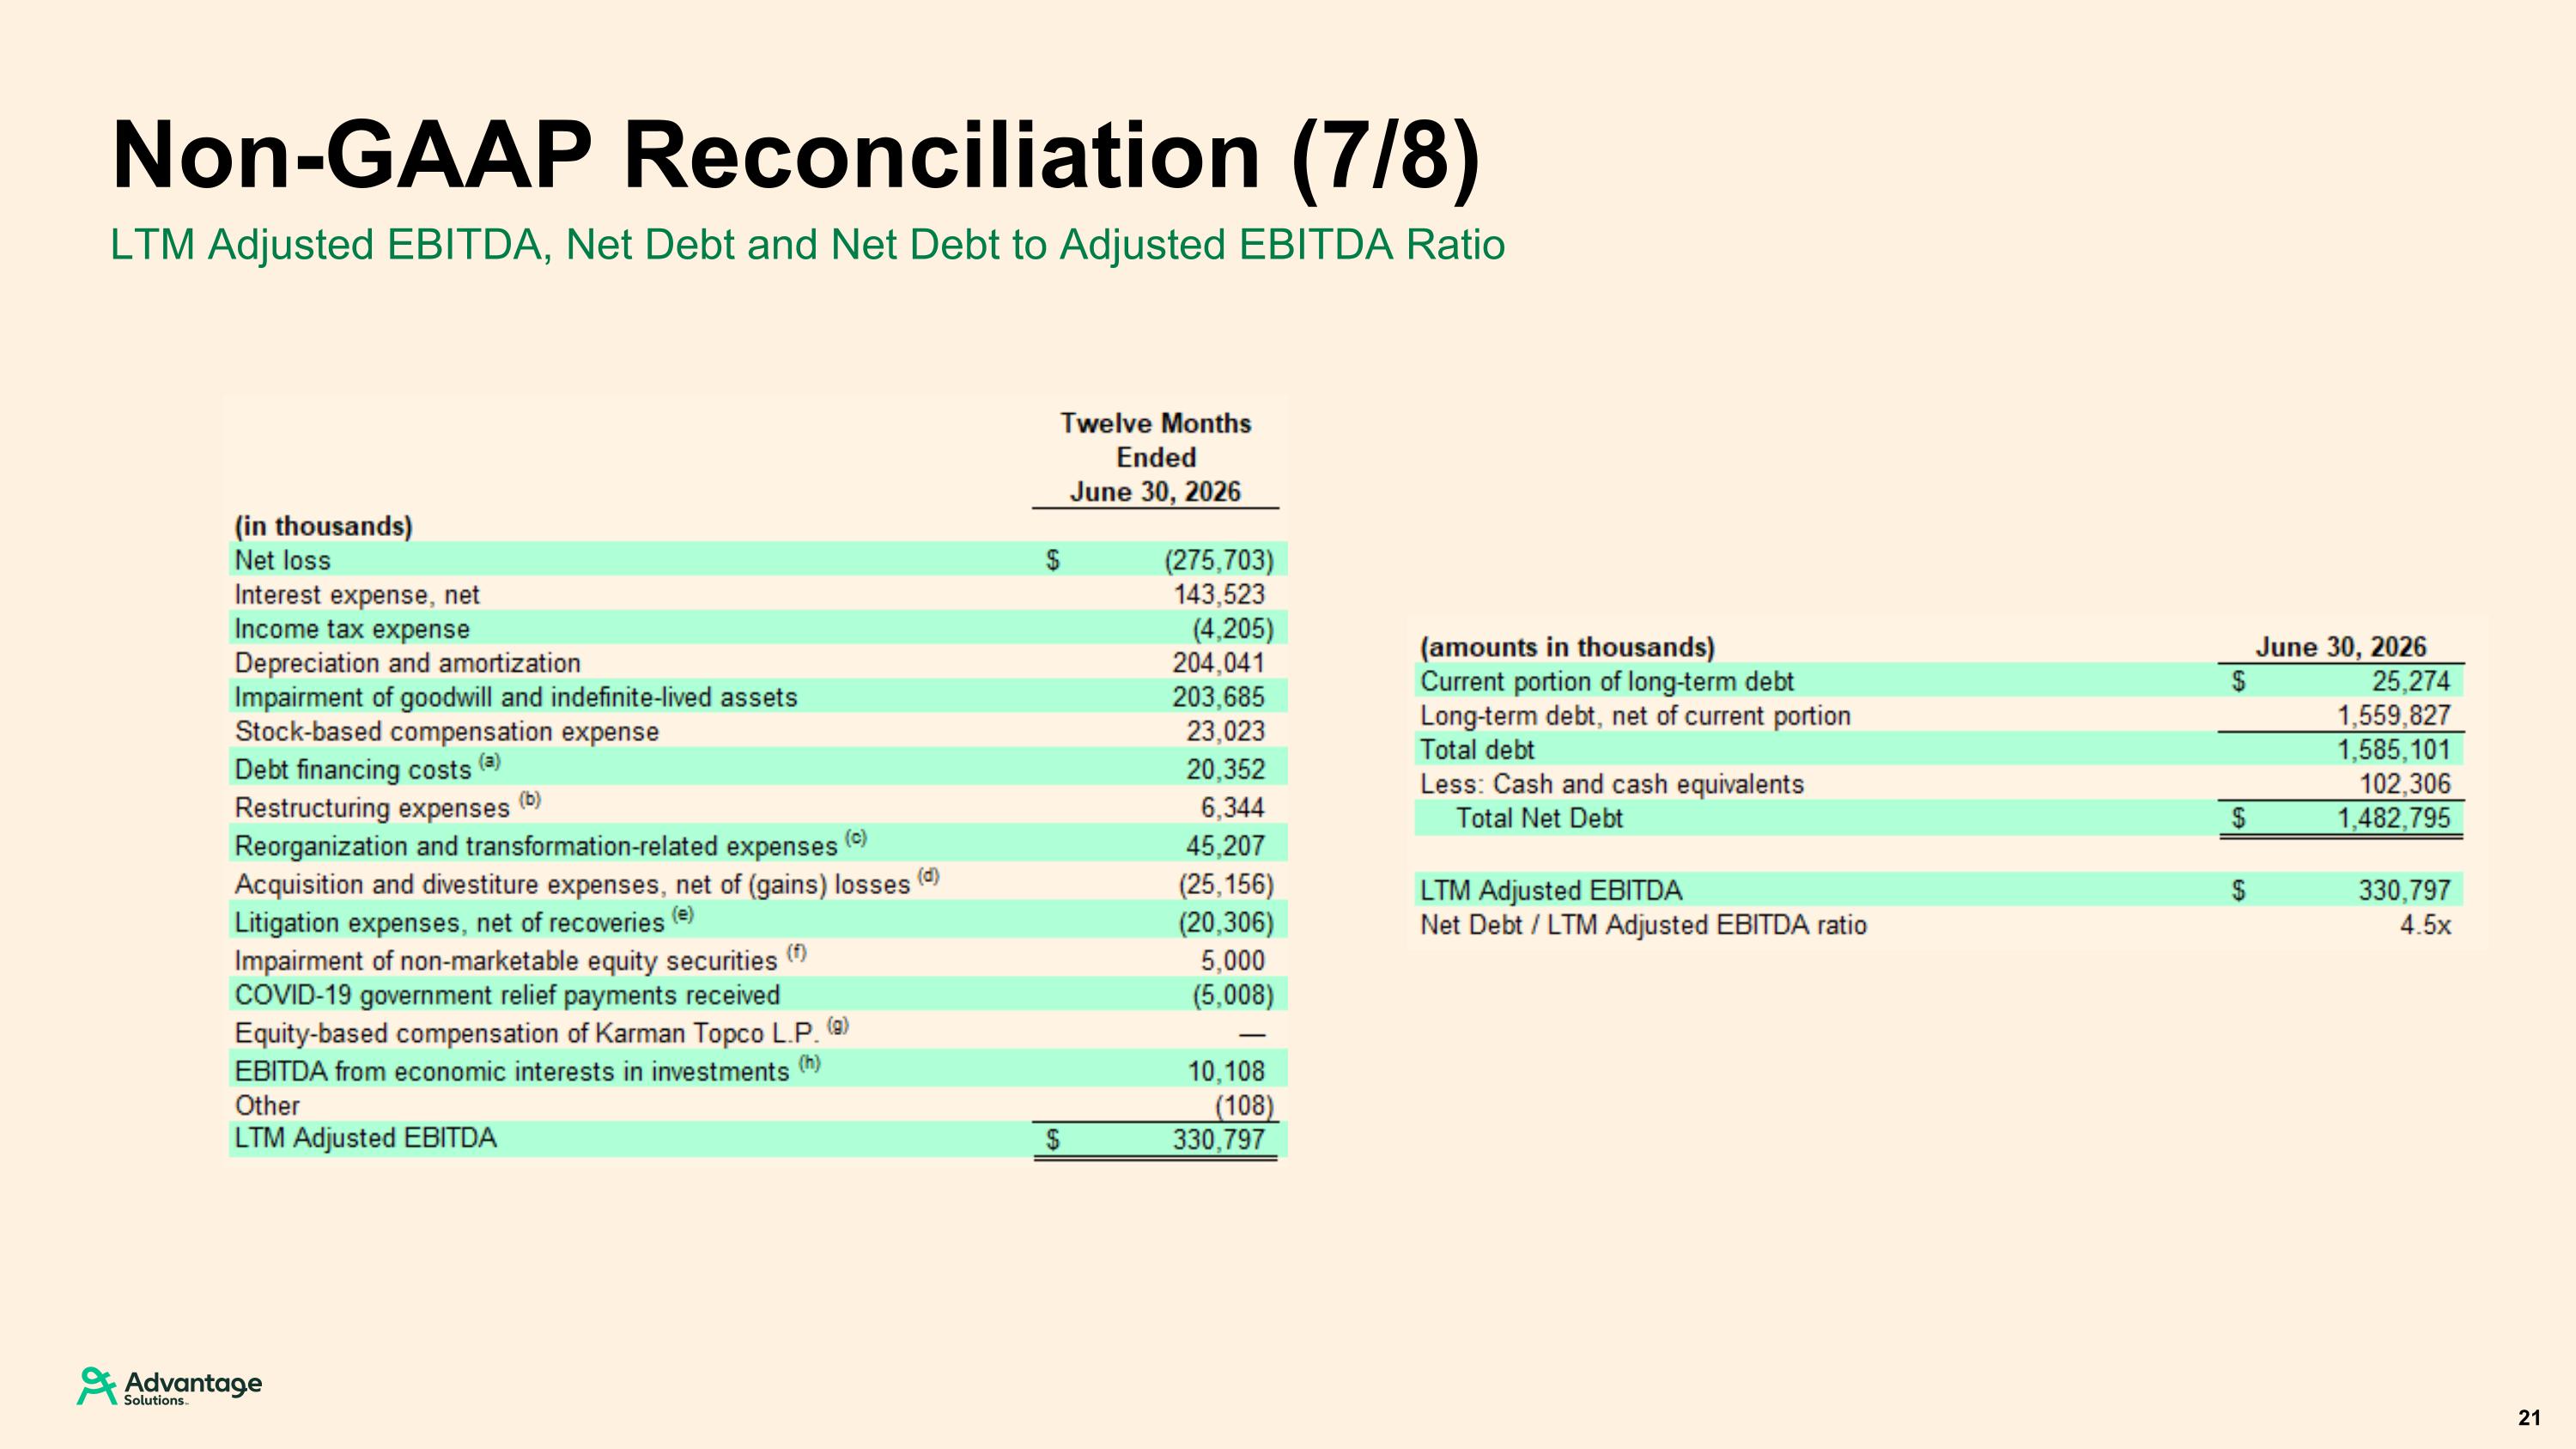
LTM Adjusted EBITDA, Net Debt and Net Debt to Adjusted EBITDA Ratio Non-GAAP Reconciliation (7/8) 21
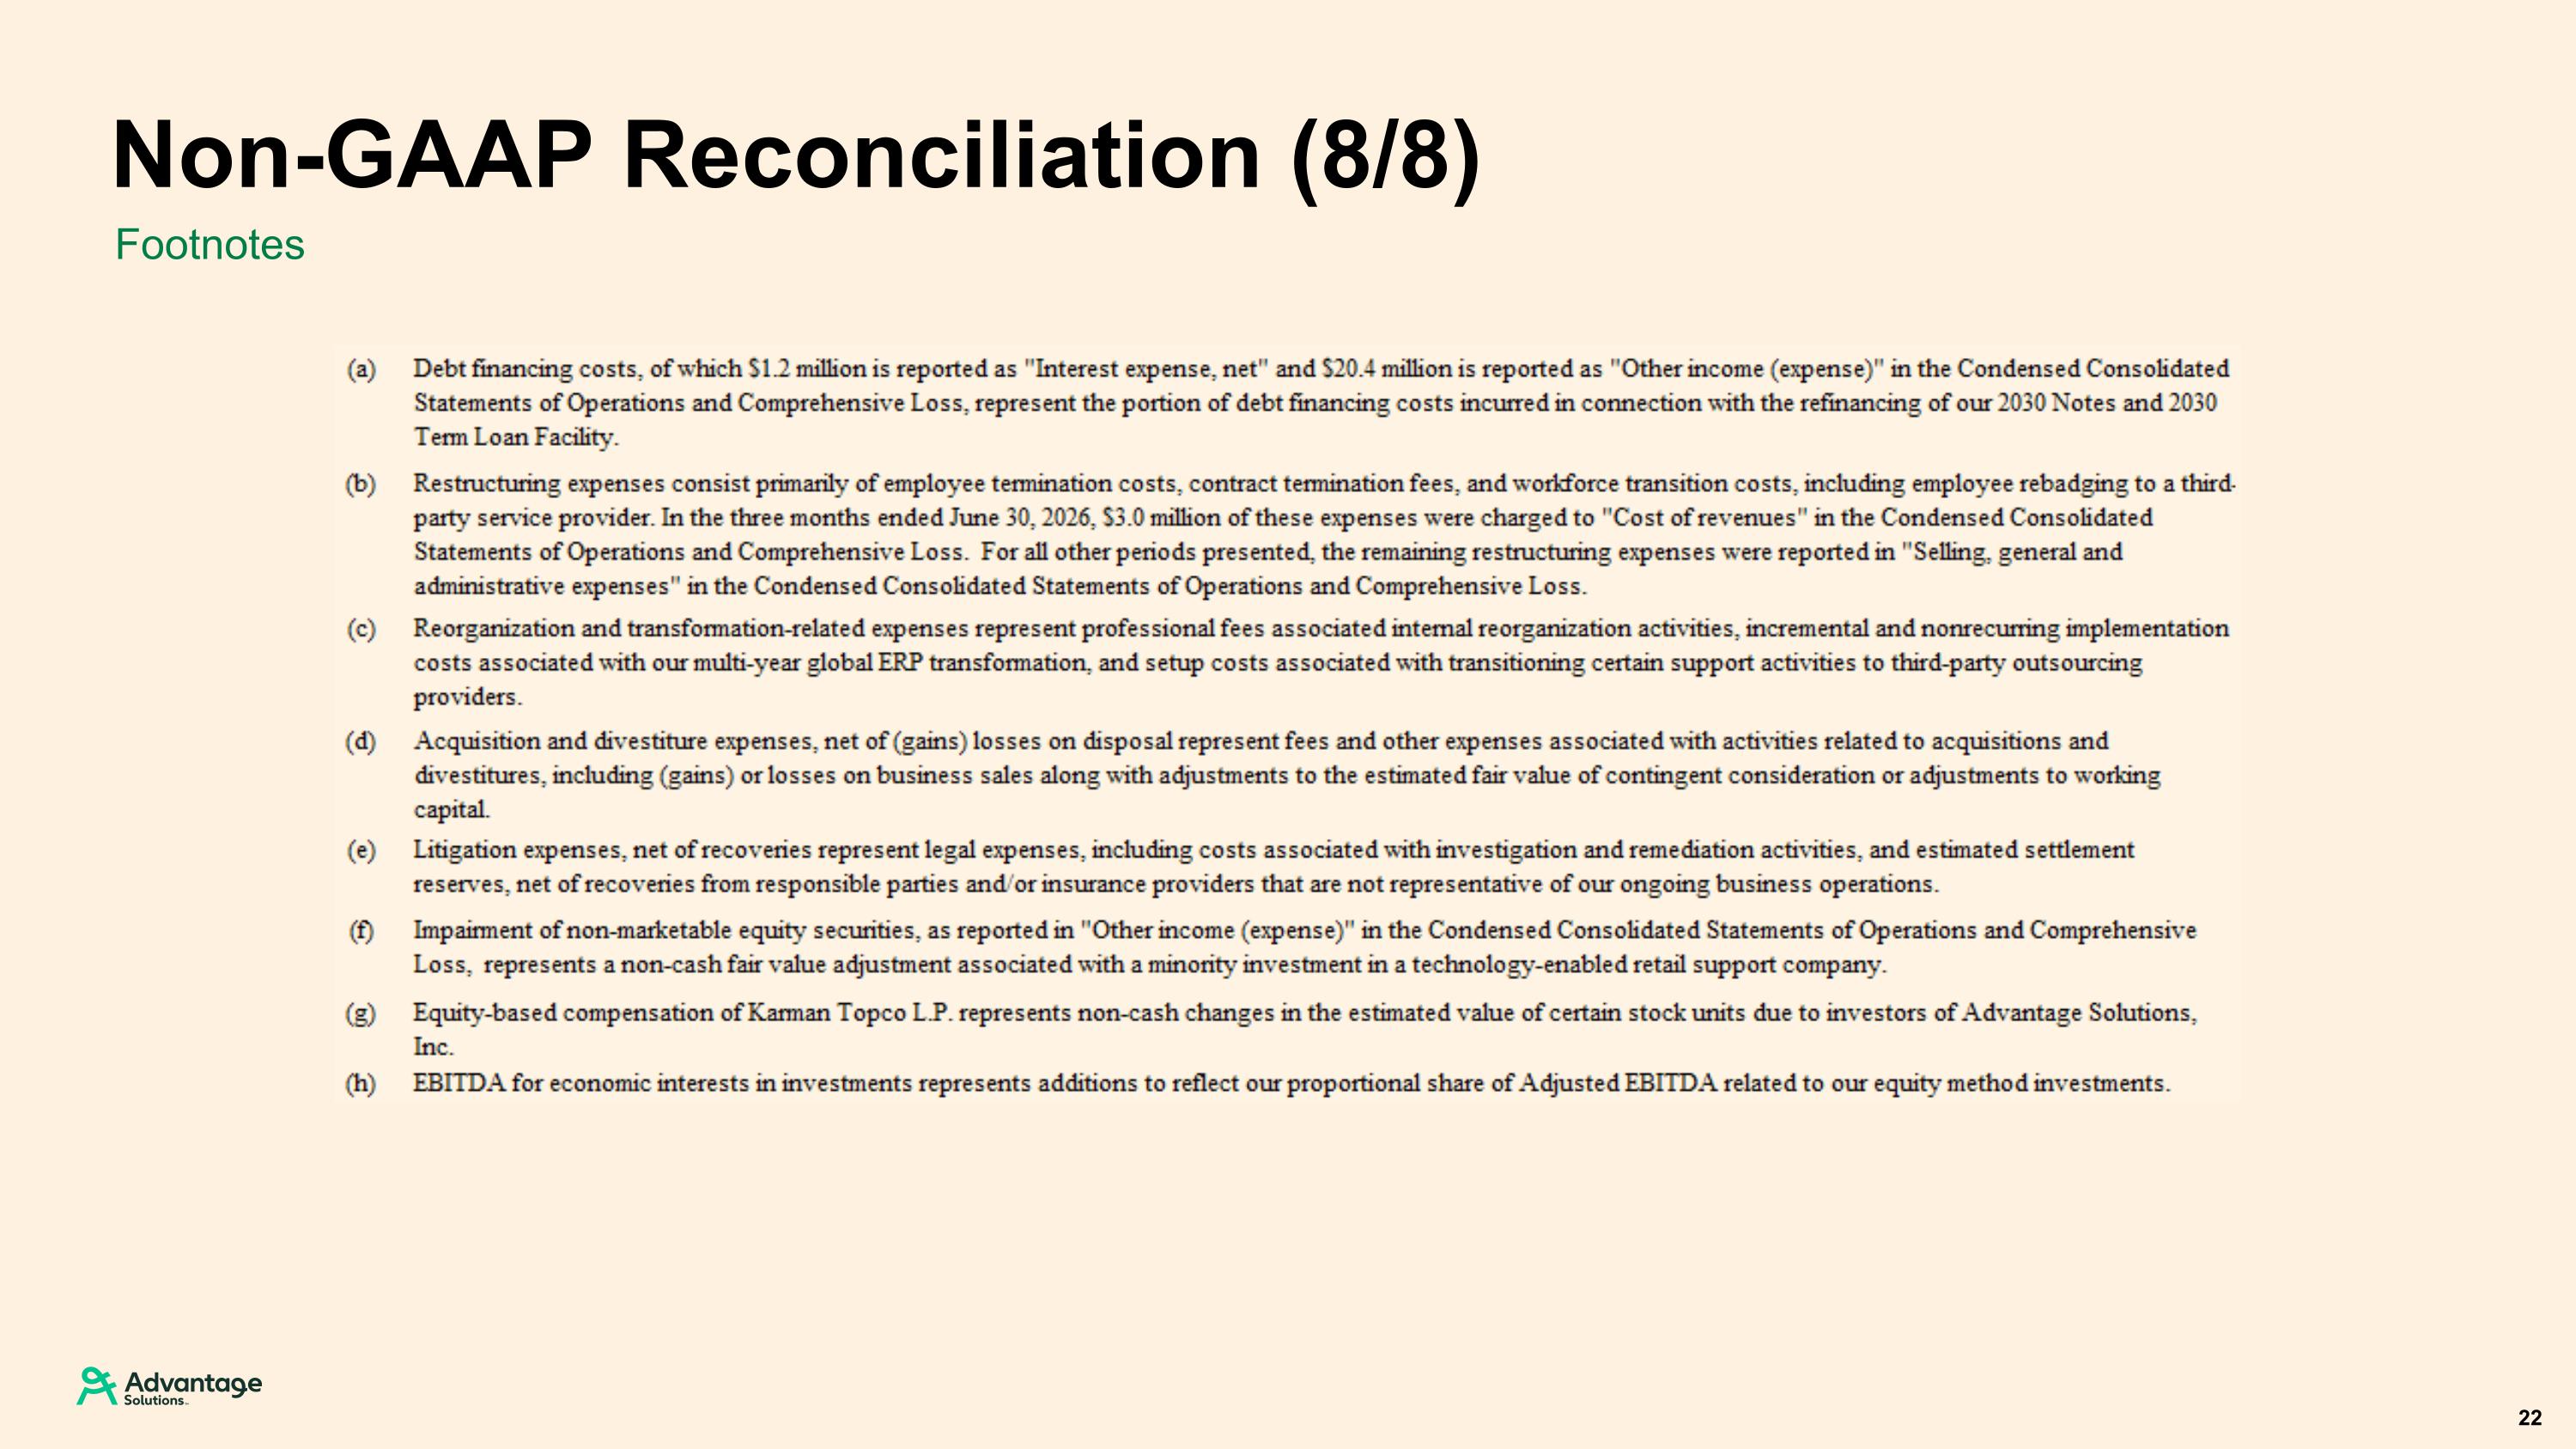
Footnotes Non-GAAP Reconciliation (8/8) 22