
Exhibit 99.3
Executing a Portfolio Transition Second Quarter 2026 Investor Presentation August 2026
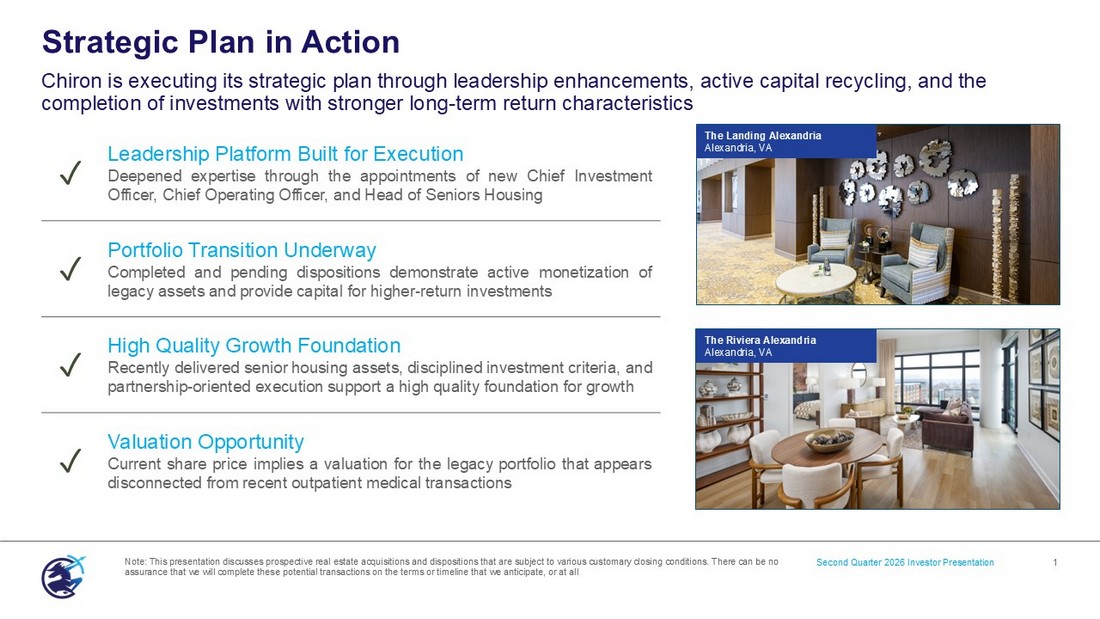
Strategic Plan in Action Chiron is executing its strategic plan through leadership enhancements, active capital recycling, and the completion of investments with stronger long - term return characteristics Second Quarter 2026 Investor Presentation 1 Note: This presentation discusses prospective real estate acquisitions and dispositions that are subject to various customary cl osing conditions. There can be no assurance that we will complete these potential transactions on the terms or timeline that we anticipate, or at all Leadership Platform Built for Execution Deepened expertise through the appointments of new Chief Investment Officer, Chief Operating Officer, and Head of Seniors Housing ✓ Portfolio Transition Underway Completed and pending dispositions demonstrate active monetization of legacy assets and provide capital for higher - return investments ✓ High Quality Growth Foundation Recently delivered senior housing assets, disciplined investment criteria, and partnership - oriented execution support a high quality foundation for growth ✓ Valuation Opportunity Current share price implies a valuation for the legacy portfolio that appears disconnected from recent outpatient medical transactions ✓ The Riviera Alexandria Alexandria, VA The Landing Alexandria Alexandria, VA

2 Recent Events Second Quarter 2026 Investor Presentation The Landing Alexandria Alexandria, VA
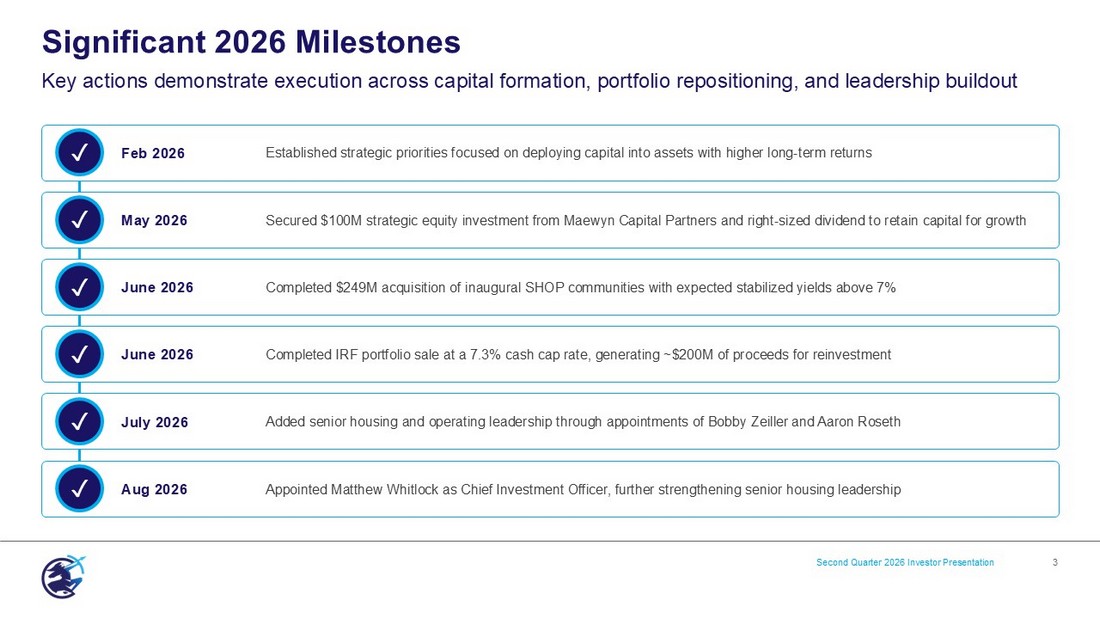
Significant 2026 Milestones Second Quarter 2026 Investor Presentation 3 Key actions demonstrate execution across capital formation, portfolio repositioning, and leadership buildout ✓ Feb 2026 Established strategic priorities focused on deploying capital into assets with higher long - term returns ✓ May 2026 Secured $100M strategic equity investment from Maewyn Capital Partners and right - sized dividend to retain capital for growth ✓ June 2026 Completed $249M acquisition of inaugural SHOP communities with expected stabilized yields above 7% ✓ June 2026 Completed IRF portfolio sale at a 7.3% cash cap rate, generating ~$200M of proceeds for reinvestment ✓ July 2026 Added senior housing and operating leadership through appointments of Bobby Zeiller and Aaron Roseth ✓ Aug 2026 Appointed Matthew Whitlock as Chief Investment Officer, further strengthening senior housing leadership
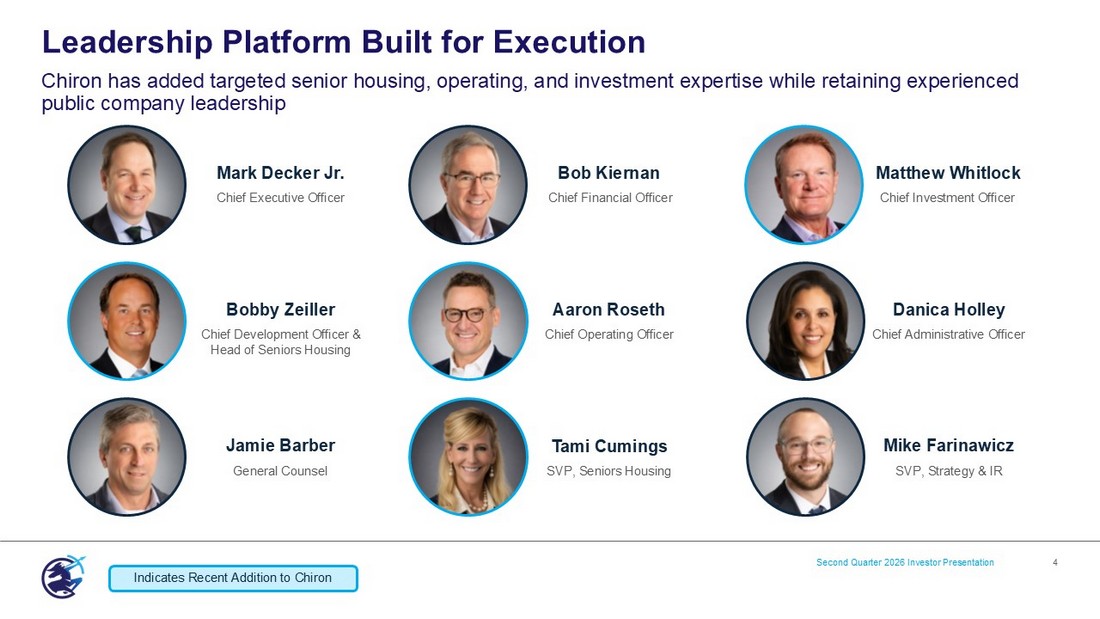
Leadership Platform Built for Execution Second Quarter 2026 Investor Presentation 4 Chiron has added targeted senior housing, operating, and investment expertise while retaining experienced public company leadership Mark Decker Jr. Chief Executive Officer Bob Kiernan Chief Financial Officer Chief Investment Officer Bobby Zeiller Chief Development Officer & Head of Seniors Housing Danica Holley Chief Administrative Officer Jamie Barber General Counsel Tami Cumings SVP, Seniors Housing Mike Farinawicz SVP, Strategy & IR Aaron Roseth Chief Operating Officer Matthew Whitlock Indicates Recent Addition to Chiron
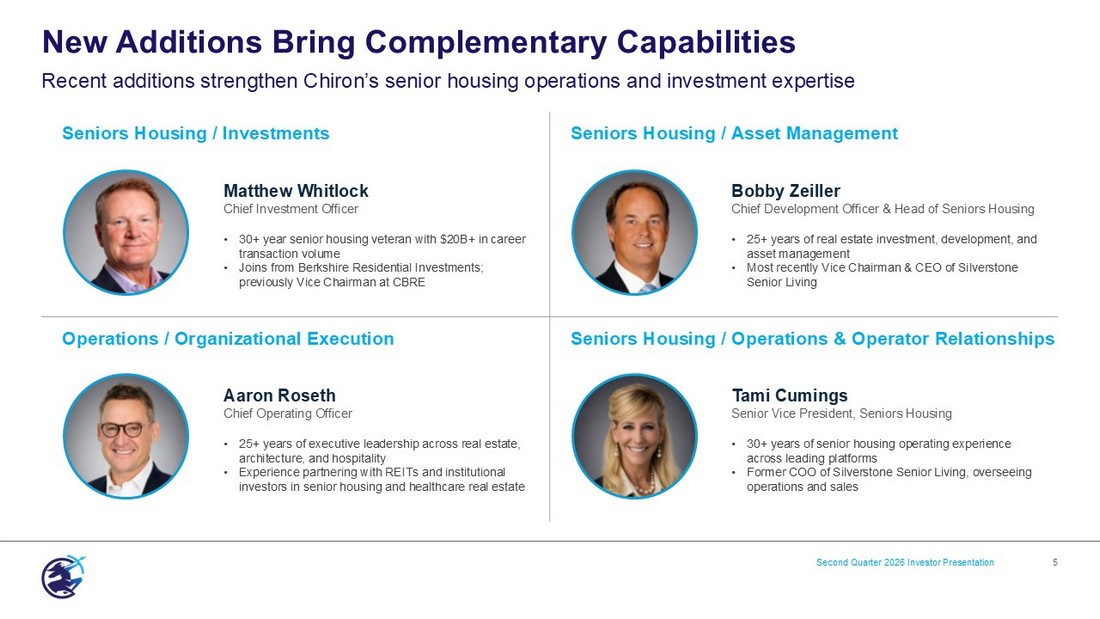
Seniors Housing / Asset Management Seniors Housing / Investments Bobby Zeiller Chief Development Officer & Head of Seniors Housing • 25+ years of real estate investment, development, and asset management • Most recently Vice Chairman & CEO of Silverstone Senior Living Matthew Whitlock Chief Investment Officer • 30+ year senior housing veteran with $20B+ in career transaction volume • Joins from Berkshire Residential Investments; previously Vice Chairman at CBRE Seniors Housing / Operations & Operator Relationships Operations / Organizational Execution Tami Cumings Senior Vice President, Seniors Housing • 30+ years of senior housing operating experience across leading platforms • Former COO of Silverstone Senior Living, overseeing operations and sales Aaron Roseth Chief Operating Officer • 25+ years of executive leadership across real estate, architecture, and hospitality • Experience partnering with REITs and institutional investors in senior housing and healthcare real estate New Additions Bring Complementary Capabilities Second Quarter 2026 Investor Presentation 5 Recent additions strengthen Chiron’s senior housing operations and investment expertise
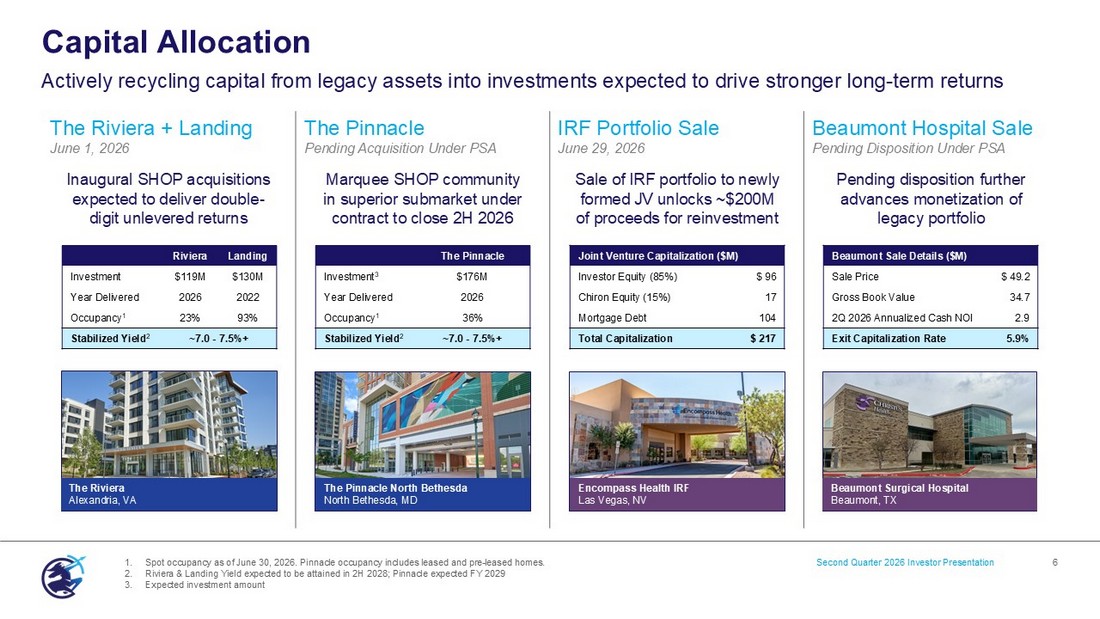
Beaumont Hospital Sale Pending Disposition Under PSA IRF Portfolio Sale June 29, 2026 The Pinnacle Pending Acquisition Under PSA The Riviera + Landing June 1, 2026 Pending disposition further advances monetization of legacy portfolio Sale of IRF portfolio to newly formed JV unlocks ~$200M of proceeds for reinvestment Marquee SHOP community in superior submarket under contract to close 2H 2026 Inaugural SHOP acquisitions expected to deliver double - digit unlevered returns Capital Allocation 6 Second Quarter 2026 Investor Presentation 1. Spot occupancy as of June 30, 2026. Pinnacle occupancy includes leased and pre - leased homes. 2. Riviera & Landing Yield expected to be attained in 2H 2028; Pinnacle expected FY 2029 3. Expected investment amount Landing Riviera $130M $119M Investment 2022 2026 Year Delivered 93% 23% Occupancy 1 ~7.0 - 7.5%+ Stabilized Yield 2 The Riviera Alexandria, VA Beaumont Sale Details ($M) $ 49.2 Sale Price 34.7 Gross Book Value 2.9 2Q 2026 Annualized Cash NOI 5.9% Exit Capitalization Rate Beaumont Surgical Hospital Beaumont, TX Actively recycling capital from legacy assets into investments expected to drive stronger long - term returns Joint Venture Capitalization ($M) $ 96 Investor Equity (85%) 17 Chiron Equity (15%) 104 Mortgage Debt $ 217 Total Capitalization Encompass Health IRF Las Vegas, NV The Pinnacle $176M Investment 3 2026 Year Delivered 36% Occupancy 1 ~7.0 - 7.5%+ Stabilized Yield 2 The Pinnacle North Bethesda North Bethesda, MD
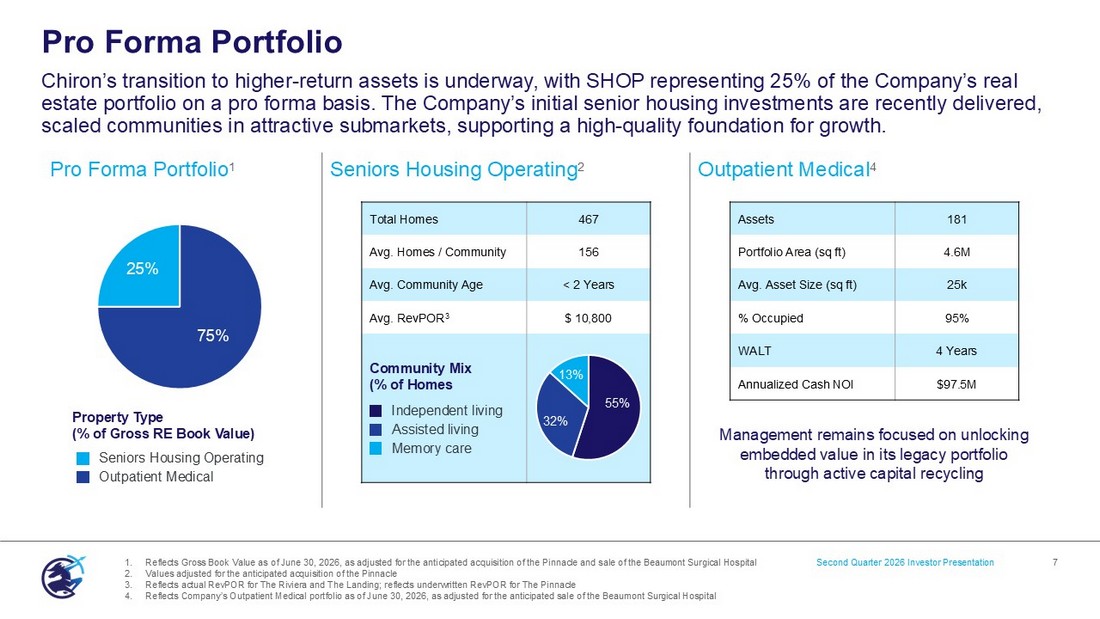
Outpatient Medical 4 Seniors Housing Operating 2 Pro Forma Portfolio 1 Management remains focused on unlocking embedded value in its legacy portfolio through active capital recycling Pro Forma Portfolio 7 Second Quarter 2026 Investor Presentation 1. Reflects Gross Book Value as of June 30, 2026, as adjusted for the anticipated acquisition of the Pinnacle and sale of the Be aum ont Surgical Hospital 2. Values adjusted for the anticipated acquisition of the Pinnacle 3. Reflects actual RevPOR for The Riviera and The Landing; reflects underwritten RevPOR for The Pinnacle 4. Reflects Company’s Outpatient Medical portfolio as of June 30, 2026, as adjusted for the anticipated sale of the Beaumont Sur gic al Hospital Senior s Housing Operating Outpatient Medical 75% 25% Property Type (% of Gross RE Book Value) Chiron’s transition to higher - return assets is underway, with SHOP representing 25% of the Company’s real estate portfolio on a pro forma basis. The Company’s initial senior housing investments are recently delivered, scaled communities in attractive submarkets, supporting a high - quality foundation for growth. 181 Assets 4.6M Portfolio Area (sq ft) 25k Avg. Asset Size (sq ft) 95% % Occupied 4 Years WALT $97.5M Annualized Cash NOI 467 Total Homes 156 Avg. Homes / Community < 2 Years Avg. Community Age $ 10,800 Avg. RevPOR 3 Independent living Assisted living Memory care Community Mix (% of Homes 55% 32% 13%

8 Market Opportunity The Riviera Alexandria Alexandria, VA Second Quarter 2026 Investor Presentation
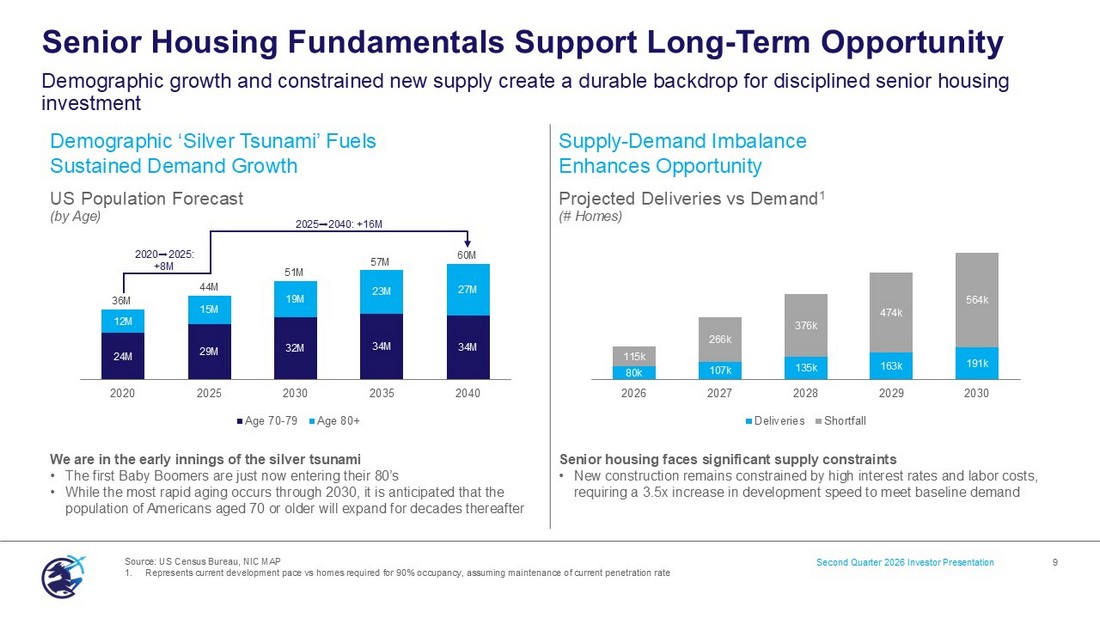
Supply - Demand Imbalance Enhances Opportunity Demographic ‘Silver Tsunami’ Fuels Sustained Demand Growth Senior housing faces significant supply constraints • New construction remains constrained by high interest rates and labor costs, requiring a 3.5x increase in development speed to meet baseline demand We are in the early innings of the silver tsunami • The first Baby Boomers are just now entering their 80’s • While the most rapid aging occurs through 2030, it is anticipated that the population of Americans aged 70 or older will expand for decades thereafter 24M 29M 32M 34M 34M 12M 15M 19M 23M 27M 36M 44M 51M 57M 60M 2020 2025 2030 2035 2040 Age 70-79 Age 80+ Senior Housing Fundamentals Support Long - Term Opportunity Demographic growth and constrained new supply create a durable backdrop for disciplined senior housing investment Second Quarter 2026 Investor Presentation 9 US Population Forecast (by Age) Projected Deliveries vs Demand 1 (# Homes) 80k 107k 135k 163k 191k 115k 266k 376k 474k 564k 2026 2027 2028 2029 2030 Deliveries Shortfall Source: US Census Bureau, NIC MAP 1. Represents current development pace vs homes required for 90% occupancy, assuming maintenance of current penetration rate 2020 2025: +8M 2025 2040: +16M
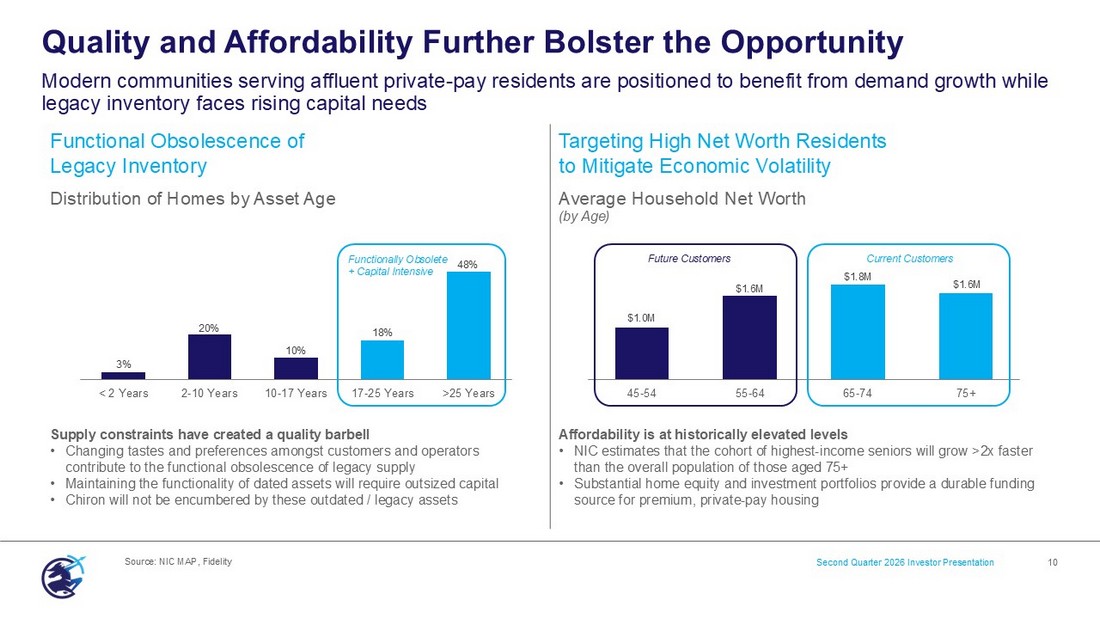
Targeting High Net Worth Residents to Mitigate Economic Volatility Functional Obsolescence of Legacy Inventory Affordability is at historically elevated levels • NIC estimates that the cohort of highest - income seniors will grow >2x faster than the overall population of those aged 75+ • Substantial home equity and investment portfolios provide a durable funding source for premium, private - pay housing Supply constraints have created a quality barbell • Changing tastes and preferences amongst customers and operators contribute to the functional obsolescence of legacy supply • Maintaining the functionality of dated assets will require outsized capital • Chiron will not be encumbered by these outdated / legacy assets Quality and Affordability Further Bolster the Opportunity Modern communities serving affluent private - pay residents are positioned to benefit from demand growth while legacy inventory faces rising capital needs Second Quarter 2026 Investor Presentation 10 Distribution of Homes by Asset Age (by Age) Average Household Net Worth (by Age) Source: NIC MAP, Fidelity $1.0M $1.6M $1.8M $1.6M 45-54 55-64 65-74 75+ Current Customers Future Customers 3% 20% 10% 18% 48% < 2 Years 2-10 Years 10-17 Years 17-25 Years >25 Years Functionally Obsolete + Capital Intensive
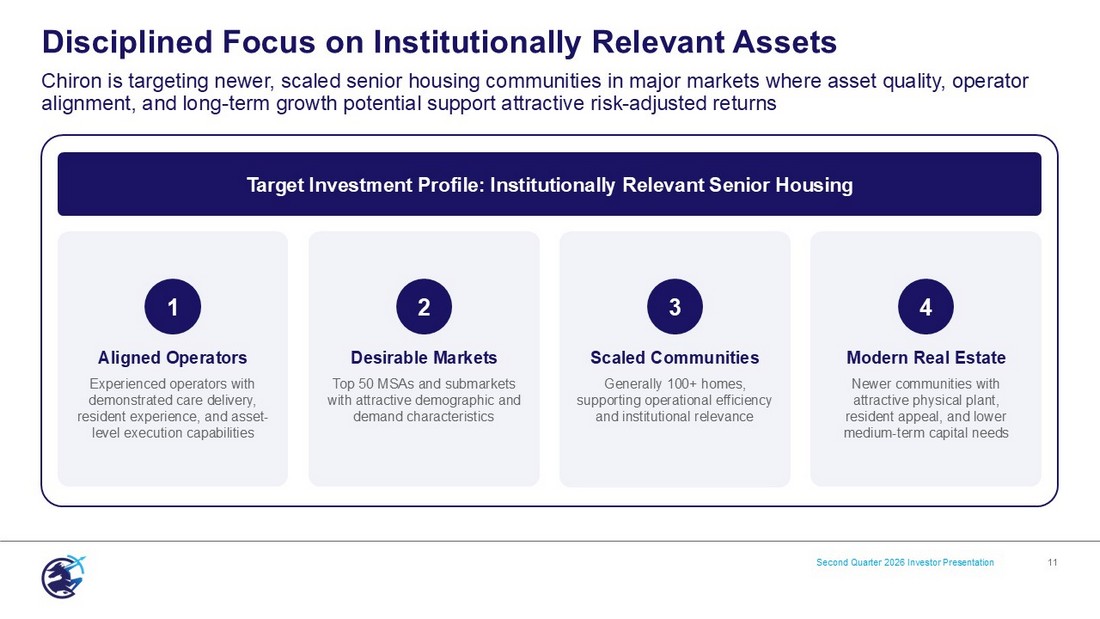
Disciplined Focus on Institutionally Relevant Assets Chiron is targeting newer, scaled senior housing communities in major markets where asset quality, operator alignment, and long - term growth potential support attractive risk - adjusted returns Second Quarter 2026 Investor Presentation 11 Target Investment Profile: Institutionally Relevant Senior Housing 1 Aligned Operators Experienced operators with demonstrated care delivery, resident experience, and asset - level execution capabilities 4 Modern Real Estate Newer communities with attractive physical plant, resident appeal, and lower medium - term capital needs Scaled Communities Generally 100+ homes, supporting operational efficiency and institutional relevance 3 2 Desirable Markets Top 50 MSAs and submarkets with attractive demographic and demand characteristics
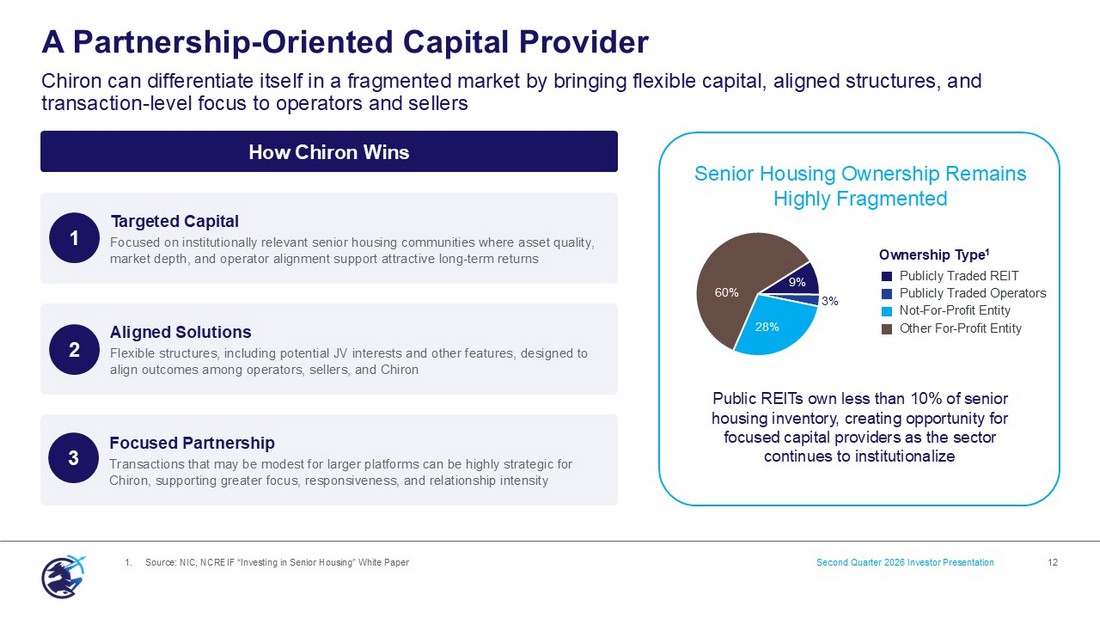
A Partnership - Oriented Capital Provider Chiron can differentiate itself in a fragmented market by bringing flexible capital, aligned structures, and transaction - level focus to operators and sellers Second Quarter 2026 Investor Presentation 12 Senior Housing Ownership Remains Highly Fragmented Ownership Type 1 Publicly Traded REIT Publicly Traded Operators Not - For - Profit Entity Other For - Profit Entity 9% 3% 28% 60% Public REITs own less than 10% of senior housing inventory, creating opportunity for focused capital providers as the sector continues to institutionalize How Chiron Wins 1 Targeted Capital Focused on institutionally relevant senior housing communities where asset quality, market depth, and operator alignment support attractive long - term returns 2 Aligned Solutions Flexible structures, including potential JV interests and other features, designed to align outcomes among operators, sellers, and Chiron 3 Focused Partnership Transactions that may be modest for larger platforms can be highly strategic for Chiron, supporting greater focus, responsiveness, and relationship intensity 1. Source: NIC, NCREIF “Investing in Senior Housing” White Paper
13 Valuation Opportunity Citrus Valley MOB Corona, CA Second Quarter 2026 Investor Presentation
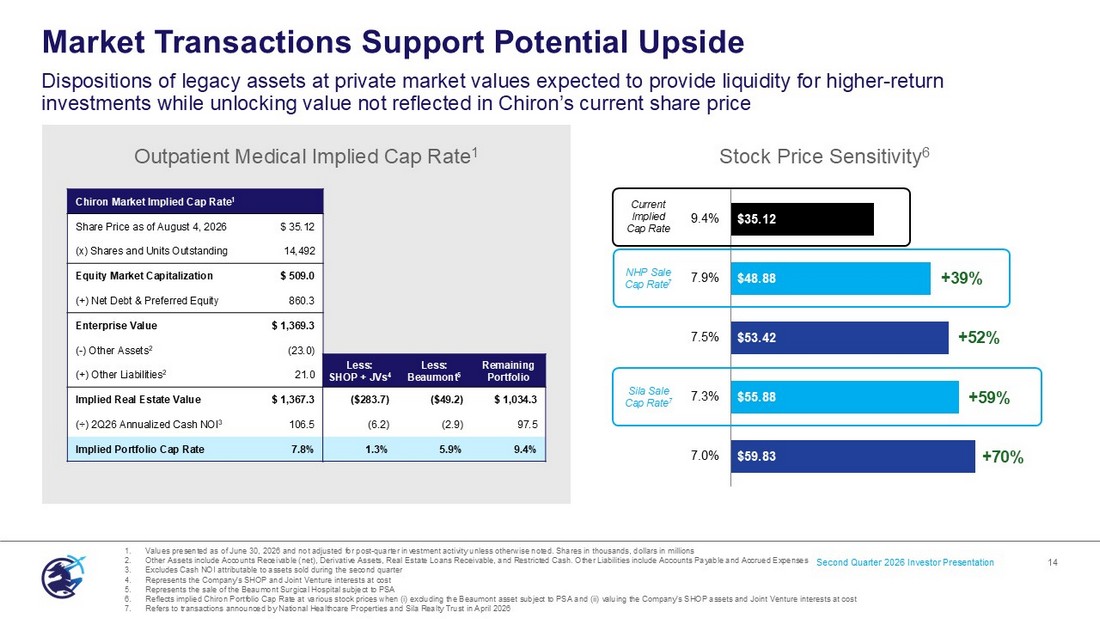
Market Transactions Support Potential Upside 14 Dispositions of legacy assets at private market values expected to provide liquidity for higher - return investments while unlocking value not reflected in Chiron’s current share price 1. Values presented as of June 30, 2026 and not adjusted for post - quarter investment activity unless otherwise noted. Shares in tho usands, dollars in millions 2. Other Assets include Accounts Receivable (net), Derivative Assets, Real Estate Loans Receivable, and Restricted Cash. Other L iab ilities include Accounts Payable and Accrued Expenses 3. Excludes Cash NOI attributable to assets sold during the second quarter 4. Represents the Company’s SHOP and Joint Venture interests at cost 5. Represents the sale of the Beaumont Surgical Hospital subject to PSA 6. Reflects implied Chiron Portfolio Cap Rate at various stock prices when ( i ) excluding the Beaumont asset subject to PSA and (ii) valuing the Company’s SHOP assets and Joint Venture interests at cost 7. Refers to transactions announced by National Healthcare Properties and Sila Realty Trust in April 2026 ` $35.12 $48.88 $53.42 $55.88 $59.83 9.4% 7.9% 7.5% 7.3% 7.0% Stock Price Sensitivity 6 NHP Sale Cap Rate 7 Sila Sale Cap Rate 7 Current Implied Cap Rate Second Quarter 2026 Investor Presentation Chiron Market Implied Cap Rate 1 $ 35.12 Share Price as of August 4, 2026 14,492 (x) Shares and Units Outstanding $ 509.0 Equity Market Capitalization 860.3 (+) Net Debt & Preferred Equity $ 1,369.3 Enterprise Value (23.0) ( - ) Other Assets 2 21.0 (+) Other Liabilities 2 $ 1,367.3 Implied Real Estate Value 106.5 ( ÷ ) 2Q26 Annualized Cash NOI 3 7.8% Implied Portfolio Cap Rate Outpatient Medical Implied Cap Rate 1 Remaining Portfolio Less: Beaumont 5 Less: SHOP + JVs 4 $ 1,034.3 ($49.2) ($283.7) 97.5 (2.9) (6.2) 9.4% 5.9% 1.3% +39% +52% +59% +70%
15 Reconciliations and Legal Second Quarter 2026 Investor Presentation The Pinnacle North Bethesda Pending SHOP Acquisition
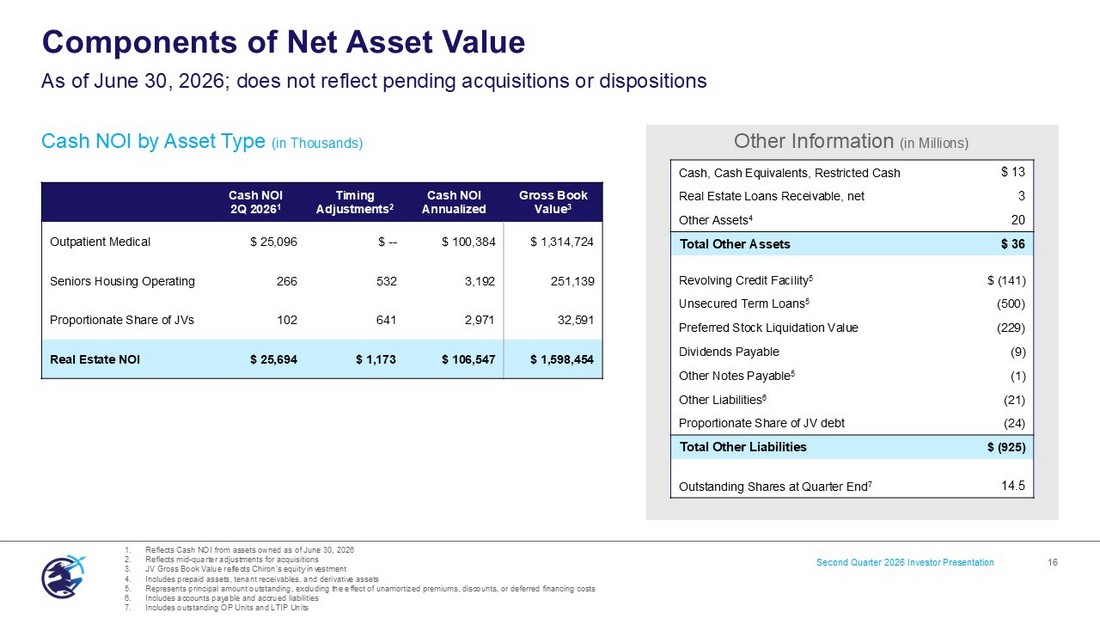
Second Quarter 2026 Investor Presentation 16 Cash NOI by Asset Type (in Thousands) Components of Net Asset Value As of June 30, 2026; does not reflect pending acquisitions or dispositions ` $ 13 Cash, Cash Equivalents, Restricted Cash 3 Real Estate Loans Receivable, net 20 Other Assets 4 $ 36 Total Other Assets $ (141) Revolving Credit Facility 5 (500) Unsecured Term Loans 5 (229) Preferred Stock Liquidation Value (9) Dividends Payable (1) Other Notes Payable 5 (21) Other Liabilities 6 (24) Proportionate Share of JV debt $ (925) Total Other Liabilities 14.5 Outstanding Shares at Quarter End 7 Other Information (in Millions) 1. Reflects Cash NOI from assets owned as of June 30, 2026 2. Reflects mid - quarter adjustments for acquisitions 3. JV Gross Book Value reflects Chiron’s equity investment 4. Includes prepaid assets, tenant receivables, and derivative assets 5. Represents principal amount outstanding, excluding the effect of unamortized premiums, discounts, or deferred financing costs 6. Includes accounts payable and accrued liabilities 7. Includes outstanding OP Units and LTIP Units Gross Book Value 3 Cash NOI Annualized Timing Adjustments 2 Cash NOI 2Q 2026 1 $ 1,314,724 $ 100,384 $ -- $ 25,096 Outpatient Medical 251,139 3,192 532 266 Seniors Housing Operating 32,591 2,971 641 102 Proportionate Share of JVs $ 1,598,454 $ 106,547 $ 1,173 $ 25,694 Real Estate NOI
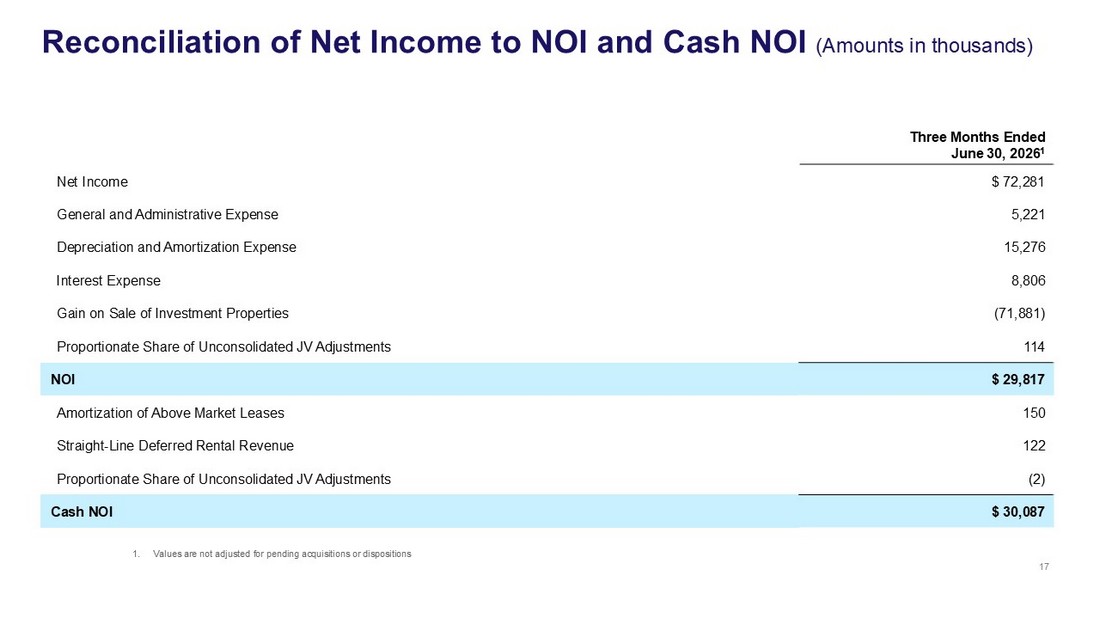
Three Months Ended June 3 0 , 202 6 1 $ 72,281 Net Income 5, 221 General and A dministrative Expense 15,276 Depreciation and A mortization Expense 8,806 Interest E xpense (71,881) Gain on S ale of I nvestment P roperties 114 Proportionate Share of Unconsolidated JV Adjustments $ 29,817 NOI 1 50 Amortization of A bove M arket L eases 122 Straight - L ine D eferred R ental R evenue ( 2 ) Proportionate Share of Unconsolidated JV Adjustments $ 30,087 Cash NOI 17 Reconciliation of Net Income to NOI and Cash NOI (Amounts in thousands) 1. Values are not adjusted for pending acquisitions or dispositions
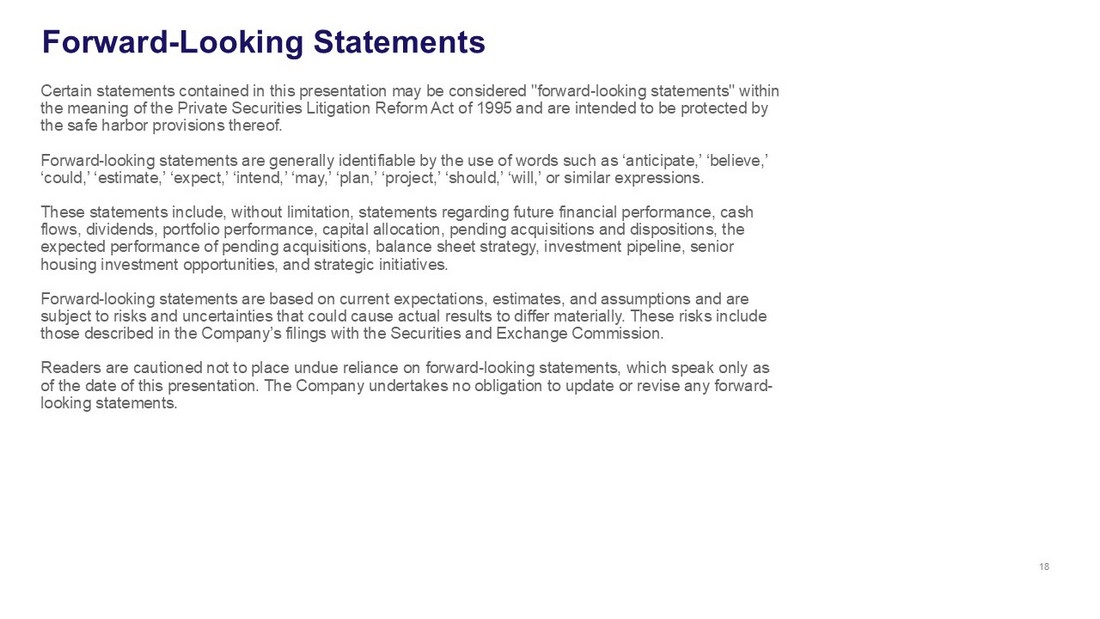
Certain statements contained in this presentation may be considered "forward - looking statements" within the meaning of the Private Securities Litigation Reform Act of 1995 and are intended to be protected by the safe harbor provisions thereof. Forward - looking statements are generally identifiable by the use of words such as ‘anticipate,’ ‘believe,’ ‘could,’ ‘estimate,’ ‘expect,’ ‘intend,’ ‘may,’ ‘plan,’ ‘project,’ ‘should,’ ‘will,’ or similar expressions. These statements include, without limitation, statements regarding future financial performance, cash flows, dividends, portfolio performance, capital allocation, pending acquisitions and dispositions , the expected performance of pending acquisitions , balance sheet strategy, investment pipeline, senior housing investment opportunities, and strategic initiatives. Forward - looking statements are based on current expectations, estimates, and assumptions and are subject to risks and uncertainties that could cause actual results to differ materially. These risks include those described in the Company’s filings with the Securities and Exchange Commission. Readers are cautioned not to place undue reliance on forward - looking statements, which speak only as of the date of this presentation. The Company undertakes no obligation to update or revise any forward - looking statements. Forward - Looking Statements 18
Management believes certain non - GAAP financial measures provide useful supplemental information regarding the Company’s operating performance and financial condition. These measures are commonly used by management, investors, and industry analysts to evaluate REIT performance and facilitate period - over - period and peer comparisons. Chiron’s non - GAAP financial measures included in this presentation are Net Operating Income (NOI) and Cash NOI. Non - GAAP financial measures are not intended to be alternatives to net income, cash flows from operating activities, or other measures prepared in accordance with GAAP. These measures may not be comparable to similarly titled measures reported by other companies and should be evaluated in conjunction with the Company’s consolidated financial statements. Non - GAAP Financial Measures 19 NOI and Cash NOI Net Operating Income (NOI) is a supplemental measure used to evaluate the operating performance of the Company’s real estate portfolio. NOI is calculated as net income or loss, plus depreciation and amortization, general and administrative expenses, transaction costs, impairments, gains or losses on the sale of investment properties, interest expense, and other non - operating items. Cash NOI excludes non - cash items such as straight - line rent and amortization of above - and below - market leases and is intended to measure unlevered, property - level cash operating performance.
NYSE: XRN 7373 Wisconsin Avenue Suite 800 Bethesda, MD 20814