NN, Inc. Q2 2026 Earnings August 6, 2026
2 Forward Looking Statements This presentation may contain forward-looking statements regarding our business, operations, and financial performance. Such statements are based on current expectations and assumptions that are subject to a number of risks and uncertainties. Actual results could differ materially. Please refer to our most recently filed Form 10-K and our Form 10-Q for the period following that Form 10-K, including the risk factors described therein. We undertake no obligation to update any forward-looking statement, except as required by law. Given these risks and uncertainties, investors are cautioned not to place undue reliance on such forward-looking statements. We present both GAAP and non-GAAP financial measures in this presentation. A reconciliation of non-GAAP to GAAP measures is included in this presentation and in the most recent earnings press release, which is distributed and available to the public through our Investor Relations website located at investors.nninc.com/news-events/presentations.
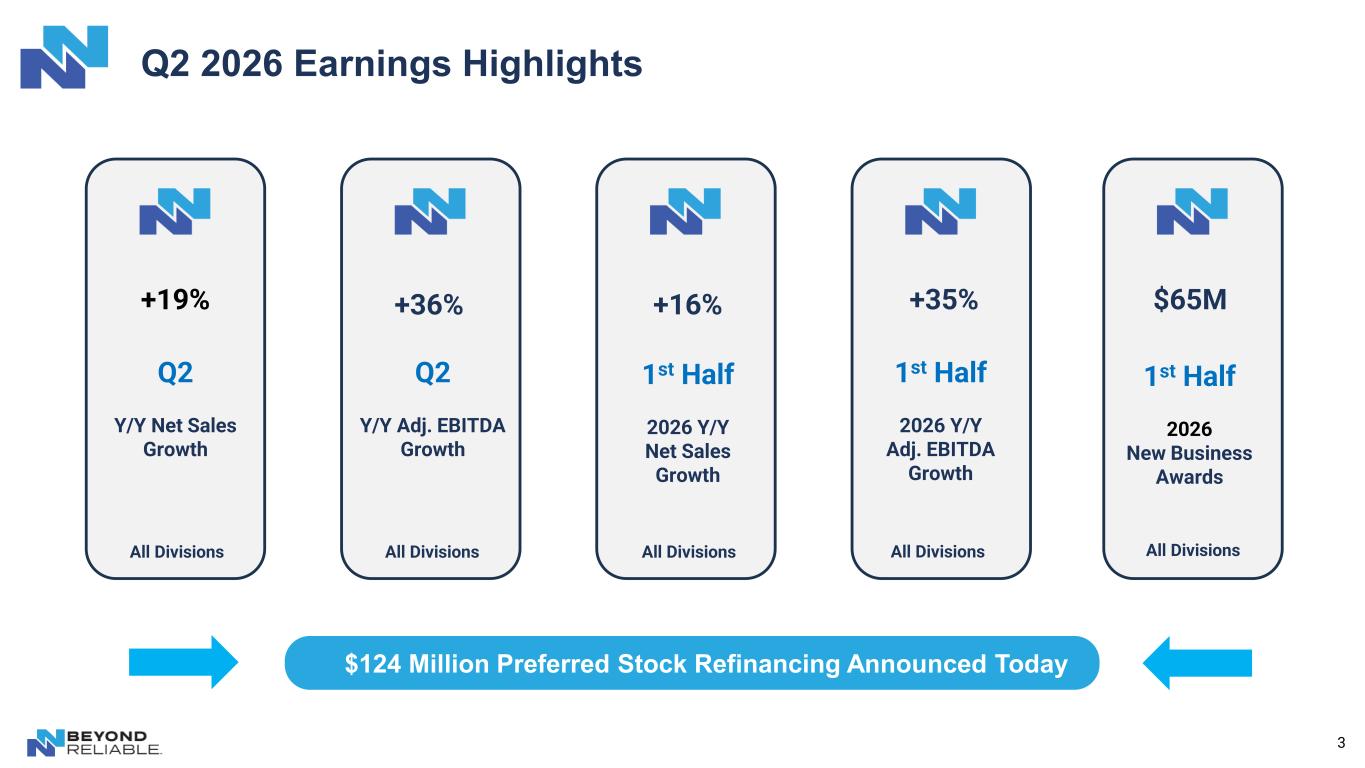
3 Q2 2026 Earnings Highlights +19% +16%+36% +35% $65M Q2 Y/Y Net Sales Growth 1st Half 2026 Y/Y Net Sales Growth Q2 Y/Y Adj. EBITDA Growth 1st Half 2026 Y/Y Adj. EBITDA Growth 1st Half 2026 New Business Awards All Divisions All Divisions All Divisions All Divisions All Divisions $124 Million Preferred Stock Refinancing Announced Today
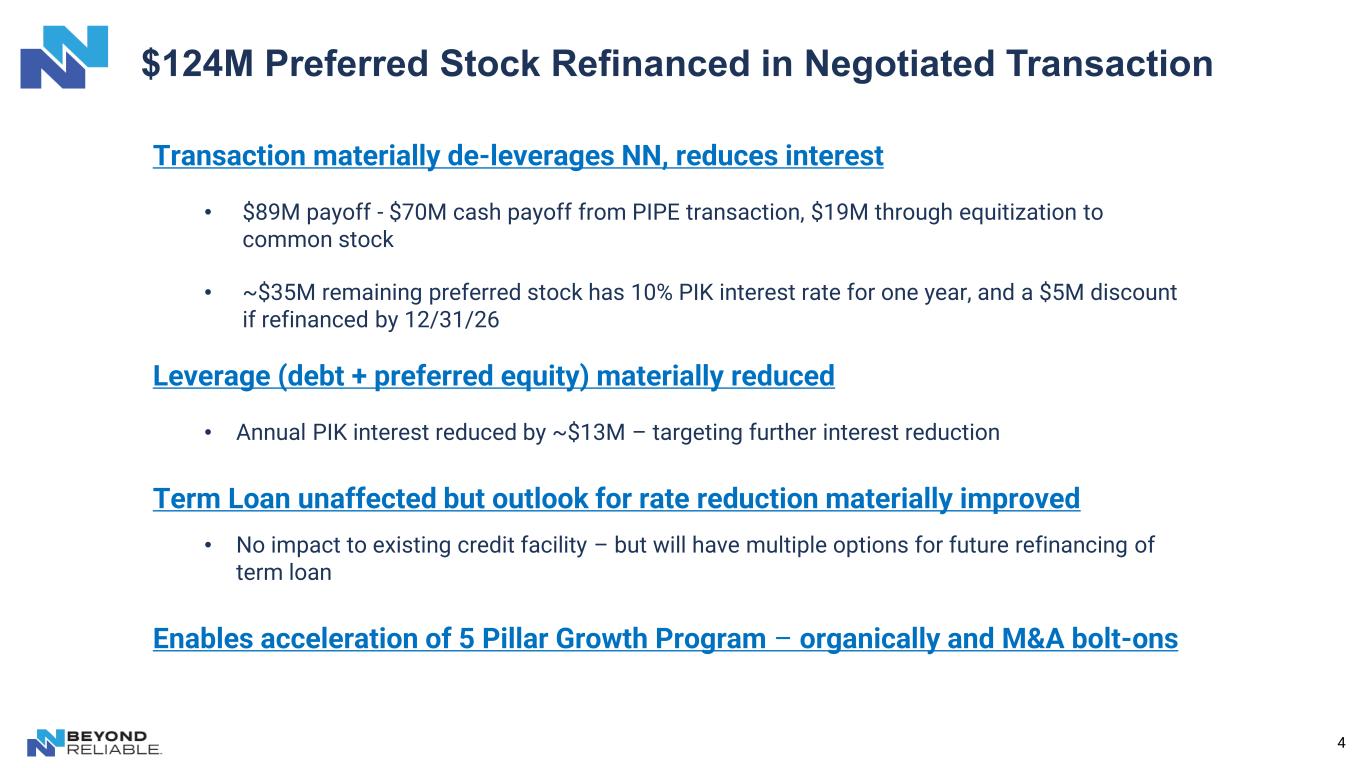
4 $124M Preferred Stock Refinanced in Negotiated Transaction Transaction materially de-leverages NN, reduces interest • $89M payoff - $70M cash payoff from PIPE transaction, $19M through equitization to common stock • ~$35M remaining preferred stock has 10% PIK interest rate for one year, and a $5M discount if refinanced by 12/31/26 Leverage (debt + preferred equity) materially reduced • Annual PIK interest reduced by ~$13M – targeting further interest reduction Term Loan unaffected but outlook for rate reduction materially improved • No impact to existing credit facility – but will have multiple options for future refinancing of term loan Enables acceleration of 5 Pillar Growth Program – organically and M&A bolt-ons
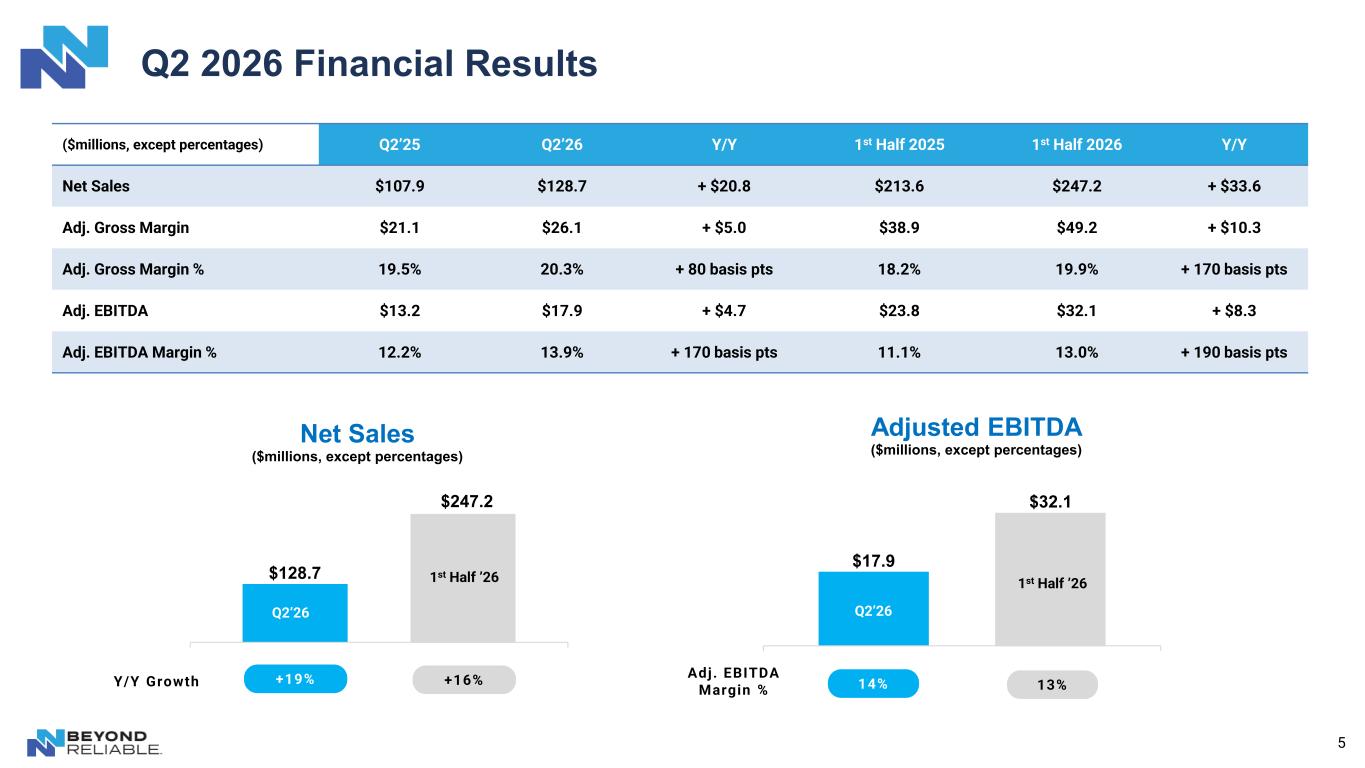
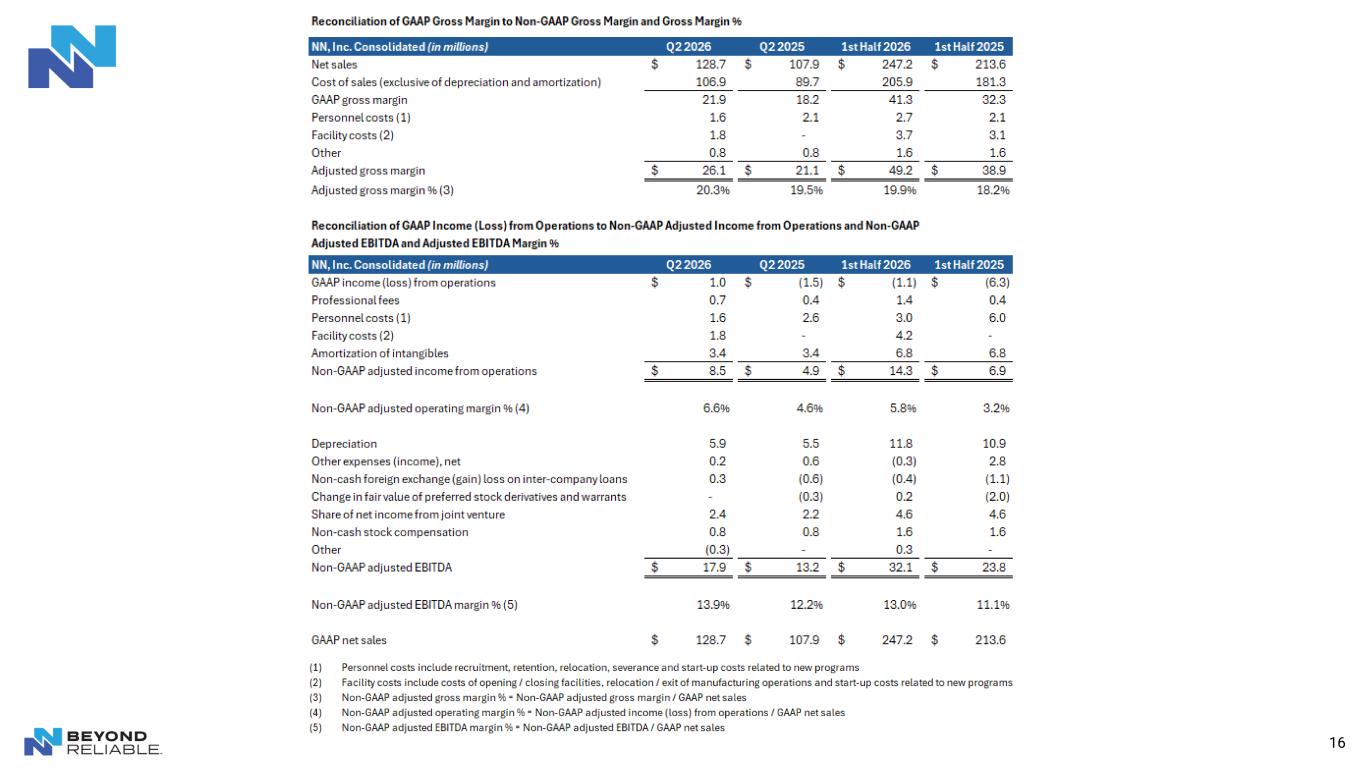
5 Q2 2026 Financial Results $17.9 $32.1 Adjusted EBITDA ($millions, except percentages) $128.7 $247.2 Net Sales ($millions, except percentages) ($millions, except percentages) Q2’25 Q2’26 Y/Y 1st Half 2025 1st Half 2026 Y/Y Net Sales $107.9 $128.7 + $20.8 $213.6 $247.2 + $33.6 Adj. Gross Margin $21.1 $26.1 + $5.0 $38.9 $49.2 + $10.3 Adj. Gross Margin % 19.5% 20.3% + 80 basis pts 18.2% 19.9% + 170 basis pts Adj. EBITDA $13.2 $17.9 + $4.7 $23.8 $32.1 + $8.3 Adj. EBITDA Margin % 12.2% 13.9% + 170 basis pts 11.1% 13.0% + 190 basis pts +19% +16% 14% 13%Y/Y Growth Adj. EBITDA Margin % Q2’26 Q2’26 1st Half ’26 1st Half ’26
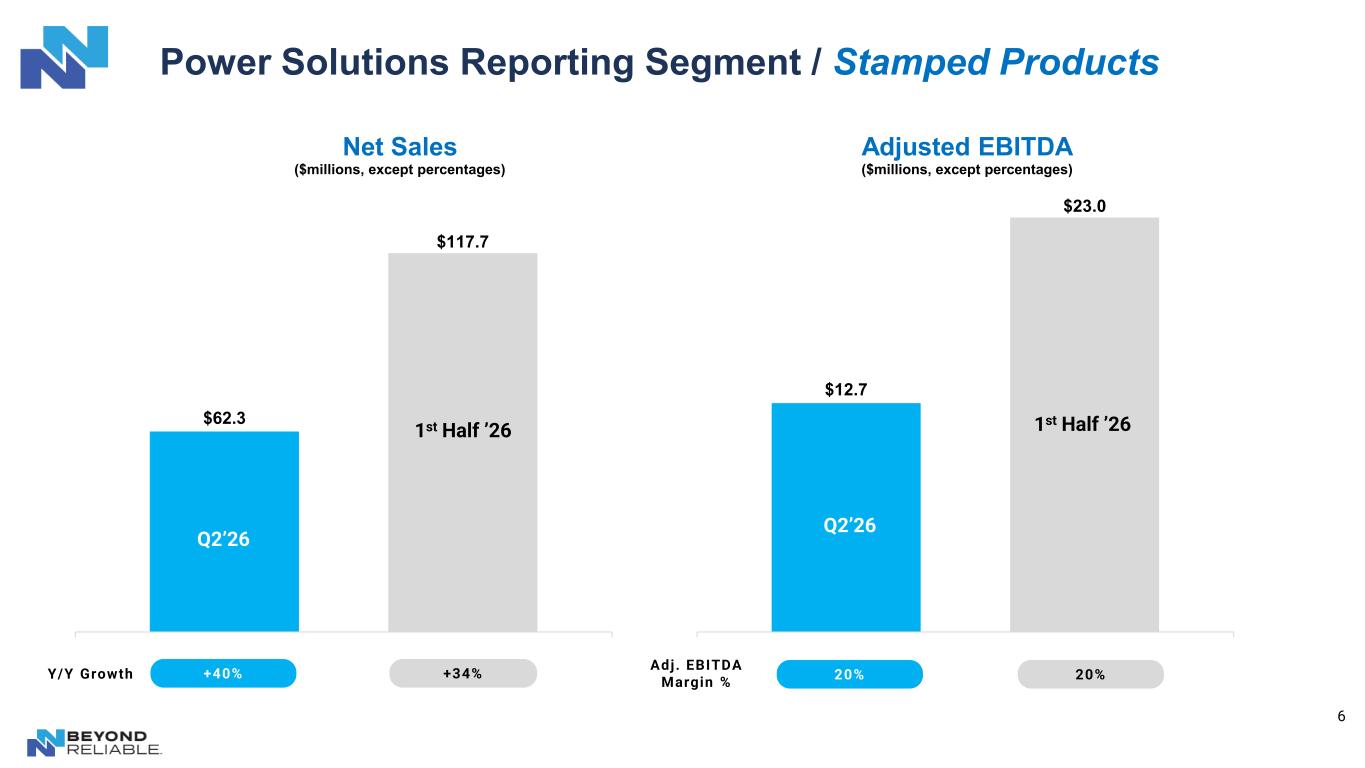
6 Power Solutions Reporting Segment / Stamped Products $62.3 $117.7 Net Sales ($millions, except percentages) +40% +34%Y/Y Growth $12.7 $23.0 Adjusted EBITDA ($millions, except percentages) Adj. EBITDA Margin % 20% 20% Q2’26 Q2’26 1st Half ’26 1st Half ’26
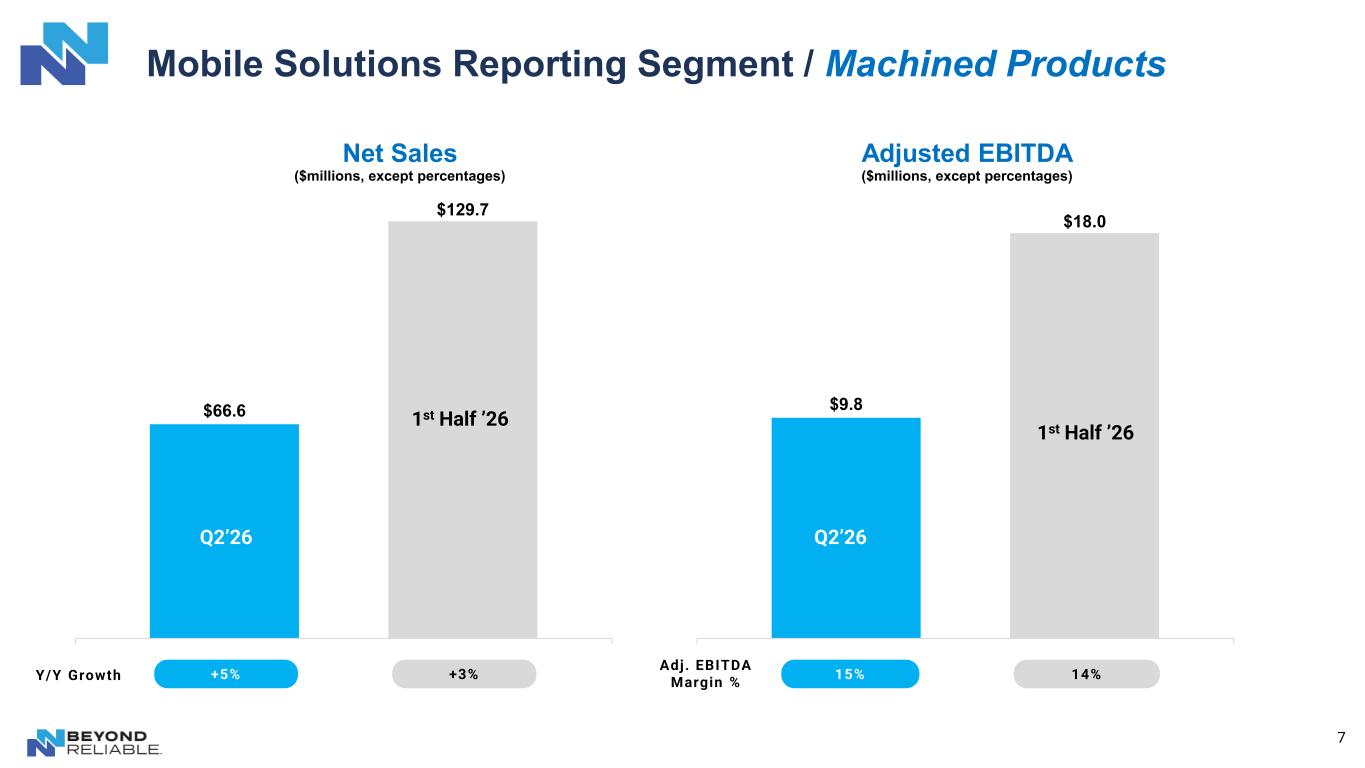
7 Mobile Solutions Reporting Segment / Machined Products $66.6 $129.7 Net Sales ($millions, except percentages) +5% +3%Y/Y Growth $9.8 $18.0 Adjusted EBITDA ($millions, except percentages) Adj. EBITDA Margin % 15% 14% Q2’26 Q2’26 1st Half ’26 1st Half ’26
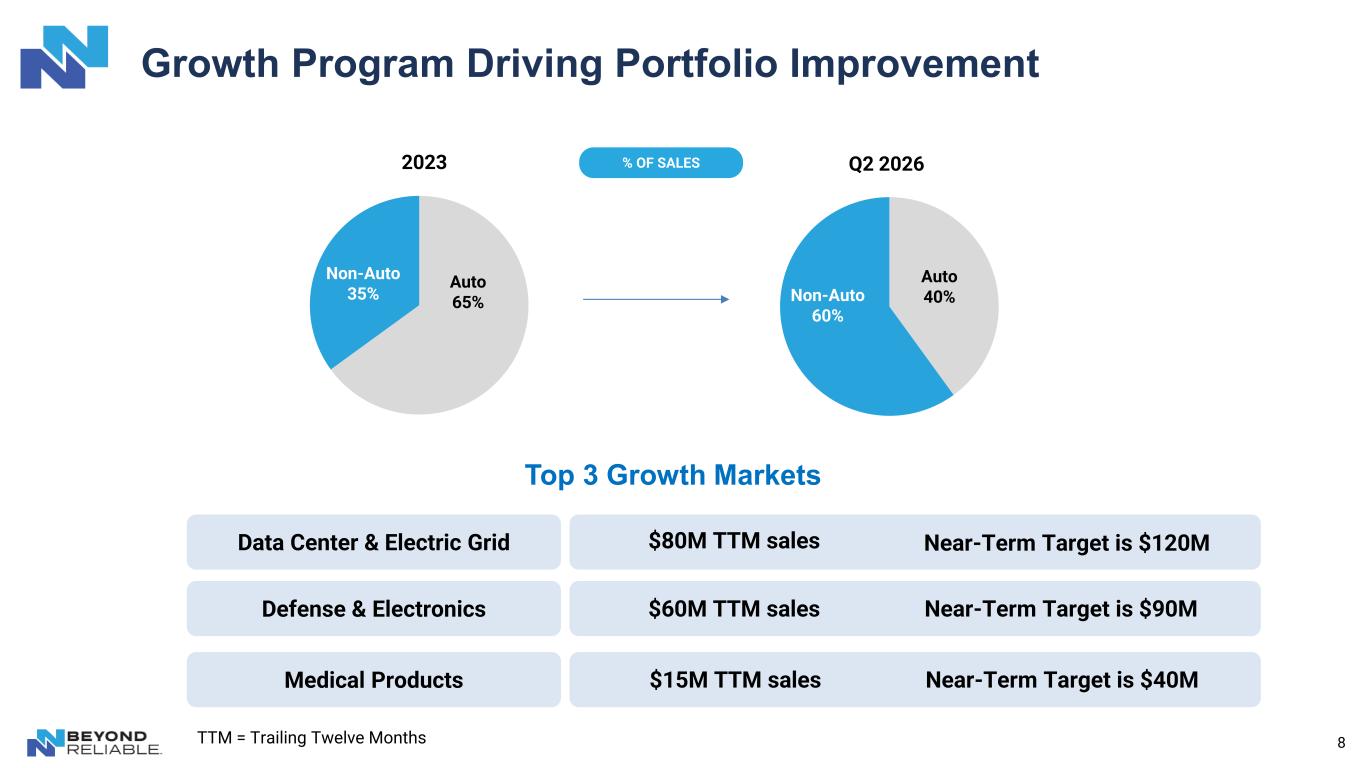
8 Growth Program Driving Portfolio Improvement Auto 65% Non-Auto 35% 2023 Auto 40%Non-Auto 60% Q2 2026% OF SALES Data Center & Electric Grid Medical Products Defense & Electronics $80M TTM sales Near-Term Target is $120M $15M TTM sales Near-Term Target is $40M $60M TTM sales Near-Term Target is $90M Top 3 Growth Markets TTM = Trailing Twelve Months
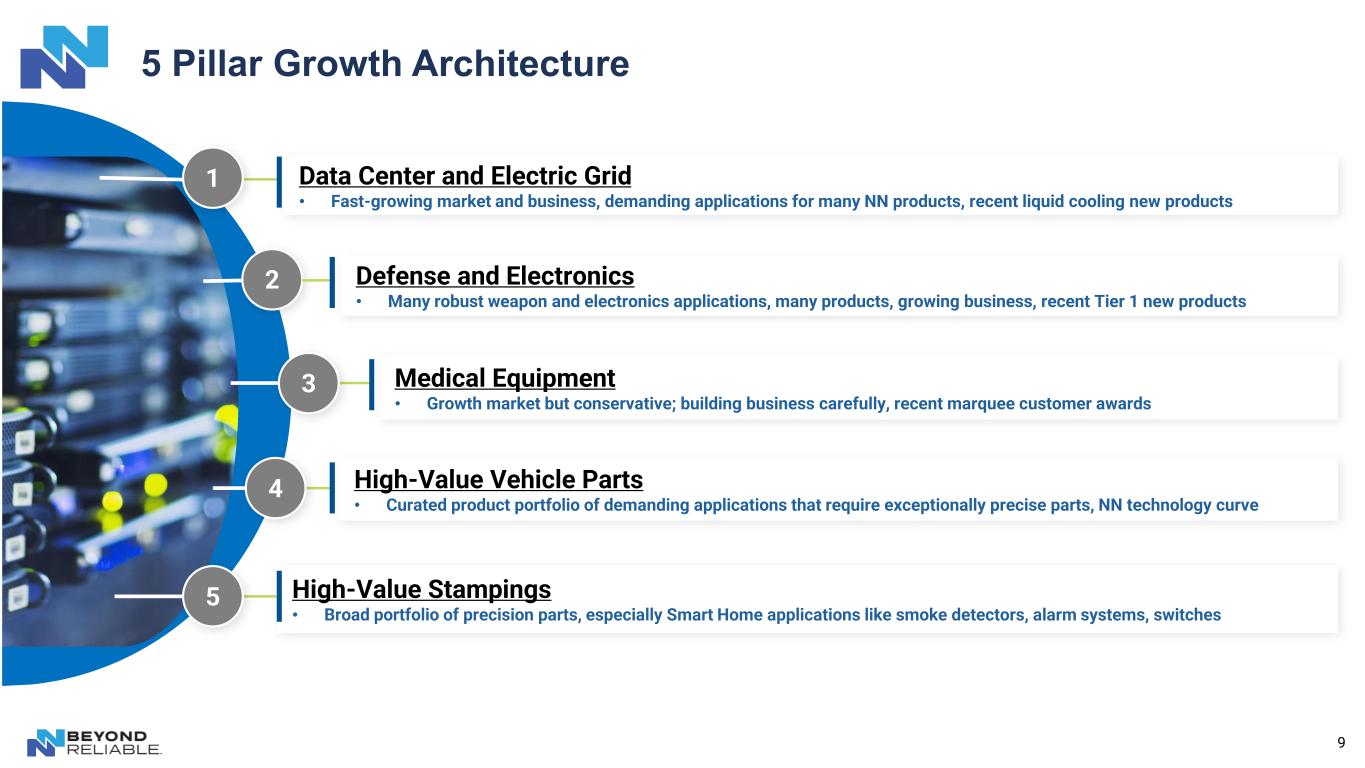
9 5 Pillar Growth Architecture High-Value Vehicle Parts • Curated product portfolio of demanding applications that require exceptionally precise parts, NN technology curve High-Value Stampings • Broad portfolio of precision parts, especially Smart Home applications like smoke detectors, alarm systems, switches 2 Medical Equipment • Growth market but conservative; building business carefully, recent marquee customer awards 3 Defense and Electronics • Many robust weapon and electronics applications, many products, growing business, recent Tier 1 new products 4 5 1 Data Center and Electric Grid • Fast-growing market and business, demanding applications for many NN products, recent liquid cooling new products
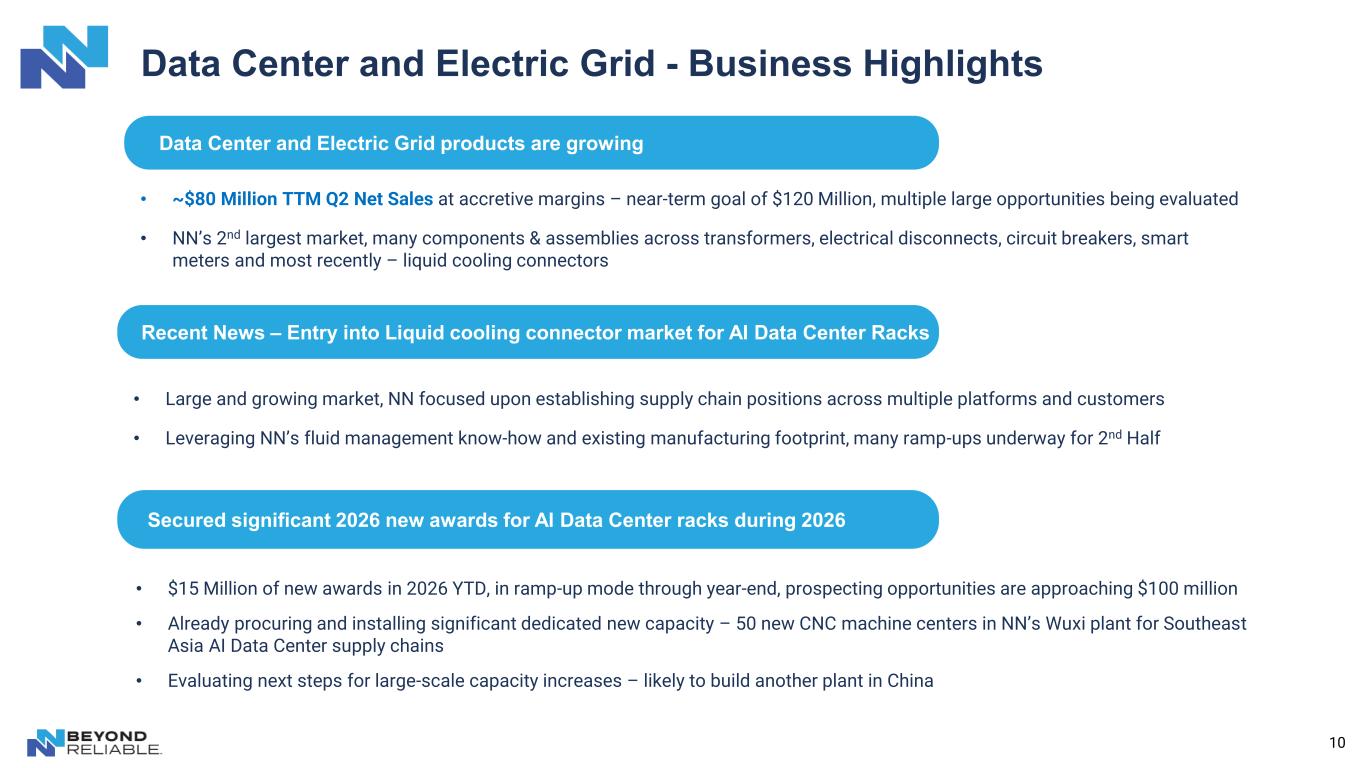
10 Data Center and Electric Grid - Business Highlights Data Center and Electric Grid products are growing • ~$80 Million TTM Q2 Net Sales at accretive margins – near-term goal of $120 Million, multiple large opportunities being evaluated • NN’s 2nd largest market, many components & assemblies across transformers, electrical disconnects, circuit breakers, smart meters and most recently – liquid cooling connectors Recent News – Entry into Liquid cooling connector market for AI Data Center Racks • Large and growing market, NN focused upon establishing supply chain positions across multiple platforms and customers • Leveraging NN’s fluid management know-how and existing manufacturing footprint, many ramp-ups underway for 2nd Half Secured significant 2026 new awards for AI Data Center racks during 2026 • $15 Million of new awards in 2026 YTD, in ramp-up mode through year-end, prospecting opportunities are approaching $100 million • Already procuring and installing significant dedicated new capacity – 50 new CNC machine centers in NN’s Wuxi plant for Southeast Asia AI Data Center supply chains • Evaluating next steps for large-scale capacity increases – likely to build another plant in China
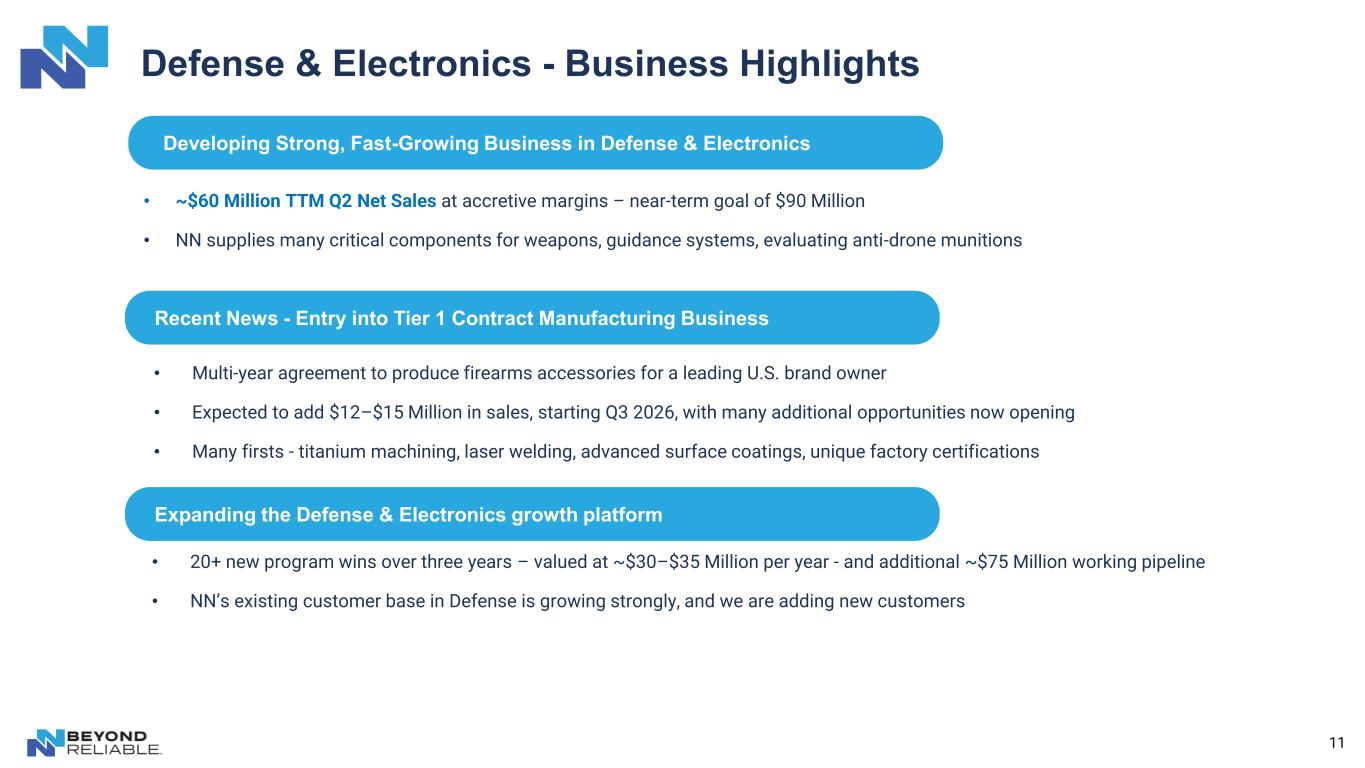
11 Defense & Electronics - Business Highlights Recent News - Entry into Tier 1 Contract Manufacturing Business • Multi-year agreement to produce firearms accessories for a leading U.S. brand owner • Expected to add $12–$15 Million in sales, starting Q3 2026, with many additional opportunities now opening • Many firsts - titanium machining, laser welding, advanced surface coatings, unique factory certifications Expanding the Defense & Electronics growth platform • 20+ new program wins over three years – valued at ~$30–$35 Million per year - and additional ~$75 Million working pipeline • NN’s existing customer base in Defense is growing strongly, and we are adding new customers Developing Strong, Fast-Growing Business in Defense & Electronics • ~$60 Million TTM Q2 Net Sales at accretive margins – near-term goal of $90 Million • NN supplies many critical components for weapons, guidance systems, evaluating anti-drone munitions
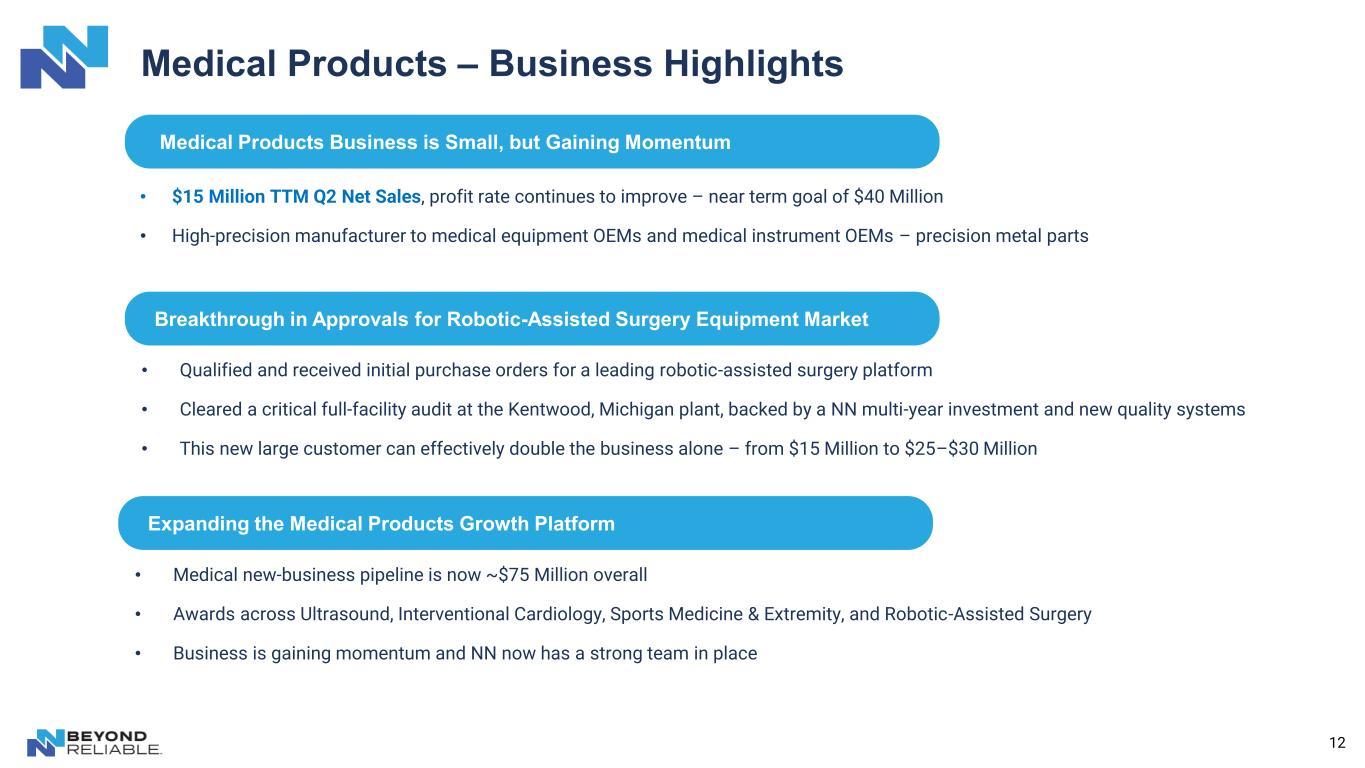
12 Medical Products – Business Highlights Breakthrough in Approvals for Robotic-Assisted Surgery Equipment Market • Qualified and received initial purchase orders for a leading robotic-assisted surgery platform • Cleared a critical full-facility audit at the Kentwood, Michigan plant, backed by a NN multi-year investment and new quality systems • This new large customer can effectively double the business alone – from $15 Million to $25–$30 Million Expanding the Medical Products Growth Platform • Medical new-business pipeline is now ~$75 Million overall • Awards across Ultrasound, Interventional Cardiology, Sports Medicine & Extremity, and Robotic-Assisted Surgery • Business is gaining momentum and NN now has a strong team in place • $15 Million TTM Q2 Net Sales, profit rate continues to improve – near term goal of $40 Million • High-precision manufacturer to medical equipment OEMs and medical instrument OEMs – precision metal parts Medical Products Business is Small, but Gaining Momentum
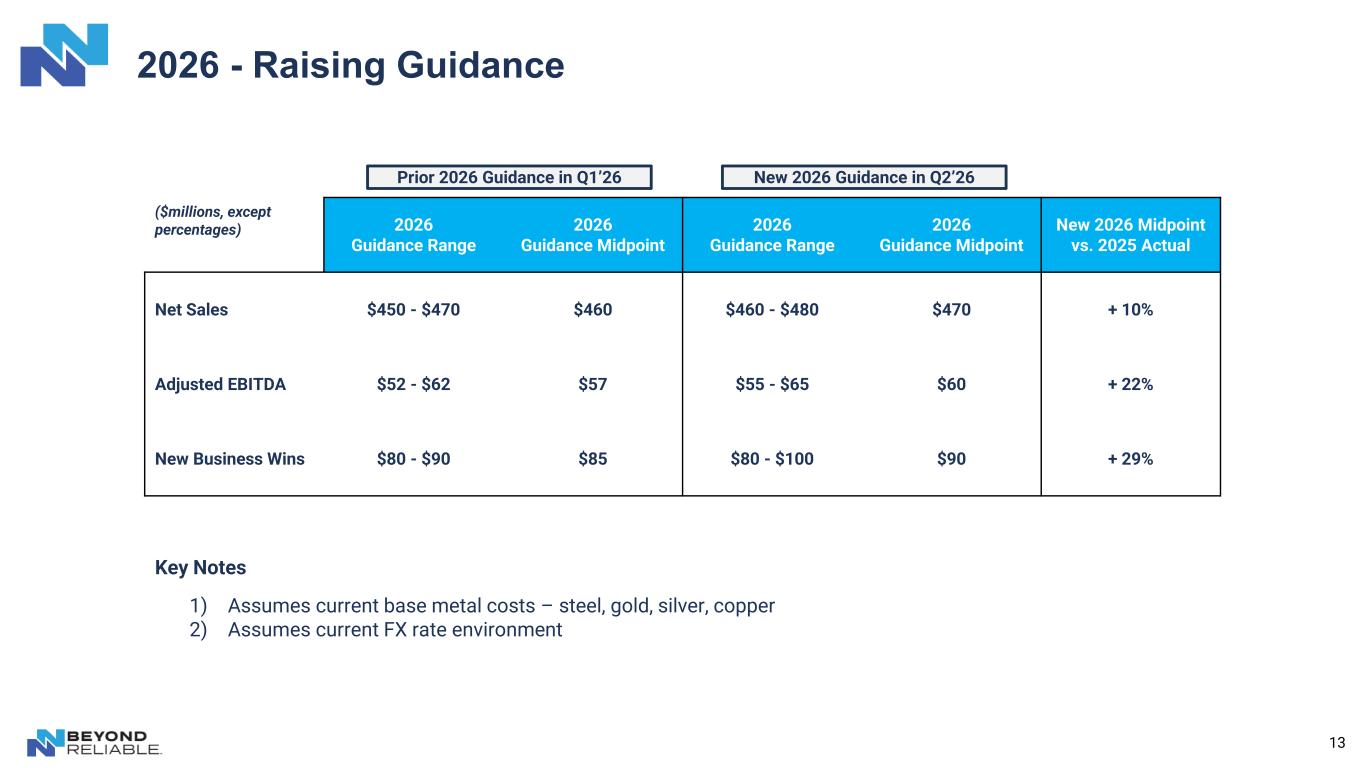
13 2026 - Raising Guidance ($millions, except percentages) 2026 Guidance Range 2026 Guidance Midpoint 2026 Guidance Range 2026 Guidance Midpoint New 2026 Midpoint vs. 2025 Actual Net Sales $450 - $470 $460 $460 - $480 $470 + 10% Adjusted EBITDA $52 - $62 $57 $55 - $65 $60 + 22% New Business Wins $80 - $90 $85 $80 - $100 $90 + 29% Prior 2026 Guidance in Q1’26 New 2026 Guidance in Q2’26 Key Notes 1) Assumes current base metal costs – steel, gold, silver, copper 2) Assumes current FX rate environment
14 Appendix
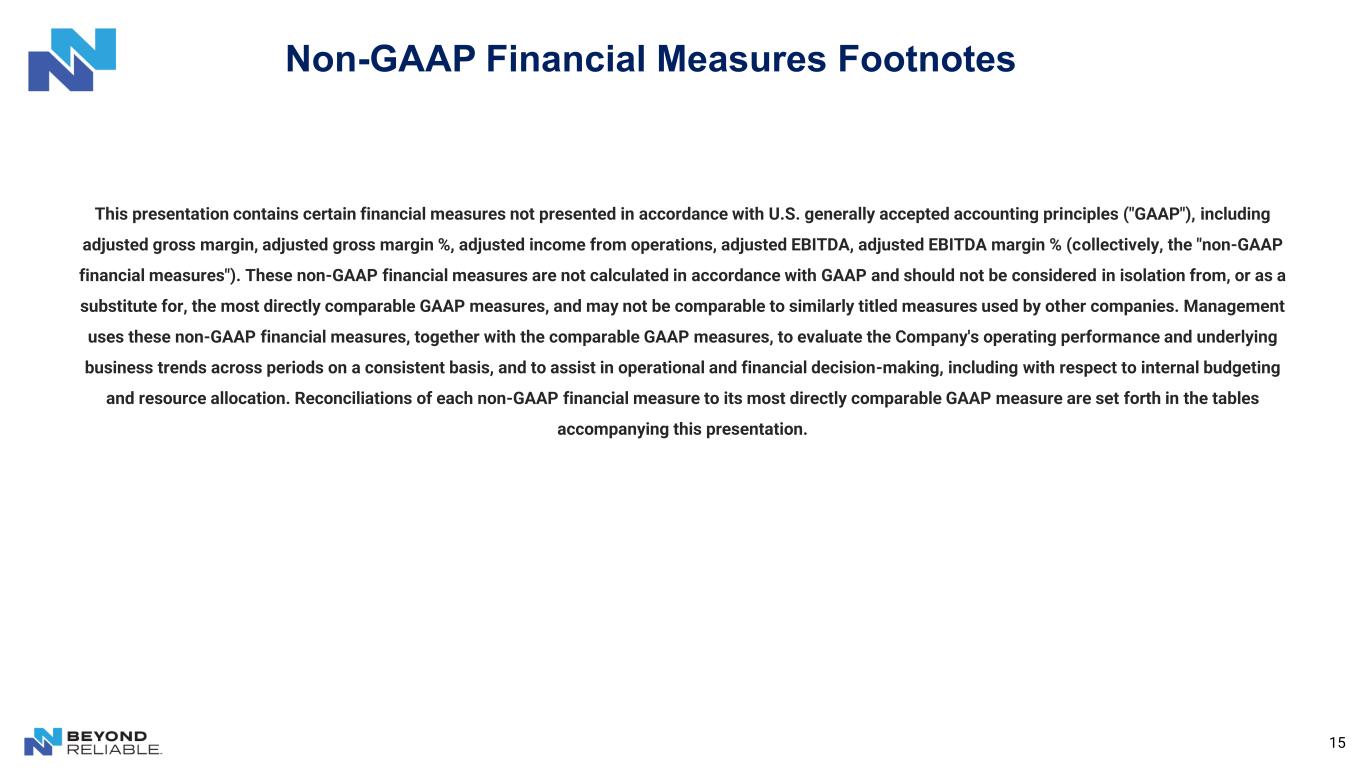
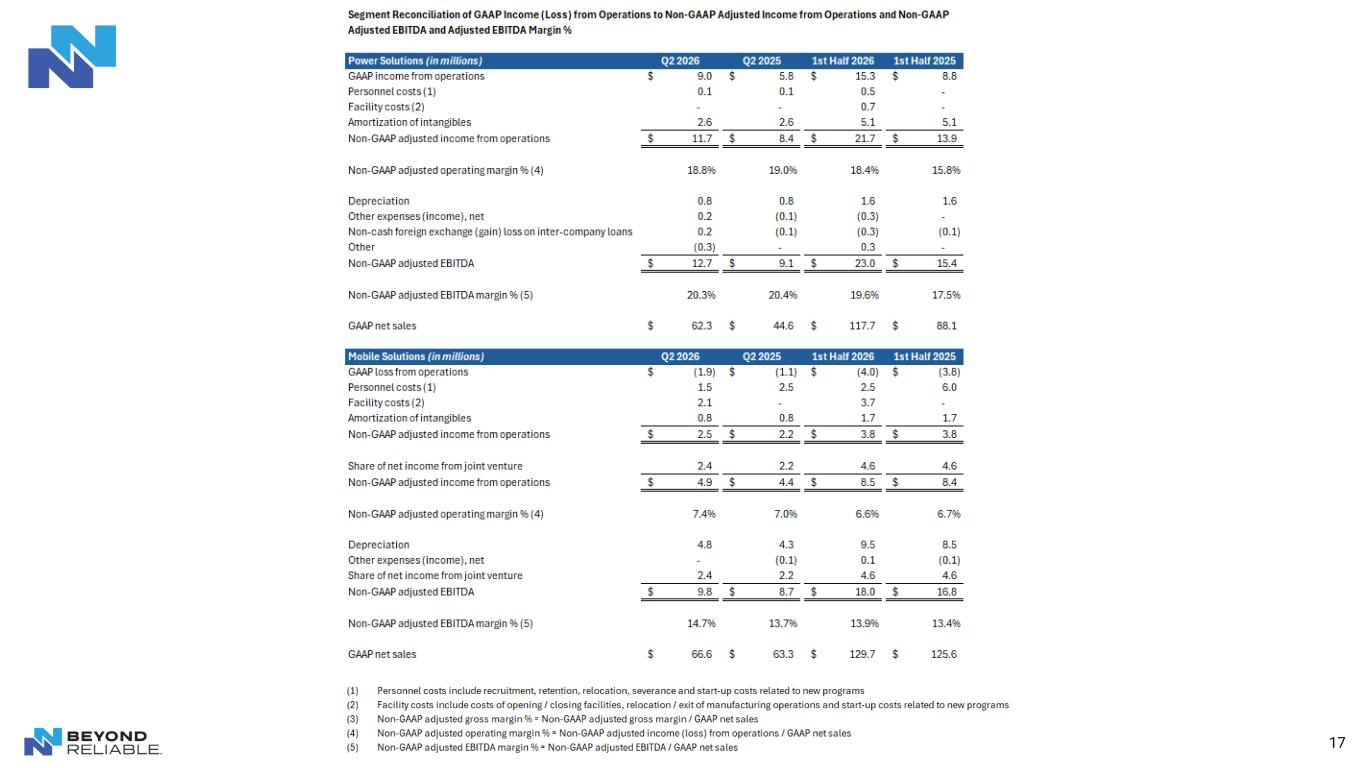
15 This presentation contains certain financial measures not presented in accordance with U.S. generally accepted accounting principles ("GAAP"), including adjusted gross margin, adjusted gross margin %, adjusted income from operations, adjusted EBITDA, adjusted EBITDA margin % (collectively, the "non-GAAP financial measures"). These non-GAAP financial measures are not calculated in accordance with GAAP and should not be considered in isolation from, or as a substitute for, the most directly comparable GAAP measures, and may not be comparable to similarly titled measures used by other companies. Management uses these non-GAAP financial measures, together with the comparable GAAP measures, to evaluate the Company's operating performance and underlying business trends across periods on a consistent basis, and to assist in operational and financial decision-making, including with respect to internal budgeting and resource allocation. Reconciliations of each non-GAAP financial measure to its most directly comparable GAAP measure are set forth in the tables accompanying this presentation. Non-GAAP Financial Measures Footnotes
16
17

18 Thank You