
Second Quarter 2026
Shareholder Letter

Sol, ‘SolProano’ shop on Etsy

2
Dear Shareholders,
From day one as CEO, I've been clear about three things: our differentiation as a human-centered marketplace
is our greatest strength; we have a massive market opportunity ahead of us; and realizing that opportunity
requires clear strategic focus and disciplined execution.
The results we are reporting today reinforce our conviction that this focus is translating into stronger
marketplace fundamentals and accelerating growth. We are encouraged by our progress, and increasingly
confident in our ability to create long-term shareholder value, reflected in our improved outlook for 2026 and
new $2 billion share repurchase authorization.
Just as importantly, we continue to see significant opportunity to further strengthen relationships with our buyers
and sellers to drive long-term marketplace value. In this letter, I’ll share how our strategic priorities are improving
performance today, as well as how we’ll evolve our organization to lay the foundation for Etsy’s next stage of
growth.
Second Quarter 2026 Key Performance Indicators
We are encouraged that all key performance indicators continue to show improving momentum. Second quarter
GMS and revenue growth accelerated on a sequential basis, and we delivered healthy flow-through of revenue
growth to adjusted EBITDA, again demonstrating the strength of our business model. Etsy marketplace GMS
grew year-over-year for the third consecutive quarter, reflecting sequential growth in trailing twelve month active
buyers, and a 2.8% year-over-year increase in trailing twelve month GMS per buyer.
On July 30, 2026 we completed the sale of Depop to eBay. Etsy’s results of operations for Q2 2026 are presented on a continuing operations basis, while Depop is presented as a discontinued operation for all periods presented. Due to the sale of Reverb on June 2, 2025, continuing operations presented herein includes Reverb and Etsy marketplaces for Q2 2025, but Q2 2026 reflects the Etsy marketplace only. This makes year-over-year continuing operations results not directly comparable. To provide investors with a meaningful basis for comparing our go-forward operations, we have included Etsy marketplace standalone year-over-year comparisons for GMS, Revenue, and Net Income below, along with comparisons on a continuing operations basis. | ||
Q2 2026 Key Performance Indicators | GMS | |
$2.6B +7.5% Y/Y Etsy Marketplace growth +1.0% Y/Y Continuing Operations basis | ||
REVENUE | TAKE RATE | |
$668M +9.3% Y/Y Etsy Marketplace growth +6.2% Y/Y Continuing Operations basis | 25.9% | |
NET INCOME | N E T I N C O M E | ADJ. EBITDA |
$114M +$67 million Y/Y Etsy Marketplace +$69 million Y/Y Continuing Operations basis | $195M 29.2% Adj. EBITDA Margin | |
Etsy Marketplace year-over-year revenue and net income growth as well as Adj. EBITDA and Adj. EBITDA Margin, are non-GAAP financial measures.
Reconciliation of non-GAAP financial measures to the most comparable GAAP measures can be found in “Non-GAAP Financial Measures” below.
3
Growth priorities are working together to create a healthier
marketplace
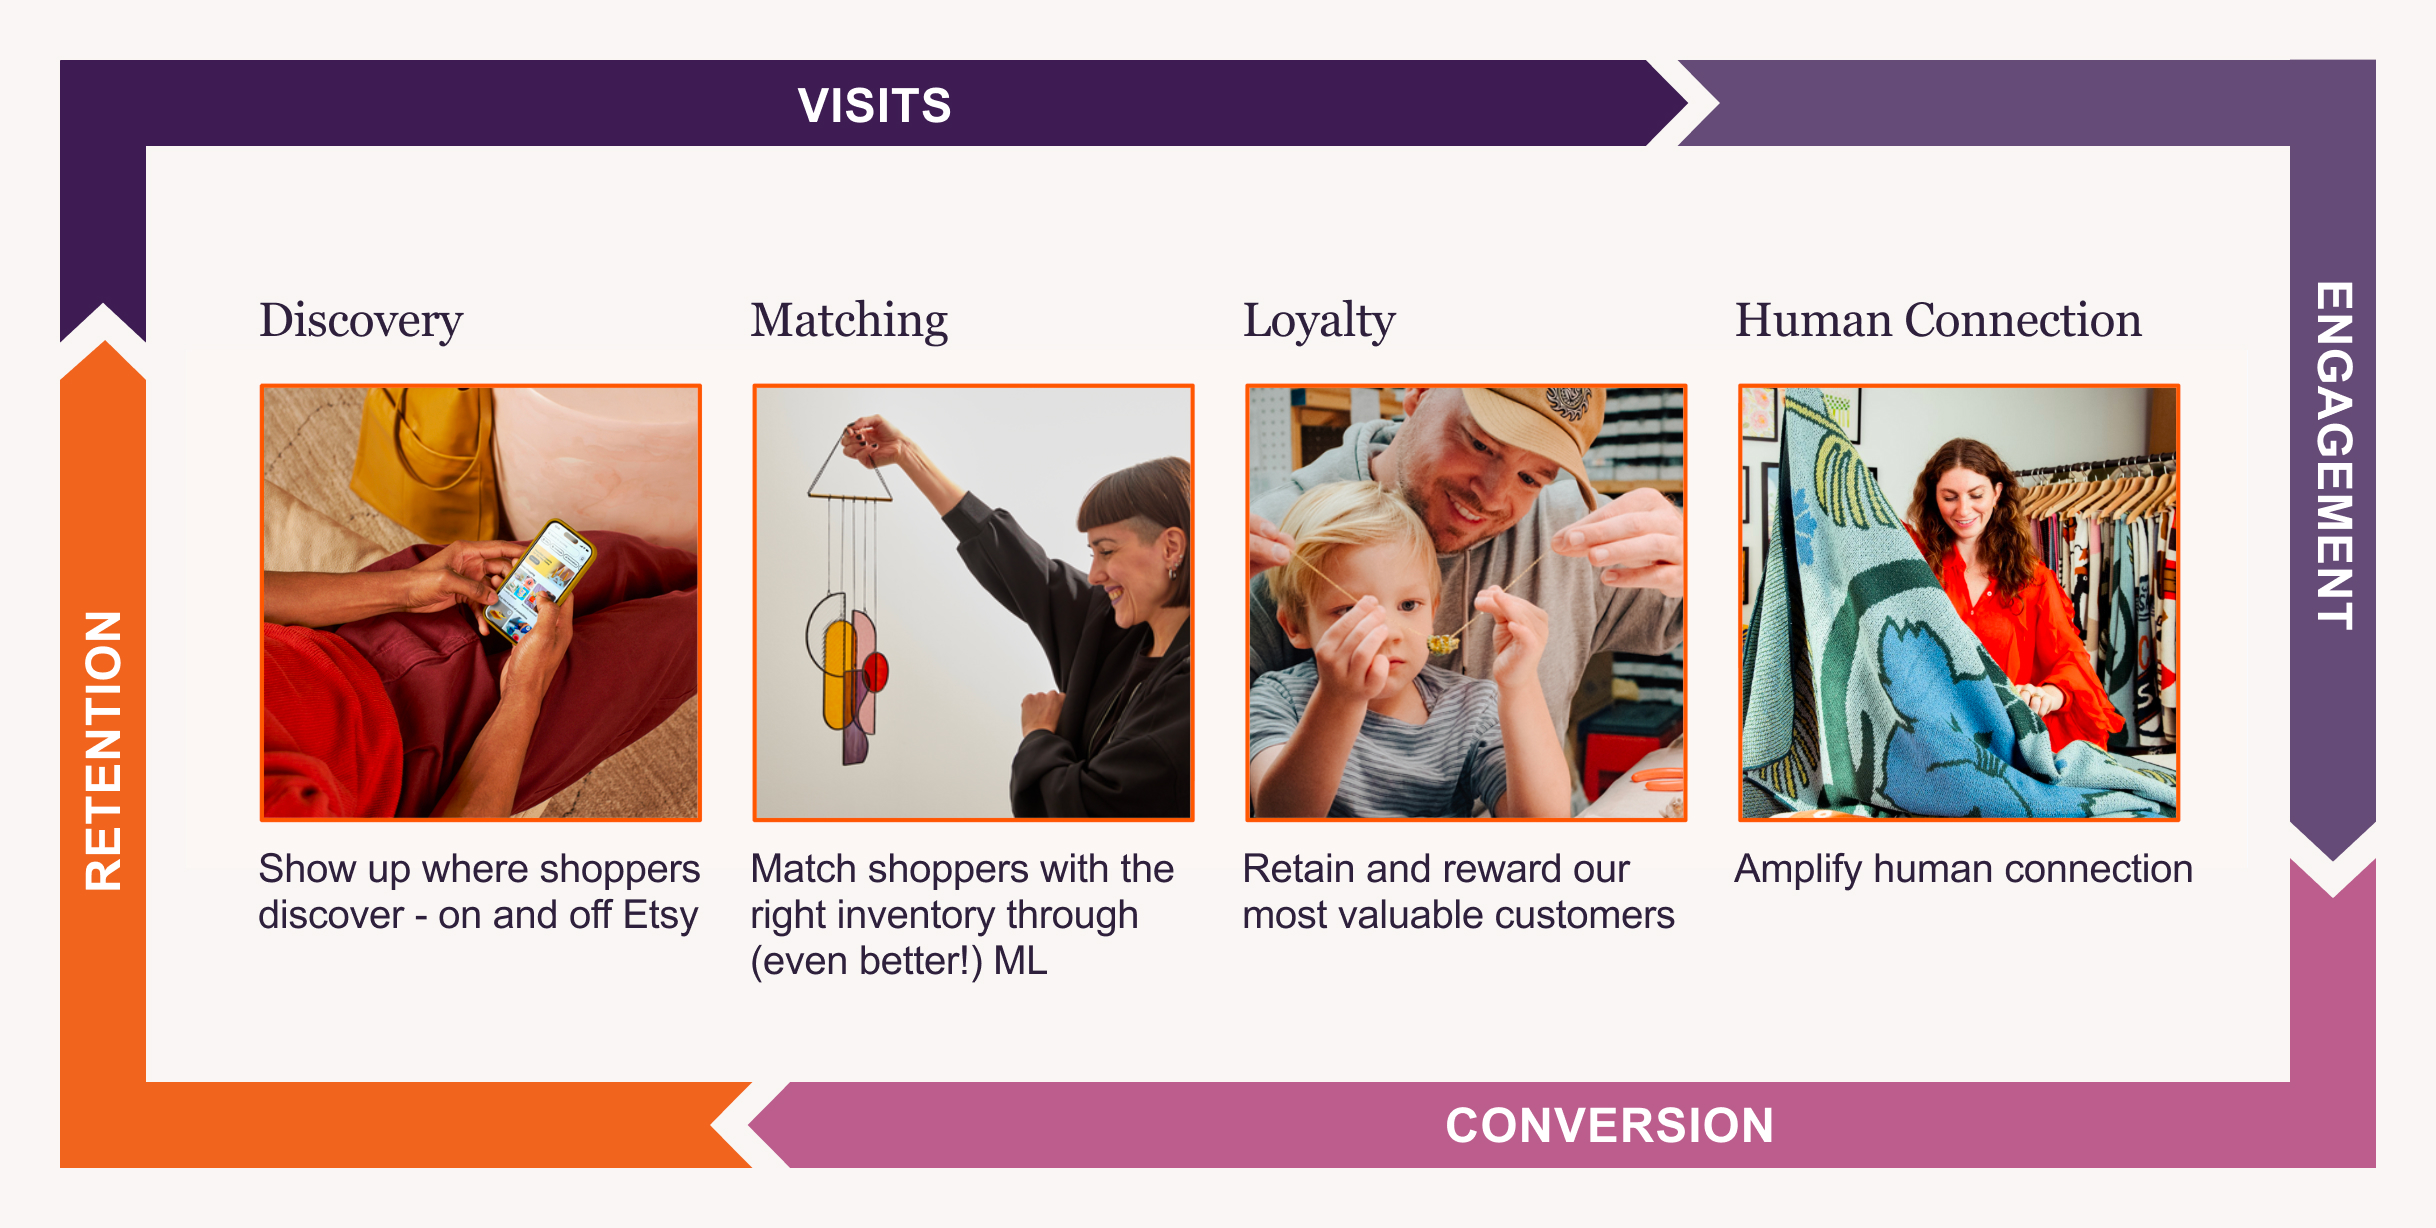
Our four growth priorities are designed to work together to build lasting relationships between buyers, sellers,
and Etsy. Discovery and Matching help buyers find and connect with the right items. Loyalty and Human
Connection give buyers more reasons to return.
In addition to headline metrics — GMS and its main levers of active buyers, frequency, and AOV — we closely
track a broader set of faster-moving metrics that help provide early signals of the impact of our work on the
customer experience and overall marketplace health. These signals span acquisition, engagement, mission
conversion and expansion, post-purchase experience, buyer-seller connections, and retention. We do not
expect these signals to move in a straight line or translate into financial results at the same pace, but together
they help us understand where product and marketing investments are gaining traction, and where we need to
adjust. As we’ve moved through 2026, these indicators are providing evidence that we are working on the right
priorities to make Etsy more relevant, trusted, and valuable to our customers.
Human Connection - Investing in our Core Differentiation
At our best, Etsy stands for creativity, craftsmanship, and connection — it’s our core differentiation. While
these qualities have always been part of what makes Etsy special, we believe that by making them more
consistently visible and tangible throughout the experience, we will reinforce our unique value for customers.
We've strengthened our conviction that the breadth of our inventory is an advantage, that handmade is a
point of differentiation to lean into, and that the individuality of our sellers is one of our greatest
strengths. For buyers, seeing more of the maker's process is one of the strongest drivers of trust, confidence,
and perceived value. We also see that signals of seller identity, craftsmanship, and the creative process
reinforce one another throughout the buyer journey, helping expand what buyers believe Etsy is for.
4
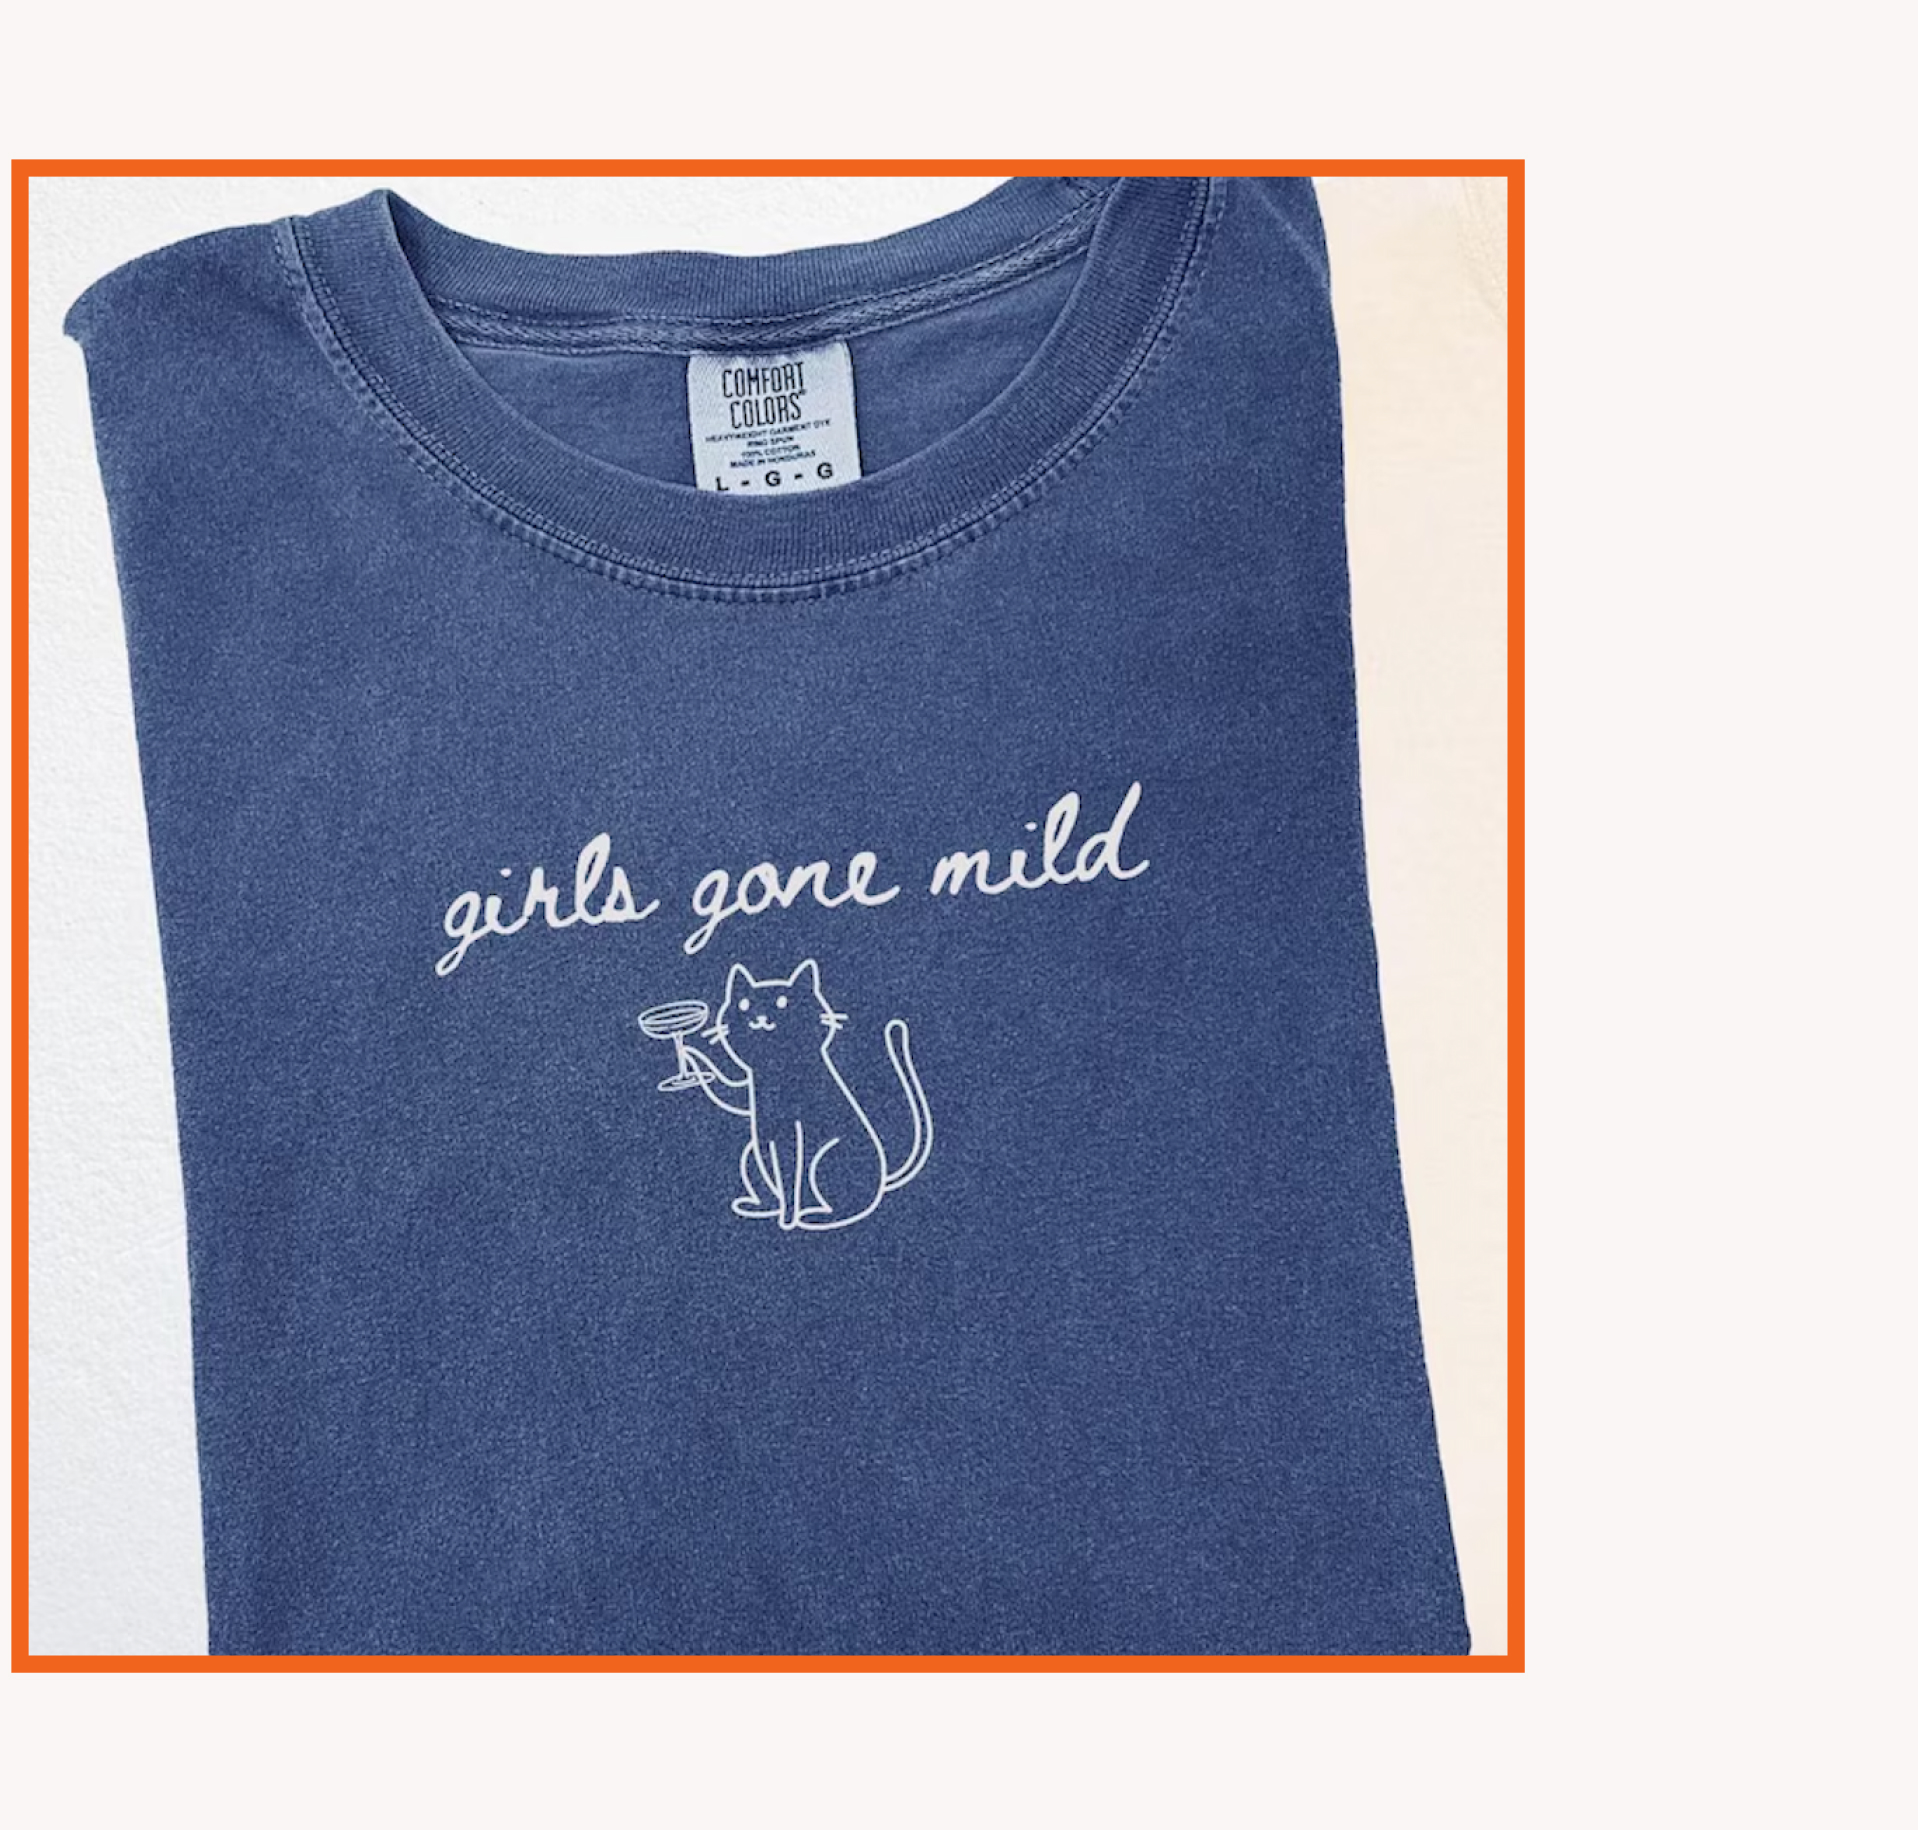
Creativity reflects imagination, originality, or personal expression from a seller, a buyer, or both. | Craftsmanship means made with skill or care, and an experience that helps buyers see and appreciate the craft. | Connection means buyers can feel the presence of a real person behind the item or the experience. |
 |  |  |
Importantly, we've learned that when buyers feel a connection to a maker, they often want to continue that
relationship. Today, Etsy doesn't provide a clear way to do that. We see an opportunity to strengthen human
connection before a purchase—building confidence and helping buyers discover the right item—and then carry
that connection beyond the transaction to encourage repeat visits, deepen affinity for the marketplace, and
further amplify what makes Etsy different. We're also learning more about how to make human connection
tangible in the shopping experience - such as by improving the conversation interfaces between buyers and
sellers.
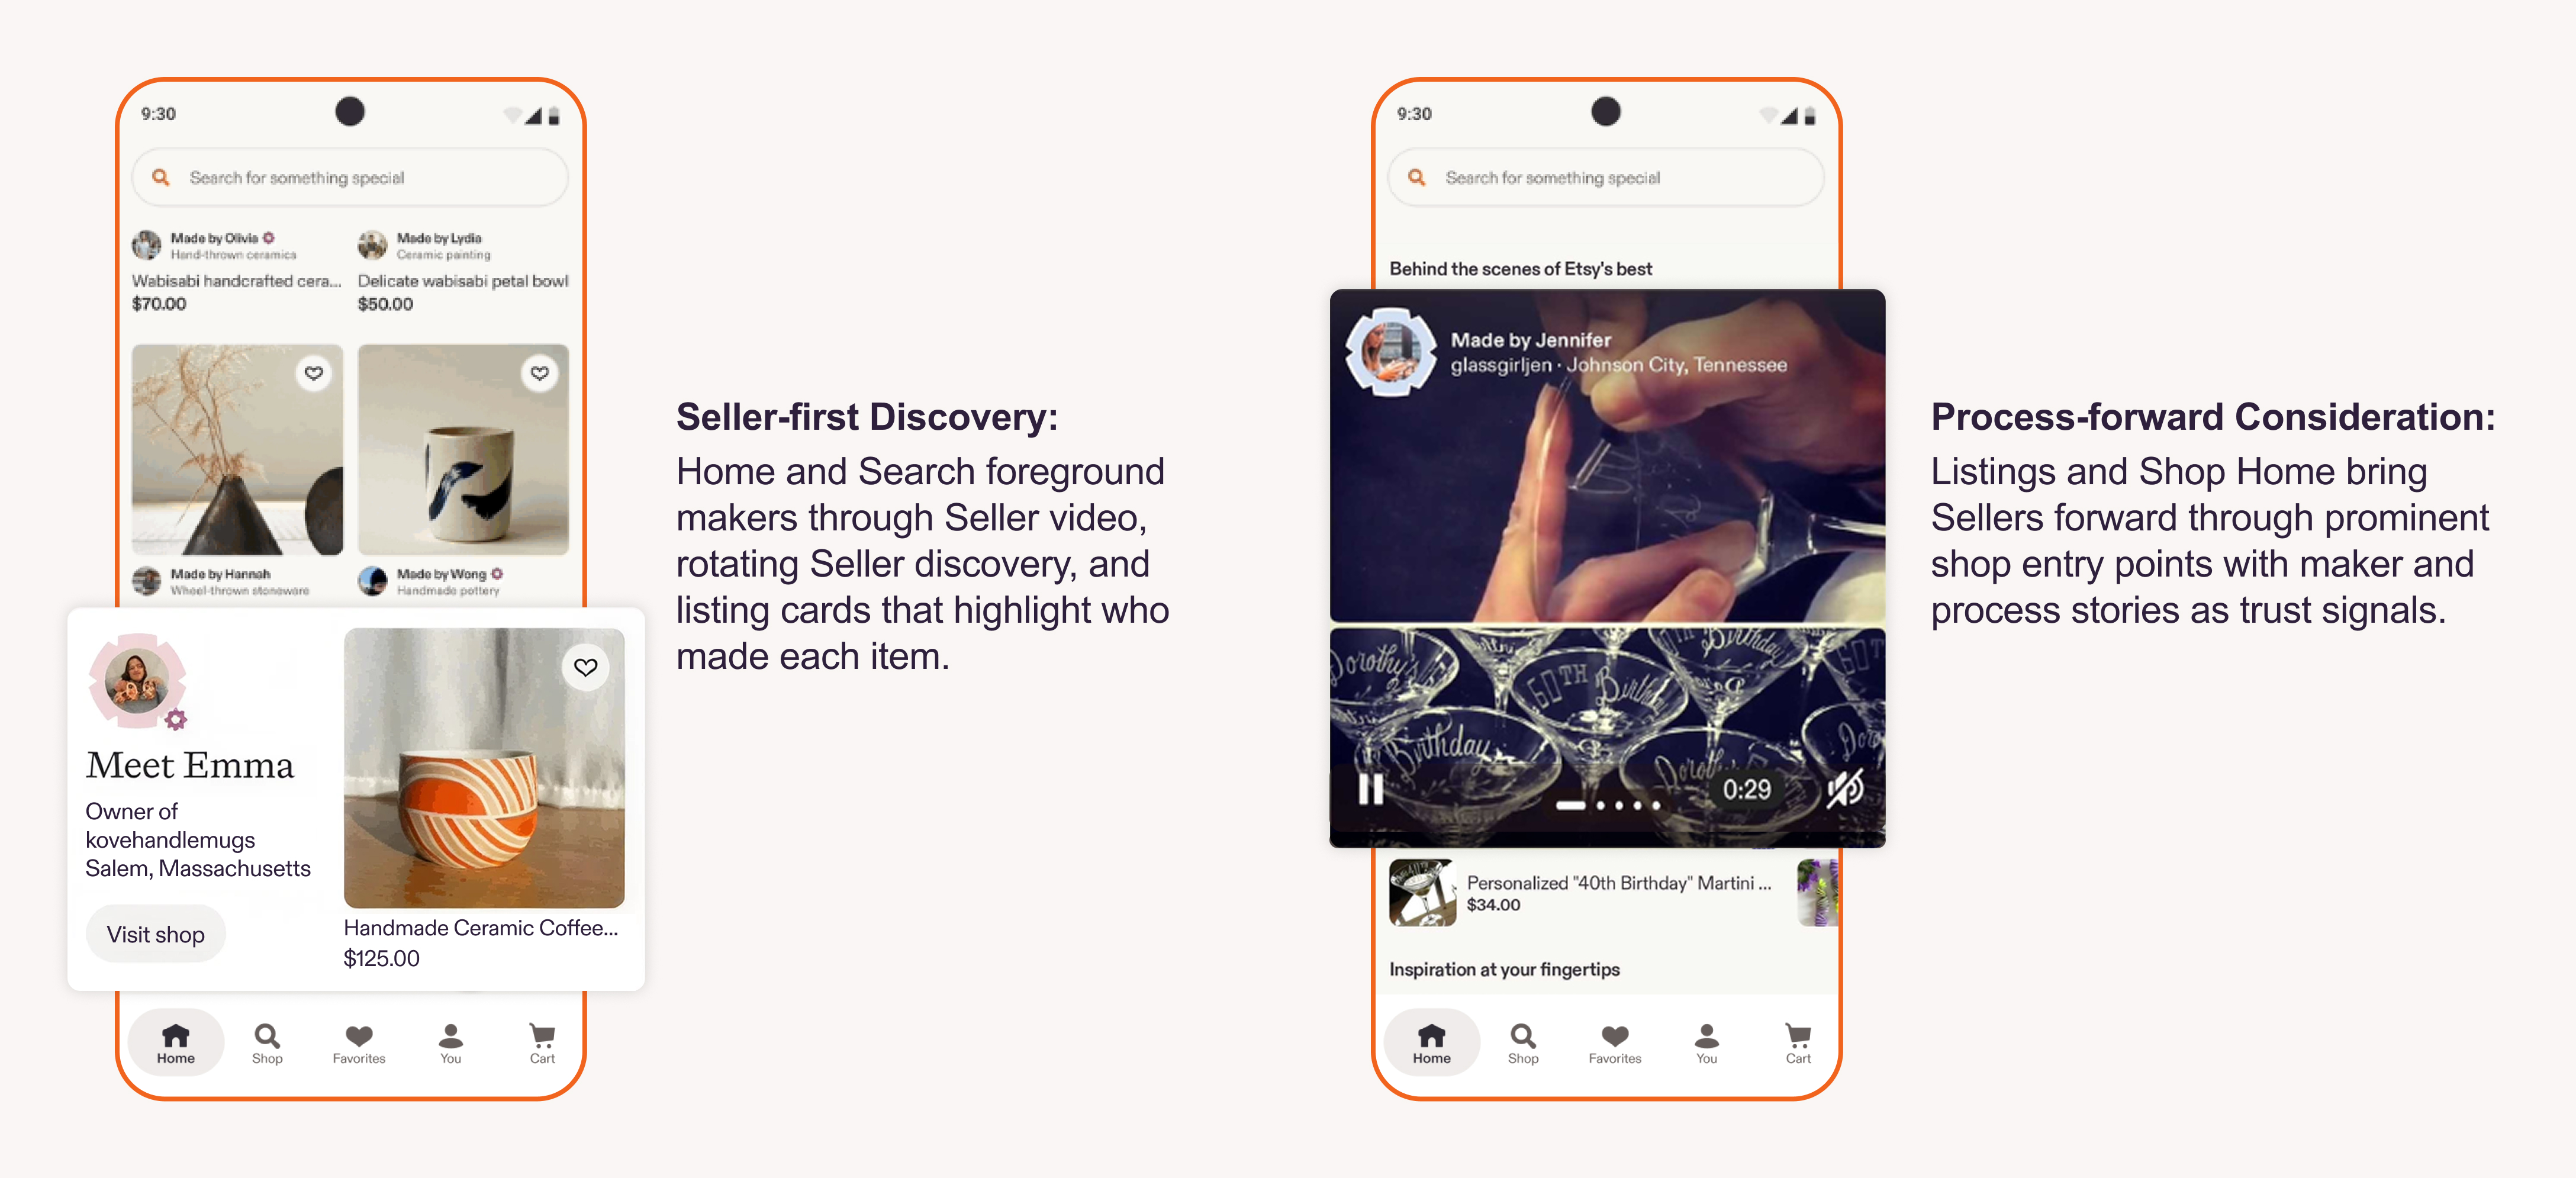
We're currently evaluating more comprehensive seller-forward shopping experiences on Android to better
understand how these ideas work together across the end-to-end shopping journey. The experience shown
below is intended to illustrate the direction we're exploring rather than a final product. These tests are helping us
learn how to make Etsy feel more human in ways that strengthen trust, highlight our differentiation, and improve
the overall buyer experience.
This focus on Human Connection is also amplified in our brand positioning - which celebrates what it means
to be human and the unique role Etsy sellers play in helping people mark moments that matter, big and small.
For example, our ‘Shop Other Jeffs’ campaign creative was designed to resonate with a younger audience -
Gen Z and Millennials.
5

In addition to contributing to some of the encouraging visits
metrics shared below, the ‘Shop Other Jeffs’ campaign
also generated significant media coverage and organic
celebrity endorsements, extending its reach well beyond
paid channels.
In another tangible example of our commitment to
creativity, craftsmanship, and connection, Etsy
recently launched the Craft Catalyst Initiative, a new
impact strategy and philanthropic endeavor in
partnership with the national nonprofit Center for
Craft. Through this initiative, Etsy is investing $10
million into American craft communities to support the
people and organizations that make these creative
ecosystems possible, helping ensure artisans have
the resources to grow, connect, and keep craft
thriving for generations to come.
Discovery and Matching Drive Better Buyer Understanding and Engagement
Along our journey to move from a buyer’s past purchases or interests and ‘in the moment’ conversion-focused
experiences, recent improvements in buyer understanding are enhancing the shopping ideas we present to
buyers whether it's on the app home screen, push, or email. Our vision is to create a shopping experience that
proactively helps buyers shop for the people, passions, goals, and moments that matter most. During the
quarter:
Buyer profiles have taken a significant step forward in quality and coverage as outlined below, and we are working to extend that buyer understanding beyond feed- based discovery into search. | Improvements to feed freshness, including suppressing over 80% of previously viewed and engaged listings, drove gains in feed favoriting, listing views, and new searches while remaining GMS neutral. | App Home continued to expand buyer consideration, helping more buyers start new shopping missions, with year-over-year growth in new missions per weekly active user. |
•We saw further growth in buyers engaging with new shopping missions and discovering fresh, cross-
category inventory through the app home feed, reflecting continued progress in our personalization
efforts. Encouragingly, these changes are introducing fresher, more differentiated content without
disrupting existing buyer intent or near-term marketplace performance.
•At the same time, we continued to improve real-time personalization in Search while evolving our
approach to quality, moving beyond surfacing what has historically been most popular or most likely to
convert, toward helping buyers discover the best our sellers have to offer for their specific shopping
mission. This approach reminds buyers what they love about Etsy and why they should come back in
the future.
•Underpinning these improvements are significantly richer buyer profiles—now covering more than 65
million buyers and providing three times more signals than earlier this year—with an average of about
30 interests and preferences per buyer. This enables more forward-looking recommendations across
Etsy.
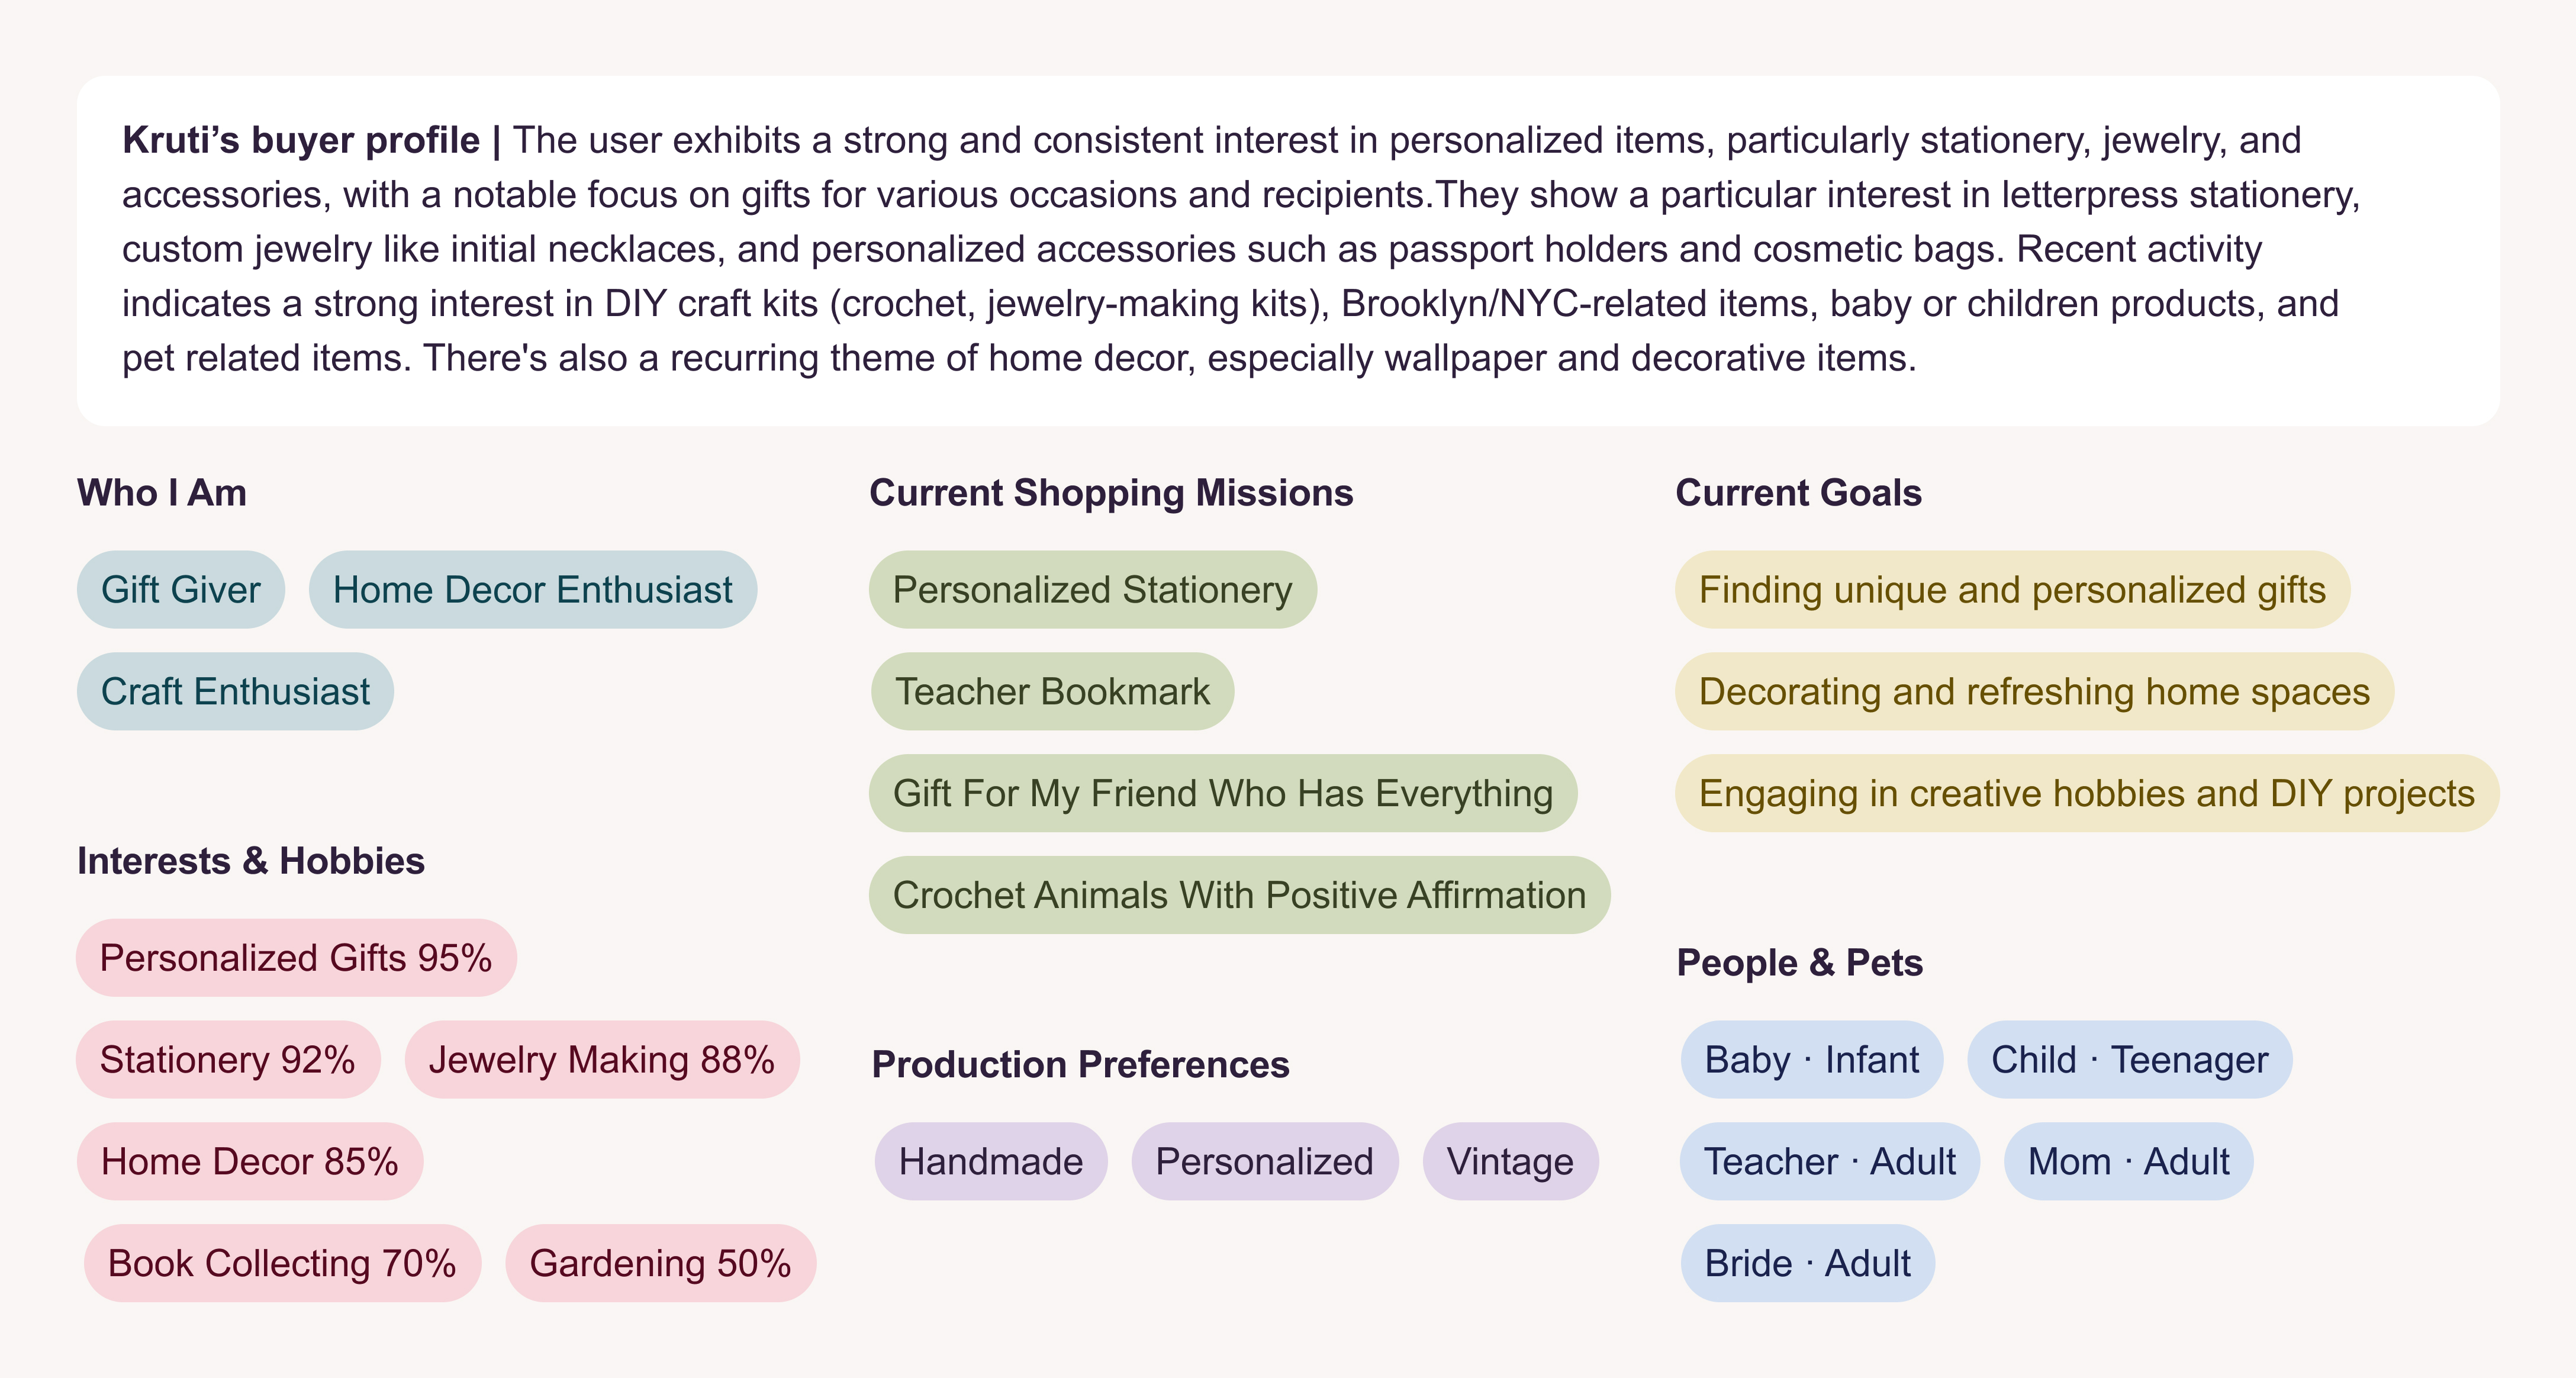
These richer buyer profiles increasingly reflect buyer’s interests, shopping goals, relationships, and seasonal
needs, allowing us to make more proactive recommendations. For example, my own buyer profile looks like this
- and shows that Etsy really gets me!
6
Moving to other Discovery investments, we continue to test how and where conversational ‘agentic’
shopping fits as a durable, distinctly Etsy experience. In May, we launched the beta version of our new ‘Gifting
Assistant’ to help buyers discover meaningful gift ideas through natural conversation. While it’s very early days,
agent usage skews to new, high-intent buyers coming from Etsy-driven sources (email or other), and it has
received positive user feedback. We’re excited to test and learn with these capabilities in order to ensure we are
ready as more buyers become inclined to use conversational assistants in their Etsy shopping journeys.

We’ve also been evolving the way Etsy shows up on various discovery channels - both organic and paid. Our
foundational investments include work on our inventory signals, content feeds, and product listing ad campaign
structures. This work is critical to ensure that the long-tail of Etsy inventory is highly visible and consumable
across all external platforms, including as agentic experiences become
more important over time. We believe Etsy sellers’ unique breadth of

inventory and brand represent an important competitive advantage and
position us well as AI-driven discovery grows.
We also continue to evolve our marketing strategy to encourage discovery
among younger buyers:
•Removing storefront friction and improving tooling for our Creator
Collective program;
•Organizing top-tier partnerships anchored to cultural moments;
•Expanding our brand presence on YouTube and TikTok to reach
younger buyers earlier in their discovery journey. In the first half,
visits from Millennial and Gen Z audiences through those two
channels grew approximately 5X year-over-year, giving us
confidence that we are reaching more target buyers and allocating
spend toward the highest-impact channels.
Left: Etsy marketing on TikTok; Right: New Olivia Rodrigo partnership.
7
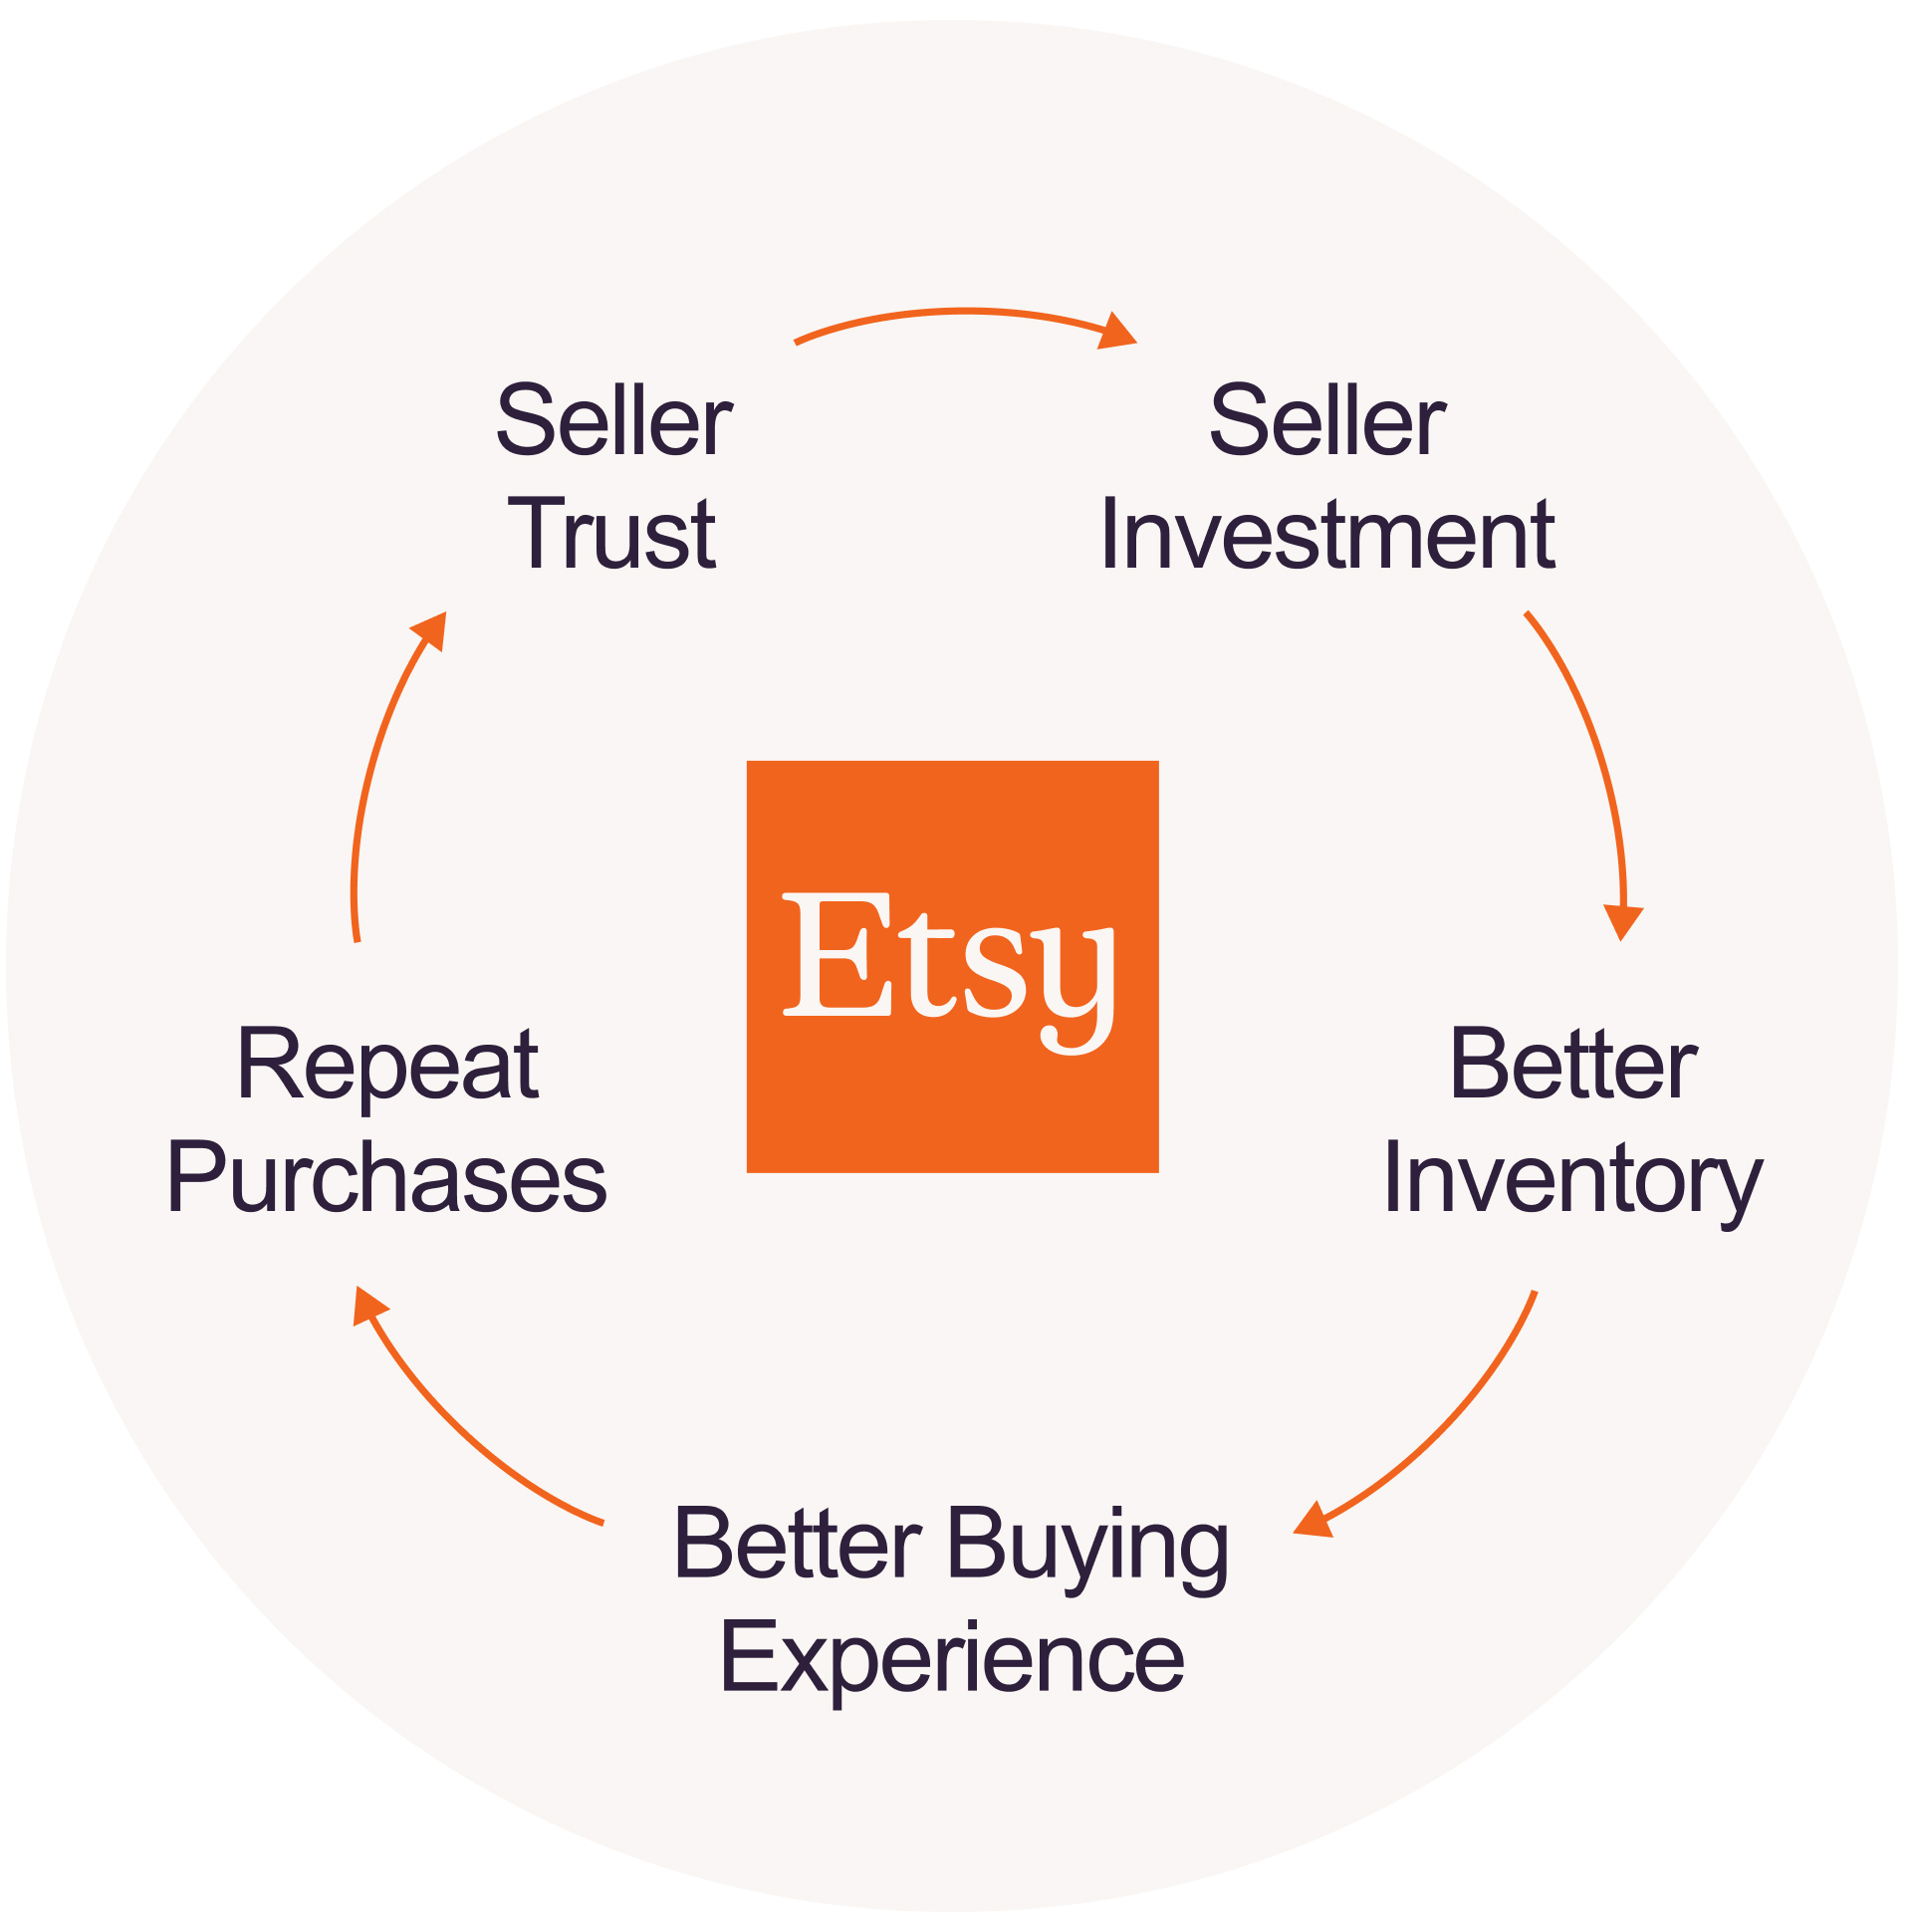
Evolving approaches to support Buyer and Seller Loyalty
A healthy marketplace requires buyers and sellers to thrive, and we’re
continuing to make progress on both fronts.
For buyers, we are developing initiatives meant to drive overall frequency,
particularly with our top buyers - those who are mid-to-high frequency and
comprise a meaningful part of our GMS - but who may drift down in
frequency over time. These include:
◦Growing direct relationships with our most active buyers by
optimizing how and when we communicate with them, delivering
more timely, relevant and valuable experiences across the app and
offsite channels;
◦Testing new ideas to reinforce buyer loyalty, such as bespoke and ‘high touch’ premium support for
our best buyers, and proactive outreach when we observe a potential delivery issue before we are
contacted; and
◦Exploring several unpaid loyalty tactics - such as rewards and ‘stamps’ - to supplement the testing
we are continuing to do on ‘Etsy Insider.’ We are specifically evaluating how these types of programs
can be used as levers to build emotional connection to one of our key brand-defining characteristics -
buyers’ desire to support small business through their Etsy purchases.
On the seller side, we are investing in the sellers who best represent what makes Etsy unique. We are
kicking off work to evolve our ‘Star Seller’ program - a designation launched five

years ago which highlights ‘how’ a seller runs their shop - their reviews, shipping
transparency and customer response - with a goal to make it more meaningful to
sellers and impactful to our business. Further, as a result of our inventory
understanding work, we also have new insights about Star Sellers who, in
addition to great customer service, also provide distinctive inventory (the ‘what’
they sell) and have a track record of proven buyer demand. Given that buyers who
purchase from this seller cohort have meaningfully higher lifetime value, we’ll be
developing new approaches to support them, as well as to help others reach this
level of excellence. Over time, we believe these initiatives will drive seller success
and retention, repeat buyer rates, and overall marketplace value.
Making Strong Progress, with More Work to Do
Over the past year, we have sharpened our strategy, strengthened execution, and are encouraged by the
progress we're seeing across the marketplace. We have inflected Etsy’s year-over-year growth trajectory from
high-single-digit GMS declines in early 2025 to mid-single-digit growth anticipated for the full year 2026 - a more
than 10 percentage point improvement in performance. As a result, we have even more conviction in our
strategic direction to build the Etsy we envision.
At the same time, we have gained additional clarity about the organization we’ll need to deliver it. So today
we’ve announced a restructuring of parts of our organization and a reduction of our workforce, with most of the
changes concentrated in our Product and Engineering group. We are changing our structure -- with fewer silos
to reduce handoffs and flatter, faster teams built to solve broader, more complex problems. And we’ll invest in
an organization capable of accelerating initiatives to drive customer frequency and retention. This is not a cost
cutting move - it is meant to lean in during a period of strong momentum so that we can move faster and
execute with even greater focus.
8
We are deeply grateful to our departing colleagues for their service, dedication, and contributions, and we are
committed to supporting them through this transition with care and respect. We know these decisions have a
real impact on people's lives, and we didn't make them lightly. They reflect our conviction that focusing our
investments and our team is the best way to build a stronger Etsy.
One of my responsibilities is to make decisions not only for the Etsy we are today, but also for the Etsy we want
to become. That means paying close attention to how the world around us is changing. Buyers are discovering
products in new ways. Sellers have access to increasingly powerful tools to build their businesses. And the
expectations they have of Etsy continue to rise. By investing in the capabilities that matter most for the future of
the marketplace, we believe Etsy will be better positioned to innovate more quickly, and ultimately deliver more
value for our customers, community, and shareholders.
Sincerely,

Kruti Patel Goyal
Chief Executive Officer
August 5, 2026
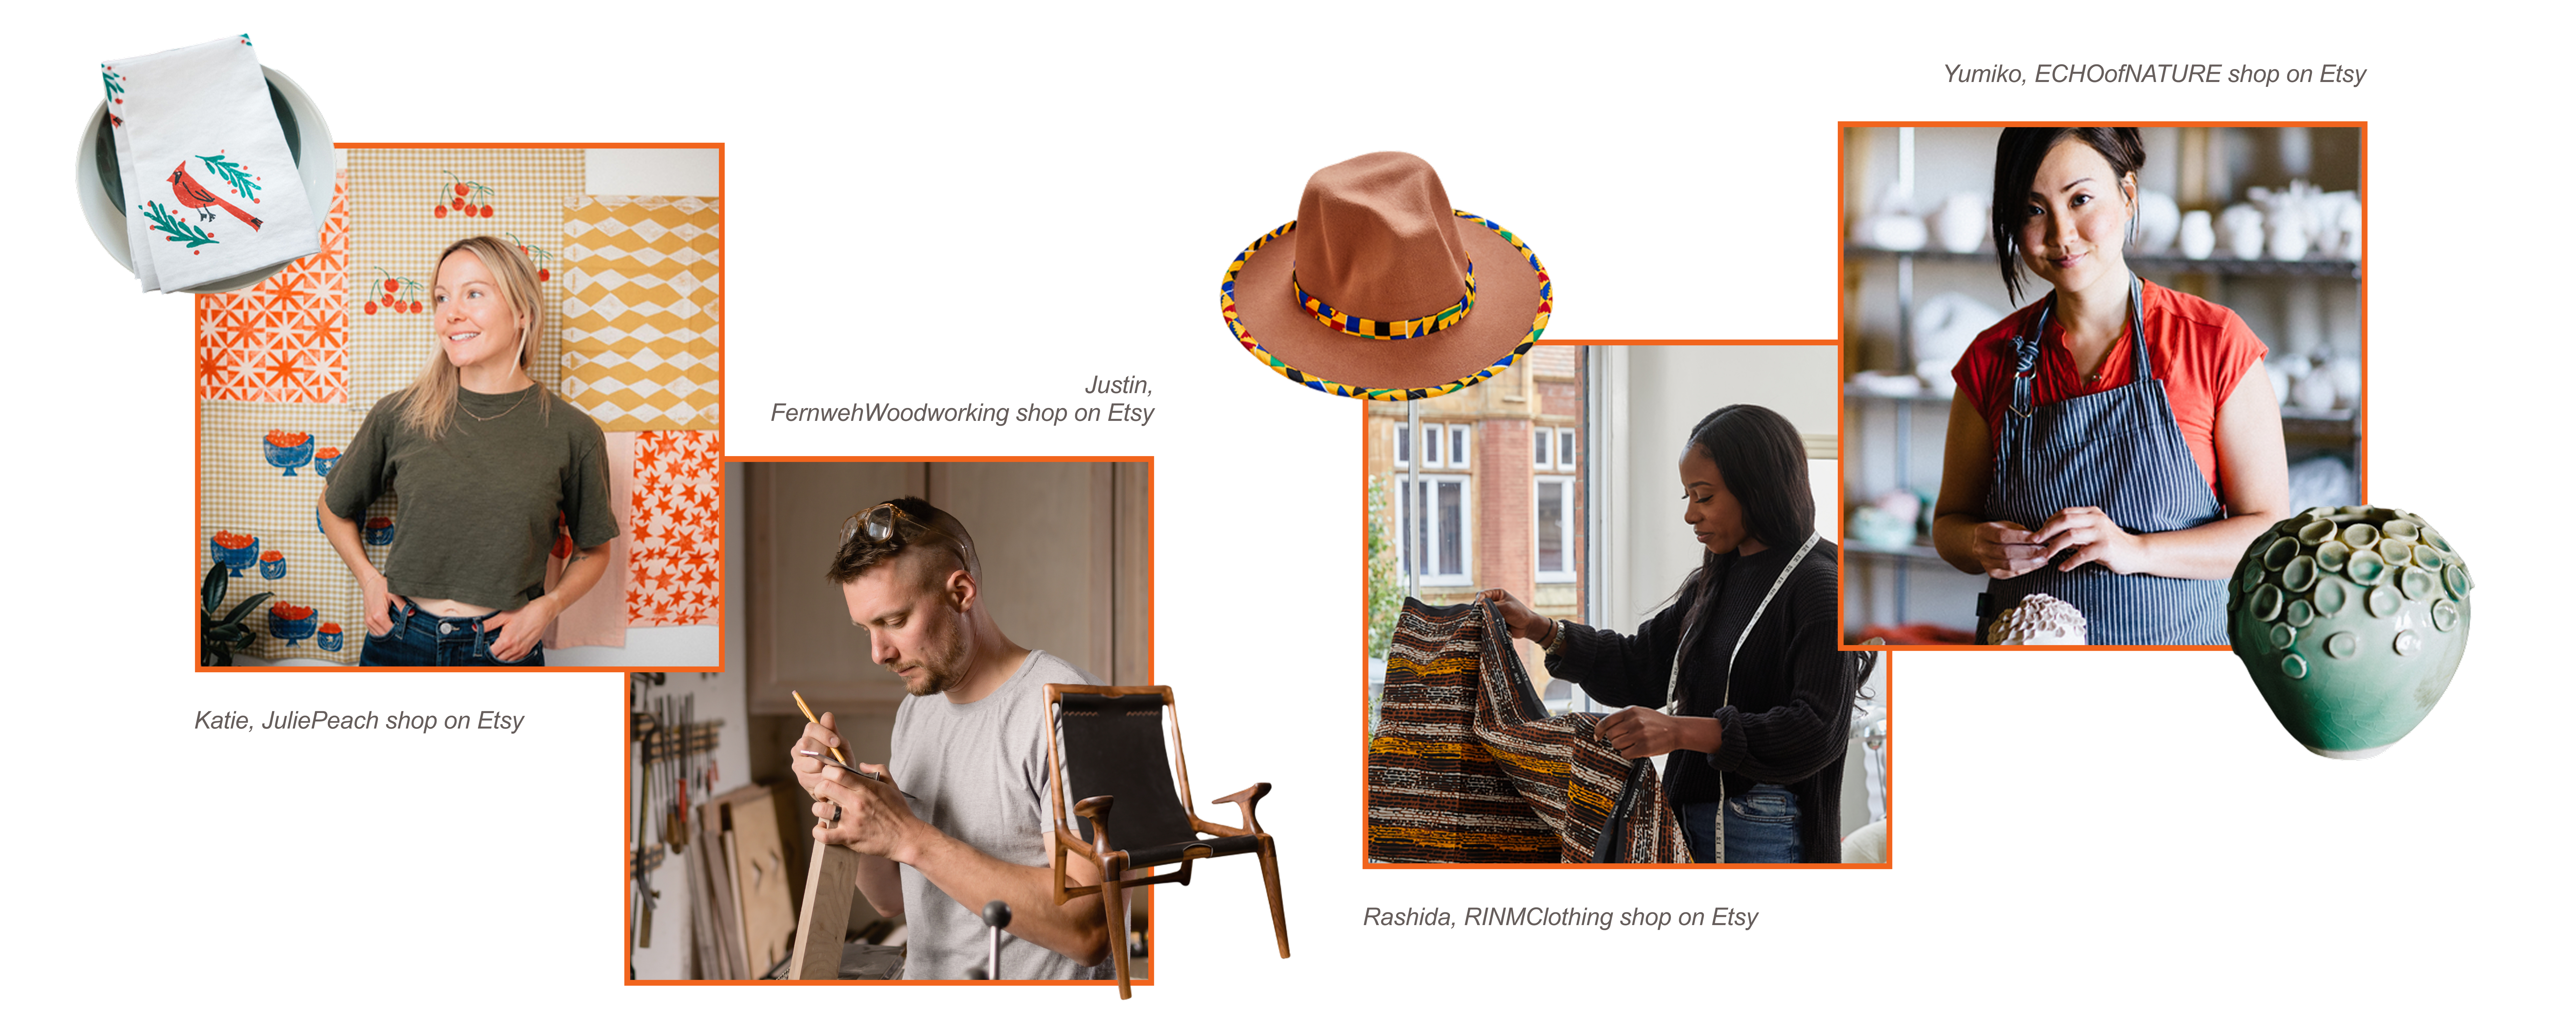
Images presented above are for illustrative purposes only and may depict work in progress.
9
Q2 2026 Financial Results
Given the sale of Depop, which was pending as of June 30, 2026, Etsy’s results of operations are presented
on a continuing operations basis, while Depop is presented as a discontinued operation for all periods
presented. Due to the sale of Reverb on June 2, 2025, continuing operations for Q2 2025 include the Reverb
and Etsy marketplaces, but Q2 2026 reflects the Etsy marketplace only. This makes year-over-year continuing
operations results not directly comparable. The GMS drivers and key customer metrics presented below are
for the Etsy marketplace only.
Q2 2026 Etsy Marketplace GMS Drivers and Key Customer Metrics
Etsy marketplace GMS achieved year-over-year growth for the third consecutive quarter, reflecting
continued improvement across marketplace fundamentals
In the second quarter, Etsy marketplace GMS was $2.6 billion, growing 7.5% year-over-year, or 7.2% on a
currency-neutral basis. Excluding foreign exchange, GMS growth accelerated by approximately 360 basis
points from the first quarter, marking the fifth consecutive quarter of sequential improvement. Both U.S. and
non-U.S. buyer GMS grew year-over-year, with U.S. growth improving sequentially and showing broad-based
strength across all household income levels. While Etsy continued to capitalize on some external factors that
support GMS growth, our product and marketing strategies are delivering meaningful benefits that are
reflected in improving buyer trends and stronger marketplace health.
One useful way to understand our performance is by looking at three main levers of growth that drive Etsy
marketplace GMS: active buyers, purchase frequency, and average order value. We made encouraging
progress across each.
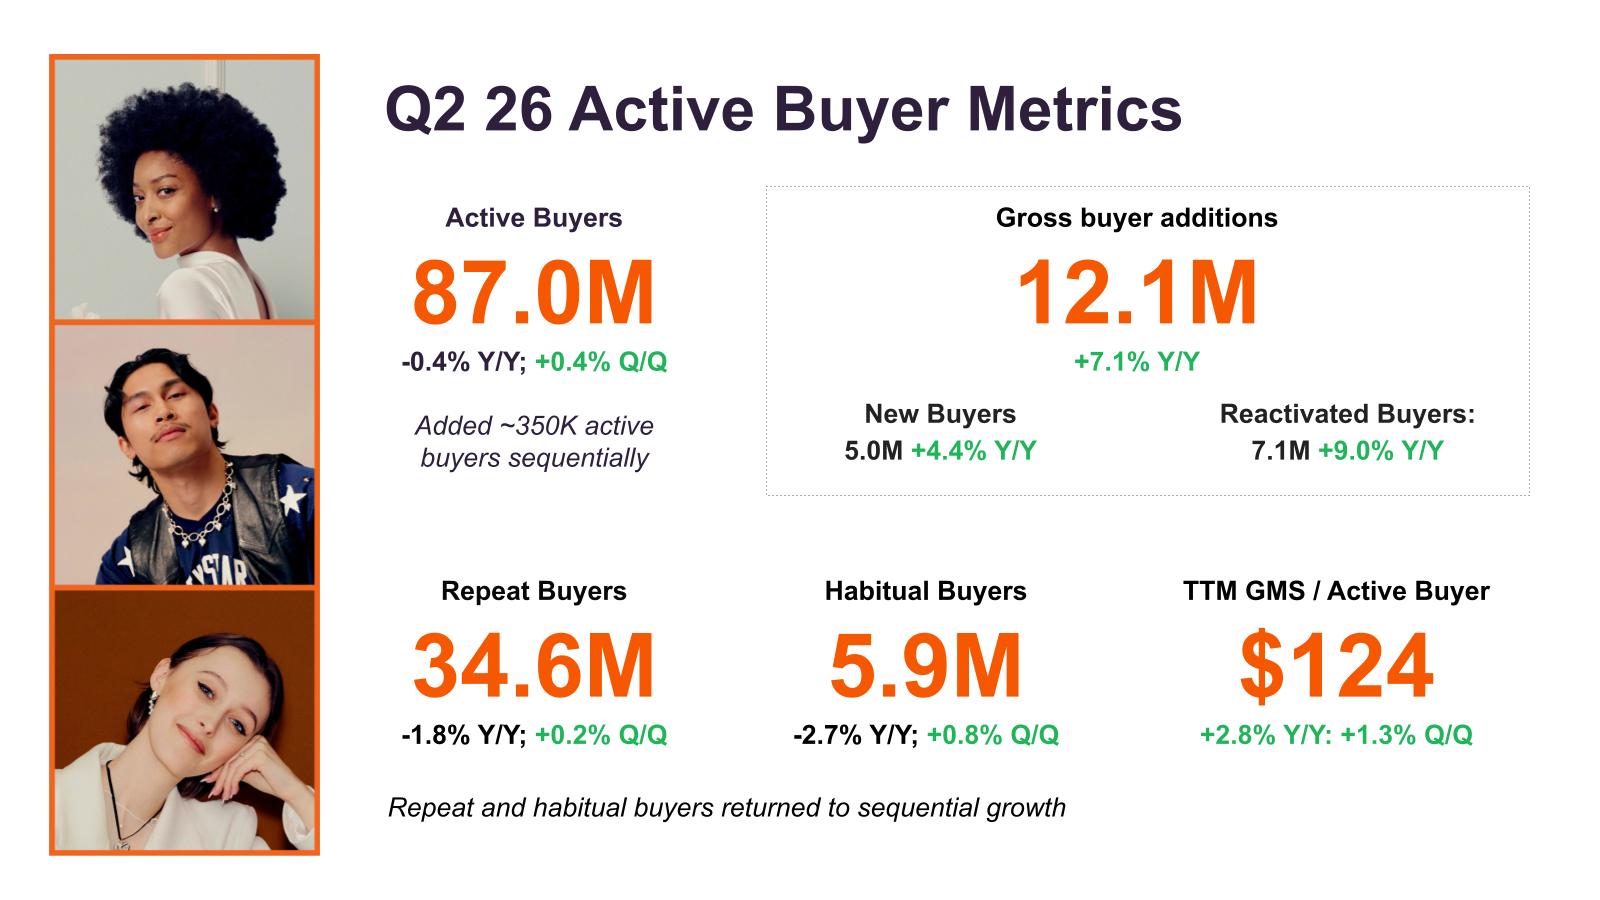
•Active buyers improved during the quarter, growing by approximately 350 thousand sequentially to
approximately 87 million for the trailing 12 months, returning to roughly stable levels on a year-over-
year basis. Gross buyer additions accelerated, increasing 7.1% year-over-year, with growth across
both new and reactivated buyers. We were also encouraged to see early signs of growth among our
most valuable buyers, with habitual and repeat buyer cohorts each showing slight sequential gains for
the first time since 2023.
•While frequency remained modestly below prior-year levels on a trailing twelve month basis, the rate
of decline moderated sequentially. We also saw improvement in the 30-day repeat purchase rate -
good signal coming from a faster-moving metric. We believe these encouraging trends reflect the
cumulative impact of our efforts to improve the overall Etsy customer experience.
•As in the first quarter, average order value was the largest contributor to GMS growth, with higher
listing prices being the prevailing driver. Our efforts to elevate higher-quality items on- and offsite
across search, discovery, and marketing are increasingly contributing to a shift toward higher AOV
items. Reflecting these trends, GMS per active buyer increased to $124 on a trailing twelve-month
basis, up 2.8% year-over-year.
Underpinning our stronger marketplace health are product enhancements which help buyers discover more
relevant, differentiated inventory, combined with marketing strategies which bring more buyers into those
improved experiences. Our mobile app is a strong example of this dynamic, and remains the surface where
personalization, direct buyer relationships, and owned marketing can most effectively compound - as
demonstrated by the continued app momentum during the quarter, shown below. Non-app GMS also
continued to improve, growing 3.4% year-over-year, accelerating from the first quarter and marking its
second consecutive quarter of growth.
10
Mobile app GMS growth accelerated to +12.5% year- over-year (vs. +11.2% last quarter). | App engagement strengthened in Q2, with visits per MAU and orders per visit both increasing year-over-year. | Mobile app drove ~47% of total GMS, increasing ~210 bps year- over-year, approximately flat sequentially. |
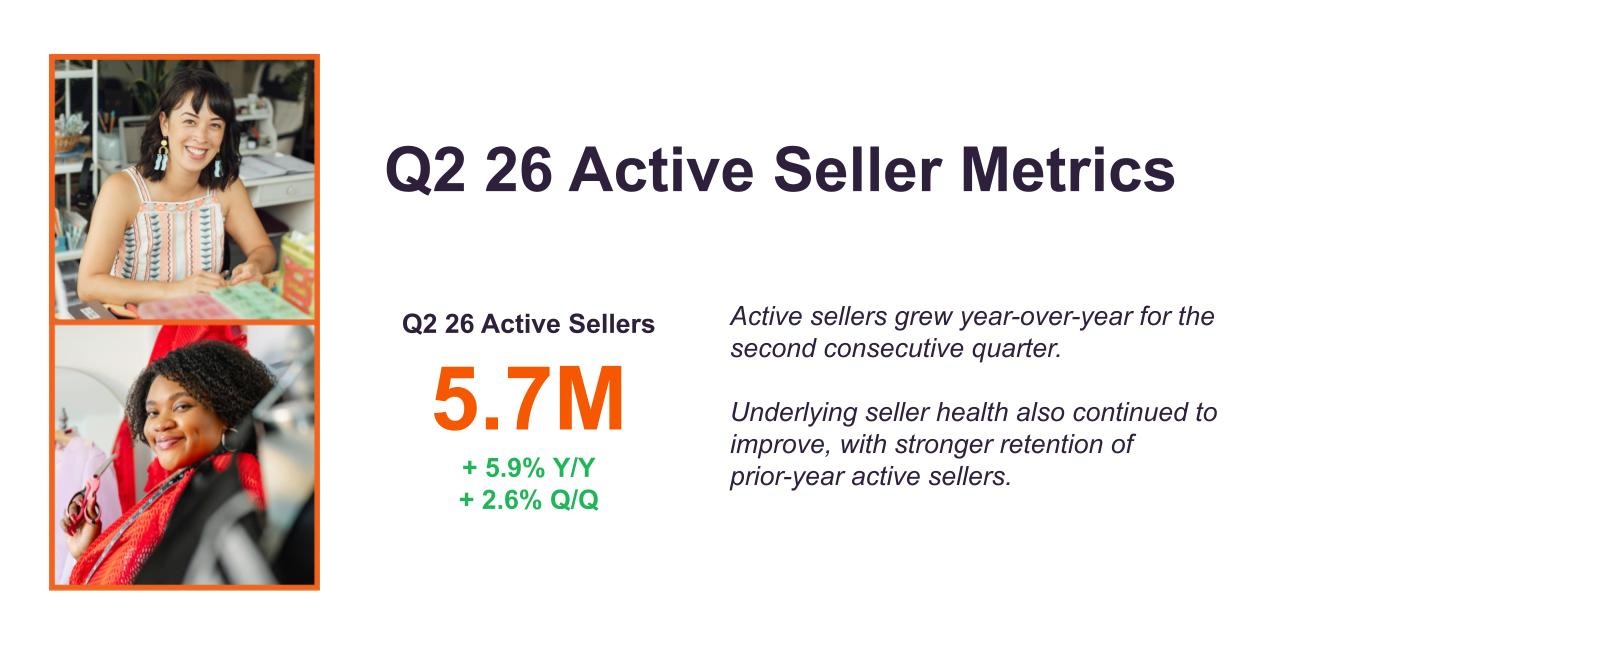
Buyer and seller metrics continued to strengthen, with healthier trends on both sides of the
marketplace
Buyer and seller metrics presented below represent the Etsy marketplace only.
Y/Y reflects Q2 2026 vs. Q2 2025, Q/Q reflects Q2 2026 vs. Q1 2026.
11
Occasion-led Growth Across Categories: Etsy continues to highlight shopping occasions where our sellers offer differentiated merchandise. We believe this focus contributed to Etsy’s outperformance versus pure-play peers in all our top GMS categories.* Some examples of merchandise trends which drove quarterly GMS appear below. | |||
 |  | 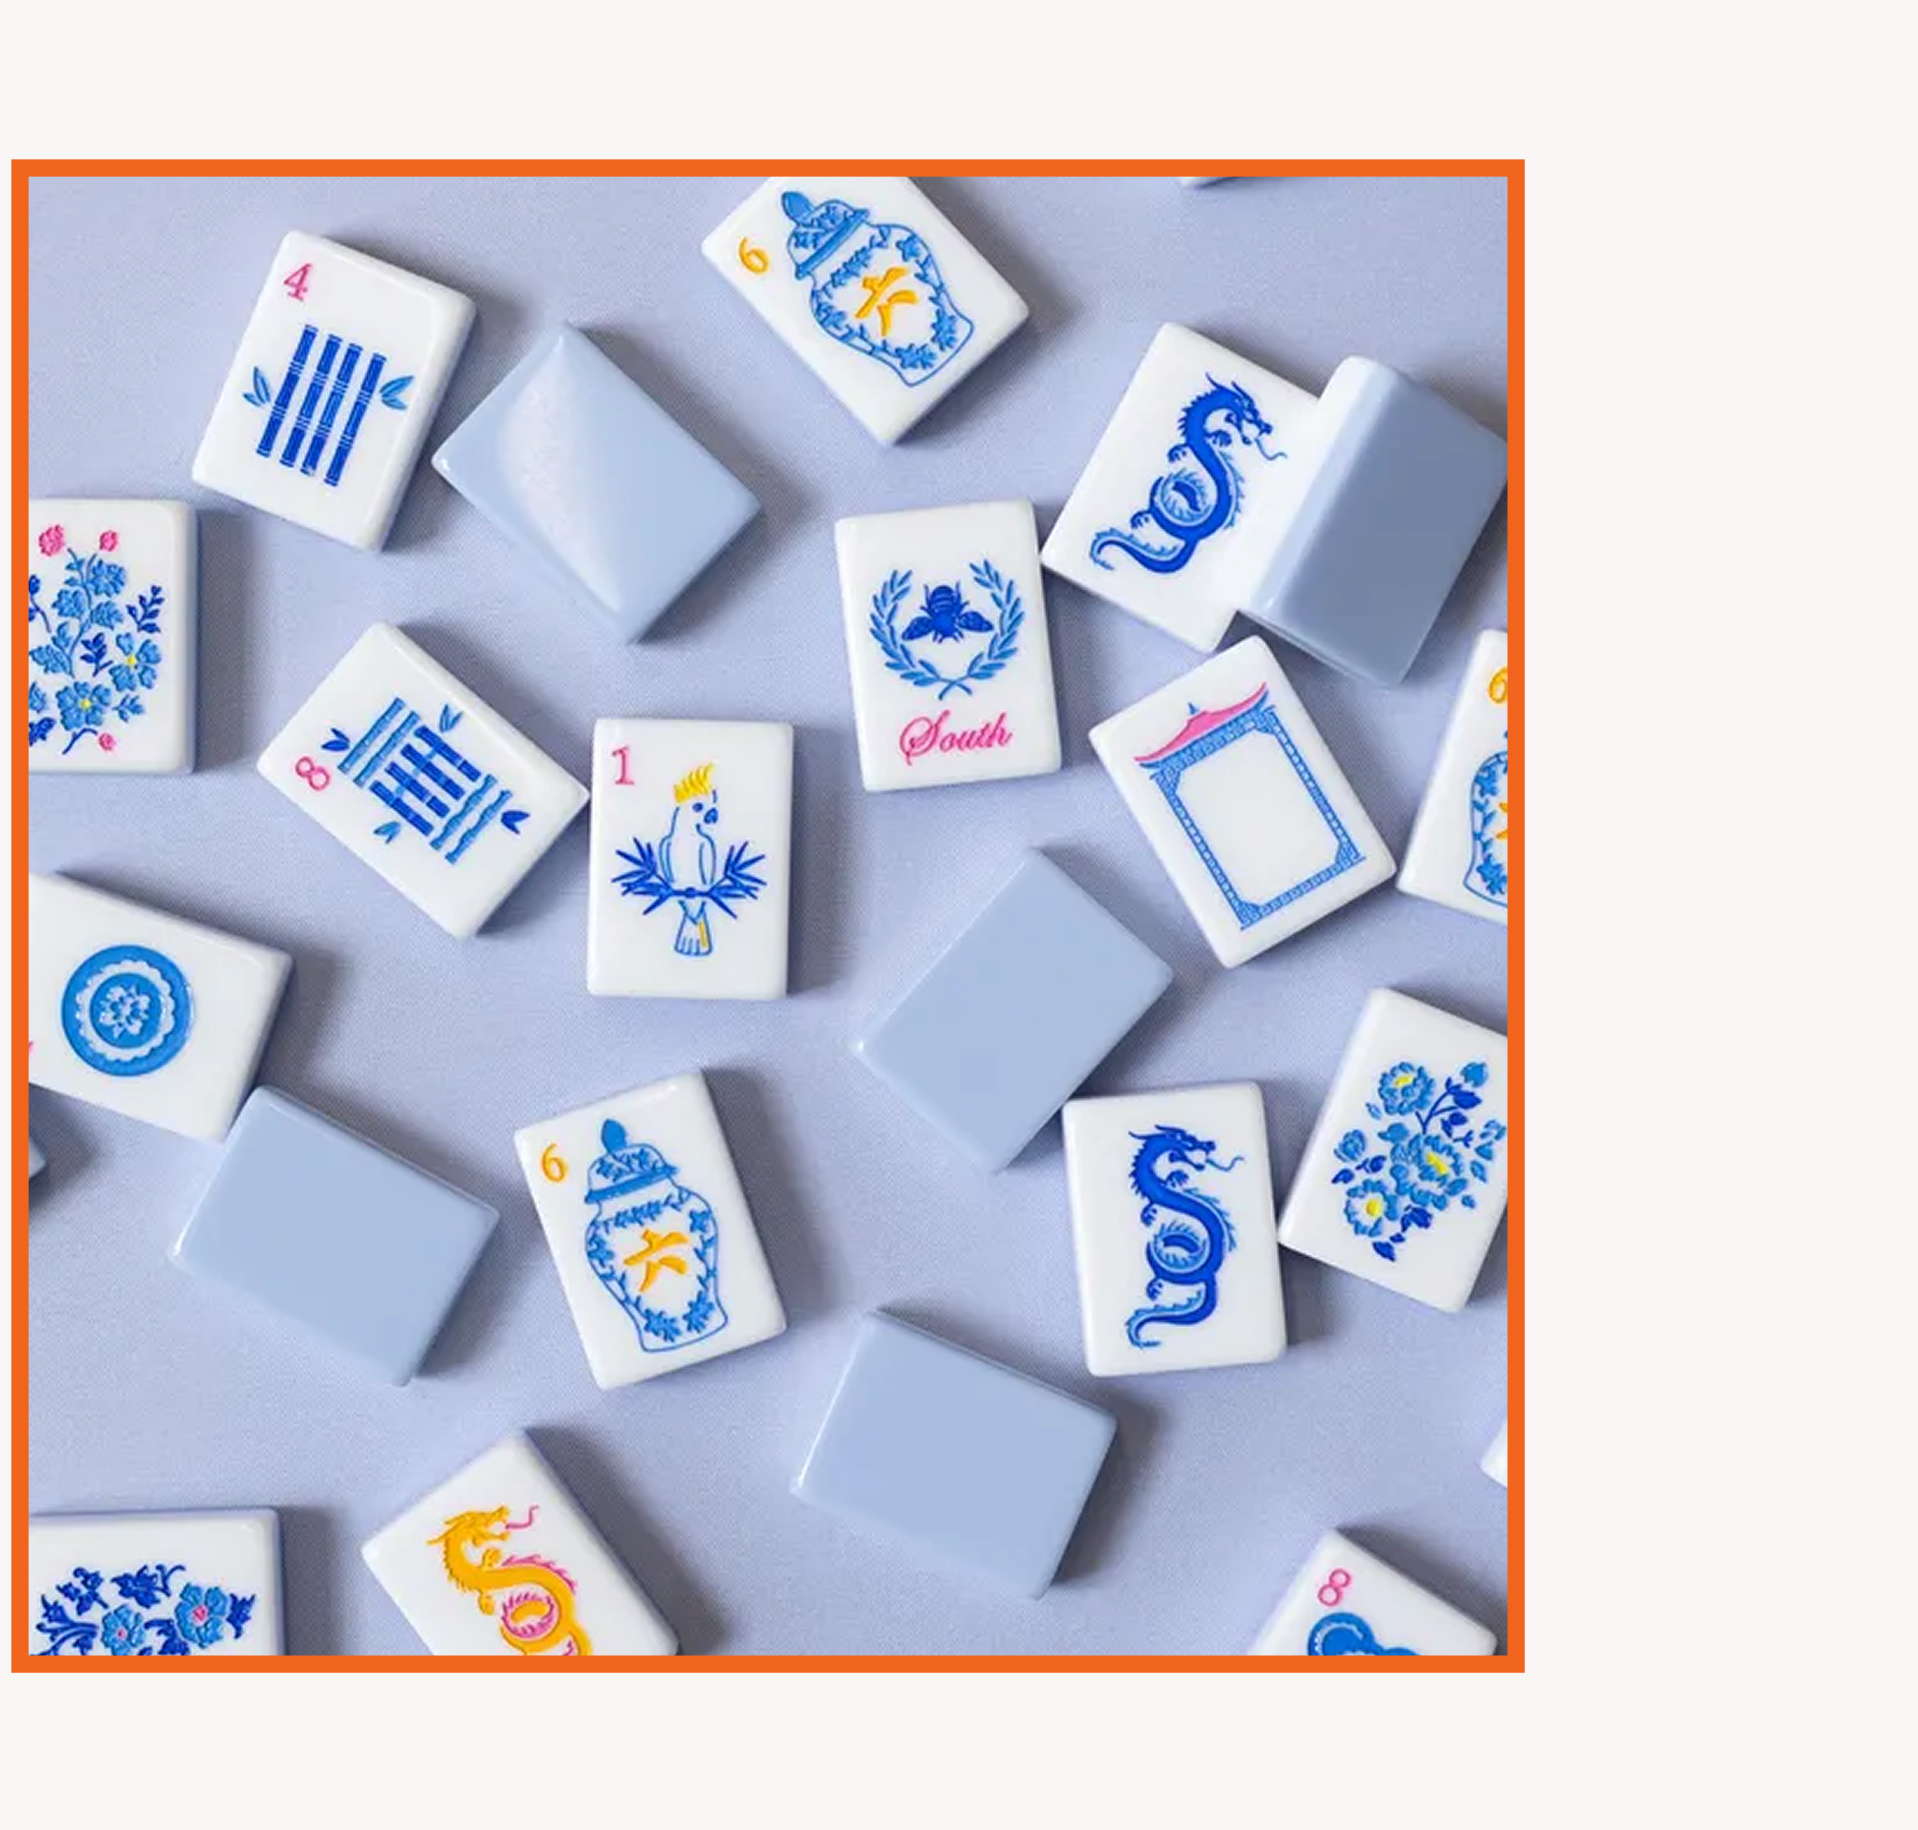 | 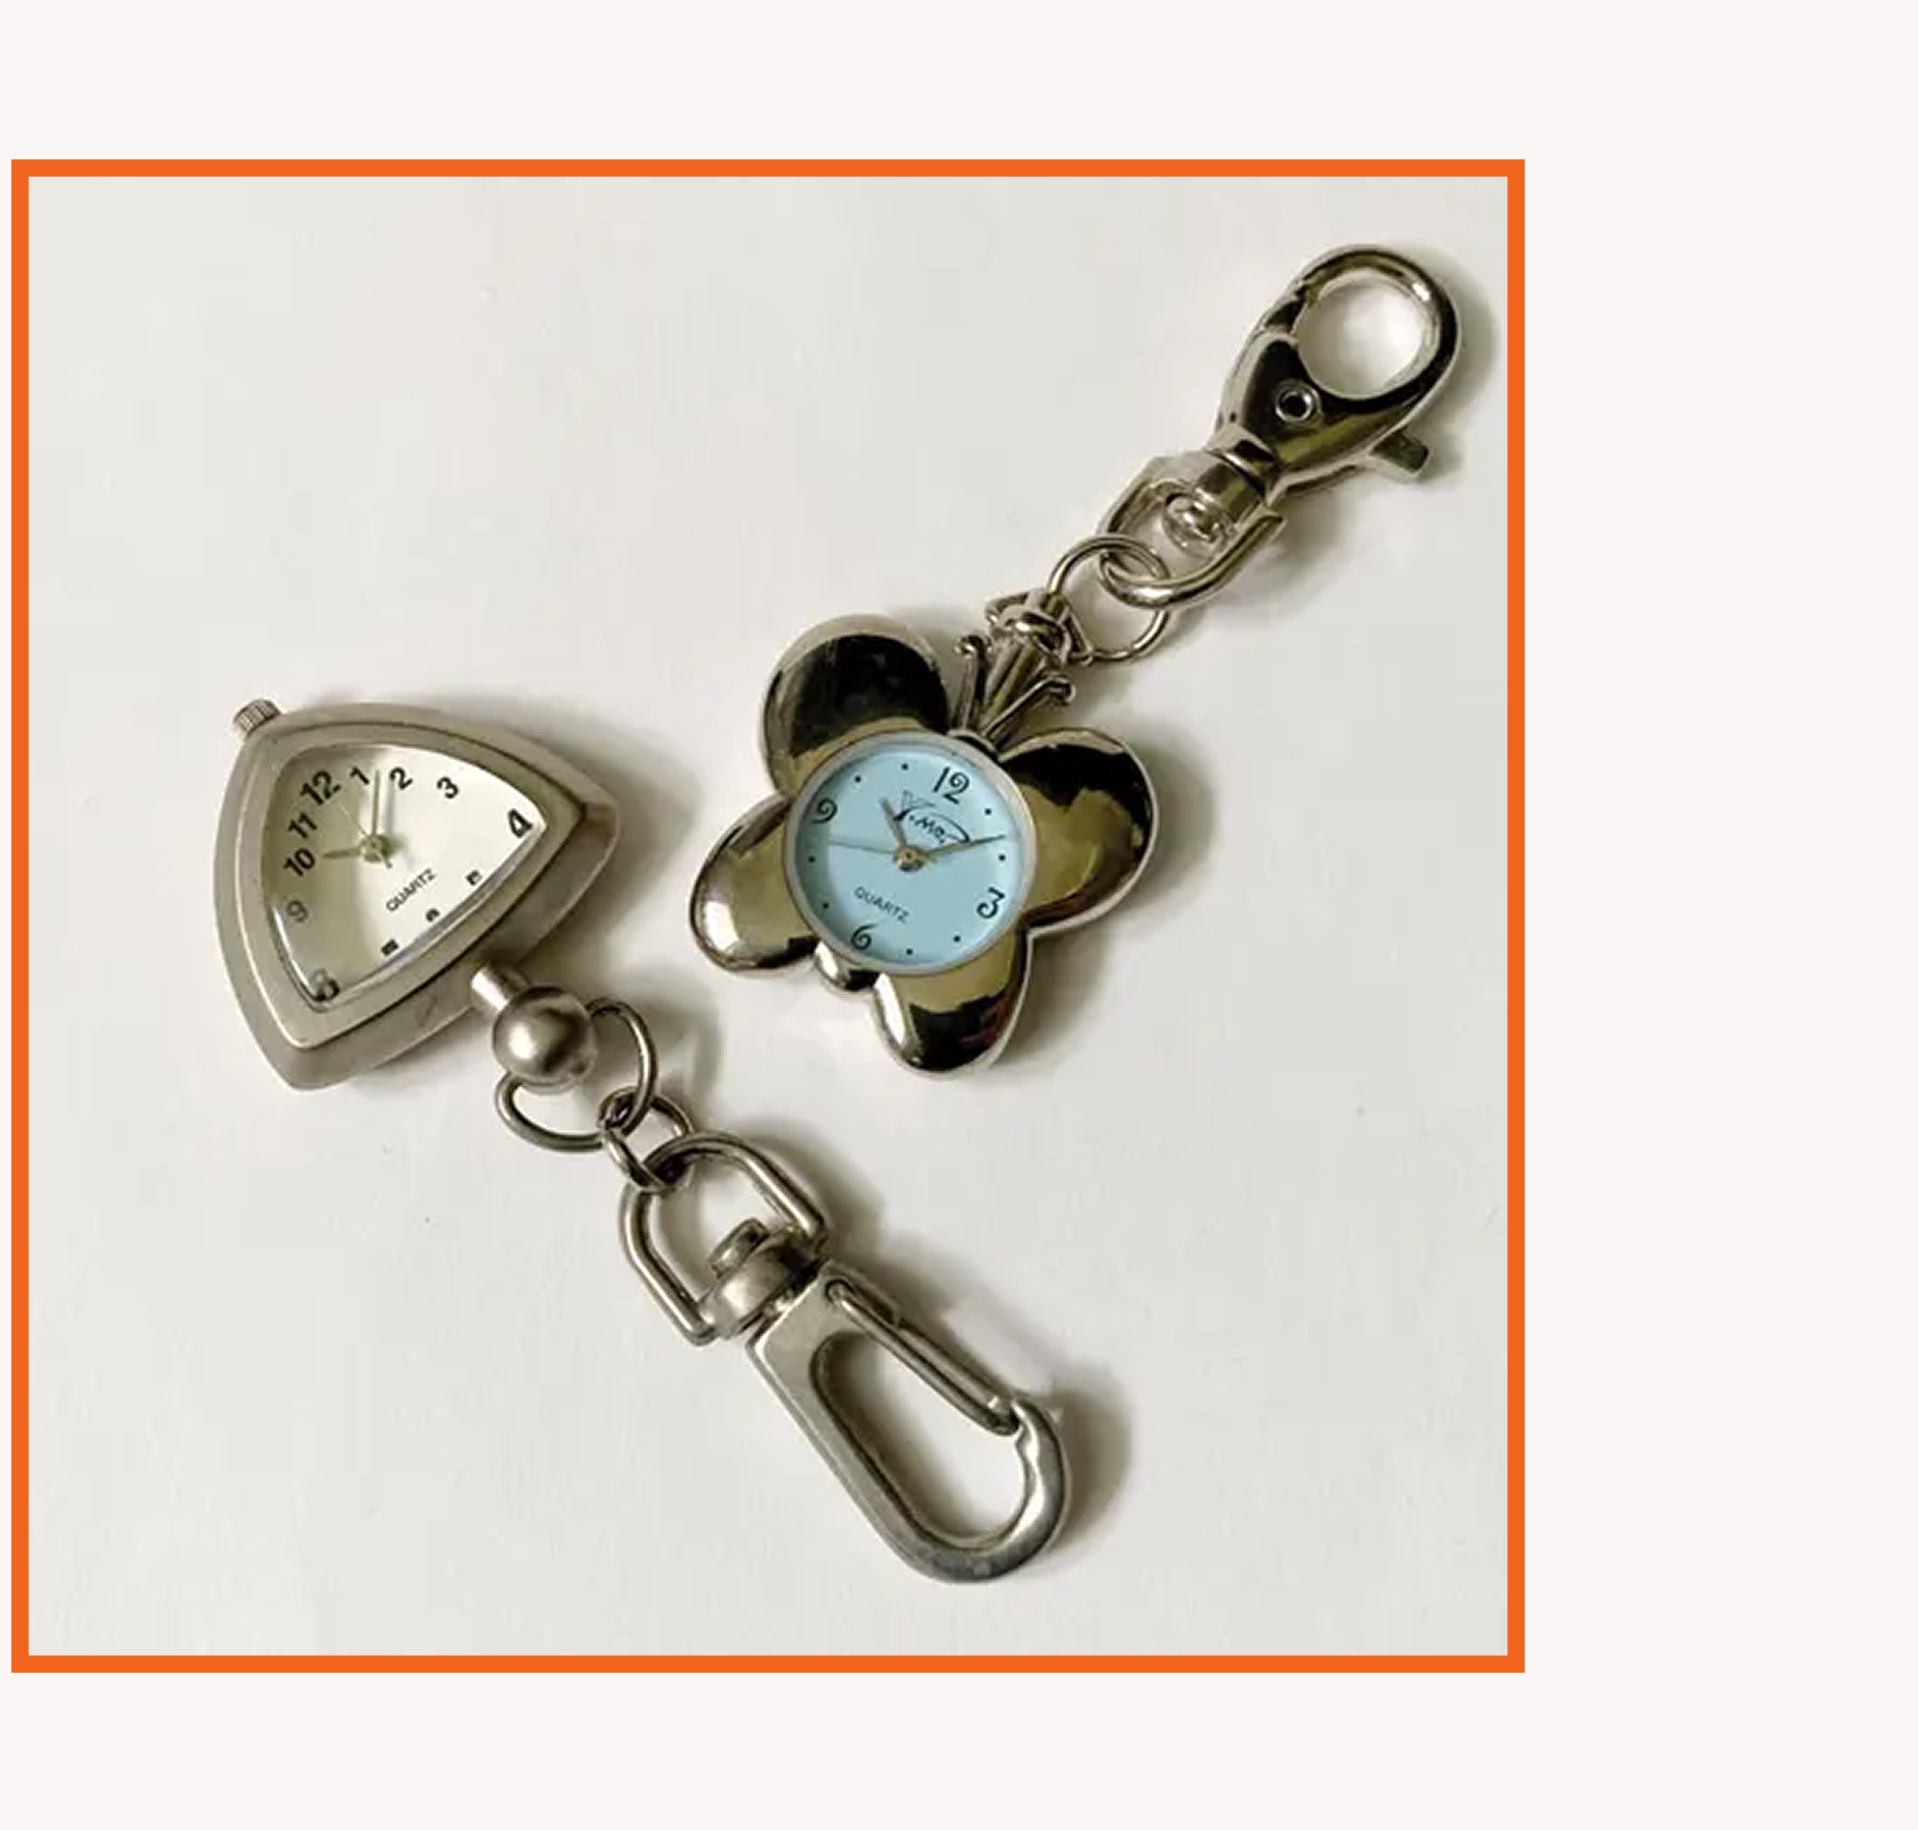 |
Solid year-over-year growth in important seasonal occasions including Mothers Day, Fathers Day, and graduation gifting | Evergreen occasions continued to perform well. Birthdays and weddings both showed double digit growth on a year-over-year basis | Year-over-year growth surged in Toys and games and cultural trends - such as Mahjong and custom card games | Vintage reached its strongest recent pace of growth in 1H26 as buyers increasingly turned to Etsy for distinctive, hard-to-find vintage items across collectible watches, furniture, and home decor |
Our ML and AI curation efforts aim to enable deeper personalization and fresher recommendations, which is an underpinning of success for these initiatives. | |||
*Consumer Edge data versus U.S. pure-play e-commerce peers across top categories, as listed in our 2025 10-K filing.
Q2 2026 Revenue and Take Rate Performance
Revenue was $668 million in the second quarter of 2026, up 6.2% on a continuing operations basis and 9.3%
for the Etsy marketplace alone. Revenue growth accelerated alongside continued GMS strength, with both
Marketplace and Services revenue delivering solid year-over-year growth, increasing 8.4% and 11.2%
respectively for the Etsy marketplace.
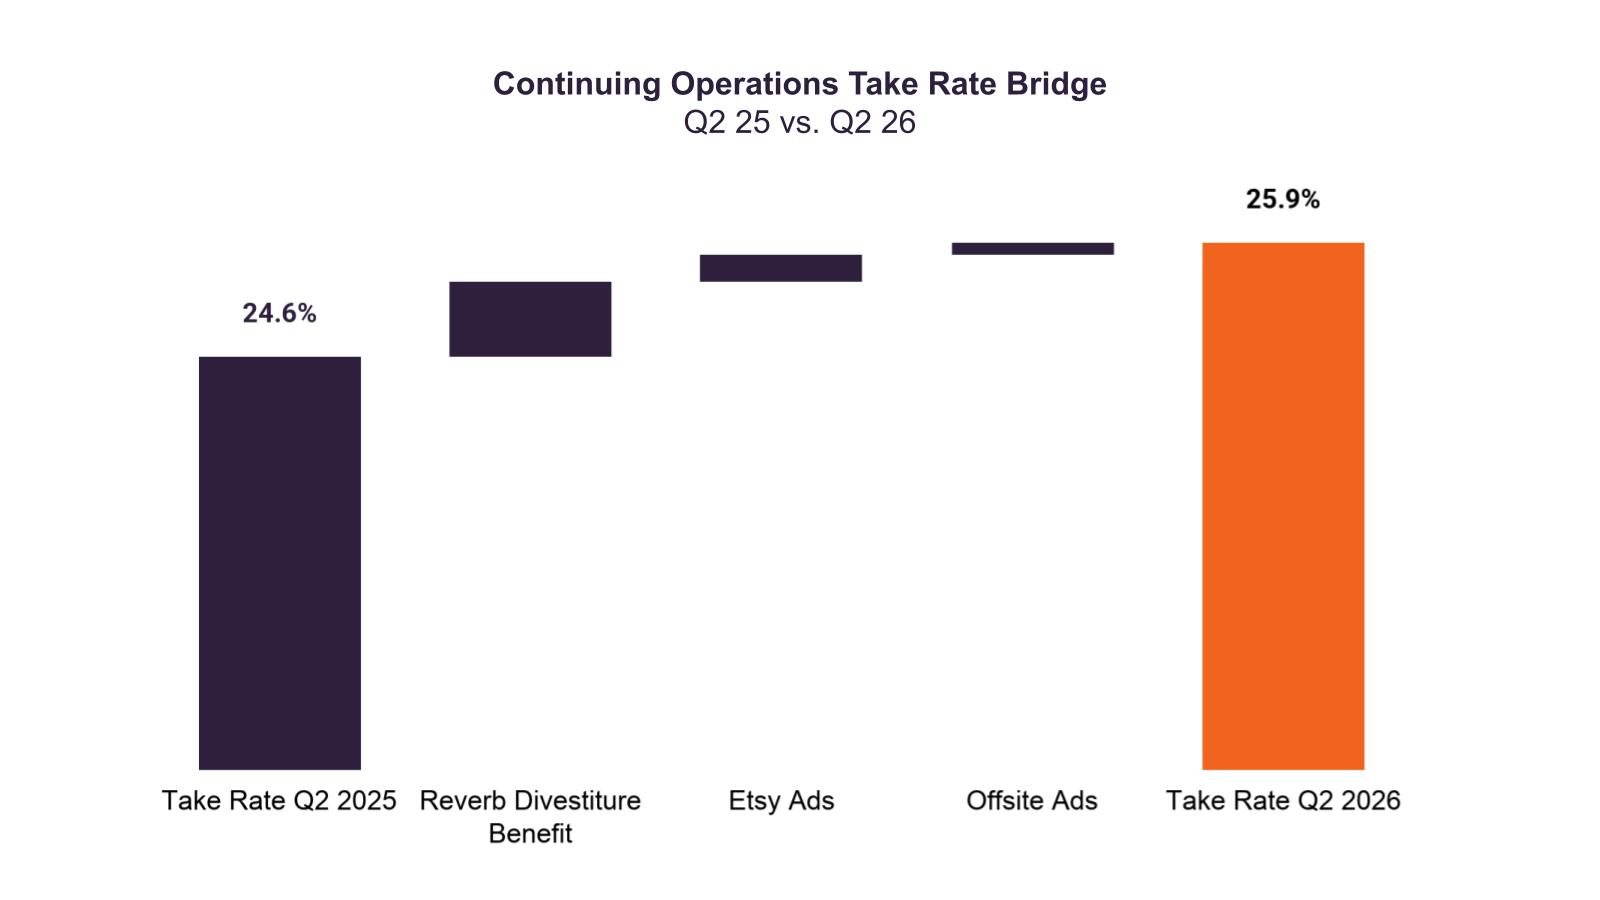
Take rate remained healthy and consistent with our expectations at 25.9% in the second quarter, up 130 bps
year-over-year, including an approximate +80 bps impact from the Reverb divestiture. Etsy marketplace year-
over-year take rate expansion was primarily driven by Etsy Ads, as machine learning-driven improvements
continued to enhance relevance and support more effective seller budget pacing. Offsite Ads also contributed,
benefiting from the shift in paid marketing activity toward higher-monetizing channels.
12
Q2 2026 Operating Expenses
We are presenting operating expenses for continuing operations, which exclude Depop in all periods
presented, and we are showing Reverb’s Q2 2025 contribution in the bar charts below. To help investors
understand the key drivers of performance, our discussion of year-over-year leverage (as a percentage of
revenue) in this section is for the Etsy marketplace only.
We remained disciplined on operating expenses in the second quarter, while investing behind the areas
where we are seeing the clearest evidence of return. As Etsy marketplace GMS growth improved, the
leverage in our model was evident: nearly half of incremental revenue flowed through to Adjusted EBITDA in
the quarter, creating room to fund our top priorities while sustaining healthy profitability.
Marketing was the clearest example of this approach in the second quarter. We increased investment where
returns supported it, scaled back where they did not, and continued to drive efficiency across the portfolio,
gaining leverage year-on-year as a percentage of revenue. Here are some highlights:
•Product listing ad (“PLA”) spend remained relatively stable as a percentage of revenue while
supporting GMS growth, aided by enhanced segmentation techniques to direct more spend toward
higher-performing, higher-quality listings.
•In paid social, we refined our platform mix to scale in areas of strength, such as TikTok.
•In brand marketing, we continued to target a younger demographic, shifting away from linear TV and
focusing on over-the top (“OTT”), social video, and partnerships.
•Lastly, owned push and email channels continued to drive strong GMS growth, efficiently re-engaging
buyers through more personalized touchpoints.
In Product Development, we gained slight year-over-year expense leverage as modestly higher employee
costs were offset by savings in other areas, and we remained deliberate about where we deployed product
and engineering resources. General and Administrative expenses also gained year-over-year leverage, driven
by employee cost leverage from continued headcount discipline, lower professional services spend, and a
one-time reversal of non-income tax expense.
Q2 26 Continuing Operations Operating Expenses
Product Development | Marketing | General & Administrative |
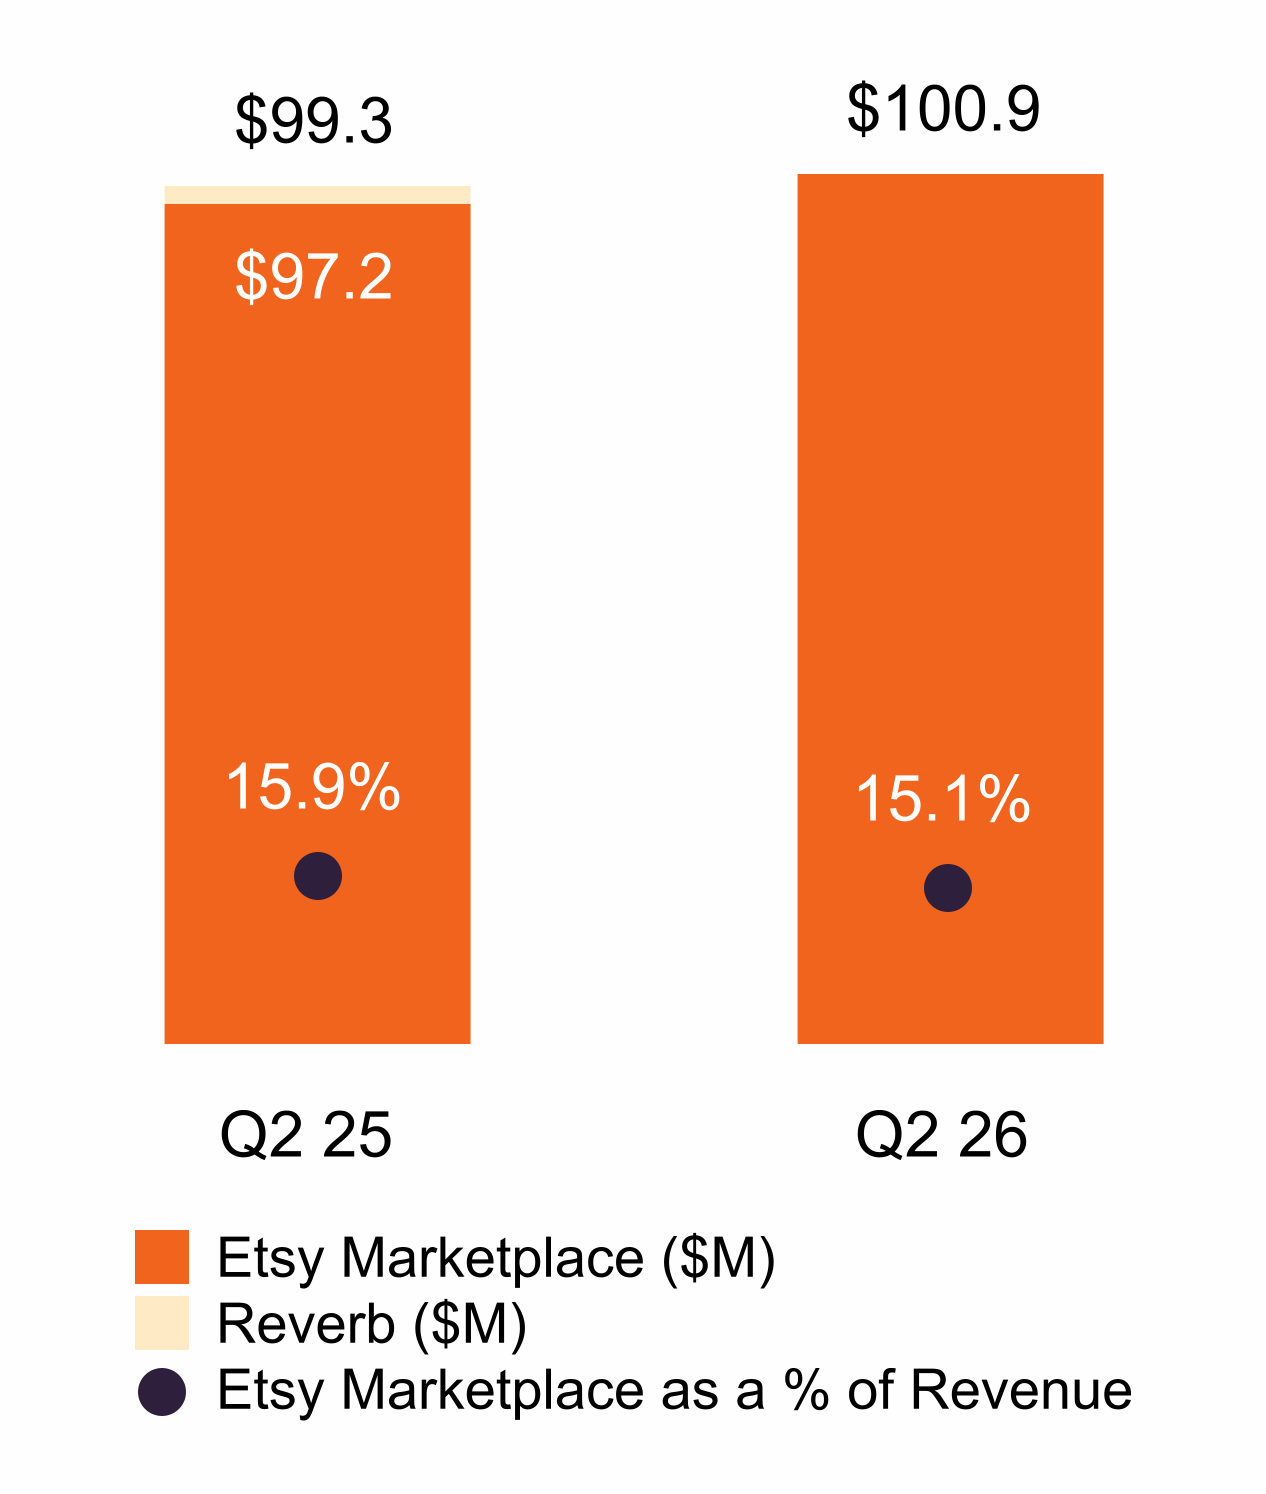
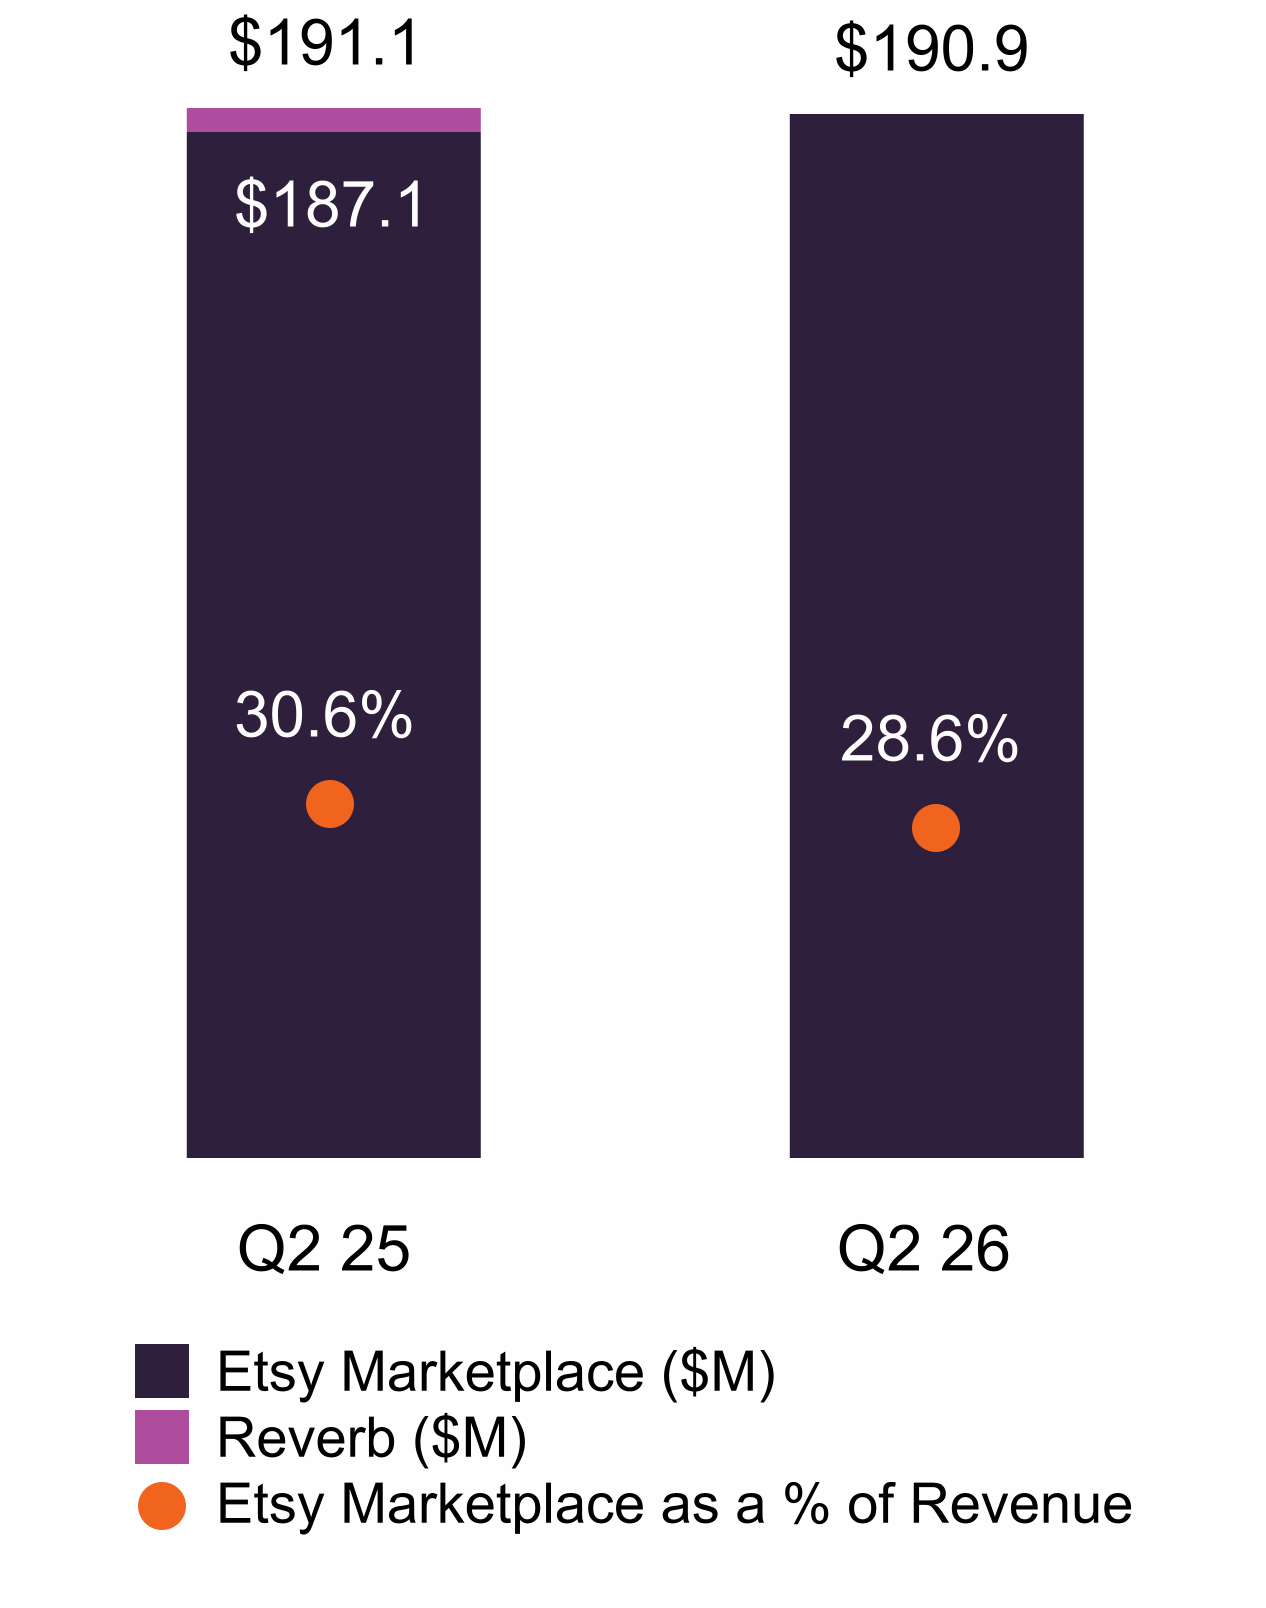
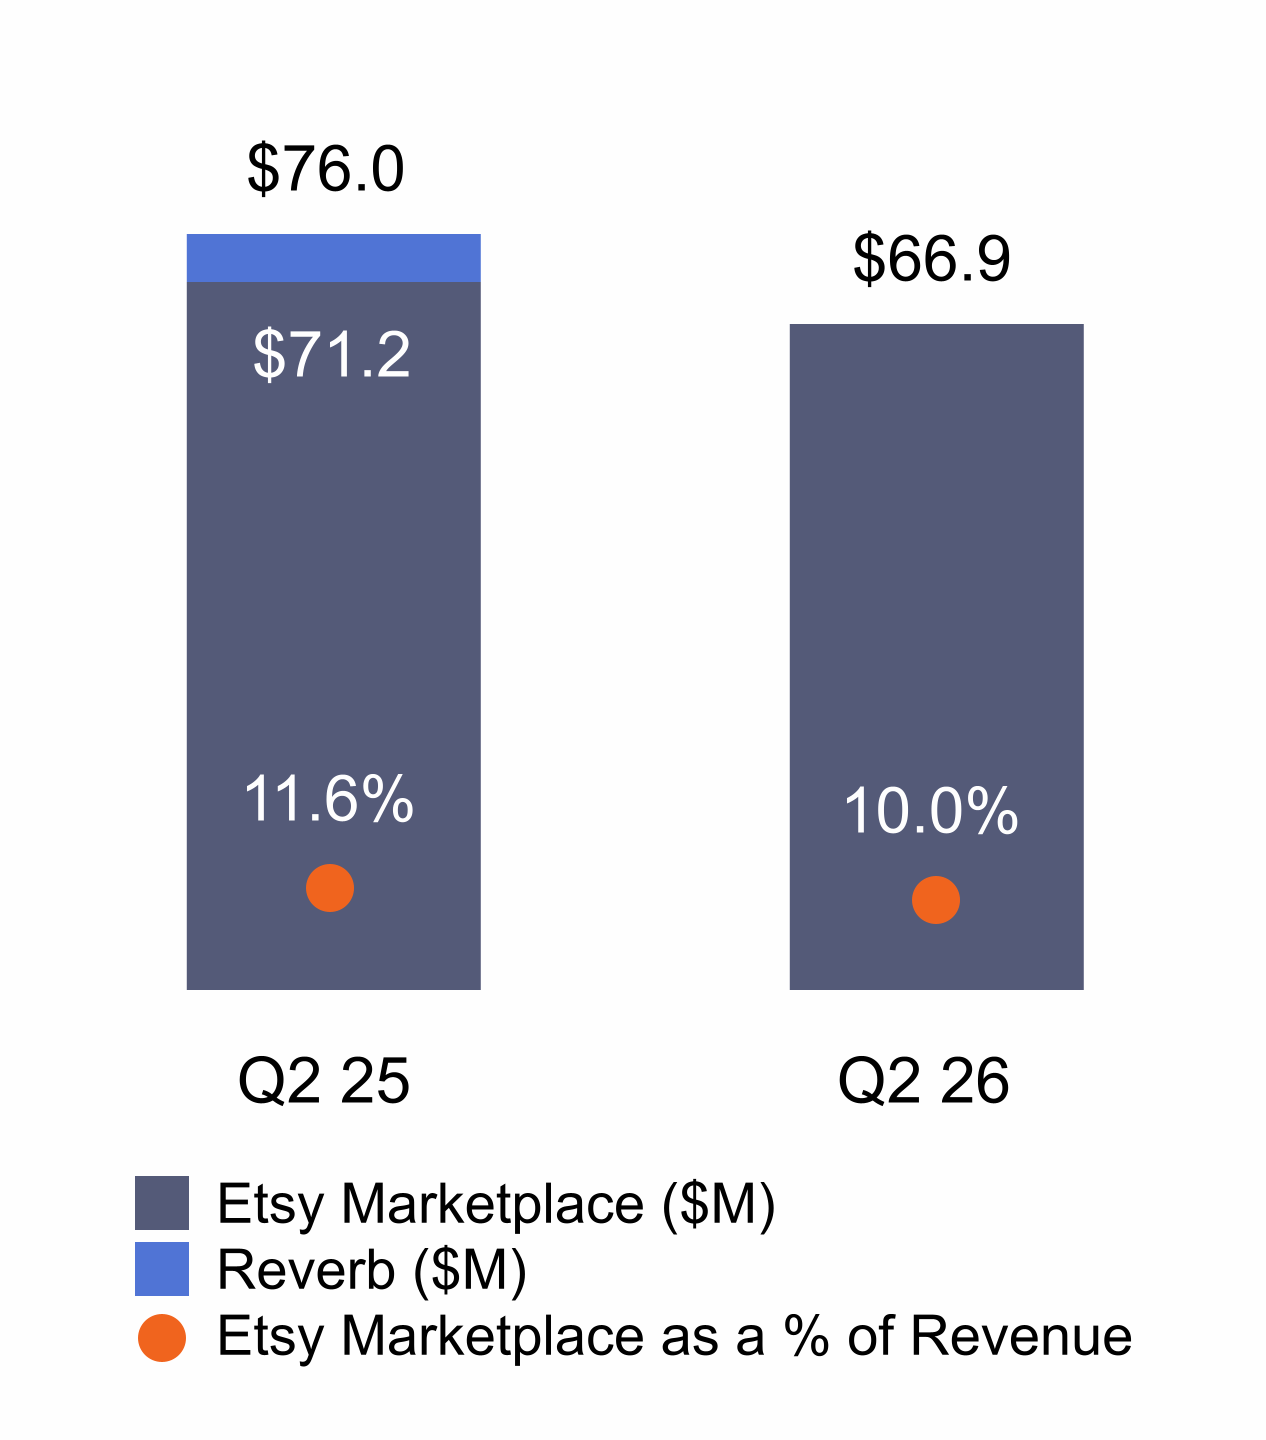
In the bar chart graphic above, Q2 2026 continuing operations results reflect the Etsy marketplace only, while Q2 2025 results include
both Etsy and Reverb.
1 See “Non-GAAP Financial Measures” below for a reconciliation of Net Cash Provided by Operating Activities to Free Cash Flow for Q2 2026 and 2025.
13
Strong Cash Flow Generation enables Increased Share Buybacks; New Board
Authorization for $2 billion in Repurchases
As of June 30, 2026, Etsy held $1.3 billion in cash, cash equivalents and short- and long-term investments.
Net cash provided by operating activities of continuing operations for the six months ended June 30, 2026
was $268.4 million. On a continuing operations basis, we converted 81%1 of our Adjusted EBITDA to free
cash flow during the quarter, approximately one third higher than the rate of conversion realized in the year-
ago quarter.
Etsy repurchased approximately 3.9 million shares of its stock in the second quarter at an aggregate cost of
$250 million, stepping up from recent quarters in reflection of Etsy’s strong liquidity and growing confidence in
our strategic execution. As of June 30, 2026, we had $578.2 million remaining on our current Board-
authorized share repurchase program. On August 3, our Audit Committee, acting pursuant to a delegation of
authority from our Board, authorized a new $2 billion share repurchase program. As previously outlined, the
sale of Depop, which brings approximately $1.4 billion in cash into Etsy in the third quarter, enables us to
further accelerate our stock buyback program.
Restructuring Plan
As referenced above in our CEO Letter, today we announced a restructuring to reduce the size of our
workforce by roughly 220 employees or approximately 12% (the “Restructuring Plan”). Following the
Restructuring Plan, headcount is expected to be approximately 1,600 people. We expect to incur an
estimated $35 million in charges, largely made up of cash expenditures consisting of severance payments,
employee benefits, and related costs. We anticipate that the charges will be incurred, and the execution of the
Restructuring Plan will be substantially complete by the end of the third quarter.
14
Third Quarter 2026 and Updated Full-Year Outlook for
Continuing Operations
With the sale of Depop, which has been classified as discontinued operations beginning in the first quarter of
2026, our outlook pertains to continuing operations only, or the Etsy marketplace.
We currently assume that overall macroeconomic factors remain relatively consistent, and that currency
tailwinds and prior-year comparisons become less favorable as we move through the year.
Q3 26 Outlook | FY 26 Outlook | |
GMS | $2.53B to $2.58B +4-6% Y/Y growth for the Etsy marketplace | We currently expect GMS will grow in the mid-single-digit range for the full year, an increase from prior outlook |
Take Rate | ~26% | Roughly equal to 1H 26 |
Adjusted EBITDA Margin | 28-30% | 29-30%, up from prior outlook of 28-30% |
Our outlook assumes currency exchange rates remain unchanged at current spot levels.
“We expect the restructuring to lower operating costs in the near-term, and have incorporated the expected benefit into our increased full-year adjusted EBITDA margin outlook. We believe that higher GMS and revenue growth – sustained over time – can create far greater absolute cash flow and shareholder value than can margin expansion alone. Accordingly, our objective in the restructuring is not only to extend the expense discipline we’ve demonstrated historically, but also to position ourselves to build the organization necessary to execute our strategy and accelerate growth in the years ahead. Specifically, we intend to deepen our expertise in strategically critical areas across product, engineering, and customer operations, with a particular focus on expanding and strengthening our team’s machine learning skills. We also plan to explore additional R&D investment in new product capabilities, marketing initiatives, customer trust, and international growth to accelerate our learnings in 2026 and inform our plans for 2027. We will be purposeful and disciplined in the investments we make, and remain committed to maintaining the very attractive profit margin profile of our business.” Lanny Baker, Chief Financial Officer |
With respect to our outlook, a reconciliation of Adjusted EBITDA margin guidance to the closest
corresponding GAAP measure is not available without unreasonable efforts on a forward-looking basis due to
the high variability, complexity, and low visibility with respect to the charges excluded from Adjusted EBITDA;
in particular, stock-based compensation expense (income) and related payroll taxes, provision for income
taxes, interest and other non-operating (income) expense, net, foreign exchange (gain) loss, acquisition,
divestiture, and corporate structure-related expenses, and other non-recurring expenses.
Webcast and Conference Call Information
Etsy will host a webcast conference call to discuss these results at 8:30 a.m. Eastern Time tomorrow,
Thursday August 6, which will be live-streamed via our Investor Relations website under the Events section.
A replay of the webcast will be available through the same link following the conference call starting at 12:00
p.m. Eastern Time tomorrow, for at least three months thereafter.
15
Cautionary Statement Regarding Forward-Looking
Statements
This shareholder letter contains or references forward-looking statements within the meaning of the federal
securities laws. Forward-looking statements include statements relating to our financial outlook for the third
quarter and full year of 2026, and the underlying assumptions; the growth potential of our business; our ability
to drive long-term loyalty and fully capitalize on Etsy’s value proposition; our ability to deliver value for our
buyers and sellers and create long-term value for our shareholders; the momentum of our customer-centric
priorities, and our ability to build on our momentum and support the next phase of Etsy's evolution into 2027
and beyond; statements concerning our Restructuring Plan, including the objectives, the amount of the
related charges and cash and non-cash expenditures, the anticipated timeline of such costs, charges,
implementation, and the expected benefits, if any; our ability to attract, deepen, and elevate talent in areas
consistent with our growth priorities; our AI-related initiatives and the impact thereof; the expected impact of
the Depop sale; and the future impact of our strategic investments. Forward-looking statements include all
statements that are not historical facts. In some cases, forward-looking statements can be identified by terms
such as “aim,” “anticipate,” “believe,” “could,” “enable,” “estimate,” “expect,” “goal,” “intend,” “may,” “outlook,”
“plan,” “potential,” “should,” “will,” or similar expressions and derivative forms and/or the negatives of those
words. Forward-looking statements involve substantial risks and uncertainties that may cause actual results to
differ materially from those that we expect. These risks and uncertainties include but are not limited to: (1) the
preliminary nature of our estimates of the charges and cash expenditures to be incurred in connection with
the Restructuring Plan, which are subject to change as we make decisions and refine these estimates over
time; (2) timing delays in implementing the Restructuring Plan due to legal requirements and other factors; (3)
potential disruption to our business and operations as we implement the Restructuring Plan; (4)
macroeconomic, geopolitical, and other events outside of our control; (5) the level of demand for our services
or products sold in our marketplace; (6) the importance to our success of the trustworthiness and safety of our
marketplace and our ability to attract and retain active and engaged communities of buyers and sellers; (7)
any real or perceived inaccuracies in our operational metrics; (8) if we or our third-party providers are unable
to protect against technology vulnerabilities, service interruptions, security breaches, or other cyber incidents;
(9) our dependence on continued and unimpeded access to third-party services, platforms, and infrastructure;
(10) operational and compliance risks related to our payments systems; (11) the global scope of our business;
(12) our ability to compete effectively; (13) our ability to enhance our current offerings and develop new
offerings to respond to the changing needs of sellers and buyers; (14) risks related to our environmental,
social, and governance activities and disclosures; (15) barriers to international trade and our efforts to grow
our marketplace globally; (16) acquisitions, dispositions, or strategic partnerships that may prove
unsuccessful or divert management attention; (17) our ability to deal effectively with fraud or other illegal
activity increasingly amplified by advances in AI; and (18) litigation and evolving global legal and regulatory
requirements, including privacy and data protection laws, tax laws, product liability laws, laws regulating
speech and platform moderation, antitrust laws, and intellectual property and counterfeiting regulations. These
and other risks and uncertainties are more fully described in our filings with the Securities and Exchange
Commission, including in the section entitled “Risk Factors” in our most recent periodic report, and in
subsequent reports that we file with the Securities and Exchange Commission. Moreover, we operate in a
very competitive and rapidly changing environment. New risks emerge from time to time. It is not possible for
our management to predict all risks, nor can we assess the impact of all factors on our business or the extent
to which any factor, or combination of factors, may cause actual results to differ materially from those
contained in any forward-looking statements we may make. In light of these risks, uncertainties, and
assumptions, we cannot guarantee future results, levels of activity, performance, achievements, or events and
circumstances reflected in the forward-looking statements will occur. Forward-looking statements represent
our beliefs and assumptions only as of the date of this shareholder letter. We disclaim any obligation to
update forward-looking statements.
16
Second Quarter 2026 Financial Summary
(in thousands, except percentages; unaudited)
Our key operating and financial metrics for continuing operations (which excludes Depop’s results, as Depop
is presented as discontinued operations) are presented in the table below. Due to the sale of Reverb on June
2, 2025, continuing operations for the three and six months ended June 30, 2025 includes Etsy marketplace
and Reverb marketplace through the date of sale, but the three and six months ended June 30, 2026 reflects
the Etsy marketplace only. This makes year-over-year continuing operations results not directly comparable.
To provide investors with a meaningful basis for comparing our results year-over-year, we have presented
Etsy marketplace results for the three and six months ended June 30, 2025 below. Our calculation of trailing
twelve months free cash flow includes activity for combined continuing and discontinued operations. See
“Non-GAAP Financial Measures” for a reconciliation of our non-GAAP financial measures (Etsy marketplace
financial metrics, Adjusted EBITDA, Adjusted EBITDA margin, and free cash flow) to the most directly
comparable GAAP financial measures.
Our key operating and financial metrics are (in thousands, except percentages):
Three Months Ended June 30, | % Growth (Decline) Y/Y for Continuing Operations | % Growth Y/Y for the Etsy Marketplace (Non-GAAP) (1) | |||
2026 | 2025 | ||||
Continuing Operations | Continuing Operations | Etsy Marketplace (Non-GAAP) | |||
GMS (2) | $2,582,892 | $2,556,644 | $2,403,655 | 1.0% | 7.5% |
Revenue | $668,313 | $629,131 | $611,542 | 6.2% | 9.3% |
Revenue take rate (3) | 25.9% | 24.6% | 25.4% | 130 bps | 50 bps |
Marketplace revenue | $456,074 | $435,026 | $420,717 | 4.8% | 8.4% |
Services revenue | $212,239 | $194,105 | $190,825 | 9.3% | 11.2% |
Gross profit | $484,045 | $460,508 | $450,946 | 5.1% | 7.3% |
Operating expenses | $358,777 | $366,408 | $355,542 | (2.1)% | 0.9% |
Net income | $114,339 | $45,638 | $47,306 | 150.5% | 141.7% |
Net income margin | 17.1% | 7.3% | 7.7% | 980 bps | 940 bps |
Adjusted EBITDA (Non-GAAP) | $195,358 | $170,299 | $167,592 | 14.7% | 16.6% |
Adjusted EBITDA margin (Non-GAAP) | 29.2% | 27.1% | 27.4% | 210 bps | 180 bps |
Six Months Ended June 30, | % (Decline) Growth Y/Y for Continuing Operations | % Growth Y/Y for the Etsy Marketplace (Non-GAAP) (1) | |||
2026 | 2025 | ||||
Continuing Operations | Continuing Operations | Etsy Marketplace (Non-GAAP) | |||
GMS (2) | $5,043,087 | $5,116,465 | $4,735,117 | (1.4)% | 6.5% |
Revenue | $1,299,590 | $1,241,335 | $1,198,099 | 4.7% | 8.5% |
Revenue take rate (3) | 25.8% | 24.3% | 25.3% | 150 bps | 50 bps |
Marketplace revenue | $888,847 | $863,262 | $827,682 | 3.0% | 7.4% |
Services revenue | $410,743 | $378,073 | $370,417 | 8.6% | 10.9% |
Gross profit | $939,643 | $904,911 | $883,114 | 3.8% | 6.4% |
Operating expenses | $694,529 | $814,684 | $684,557 | (14.7)% | 1.5% |
Net income | $219,001 | $10,551 | $118,797 | 1,975.6% | 84.3% |
Net income margin | 16.9% | 0.8% | 9.9% | 1,610 bps | 700 bps |
Adjusted EBITDA (Non-GAAP) | $380,069 | $343,820 | $338,241 | 10.5% | 12.4% |
Adjusted EBITDA margin (Non-GAAP) | 29.2% | 27.7% | 28.2% | 150 bps | 100 bps |
17
(1)% growth Y/Y for the Etsy marketplace is the change in continuing operations for the three and six months ended June 30, 2026,
which represents activity for the Etsy marketplace only, compared to the Etsy marketplace excluding Reverb for the three and six
months ended June 30, 2025, as Reverb was sold in the second quarter of 2025.
(2)Excluded from the tables above is gross merchandise sales (“GMS”) for Depop, which was $455.7 million and $249.6 million for the
three months ended June 30, 2026 and 2025, respectively, and $804.6 million and $483.1 million for the six months ended June 30,
2026 and 2025, respectively.
(3)Revenue take rate is revenue divided by GMS.
As of June 30, | % Decline Y/Y | ||
2026 | 2025 | ||
Continuing and Discontinued Operations | Continuing and Discontinued Operations | ||
Net cash provided by operating activities - trailing twelve months | $657,391 | $689,695 | (4.7)% |
Free cash flow - trailing twelve months (Non-GAAP) | $610,141 | $634,622 | (3.9)% |
18
Etsy, Inc.
Condensed Consolidated Balance Sheets
(in thousands; unaudited)
As of June 30, 2026 | As of December 31, 2025 | |
Assets | ||
Current assets: | ||
Cash and cash equivalents | $901,281 | $1,355,428 |
Short-term investments | 221,007 | 224,088 |
Accounts receivable, net | 8,664 | 8,690 |
Prepaid and other current assets | 100,063 | 113,953 |
Funds receivable and seller accounts | 193,840 | 205,002 |
Current assets of discontinued operations | 450,419 | 53,822 |
Total current assets | 1,875,274 | 1,960,983 |
Restricted cash | 7,655 | 8,524 |
Property and equipment, net | 200,272 | 205,552 |
Goodwill | 37,408 | 38,067 |
Intangible assets, net | 12,013 | 14,511 |
Deferred tax assets | 104,115 | 119,051 |
Long-term investments | 160,665 | 134,376 |
Other assets | 41,765 | 38,964 |
Noncurrent assets of discontinued operations | — | 307,226 |
Total assets | $2,439,167 | $2,827,254 |
Liabilities and Stockholders' Deficit | ||
Current liabilities: | ||
Accounts payable | $20,449 | $27,732 |
Accrued expenses | 247,805 | 342,200 |
Short-term debt, net | 649,594 | 649,008 |
Funds payable and amounts due to sellers | 193,840 | 205,002 |
Deferred revenue | 32,478 | 27,049 |
Other current liabilities | 49,940 | 60,354 |
Current liabilities of discontinued operations | 76,205 | 52,274 |
Total current liabilities | 1,270,311 | 1,363,619 |
Finance lease obligations—net of current portion | 90,302 | 93,482 |
Deferred tax liabilities | 11,031 | 8,808 |
Long-term debt, net | 2,335,911 | 2,333,230 |
Other liabilities | 126,690 | 125,103 |
Noncurrent liabilities of discontinued operations | — | 1,107 |
Total liabilities | 3,834,245 | 3,925,349 |
Total stockholders’ deficit | (1,395,078) | (1,098,095) |
Total liabilities and stockholders’ deficit | $2,439,167 | $2,827,254 |
2 During the period leading up to the Depop close date we continued to invest in the growth of the business, the costs of which were recovered through
purchase price adjustments on the closing date. These investments contributed to Depop’s Q2 26 76% year-over-year revenue growth, which is disclosed in
our Quarterly Report on Form 10-Q for the period ended June 30, 2026.
19
Etsy, Inc.
Condensed Consolidated Statements of Operations
(in thousands, except per share amounts; unaudited)
Three Months Ended June 30, | Six Months Ended June 30, | |||
2026 | 2025 | 2026 | 2025 | |
Revenue | $668,313 | $629,131 | $1,299,590 | $1,241,335 |
Cost of revenue | 184,268 | 168,623 | 359,947 | 336,424 |
Gross profit | 484,045 | 460,508 | 939,643 | 904,911 |
Operating expenses: | ||||
Marketing | 190,928 | 191,053 | 365,167 | 362,910 |
Product development | 100,921 | 99,326 | 199,973 | 200,136 |
General and administrative | 66,928 | 76,029 | 129,389 | 149,935 |
Asset impairment charge | — | — | — | 101,703 |
Total operating expenses | 358,777 | 366,408 | 694,529 | 814,684 |
Income from operations | 125,268 | 94,100 | 245,114 | 90,227 |
Other income (expense), net | 9,703 | (25,195) | 19,117 | (35,909) |
Income from continuing operations before income taxes | 134,971 | 68,905 | 264,231 | 54,318 |
Provision for income taxes from continuing operations | (20,632) | (23,267) | (45,230) | (43,767) |
Net income from continuing operations | 114,339 | 45,638 | 219,001 | 10,551 |
Discontinued operations: | ||||
Loss from discontinued operations before income taxes | (160,769) | (17,759) | (196,578) | (36,491) |
(Provision) benefit for income taxes from discontinued operations | (220) | 961 | 607 | 2,684 |
Net loss from discontinued operations2 | (160,989) | (16,798) | (195,971) | (33,807) |
Net (loss) income | $(46,650) | $28,840 | $23,030 | $(23,256) |
Basic net income from continuing operations per share attributable to common stockholders | $1.21 | $0.44 | $2.29 | $0.10 |
Total basic net (loss) income per share attributable to common stockholders | $(0.49) | $0.28 | $0.24 | $(0.22) |
Diluted net income from continuing operations per share attributable to common stockholders | $0.98 | $0.39 | $1.87 | $0.10 |
Total diluted net (loss) income per share attributable to common stockholders | $(0.36) | $0.25 | $0.25 | $(0.22) |
Weighted-average common shares outstanding: | ||||
Basic | 94,358 | 103,212 | 95,618 | 105,246 |
Diluted | 119,961 | 121,514 | 120,908 | 107,393 |
20
Condensed Consolidated Statements of Cash Flows
(in thousands; unaudited)
Six Months Ended June 30, | ||
2026 | 2025 | |
Cash flows from operating activities | ||
Net income (loss) | $23,030 | $(23,256) |
Net loss from discontinued operations | (195,971) | (33,807) |
Net income from continuing operations | 219,001 | 10,551 |
Adjustments to reconcile net income from continuing operations to net cash provided by operating activities: | ||
Stock-based compensation expense | 104,147 | 109,099 |
Depreciation and amortization expense | 30,544 | 31,787 |
Provision for expected credit losses | 2,650 | 4,908 |
Deferred provision (benefit) for income taxes | 18,447 | (1,018) |
Asset impairment charge | — | 101,703 |
Other non-cash (income) expense, net | (8,604) | 33,184 |
Changes in operating assets and liabilities (net of impact of sale of business) | (97,744) | (121,402) |
Net cash provided by operating activities of continuing operations | 268,441 | 168,812 |
Net cash used in operating activities of discontinued operations | (147,144) | (11,492) |
Net cash provided by operating activities | 121,297 | 157,320 |
Cash flows from investing activities | ||
Purchases of property and equipment | (2,718) | (10,101) |
Website and app development | (14,915) | (18,318) |
Purchases of investments | (179,142) | (197,570) |
Sales and maturities of investments | 156,256 | 184,207 |
Proceeds from sale of business, net of cash sold | — | 100,485 |
Net cash (used in) provided by investing activities of continuing operations | (40,519) | 58,703 |
Net cash used in investing activities of discontinued operations | (6,529) | (3,157) |
Net cash (used in) provided by investing activities | (47,048) | 55,546 |
Cash flows from financing activities | ||
Payment of tax obligations on vested equity awards | (40,687) | (28,959) |
Repurchase of stock | (394,925) | (523,852) |
Proceeds from exercise of stock options | 10,249 | 5,654 |
Proceeds from issuance of convertible senior notes | — | 700,000 |
Payment of debt issuance costs | — | (10,500) |
Payments on finance lease obligations | (3,192) | (3,045) |
Other financing, net | (753) | (17,226) |
Net cash (used in) provided by financing activities | (429,308) | 122,072 |
Effect of exchange rate changes on cash | (10,063) | 37,241 |
Net (decrease) increase in cash and cash equivalents | (365,122) | 372,179 |
Cash, cash equivalents, and restricted cash at beginning of period | 1,404,360 | 811,178 |
Cash, cash equivalents, and restricted cash at end of period | $1,039,238 | $1,183,357 |
21
Currency-Neutral GMS
We calculate currency-neutral GMS by translating current period GMS for goods sold that were listed in non-
U.S. dollar currencies into U.S. dollars using prior year foreign currency exchange rates.
As reported and currency-neutral GMS growth (decline) for the periods presented below are as follows:
2026 | 2025 | |||||
As Reported | Currency- Neutral | FX Impact | As Reported | Currency- Neutral | FX Impact | |
Three months ended June 30, | ||||||
GMS - Continuing operations | 1.0% | 0.8% | 0.2% | (7.5)% | (8.5)% | 1.0% |
GMS - Etsy marketplace | 7.5% | 7.2% | 0.3% | (5.4)% | (6.3)% | 0.9% |
Six months ended June 30, | ||||||
GMS - Continuing operations | (1.4)% | (2.4)% | 1.0% | (8.2)% | (8.3)% | 0.1% |
GMS - Etsy marketplace | 6.5% | 5.4% | 1.1% | (7.1)% | (7.2)% | 0.1% |
22
Non-GAAP Financial Measures
Other Key Financial Metrics
(in thousands, except percentages; unaudited)
Given that the sale of Depop was pending as of June 30, 2026, Etsy results are presented on a continuing
operations basis, while Depop results are reported as discontinued operations across all periods presented.
Due to the sale of Reverb on June 2, 2025, continuing operations for the three and six months ended June
30, 2025 includes Etsy marketplace and Reverb marketplace through the date of sale, but the three and six
months ended June 30, 2026 reflects the Etsy marketplace only. This makes year-over-year continuing
operations results not directly comparable.
To provide investors with a meaningful basis for comparing our ongoing operating results year-over-year, we
have presented certain Etsy marketplace financial measures for the three and six months ended June 30,
2025 in this Shareholder Letter. These measures include the following non-GAAP financial measures for the
three and six months ended June 30, 2025 where we exclude the impact of Reverb: (1) Revenue and
Revenue take rate, (2) Marketplace revenue, (3) Services revenue, (4) Gross profit, (5) Marketing expense,
(6) Product development expense, (7) General and administrative expense, (8) Operating expenses, (9) Net
income (loss) and Net income (loss) margin, and (10) Adjusted EBITDA and Adjusted EBITDA margin.
Management believes that presenting these Etsy marketplace non-GAAP financial measures is useful to
investors because they:
•provide a clearer, normalized baseline to evaluate the organic growth, financial performance, and
underlying trends of our remaining Etsy marketplace business;
•facilitate more direct year-over-year comparisons of our continuing operations by removing the impact
of the divested Reverb marketplace; and
•align with how management evaluates the performance of the business, allocates resources, and sets
internal operational targets moving forward.
A reconciliation of these non-GAAP measures to the most directly comparable GAAP measures is provided in
the following tables:
Three Months Ended June 30, 2025 | Six Months Ended June 30, 2025 | |||||
Continuing Operations (As Reported) | Less: Reverb Marketplace | Etsy Marketplace (Non-GAAP) | Continuing Operations (As Reported) | Less: Reverb Marketplace | Etsy Marketplace (Non-GAAP) | |
Revenue | $629,131 | $17,589 | $611,542 | $1,241,335 | $43,236 | $1,198,099 |
Revenue take rate | 24.6% | 11.5% | 25.4% | 24.3% | 11.3% | 25.3% |
Marketplace revenue | $435,026 | $14,309 | $420,717 | $863,262 | $35,580 | $827,682 |
Services revenue | $194,105 | $3,280 | $190,825 | $378,073 | $7,656 | $370,417 |
Gross profit | $460,508 | $9,562 | $450,946 | $904,911 | $21,797 | $883,114 |
Marketing expense | $191,053 | $3,904 | $187,149 | $362,910 | $11,380 | $351,530 |
Product development expense | $99,326 | $2,105 | $97,221 | $200,136 | $7,271 | $192,865 |
General and administrative expense | $76,029 | $4,857 | $71,172 | $149,935 | $9,773 | $140,162 |
Operating expenses | $366,408 | $10,866 | $355,542 | $814,684 | $130,127 | $684,557 |
Net income (loss) | $45,638 | $(1,668) | $47,306 | $10,551 | $(108,246) | $118,797 |
Net income (loss) margin | 7.3% | (9.5)% | 7.7% | 0.8% | (250.4)% | 9.9% |
23
Reconciliation of Net Income (Loss) to Adjusted EBITDA and the
Calculation of Adjusted EBITDA Margin
(in thousands, except percentages; unaudited)
Adjusted EBITDA represents our net income (loss) adjusted to exclude: stock-based compensation expense
(income) and related payroll taxes; depreciation and amortization expense; provision for income taxes;
interest and other non-operating (income) expense, net; foreign exchange (gain) loss; acquisition, divestiture,
and corporate structure-related expenses; asset impairment charge; loss on sale of business; restructuring
and other exit income; and retroactive non-income tax income. The following tables reflect the reconciliation of
net income (loss) to Adjusted EBITDA as well as the calculation of Adjusted EBITDA margin for continuing
operations, the Etsy marketplace, and the Reverb marketplace:
Three Months Ended June 30, | ||||
2026 | 2025 | |||
Continuing Operations | Continuing Operations (As Reported) | Less: Reverb Marketplace | Etsy Marketplace (Non-GAAP) | |
Net income (loss) | $114,339 | $45,638 | $(1,668) | $47,306 |
Excluding: | ||||
Stock-based compensation expense (income) and related payroll taxes (1) | 54,825 | 55,382 | (1,048) | 56,430 |
Depreciation and amortization expense | 15,229 | 14,598 | 966 | 13,632 |
Provision for income taxes | 20,632 | 23,267 | 552 | 22,715 |
Interest and other non-operating (income) expense, net | (5,885) | (4,939) | 160 | (5,099) |
Foreign exchange (gain) loss | (3,818) | 25,356 | (348) | 25,704 |
Acquisition, divestiture, and corporate structure-related expenses | 36 | 5,903 | 4,093 | 1,810 |
Loss on sale of business | — | 5,097 | — | 5,097 |
Restructuring and other exit income | — | (3) | — | (3) |
Adjusted EBITDA | $195,358 | $170,299 | $2,707 | $167,592 |
Divided by: | ||||
Revenue | $668,313 | $629,131 | $17,589 | $611,542 |
Adjusted EBITDA margin | 29.2% | 27.1% | 15.4% | 27.4% |
24
Six Months Ended June 30, | ||||
2026 | 2025 | |||
Continuing Operations | Continuing Operations (As Reported) | Less: Reverb Marketplace | Etsy Marketplace (Non-GAAP) | |
Net income (loss) | $219,001 | $10,551 | $(108,246) | $118,797 |
Excluding: | ||||
Stock-based compensation expense and related payroll taxes (1) | 110,362 | 113,021 | 3,035 | 109,986 |
Depreciation and amortization expense | 30,544 | 31,787 | 5,078 | 26,709 |
Provision for income taxes | 45,230 | 43,767 | 109 | 43,658 |
Interest and other non-operating (income) expense, net | (12,841) | (9,841) | 380 | (10,221) |
Foreign exchange (gain) loss | (6,266) | 40,972 | (573) | 41,545 |
Acquisition, divestiture, and corporate structure-related expenses | 75 | 7,166 | 4,093 | 3,073 |
Asset impairment charge | — | 101,703 | 101,703 | — |
Loss on sale of business | — | 5,097 | — | 5,097 |
Restructuring and other exit income | — | (403) | — | (403) |
Retroactive non-income tax income | (6,036) | — | — | — |
Adjusted EBITDA | $380,069 | $343,820 | $5,579 | $338,241 |
Divided by: | ||||
Revenue | $1,299,590 | $1,241,335 | $43,236 | $1,198,099 |
Adjusted EBITDA margin | 29.2% | 27.7% | 12.9% | 28.2% |
(1)Stock-based compensation expense included in continuing operations in the Condensed Consolidated Statements of Operations for
the periods presented below is as follows:
Three Months Ended June 30, | Six Months Ended June 30, | |||
2026 | 2025 | 2026 | 2025 | |
Cost of revenue | $4,730 | $6,775 | $10,562 | $13,661 |
Marketing | 3,698 | 4,500 | 7,470 | 4,564 |
Product development | 26,132 | 28,239 | 53,670 | 60,225 |
General and administrative | 16,624 | 13,407 | 32,445 | 30,649 |
Stock-based compensation expense | $51,184 | $52,921 | $104,147 | $109,099 |
25
Reconciliation of Net Cash Provided by Operating Activities to Free Cash
Flow
(in thousands; unaudited)
Free cash flow represents our net cash provided by operating activities, reduced by purchases of property
and equipment and website and app development that are included in cash flows from investing activities.
The following table reflects the reconciliation of operating activities to free cash flow for combined continuing
and discontinued operations on a trailing twelve month basis (in thousands):
As of June 30, | ||
2026 | 2025 | |
Continuing and Discontinued Operations | Continuing and Discontinued Operations | |
Net cash provided by operating activities | $657,391 | $689,695 |
Purchases of property and equipment | (8,111) | (18,412) |
Website and app development | (39,139) | (36,661) |
Free cash flow | $610,141 | $634,622 |
The following table reflects the reconciliation of operating activities to free cash flow for continuing operations
(in thousands):
Three Months Ended June 30, | ||
2026 | 2025 | |
Net cash provided by operating activities | $165,905 | $118,996 |
Purchases of property and equipment | (1,234) | (6,853) |
Website and app development | (6,537) | (9,368) |
Free cash flow | $158,134 | $102,775 |