 | earnings release |
Introduction
São Paulo, August 5, 2026 – Agi Inc. (“Agi”), a leading technology-powered provider of specialized financial services in Brazil, invites the investor community to its 2026 first half and second quarter earnings release. Agi listed at the New York Stock Exchange on February 11, 2026, under the ticker ‘AGBK’, after the Initial Public Offering. Agi Inc. is the holding company of Banco Agibank S.A. (“Agibank”) and its subsidiaries.
Letter from the Founder
To Our Stakeholders,
We are pleased to present our second-quarter results, which reflect disciplined execution and our unwavering commitment to long-term value creation.
Our performance and strategic decisions continue to be guided by three long-term principles: living for our customers by prioritizing client value, winning with technology by continuously enhancing our capabilities, and fostering an entrepreneurial culture that supports innovation and growth while maintaining disciplined focus on long-term returns. These principles shape how we allocate capital, respond to market changes and build Agi for the long term.
In June, our active customer base reached 7.6 million, after attracting more than 600 thousand new customers during the quarter, with both metrics reaching all-time highs for the Company. During the quarter, we also advanced one position to be the sixth-largest payer of INSS benefits in Brazil, surpassing the incumbent bank who previously held it, further strengthening our strategy within the country's social security ecosystem, and placing Agi among the leading institutions in the INSS benefits and payroll ecosystem, a market traditionally dominated by incumbent banks. Our credit portfolio continued its upward trajectory, capturing an additional 60bps of market share in the INSS Payroll Credit segment to reach 9.60% by the end of June, which is a testament to the resilience of our business model and our ability to continue gaining share despite a challenging macroeconomic environment. This performance also demonstrates our ability to adapt rapidly to structural and regulatory changes. It also reinforces our belief that Agi is among the first players in the market to return to strong growth.
To support the evolving needs of our customers, we recently launched two important initiatives. First, we introduced our Proprietary Investment Platform further expanding the range of financial solutions available within the Agibank app. The platform debuts with our own time deposit (CDB) available to all Agibank account holders, offering customers a secure and attractive savings alternative while strengthening our primary banking relationship with our clients. Over time, the platform will also enable the distribution of products from Agibank Asset as well as selected third-party offerings, reinforcing our strategy to deepen customer engagement, increase share of wallet and further diversify our deposit funding base.
| 2 |
| | earnings release |
Second, we launched Agi+, marking another important step in our strategy to evolve into a subscription-based banking platform. Designed to extend our relationship with customers beyond traditional financial services, Agi+ combines financial benefits with a broad suite of everyday services–including healthcare and dental assistance, pharmacy discounts, home and pet assistance, mobile services, and exclusive retail offers–through an affordable monthly subscription. Leveraging the scale of our more than 7 million active customers, Agi+ creates a new avenue for predictable recurring revenue while strengthening customer engagement, increasing retention, expanding cross-selling opportunities, and reinforcing Agibank as our customers' primary financial partner. This initiative further diversifies our revenue streams and reflects our long-term vision of building a broader ecosystem centered around our customers' everyday needs. Following an initial rollout period, Agi+ has already surpassed 250 thousand subscriptions in its first 45 days, demonstrating strong early customer engagement.
We believe Agi reached a significant operational inflection point in the second quarter of 2026. This is already visible across customer acquisition, credit origination, product activity and fee revenues, although the full financial benefits will be recognized over the coming quarters. Accelerating growth requires upfront expected-loss provisions on new vintages, customer acquisition investments and higher costs to serve and activate customers, while interest income, fees and cross-selling revenues accrue over the subsequent quarters and years.
We expect this operating resurgence to support sequentially stronger earnings beginning in the third quarter, with a more pronounced financial contribution in the fourth quarter.
In line with our principle of winning with technology, we are seeing tangible results from our investments in artificial intelligence, which is rapidly becoming a core pillar of our strategy. A clear example is the evolution of our customer service model: we have transitioned from traditional rule-based chatbots to a multi-agent AI architecture integrated with WhatsApp, capable of managing complex, end-to-end customer journeys with greater efficiency and personalization.
The challenges faced in previous quarters have not altered our course or our conviction in our business model. Our confidence in this path remains unwavering. We believe this conviction is shared by our long-term partners, as evidenced by Lumina Capital's recent decision to increase its ownership stake in Agi Inc. from 5% to 7%. Members of management have likewise continued to increase their personal investment in the Company, further reinforcing our alignment with all shareholders.
Thank you for your continued trust and partnership.
Marciano Testa
Founder, Chairman and CEO of Agi
Inc.
| 3 |
| | earnings release |
Key Indicators
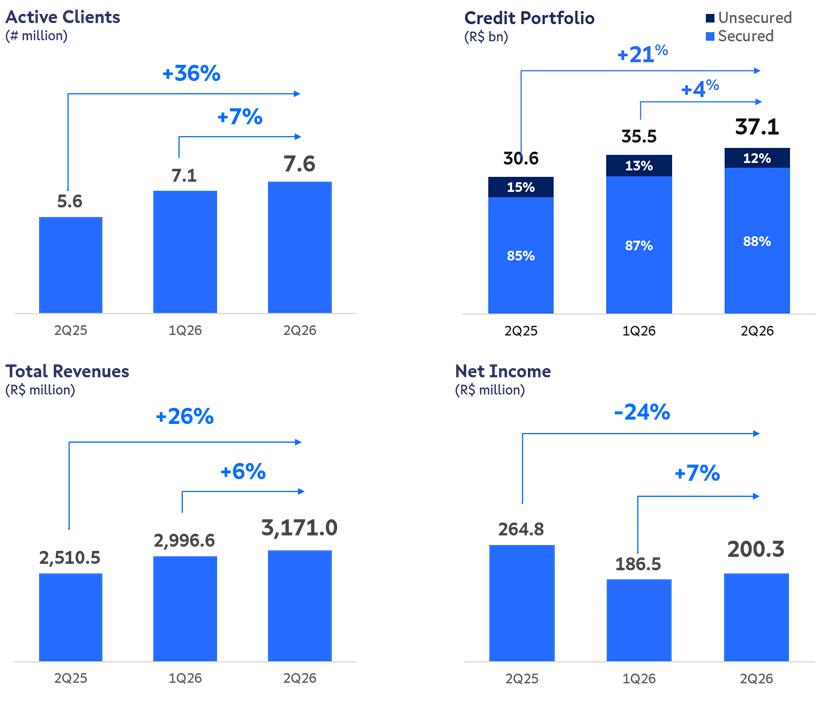
| Key Figures (R$ millions) | 2Q26 | 1Q26 | Var.% | 2Q25 | Var.% | 1H26 | 1H25 | Var.% |
| Total Active Clients ('000) | 7,589.0 | 7,069.9 | 7.3% | 5,563.4 | 36.4% | 7,589.0 | 5,563.4 | 36.4% |
| Total Revenues | 3,171.0 | 2,996.6 | 5.8% | 2,510.5 | 26.3% | 6,167.6 | 4,935.4 | 25.0% |
| Net Interest Income | 1,300.9 | 1,268.6 | 2.5% | 1,172.7 | 10.9% | 2,569.4 | 2,331.6 | 10.2% |
| Earnings Before Taxes | 115.0 | 216.1 | -46.8% | 367.9 | -68.7% | 331.0 | 879.6 | -62.4% |
| Net Income | 200.3 | 186.5 | 7.4% | 264.8 | -24.4% | 386.8 | 621.3 | -37.7% |
| Interest Bearing Assets | 43,998.6 | 43,238.5 | 1.8% | 35,750.5 | 23.1% | 43,998.6 | 35,750.5 | 23.1% |
| Gross Credit Portfolio | 37,075.8 | 35,498.5 | 4.4% | 30,599.4 | 21.2% | 37,075.8 | 30,599.4 | 21.2% |
| Net Equity | 4,799.2 | 4,655.0 | 3.1% | 2,938.9 | 63.3% | 4,799.2 | 2,938.9 | 63.3% |
| ROAE LTM | 21.6% | 26.1% | -4,5 p.p | 41.2% | -19,6 p.p | 21.6% | 41.2% | -19,6 p.p |
| NIM Annualized | 11.9% | 12.0% | -0,1 p.p | 14.1% | -2,2 p.p | 11.9% | 14.1% | -2,2 p.p |
| Operating Efficiency Ratio | 48.9% | 43.2% | 5,7 p.p | 42.9% | 6 p.p | 46.1% | 38.5% | 7,6 p.p |
| NPL > 90 days | 3.3% | 3.6% | -0,3 p.p | 2.7% | 0,6 p.p | 3.3% | 2.7% | 0,6 p.p |
| Capital Adequacy Ratio (Basel III) | 18.7% | 19.3% | -0,6 p.p | 15.0% | 3,7 p.p | 18.7% | 15.0% | 3,7 p.p |
| Smart Hubs (#) | 1,115 | 1,115 | 0.0% | 1,057 | 5.5% | 1,115 | 1,057 | 5.5% |
| Headcount (#) | 5,068 | 5,010 | 1.2% | 5,030 | 0.8% | 5,068 | 5,030 | 0.8% |
| 4 |
| | earnings release |
Performance Evolution
Our second-quarter performance reaffirmed many of the strengths of our business model. Even as the payroll lending market navigated a period of structural change, we sustained high origination volumes and continued to gain share in our core segments, a direct result of the operational speed and competitive advantage of our hybrid, 100% proprietary platform relative to other market players. An additional driver was our Private Payroll loan portfolio, which posted its strongest single-quarter growth on record in 2Q, underpinned by consistently better credit quality metrics that reinforce the profitability and durability of this expansion.
Importantly, the recovery was broad-based across virtually every leading operating indicator. Gross credit origination exceeded R$7 billion, while customer acquisition reached an all-time high. Private Payroll originations doubled compared with the previous quarter, unsecured Personal Loan originations increased by more than 80%, and fee revenues grew 34.6% quarter over quarter. Together, these indicators reinforce our view that Agi’s operating engine has returned to strong growth.
This resilience was tested by the rollout of Desenrola 2.0, a Brazilian federal government program, in May. The program introduced system-wide changes to payroll lending, mainly additional steps for contract formalization, as well as a reduction in payroll credit limits relative to clients’ monthly income (from 45% to 40%) and an extension of maximum contract terms (from 96 to 108 months). We view these shifts as a net positive: they reward the scale and agility on which Agi competes best. Despite the industry-wide disruption, our origination remained above R$7 billion, net origination increased 15.0% quarter over quarter, and growth accelerated across several priority products, leading to an additional 60bps of market share in INSS Payroll Credit in the quarter alone, bringing our total share to 9.60%. We consider this a significant achievement and clear evidence of our ability to adapt faster than the competition.
Fee revenues reached R$135.6 million in the second quarter, increasing 34.6% quarter over quarter and providing one of the clearest indications of the recovery in business activity. Because fee revenues are recognized without the provisioning dynamics associated with credit growth, they provide a more immediate view of operating momentum. One indirect impact of Desenrola 2.0 was that fee revenues originated from Operational Cost Reimbursements related to external portability decreased in the quarter, as other financial institutions faced greater challenges in their origination efforts. While this shift is highly beneficial to our credit portfolio health and customer retention, it created a temporary headwind for our fee revenues, highlighting the organic growth capacity of this line. Looking ahead, Agi+ is expected to become an additional driver of recurring fee revenue from the third quarter onward.
Agi exits the second quarter from a position of strength. Having navigated the most significant regulatory transition the industry has seen in years – while simultaneously gaining market share and improving credit quality – we enter the second half of 2026 with clear operating momentum and a widening competitive moat. With Agi+ and our proprietary investment platform now live, we are positioned to convert this foundation into accelerating growth and profitability, compounding long-term value for our shareholders.
| 5 |
| | earnings release |
Summary of Quarterly Results
Clients. Our total active client base grew by 36.4% year-over-year, reaching 7.6 million by the end of 2Q26. For the purposes of our high-touch strategy, we define "active customers" as those holding at least one product as of the quarter’s end. Our strategy continues to drive deep engagement; average product penetration for customers with principality - defined as those who receive their payroll via Agi - exceeds five products. Notably, for our mature cohorts (customers with a tenure exceeding one year), this figure rises to over seven products, highlighting the significant cross-selling potential embedded in our business model. In June, Agi became the sixth-largest payer of Social Security benefits in Brazil, serving approximately 1.5 million clients with principality and further reinforcing our commitment to this vital segment of the population.
Agi+ is a brand-new subscription service designed for broad penetration across our customer base, combining financial benefits with everyday services. Following its initial rollout, the product surpassed 250 thousand subscriptions in its first 45 days, demonstrating strong early engagement. Agi+ is expected to become an important source of recurring fee revenue and a driver of customer retention, engagement and cross-selling beginning in 3Q26.
Credit
| Credit Portfolio (R$ million) | 2Q26 | 1Q26 | Var.% | 2Q25 | Var.% | ||
| Secured Credit | 32,599.5 | 30,714.3 | 6.1% | 26,123.3 | 24.8% | ||
| Payroll Credit | 28,905.6 | 26,937.3 | 7.3% | 23,199.1 | 24.6% | ||
| INSS | 27,154.4 | 25,687.5 | 5.7% | 22,601.4 | 20.1% | ||
| Private | 1,406.8 | 950.1 | 48.1% | 495.8 | 183.7% | ||
| Public | 344.4 | 299.7 | 14.9% | 101.9 | 238.0% | ||
| Payroll Credit Cards | 2,490.1 | 2,486.5 | 0.1% | 2,262.9 | 10.0% | ||
| FGTS | 1,203.8 | 1,290.5 | -6.7% | 661.2 | 82.1% | ||
| Unsecured Credit | 4,476.3 | 4,784.2 | -6.4% | 4,476.1 | 0.0% | ||
| Personal Credit | 4,431.2 | 4,729.6 | -6.3% | 4,410.6 | 0.5% | ||
| Credit Cards | 45.1 | 54.6 | -17.4% | 65.5 | -31.2% | ||
| Credit Portfolio | 37,075.8 | 35,498.5 | 4.4% | 30,599.4 | 21.2% | ||
| Loss Provisions - Loan Portfolio | (2,226.7) | (2,116.1) | 5.2% | (2,001.7) | 11.2% | ||
| Net Credit Portfolio | 34,849.2 | 33,382.4 | 4.4% | 28,597.7 | 21.9% | ||
| NPL>90 days (%) | 3.3% | 3.6% | -0,3 p.p | 2.7% | 0,6 p.p | ||
| Coverage Ratio (%) | 182.6% | 164.9% | 17,7 p.p | 240.4% | -57,8 p.p | ||
| Cost of Risk LTM (%) | 5.9% | 5.7% | 0,2 p.p | 5.7% | 0,2 p.p |
Total portfolio grew 4.4% QoQ and 21.2% YoY, reaching R$37.1 billion. Our portfolio is strategically balanced between Secured Loans (88%, R$32.6 billion) and Unsecured Loans (12%, R$4.5 billion), serving Social Security beneficiaries alongside public and private sector employees. We believe this composition provides an optimal balance of profitability, credit quality, and long-term client loyalty.
INSS Payroll Credit grew 5.7% QoQ and 20.1% YoY, with origination levels returning to pre-suspension volumes as of March. The Desenrola 2.0 program introduced regulatory adjustments in May -including a reduction in the payroll installment limit (from 45% to 40% of monthly income), an extension of maximum contract terms (from 96 to 108 months), and additional formalization requirements on the client side. While these changes caused temporary challenges for market-wide origination, especially in connection with portability and refinancing, they have encouraged players to focus in the origination of new INSS Payroll Credit contracts, which usually carry higher yields. Our ability to navigate this environment and our competitive resilience resulted in a 60bps market share gain in 2Q26 alone.
| 6 |
| | earnings release |
Private Payroll Credit grew 48.1% QoQ to more than R$1.4 billion, while new originations approximately doubled compared with the previous quarter, with monthly originations stabilizing between R$150 million and R$200 million. This growth is supported by refined credit modeling, which has significantly enhanced the quality of new cohorts. We maintain our appetite to the product and view this segment as a key driver of future profitability.
Public Payroll Credit grew 14.9% QoQ and 238.0% YoY. While this remains a smaller portfolio, it represents a significant growth vector, with great potential. We are actively expanding our presence across additional municipalities to increase our credit distribution footprint.
Personal Loans decreased 6.3% QoQ - despite an increase of more than 80% in new originations compared with the previous quarter - and remained stable YoY. While originations for this unsecured portfolio have surpassed pre-suspension levels, the outstanding balance on 2Q26 reflected two factors: the inherently shorter duration of these products (under 12 months) and the seasonal maturity of 13th-salary advances, which typically occur in the second quarter. By itself, the amortization of the 13th-salary advances portion of the portfolio represented a reduction of approximately R$ 300 million in the Personal Loans total balance, rather than a slowdown in new business activity.
Credit Origination. Production recovered to pre-suspension levels in 2Q26: Net Credit Origination grew 15.0% QoQ to R$2.8 billion, driving the expansion of our outstanding portfolio, and we estimate Agi held the highest origination share among all INSS players in payroll loans. Gross Credit Origination was R$7.1 billion stable – QoQ despite the system-wide Desenrola 2.0 adjustments – underscoring our operating speed relative to the market. Agi’s core competitive advantage lies in our hybrid, 100% proprietary platform integrating physical and digital channels, which fosters higher product penetration, superior credit quality, and increased customer lifetime value.
Credit Quality. Our Non-Performing Loans over 90 days (NPL>90) ratio improved to 3.3% by the end of June 2026 - a 0.3 p.p. reduction QoQ. This performance, driven by the normalization of defaulting cohorts and enhanced credit modeling, stands in contrast to the broader deterioration observed across the Brazilian consumer credit segment. The Cost of Risk (LTM) remained at a sustainable 5.9%, while our Coverage Ratio (Provisions over NPL >90) reached 182.6%, an improvement of 17.7 p.p. QoQ, reflecting a robust and conservative stance on provisioning. These trends demonstrate that Agi resumed strong growth while maintaining asset quality under control.
| 7 |
| | earnings release |
Funding
| Deposits | 2Q26 | 1Q26 | Var.% | 2Q25 | Var.% | ||
| Demand customer deposits | 566.2 | 456.5 | 24.0% | 361.8 | 56.5% | ||
| Time Deposits - CDB | 14,788.1 | 17,154.6 | -13.8% | 18,038.1 | -18.0% | ||
| Time Deposits - DPGE | 2,332.2 | 2,812.4 | -17.1% | 1,594.2 | 46.3% | ||
| Financial Bills and CDI | 8,336.1 | 8,556.0 | -2.6% | 6,287.2 | 32.6% | ||
| Collateralized Issuances | 12,372.7 | 9,422.6 | 31.3% | 6,912.9 | 79.0% | ||
| Foreign Bonds | 1,502.5 | 890.6 | 68.7% | 649.7 | 131.2% | ||
| Total Deposits | 39,897.8 | 39,292.8 | 1.5% | 33,843.9 | 17.9% | ||
| Share of Retail Funding (%) | 38.5% | 44.8% | -6,3 p.p | 54.4% | -15,9 p.p | ||
| Share of Institutional Funding (%) | 61.5% | 55.2% | 6,3 p.p | 45.6% | 15,9 p.p | ||
| Loans to Deposits Ratio (%) | 92.9% | 90.3% | 2,6 p.p | 90.4% | 2,5 p.p |
Deposits. Agi maintains a long-standing presence in the Brazilian credit market as a frequent issuer of debt securities, with the primary objective of diversifying funding sources to support the sustainable growth of our loan operations. Our Asset & Liability Management (ALM) strategy remains conservative, effectively matching the durations and indexation of our secured credit portfolios with their respective funding sources. This approach provides a structural hedge, protecting our spreads against market and interest rate volatility, while providing the liquidity and balance-sheet flexibility required to support the renewed origination momentum.
Debt Issuances in Brazil. In the second quarter of 2026, Agibank successfully executed two debt issuances to increase its funding base. These issuances underscore our continued access to competitive funding and our status as a recurring issuer in the Brazilian debt market, ensuring the liquidity necessary to accelerate credit origination and gain market share.
| • | Second FIDC: Successfully structured in April, totaling R$2.5 billion. This instrument features a 10-year maturity and a ‘AAA.br’ rating from Moody’s. It is backed by payroll loan contracts and issued at a rate of CDI + 1.05%. |
| • | Seventh Public Financial Bill Issuance: Completed in June, raising R$500 million. This issuance was structured in two tranches with tenors of 24 and 36 months, at rates of CDI + 0.60% and CDI + 0.75%, respectively. |
Credit Ratings. Agibank has recently received credit ratings upgrades from the core agencies. In July, Fitch Ratings upgraded Agibank’s rating from ‘AA-(br)’ to ‘AA(bra)’, and in June Moody’s Local upgraded the bank’s rating from ‘AA-.br’ to ‘AA.br’. Both agencies note that the upgrades reflect the bank’s strengthened credit profile, driven by robust loan portfolio growth, improved capital levels, and enhanced corporate governance following Agi’s NYSE listing. Agi’s management expects this rating improvement to further bolster market confidence in our hybrid digital-physical business model, facilitating greater diversification of funding alternatives and optimizing cost of capital.

| 8 |
| | earnings release |
Financial Results
| Net Interest Margin - Quarterly | 2Q26 | 1Q26 | Var.% | 2Q25 | Var.% | |
| Interest from Loans | 2,316.2 | 2,212.3 | 4.7% | 2,061.0 | 12.4% | |
| Interest from Cash and Gains on Financial Assets | 719.3 | 683.6 | 5.2% | 243.0 | 196.0% | |
| Interest Expenses | (1,734.6) | (1,627.3) | 6.6% | (1,131.3) | 53.3% | |
| Net Interest Income (a) | 1,300.9 | 1,268.6 | 2.5% | 1,172.7 | 10.9% | |
| Average Secured Loans | 31,656.9 | 30,354.4 | 4.3% | 24,396.0 | 29.8% | |
| Average Unsecured Loans | 4,630.3 | 4,822.3 | -4.0% | 4,523.5 | 2.4% | |
| Average Other Interest-Bearing Assets* | 7,331.4 | 7,152.8 | 2.5% | 4,335.7 | 69.1% | |
| Average Interest-Bearing Assets (b) | 43,618.6 | 42,329.6 | 3.0% | 33,255.2 | 31.2% | |
| Share of Average Secured Loans | 72.6% | 71.7% | 0,9 p.p | 73.4% | -0,8 p.p | |
| Share of Average Unsecured Loans | 10.6% | 11.4% | -0,8 p.p | 13.6% | -3 p.p | |
| Share of Average Other Interest-Bearing Assets* | 16.8% | 16.9% | -0,1 p.p | 13.0% | 3,8 p.p | |
| NIM - (a)/(b) - Annualized | 11.9% | 12.0% | -0,1 p.p | 14.1% | -2,2 p.p | |
| NIM - (LTM) | 12.3% | 12.8% | -0,5 p.p | 15.8% | -3,5 p.p | |
| Provision Expenses (c) | (562.2) | (499.0) | 12.7% | (351.5) | 60.0% | |
| NIM after provisions - ((a)+(c))/(b) - Annualized | 6.8% | 7.3% | -0,5 p.p | 9.9% | -3,1 p.p | |
| NIM after provisions - LTM | 7.2% | 8.0% | -0,8 p.p | 10.8% | -3,6 p.p | |
| Net Interest Margin - First Half | 1H26 | 1H25 | Var.% | |||
| Interest from Loans | 4,528.4 | 3,992.2 | 13.4% | |||
| Interest from Cash and Gains on Financial Assets | 1,402.9 | 420.8 | 233.4% | |||
| Interest Expenses | (3,361.9) | (2,081.4) | 61.5% | |||
| Net Interest Income (a) | 2,569.4 | 2,331.6 | 10.2% | |||
| Average Secured Loans | 31,656.9 | 24,396.0 | 29.8% | |||
| Average Unsecured Loans | 4,630.3 | 4,523.5 | 2.4% | |||
| Average Other Interest-Bearing Assets* | 7,331.4 | 4,335.7 | 69.1% | |||
| Average Interest-Bearing Assets (b) | 43,618.6 | 33,255.2 | 31.2% | |||
| Share of Average Secured Loans | 72.6% | 73.4% | -0,8 p.p | |||
| Share of Average Unsecured Loans | 10.6% | 13.6% | -3 p.p | |||
| Share of Average Other Interest-Bearing Assets* | 16.8% | 13.0% | 3,8 p.p | |||
| NIM - (a)/(b) - Annualized | 11.8% | 14.0% | -2,2 p.p | |||
| NIM - (LTM) | 12.3% | 12.8% | -0,5 p.p | |||
| Provision Expenses (c) | (1,061.2) | (712.9) | 48.8% | |||
| NIM after provisions - ((a)+(c))/(b) - Annualized | 6.9% | 9.7% | -2,8 p.p | |||
| NIM after provisions - LTM | 7.2% | 8.0% | -0,8 p.p |
Net Interest Margin. The quarterly annualized NIM, net of provisions, decreased 50bps QoQ. The move is largely mix-driven: a higher share of secured products – which carry lower yields but materially better credit quality – together with a macro rate environment that compressed spreads, and a temporarily larger allocation to liquid, lower-yielding assets that provides balance-sheet flexibility during this growth phase. We regard this as a transitory trade-off and expect interest margins to recover as higher-yielding vintages mature and our asset mix normalizes, subject to market and interest-rate conditions.
|
*Other Interest-Bearing Assets: from 1Q26 earnings on, the line ‘Debentures’ is being excluded from calculation, as its outstanding balance in Assets stems from issuances collateralized by credit portfolio, destined for funding, and has null impact on Net Interest Income. This has been reflected in the previous quarters for proper comparison. |
| 9 |
| | earnings release |
| Operating Efficiency Ratio - Quarterly | 2Q26 | 1Q26 | Var.% | 2Q25 | Var.% | ||
| Personnel Expenses | (131.5) | (90.6) | 45.2% | (143.9) | -8.6% | ||
| Selling, general and administrative expenses | (470.1) | (368.1) | 23.1% | (331.0) | 42.0% | ||
| Depreciation and Amortization | (57.8) | (53.7) | 7.7% | (48.4) | 19.3% | ||
| Other income (expenses) | 10.1 | (17.1) | -159.3% | (18.1) | -155.8% | ||
| Total Expenses (a) | (649.3) | (529.4) | 19.5% | (541.5) | 19.9% | ||
| Operating Income (NII + Fees) | 1,436.4 | 1,369.3 | 4.9% | 1,379.2 | 4.1% | ||
| Tax expenses | (109.9) | (111.0) | -1.0% | (118.4) | -7.1% | ||
| Operating Income + Tax expenses (b) | 1,326.5 | 1,258.2 | 5.4% | 1,260.9 | 5.2% | ||
| Operating Efficiency Ratio - (a)/(b) | 48.9% | 42.1% | 6,9 p.p. | 42.9% | 6,1 p.p. | ||
| Operating Efficiency Ratio - LTM | 44.8% | 42.5% | 2,4 p.p. | 43.5% | 1,4 p.p. | ||
| Operating Efficiency Ratio - First Half | 1H26 | 1H25 | Var.% | ||||
| Personnel Expenses | (222.1) | (231.5) | -4.1% | ||||
| Selling, general and administrative expenses | (852.0) | (648.8) | 31.3% | ||||
| Depreciation and Amortization | (111.5) | (95.4) | 16.9% | ||||
| Other income (expenses) | (7.0) | (19.6) | -64.6% | ||||
| Total Expenses (a) | (1,192.5) | (995.3) | 19.8% | ||||
| Operating Income (NII + Fees) | 2,805.7 | 2,854.0 | -1.7% | ||||
| Tax expenses | (220.9) | (266.2) | -17.0% | ||||
| Operating Income + Tax expenses (b) | 2,584.7 | 2,587.8 | -0.1% | ||||
| Operating Efficiency Ratio - (a)/(b) | 46.1% | 38.5% | 7,7 p.p. | ||||
| Operating Efficiency Ratio - LTM | 46.4% | 42.5% | 3,9 p.p. |
Efficiency. The Operating Efficiency Ratio for 2Q26 was 48.9%, a 690bps increase QoQ. This was driven primarily by (i) higher SG&A, including legal expenses, and (ii) an organic increase in transactional and financial-service costs that scales directly with our growing base of principality customers – a cost we view as a leading indicator of deeper, more profitable relationships. The increase also reflects upfront investments associated with customer acquisition, servicing and activation, while the related revenues are expected to accrue over subsequent quarters. Personnel Expenses on 1Q26 were benefitted from the seasonality related to the payout of bonuses, which are previously provisioned throughout the year, and thus generating an expected increase in the following quarters. We expect efficiency to improve in the coming quarters as the financial returns from portfolio growth emerge and new initiatives, including Agi+, begin contributing to revenue from 3Q26 onward.
Profitability. Net Income for 2Q26 reached R$200.3 million, up 7.4% QoQ, with a last-twelve-months Return on Equity of 21.6%. Earnings Before Taxes declined 46.8% QoQ – a movement that reflects the growth dynamics described in this release rather than any deterioration in our franchise: front-loaded provisioning to support a 4.4% QoQ portfolio expansion (allowance for loan losses of R$562.2 million, up 12.7% QoQ), temporary NIM compression from our shift toward secured assets, and normalization of our SG&A. Because the revenues from these new, higher-quality vintages, are recognized over their life while their costs are recognized upfront, we expect pre-tax profitability to re-accelerate as these cohorts season. Our effective tax rate additionally benefited from the tax-efficient allocation of IPO proceeds and Agibank’s cash into eligible instruments, which is a feature of our capital management. Accordingly, we believe the second quarter represents an operational inflection point, with the earnings contribution from recent customer acquisition and new loan vintages expected to build progressively over the second half of 2026.
Capital. The Capital Adequacy Ratio (CAR) was 18.7% at the end of 2Q26, with a Tier I capital ratio of 17.6%. These figures reflect the capital allocation from Agi Inc.’s consolidated financial statements, incorporating the proceeds from our IPO into our Referential Equity. Agi’s track record of delivering above-average ROE continues to support a self-sustainable approach to capital generation, ensuring we remain well-positioned for future growth, with our capital position allowing us to continue investing in customer growth and technology while maintaining disciplined focus on long-term returns. The table below presents the Capital Adequacy Ratio at the Agi Inc level from 2026 on.
| 10 |
| | earnings release |
| Capital* | 2Q26 | 1Q26 | Var.% | 2Q25 | Var.% | |
| Referencial Equity | 5,250.6 | 5,213.7 | 0.7% | 3,304.2 | 58.9% | |
| Referential Equity - Tier I | 4,924.8 | 4,881.3 | 0.9% | 2,940.8 | 67.5% | |
| Common Equity | 4,696.6 | 4,642.9 | 1.2% | 2,940.8 | 59.7% | |
| Complementary Capital | 228.3 | 238.3 | -4.2% | - | - | |
| Referential Equity - Tier II | 325.8 | 332.4 | -2.0% | 363.4 | -10.3% | |
| Risk-weighted Assets | 28,035.8 | 26,951.7 | 4.0% | 21,989.3 | 27.5% | |
| Credit Risk-weighted Assets | 23,921.8 | 23,236.9 | 2.9% | 19,874.6 | 20.4% | |
| Market Risk-weighted Assets | 441.5 | 42.2 | 947.0% | 119.3 | 269.9% | |
| Operational Risk-weighted Assets | 3,672.6 | 3,672.6 | 0.0% | 1,995.3 | 84.1% | |
| RBAN | 756.7 | 646.3 | 17.1% | 535.1 | 41.4% | |
| Capital Adequacy Ratio - Regulatory Limit = 10.5% | 18.7% | 19.3% | -0.6 p.p. | 15.0% | 3.7 p.p. | |
| Tier I - Regulatory Limit = 8.0% | 17.6% | 18.1% | -0.5 p.p. | 13.4% | 4.2 p.p. | |
| Tier II | 1.2% | 1.2% | 0.0 p.p. | 1.7% | -0.5 p.p. | |
| Expanded Capital Adequancy Ratio (RE/(RWA+RBAN)) | 18.2% | 18.9% | -0.7 p.p. | 14.7% | 3.5 p.p. | |
| Liquidity Coverage Ratio | 2Q26 | 1Q26 | Var.% | 2Q25 | Var.% | |
| High Quality Liquidity Assets | 2,141.5 | 3,590.5 | -48.9% | 3,008.8 | -28.8% | |
| Potencial Cash Outflows | 292.6 | 1,286.9 | 29.6% | 427.6 | -31.6% | |
| LCR (%) Regulatory Limit = 100% | 731.9% | 279.0% | -426.2 p.p. | 703.6% | 28.3 p.p. |
* For 4Q25 and previous quarters, the Capital Adequacy Ratio refers to Banco Agibank SA. From 1Q26 on, it refers to the Capital Adequacy Ratio of Agi Inc.
| 11 |
| | earnings release |
Consolidated Financial Statements 2Q26 - Agi Inc – IFRS
For 4Q25 and earlier quarters, Agi Financial Holding
Balance Sheet
| ASSETS | 2Q26 | 1Q26 | Var.% | 2Q25 | Var.% |
| Cash and cash and equivalents | 752.1 | 1,002.4 | -25.0% | 371.4 | 102.5% |
| Financial Assets Measured At Fair Value Through Profit Or Loss | 1,890.8 | 2,115.4 | -10.6% | 383.8 | 392.6% |
| Financial Assets Measured At Fair Value Through Other Comprehensive Income | - | - | 2,518.8 | -100.0% | |
| Financial Assets Measured At Amortized Cost | 45,288.5 | 43,897.4 | 3.2% | 31,977.6 | 41.6% |
| Securities | 4,279.8 | 4,054.3 | 5.6% | 1,877.3 | 128.0% |
| Debentures | 6,159.5 | 5,892.7 | 4.5% | 1,502.7 | 309.9% |
| Loans to customers | 37,075.8 | 35,498.5 | 4.4% | 30,599.3 | 21.2% |
| (-) Provision for Expected Loss | (2,226.7) | (2,116.1) | 5.2% | (2,001.7) | 11.2% |
| Compulsory deposits with the Brazilian Central Bank | - | 567.9 | -100.0% | - | |
| Deferred Tax Assets | 1,318.5 | 1,447.6 | -8.9% | 1,023.1 | 28.9% |
| Property and Equipment | 101.9 | 95.1 | 7.2% | 65.9 | 54.6% |
| Intangible Assets | 227.7 | 223.9 | 1.7% | 203.0 | 12.2% |
| Right-of-use assets | 201.0 | 198.0 | 1.5% | 214.9 | -6.5% |
| Other Assets | 1,328.5 | 1,213.7 | 9.5% | 1,669.5 | -20.4% |
| Total Assets | 51,109.0 | 50,193.4 | 1.8% | 38,427.9 | 33.0% |
| LIABILITIES | 2Q26 | 1Q26 | Var.% | 2Q25 | Var.% |
| Financial Liabilities At Amortized Cost | 31,316.3 | 33,240.8 | -5.8% | 28,945.7 | 8.2% |
| Demand customer deposits | 566.2 | 456.5 | 24.0% | 361.8 | 56.5% |
| Funds from acceptances and issuance of securities | 6,285.0 | 6,399.9 | -1.8% | 5,512.3 | 14.0% |
| Time customer deposits | 18,414.8 | 21,341.4 | -13.7% | 19,902.3 | -7.5% |
| Debt issued and other borrowed funds | 756.6 | 890.6 | -15.0% | 496.5 | 52.4% |
| Loans and borrowing LP | 1,502.5 | 781.7 | 92.2% | 649.7 | 131.2% |
| Investment securities | 300.0 | - | 2,023.0 | -85.2% | |
| Debentures (from Repurchase Agreements) | 3,491.2 | 3,370.6 | 3.6% | - | |
| Derivatives | 270.3 | 112.2 | 140.9% | 38.7 | 598.4% |
| Provision For Contingencies | 322.5 | 295.6 | 9.1% | 361.5 | -10.8% |
| Other Liabilities | 880.0 | 948.6 | -7.2% | 962.0 | -8.5% |
| Liabilities related to credit assigments | 13,158.1 | 10,474.3 | 25.6% | 4,599.6 | 186.1% |
| Lease liabilities | 237.9 | 233.9 | 1.7% | 248.6 | -4.3% |
| Deferred tax liabilities | 124.8 | 233.0 | -46.4% | 332.8 | -62.5% |
| Total Liabilities | 46,309.8 | 45,538.4 | 1.7% | 35,488.9 | 30.5% |
| EQUITY | 2Q26 | 1Q26 | Var.% | 2Q25 | Var.% |
| Controlling interests | 4,799.2 | 4,655.0 | 3.1% | 2,941.6 | 63.2% |
| Share capital and premium reserve | 3,911.0 | 3,941.9 | -0.8% | 1,693.0 | 131.0% |
| Reserves | 519.2 | 547.0 | -5.1% | 869.6 | -40.3% |
| Retained earnings | 386.8 | 186.5 | 107.4% | - | |
| Treasury shares | (17.0) | (17.0) | 0.0% | 384.7 | -104.4% |
| Other Comprehensive income | (0.8) | (3.5) | -75.7% | (5.8) | -85.3% |
| Non - Controlling Interests | - | - | (2.7) | -100.0% | |
| Total Equity | 4,799.2 | 4,655.0 | 3.1% | 2,938.9 | 63.3% |
| Total Liabilities and Equity | 51,109.0 | 50,193.4 | 1.8% | 38,427.9 | 33.0% |
| 12 |
| | earnings release |
Consolidated Financial Statements 2Q26 - Agi Inc – IFRS
For 4Q25 and earlier quarters, Agi Financial Holding - IFRS
Income Statement
| P&L - Quarterly | 2Q26 | 1Q26 | Var.% | 2Q25 | Var.% |
| Total Revenues | 3,171.0 | 2,996.6 | 5.8% | 2,510.5 | 26.3% |
| Interest Revenues | 2,830.1 | 2,710.1 | 4.4% | 2,216.1 | 27.7% |
| Interest on Cash | 513.9 | 497.8 | 3.2% | 155.0 | 231.5% |
| Interest from Loan Operations | 2,316.2 | 2,212.3 | 4.7% | 2,061.0 | 12.4% |
| Interest income using the effective interest method | (1,734.6) | (1,627.3) | 6.6% | (1,131.3) | 53.3% |
| Gains (losses) on financial assets at fair value through profit or loss* | 205.3 | 185.7 | 10.5% | 87.9 | 133.5% |
| Net interest income | 1,300.9 | 1,268.6 | 2.5% | 1,172.7 | 10.9% |
| Commissions, banking fees and other revenues from services | 135.6 | 100.7 | 34.6% | 206.5 | -34.4% |
| Operating revenues | 1,436.4 | 1,369.3 | 4.9% | 1,379.2 | 4.1% |
| Allowance for loan losses | (562.2) | (499.0) | 12.7% | (351.5) | 60.0% |
| Personnel expenses | (131.5) | (90.6) | 45.2% | (143.9) | -8.6% |
| Selling, general and administrative expenses | (470.1) | (381.8) | 23.1% | (331.0) | 42.0% |
| Tax expenses | (109.9) | (111.0) | -1.0% | (118.4) | -7.1% |
| Depreciation and amortization | (57.8) | (53.7) | 7.7% | (48.4) | 19.3% |
| Operating expenses | (1,331.6) | (1,136.1) | 17.2% | (993.2) | 34.1% |
| Net Operating Income | 104.8 | 233.2 | -55.0% | 386.1 | -72.8% |
| Other income (expenses), net | 10.1 | (17.1) | -159.3% | (18.1) | -155.8% |
| Earnings Before Taxes | 115.0 | 216.1 | -46.8% | 367.9 | -68.7% |
| Current income tax and social contribution | 84.5 | (179.7) | -147.0% | (58.7) | -243.8% |
| Deferred income tax and social contribution | 0.8 | 150.1 | -99.4% | (44.3) | -101.9% |
| Net Income | 200.3 | 186.5 | 7.4% | 264.8 | -24.4% |
| Effective Tax Rate | -74.2% | 13.7% | -87,9 p.p | 28.0% | -102,2 p.p |
| P&L - First Half | 1H26 | 1H25 | Var.% | ||
| Total Revenues | 6,167.6 | 4,935.4 | 25.0% | ||
| Interest Revenues | 5,540.2 | 4,281.2 | 29.4% | ||
| Interest on Cash | 1,011.8 | 289.0 | 250.1% | ||
| Interest from Loan Operations | 4,528.4 | 3,992.2 | 13.4% | ||
| Interest income using the effective interest method | (3,361.9) | (2,081.4) | 61.5% | ||
| Gains (losses) on financial assets at fair value through profit or loss* | 391.1 | 131.8 | 196.7% | ||
| Net interest income | 2,569.4 | 2,331.6 | 10.2% | ||
| Commissions, banking fees and other revenues from services | 236.3 | 522.4 | -54.8% | ||
| Operating revenues | 2,805.7 | 2,854.0 | -1.7% | ||
| Allowance for loan losses | (1,061.2) | (712.9) | 48.8% | ||
| Personnel expenses | (222.1) | (231.5) | -4.1% | ||
| Selling, general and administrative expenses | (852.0) | (648.8) | 31.3% | ||
| Tax expenses | (220.9) | (266.2) | -17.0% | ||
| Depreciation and amortization | (111.5) | (95.4) | 16.9% | ||
| Operating expenses | (2,467.7) | (1,954.8) | 26.2% | ||
| Net Operating Income | 338.0 | 899.2 | -62.4% | ||
| Other income (expenses), net | (7.0) | (19.6) | -64.6% | ||
| Earnings Before Taxes | 331.0 | 879.6 | -62.4% | ||
| Current income tax and social contribution | (95.2) | (292.9) | -67.5% | ||
| Deferred income tax and social contribution | 151.0 | 34.6 | 336.7% | ||
| Net Income | 386.8 | 621.3 | -37.7% | ||
| Effective Tax Rate | -16.8% | 29.4% | -46,2 p.p |
*As a managerial adjustment, the line “Gains (Losses) on financial
assets at fair value through profit or loss” was moved to represent a more accurate view on total “Net Interest Income”
for the periods.
| 13 |