
Q2 2026 EARNINGS CONFERENCE CALL | August 5, 2026
This presentation contains certain “forward-looking statements” with respect to our financial condition, results of operations, profitability, margin growth, business strategies, operating efficiencies or synergies, competitive position, growth opportunities, acquisitions, plans and objectives of management, markets for the Company’s common stock, the impact of legal proceedings, and other matters. Statements in this presentation that are not historical facts are “forward-looking statements” for the purpose of the safe harbor provided by Section 21E of the Securities Exchange Act of 1934, as amended, and Section 27A of the Securities Act of 1933, as amended, and involve a number of risks and uncertainties. Forward-looking statements, including, without limitation, those relating to the Company's 2026 outlook and related assumptions, production levels, future business prospects, net sales, expenses and income (loss), capital expenditures, tax rate, cash flow, financial condition, liquidity, covenant compliance, retail and wholesale demand, integration of acquisitions, R&D investments, commodity prices, addressable markets, industry trends, and the Mergers whenever they occur in this presentation are necessarily estimates reflecting the best judgment of the Company's senior management at the time such statements were made. There are a number of factors, many of which are beyond the Company’s control, which could cause actual results and events to differ materially from those described in the forward-looking statements. These factors include, in addition to other matters described in this presentation, (1) the impacts of costs and availability of, and tariffs on, raw materials (particularly steel and aluminum) and other components, (2) tariff refunds and related pass through to customers, (3) future pandemics, geopolitical tensions, armed conflicts, or natural disasters on the global economy and on the Company's customers, suppliers, team members, business and cash flows, (4) pricing pressures due to domestic and foreign competition, (5) seasonality and cyclicality in the industries to which we sell our products, (6) availability of credit for financing the retail and wholesale purchase of products for which we sell our components, (7) inventory levels of retail dealers and manufacturers, availability of transportation for products for which we sell our components, (8) the financial condition of our customers, (9) the financial condition of retail dealers of products for which we sell our components, (10) retention and concentration of significant customers, (11) the costs, pace of, and successful integration of acquisitions and other growth initiatives, (12) availability and costs of production facilities and labor, team member benefits, team member retention, realization and impact of expansion plans, (13) efficiency improvements and cost reductions, (14) the disruption of business resulting from natural disasters or other unforeseen events, (15) the successful entry into new markets, (16) the costs of compliance with environmental laws, laws of foreign jurisdictions in which we operate, other operational and financial risks related to conducting business internationally, and increased governmental regulation and oversight, (17) information technology performance and security, (18) the ability to protect intellectual property, (19) warranty and product liability claims or product recalls, (20) interest rates, oil and gasoline prices, and availability, the impact of international, national and regional economic conditions and consumer confidence on the retail sale of products for which we sell our components, (21) risks related to our pending transaction (the "Mergers") with Patrick Industries, Inc. ("Patrick"), including (a) the risk that the cost savings and any revenue synergies from the Mergers may not be fully realized or may take longer than anticipated to be realized, (b) disruption to each party’s business as a result of the announcement and pendency of the Mergers, (c) the risk that the integration of each party’s operations will be materially delayed or will be more costly or difficult than expected or that the parties are otherwise unable to successfully integrate as a result of unexpected factors or events, (d) the failure to obtain the necessary approvals by the stockholders of the Company or Patrick, (e) the ability by each of the Company and Patrick to obtain required governmental approvals of the Mergers on the timeline expected, or at all, and the risk that such approvals may result in the imposition of conditions that could adversely affect the combined company or the expected benefits of the Mergers, (f) reputational risk and the reaction of each party’s customers, suppliers, employees or other business partners to the Mergers, (g) the failure of the closing conditions in the Merger Agreement to be satisfied, or any unexpected delay in closing the Mergers or the occurrence of any event, change or other circumstances that could give rise to the termination of the Merger Agreement, (h) the possibility that the Mergers may be more expensive to complete than anticipated, including as a result of unexpected factors or events, (i) risks related to management and oversight of the expanded business and operations of the combined company due to the increased size and complexity, (j) the possibility of increased scrutiny by, and/or additional regulatory requirements of, governmental authorities as a result of the Mergers or the size, scope and complexity of the combined company’s business operations, and (k) the outcome of any legal or regulatory proceedings that may be currently pending or later instituted against the Company, Patrick or the combined company before or after the Mergers, and (22) other risks and uncertainties discussed more fully under the caption "Risk Factors" in the Company's Annual Report on Form 10-K for the year ended December 31, 2025 and in this presentation, and in the Company's subsequent filings with the SEC, including the Company's Quarterly Reports on Form 10-Q. Readers of this presentation are cautioned not to place undue reliance on these forward-looking statements, since there can be no assurance that these forward-looking statements will prove to be accurate. The Company disclaims any obligation or undertaking to update forward- looking statements to reflect circumstances or events that occur after the date the forward-looking statements are made, except as required by law. This presentation includes certain non-GAAP financial measures, such as adjusted net income, adjusted net income per diluted share, adjusted EBITDA, adjusted net sales, adjusted EBITDA as a percentage of adjusted net sales, net debt to adjusted EBITDA leverage, and free cash flow. These non-GAAP financial measures should not be considered a substitute for the comparable GAAP financial measures. Reconciliations of these non-GAAP financial measures to the most directly comparable GAAP financial measure are included in the presentation. This presentation also includes certain forward-looking non-GAAP financial measures, such as forward-looking guidance for adjusted diluted EPS and adjusted operating profit margin. The Company is unable to provide a reconciliation of forward-looking non-GAAP financial measures to their most directly comparable GAAP financial measures because the Company is unable to provide, without unreasonable effort, a meaningful or accurate calculation or estimation of amounts that would be necessary for the reconciliation due to the complexity and inherent difficulty in forecasting and quantifying future amounts or when they may occur. Such unavailable information could be significant to future results. Forward-Looking Statements 2LCI Industries | Q2 2026 Earnings Presentation
Important Information About the Proposed Transaction and Where to Find It In connection with the proposed transaction between the Company and Patrick, the Company and Patrick intend to file relevant materials with the SEC, including, among other filings, a Patrick registration statement on Form S-4 that will include a joint proxy statement of the Company and Patrick that also constitutes a prospectus of Patrick with respect to shares of Patrick’s common stock to be issued in the proposed transaction, and a definitive joint proxy statement/prospectus, which will be mailed to stockholders of the Company and Patrick (the “Joint Proxy Statement/ Prospectus”). The Company and Patrick may also file other documents with the SEC regarding the proposed transaction. This document is not a substitute for the Joint Proxy Statement/ Prospectus or any other document which the Company and Patrick may file with the SEC. INVESTORS AND SECURITY HOLDERS OF THE COMPANY AND PATRICK ARE URGED TO READ THE REGISTRATION STATEMENT AND THE JOINT PROXY STATEMENT/PROSPECTUS AND ANY OTHER DOCUMENTS THAT WILL BE FILED WITH THE SEC, AS WELL AS ANY AMENDMENTS OR SUPPLEMENTS TO THESE DOCUMENTS, CAREFULLY AND IN THEIR ENTIRETY WHEN THEY BECOME AVAILABLE BECAUSE THEY WILL CONTAIN IMPORTANT INFORMATION ABOUT THE PROPOSED TRANSACTION AND RELATED MATTERS. Investors and security holders will be able to obtain free copies of the registration statement and the Joint Proxy Statement/Prospectus (when available) and other documents filed with the SEC by the Company and Patrick through the website maintained by the SEC at http://www.sec.gov. Copies of the documents filed with the SEC by the Company will be available free of charge on Company’s website at lippert.com under the tab “Investors” and under the heading “Financials” and subheading “SEC Filings.” Copies of the documents filed with the SEC by Patrick will be available free of charge on Patrick’s website at patrickind.com under the tab “Investors” and under the heading “SEC Filings.” Certain Information Regarding Participants The Company, Patrick and their respective directors and executive officers may be considered participants in the solicitation of proxies from the stockholders of each of the Company and Patrick in connection with the proposed transaction. Information about the directors and executive officers of the Company and their ownership of Company common stock is set forth in its Annual Report on Form 10-K for the year ended December 31, 2025, which was filed with the SEC on February 26, 2026 and its proxy statement for its 2026 annual meeting, which was filed with the SEC on March 27, 2026. Information about the directors and executive officers of Patrick and their ownership of Patrick common stock is set forth in its Annual Report on Form 10-K for the year ended December 31, 2025, which was filed with the SEC on February 19, 2026 and its proxy statement for its 2026 annual meeting, which was filed with the SEC on March 30, 2026. To the extent holdings of Company’s or Patrick’s securities by its directors or executive officers have changed since the amounts set forth in such filings, such changes have been or will be reflected on Initial Statements of Beneficial Ownership on Form 3 or Statements of Beneficial Ownership on Form 4 filed with the SEC. Information about the directors and executive officers of the Company and Patrick, including a description of their direct or indirect interests, by security holdings or otherwise, and other information regarding the potential participants in the proxy solicitations, which may be different than those of the Company’s stockholders and Patrick’s stockholders generally, will be contained in the Joint Proxy Statement/Prospectus and other relevant materials to be filed with the SEC regarding the proposed transaction. You may obtain these documents (when they become available) free of charge through the website maintained by the SEC at http:// www.sec.gov and from Company’s or Patrick’s website as described above. No Offer or Solicitation This press release does not constitute an offer to sell or the solicitation of an offer to buy or exchange any securities or a solicitation of any vote or approval in any jurisdiction, nor shall there be any sale, issuance or transfer of securities in any jurisdiction in which such offer, solicitation or sale would be unlawful prior to registration or qualification under the securities laws of any such jurisdiction. It does not constitute a prospectus or prospectus equivalent document. No offering or sale of securities shall be made except by means of a prospectus meeting the requirements of Section 10 of the Securities Act of 1933, as amended, and otherwise in accordance with applicable law. Important Disclosures 3LCI Industries | Q2 2026 Earnings Presentation
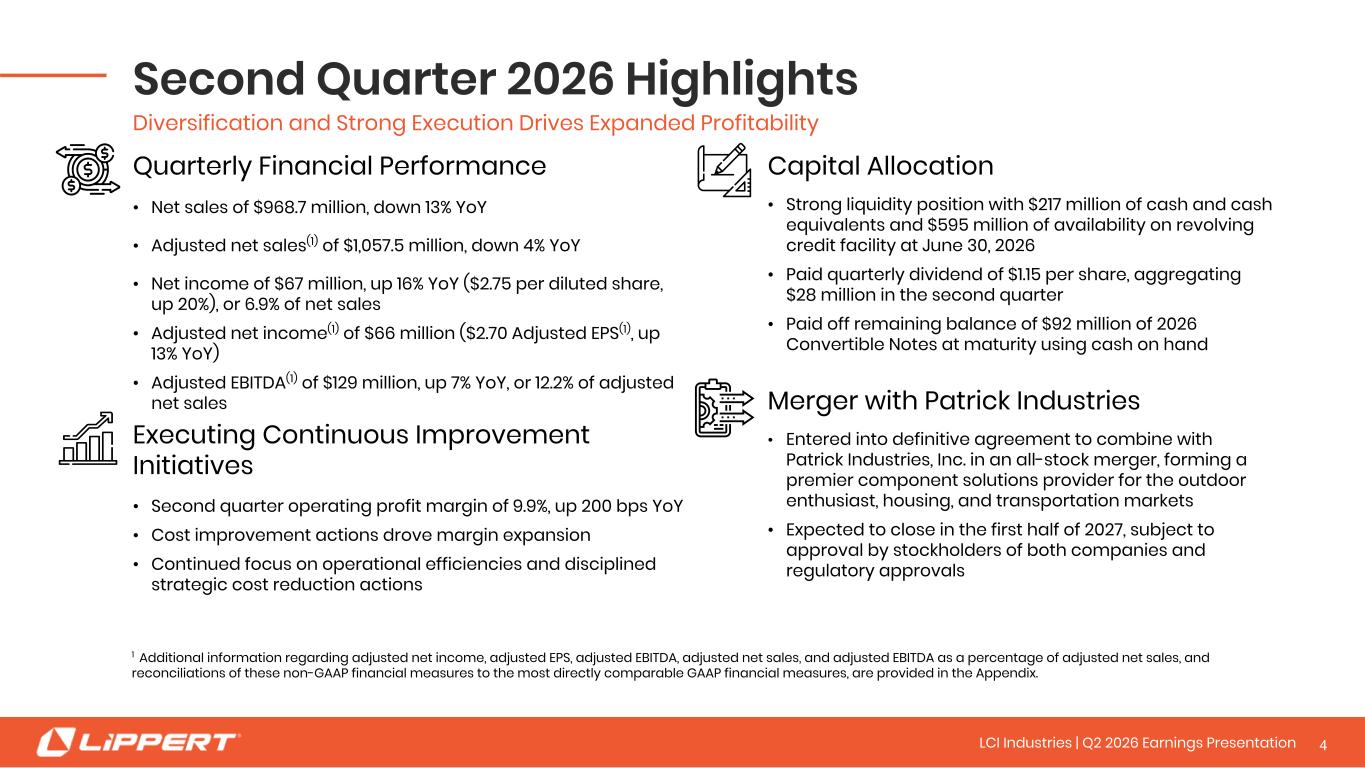
Diversification and Strong Execution Drives Expanded Profitability Executing Continuous Improvement Initiatives • Second quarter operating profit margin of 9.9%, up 200 bps YoY • Cost improvement actions drove margin expansion • Continued focus on operational efficiencies and disciplined strategic cost reduction actions Quarterly Financial Performance • Net sales of $968.7 million, down 13% YoY • Adjusted net sales(1) of $1,057.5 million, down 4% YoY • Net income of $67 million, up 16% YoY ($2.75 per diluted share, up 20%), or 6.9% of net sales • Adjusted net income(1) of $66 million ($2.70 Adjusted EPS(1), up 13% YoY) • Adjusted EBITDA(1) of $129 million, up 7% YoY, or 12.2% of adjusted net sales 1 Additional information regarding adjusted net income, adjusted EPS, adjusted EBITDA, adjusted net sales, and adjusted EBITDA as a percentage of adjusted net sales, and reconciliations of these non-GAAP financial measures to the most directly comparable GAAP financial measures, are provided in the Appendix. Capital Allocation • Strong liquidity position with $217 million of cash and cash equivalents and $595 million of availability on revolving credit facility at June 30, 2026 • Paid quarterly dividend of $1.15 per share, aggregating $28 million in the second quarter • Paid off remaining balance of $92 million of 2026 Convertible Notes at maturity using cash on hand Second Quarter 2026 Highlights 4LCI Industries | Q2 2026 Earnings Presentation Merger with Patrick Industries • Entered into definitive agreement to combine with Patrick Industries, Inc. in an all-stock merger, forming a premier component solutions provider for the outdoor enthusiast, housing, and transportation markets • Expected to close in the first half of 2027, subject to approval by stockholders of both companies and regulatory approvals

Results by Market 5 OEM Segment • RV • Transportation • Marine • Housing Aftermarket Segment
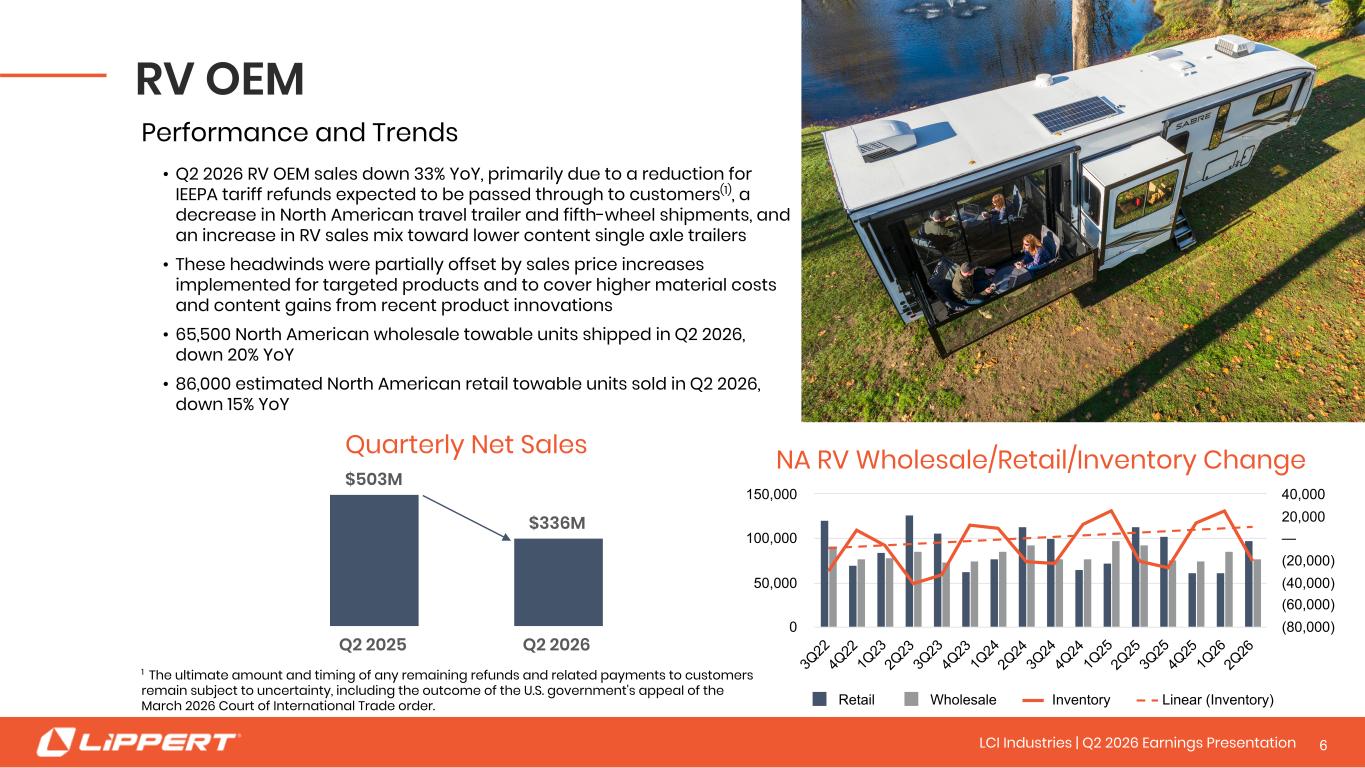
RV OEM Performance and Trends • Q2 2026 RV OEM sales down 33% YoY, primarily due to a reduction for IEEPA tariff refunds expected to be passed through to customers(1), a decrease in North American travel trailer and fifth-wheel shipments, and an increase in RV sales mix toward lower content single axle trailers • These headwinds were partially offset by sales price increases implemented for targeted products and to cover higher material costs and content gains from recent product innovations • 65,500 North American wholesale towable units shipped in Q2 2026, down 20% YoY • 86,000 estimated North American retail towable units sold in Q2 2026, down 15% YoY Quarterly Net Sales $503M $336M Q2 2025 Q2 2026 NA RV Wholesale/Retail/Inventory Change Retail Wholesale Inventory Linear (Inventory) 3Q 22 4Q 22 1Q 23 2Q 23 3Q 23 4Q 23 1Q 24 2Q 24 3Q 24 4Q 24 1Q 25 2Q 25 3Q 25 4Q 25 1Q 26 2Q 26 0 50,000 100,000 150,000 (80,000) (60,000) (40,000) (20,000) — 20,000 40,000 6LCI Industries | Q2 2026 Earnings Presentation 1 The ultimate amount and timing of any remaining refunds and related payments to customers remain subject to uncertainty, including the outcome of the U.S. government's appeal of the March 2026 Court of International Trade order.
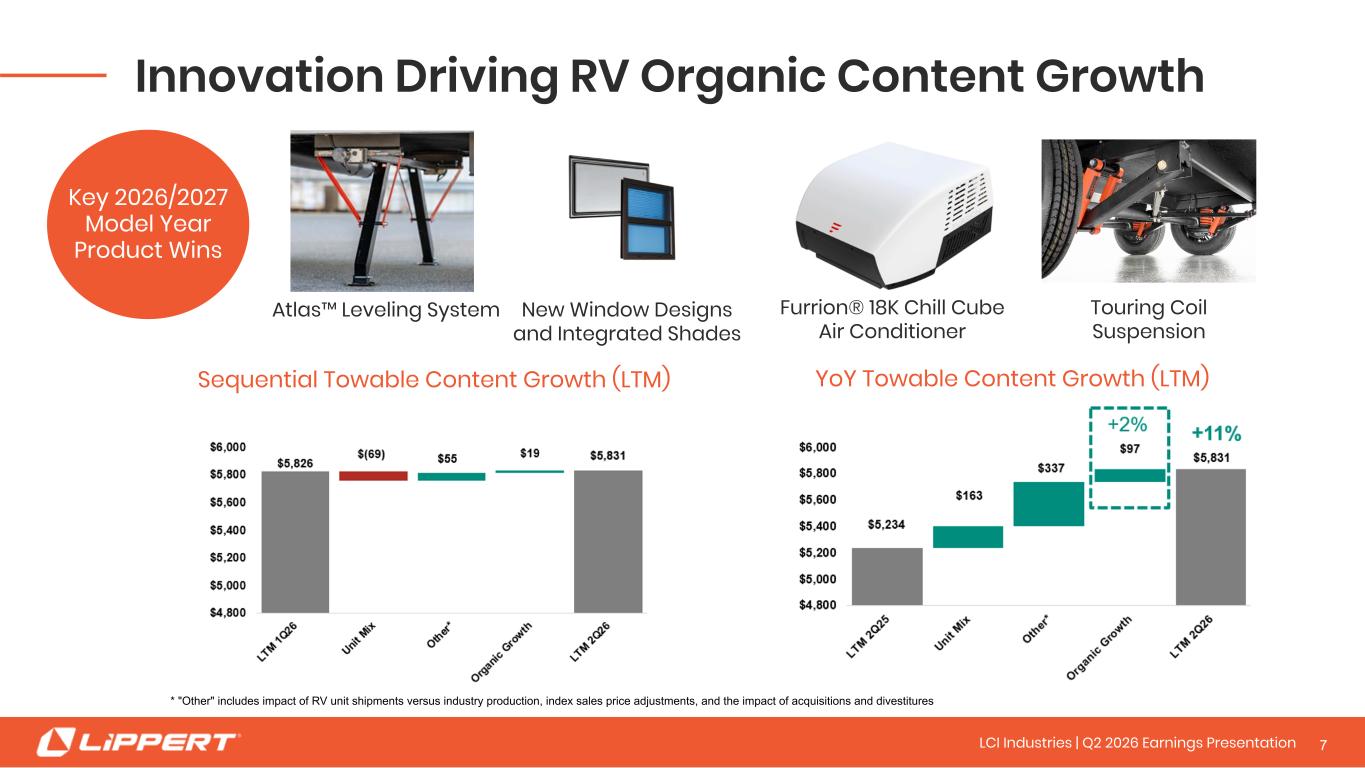
Touring Coil Suspension Furrion® 18K Chill Cube Air Conditioner * "Other" includes impact of RV unit shipments versus industry production, index sales price adjustments, and the impact of acquisitions and divestitures New Window Designs and Integrated Shades Innovation Driving RV Organic Content Growth YoY Towable Content Growth (LTM) Key 2026/2027 Model Year Product Wins Atlas™ Leveling System 7LCI Industries | Q2 2026 Earnings Presentation Sequential Towable Content Growth (LTM)
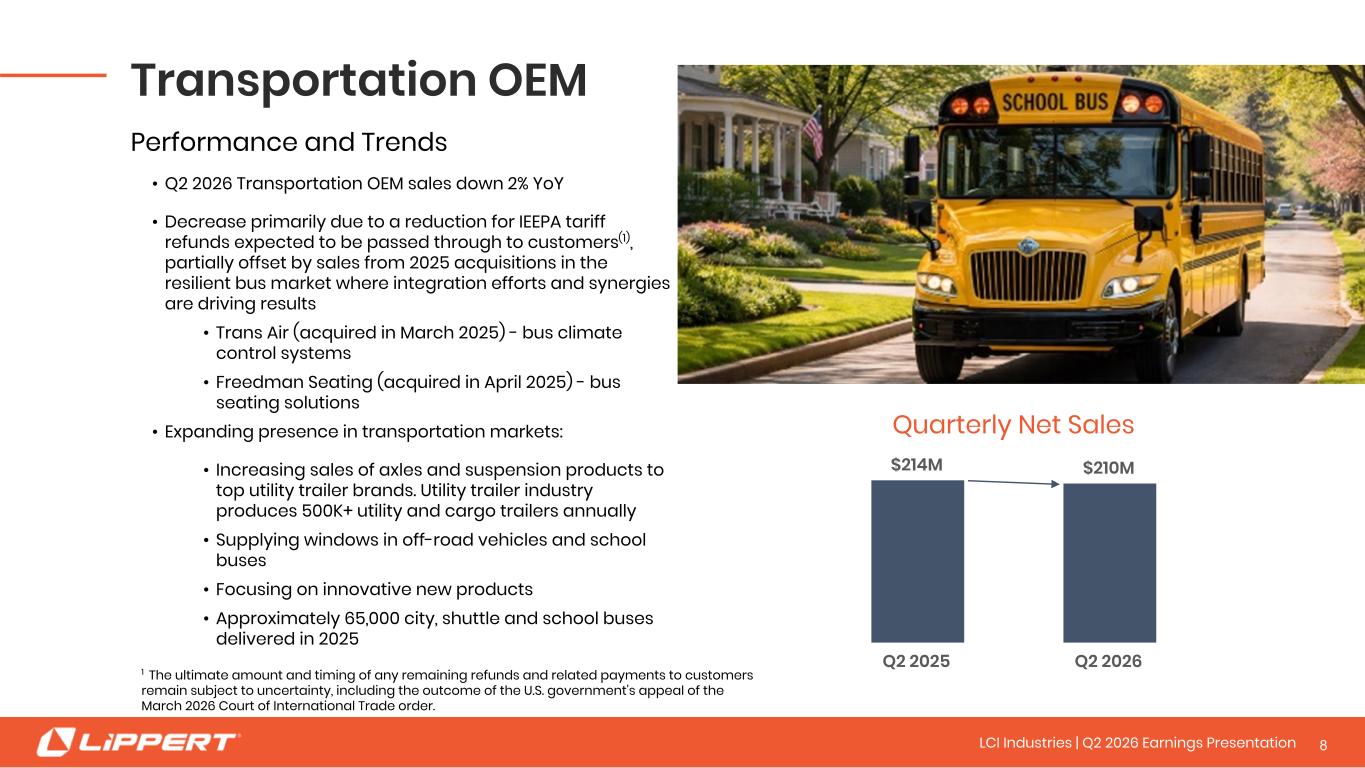
Transportation OEM Performance and Trends • Q2 2026 Transportation OEM sales down 2% YoY • Decrease primarily due to a reduction for IEEPA tariff refunds expected to be passed through to customers(1), partially offset by sales from 2025 acquisitions in the resilient bus market where integration efforts and synergies are driving results • Trans Air (acquired in March 2025) - bus climate control systems • Freedman Seating (acquired in April 2025) - bus seating solutions • Expanding presence in transportation markets: • Increasing sales of axles and suspension products to top utility trailer brands. Utility trailer industry produces 500K+ utility and cargo trailers annually • Supplying windows in off-road vehicles and school buses • Focusing on innovative new products • Approximately 65,000 city, shuttle and school buses delivered in 2025 Quarterly Net Sales $214M $210M Q2 2025 Q2 2026 8LCI Industries | Q2 2026 Earnings Presentation 1 The ultimate amount and timing of any remaining refunds and related payments to customers remain subject to uncertainty, including the outcome of the U.S. government's appeal of the March 2026 Court of International Trade order.
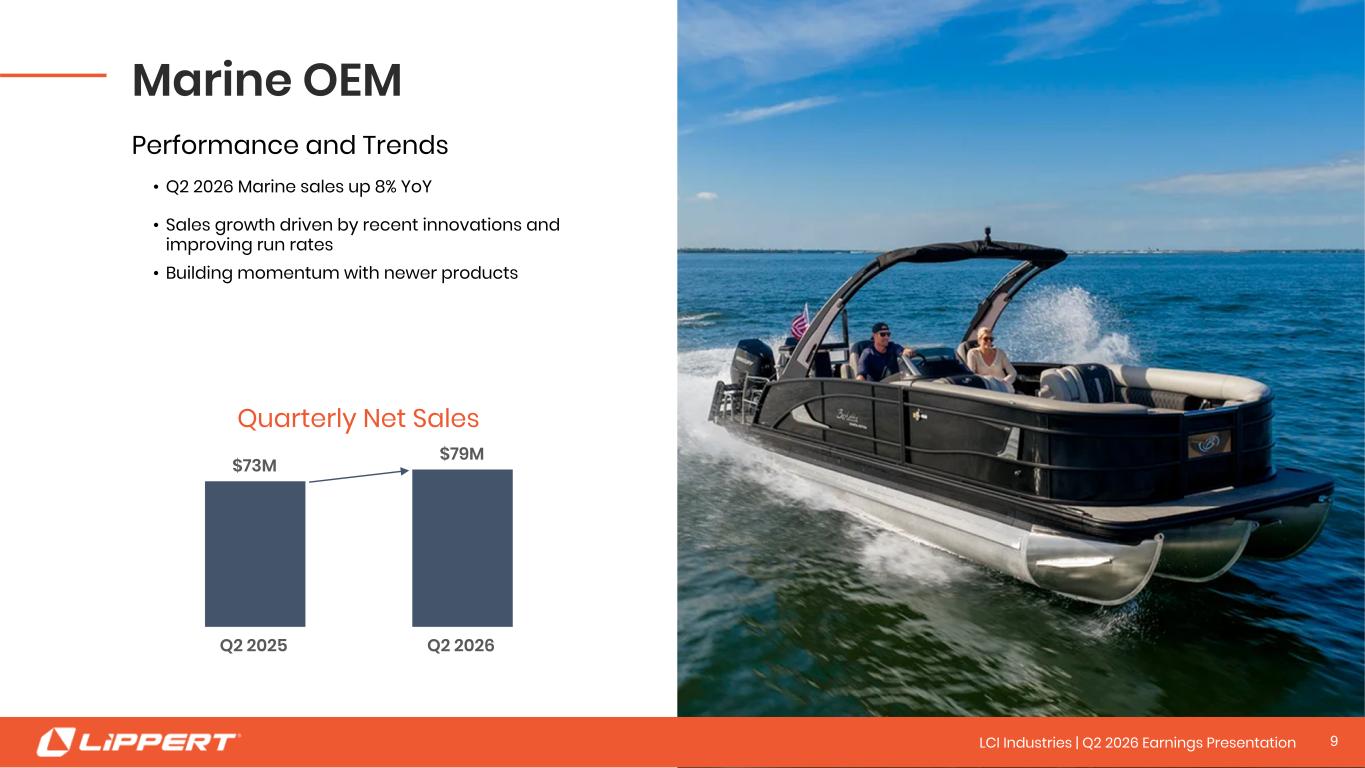
9 Marine OEM Performance and Trends • Q2 2026 Marine sales up 8% YoY • Sales growth driven by recent innovations and improving run rates • Building momentum with newer products Quarterly Net Sales $73M $79M Q2 2025 Q2 2026 9 9LCI Industries | Q2 2026 Earnings Presentation
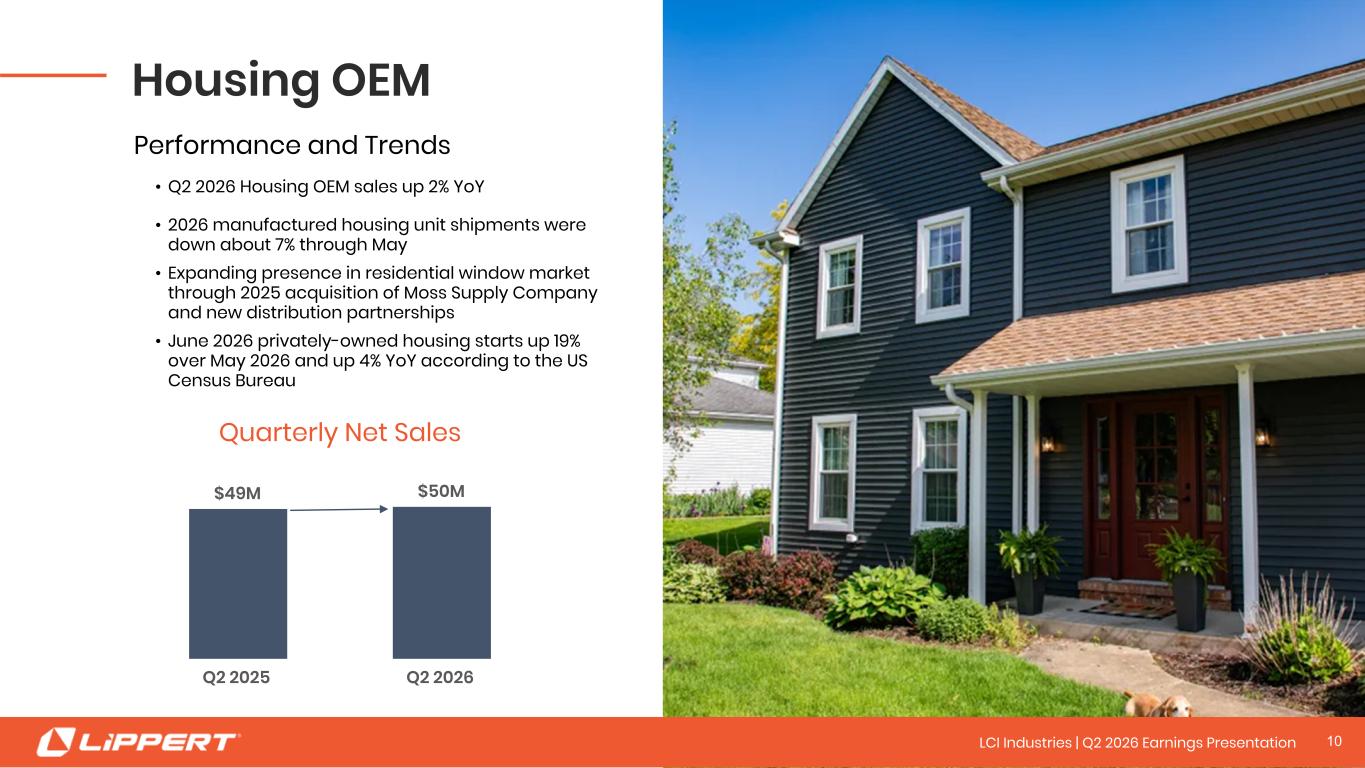
10 Housing OEM Performance and Trends • Q2 2026 Housing OEM sales up 2% YoY • 2026 manufactured housing unit shipments were down about 7% through May • Expanding presence in residential window market through 2025 acquisition of Moss Supply Company and new distribution partnerships • June 2026 privately-owned housing starts up 19% over May 2026 and up 4% YoY according to the US Census Bureau $49M $50M Q2 2025 Q2 2026 Quarterly Net Sales 1010LCI Industries | Q2 2026 Earnings Presentation
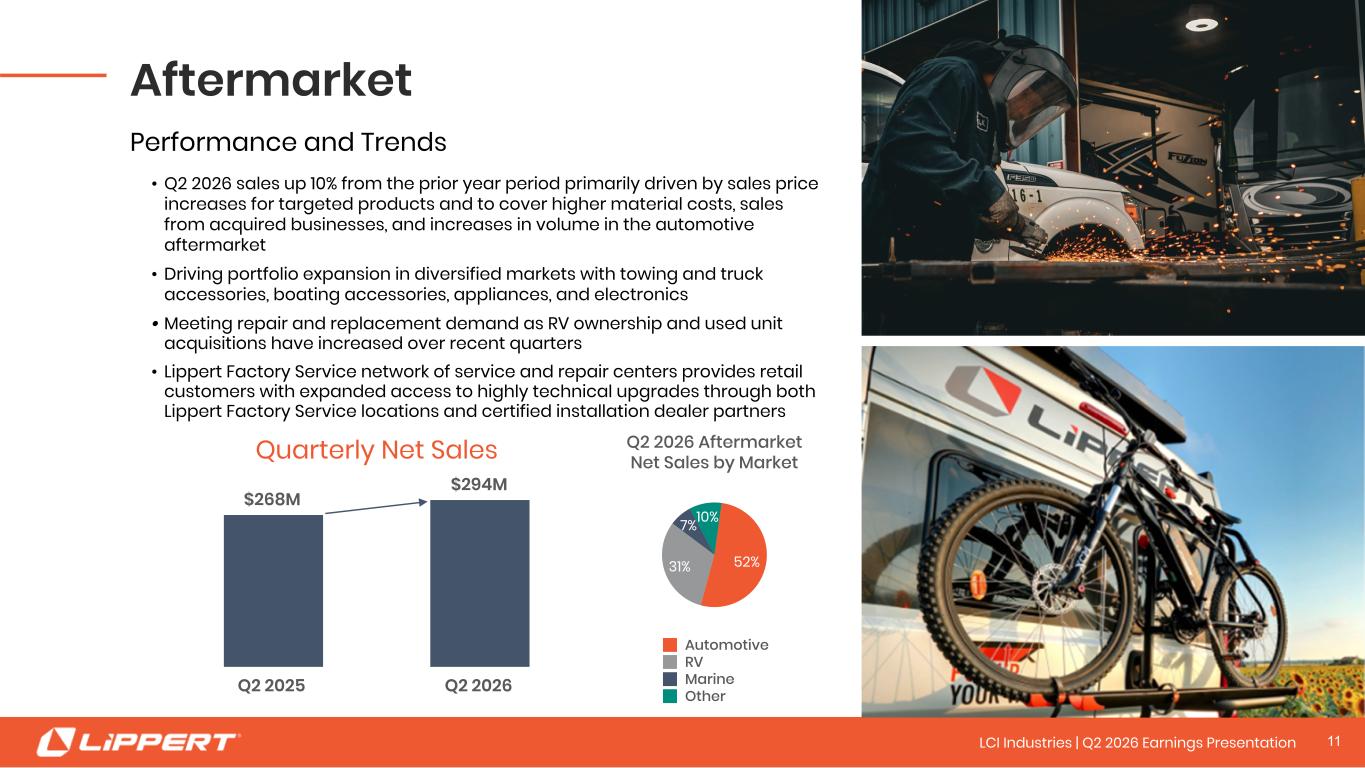
11 Aftermarket Performance and Trends • Q2 2026 sales up 10% from the prior year period primarily driven by sales price increases for targeted products and to cover higher material costs, sales from acquired businesses, and increases in volume in the automotive aftermarket • Driving portfolio expansion in diversified markets with towing and truck accessories, boating accessories, appliances, and electronics • Meeting repair and replacement demand as RV ownership and used unit acquisitions have increased over recent quarters • Lippert Factory Service network of service and repair centers provides retail customers with expanded access to highly technical upgrades through both Lippert Factory Service locations and certified installation dealer partners Quarterly Net Sales $268M $294M Q2 2025 Q2 2026 Q2 2026 Aftermarket Net Sales by Market 52%31% 7%10% Automotive RV Marine Other 1111LCI Industries | Q2 2026 Earnings Presentation

Consolidated Results 12
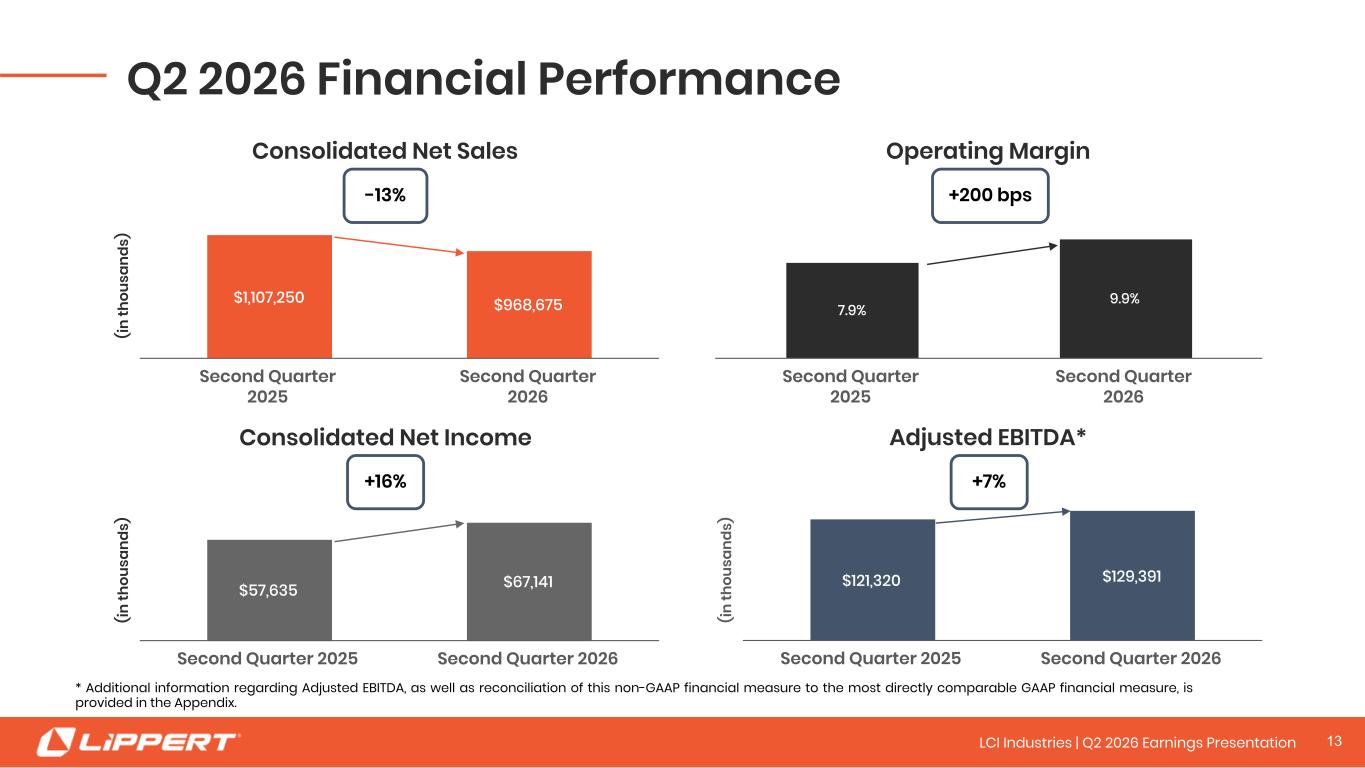
13 Q2 2026 Financial Performance Operating Margin 7.9% 9.9% Second Quarter 2025 Second Quarter 2026 (in th ou sa nd s) Consolidated Net Income $57,635 $67,141 Second Quarter 2025 Second Quarter 2026 (in th ou sa nd s) Adjusted EBITDA* $121,320 $129,391 Second Quarter 2025 Second Quarter 2026 * Additional information regarding Adjusted EBITDA, as well as reconciliation of this non-GAAP financial measure to the most directly comparable GAAP financial measure, is provided in the Appendix. (in th ou sa nd s) Consolidated Net Sales $1,107,250 $968,675 Second Quarter 2025 Second Quarter 2026 -13% +200 bps +7%+16% 1313LCI Industries | Q2 2026 Earnings Presentation
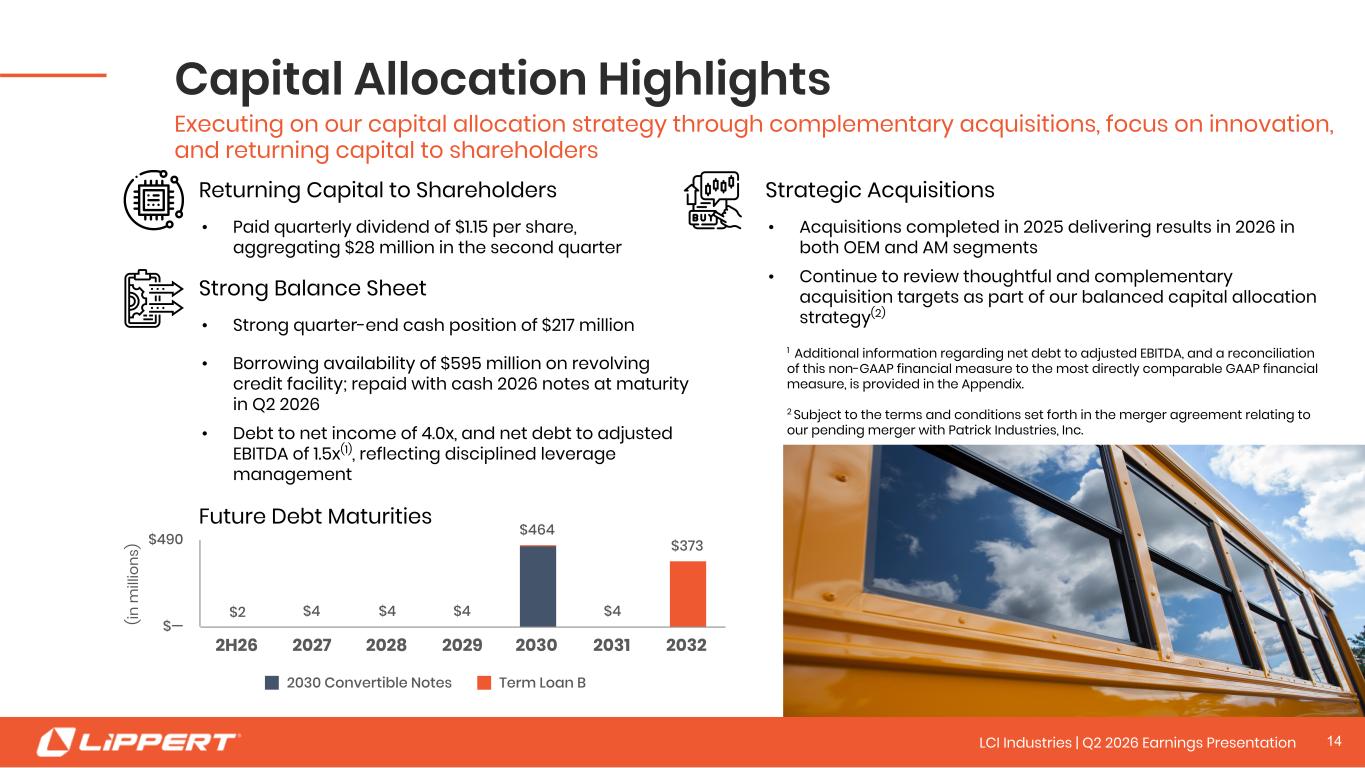
14 Strategic Acquisitions • Acquisitions completed in 2025 delivering results in 2026 in both OEM and AM segments • Continue to review thoughtful and complementary acquisition targets as part of our balanced capital allocation strategy(2) Capital Allocation Highlights Executing on our capital allocation strategy through complementary acquisitions, focus on innovation, and returning capital to shareholders (in m ill io ns ) $2 $4 $4 $4 $464 $4 $373 2030 Convertible Notes Term Loan B 2H26 2027 2028 2029 2030 2031 2032 $— $490 Future Debt Maturities Strong Balance Sheet • Strong quarter-end cash position of $217 million • Borrowing availability of $595 million on revolving credit facility; repaid with cash 2026 notes at maturity in Q2 2026 • Debt to net income of 4.0x, and net debt to adjusted EBITDA of 1.5x(1), reflecting disciplined leverage management 1 Additional information regarding net debt to adjusted EBITDA, and a reconciliation of this non-GAAP financial measure to the most directly comparable GAAP financial measure, is provided in the Appendix. 2 Subject to the terms and conditions set forth in the merger agreement relating to our pending merger with Patrick Industries, Inc. 14 Returning Capital to Shareholders • Paid quarterly dividend of $1.15 per share, aggregating $28 million in the second quarter 14LCI Industries | Q2 2026 Earnings Presentation
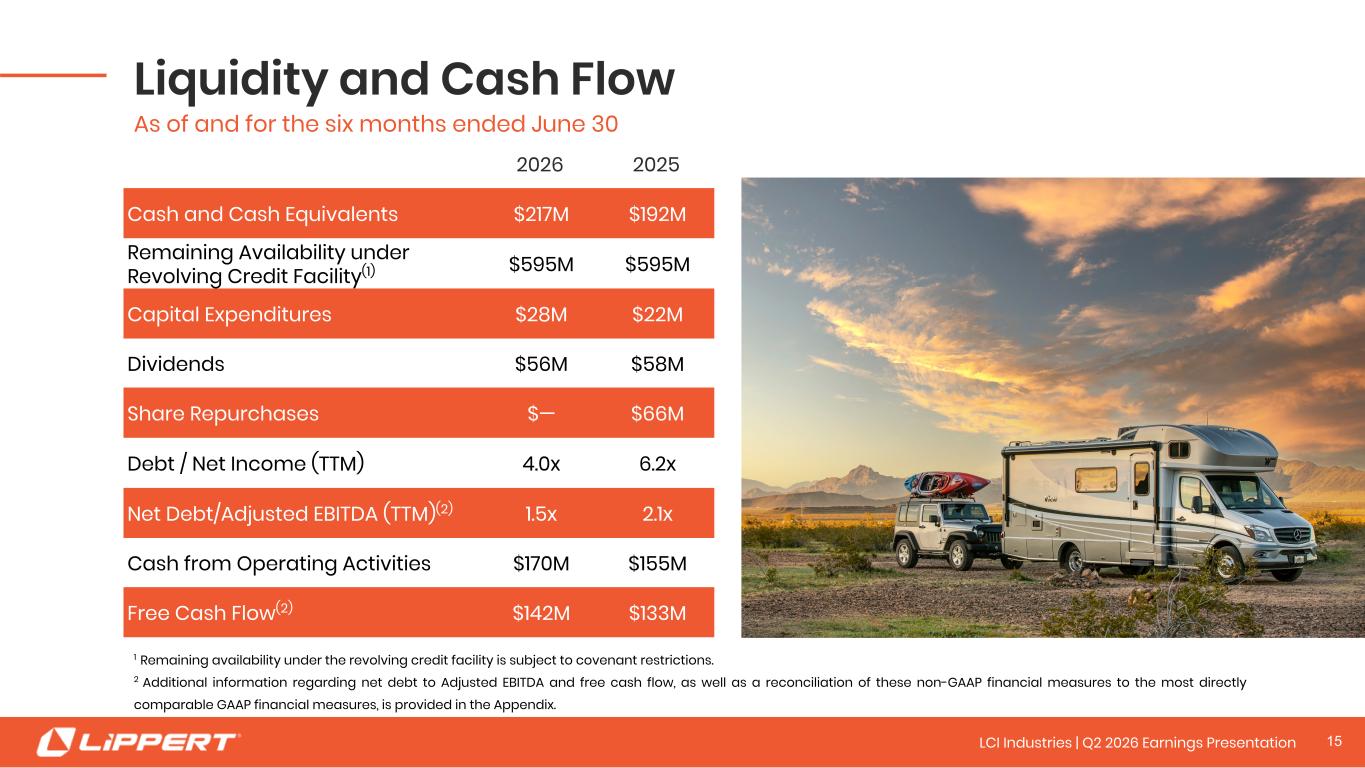
15 Liquidity and Cash Flow As of and for the six months ended June 30 2026 2025 Cash and Cash Equivalents $217M $192M Remaining Availability under Revolving Credit Facility(1) $595M $595M Capital Expenditures $28M $22M Dividends $56M $58M Share Repurchases $— $66M Debt / Net Income (TTM) 4.0x 6.2x Net Debt/Adjusted EBITDA (TTM)(2) 1.5x 2.1x Cash from Operating Activities $170M $155M Free Cash Flow(2) $142M $133M 1 Remaining availability under the revolving credit facility is subject to covenant restrictions. 2 Additional information regarding net debt to Adjusted EBITDA and free cash flow, as well as a reconciliation of these non-GAAP financial measures to the most directly comparable GAAP financial measures, is provided in the Appendix. 1515LCI Industries | Q2 2026 Earnings Presentation

2026 Outlook 16
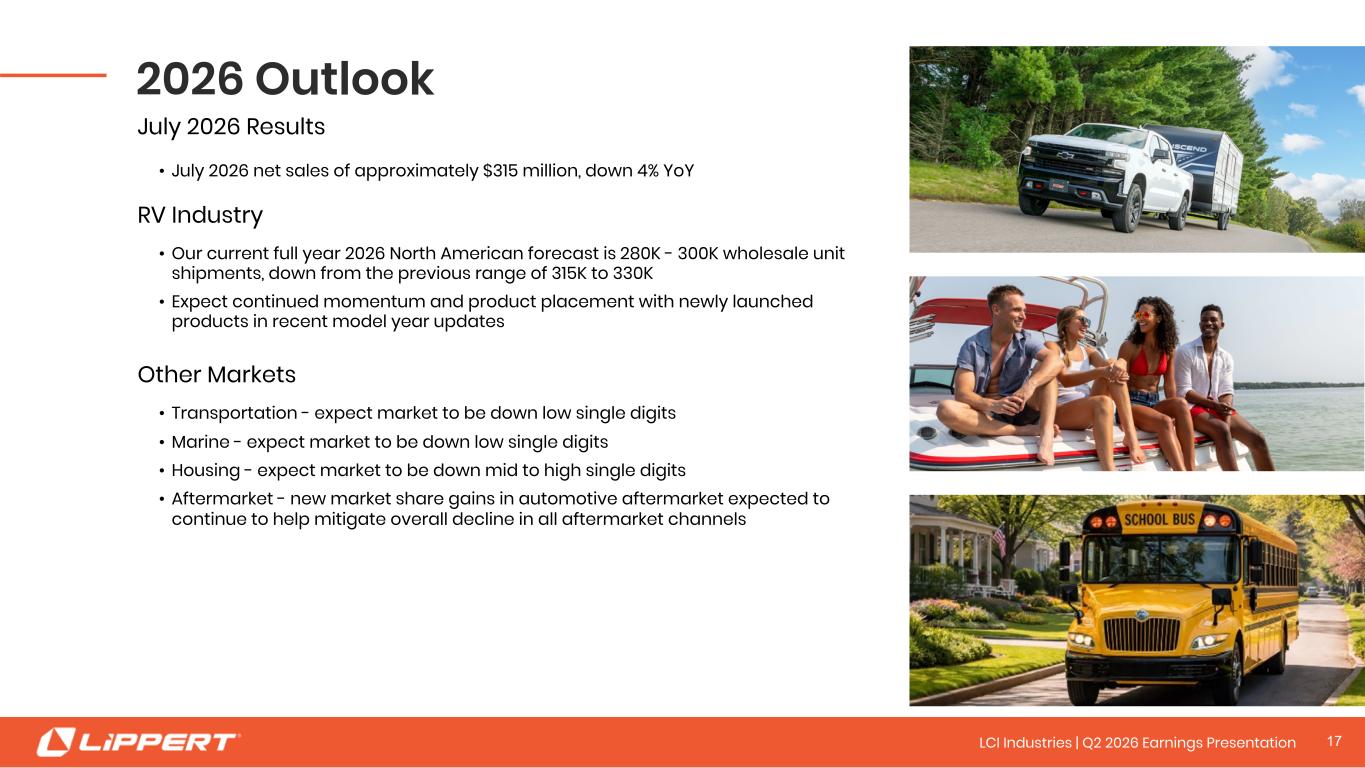
17 2026 Outlook RV Industry • Our current full year 2026 North American forecast is 280K - 300K wholesale unit shipments, down from the previous range of 315K to 330K • Expect continued momentum and product placement with newly launched products in recent model year updates Other Markets • Transportation - expect market to be down low single digits • Marine - expect market to be down low single digits • Housing - expect market to be down mid to high single digits • Aftermarket - new market share gains in automotive aftermarket expected to continue to help mitigate overall decline in all aftermarket channels July 2026 Results • July 2026 net sales of approximately $315 million, down 4% YoY 1717LCI Industries | Q2 2026 Earnings Presentation
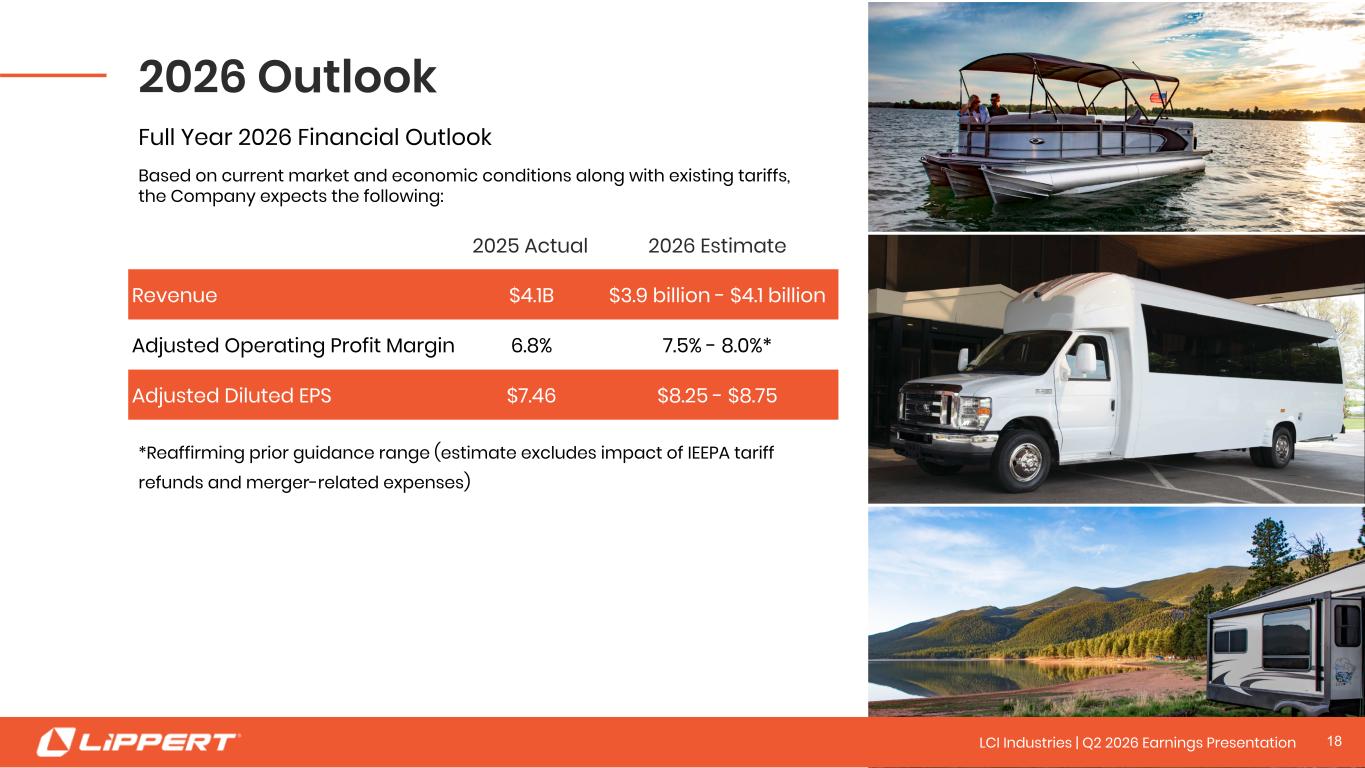
Full Year 2026 Financial Outlook Based on current market and economic conditions along with existing tariffs, the Company expects the following: 2026 Outlook 2025 Actual 2026 Estimate Revenue $4.1B $3.9 billion - $4.1 billion Adjusted Operating Profit Margin 6.8% 7.5% - 8.0%* Adjusted Diluted EPS $7.46 $8.25 - $8.75 18 1818LCI Industries | Q2 2026 Earnings Presentation *Reaffirming prior guidance range (estimate excludes impact of IEEPA tariff refunds and merger-related expenses)

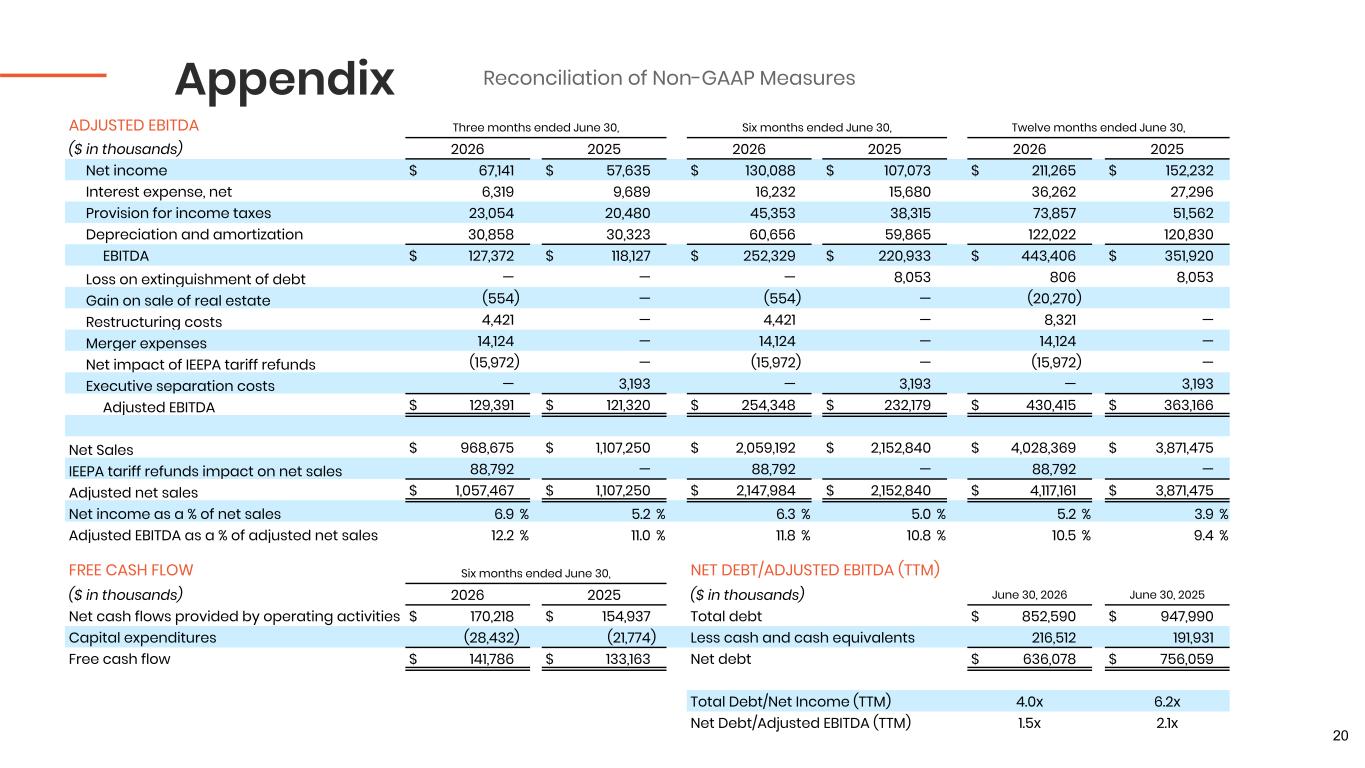
20 Appendix Reconciliation of Non-GAAP Measures ADJUSTED EBITDA Three months ended June 30, Six months ended June 30, Twelve months ended June 30, ($ in thousands) 2026 2025 2026 2025 2026 2025 Net income $ 67,141 $ 57,635 $ 130,088 $ 107,073 $ 211,265 $ 152,232 Interest expense, net 6,319 9,689 16,232 15,680 36,262 27,296 Provision for income taxes 23,054 20,480 45,353 38,315 73,857 51,562 Depreciation and amortization 30,858 30,323 60,656 59,865 122,022 120,830 EBITDA $ 127,372 $ 118,127 $ 252,329 $ 220,933 $ 443,406 $ 351,920 Loss on extinguishment of debt — — — 8,053 806 8,053 Gain on sale of real estate (554) — (554) — (20,270) Restructuring costs 4,421 — 4,421 — 8,321 — Merger expenses 14,124 — 14,124 — 14,124 — Net impact of IEEPA tariff refunds (15,972) — (15,972) — (15,972) — Executive separation costs — 3,193 — 3,193 — 3,193 Adjusted EBITDA $ 129,391 $ 121,320 $ 254,348 $ 232,179 $ 430,415 $ 363,166 Net Sales $ 968,675 $ 1,107,250 $ 2,059,192 $ 2,152,840 $ 4,028,369 $ 3,871,475 IEEPA tariff refunds impact on net sales 88,792 — 88,792 — 88,792 — Adjusted net sales $ 1,057,467 $ 1,107,250 $ 2,147,984 $ 2,152,840 $ 4,117,161 $ 3,871,475 Net income as a % of net sales 6.9 % 5.2 % 6.3 % 5.0 % 5.2 % 3.9 % Adjusted EBITDA as a % of adjusted net sales 12.2 % 11.0 % 11.8 % 10.8 % 10.5 % 9.4 % FREE CASH FLOW Six months ended June 30, NET DEBT/ADJUSTED EBITDA (TTM) ($ in thousands) 2026 2025 ($ in thousands) June 30, 2026 June 30, 2025 Net cash flows provided by operating activities $ 170,218 $ 154,937 Total debt $ 852,590 $ 947,990 Capital expenditures (28,432) (21,774) Less cash and cash equivalents 216,512 191,931 Free cash flow $ 141,786 $ 133,163 Net debt $ 636,078 $ 756,059 Total Debt/Net Income (TTM) 4.0x 6.2x Net Debt/Adjusted EBITDA (TTM) 1.5x 2.1x
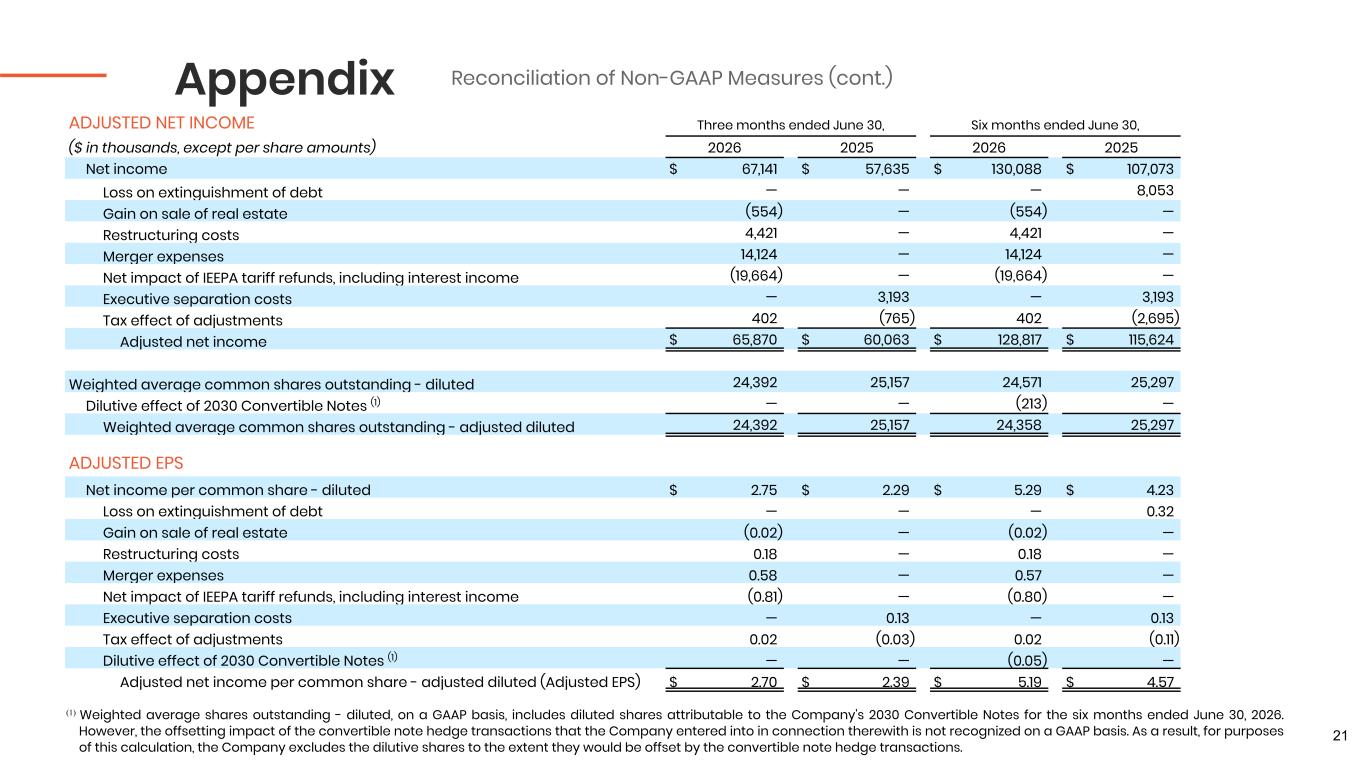
21 Appendix Reconciliation of Non-GAAP Measures (cont.) ADJUSTED NET INCOME Three months ended June 30, Six months ended June 30, ($ in thousands, except per share amounts) 2026 2025 2026 2025 Net income $ 67,141 $ 57,635 $ 130,088 $ 107,073 Loss on extinguishment of debt — — — 8,053 Gain on sale of real estate (554) — (554) — Restructuring costs 4,421 — 4,421 — Merger expenses 14,124 — 14,124 — Net impact of IEEPA tariff refunds, including interest income (19,664) — (19,664) — Executive separation costs — 3,193 — 3,193 Tax effect of adjustments 402 (765) 402 (2,695) Adjusted net income $ 65,870 $ 60,063 $ 128,817 $ 115,624 Weighted average common shares outstanding - diluted 24,392 25,157 24,571 25,297 Dilutive effect of 2030 Convertible Notes (1) — — (213) — Weighted average common shares outstanding - adjusted diluted 24,392 25,157 24,358 25,297 ADJUSTED EPS Net income per common share - diluted $ 2.75 $ 2.29 $ 5.29 $ 4.23 Loss on extinguishment of debt — — — 0.32 Gain on sale of real estate (0.02) — (0.02) — Restructuring costs 0.18 — 0.18 — Merger expenses 0.58 — 0.57 — Net impact of IEEPA tariff refunds, including interest income (0.81) — (0.80) — Executive separation costs — 0.13 — 0.13 Tax effect of adjustments 0.02 (0.03) 0.02 (0.11) Dilutive effect of 2030 Convertible Notes (1) — — (0.05) — Adjusted net income per common share - adjusted diluted (Adjusted EPS) $ 2.70 $ 2.39 $ 5.19 $ 4.57 (1) Weighted average shares outstanding - diluted, on a GAAP basis, includes diluted shares attributable to the Company's 2030 Convertible Notes for the six months ended June 30, 2026. However, the offsetting impact of the convertible note hedge transactions that the Company entered into in connection therewith is not recognized on a GAAP basis. As a result, for purposes of this calculation, the Company excludes the dilutive shares to the extent they would be offset by the convertible note hedge transactions.
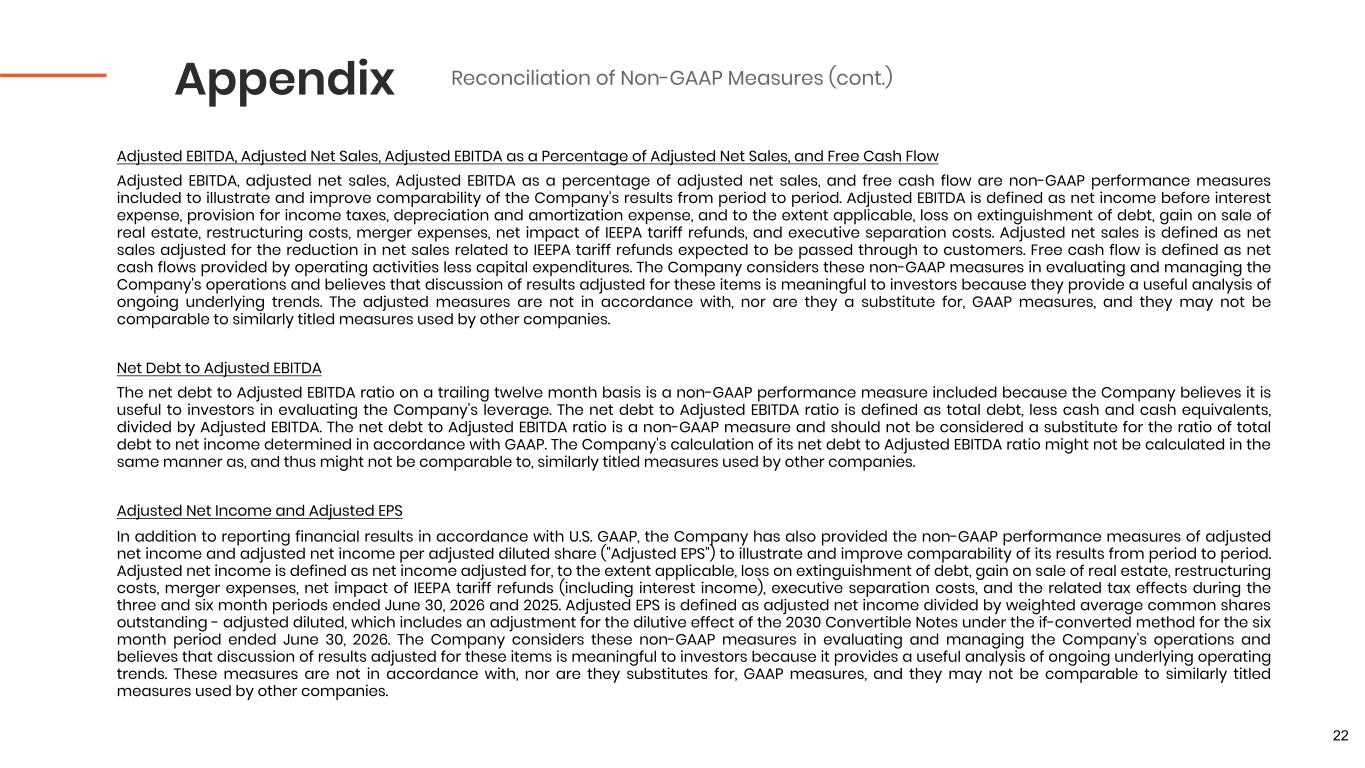
22 Appendix Reconciliation of Non-GAAP Measures (cont.) Adjusted EBITDA, Adjusted Net Sales, Adjusted EBITDA as a Percentage of Adjusted Net Sales, and Free Cash Flow Adjusted EBITDA, adjusted net sales, Adjusted EBITDA as a percentage of adjusted net sales, and free cash flow are non-GAAP performance measures included to illustrate and improve comparability of the Company's results from period to period. Adjusted EBITDA is defined as net income before interest expense, provision for income taxes, depreciation and amortization expense, and to the extent applicable, loss on extinguishment of debt, gain on sale of real estate, restructuring costs, merger expenses, net impact of IEEPA tariff refunds, and executive separation costs. Adjusted net sales is defined as net sales adjusted for the reduction in net sales related to IEEPA tariff refunds expected to be passed through to customers. Free cash flow is defined as net cash flows provided by operating activities less capital expenditures. The Company considers these non-GAAP measures in evaluating and managing the Company's operations and believes that discussion of results adjusted for these items is meaningful to investors because they provide a useful analysis of ongoing underlying trends. The adjusted measures are not in accordance with, nor are they a substitute for, GAAP measures, and they may not be comparable to similarly titled measures used by other companies. Net Debt to Adjusted EBITDA The net debt to Adjusted EBITDA ratio on a trailing twelve month basis is a non-GAAP performance measure included because the Company believes it is useful to investors in evaluating the Company's leverage. The net debt to Adjusted EBITDA ratio is defined as total debt, less cash and cash equivalents, divided by Adjusted EBITDA. The net debt to Adjusted EBITDA ratio is a non-GAAP measure and should not be considered a substitute for the ratio of total debt to net income determined in accordance with GAAP. The Company's calculation of its net debt to Adjusted EBITDA ratio might not be calculated in the same manner as, and thus might not be comparable to, similarly titled measures used by other companies. Adjusted Net Income and Adjusted EPS In addition to reporting financial results in accordance with U.S. GAAP, the Company has also provided the non-GAAP performance measures of adjusted net income and adjusted net income per adjusted diluted share ("Adjusted EPS") to illustrate and improve comparability of its results from period to period. Adjusted net income is defined as net income adjusted for, to the extent applicable, loss on extinguishment of debt, gain on sale of real estate, restructuring costs, merger expenses, net impact of IEEPA tariff refunds (including interest income), executive separation costs, and the related tax effects during the three and six month periods ended June 30, 2026 and 2025. Adjusted EPS is defined as adjusted net income divided by weighted average common shares outstanding - adjusted diluted, which includes an adjustment for the dilutive effect of the 2030 Convertible Notes under the if-converted method for the six month period ended June 30, 2026. The Company considers these non-GAAP measures in evaluating and managing the Company's operations and believes that discussion of results adjusted for these items is meaningful to investors because it provides a useful analysis of ongoing underlying operating trends. These measures are not in accordance with, nor are they substitutes for, GAAP measures, and they may not be comparable to similarly titled measures used by other companies.
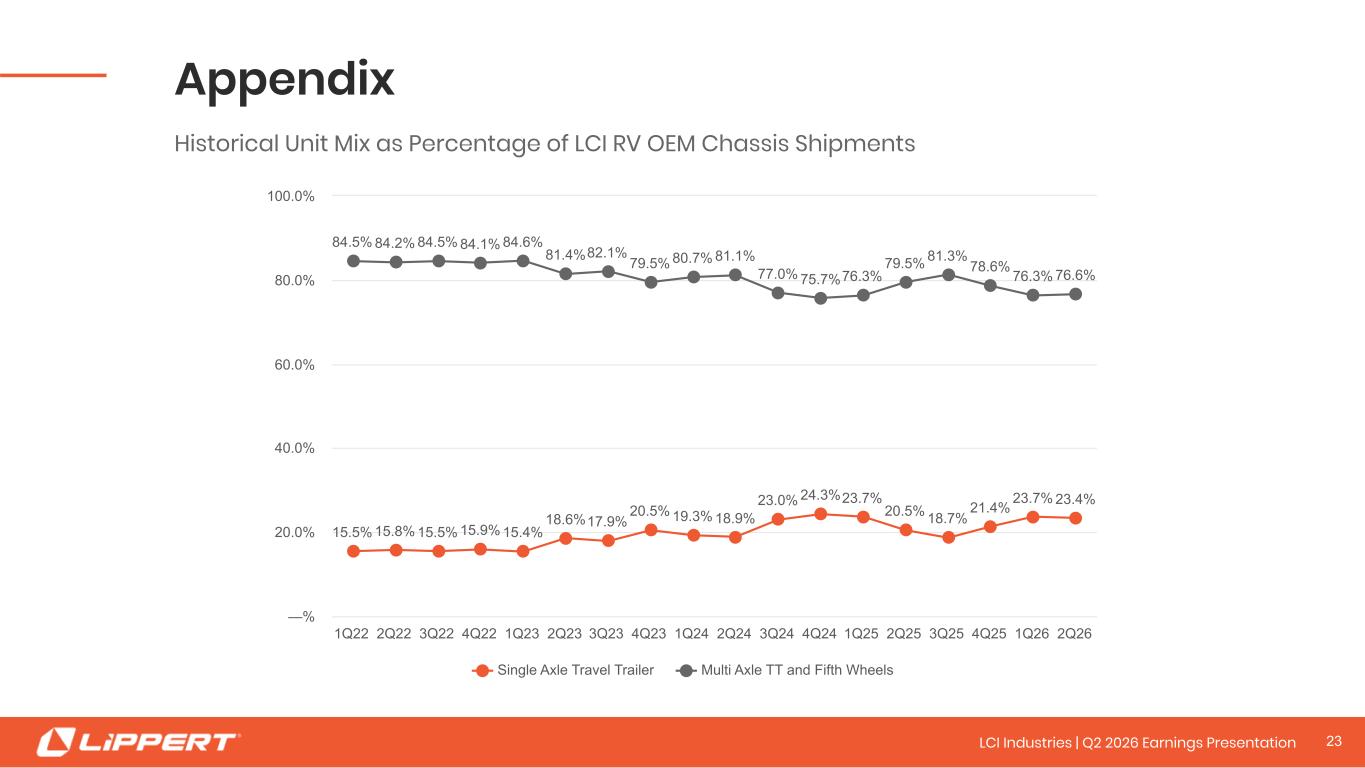
23 Appendix Historical Unit Mix as Percentage of LCI RV OEM Chassis Shipments 15.5% 15.8% 15.5% 15.9% 15.4% 18.6%17.9% 20.5% 19.3% 18.9% 23.0% 24.3%23.7% 20.5% 18.7% 21.4% 23.7% 23.4% 84.5% 84.2% 84.5% 84.1% 84.6% 81.4%82.1% 79.5% 80.7% 81.1% 77.0% 75.7%76.3% 79.5% 81.3% 78.6% 76.3% 76.6% Single Axle Travel Trailer Multi Axle TT and Fifth Wheels 1Q22 2Q22 3Q22 4Q22 1Q23 2Q23 3Q23 4Q23 1Q24 2Q24 3Q24 4Q24 1Q25 2Q25 3Q25 4Q25 1Q26 2Q26 —% 20.0% 40.0% 60.0% 80.0% 100.0% 2323LCI Industries | Q2 2026 Earnings Presentation
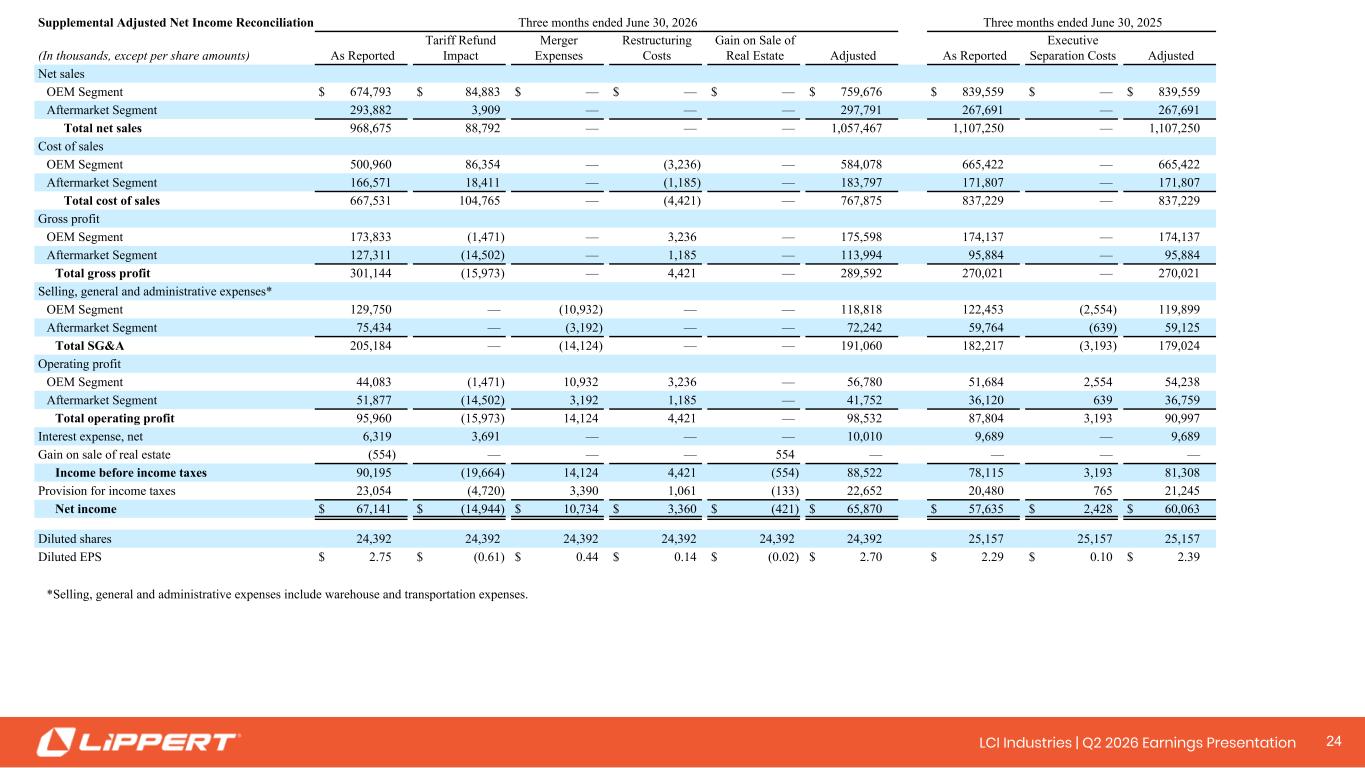
24 2424LCI Industries | Q2 2026 Earnings Presentation Supplemental Adjusted Net Income Reconciliation Three months ended June 30, 2026 Three months ended June 30, 2025 (In thousands, except per share amounts) As Reported Tariff Refund Impact Merger Expenses Restructuring Costs Gain on Sale of Real Estate Adjusted As Reported Executive Separation Costs Adjusted Net sales OEM Segment $ 674,793 $ 84,883 $ — $ — $ — $ 759,676 $ 839,559 $ — $ 839,559 Aftermarket Segment 293,882 3,909 — — — 297,791 267,691 — 267,691 Total net sales 968,675 88,792 — — — 1,057,467 1,107,250 — 1,107,250 Cost of sales OEM Segment 500,960 86,354 — (3,236) — 584,078 665,422 — 665,422 Aftermarket Segment 166,571 18,411 — (1,185) — 183,797 171,807 — 171,807 Total cost of sales 667,531 104,765 — (4,421) — 767,875 837,229 — 837,229 Gross profit OEM Segment 173,833 (1,471) — 3,236 — 175,598 174,137 — 174,137 Aftermarket Segment 127,311 (14,502) — 1,185 — 113,994 95,884 — 95,884 Total gross profit 301,144 (15,973) — 4,421 — 289,592 270,021 — 270,021 Selling, general and administrative expenses* OEM Segment 129,750 — (10,932) — — 118,818 122,453 (2,554) 119,899 Aftermarket Segment 75,434 — (3,192) — — 72,242 59,764 (639) 59,125 Total SG&A 205,184 — (14,124) — — 191,060 182,217 (3,193) 179,024 Operating profit OEM Segment 44,083 (1,471) 10,932 3,236 — 56,780 51,684 2,554 54,238 Aftermarket Segment 51,877 (14,502) 3,192 1,185 — 41,752 36,120 639 36,759 Total operating profit 95,960 (15,973) 14,124 4,421 — 98,532 87,804 3,193 90,997 Interest expense, net 6,319 3,691 — — — 10,010 9,689 — 9,689 Gain on sale of real estate (554) — — — 554 — — — — Income before income taxes 90,195 (19,664) 14,124 4,421 (554) 88,522 78,115 3,193 81,308 Provision for income taxes 23,054 (4,720) 3,390 1,061 (133) 22,652 20,480 765 21,245 Net income $ 67,141 $ (14,944) $ 10,734 $ 3,360 $ (421) $ 65,870 $ 57,635 $ 2,428 $ 60,063 Diluted shares 24,392 24,392 24,392 24,392 24,392 24,392 25,157 25,157 25,157 Diluted EPS $ 2.75 $ (0.61) $ 0.44 $ 0.14 $ (0.02) $ 2.70 $ 2.29 $ 0.10 $ 2.39 *Selling, general and administrative expenses include warehouse and transportation expenses.
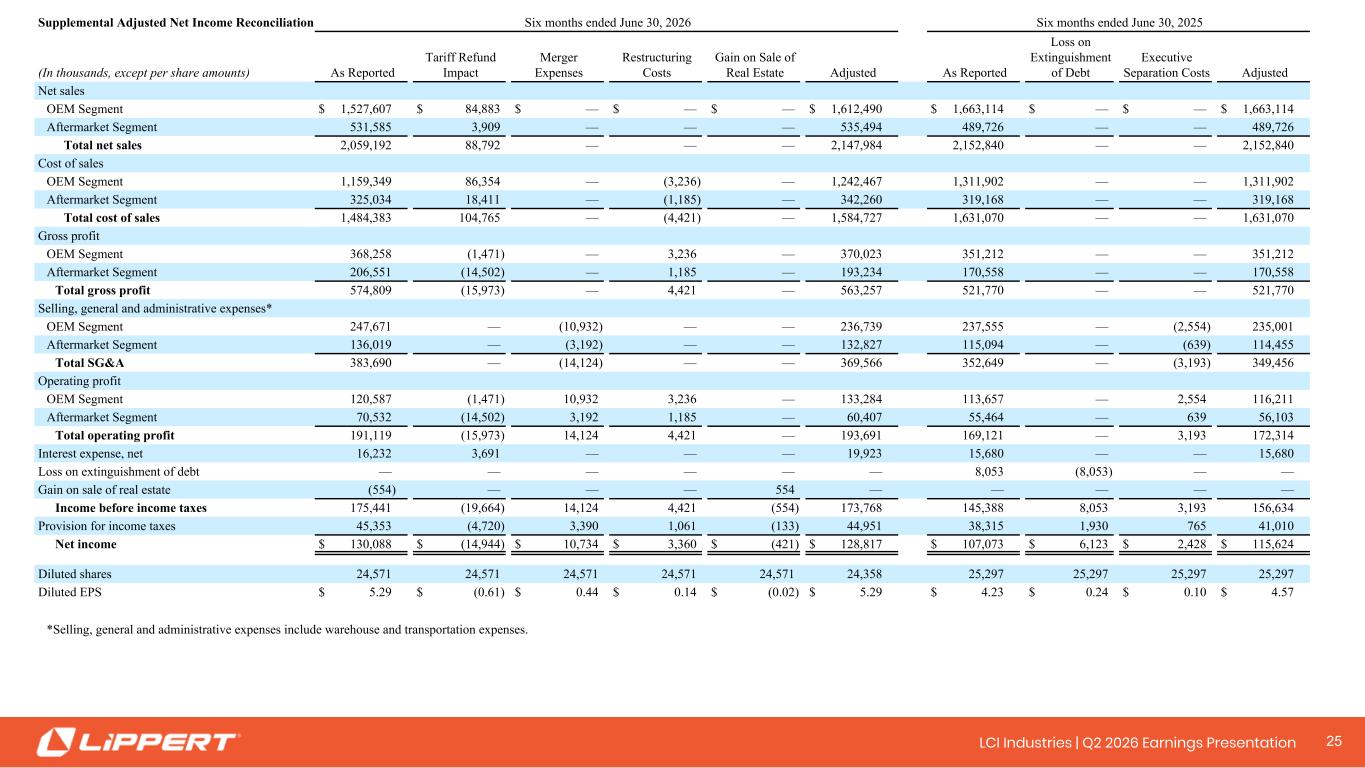
25 2525LCI Industries | Q2 2026 Earnings Presentation Supplemental Adjusted Net Income Reconciliation Six months ended June 30, 2026 Six months ended June 30, 2025 (In thousands, except per share amounts) As Reported Tariff Refund Impact Merger Expenses Restructuring Costs Gain on Sale of Real Estate Adjusted As Reported Loss on Extinguishment of Debt Executive Separation Costs Adjusted Net sales OEM Segment $ 1,527,607 $ 84,883 $ — $ — $ — $ 1,612,490 $ 1,663,114 $ — $ — $ 1,663,114 Aftermarket Segment 531,585 3,909 — — — 535,494 489,726 — — 489,726 Total net sales 2,059,192 88,792 — — — 2,147,984 2,152,840 — — 2,152,840 Cost of sales OEM Segment 1,159,349 86,354 — (3,236) — 1,242,467 1,311,902 — — 1,311,902 Aftermarket Segment 325,034 18,411 — (1,185) — 342,260 319,168 — — 319,168 Total cost of sales 1,484,383 104,765 — (4,421) — 1,584,727 1,631,070 — — 1,631,070 Gross profit OEM Segment 368,258 (1,471) — 3,236 — 370,023 351,212 — — 351,212 Aftermarket Segment 206,551 (14,502) — 1,185 — 193,234 170,558 — — 170,558 Total gross profit 574,809 (15,973) — 4,421 — 563,257 521,770 — — 521,770 Selling, general and administrative expenses* OEM Segment 247,671 — (10,932) — — 236,739 237,555 — (2,554) 235,001 Aftermarket Segment 136,019 — (3,192) — — 132,827 115,094 — (639) 114,455 Total SG&A 383,690 — (14,124) — — 369,566 352,649 — (3,193) 349,456 Operating profit OEM Segment 120,587 (1,471) 10,932 3,236 — 133,284 113,657 — 2,554 116,211 Aftermarket Segment 70,532 (14,502) 3,192 1,185 — 60,407 55,464 — 639 56,103 Total operating profit 191,119 (15,973) 14,124 4,421 — 193,691 169,121 — 3,193 172,314 Interest expense, net 16,232 3,691 — — — 19,923 15,680 — — 15,680 Loss on extinguishment of debt — — — — — — 8,053 (8,053) — — Gain on sale of real estate (554) — — — 554 — — — — — Income before income taxes 175,441 (19,664) 14,124 4,421 (554) 173,768 145,388 8,053 3,193 156,634 Provision for income taxes 45,353 (4,720) 3,390 1,061 (133) 44,951 38,315 1,930 765 41,010 Net income $ 130,088 $ (14,944) $ 10,734 $ 3,360 $ (421) $ 128,817 $ 107,073 $ 6,123 $ 2,428 $ 115,624 Diluted shares 24,571 24,571 24,571 24,571 24,571 24,358 25,297 25,297 25,297 25,297 Diluted EPS $ 5.29 $ (0.61) $ 0.44 $ 0.14 $ (0.02) $ 5.29 $ 4.23 $ 0.24 $ 0.10 $ 4.57 *Selling, general and administrative expenses include warehouse and transportation expenses.