Diodes Incorporated (DIOD) SECOND QUARTER 2026 FINANCIAL RESULTS August 5, 2026 Exhibit 99.2
Safe Harbor Statement Safe Harbor Statement Under the Private Securities Litigation Reform Act of 1995: Any statements set forth above that are not historical facts are forward-looking statements that involve risks and uncertainties that could cause actual results to differ materially from those in the forward-looking statements. Such statements include statements containing forward-looking words such as “expect,” “anticipate,” “aim,” “estimate,” and variations thereof, including without limitation statements, whether direct or implied, regarding expectations of that for the third quarter of 2026, we expect revenue to be approximately $510 million plus or minus 3 percent; we expect GAAP gross margin to be 35.0 percent, plus or minus 1 percent; and non-GAAP adjusted EPS to be $1.05, plus or minus $0.10. Potential risks and uncertainties include, but are not limited to, such factors as: the risk that such expectations may not be met; the risk that the expected benefits of acquisitions may not be realized or that integration of acquired businesses may not continue as rapidly as we anticipate; the risk that we may not be able to maintain our current growth strategy or continue to maintain our current performance, costs, and loadings in our manufacturing facilities; the risk that we may not be able to increase our automotive, industrial, or other revenue and market share; risks of domestic and foreign operations, including excessive operating costs, labor shortages, higher tax rates, and our joint venture prospects; the risks of cyclical downturns in the semiconductor industry and of changes in end-market demand or product mix that may affect gross margin or render inventory obsolete; the risk of unfavorable currency exchange rates; the risk that our future outlook or guidance may be incorrect; the risks of global economic weakness or instability in global financial markets; the risks of trade restrictions, tariffs, or embargoes; the risk of breaches of our information technology systems; and other information, including the “Risk Factors” detailed from time to time in Diodes’ filings with the United States Securities and Exchange Commission. This presentation also contains non-GAAP measures. See the Company’s press release on August 5, 2026, titled, “Diodes Incorporated Reports Second Quarter 2026 Financial Results” for detailed information related to the Company’s non-GAAP measures and a reconciliation of GAAP net income to non-GAAP net income.
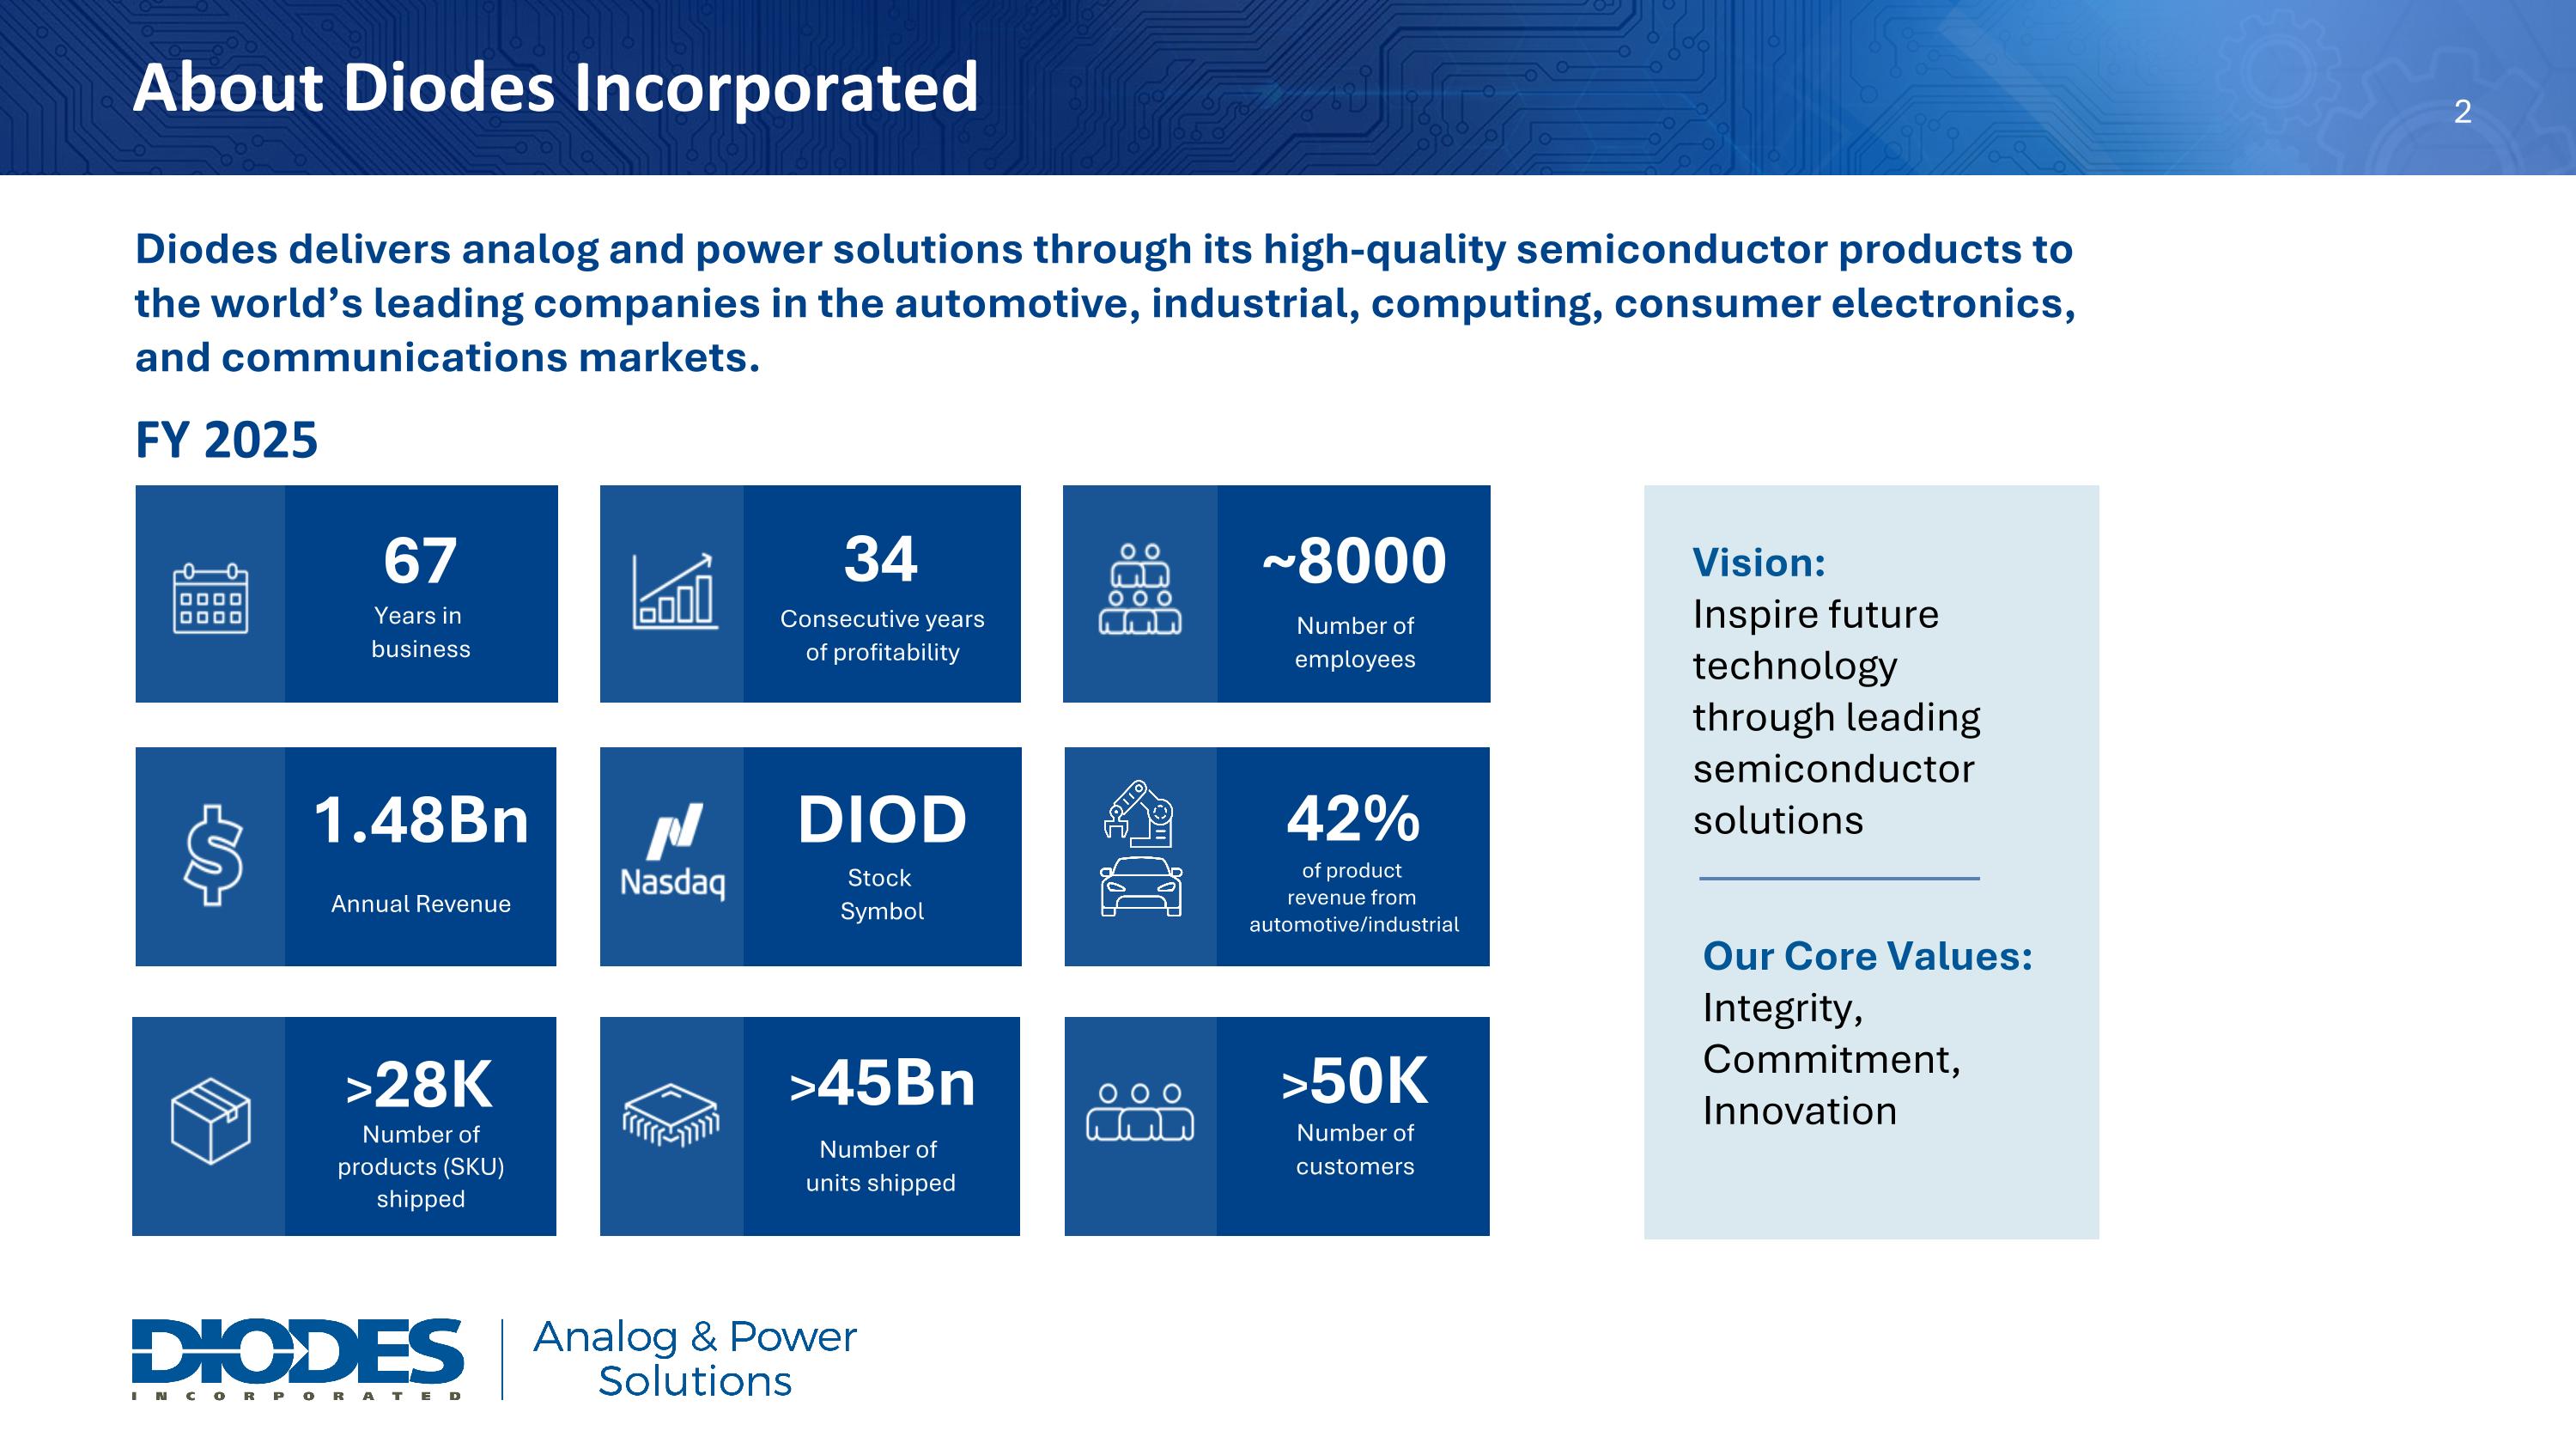
About Diodes Incorporated Diodes delivers analog and power solutions through its high-quality semiconductor products to the world’s leading companies in the automotive, industrial, computing, consumer electronics, and communications markets. Vision: Inspire future technology through leading semiconductor solutions Our Core Values: Integrity, Commitment, Innovation 67 Years in business 34 Consecutive years of profitability ~8000 Number of employees 1.48Bn Annual Revenue >45Bn >28K Number of products (SKU) shipped >50K Number of customers 42% of product revenue from automotive/industrial Stock Symbol Number of units shipped DIOD FY 2025
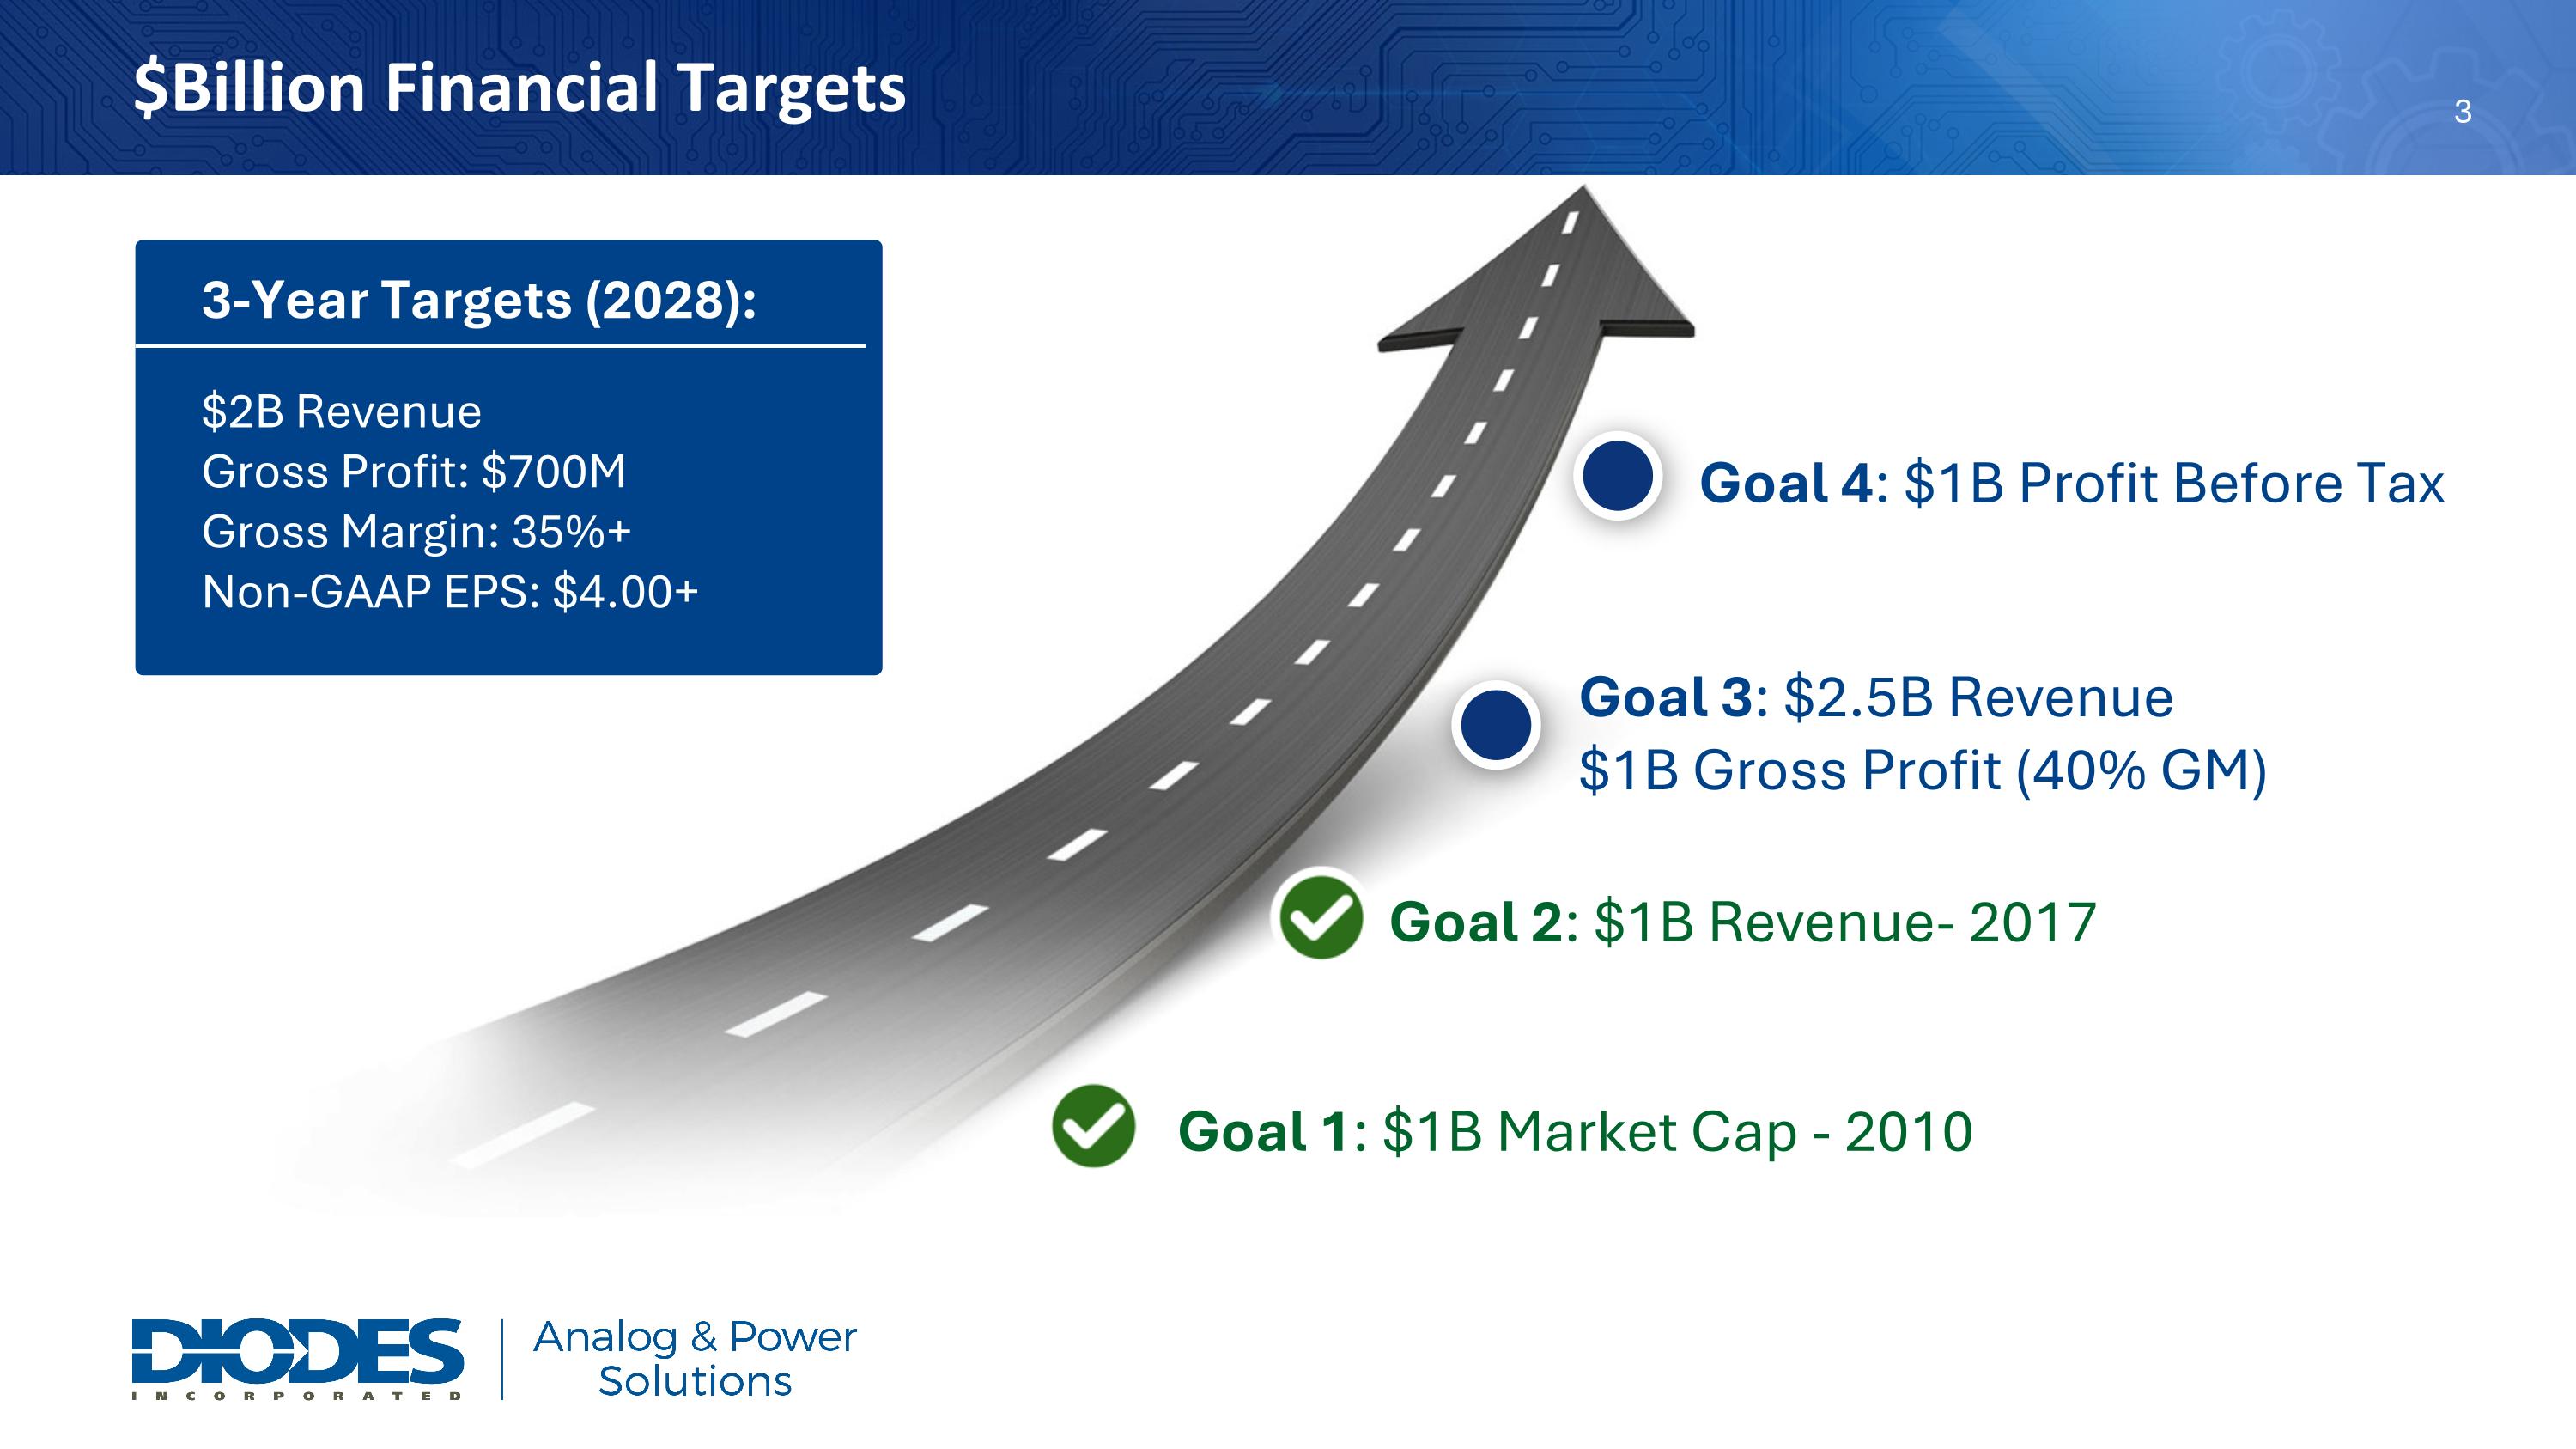
$Billion Financial Targets Goal 1: $1B Market Cap - 2010 Goal 2: $1B Revenue- 2017 Goal 3: $2.5B Revenue $1B Gross Profit (40% GM) Goal 4: $1B Profit Before Tax 3-Year Targets (2028): $2B Revenue Gross Profit: $700M Gross Margin: 35%+ Non-GAAP EPS: $4.00+
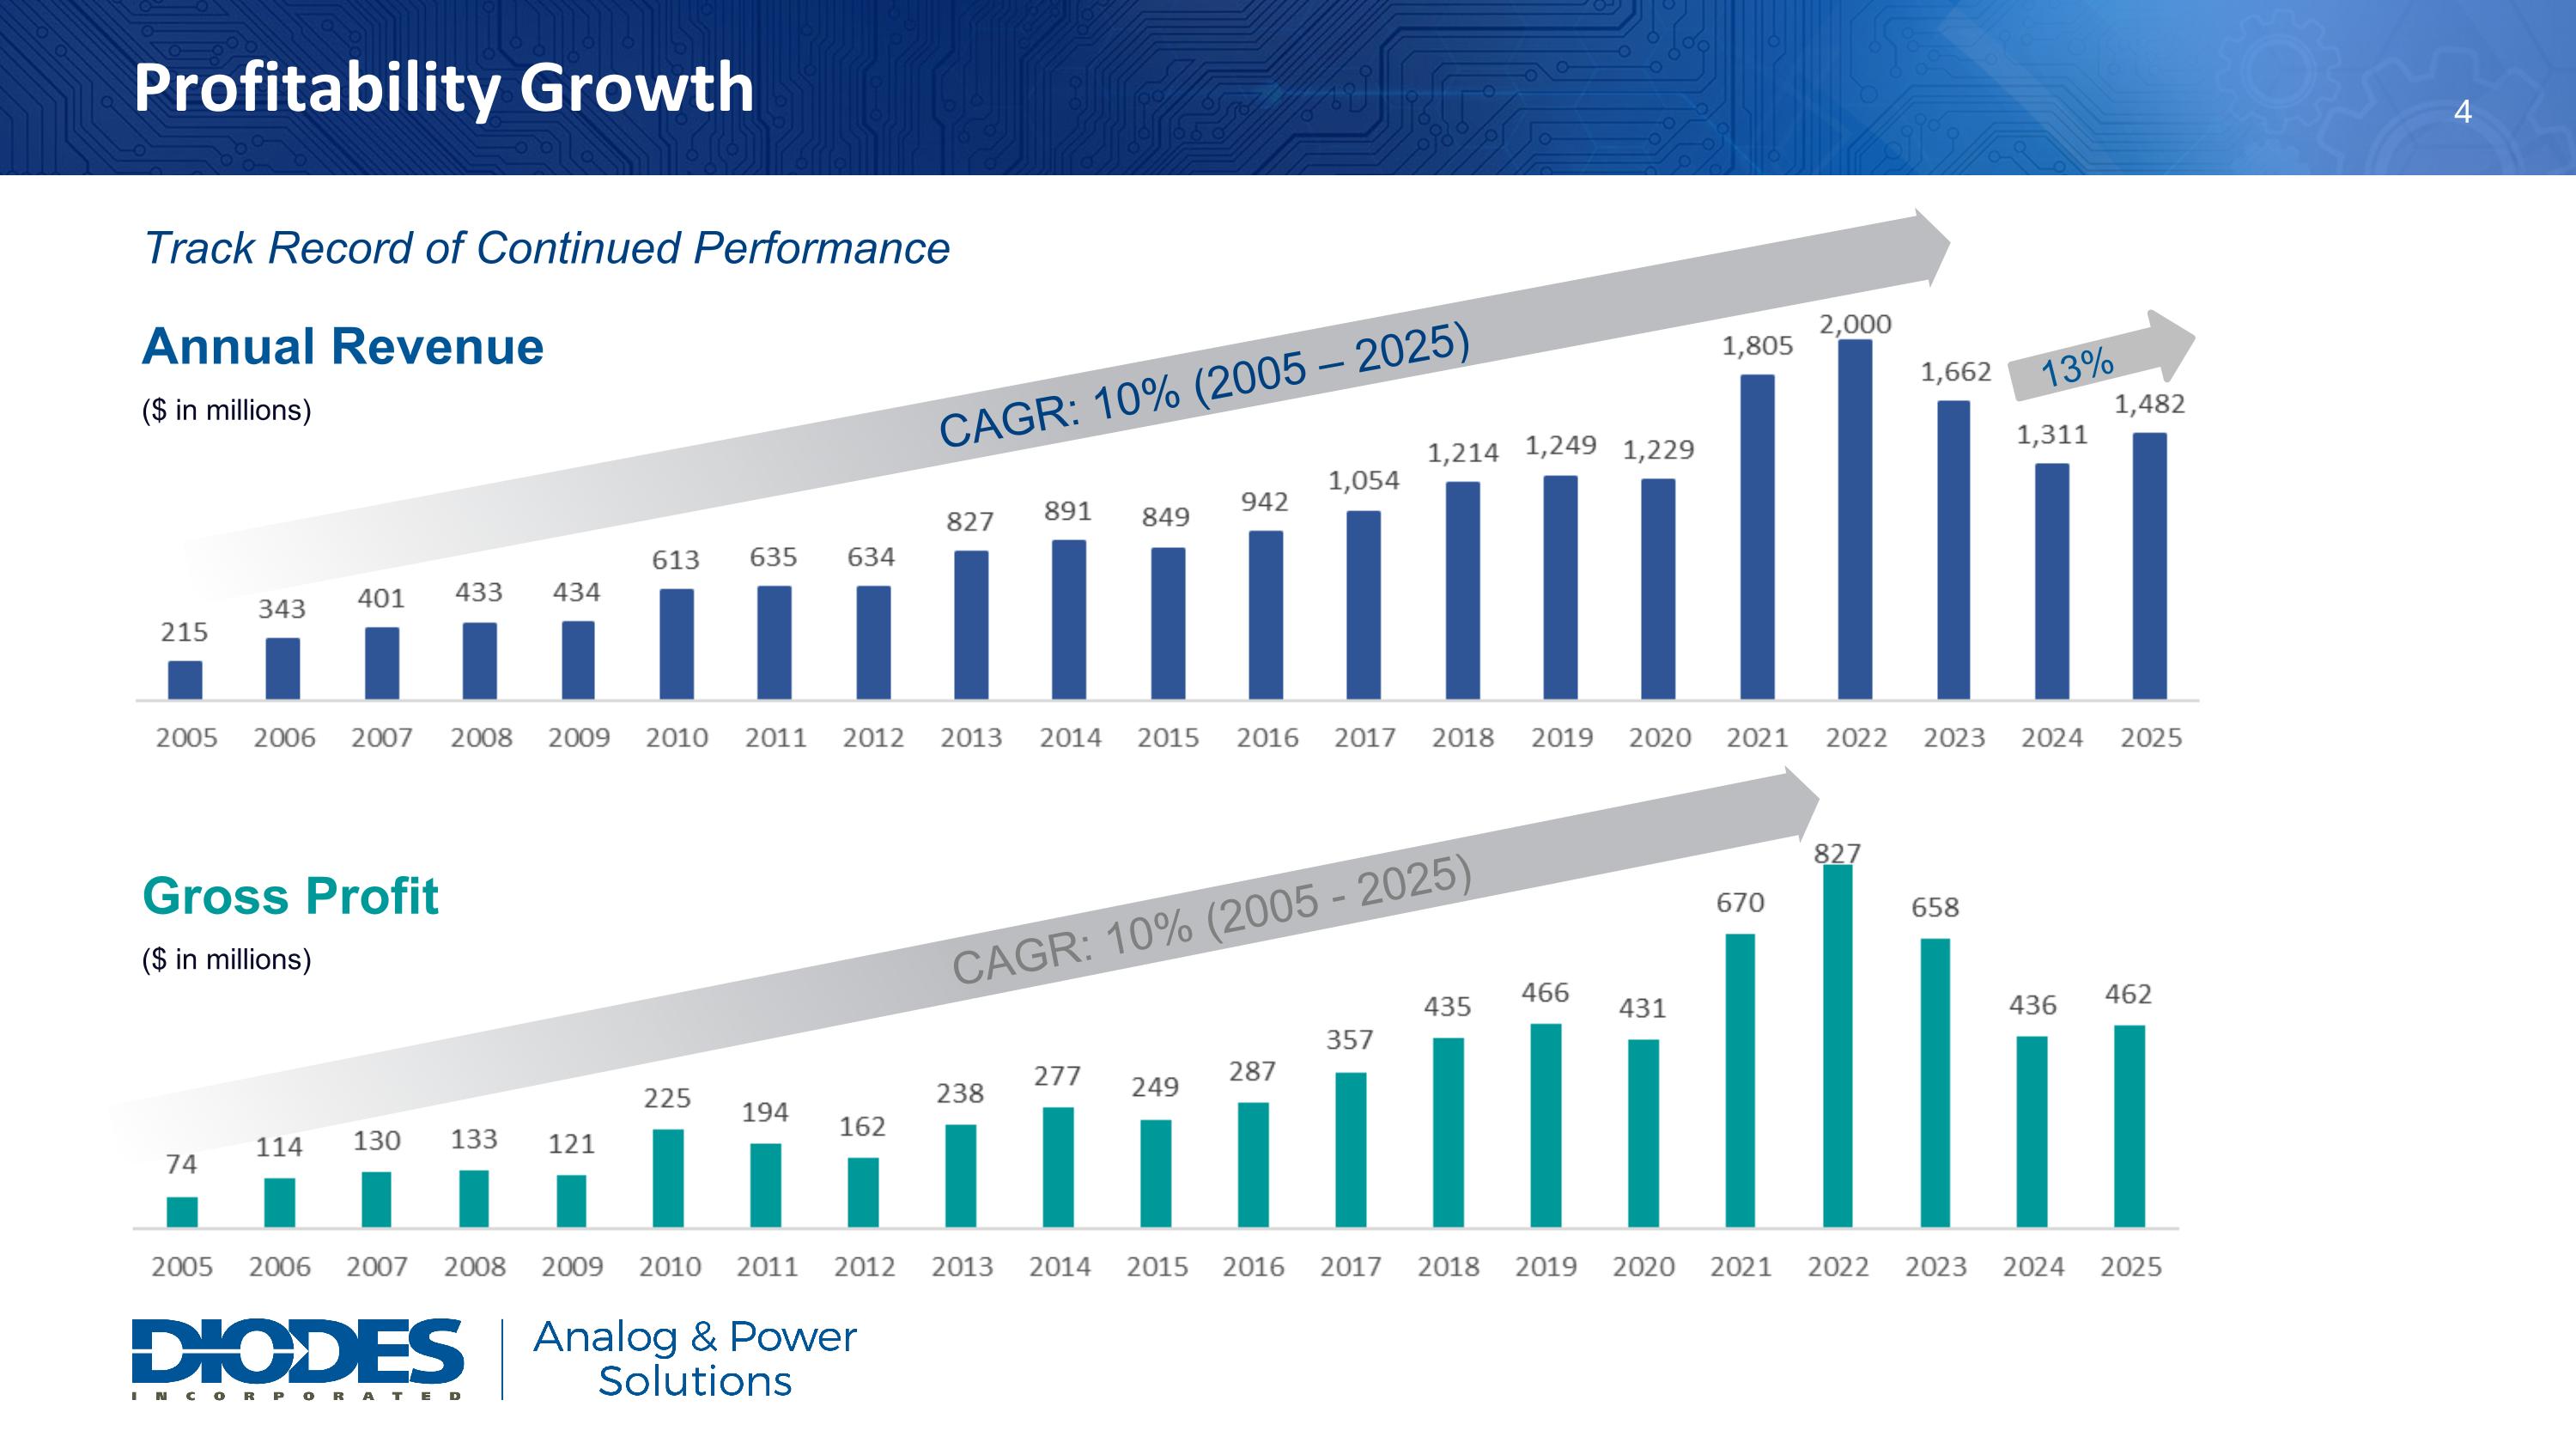
Profitability Growth Track Record of Continued Performance Gross Profit ($ in millions) ($ in millions) CAGR: 10% (2005 – 2025) CAGR: 10% (2005 - 2025) 13% Annual Revenue
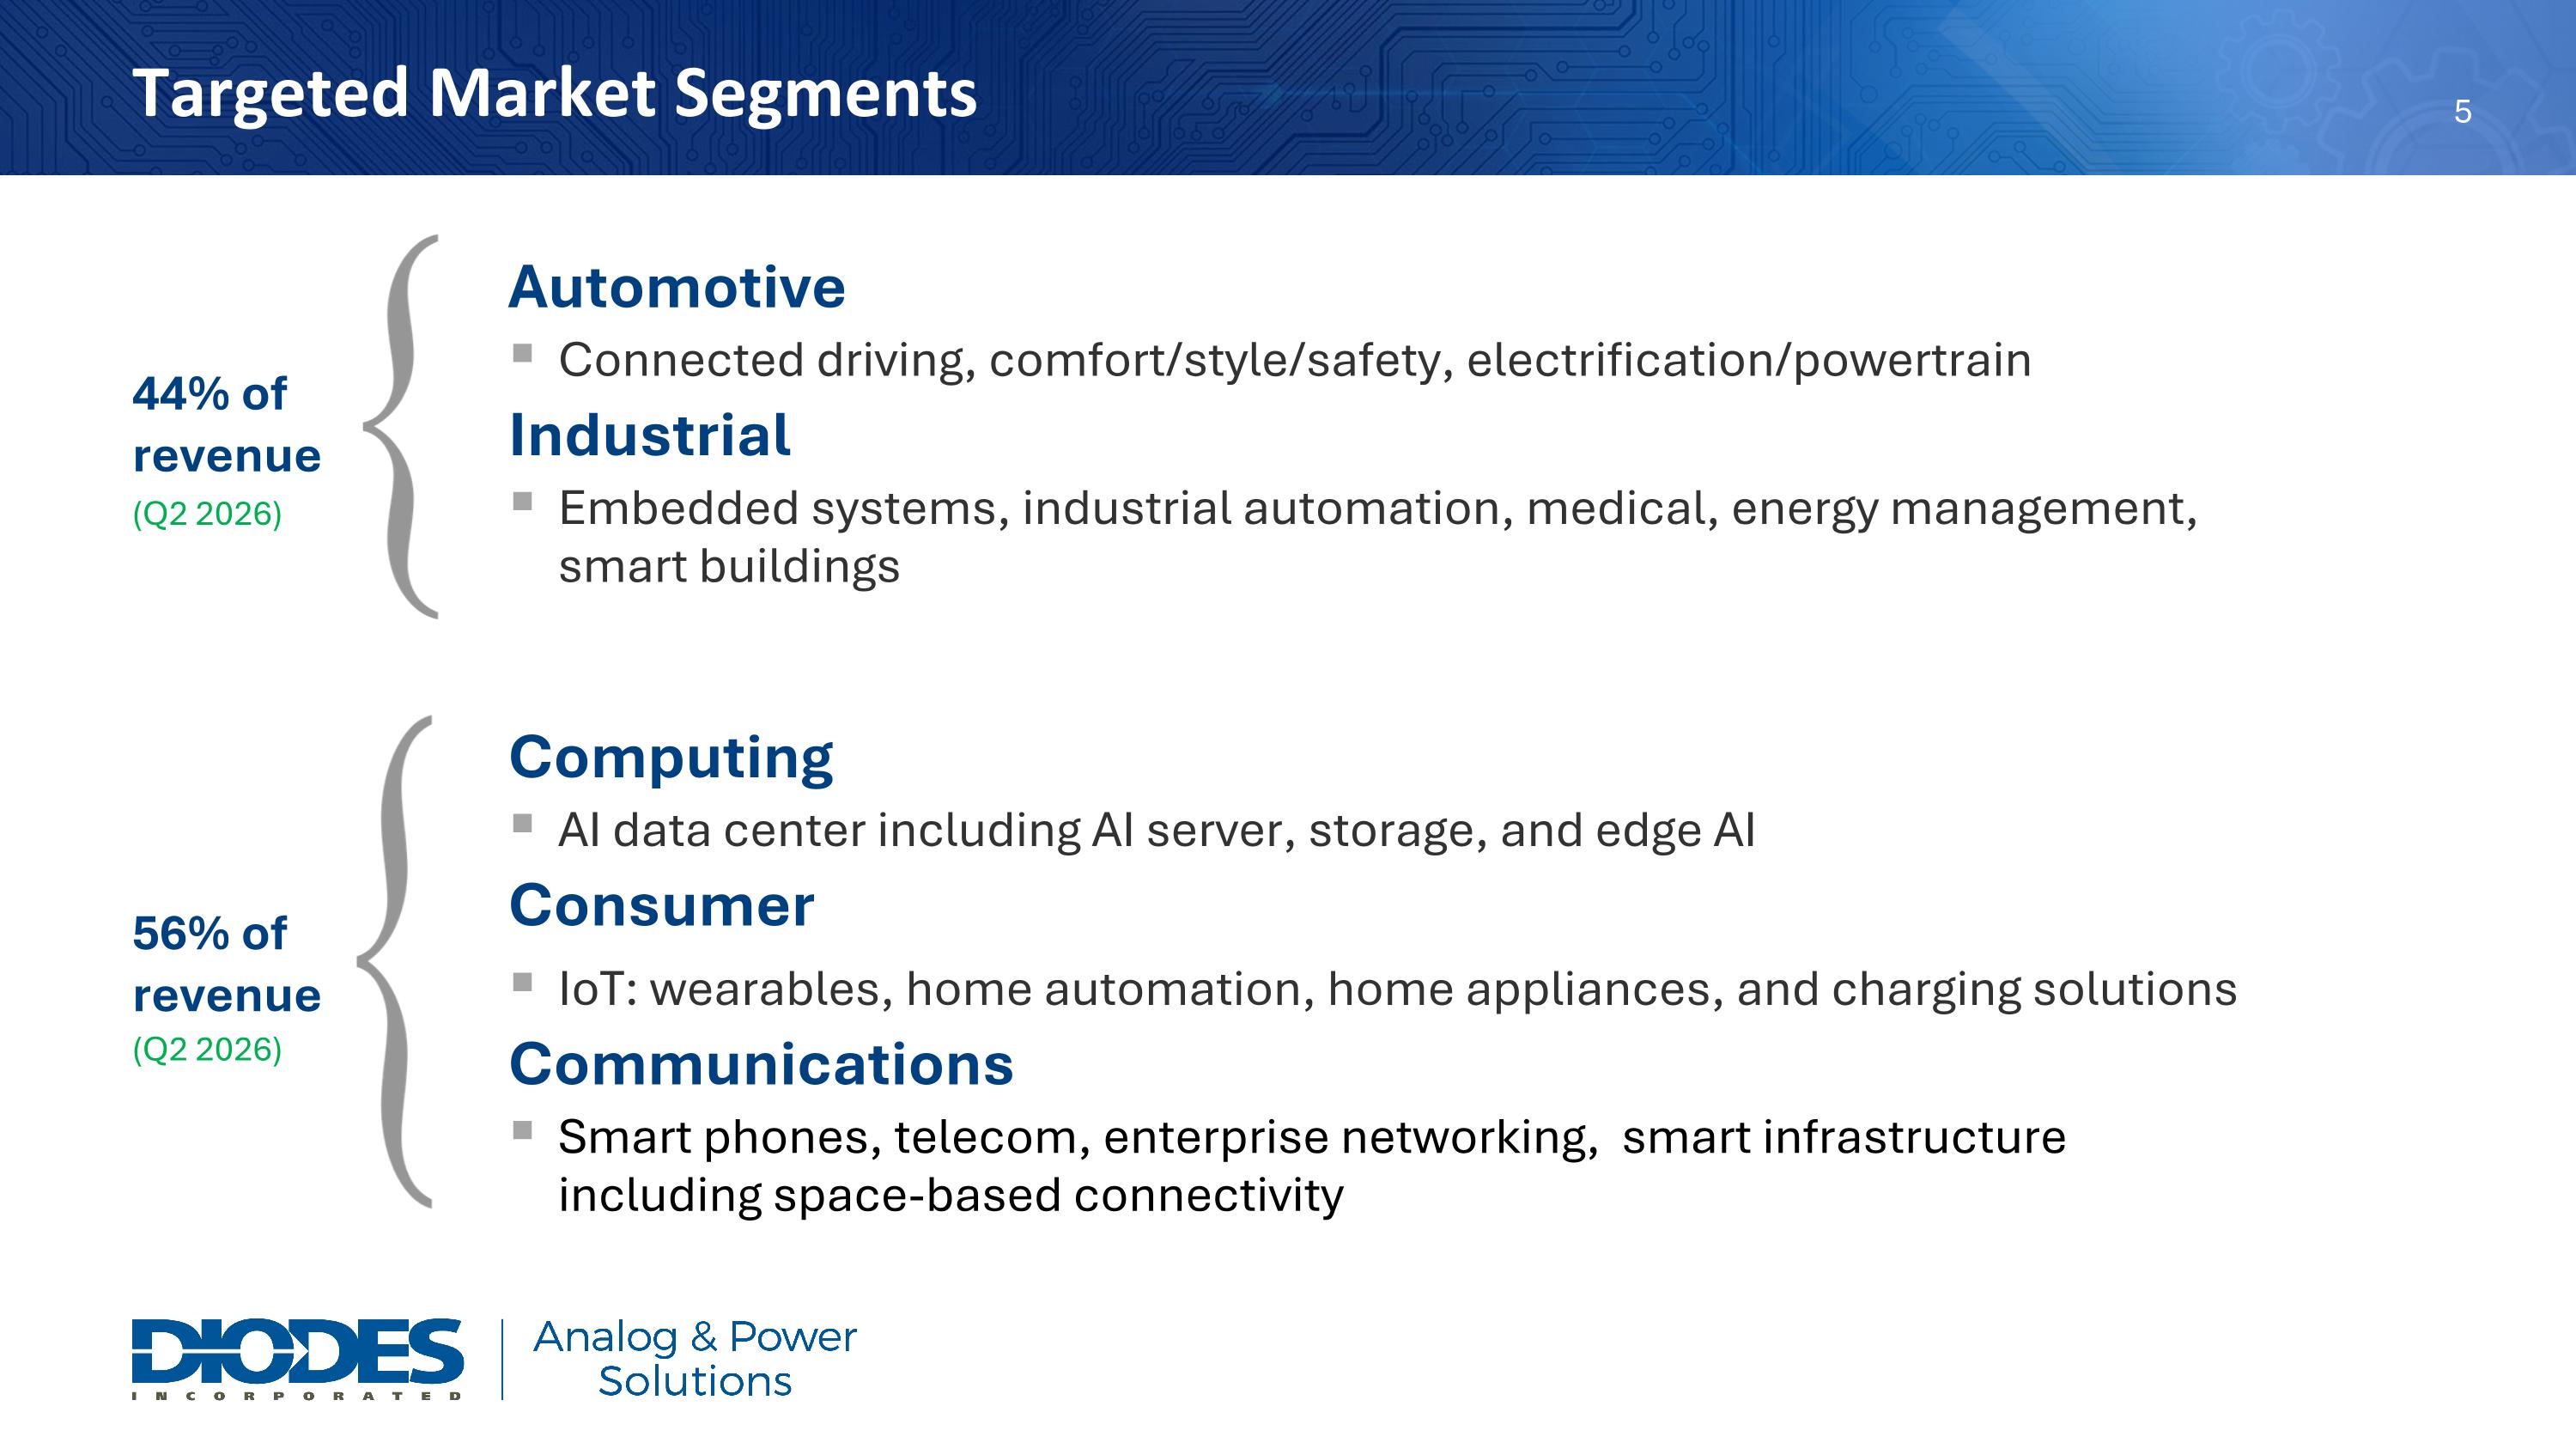
Automotive Connected driving, comfort/style/safety, electrification/powertrain Industrial Embedded systems, industrial automation, medical, energy management, smart buildings Computing AI data center including AI server, storage, and edge AI Consumer IoT: wearables, home automation, home appliances, and charging solutions Communications Smart phones, telecom, enterprise networking, smart infrastructure including space-based connectivity 56% of revenue 44% of revenue (Q2 2026) (Q2 2026) Targeted Market Segments
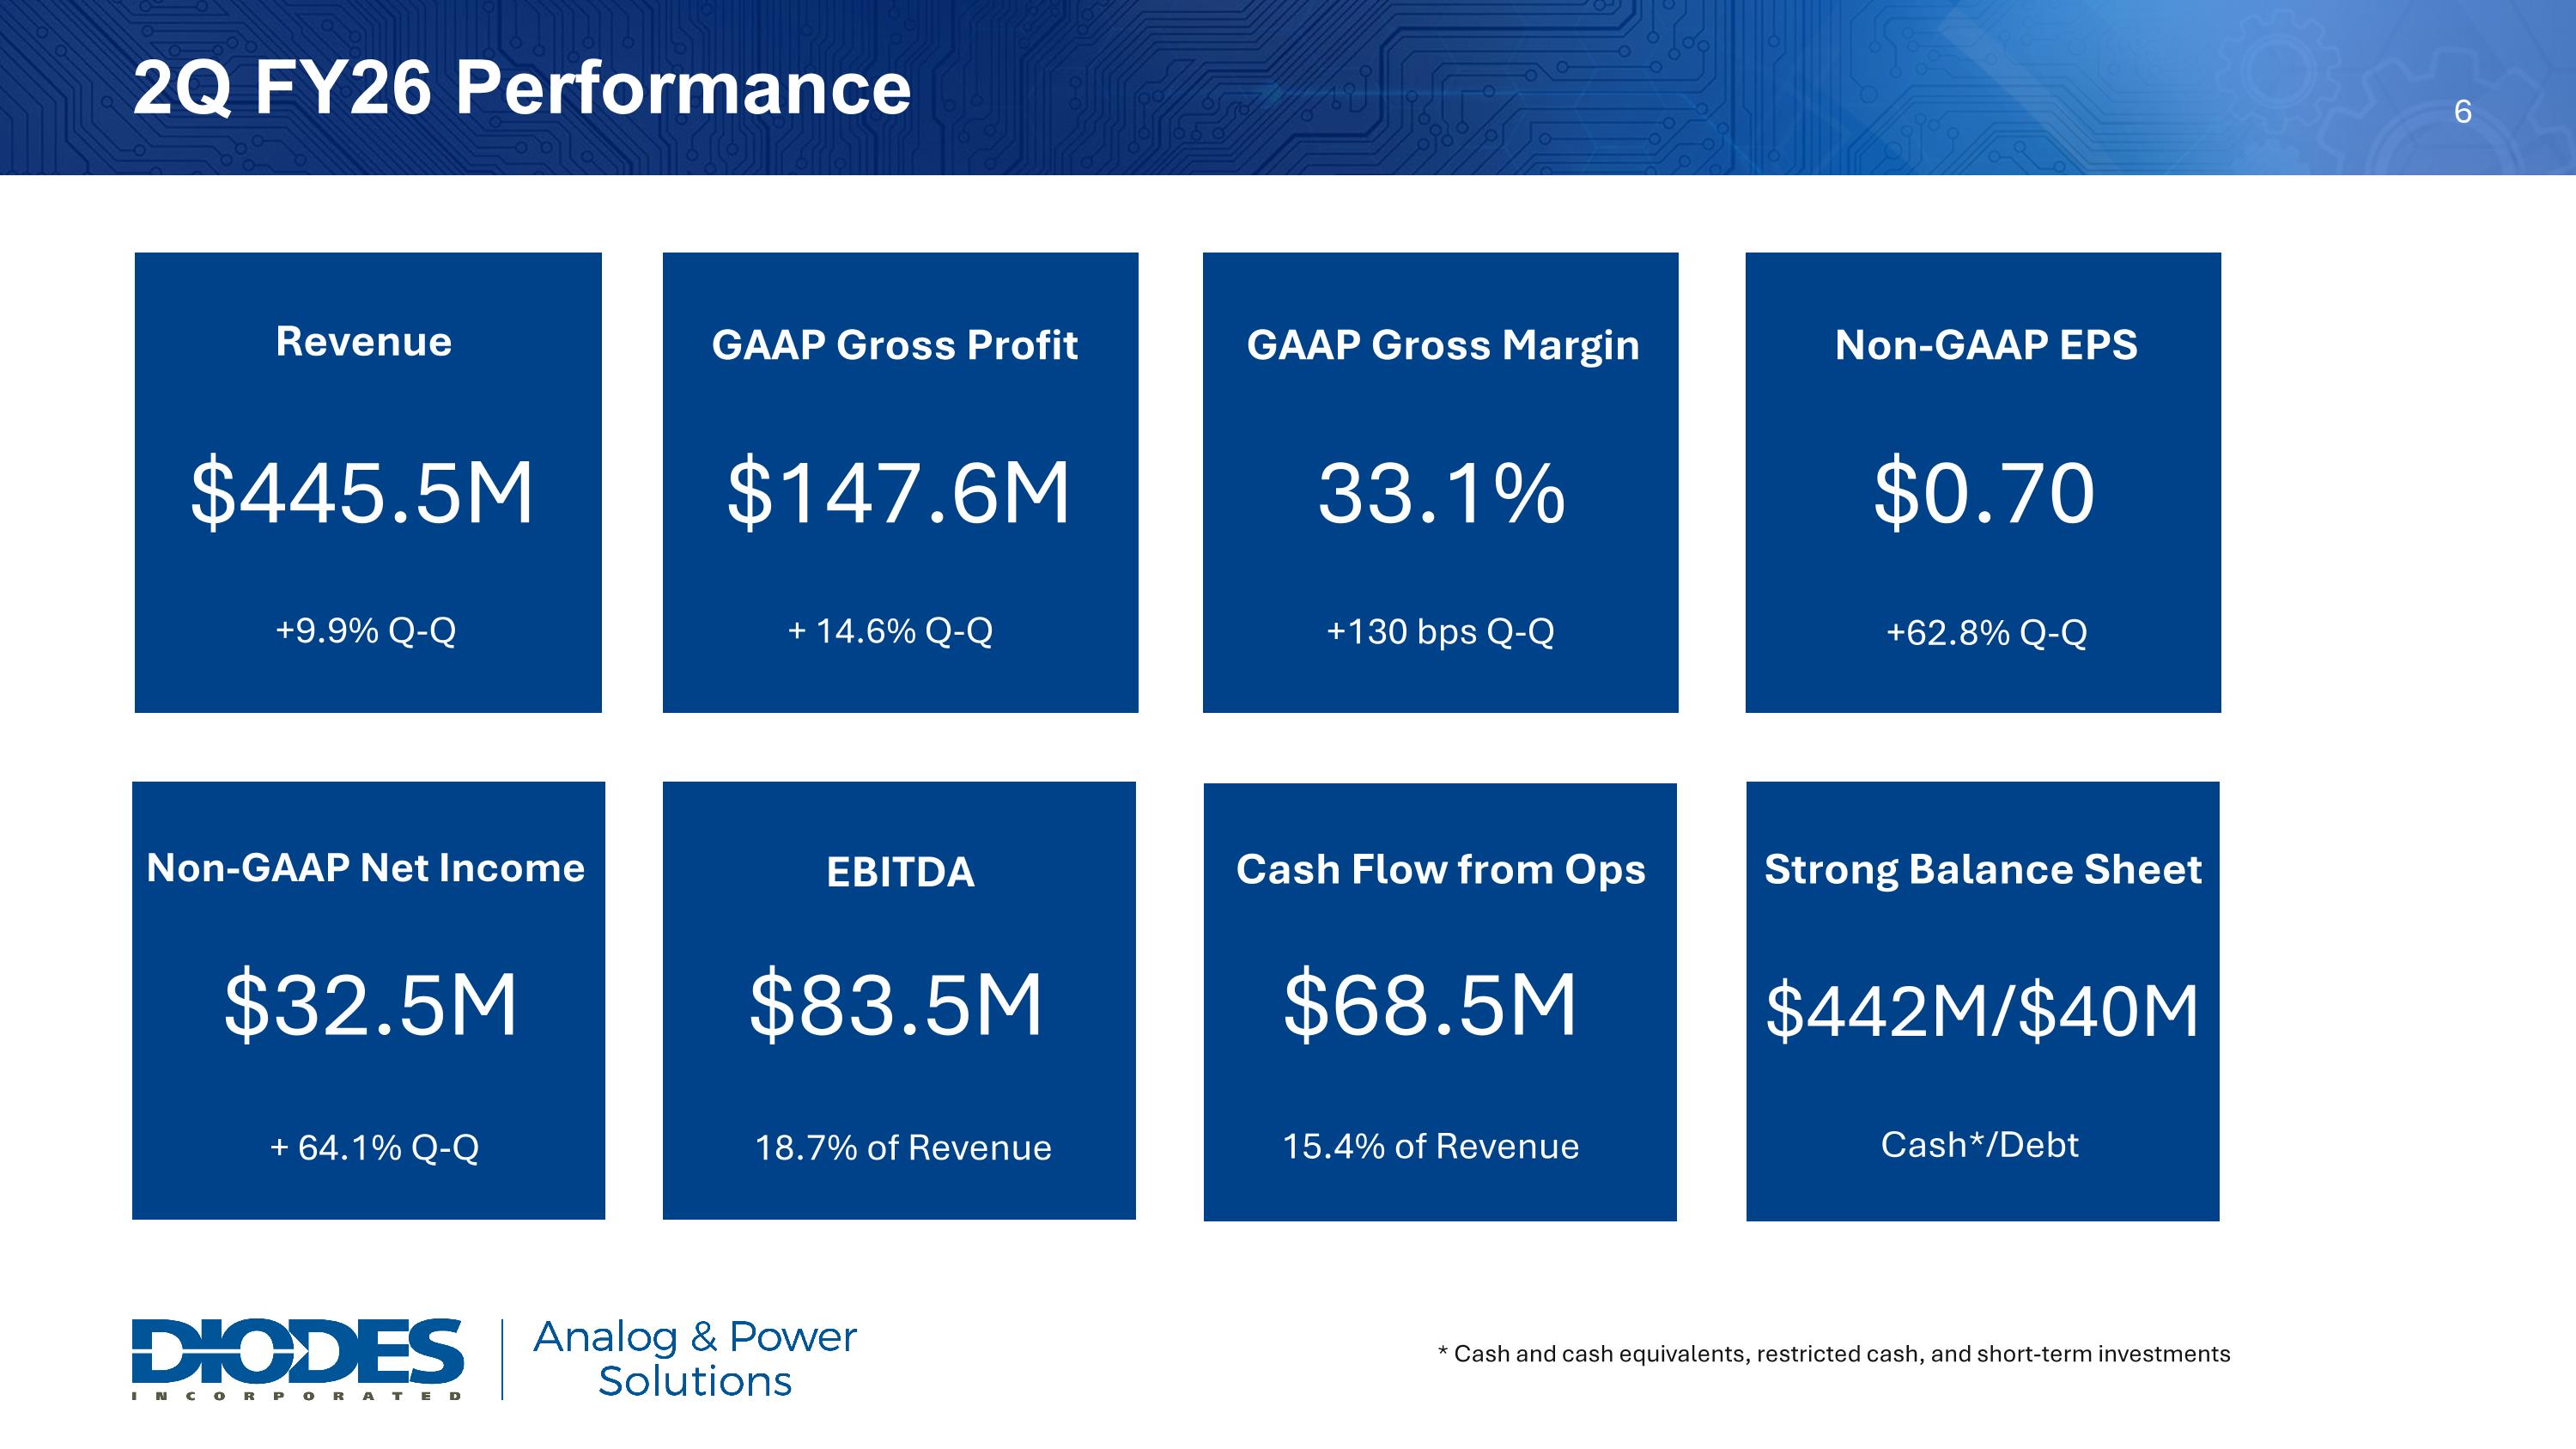
2Q FY26 Performance * Cash and cash equivalents, restricted cash, and short-term investments $445.5M +9.9% Q-Q Revenue $147.6M 33.1% +130 bps Q-Q GAAP Gross Margin $0.70 +62.8% Q-Q Non-GAAP EPS $32.5M + 64.1% Q-Q Non-GAAP Net Income $83.5M EBITDA 18.7% of Revenue Cash Flow from Ops 15.4% of Revenue Strong Balance Sheet $442M/$40M Cash*/Debt $68.5M + 14.6% Q-Q GAAP Gross Profit
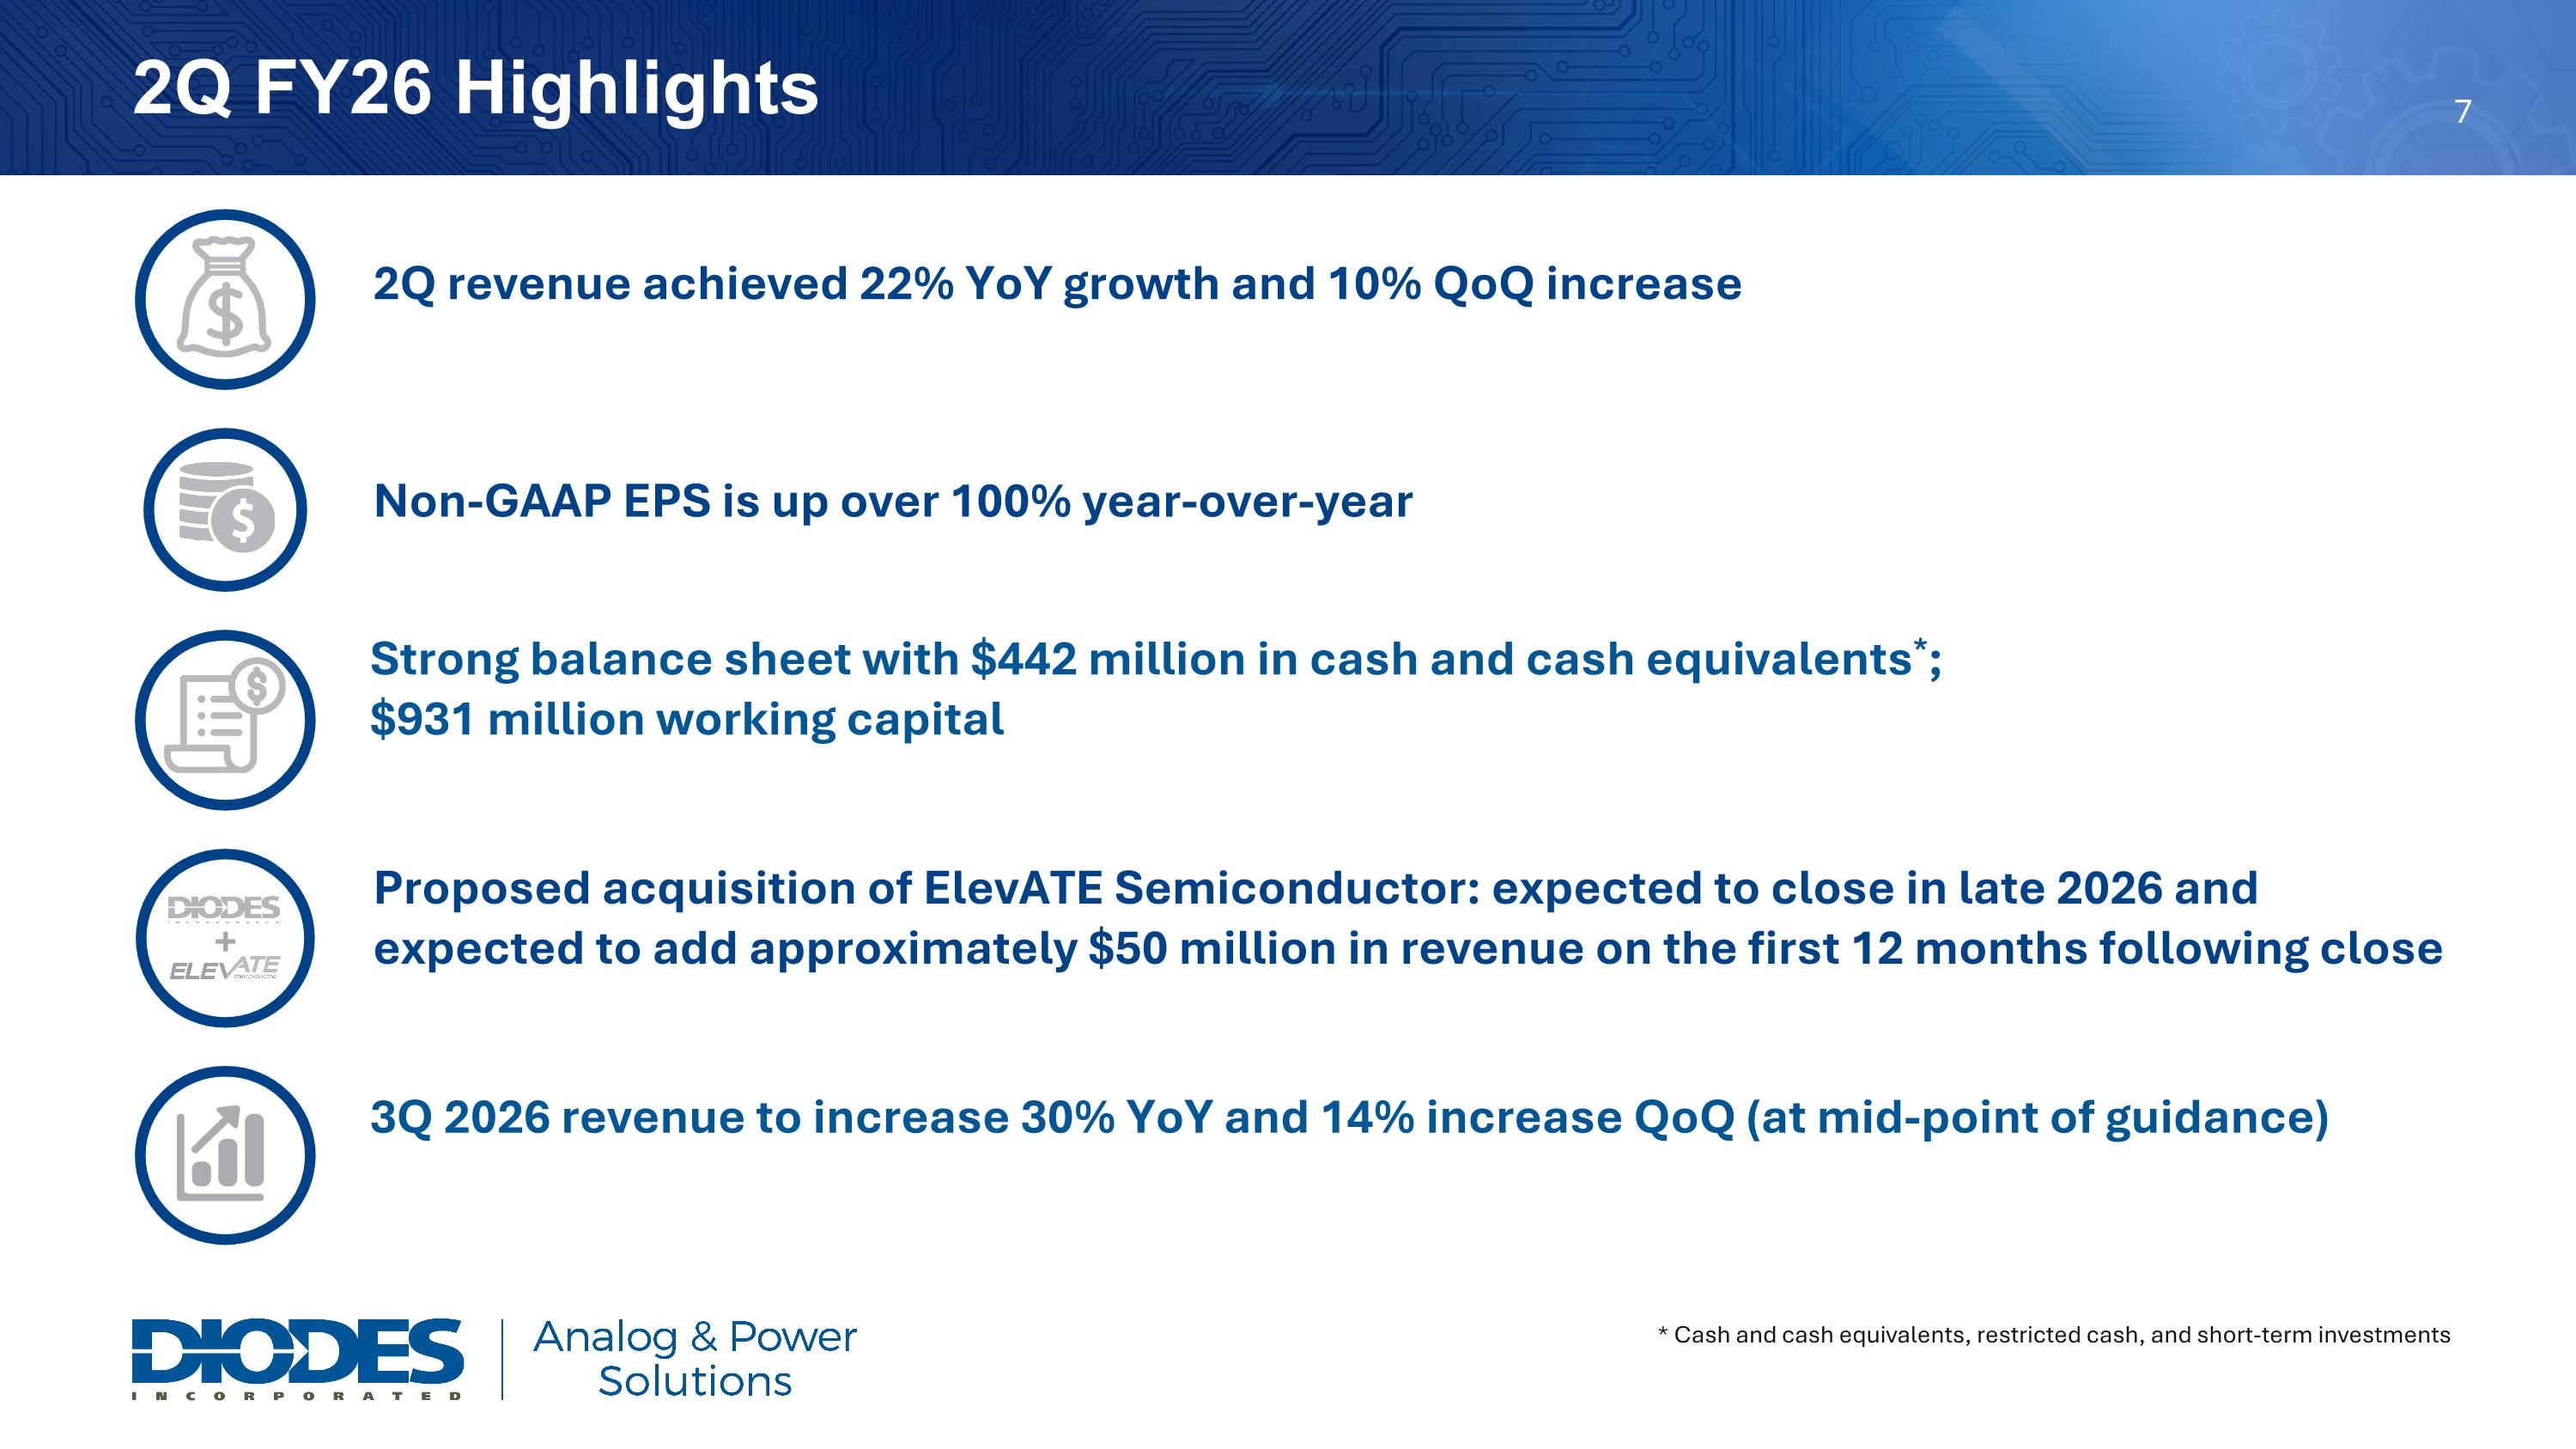
2Q FY26 Highlights 2Q revenue achieved 22% YoY growth and 10% QoQ increase Strong balance sheet with $442 million in cash and cash equivalents*; $931 million working capital 3Q 2026 revenue to increase 30% YoY and 14% increase QoQ (at mid-point of guidance) Non-GAAP EPS is up over 100% year-over-year * Cash and cash equivalents, restricted cash, and short-term investments Proposed acquisition of ElevATE Semiconductor: expected to close in late 2026 and expected to add approximately $50 million in revenue on the first 12 months following close +
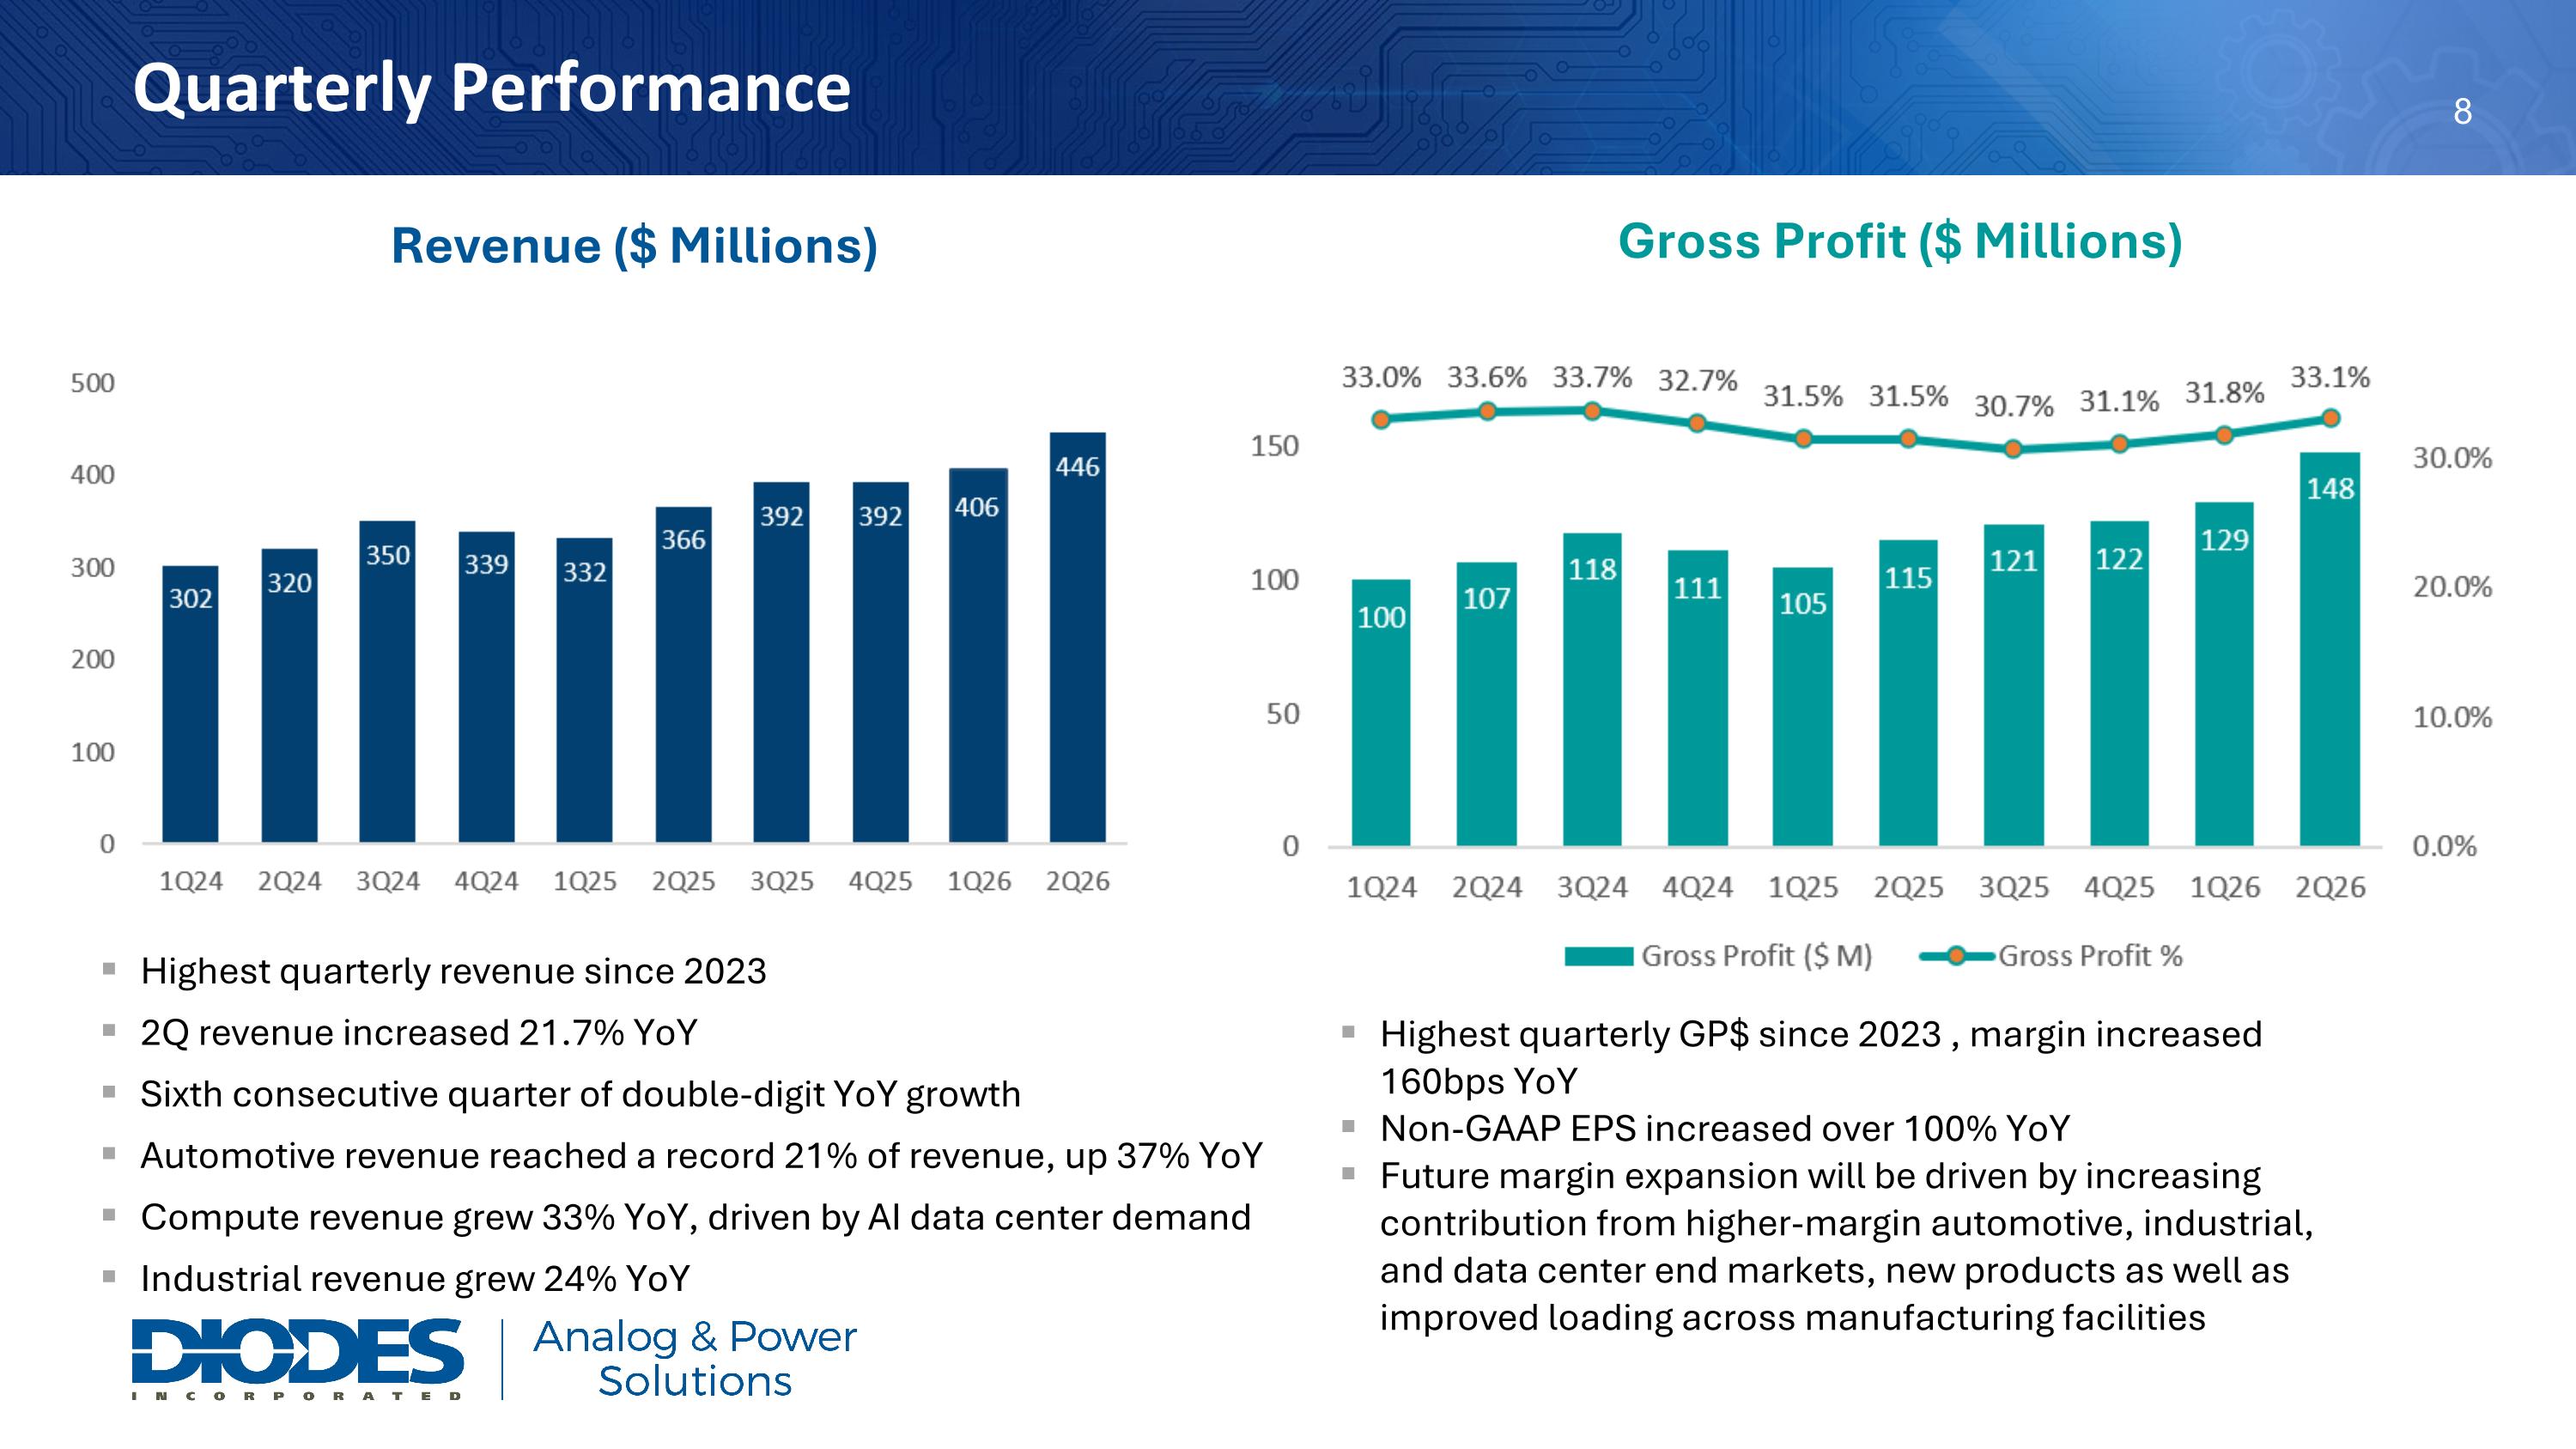
Quarterly Performance Gross Profit ($ Millions) Revenue ($ Millions) Highest quarterly revenue since 2023 2Q revenue increased 21.7% YoY Sixth consecutive quarter of double-digit YoY growth Automotive revenue reached a record 21% of revenue, up 37% YoY Compute revenue grew 33% YoY, driven by AI data center demand Industrial revenue grew 24% YoY Highest quarterly GP$ since 2023 , margin increased 160bps YoY Non-GAAP EPS increased over 100% YoY Future margin expansion will be driven by increasing contribution from higher-margin automotive, industrial, and data center end markets, new products as well as improved loading across manufacturing facilities
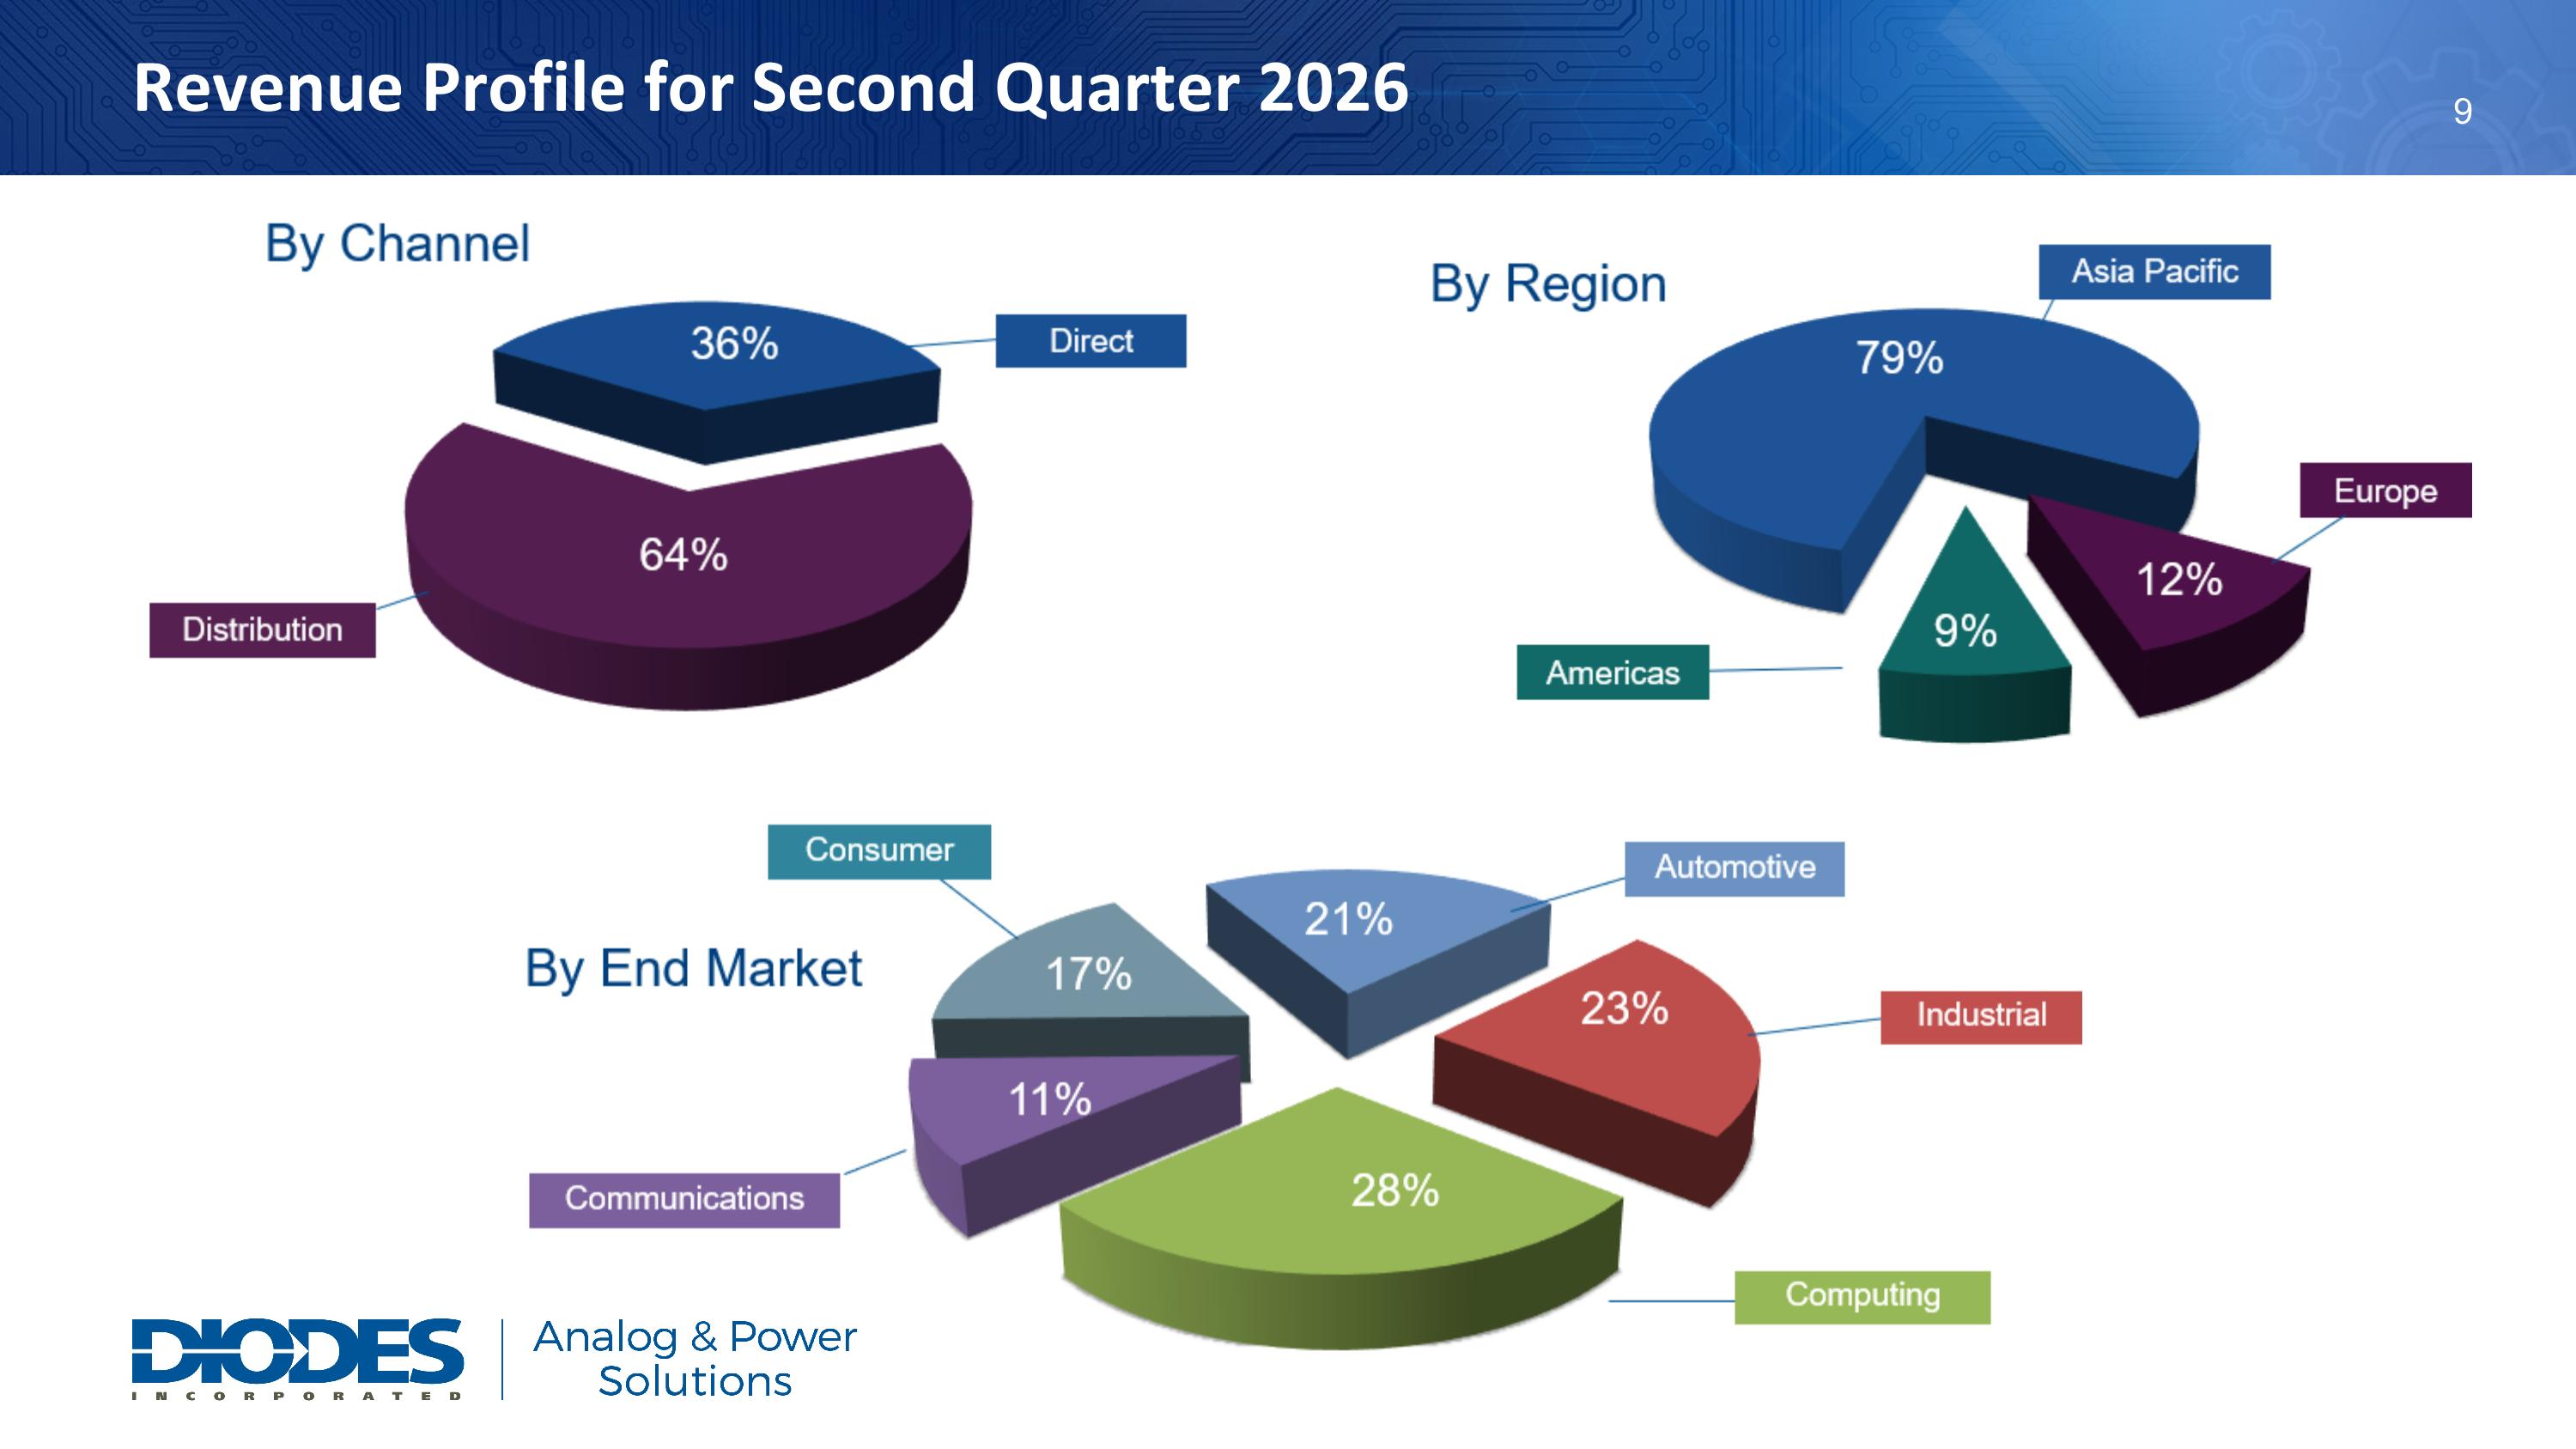
Revenue Profile for Second Quarter 2026
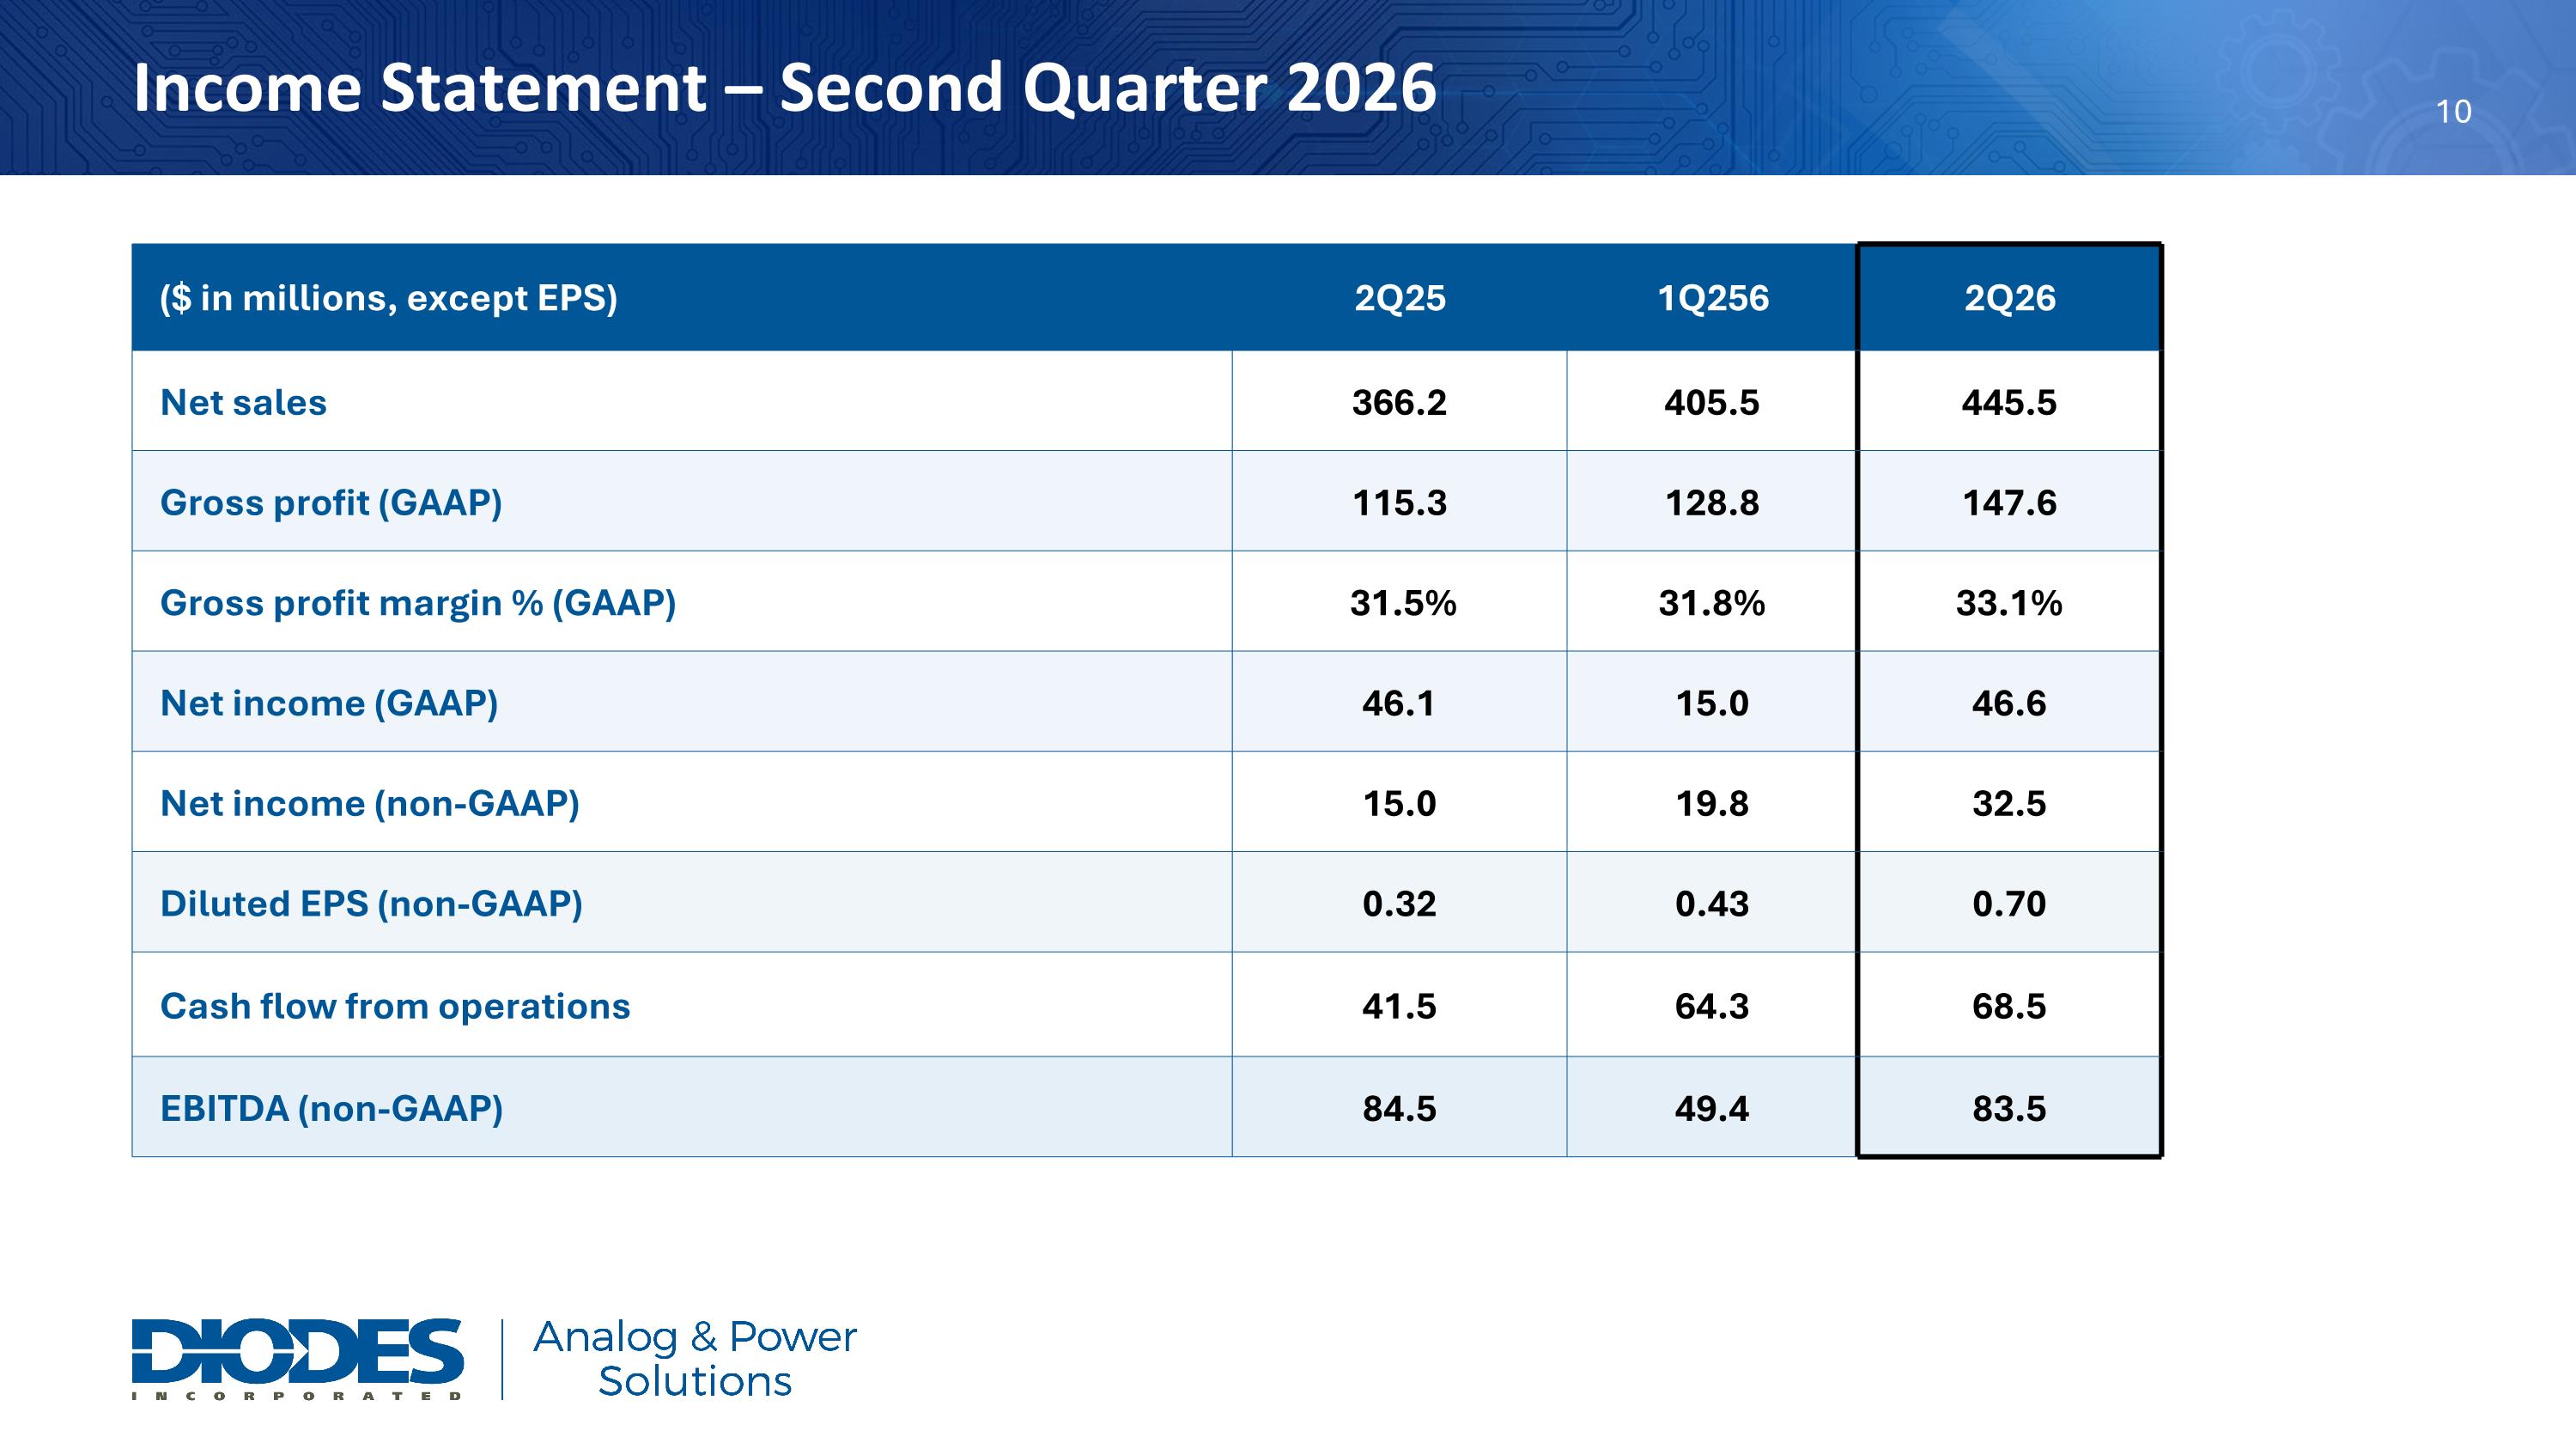
Income Statement – Second Quarter 2026 ($ in millions, except EPS) 2Q25 1Q256 2Q26 Net sales 366.2 405.5 445.5 Gross profit (GAAP) 115.3 128.8 147.6 Gross profit margin % (GAAP) 31.5% 31.8% 33.1% Net income (GAAP) 46.1 15.0 46.6 Net income (non-GAAP) 15.0 19.8 32.5 Diluted EPS (non-GAAP) 0.32 0.43 0.70 Cash flow from operations 41.5 64.3 68.5 EBITDA (non-GAAP) 84.5 49.4 83.5
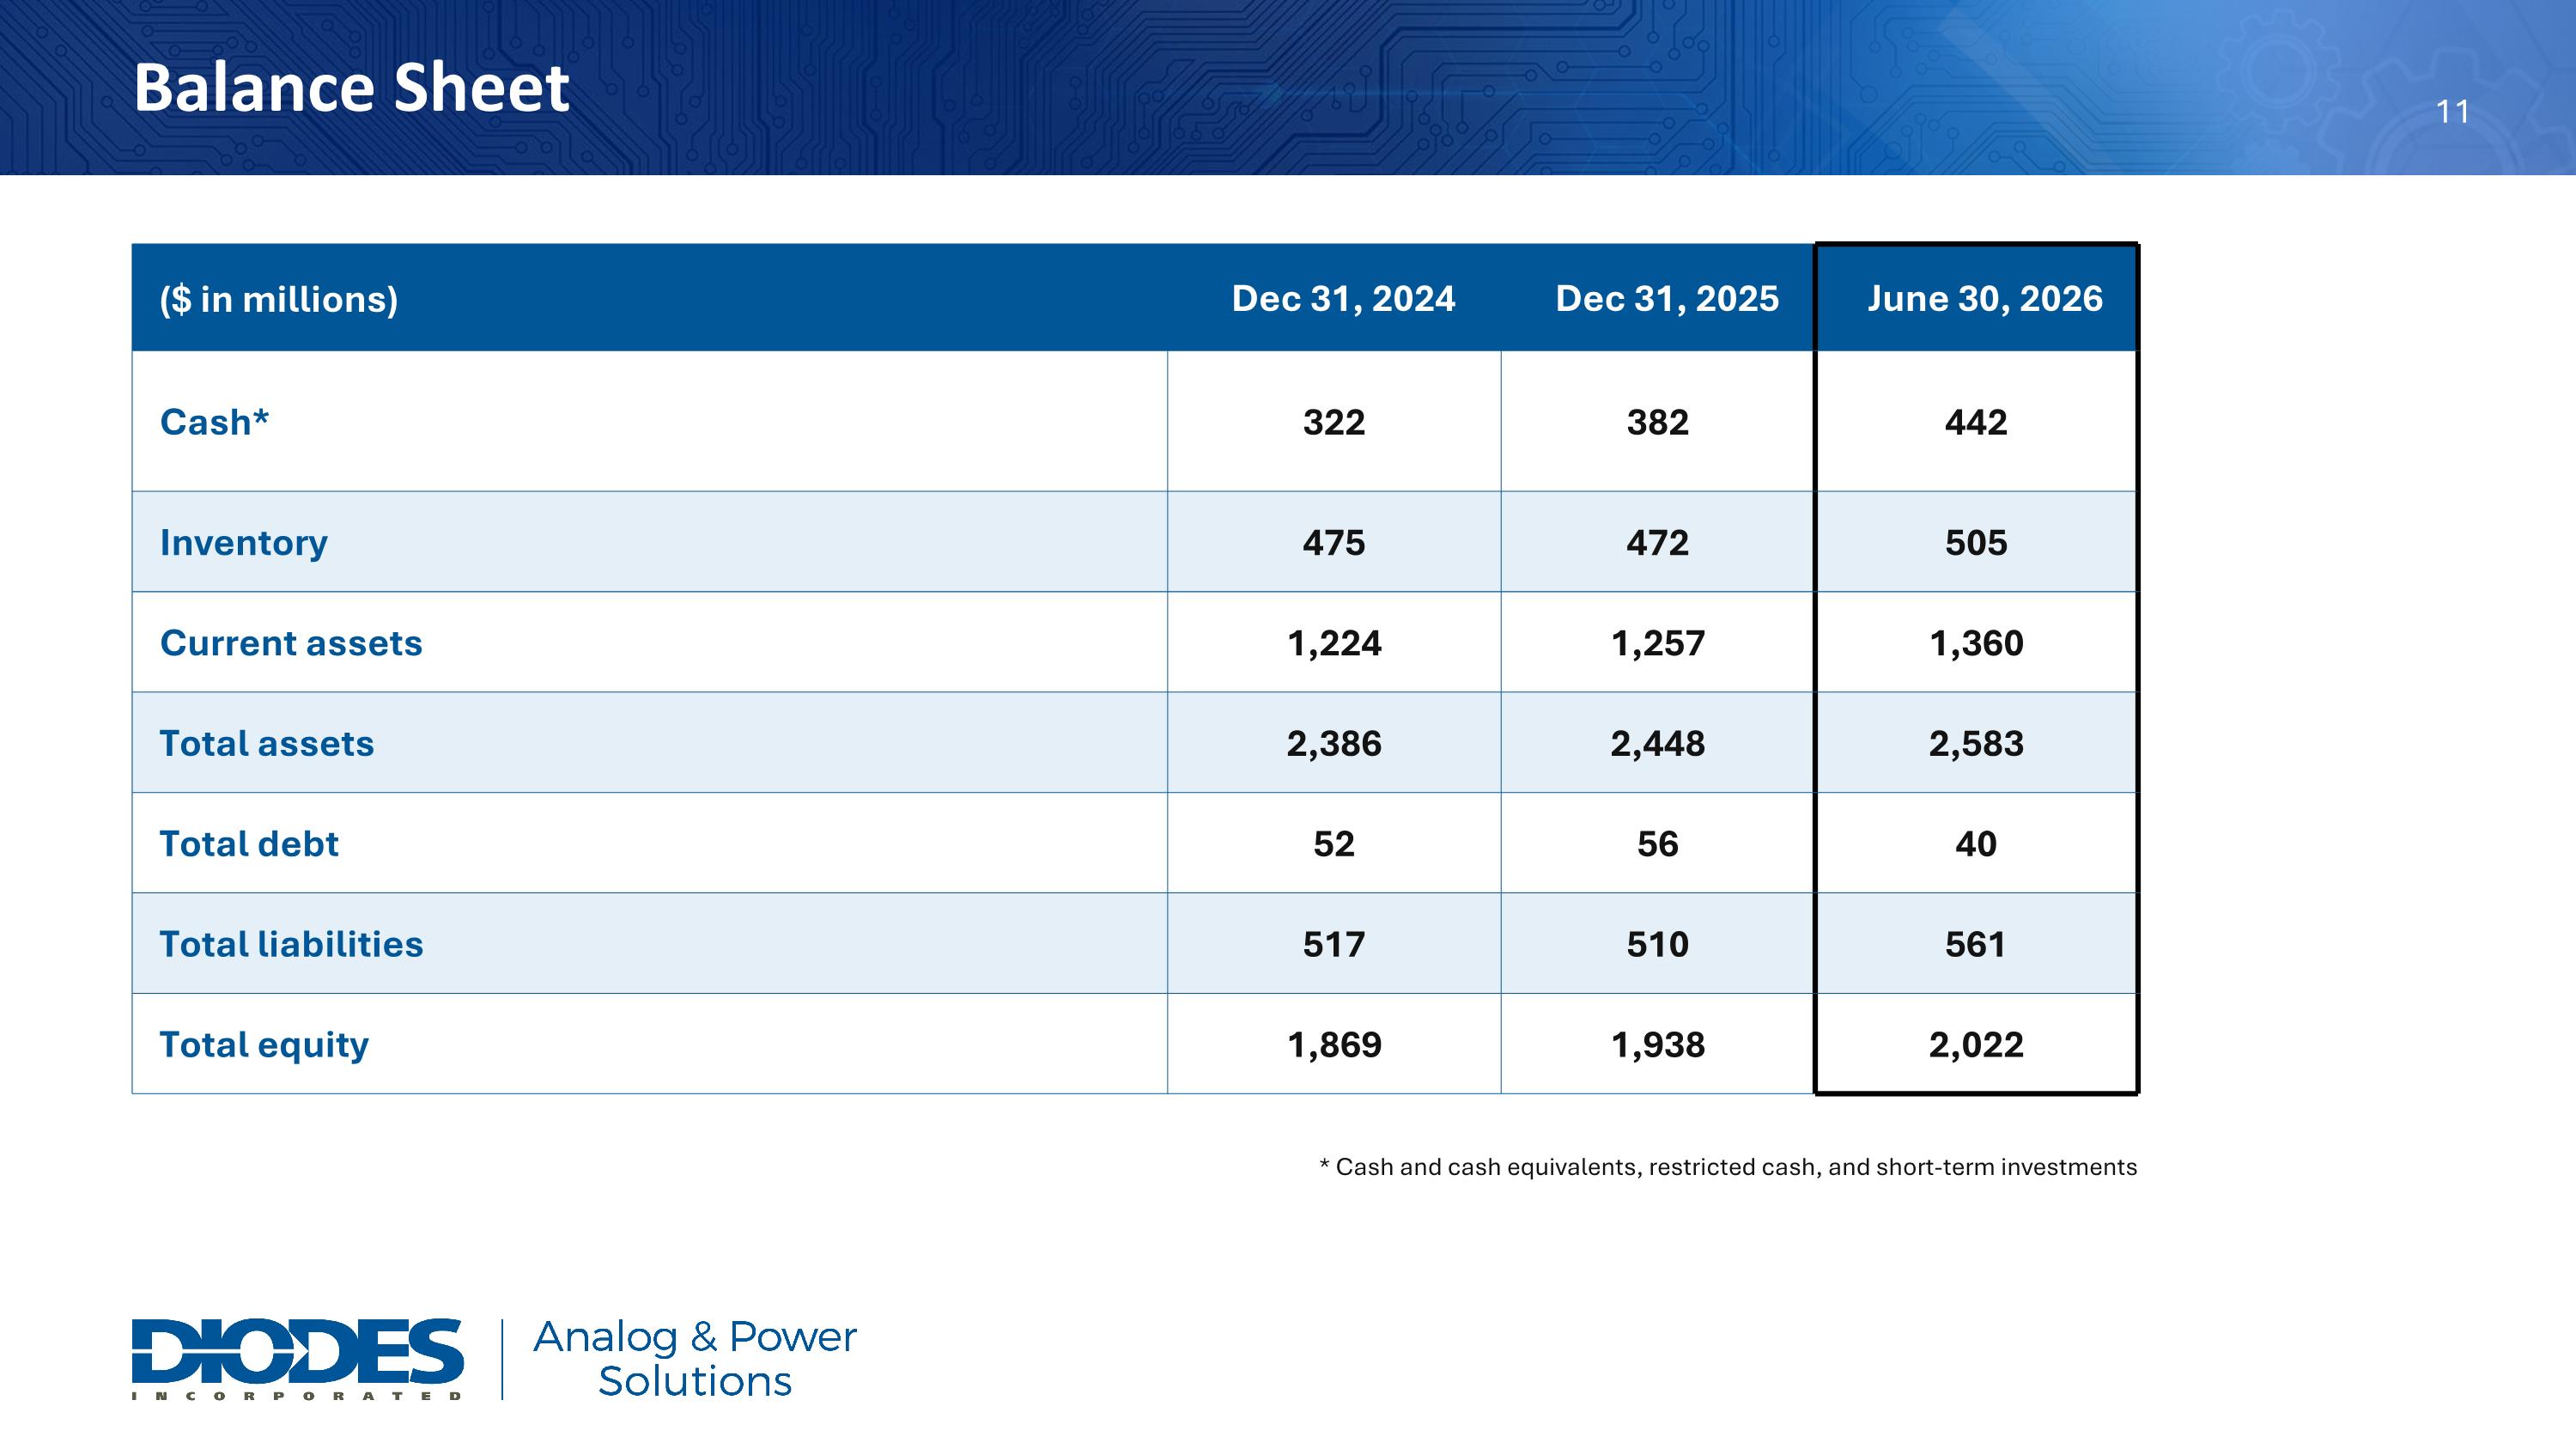
Balance Sheet ($ in millions) Dec 31, 2024 Dec 31, 2025 June 30, 2026 Cash* 322 382 442 Inventory 475 472 505 Current assets 1,224 1,257 1,360 Total assets 2,386 2,448 2,583 Total debt 52 56 40 Total liabilities 517 510 561 Total equity 1,869 1,938 2,022 * Cash and cash equivalents, restricted cash, and short-term investments
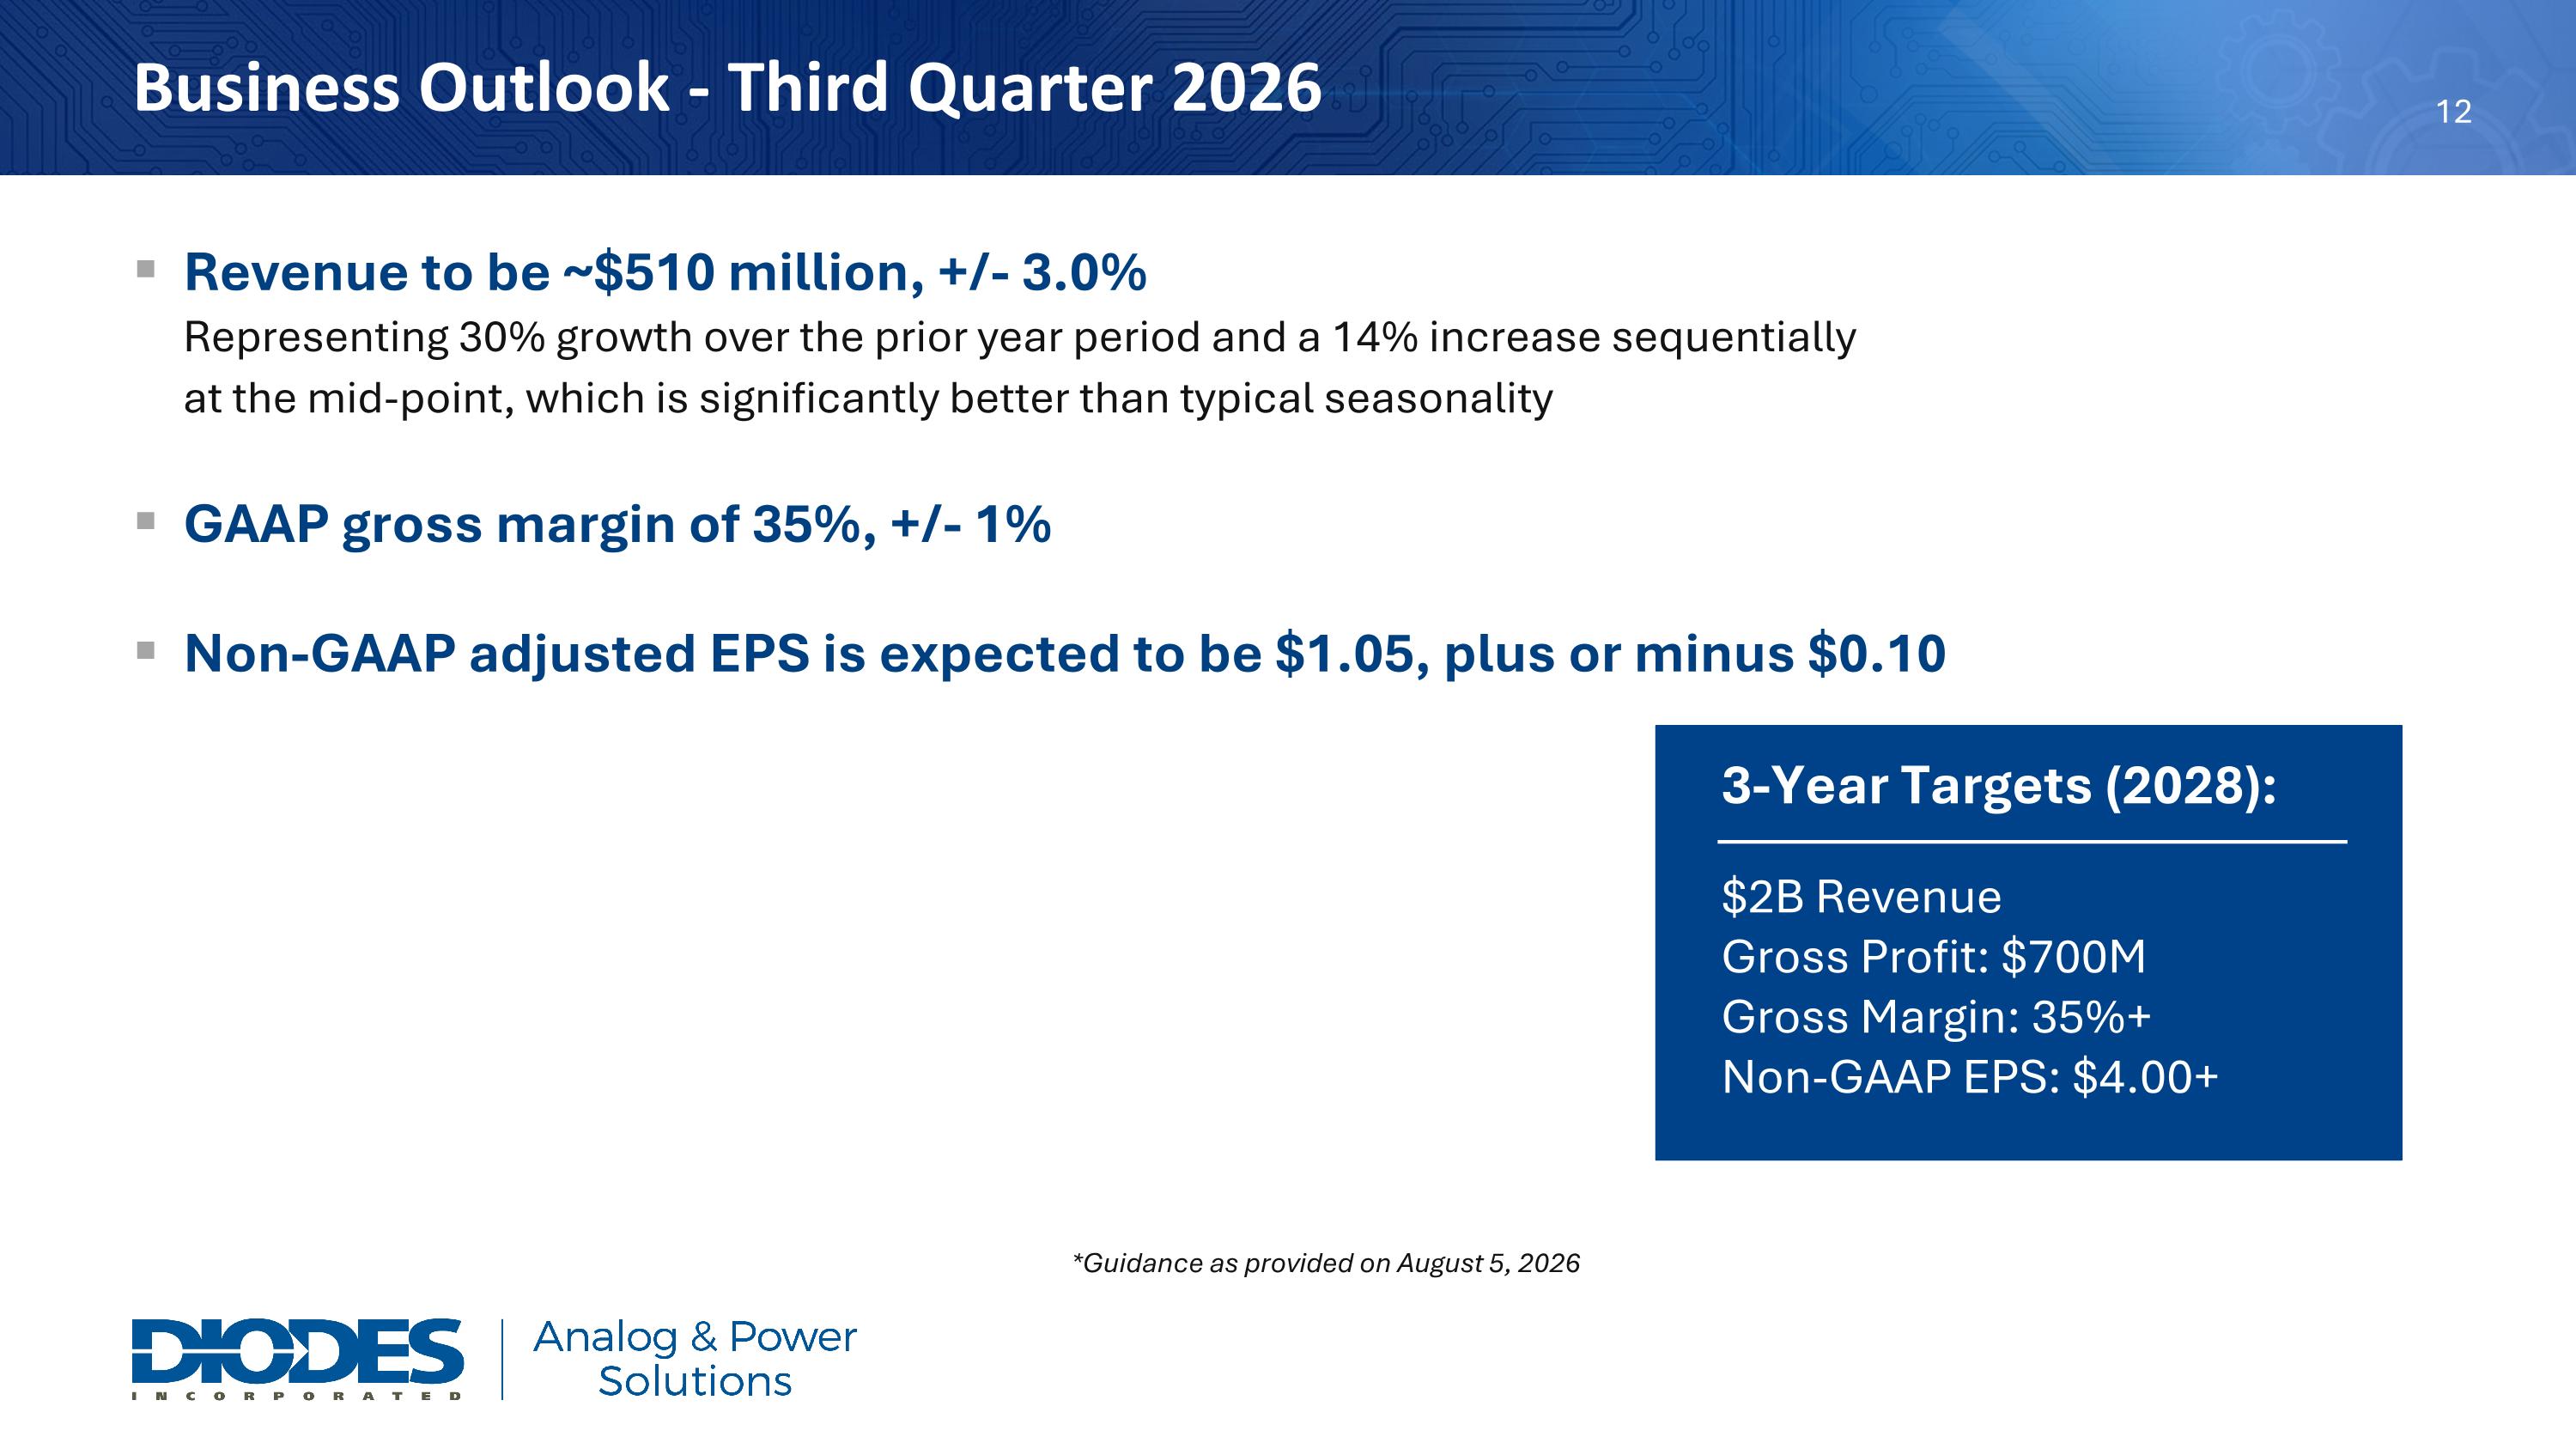
Business Outlook - Third Quarter 2026 Revenue to be ~$510 million, +/- 3.0% Representing 30% growth over the prior year period and a 14% increase sequentially at the mid-point, which is significantly better than typical seasonality GAAP gross margin of 35%, +/- 1% Non-GAAP adjusted EPS is expected to be $1.05, plus or minus $0.10 *Guidance as provided on August 5, 2026 3-Year Targets (2028): $2B Revenue Gross Profit: $700M Gross Margin: 35%+ Non-GAAP EPS: $4.00+
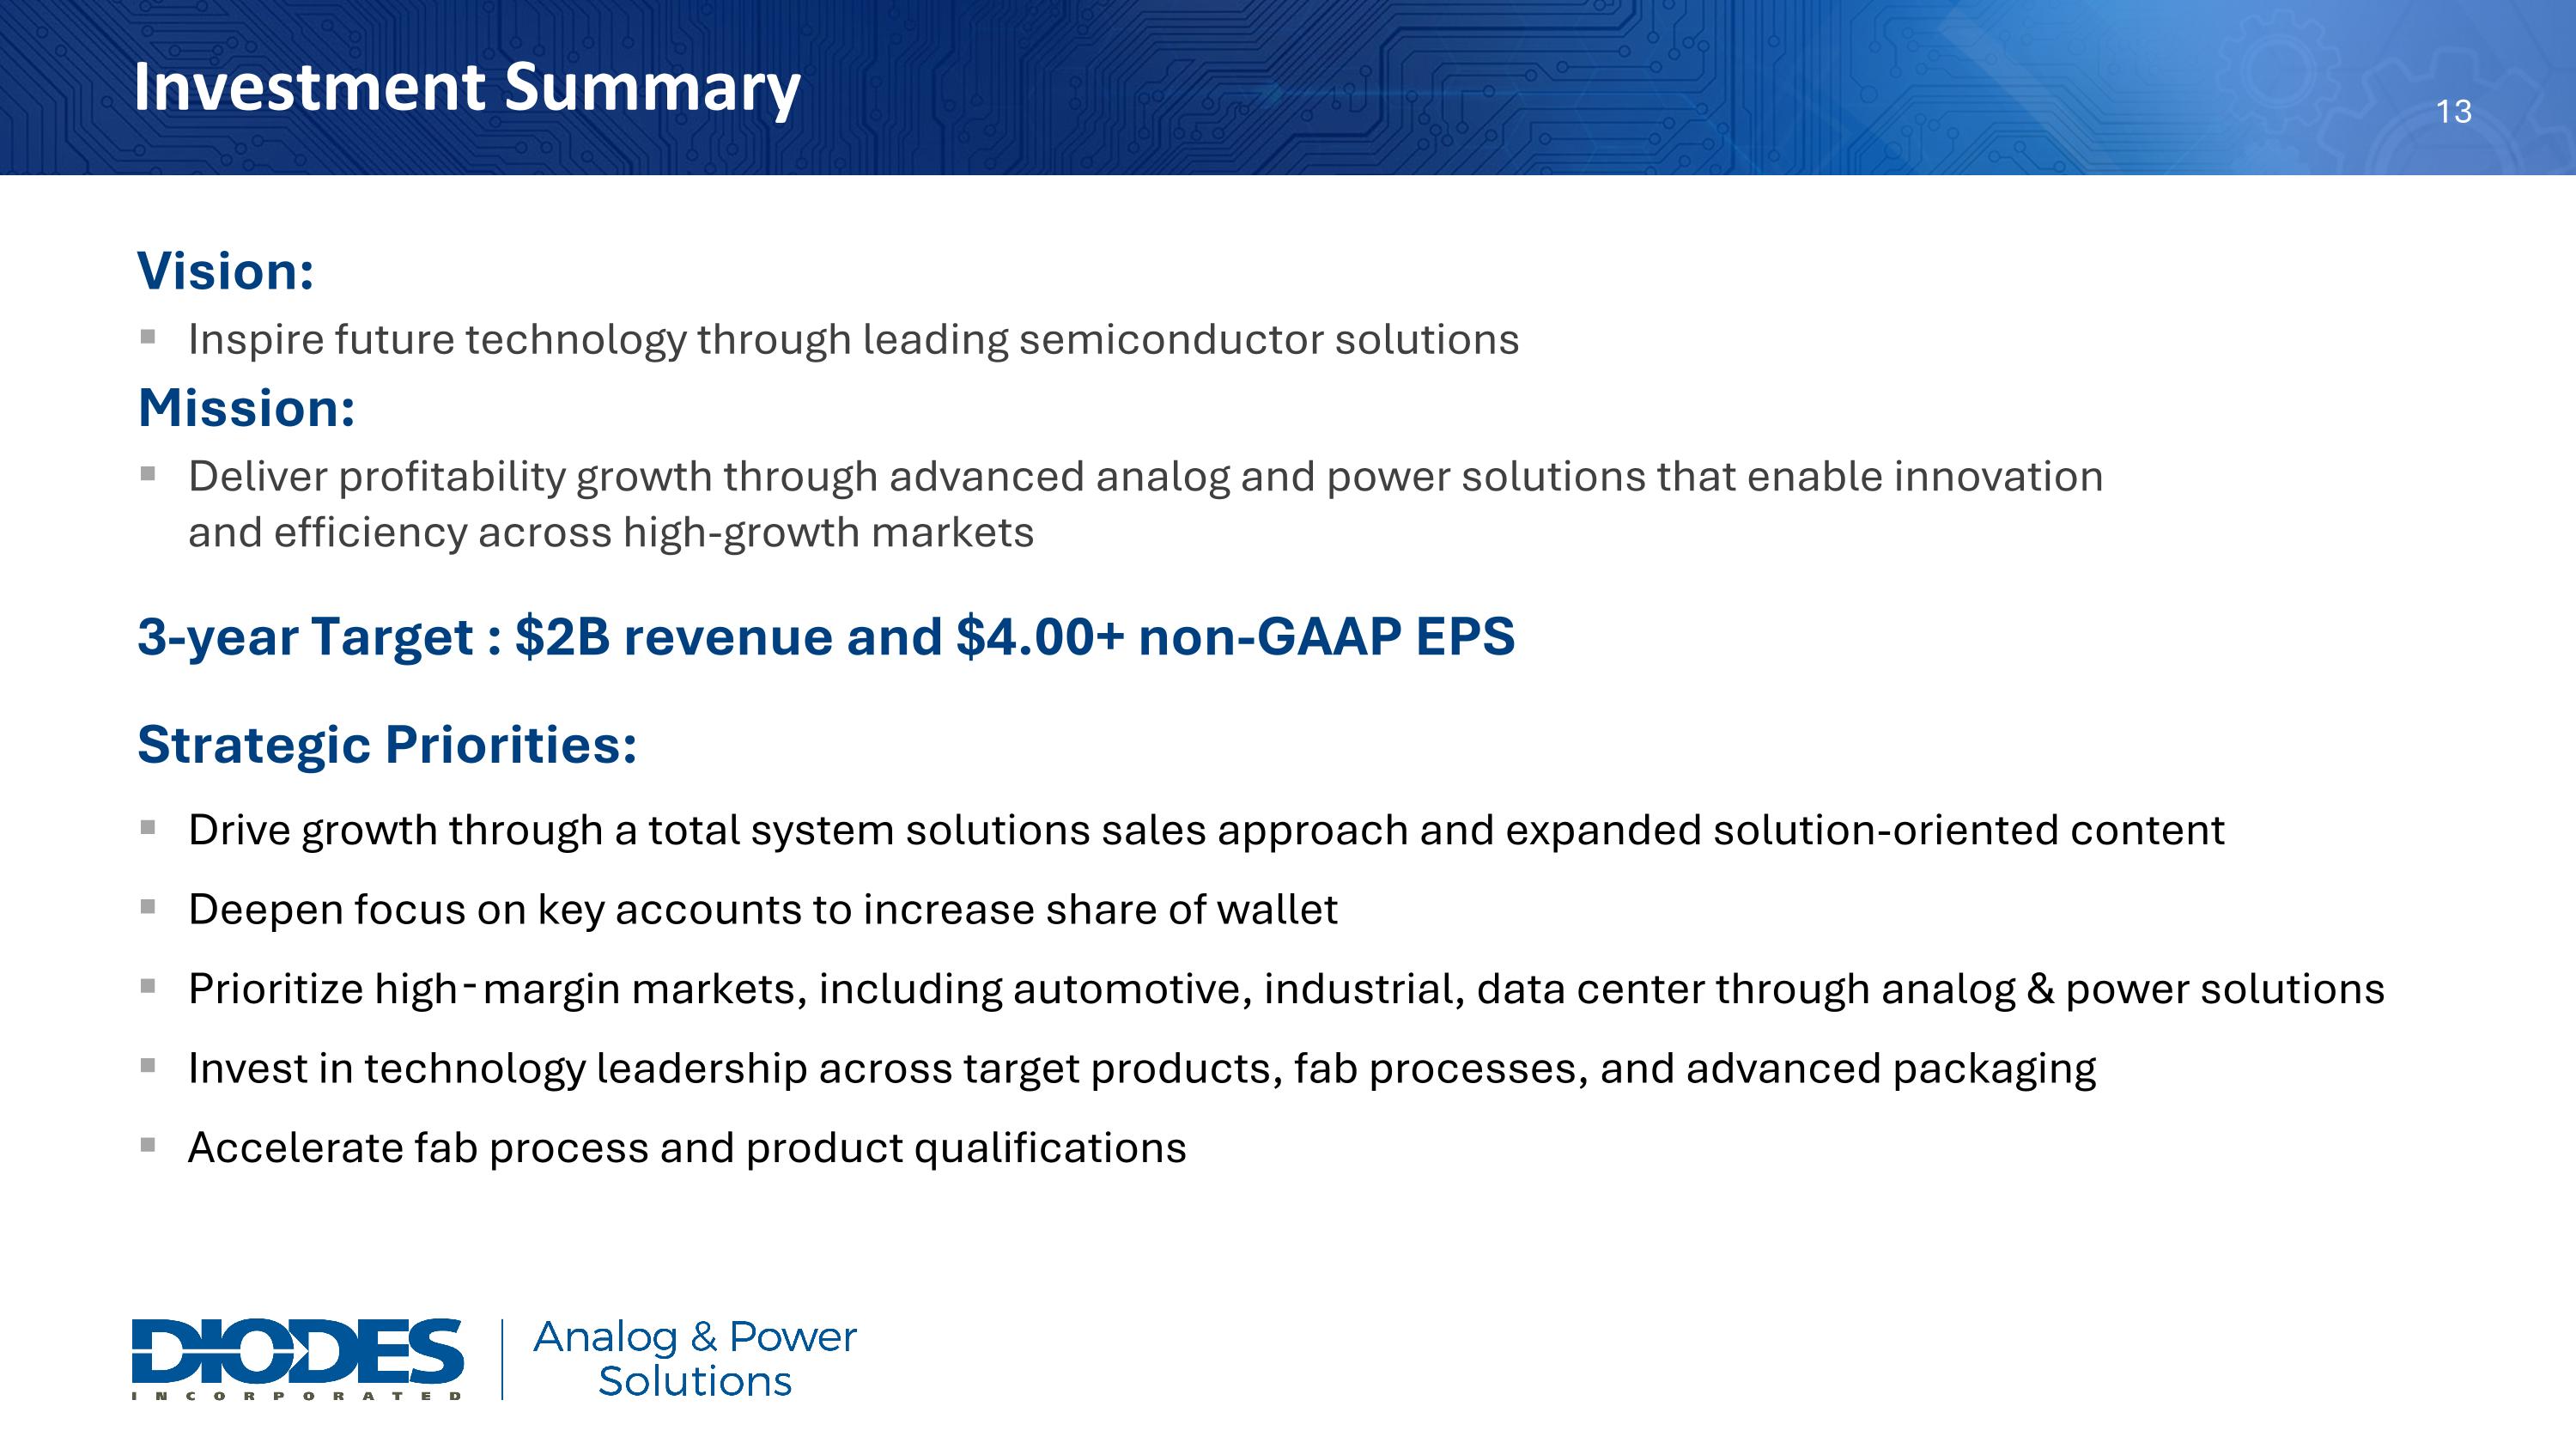
Investment Summary Vision: Inspire future technology through leading semiconductor solutions Mission: Deliver profitability growth through advanced analog and power solutions that enable innovation and efficiency across high-growth markets 3-year Target : $2B revenue and $4.00+ non-GAAP EPS Strategic Priorities: Drive growth through a total system solutions sales approach and expanded solution-oriented content Deepen focus on key accounts to increase share of wallet Prioritize high‑margin markets, including automotive, industrial, data center through analog & power solutions Invest in technology leadership across target products, fab processes, and advanced packaging Accelerate fab process and product qualifications

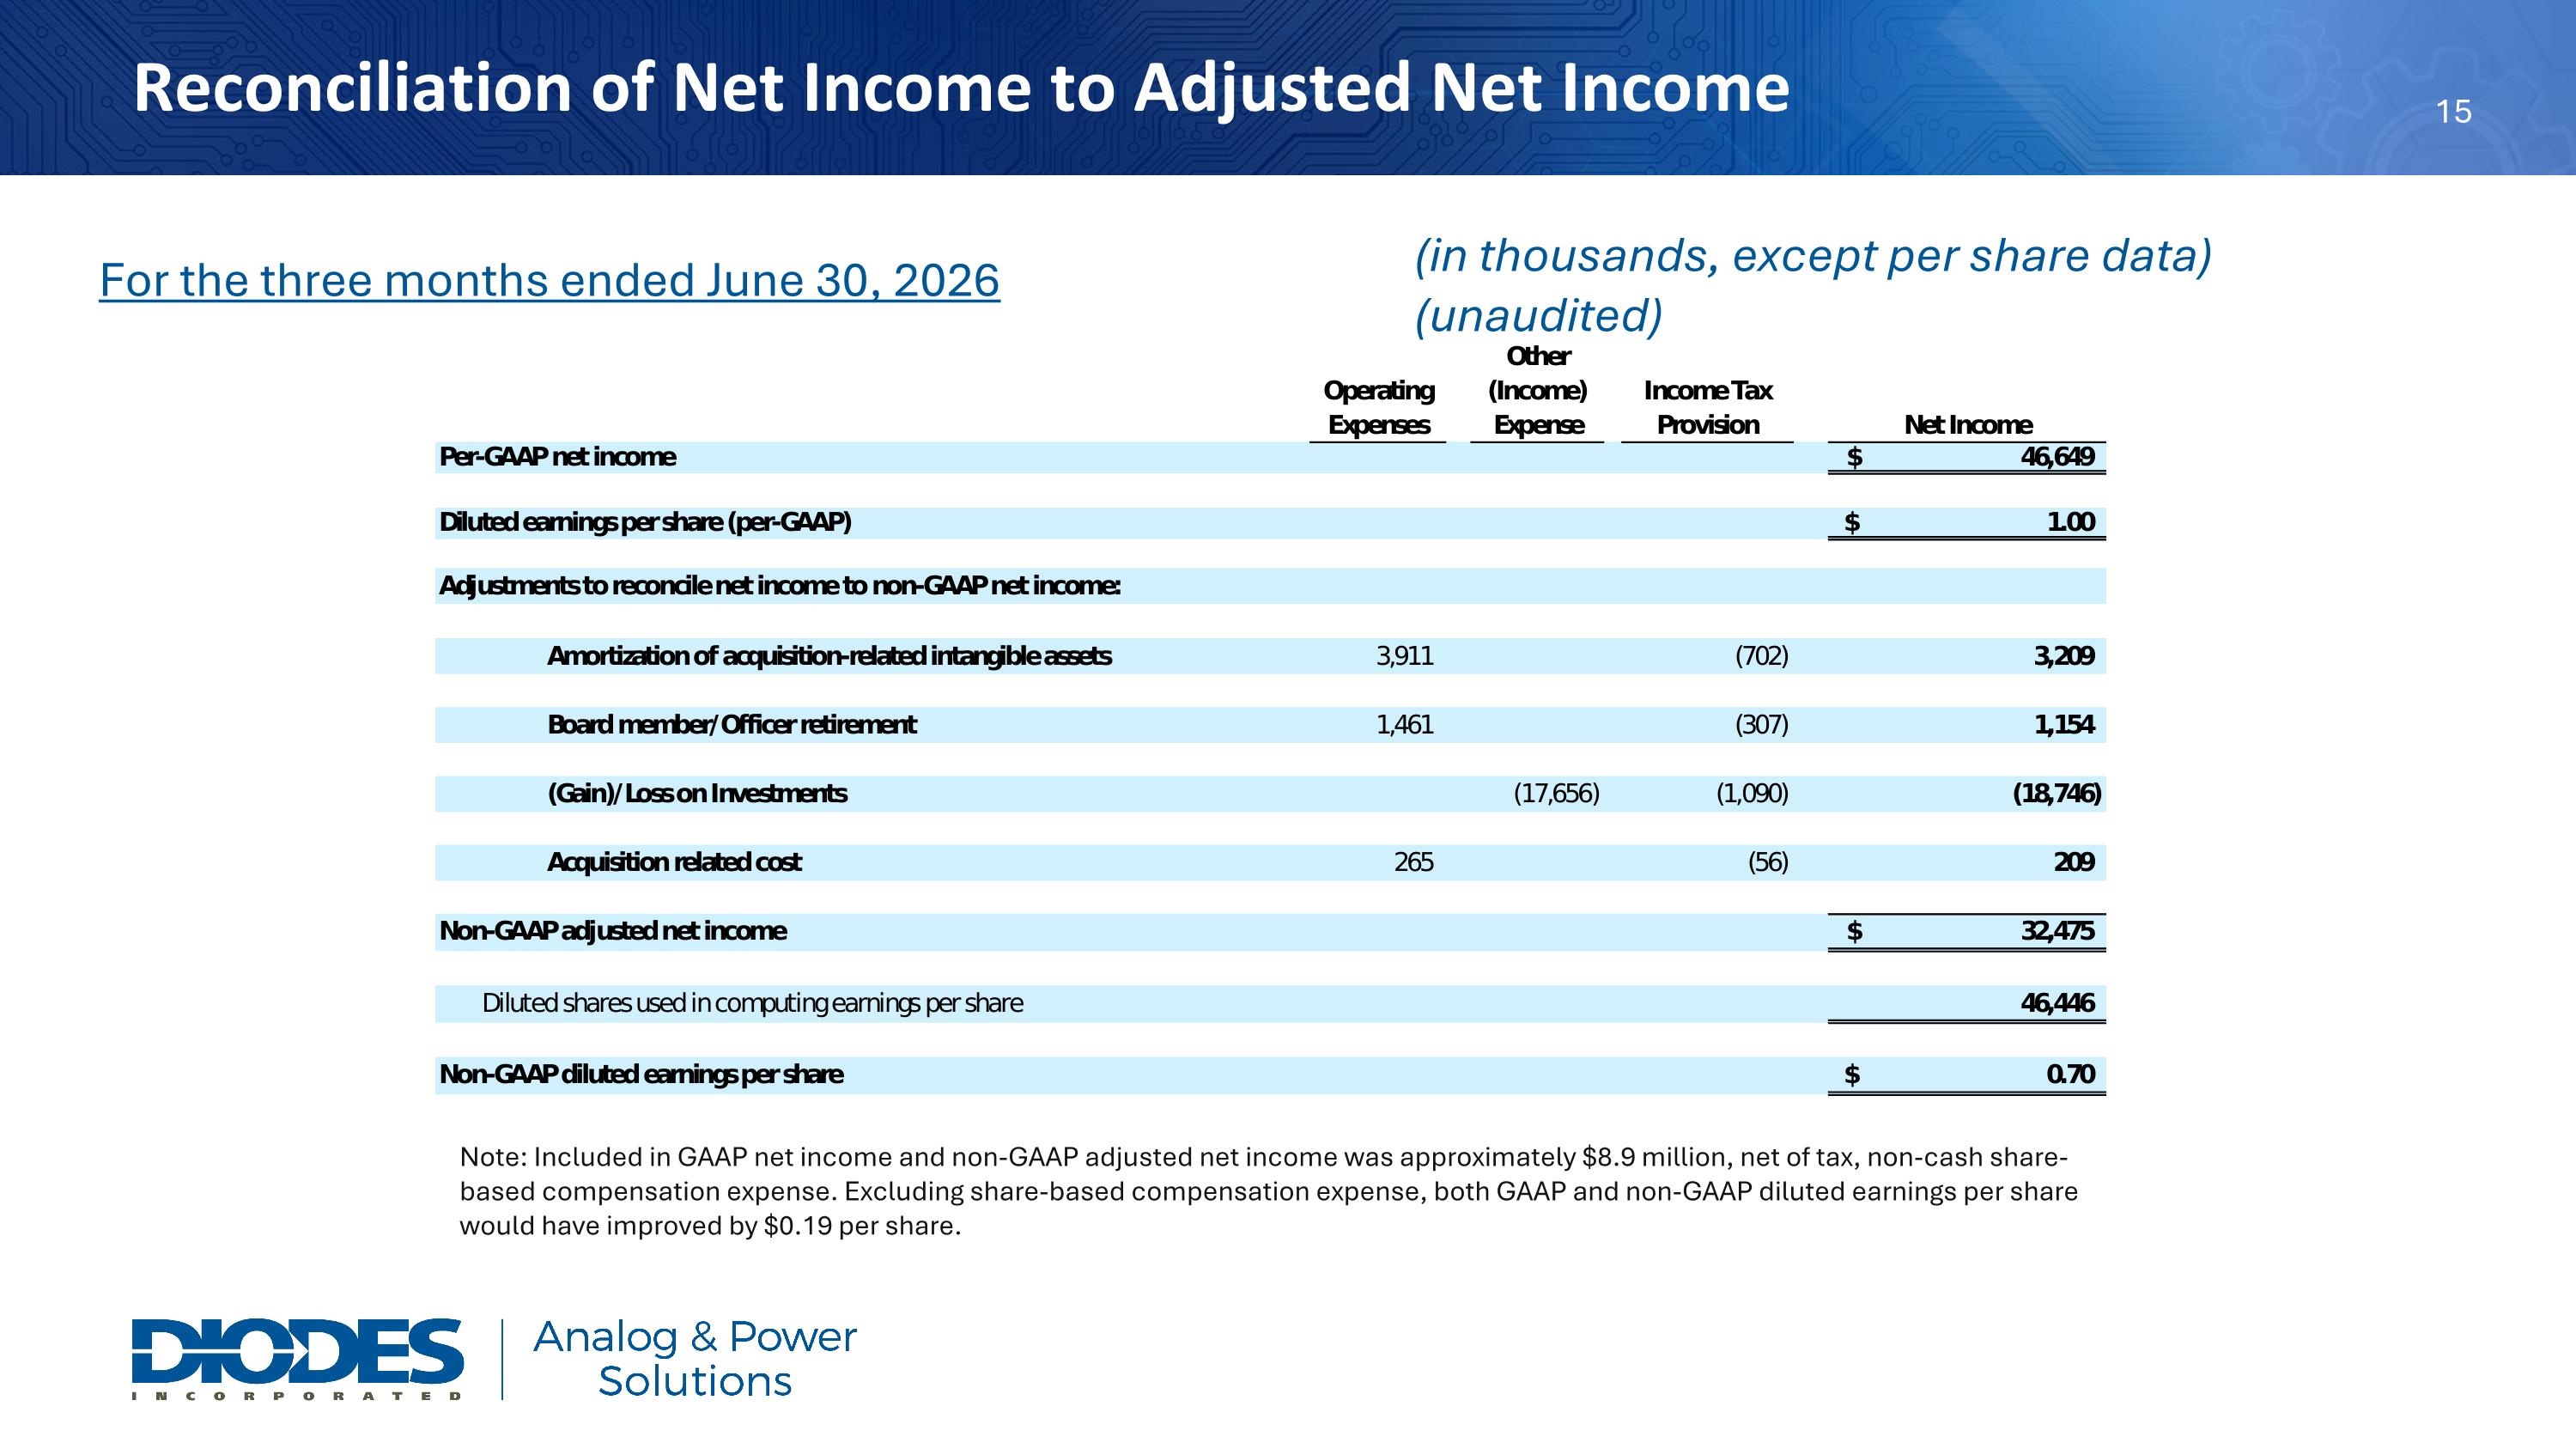
Reconciliation of Net Income to Adjusted Net Income (in thousands, except per share data) (unaudited) Note: Included in GAAP net income and non-GAAP adjusted net income was approximately $8.9 million, net of tax, non-cash share-based compensation expense. Excluding share-based compensation expense, both GAAP and non-GAAP diluted earnings per share would have improved by $0.19 per share. For the three months ended June 30, 2026
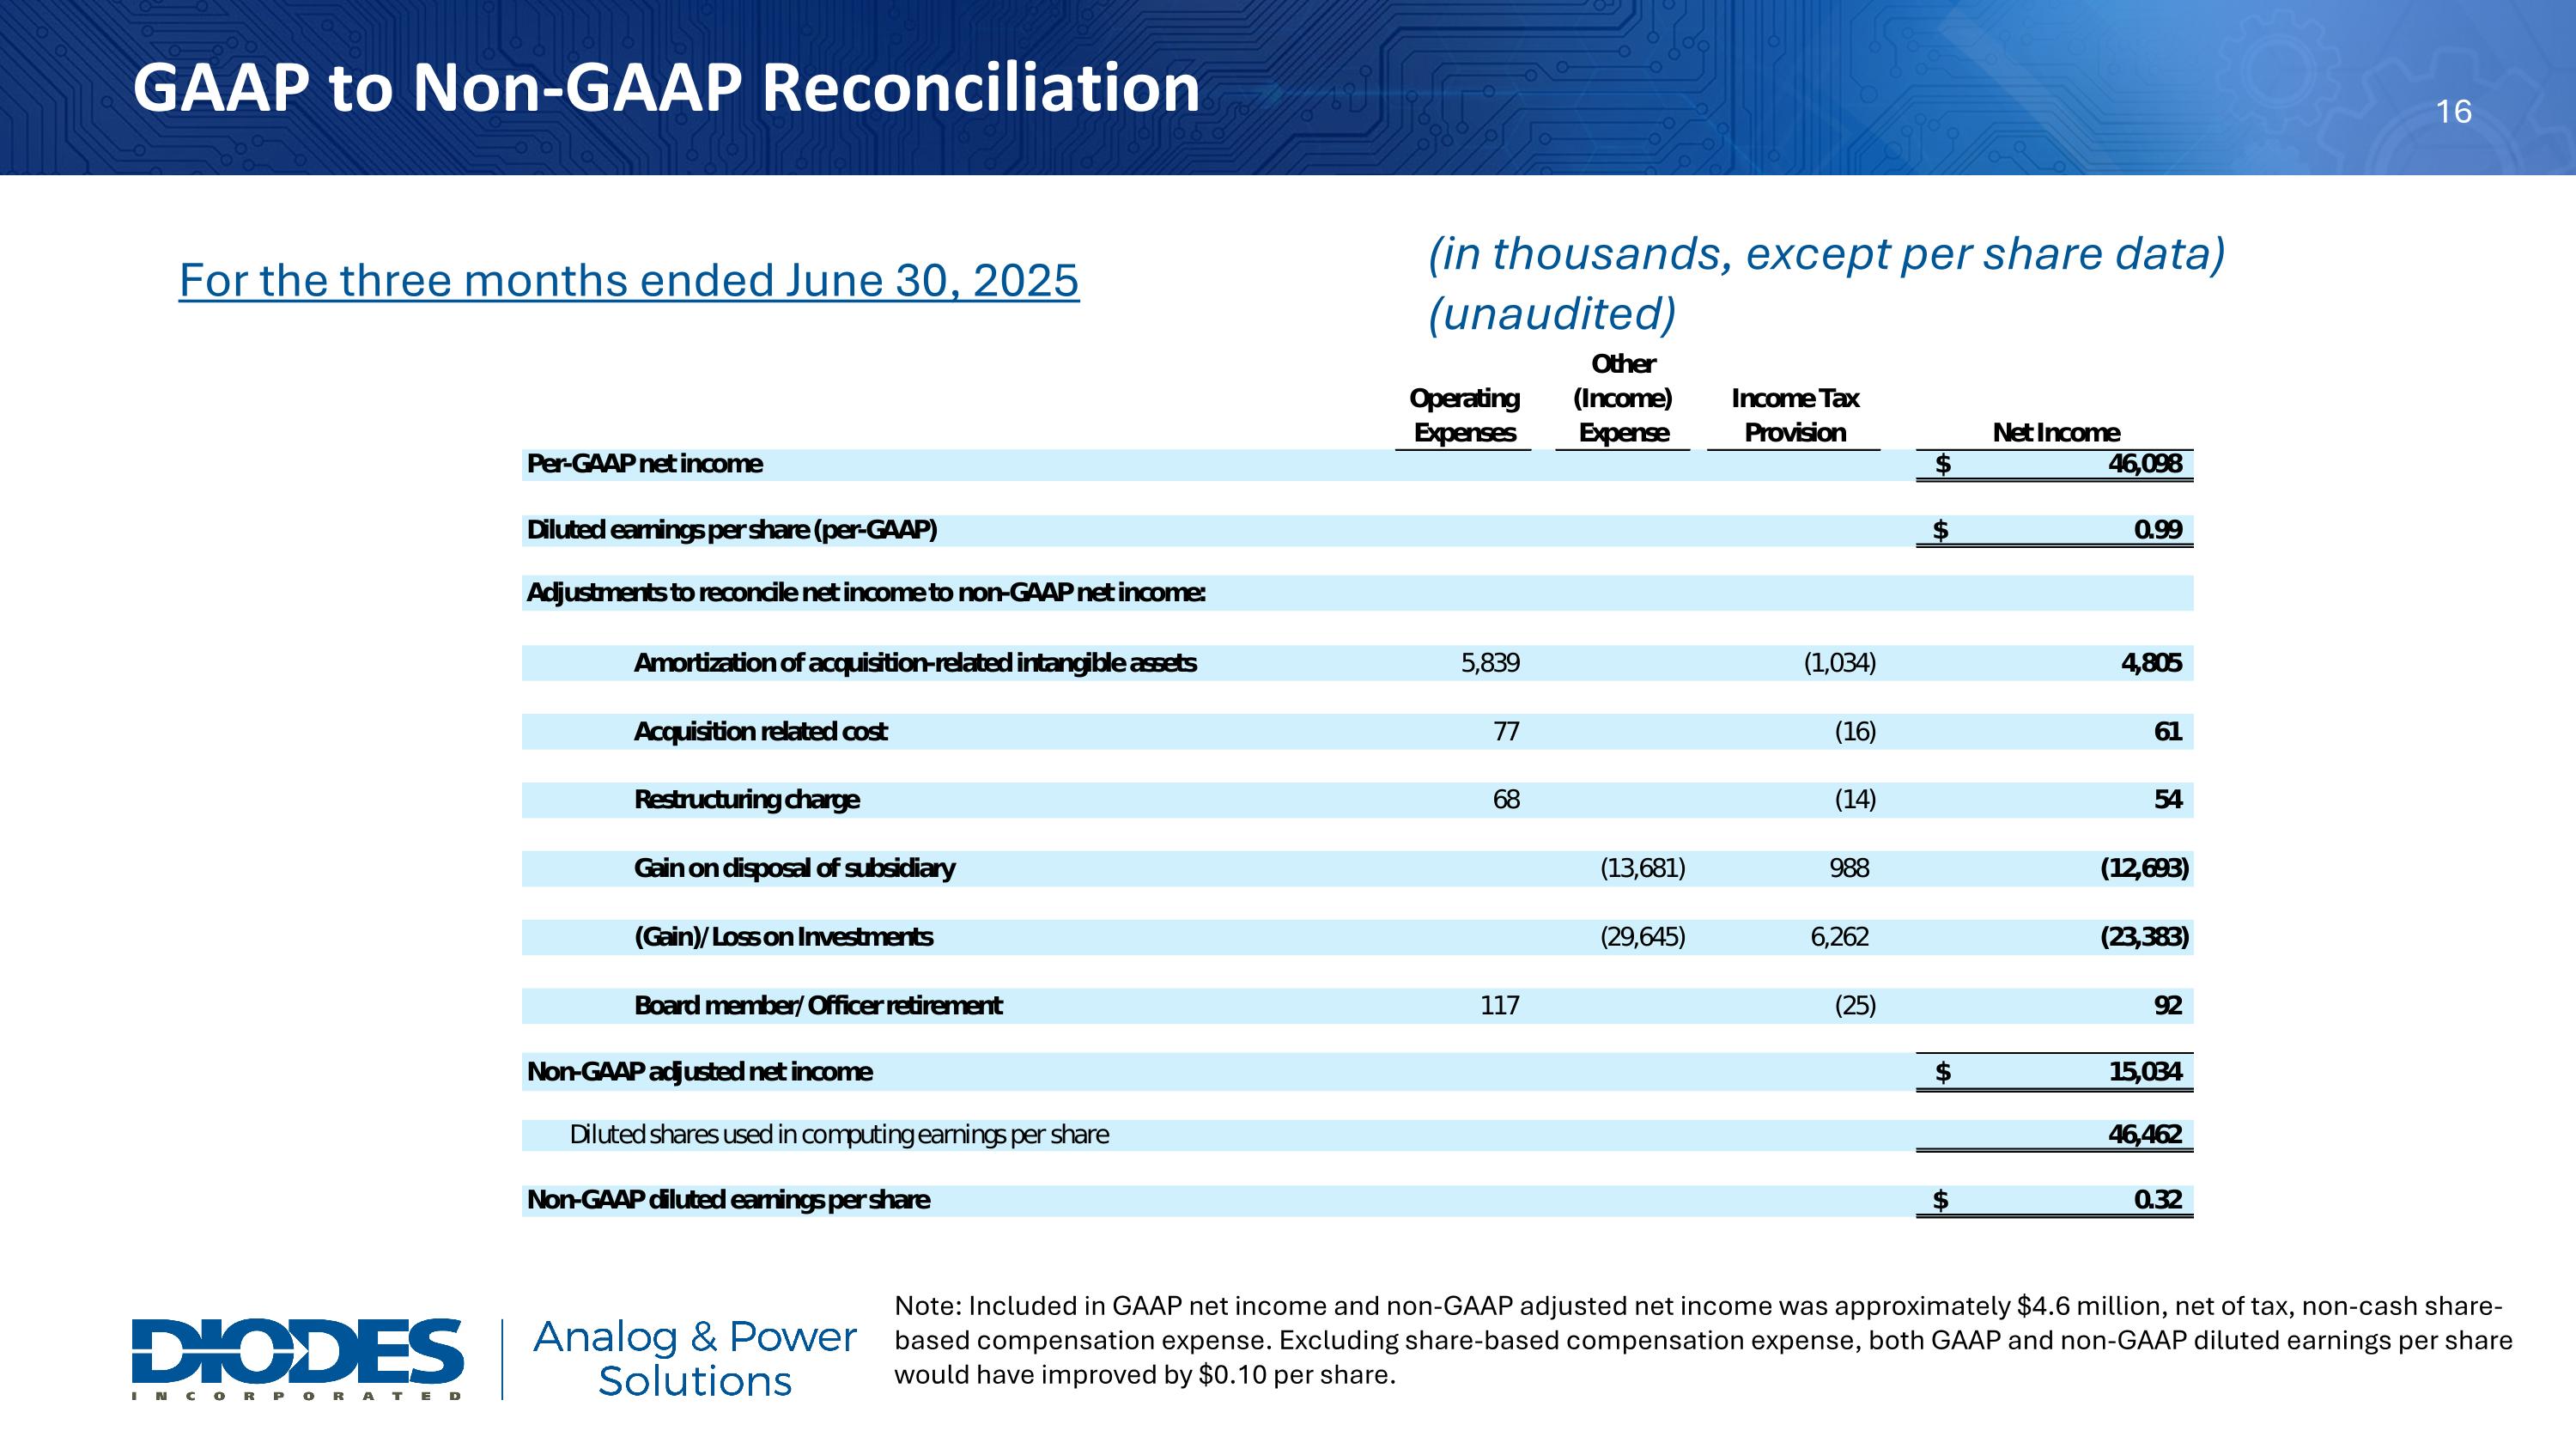
GAAP to Non-GAAP Reconciliation Note: Included in GAAP net income and non-GAAP adjusted net income was approximately $4.6 million, net of tax, non-cash share-based compensation expense. Excluding share-based compensation expense, both GAAP and non-GAAP diluted earnings per share would have improved by $0.10 per share. (in thousands, except per share data) (unaudited) For the three months ended June 30, 2025