stoneridge.com © 2026 Q2 2026 Results August 6, 2026 Exhibit 99.2
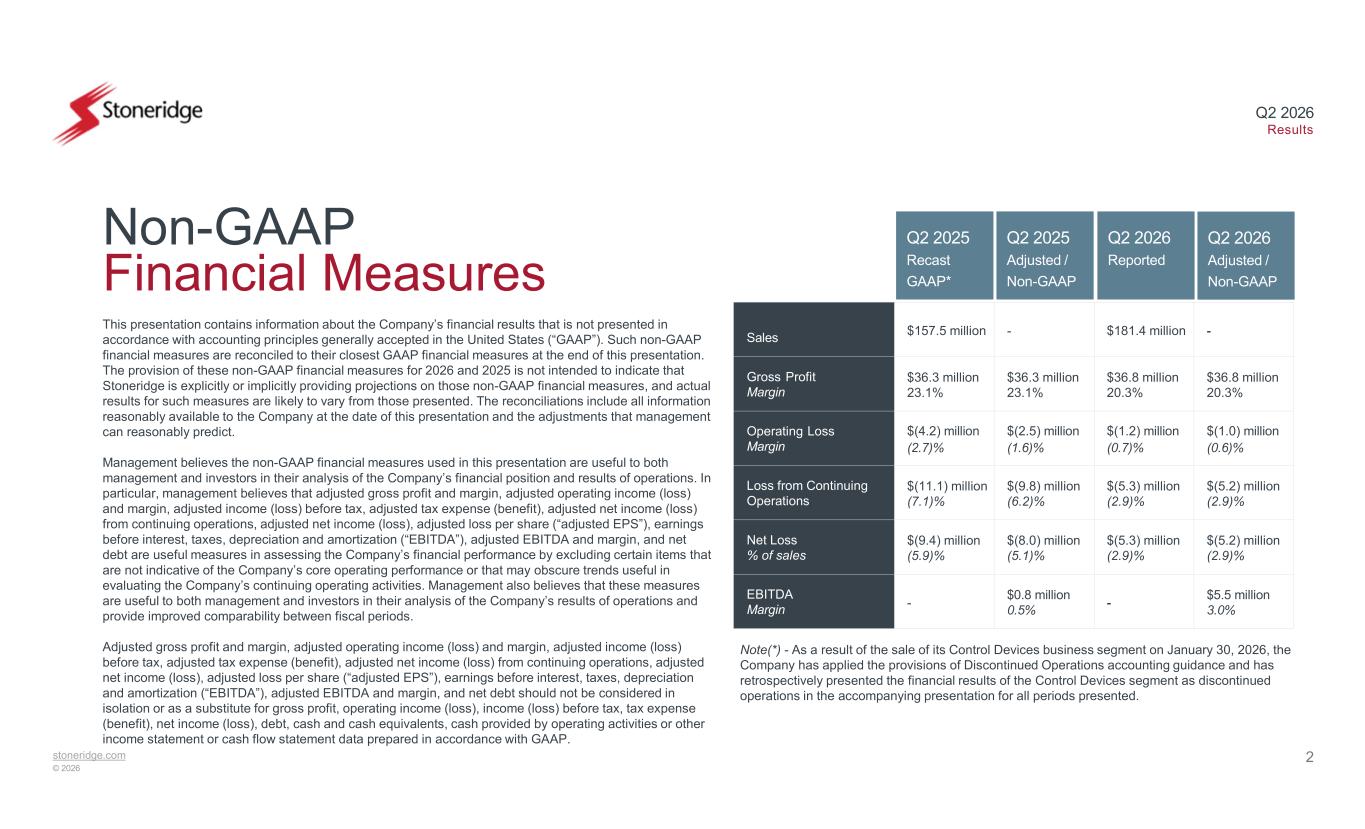
stoneridge.com © 2026 Q2 2026 Results 2 Non-GAAP Financial Measures This presentation contains information about the Company’s financial results that is not presented in accordance with accounting principles generally accepted in the United States (“GAAP”). Such non-GAAP financial measures are reconciled to their closest GAAP financial measures at the end of this presentation. The provision of these non-GAAP financial measures for 2026 and 2025 is not intended to indicate that Stoneridge is explicitly or implicitly providing projections on those non-GAAP financial measures, and actual results for such measures are likely to vary from those presented. The reconciliations include all information reasonably available to the Company at the date of this presentation and the adjustments that management can reasonably predict. Management believes the non-GAAP financial measures used in this presentation are useful to both management and investors in their analysis of the Company’s financial position and results of operations. In particular, management believes that adjusted gross profit and margin, adjusted operating income (loss) and margin, adjusted income (loss) before tax, adjusted tax expense (benefit), adjusted net income (loss) from continuing operations, adjusted net income (loss), adjusted loss per share (“adjusted EPS”), earnings before interest, taxes, depreciation and amortization (“EBITDA”), adjusted EBITDA and margin, and net debt are useful measures in assessing the Company’s financial performance by excluding certain items that are not indicative of the Company’s core operating performance or that may obscure trends useful in evaluating the Company’s continuing operating activities. Management also believes that these measures are useful to both management and investors in their analysis of the Company’s results of operations and provide improved comparability between fiscal periods. Adjusted gross profit and margin, adjusted operating income (loss) and margin, adjusted income (loss) before tax, adjusted tax expense (benefit), adjusted net income (loss) from continuing operations, adjusted net income (loss), adjusted loss per share (“adjusted EPS”), earnings before interest, taxes, depreciation and amortization (“EBITDA”), adjusted EBITDA and margin, and net debt should not be considered in isolation or as a substitute for gross profit, operating income (loss), income (loss) before tax, tax expense (benefit), net income (loss), debt, cash and cash equivalents, cash provided by operating activities or other income statement or cash flow statement data prepared in accordance with GAAP. Q2 2026 Reported Q2 2026 Adjusted / Non-GAAP -$181.4 million-$157.5 millionSales $36.8 million 20.3% $36.8 million 20.3% $36.3 million 23.1% $36.3 million 23.1% Gross Profit Margin $(1.0) million (0.6)% $(1.2) million (0.7)% $(2.5) million (1.6)% $(4.2) million (2.7)% Operating Loss Margin $(5.2) million (2.9)% $(5.3) million (2.9)% $(9.8) million (6.2)% $(11.1) million (7.1)% Loss from Continuing Operations $(5.2) million (2.9)% $(5.3) million (2.9)% $(8.0) million (5.1)% $(9.4) million (5.9)% Net Loss % of sales $5.5 million 3.0% - $0.8 million 0.5% - EBITDA Margin Q2 2025 Recast GAAP* Q2 2025 Adjusted / Non-GAAP Note(*) - As a result of the sale of its Control Devices business segment on January 30, 2026, the Company has applied the provisions of Discontinued Operations accounting guidance and has retrospectively presented the financial results of the Control Devices segment as discontinued operations in the accompanying presentation for all periods presented.
stoneridge.com © 2026 Q2 2026 Results 3 Forward-Looking Statements Statements in this presentation contain “forward-looking statements” under the Private Securities Litigation Reform Act of 1995. These statements appear in a number of places in this presentation and may include statements regarding the intent, belief or current expectations of the Company, with respect to, among other things, our (i) future product and facility expansion, (ii) strategic focus following the sale of the Control Devices segment (iii) acquisition strategy, (iv) investments and new product development, and (v) growth opportunities related to awarded business, and (vi) operational expectations. Forward-looking statements may be identified by the words “will,” “may,” “should,” “could,” “would,” “designed to,” “believes,” “plans,” “projects,” “intends,” “expects,” “estimates,” “anticipates,” “continue,” and similar words and expressions. The forward-looking statements are subject to risks and uncertainties that could cause actual events or results to differ materially from those expressed in or implied by these statements. Important factors that could cause actual results to differ materially from those in the forward-looking statements include, among other factors, the ability of our suppliers to supply us with parts and components at competitive prices on a timely basis, including the impact of potential tariffs and trade considerations on their operations and output; fluctuations in the cost and availability of key materials and components (including semiconductors, printed circuit boards, resin, aluminum, steel and copper) and our ability to offset cost increases through negotiated price increases with or reimbursements from our customers or other cost reduction actions, as necessary; global economic trends, competition and geopolitical risks, including impacts from ongoing or potential global conflicts and any related sanctions and other measures, or an escalation of sanctions, tariffs or other trade tensions between the U.S. and other countries; tariffs specifically in countries where we have significant direct or indirect manufacturing or supply chain exposure and our ability to either mitigate the impact of tariffs or pass any incremental costs to our customers; our ability to achieve cost reductions that offset or exceed customer-mandated selling price reductions; the reduced purchases, loss, financial distress or bankruptcy of a major customer or supplier; the costs and timing of business realignment, facility closures or similar actions; a significant change in commercial, automotive, off-highway or agricultural vehicle production; competitive market conditions and resulting effects on sales and pricing; foreign currency fluctuations and our ability to manage those impacts; customer acceptance of new products; our ability to successfully launch/produce products for awarded business; adverse changes in laws, government regulations or market conditions, affecting our products, our suppliers, or our customers’ products; our ability to protect intellectual property and successfully defend against assertions made against us; liabilities arising from warranty claims, product recall or field actions, product liability and legal proceedings to which we are or may become a party, or the impact of product recall or field actions on our customers; labor disruptions at our facilities or at any significant customers or suppliers; business disruptions due to natural disasters or other disasters outside of our control; the amount of our indebtedness and the restrictive covenants contained in the agreements governing its indebtedness, including our revolving credit facility; capital availability or costs, including changes in interest rates; refinancing risk and access to capital markets and liquidity; the failure to achieve successful integration of any acquired company or business; risks related to a failure of our information technology systems and networks, and risks associated with current and emerging technology threats and damage from computer viruses, unauthorized access, cyber- attack and other similar disruptions, the occurrence or non-occurrence of circumstances beyond Stoneridge’s control; and the items described in Part I, Item 1A (“Risk Factors”) and other uncertainties or risks disclosed in Stoneridge’s periodic and current reports, including the Form 10-Ks and Form 10-Qs, filed with the Securities and Exchange Commission. The forward-looking statements contained herein represent our estimates only as of the date of this filing and should not be relied upon as representing our estimates as of any subsequent date. While we may elect to update these forward-looking statements at some point in the future, except as required by law, we specifically disclaim any obligation to do so, whether to reflect actual results, changes in assumptions, changes in other factors affecting such forward-looking statements or otherwise. Rounding Disclosure: There may be slight immaterial differences between figures represented in our public filings compared to what is shown in this presentation. The differences are the result of rounding due to the representation of values in millions rather than thousands in public filings.
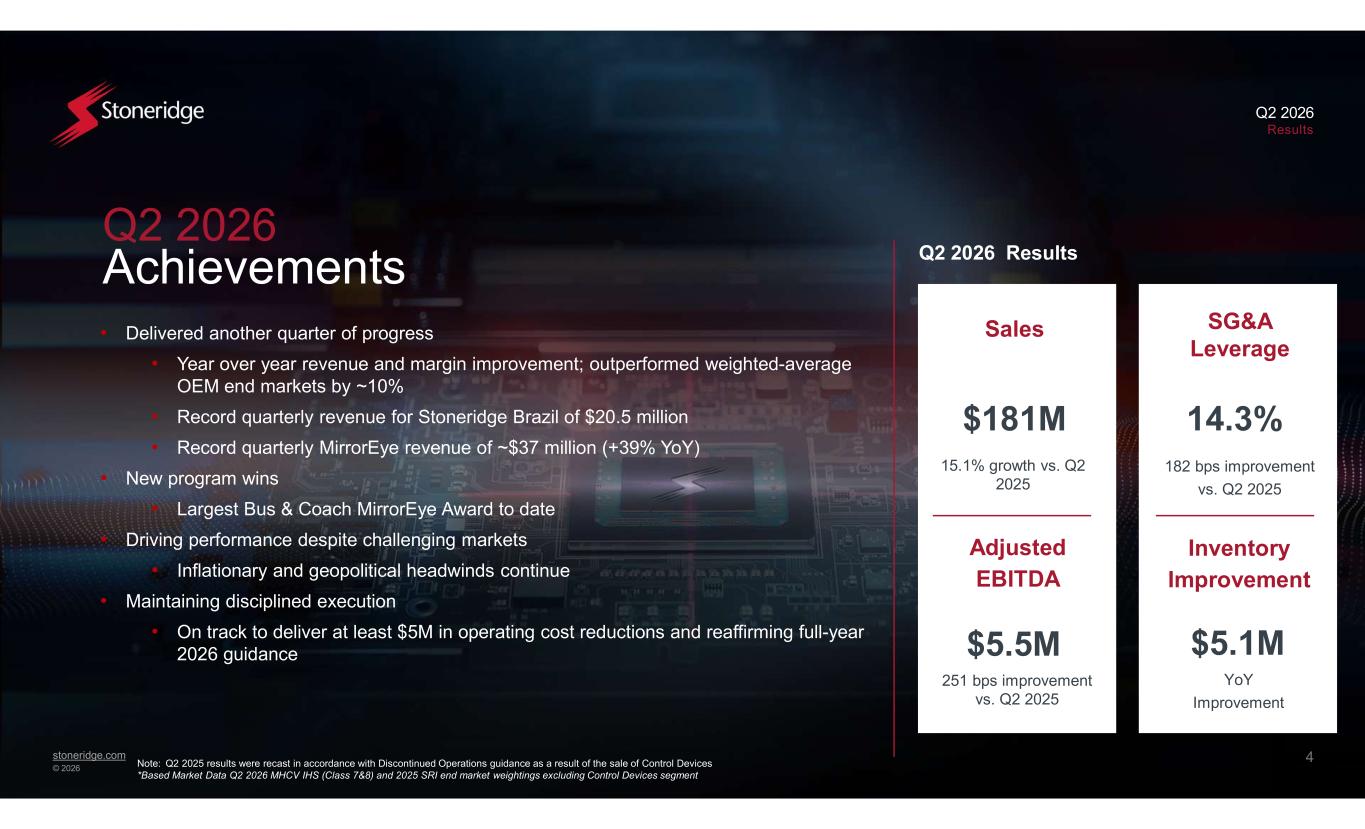
stoneridge.com © 2026 Q2 2026 Results 4 Q2 2026 Achievements • Delivered another quarter of progress • Year over year revenue and margin improvement; outperformed weighted-average OEM end markets by ~10% • Record quarterly revenue for Stoneridge Brazil of $20.5 million • Record quarterly MirrorEye revenue of ~$37 million (+39% YoY) • New program wins • Largest Bus & Coach MirrorEye Award to date • Driving performance despite challenging markets • Inflationary and geopolitical headwinds continue • Maintaining disciplined execution • On track to deliver at least $5M in operating cost reductions and reaffirming full-year 2026 guidance Sales $181M 15.1% growth vs. Q2 2025 Q2 2026 Results 182 bps improvement vs. Q2 2025 14.3% Inventory Improvement $5.1M YoY Improvement SG&A Leverage 251 bps improvement vs. Q2 2025 $5.5M Adjusted EBITDA Includes $0.5m of non-operating FX expenseNote: Q2 2025 results were recast in accordance with Discontinued Operations guidance as a result of the sale of Control Devices *Based Market Data Q2 2026 MHCV IHS (Class 7&8) and 2025 SRI end market weightings excluding Control Devices segment
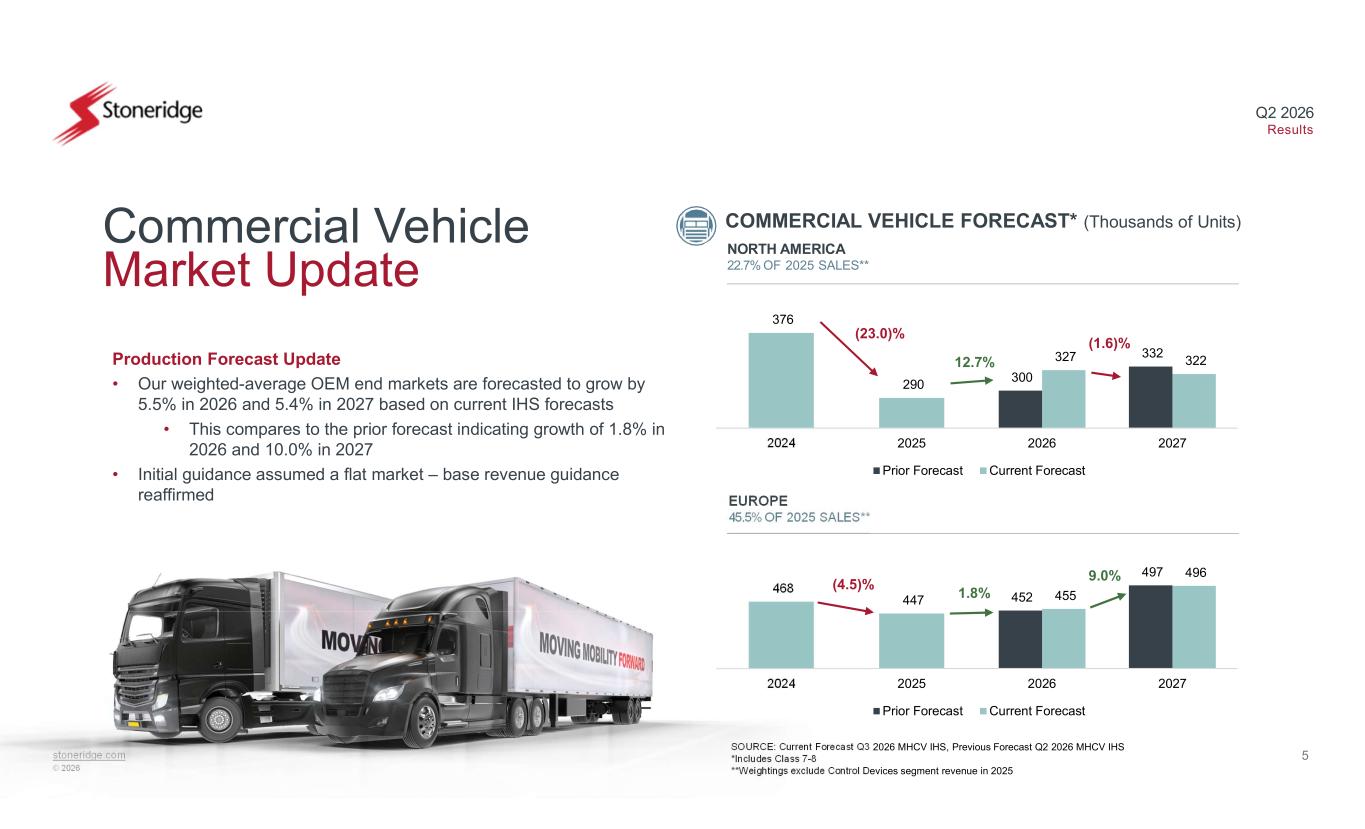
stoneridge.com © 2026 Q2 2026 Results 452 497 455 496 468 447 2024 2025 2026 2027 Prior Forecast Current Forecast 300 332 327 322 376 290 2024 2025 2026 2027 Prior Forecast Current Forecast 5 Commercial Vehicle Market Update NORTH AMERICA 22.7% OF 2025 SALES** EUROPE 45.5% OF 2025 SALES** COMMERCIAL VEHICLE FORECAST* (Thousands of Units) SOURCE: Current Forecast Q3 2026 MHCV IHS, Previous Forecast Q2 2026 MHCV IHS *Includes Class 7-8 **Weightings exclude Control Devices segment revenue in 2025 (23.0)% 12.7% (1.6)% (4.5)% 1.8% 9.0% Production Forecast Update • Our weighted-average OEM end markets are forecasted to grow by 5.5% in 2026 and 5.4% in 2027 based on current IHS forecasts • This compares to the prior forecast indicating growth of 1.8% in 2026 and 10.0% in 2027 • Initial guidance assumed a flat market – base revenue guidance reaffirmed
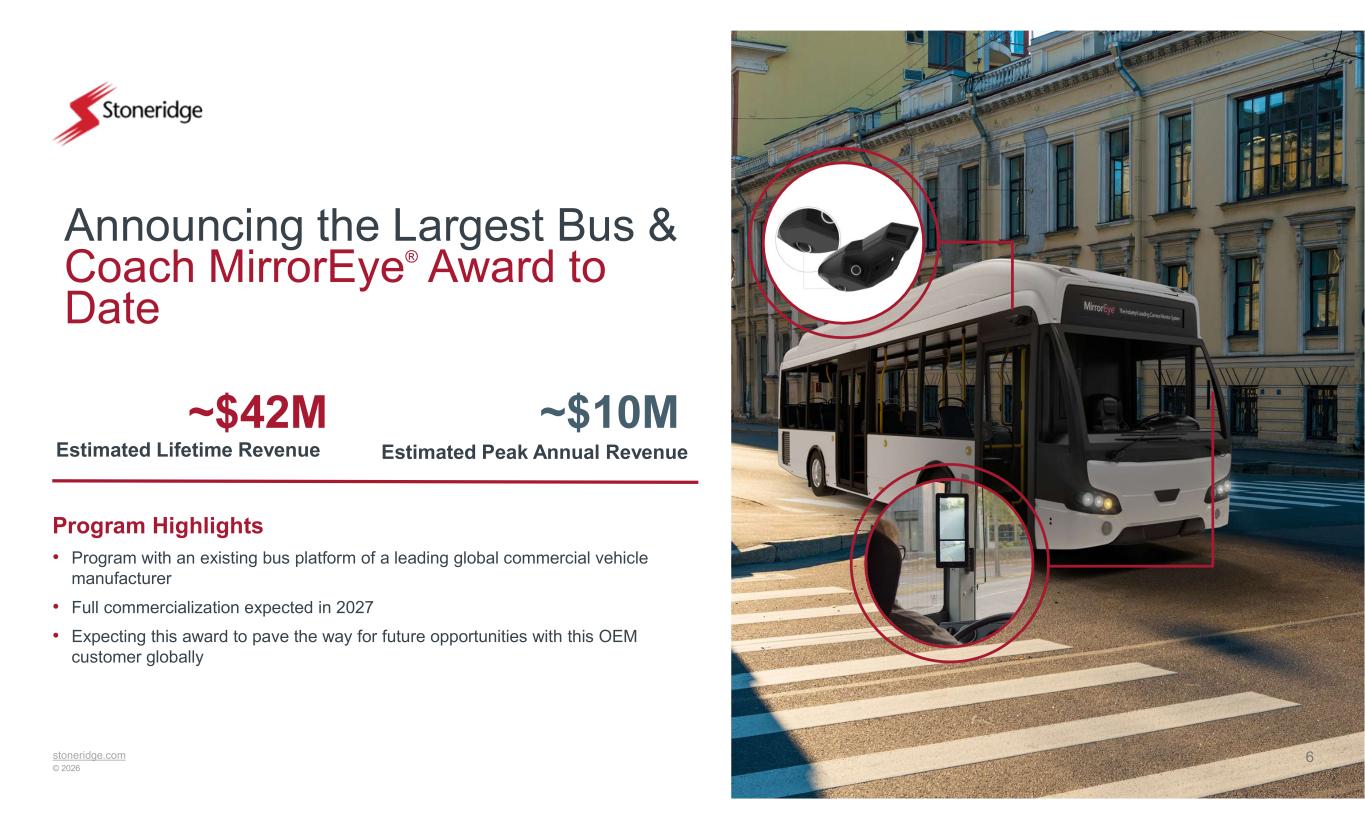
stoneridge.com © 2026 Q2 2026 Results Announcing the Largest Bus & Coach MirrorEye® Award to Date 6 Program Highlights • Program with an existing bus platform of a leading global commercial vehicle manufacturer • Full commercialization expected in 2027 • Expecting this award to pave the way for future opportunities with this OEM customer globally ~$42M Estimated Lifetime Revenue ~$10M Estimated Peak Annual Revenue
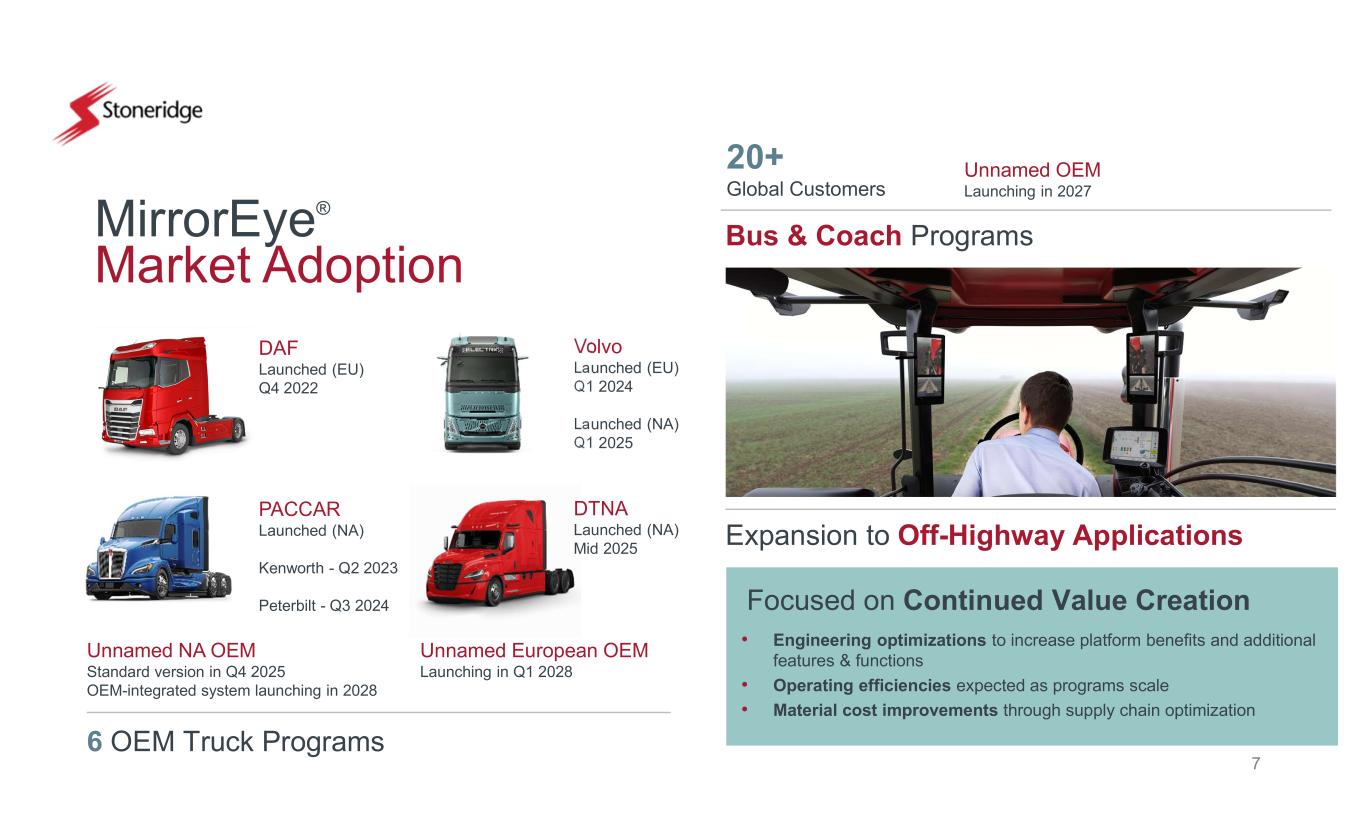
MirrorEye® Market Adoption DAF Launched (EU) Q4 2022 PACCAR Launched (NA) Kenworth - Q2 2023 Peterbilt - Q3 2024 Volvo Launched (EU) Q1 2024 Launched (NA) Q1 2025 DTNA Launched (NA) Mid 2025 6 OEM Truck Programs Bus & Coach Programs 7 Unnamed NA OEM Standard version in Q4 2025 OEM-integrated system launching in 2028 Unnamed European OEM Launching in Q1 2028 Expansion to Off-Highway Applications Focused on Continued Value Creation • Engineering optimizations to increase platform benefits and additional features & functions • Operating efficiencies expected as programs scale • Material cost improvements through supply chain optimization Unnamed OEM Launching in 2027 20+ Global Customers

stoneridge.com © 2026 Financial Update Exhibit 99.2
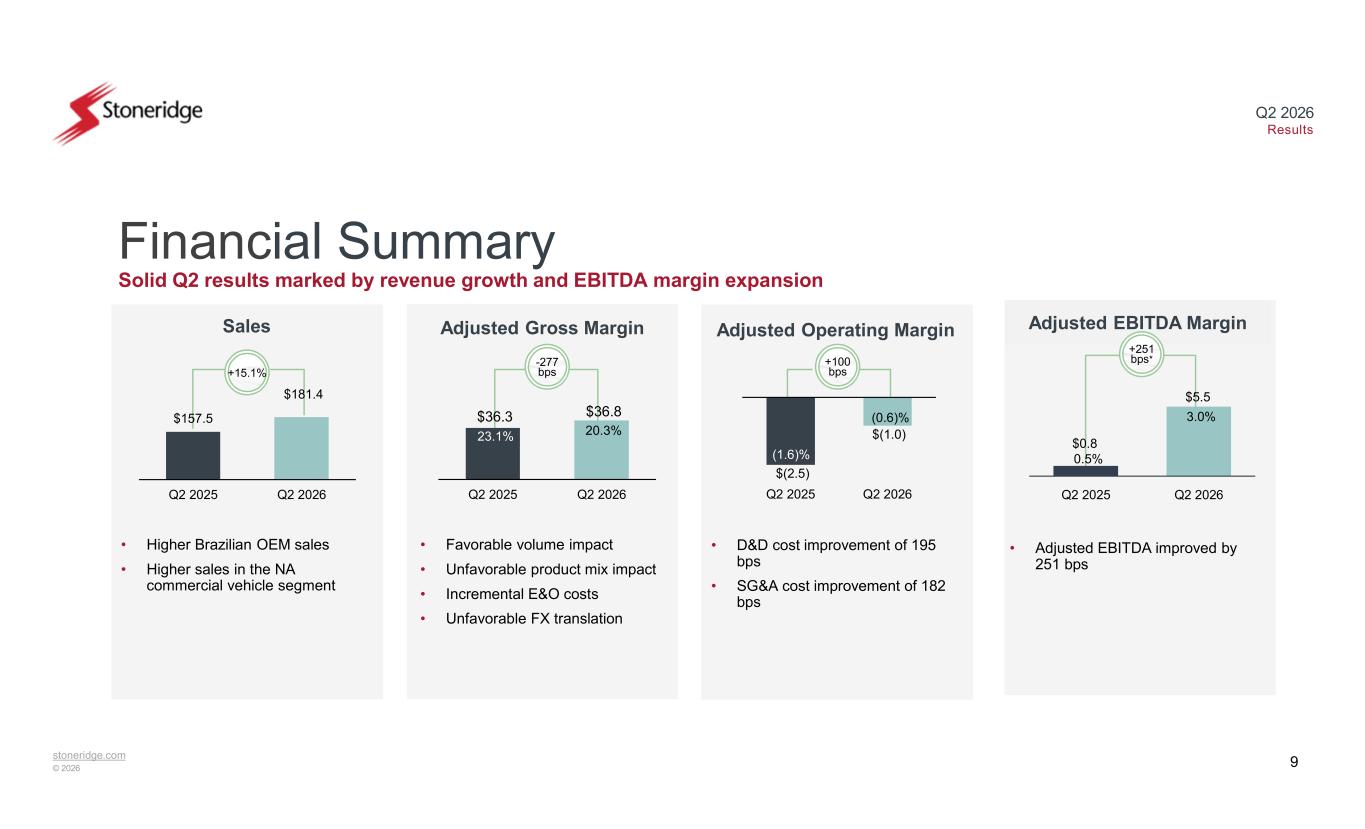
stoneridge.com © 2026 Q2 2026 Results $0.8 $5.5 Q2 2025 Q2 2026 Financial Summary Solid Q2 results marked by revenue growth and EBITDA margin expansion • D&D cost improvement of 195 bps • SG&A cost improvement of 182 bps • Adjusted EBITDA improved by 251 bps • Higher Brazilian OEM sales • Higher sales in the NA commercial vehicle segment Sales Adjusted Gross Margin Adjusted Operating Margin Adjusted EBITDA Margin -277 bps +100 bps +251 bps* 9 0.5% 3.0%$157.5 $181.4 Q2 2025 Q2 2026 +15.1% 23.1% • Favorable volume impact • Unfavorable product mix impact • Incremental E&O costs • Unfavorable FX translation $(2.5) $(1.0) Q2 2025 Q2 2026 $36.3 $36.8 Q2 2025 Q2 2026 (1.6)% (0.6)% 23.1% 20.3%
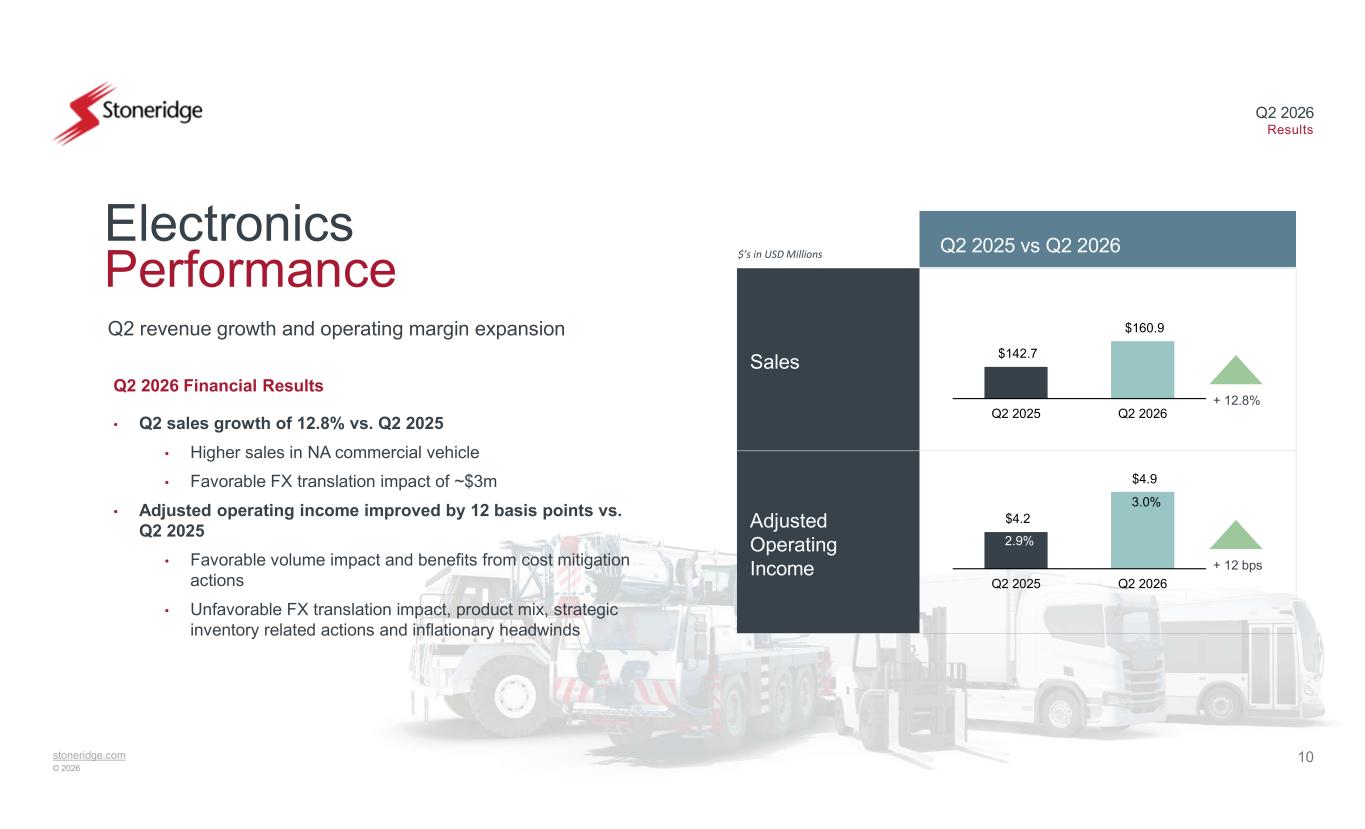
10stoneridge.com © 2026 Q2 2026 Results Sales Adjusted Operating Income $4.2 $4.9 Q2 2025 Q2 2026 Electronics Performance Q2 2026 Financial Results • Q2 sales growth of 12.8% vs. Q2 2025 • Higher sales in NA commercial vehicle • Favorable FX translation impact of ~$3m • Adjusted operating income improved by 12 basis points vs. Q2 2025 • Favorable volume impact and benefits from cost mitigation actions • Unfavorable FX translation impact, product mix, strategic inventory related actions and inflationary headwinds Q2 revenue growth and operating margin expansion Q2 2025 vs Q2 2026$’s in USD Millions + 12.8% $142.7 $160.9 Q2 2025 Q2 2026 2.9% 3.0% + 12 bps
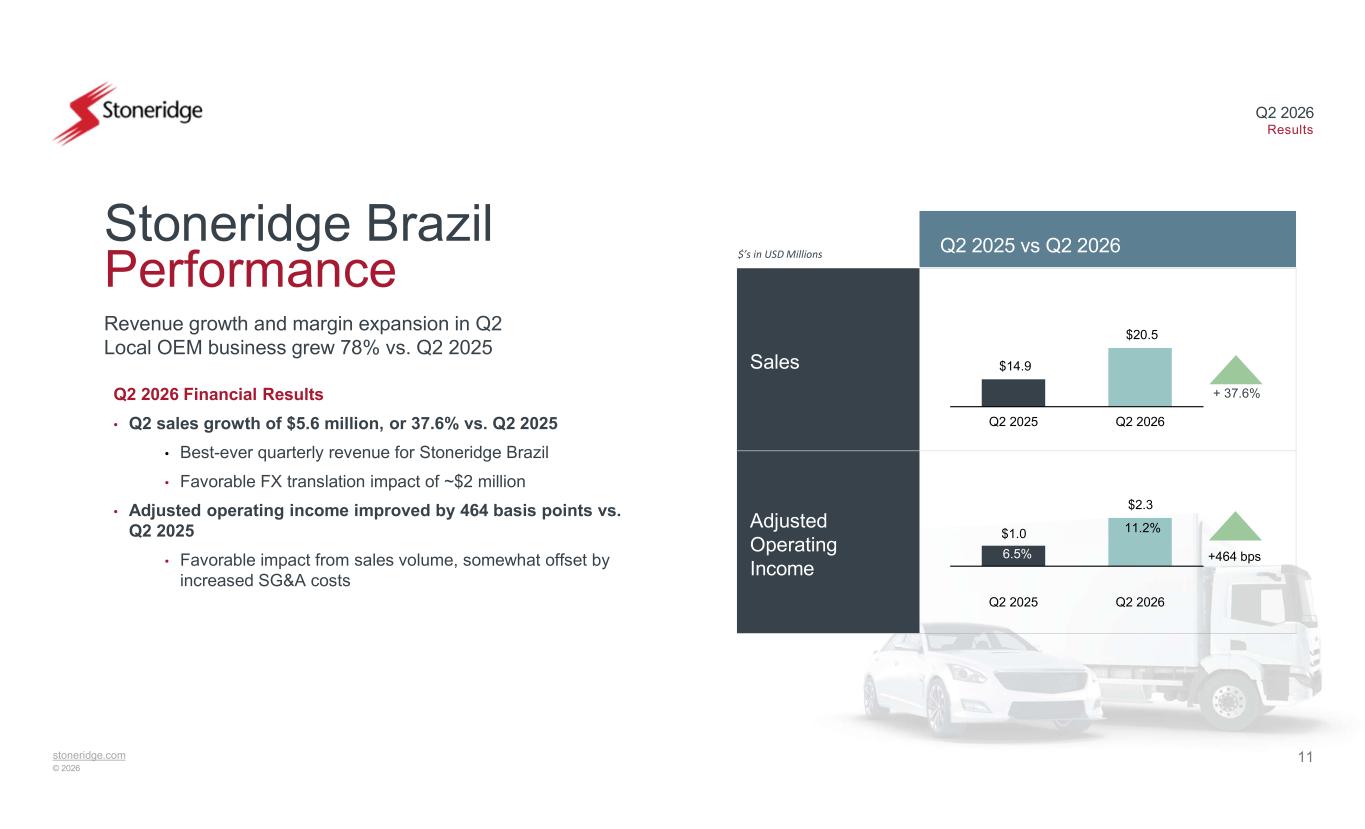
11stoneridge.com © 2026 Q2 2026 Results Sales Adjusted Operating Income Stoneridge Brazil Performance Q2 2026 Financial Results • Q2 sales growth of $5.6 million, or 37.6% vs. Q2 2025 • Best-ever quarterly revenue for Stoneridge Brazil • Favorable FX translation impact of ~$2 million • Adjusted operating income improved by 464 basis points vs. Q2 2025 • Favorable impact from sales volume, somewhat offset by increased SG&A costs Revenue growth and margin expansion in Q2 Local OEM business grew 78% vs. Q2 2025 Q2 2025 vs Q2 2026$’s in USD Millions + 37.6% +464 bps $1.0 $2.3 Q2 2025 Q2 2026 $14.9 $20.5 Q2 2025 Q2 2026 6.5% 11.2%
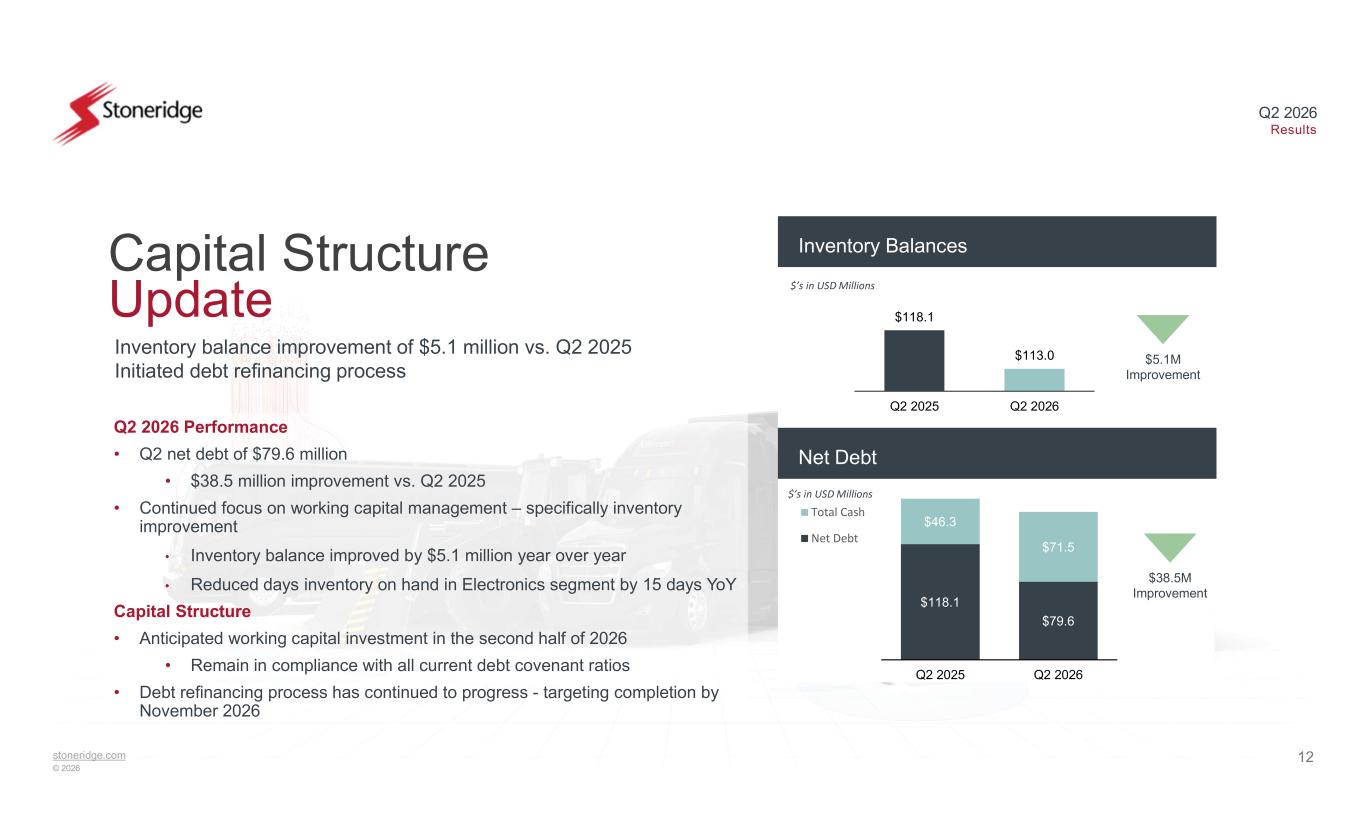
12stoneridge.com © 2026 Q2 2026 Results Q2 2026 Performance • Q2 net debt of $79.6 million • $38.5 million improvement vs. Q2 2025 • Continued focus on working capital management – specifically inventory improvement • Inventory balance improved by $5.1 million year over year • Reduced days inventory on hand in Electronics segment by 15 days YoY Capital Structure • Anticipated working capital investment in the second half of 2026 • Remain in compliance with all current debt covenant ratios • Debt refinancing process has continued to progress - targeting completion by November 2026 Capital Structure Update Inventory balance improvement of $5.1 million vs. Q2 2025 Initiated debt refinancing process Inventory Balances $5.1M Improvement $’s in USD Millions $’s in USD Millions Net Debt $38.5M Improvement $118.1 $79.6 $46.3 $71.5 Q2 2025 Q2 2026 Total Cash Net Debt $118.1 $113.0 Q2 2025 Q2 2026
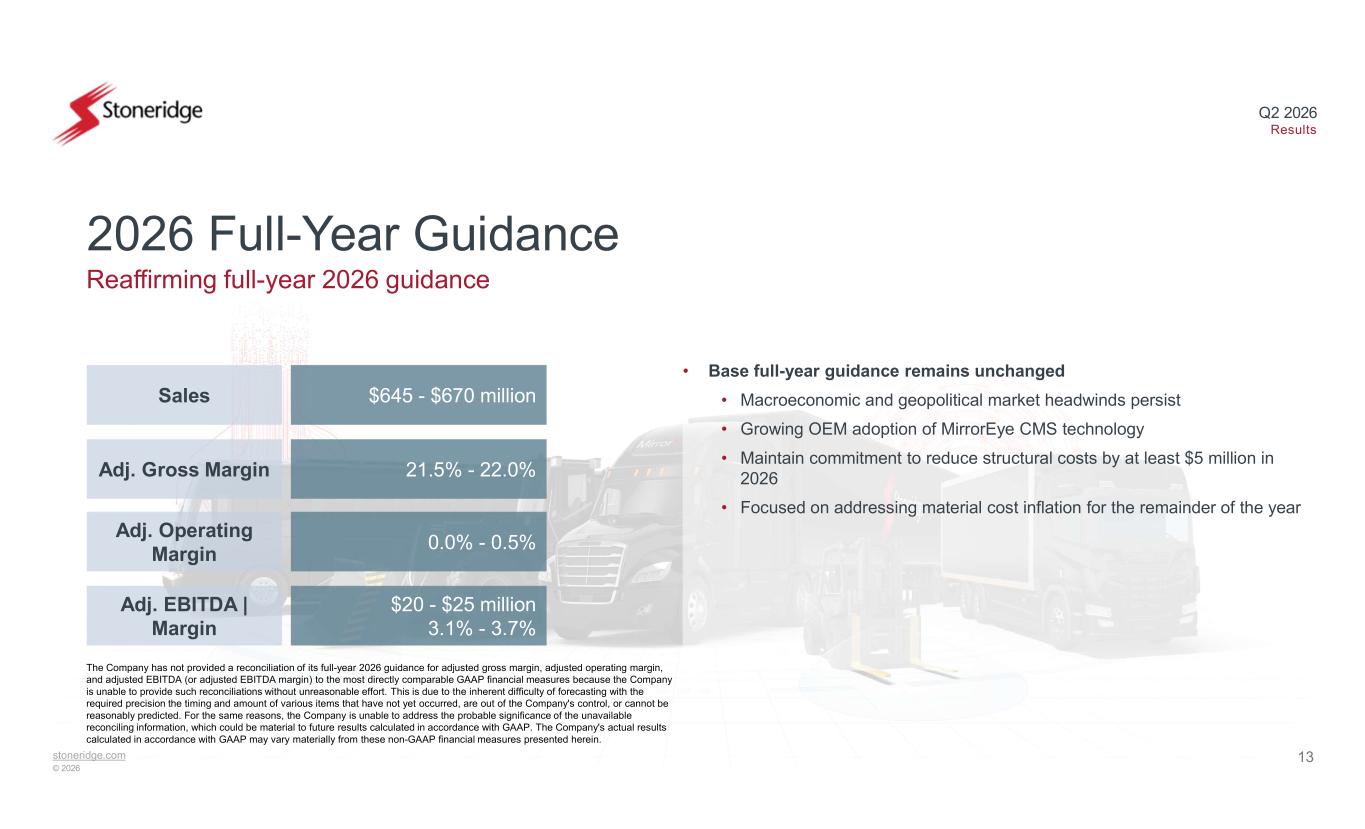
13stoneridge.com © 2026 Q2 2026 Results 2026 Full-Year Guidance Reaffirming full-year 2026 guidance Sales Adj. Gross Margin Adj. Operating Margin Adj. EBITDA | Margin $645 - $670 million 21.5% - 22.0% 0.0% - 0.5% $20 - $25 million 3.1% - 3.7% • Base full-year guidance remains unchanged • Macroeconomic and geopolitical market headwinds persist • Growing OEM adoption of MirrorEye CMS technology • Maintain commitment to reduce structural costs by at least $5 million in 2026 • Focused on addressing material cost inflation for the remainder of the year The Company has not provided a reconciliation of its full-year 2026 guidance for adjusted gross margin, adjusted operating margin, and adjusted EBITDA (or adjusted EBITDA margin) to the most directly comparable GAAP financial measures because the Company is unable to provide such reconciliations without unreasonable effort. This is due to the inherent difficulty of forecasting with the required precision the timing and amount of various items that have not yet occurred, are out of the Company's control, or cannot be reasonably predicted. For the same reasons, the Company is unable to address the probable significance of the unavailable reconciling information, which could be material to future results calculated in accordance with GAAP. The Company's actual results calculated in accordance with GAAP may vary materially from these non-GAAP financial measures presented herein.
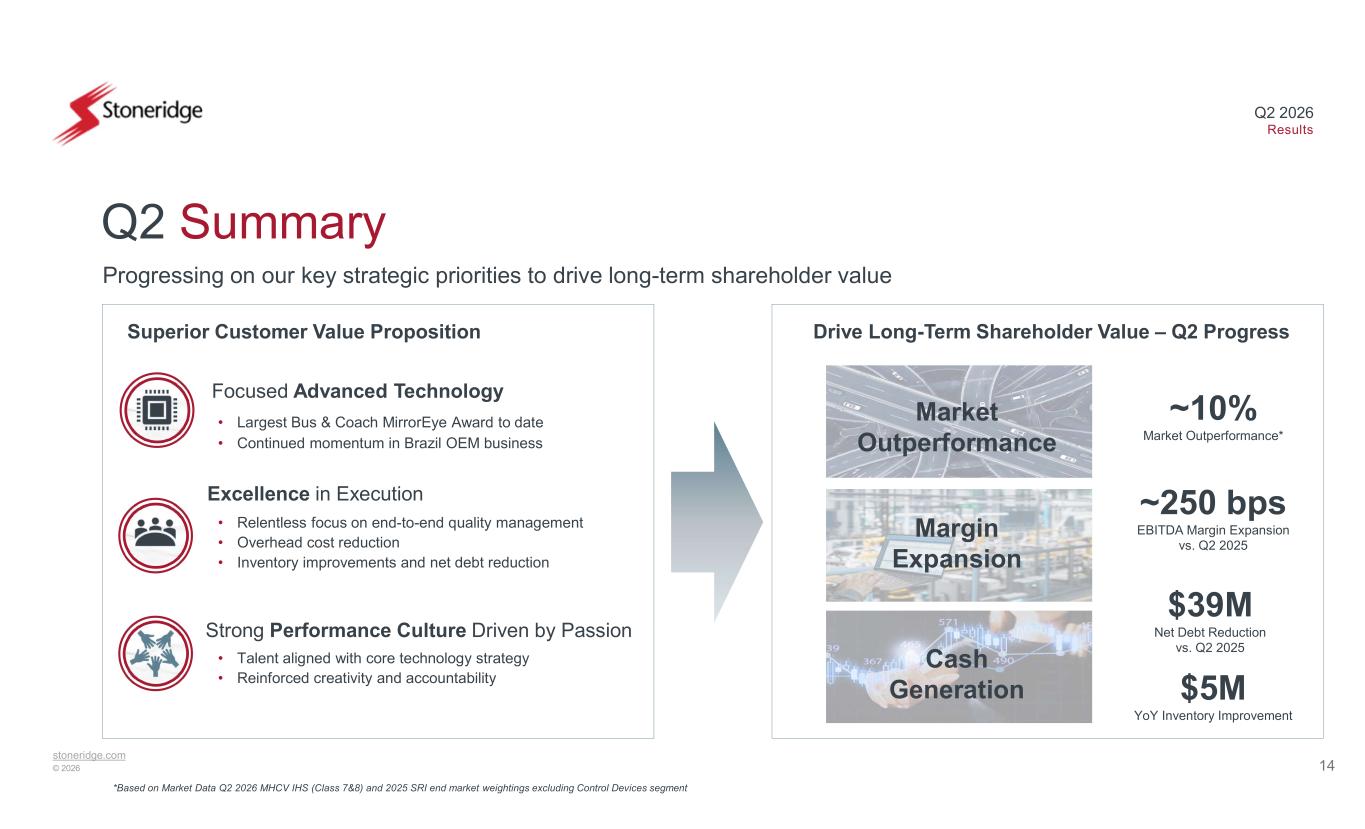
stoneridge.com © 2026 Q2 2026 Results 14 Focused Advanced Technology Progressing on our key strategic priorities to drive long-term shareholder value Excellence in Execution Strong Performance Culture Driven by Passion Market Outperformance Margin Expansion Cash Generation ~10% Market Outperformance* Drive Long-Term Shareholder Value – Q2 ProgressSuperior Customer Value Proposition • Largest Bus & Coach MirrorEye Award to date • Continued momentum in Brazil OEM business • Relentless focus on end-to-end quality management • Overhead cost reduction • Inventory improvements and net debt reduction • Talent aligned with core technology strategy • Reinforced creativity and accountability Q2 Summary ~250 bps EBITDA Margin Expansion vs. Q2 2025 $5M YoY Inventory Improvement $39M Net Debt Reduction vs. Q2 2025 *Based on Market Data Q2 2026 MHCV IHS (Class 7&8) and 2025 SRI end market weightings excluding Control Devices segment

stoneridge.com © 2026 Appendix Materials
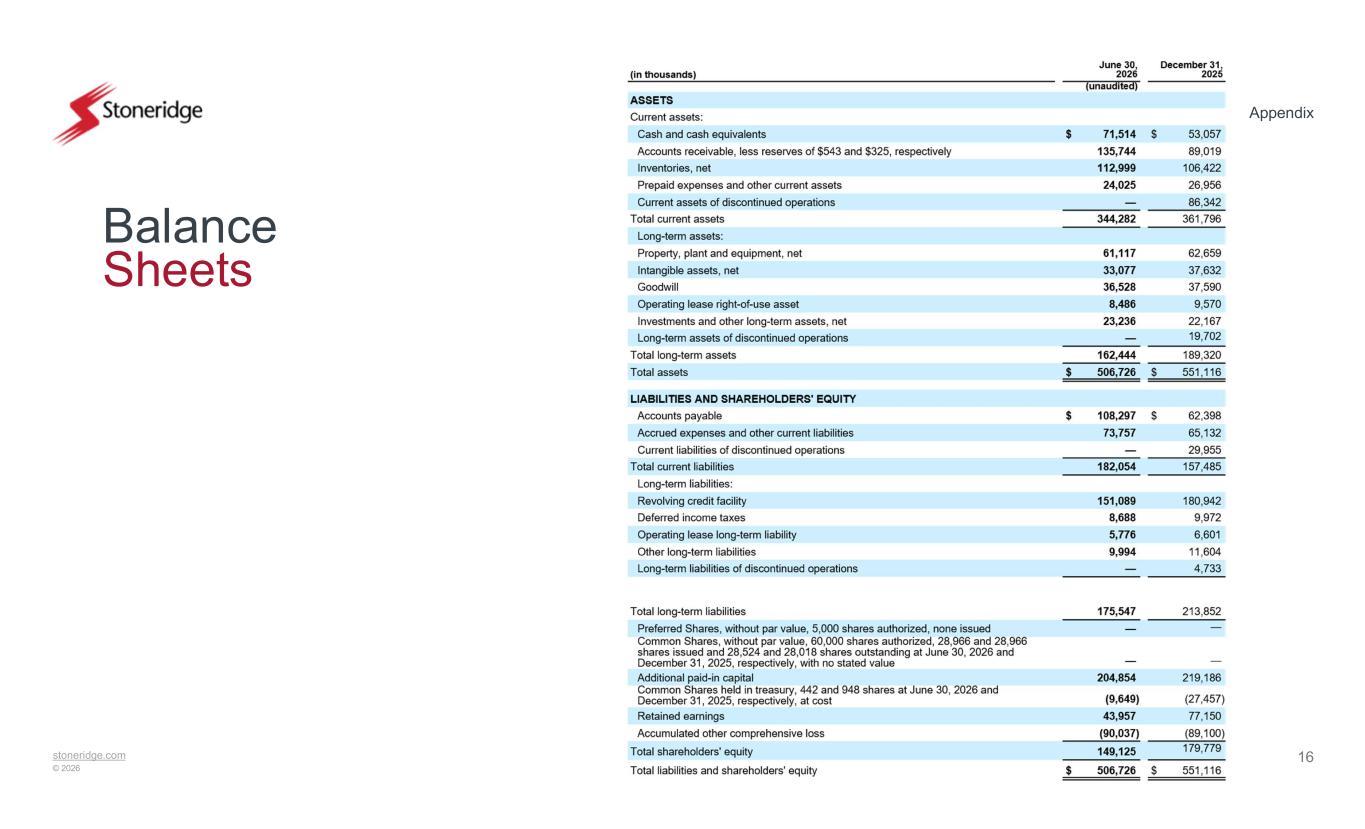
stoneridge.com © 2026 Appendix 16 Balance Sheets
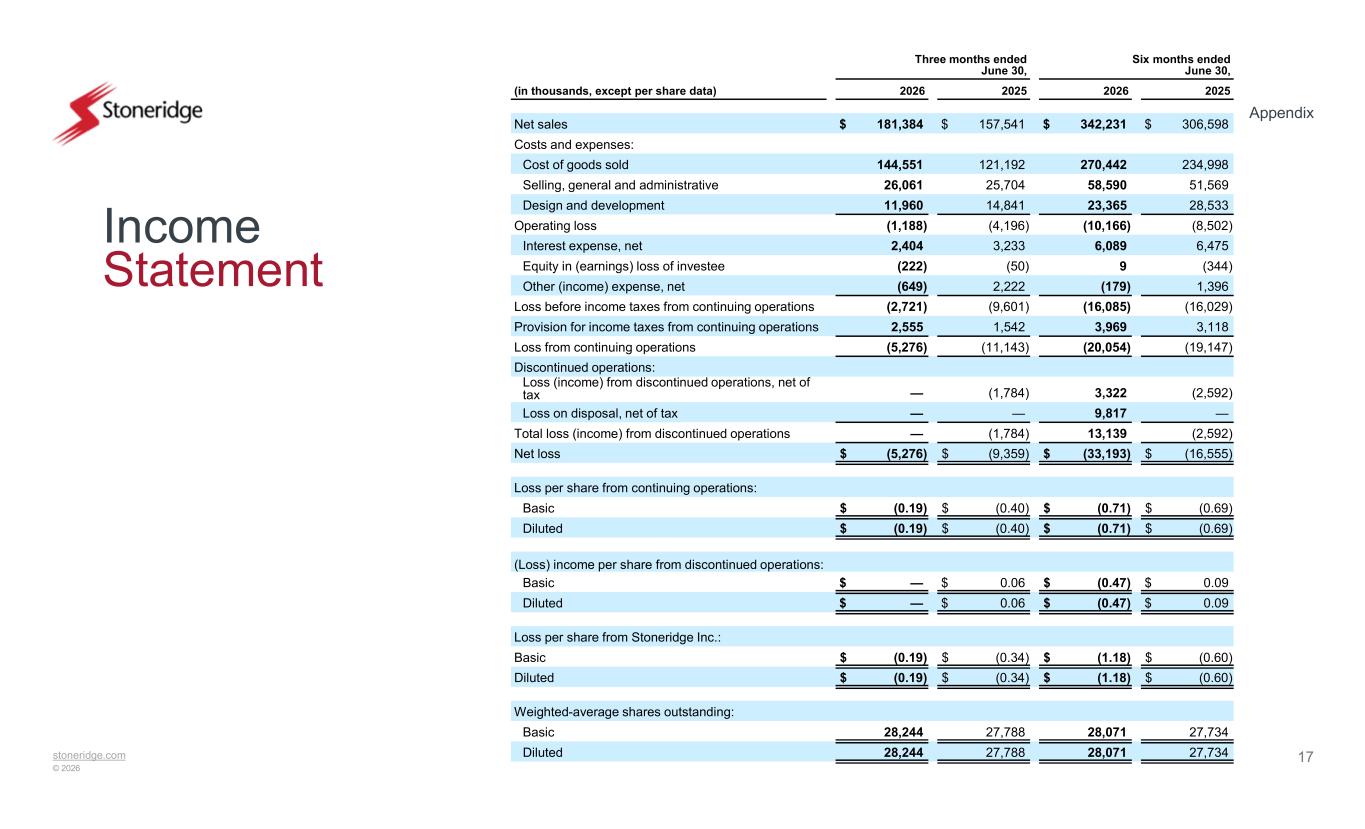
stoneridge.com © 2026 Appendix 17 Income Statement Six months ended June 30, Three months ended June 30, 2025202620252026(in thousands, except per share data) $ 306,598$ 342,231$ 157,541$ 181,384Net sales Costs and expenses: 234,998270,442121,192144,551Cost of goods sold 51,56958,59025,70426,061Selling, general and administrative 28,53323,36514,84111,960Design and development (8,502)(10,166)(4,196)(1,188)Operating loss 6,4756,0893,2332,404Interest expense, net (344)9(50)(222)Equity in (earnings) loss of investee 1,396(179)2,222(649)Other (income) expense, net (16,029)(16,085)(9,601)(2,721)Loss before income taxes from continuing operations 3,1183,9691,5422,555Provision for income taxes from continuing operations (19,147)(20,054)(11,143)(5,276)Loss from continuing operations Discontinued operations: (2,592)3,322(1,784)— Loss (income) from discontinued operations, net of tax —9,817——Loss on disposal, net of tax (2,592)13,139(1,784)—Total loss (income) from discontinued operations $ (16,555)$ (33,193)$ (9,359)$ (5,276)Net loss Loss per share from continuing operations: $ (0.69)$ (0.71)$ (0.40)$ (0.19)Basic $ (0.69)$ (0.71)$ (0.40)$ (0.19)Diluted (Loss) income per share from discontinued operations: $ 0.09$ (0.47)$ 0.06$ —Basic $ 0.09$ (0.47)$ 0.06$ —Diluted Loss per share from Stoneridge Inc.: $ (0.60)$ (1.18)$ (0.34)$ (0.19)Basic $ (0.60)$ (1.18)$ (0.34)$ (0.19)Diluted Weighted-average shares outstanding: 27,73428,07127,78828,244Basic 27,73428,07127,78828,244Diluted
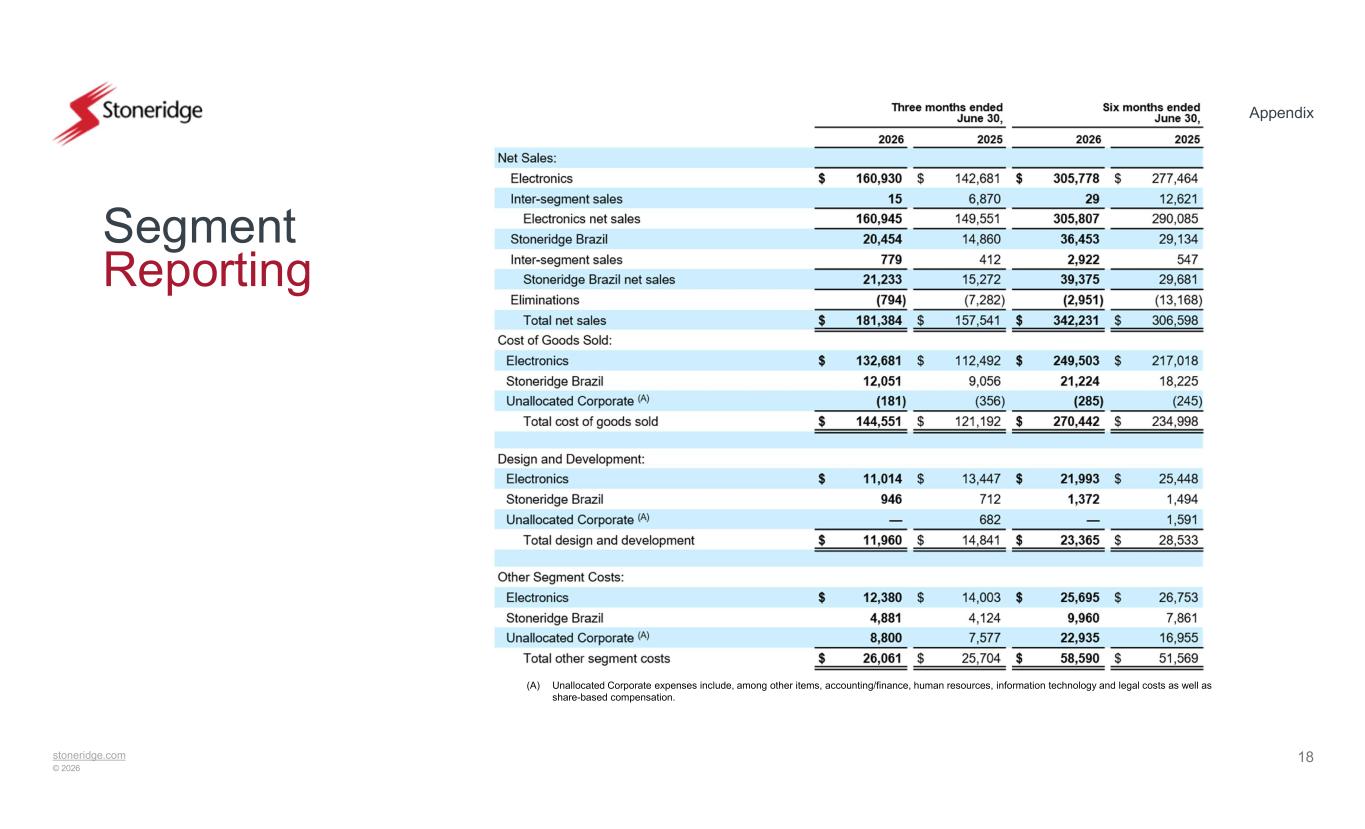
stoneridge.com © 2026 Appendix 18 Segment Reporting (A) Unallocated Corporate expenses include, among other items, accounting/finance, human resources, information technology and legal costs as well as share-based compensation.
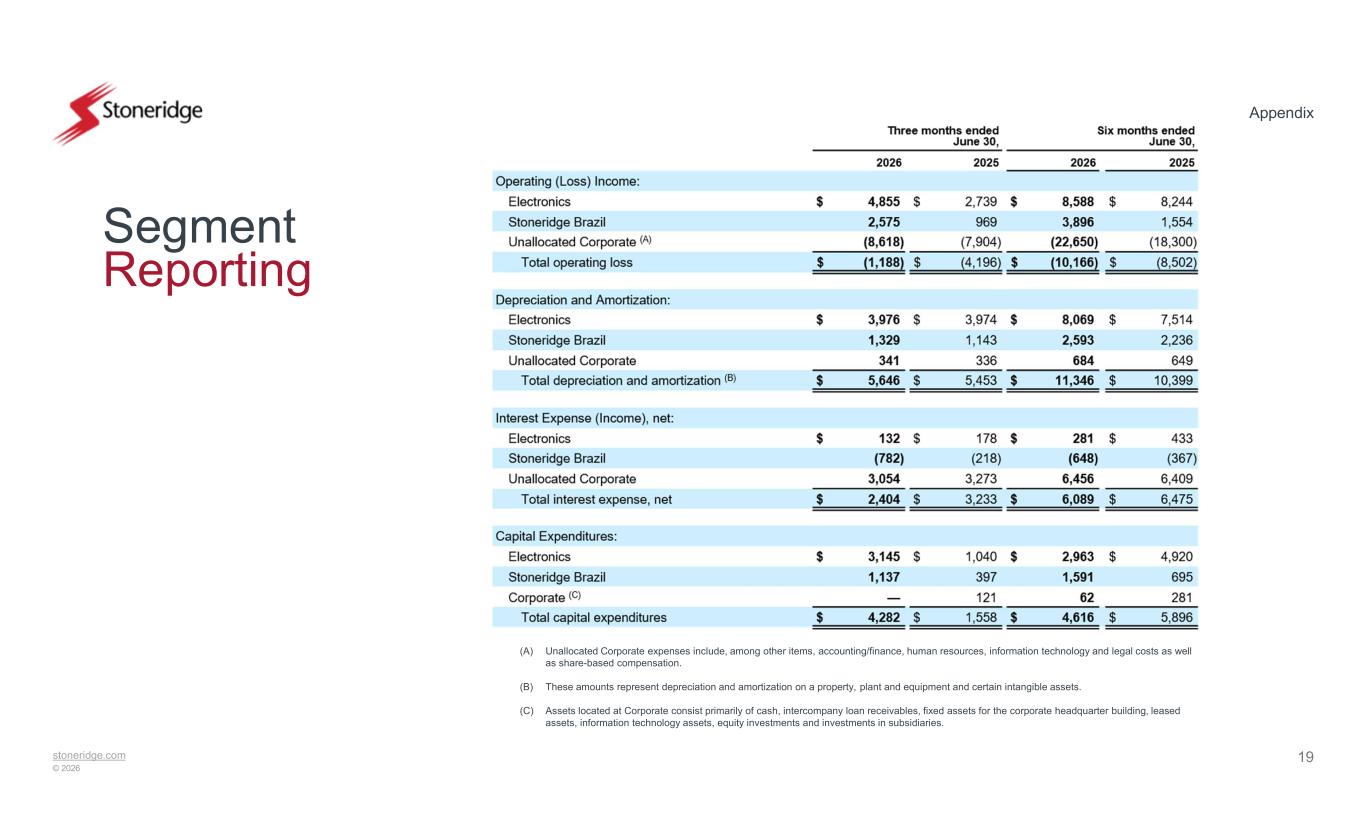
stoneridge.com © 2026 Appendix 19 Segment Reporting (A) Unallocated Corporate expenses include, among other items, accounting/finance, human resources, information technology and legal costs as well as share-based compensation. (B) These amounts represent depreciation and amortization on a property, plant and equipment and certain intangible assets. (C) Assets located at Corporate consist primarily of cash, intercompany loan receivables, fixed assets for the corporate headquarter building, leased assets, information technology assets, equity investments and investments in subsidiaries.

stoneridge.com © 2026 Reconciliations to US GAAP
stoneridge.com © 2026 US GAAP Reconciliations US GAAP Reconciliations 21 This document contains information about Stoneridge's financial results which is not presented in accordance with accounting principles generally accepted in the United States ("GAAP"). Such non-GAAP financial measures are reconciled to their closest GAAP financial measures in the appendix of this document. The provision of these non-GAAP financial measures is not intended to indicate that Stoneridge is explicitly or implicitly providing projections on those non- GAAP financial measures, and actual results for such measures are likely to vary from those presented. The reconciliations include all information reasonably available to the Company at the date of this document and the adjustments that management can reasonably predict.
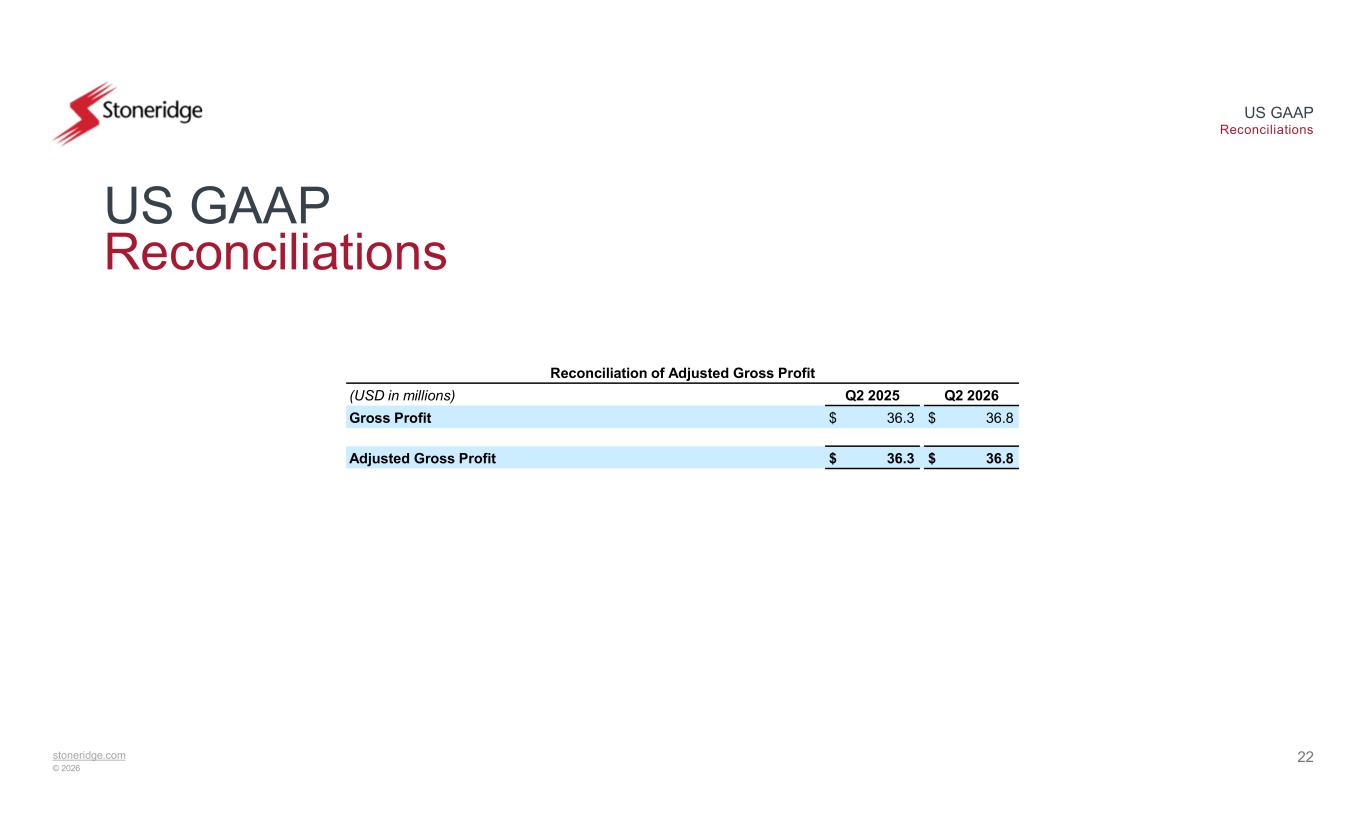
stoneridge.com © 2026 US GAAP Reconciliations 22 US GAAP Reconciliations Reconciliation of Adjusted Gross Profit Q2 2026Q2 2025(USD in millions) $ 36.8$ 36.3Gross Profit $ 36.8$ 36.3Adjusted Gross Profit
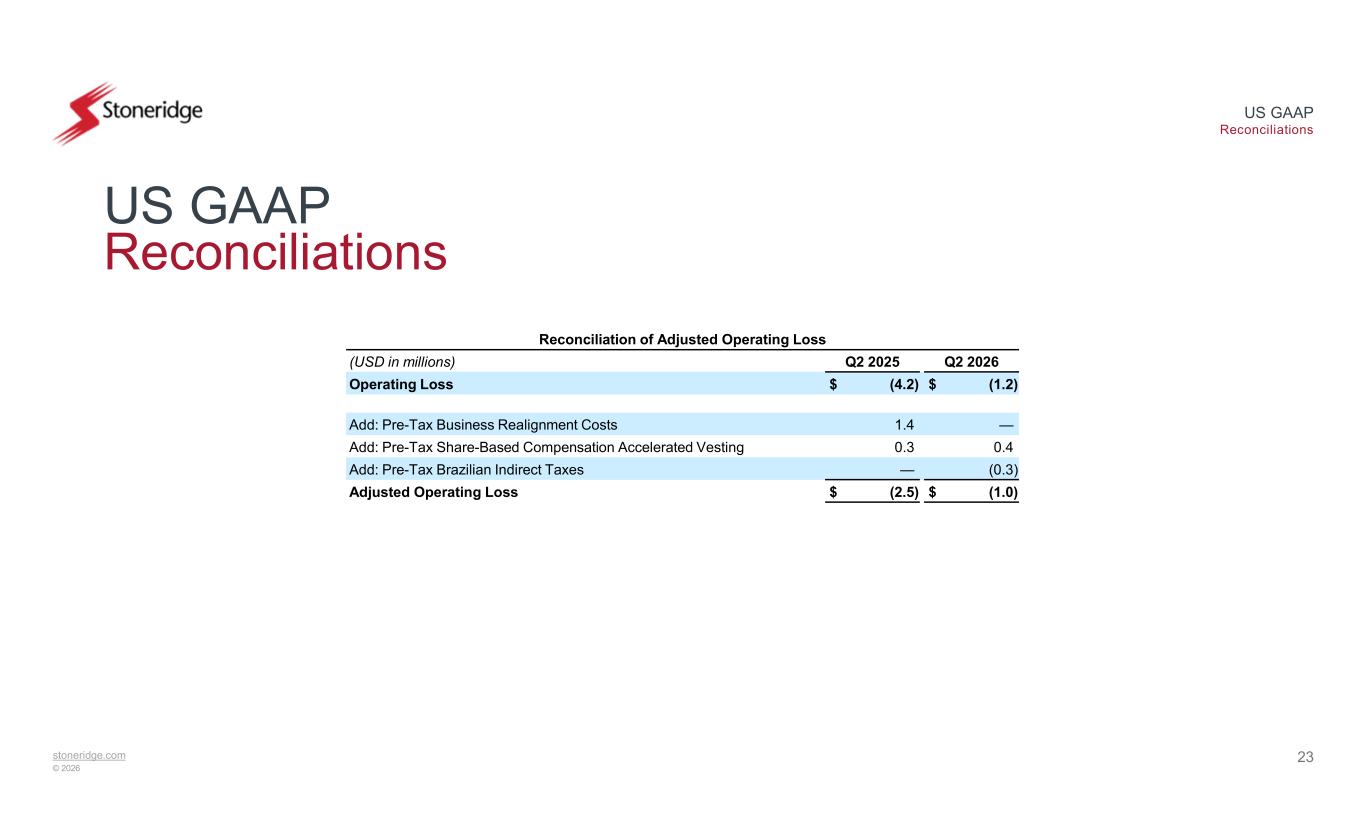
stoneridge.com © 2026 US GAAP Reconciliations 23 US GAAP Reconciliations Reconciliation of Adjusted Operating Loss Q2 2026Q2 2025(USD in millions) $ (1.2)$ (4.2)Operating Loss —1.4Add: Pre-Tax Business Realignment Costs 0.40.3Add: Pre-Tax Share-Based Compensation Accelerated Vesting (0.3)—Add: Pre-Tax Brazilian Indirect Taxes $ (1.0)$ (2.5)Adjusted Operating Loss
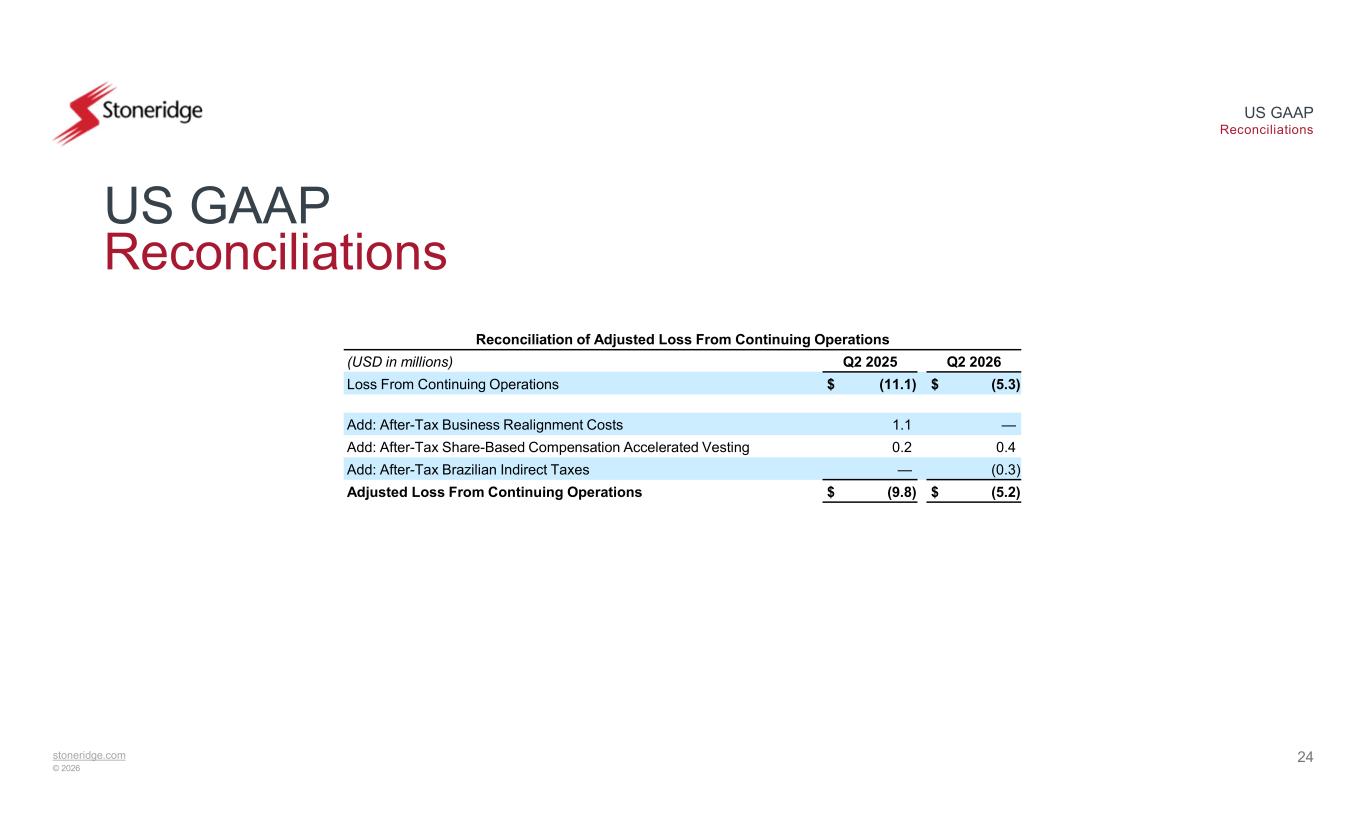
stoneridge.com © 2026 US GAAP Reconciliations 24 US GAAP Reconciliations Reconciliation of Adjusted Loss From Continuing Operations Q2 2026Q2 2025(USD in millions) $ (5.3)$ (11.1)Loss From Continuing Operations —1.1Add: After-Tax Business Realignment Costs 0.40.2Add: After-Tax Share-Based Compensation Accelerated Vesting (0.3)—Add: After-Tax Brazilian Indirect Taxes $ (5.2)$ (9.8)Adjusted Loss From Continuing Operations
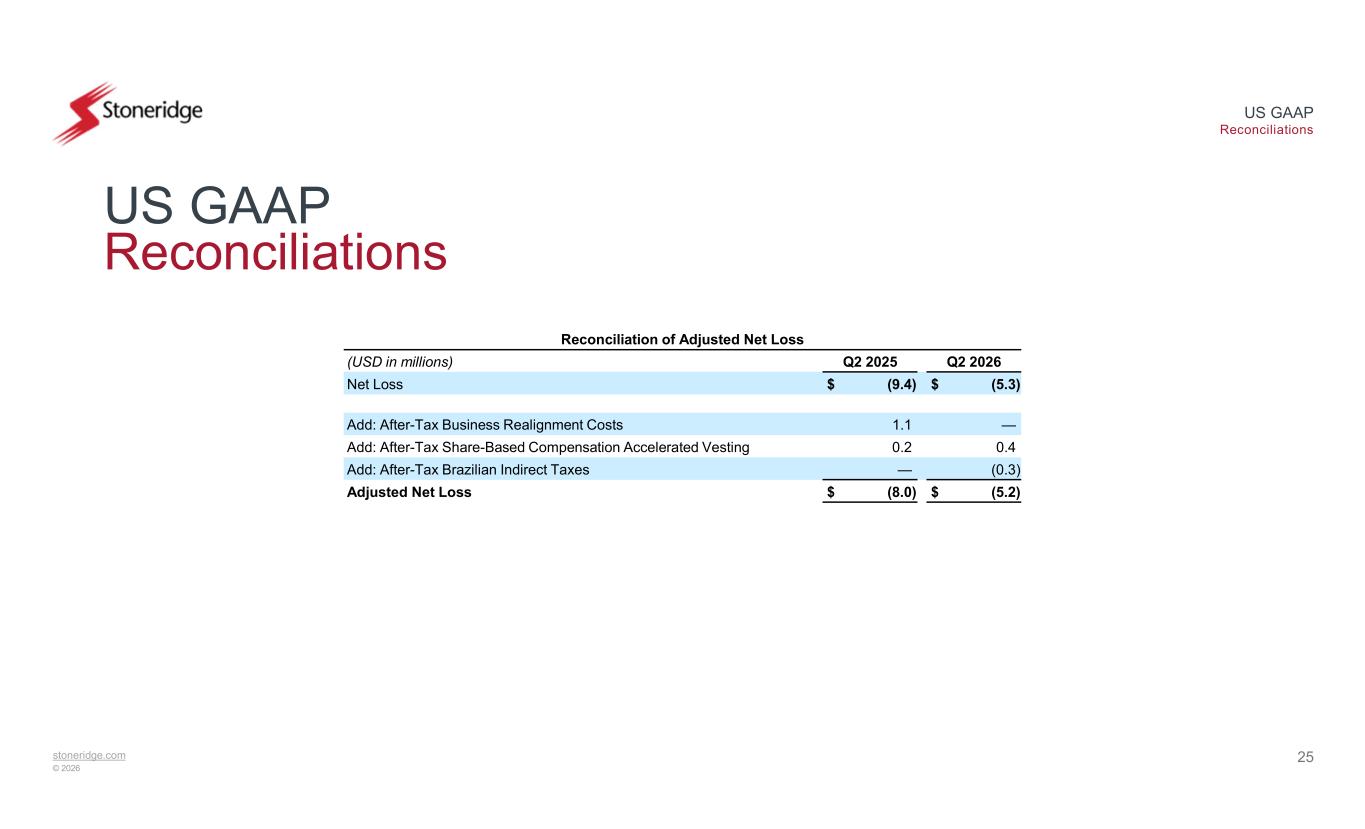
stoneridge.com © 2026 US GAAP Reconciliations 25 US GAAP Reconciliations Reconciliation of Adjusted Net Loss Q2 2026Q2 2025(USD in millions) $ (5.3)$ (9.4)Net Loss —1.1Add: After-Tax Business Realignment Costs 0.40.2Add: After-Tax Share-Based Compensation Accelerated Vesting (0.3)—Add: After-Tax Brazilian Indirect Taxes $ (5.2)$ (8.0)Adjusted Net Loss
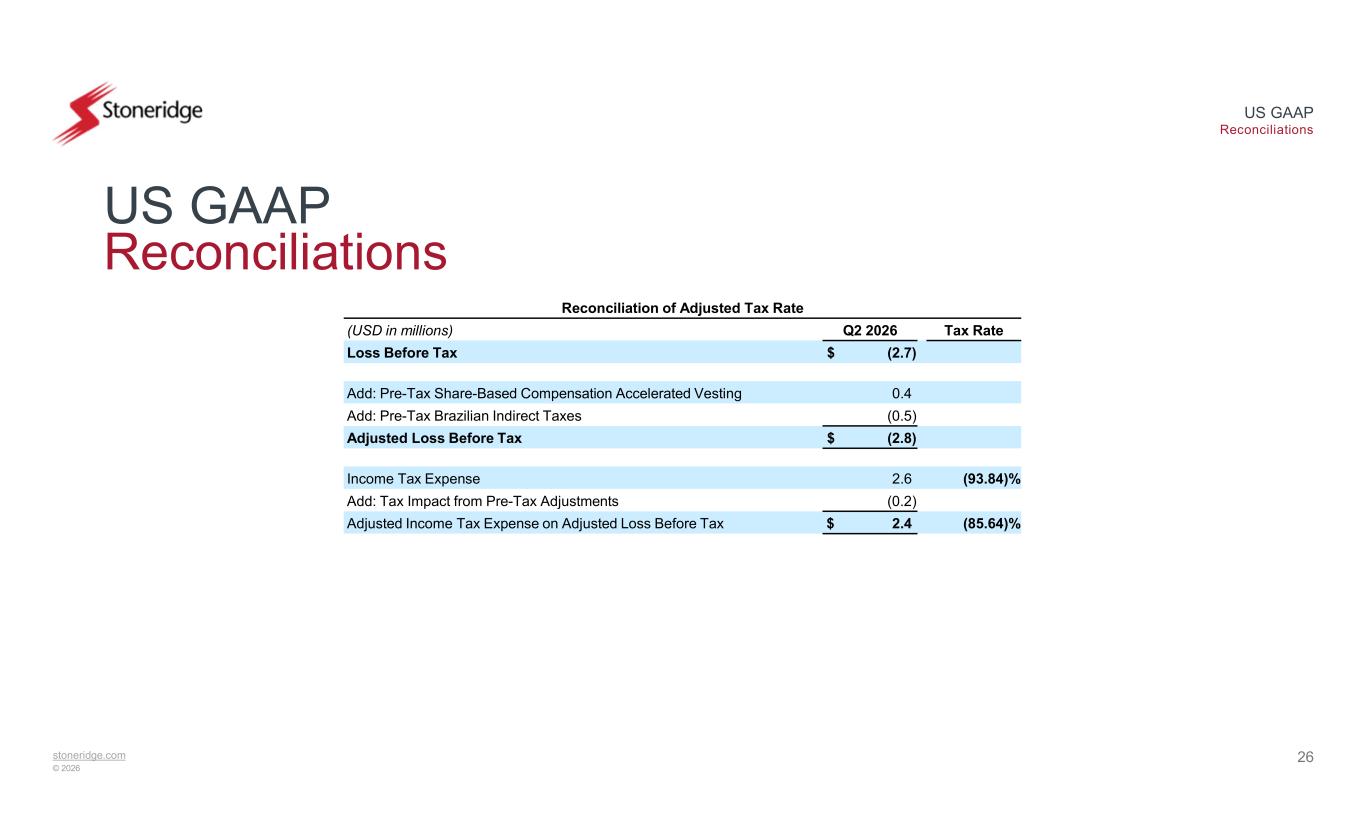
stoneridge.com © 2026 US GAAP Reconciliations 26 US GAAP Reconciliations Reconciliation of Adjusted Tax Rate Tax RateQ2 2026(USD in millions) $ (2.7)Loss Before Tax 0.4Add: Pre-Tax Share-Based Compensation Accelerated Vesting (0.5)Add: Pre-Tax Brazilian Indirect Taxes $ (2.8)Adjusted Loss Before Tax (93.84)%2.6Income Tax Expense (0.2)Add: Tax Impact from Pre-Tax Adjustments (85.64)%$ 2.4Adjusted Income Tax Expense on Adjusted Loss Before Tax
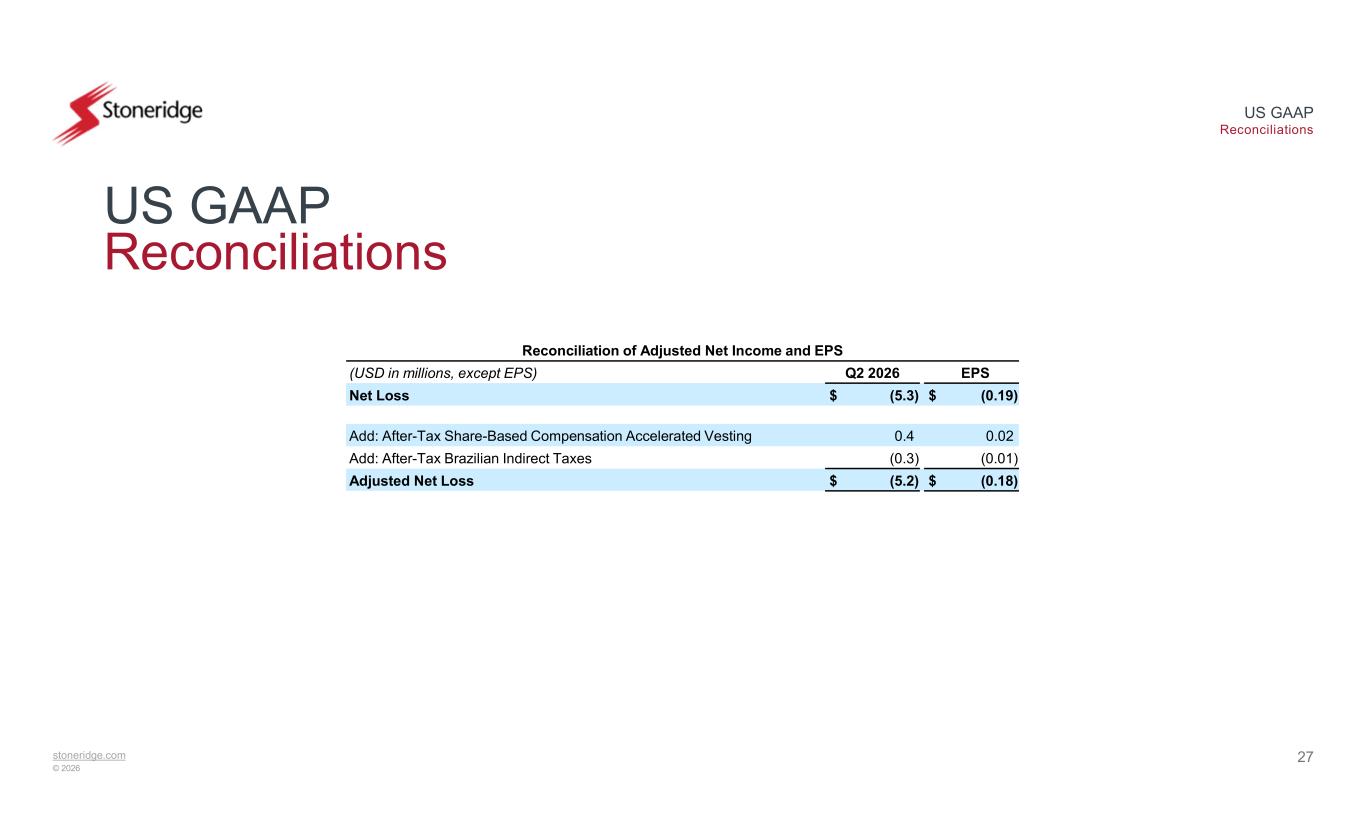
stoneridge.com © 2026 US GAAP Reconciliations 27 US GAAP Reconciliations Reconciliation of Adjusted Net Income and EPS EPSQ2 2026(USD in millions, except EPS) $ (0.19)$ (5.3)Net Loss 0.020.4Add: After-Tax Share-Based Compensation Accelerated Vesting (0.01)(0.3)Add: After-Tax Brazilian Indirect Taxes $ (0.18)$ (5.2)Adjusted Net Loss
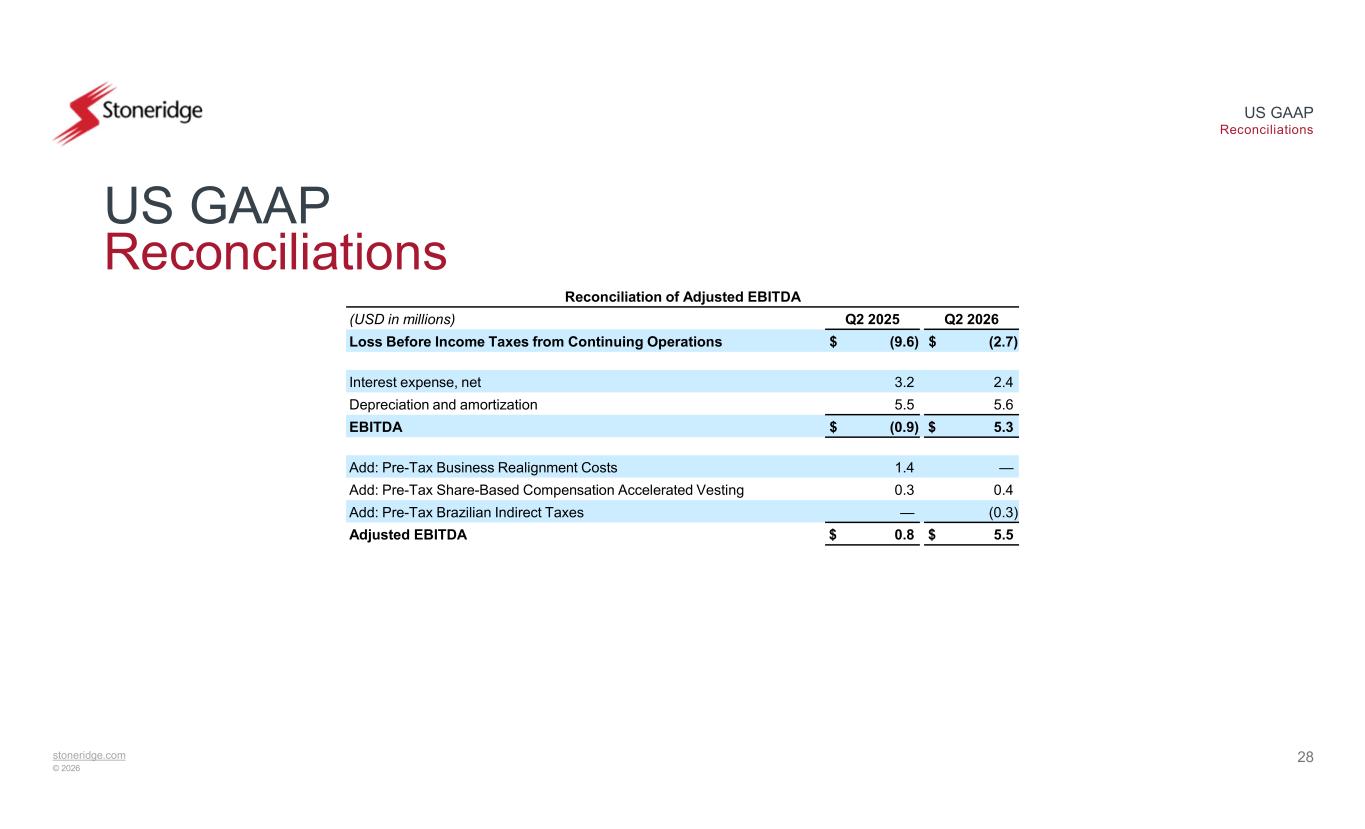
stoneridge.com © 2026 US GAAP Reconciliations 28 US GAAP Reconciliations Reconciliation of Adjusted EBITDA Q2 2026Q2 2025(USD in millions) $ (2.7)$ (9.6)Loss Before Income Taxes from Continuing Operations 2.43.2Interest expense, net 5.65.5Depreciation and amortization $ 5.3$ (0.9)EBITDA —1.4Add: Pre-Tax Business Realignment Costs 0.40.3Add: Pre-Tax Share-Based Compensation Accelerated Vesting (0.3)—Add: Pre-Tax Brazilian Indirect Taxes $ 5.5$ 0.8Adjusted EBITDA
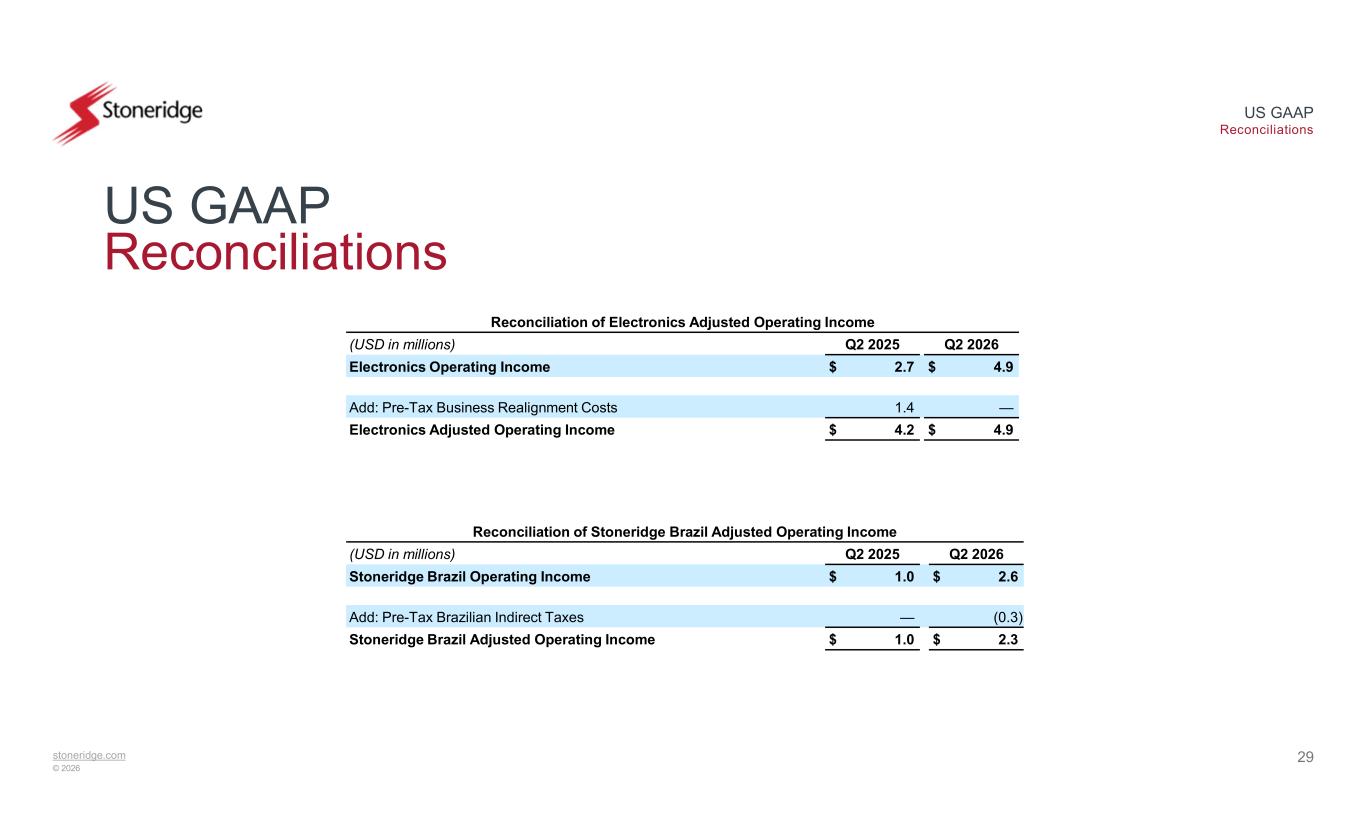
stoneridge.com © 2026 US GAAP Reconciliations 29 US GAAP Reconciliations Reconciliation of Electronics Adjusted Operating Income Q2 2026Q2 2025(USD in millions) $ 4.9$ 2.7Electronics Operating Income —1.4Add: Pre-Tax Business Realignment Costs $ 4.9$ 4.2Electronics Adjusted Operating Income Reconciliation of Stoneridge Brazil Adjusted Operating Income Q2 2026Q2 2025(USD in millions) $ 2.6$ 1.0Stoneridge Brazil Operating Income (0.3)—Add: Pre-Tax Brazilian Indirect Taxes $ 2.3$ 1.0Stoneridge Brazil Adjusted Operating Income
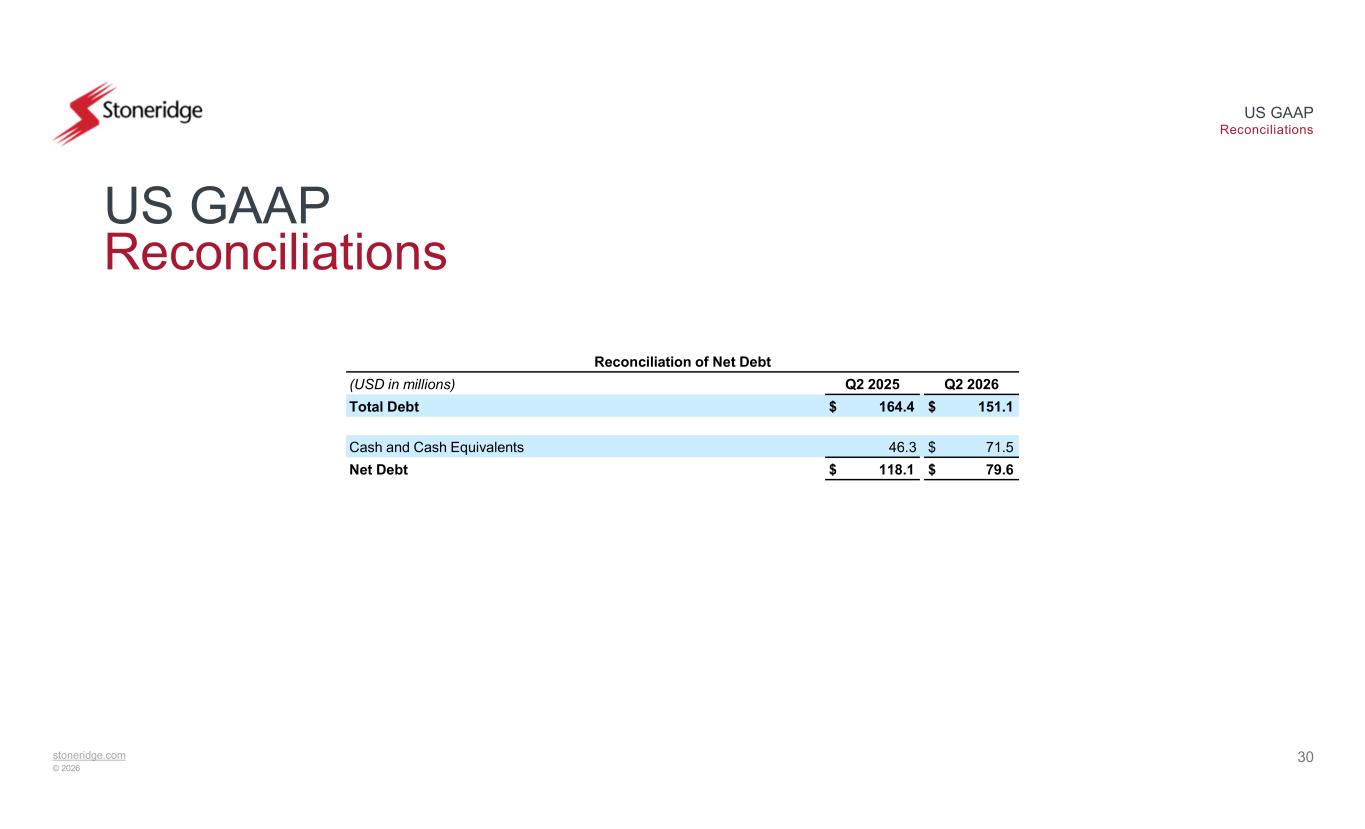
stoneridge.com © 2026 US GAAP Reconciliations 30 US GAAP Reconciliations Reconciliation of Net Debt Q2 2026Q2 2025(USD in millions) $ 151.1$ 164.4Total Debt $ 71.546.3Cash and Cash Equivalents $ 79.6$ 118.1Net Debt
stoneridge.com © 2026 Stoneridge @StoneridgeInc StoneridgeGlobal 31