
SUPPLEMENTAL INFORMATION Q2 2026 August 4, 2026 Exhibit 99.2
FORWARD LOOKING STATEMENTS In addition to historical information, this presentation may contain a number of “forward-looking statements” as defined in the Private Securities Litigation Reform Act of 1995, which are subject to known and unknown risks, uncertainties and other important factors that may cause actual results to be materially different from the statements made herein. All statements other than statements of historical fact are forward-looking statements. Forward-looking statements discuss our current expectations and projections relating to our financial position, results of operations, plans, objectives, future performance and business. You can identify forward-looking statements by the fact that they do not relate strictly to any historical or current facts. These statements may include words such as “aim,” “anticipate,” “believe,” “estimate,” “expect,” “forecast,” “future,” “intend,” “outlook,” “potential,” “project,” “projection,” “plan,” “seek,” “may,” “could,” “would,” “will,” “should,” “can,” “can have,” “likely,” the negatives thereof and other similar expressions. You should evaluate all forward-looking statements made in this presentation in the context of the risks and uncertainties disclosed in our filings with the Securities and Exchange Commission (the “SEC”), accessible on the SEC’s website at www.sec.gov and the Investors Relations section of the Company’s website at https://investors.firstwatch.com/financial-information/sec- filings. Important factors that could cause actual results to differ materially from those in the forward-looking statements include the following: our vulnerability to changes in consumer preferences and economic conditions such as inflation and recession; our inability to successfully open new restaurants or establish new markets; our inability to effectively manage our growth; potential negative impacts on sales at our and our franchisees’ restaurants as a result of our opening new restaurants in existing markets; a decline in visitors to any of the retail centers, lifestyle centers, or entertainment centers where our restaurants are located; lower than expected same-restaurant sales growth; unsuccessful marketing programs and limited time new offerings; changes in the cost of food; unprofitability or closure of new restaurants or lower than previously experienced performance in existing restaurants; our inability to compete effectively for customers; our vulnerability to food safety and food-borne illness concerns; unsuccessful financial performance of our franchisees, our limited control over our franchisees’ operations, our inability to maintain good relationships with our franchisees and conflicts of interest with our franchisees; the geographic concentration of our system-wide restaurant base in the southeast portion of the United States; damage to our reputation and negative publicity; our inability or failure to recognize, respond to and effectively manage the accelerated impact of social media and artificial intelligence; our limited number of suppliers and distributors for several of our frequently used ingredients and shortages or disruptions in the supply or delivery of such ingredients; information technology system failures or breaches of our network security; our failure to comply with federal and state laws and regulations relating to privacy, data protection, advertising and consumer protection, or the expansion of current or the enactment of new laws or regulations relating to privacy, data protection, advertising and consumer protection; our potential liability with our gift cards under the property laws of some states; our failure to enforce and maintain our trademarks and protect our other intellectual property; litigation with respect to intellectual property assets; our dependence on our executive officers and certain other key employees; our inability to identify, hire, train and retain qualified individuals for our workforce; our failure to obtain or to properly verify the employment eligibility of our employees; our failure to maintain our corporate culture as we grow; unionization activities among our employees; employment and labor law proceedings; labor shortages or increased labor costs or health care costs; risks associated with leasing property subject to long-term and non-cancelable leases; risks related to our sale of alcoholic beverages; costly and complex compliance with federal, state and local laws, including trade and tax policies; changes in accounting principles applicable to us; our vulnerability to natural disasters, unusual weather conditions, pandemic outbreaks, political events, war and terrorism; our inability to secure additional capital to support business growth; our level of indebtedness; failure to comply with covenants under our credit facility; and uncertainty regarding the Russia and Ukraine war, war and unrest in the Middle East and the related impact on macroeconomic conditions, including inflation, as a result of such conflicts or other related events. The forward-looking statements included in this presentation are made only as of the date hereof and are expressly qualified in their entirety by these cautionary statements. We undertake no obligation to publicly update or revise any forward-looking statement as a result of new information, future events or otherwise, except as otherwise required by law. NON-GAAP FINANCIAL MEASURES (UNAUDITED) To supplement the consolidated financial statements, which are prepared in accordance with accounting principles generally accepted in the United States of America (“GAAP”), we use the following non-GAAP measures, which present operating results on an adjusted basis: (i) Adjusted EBITDA, (ii) Adjusted EBITDA margin, (iii) Restaurant level operating profit and (iv) Restaurant level operating profit margin. Our presentation of these non-GAAP measures includes isolating the effects of some items that are either nonrecurring in nature or have no meaningful correlation to our ongoing core operating performance. These supplemental measures of performance are not required by or presented in accordance with GAAP. Management believes these non-GAAP measures provide investors with additional visibility into our operations, facilitate analysis and comparisons of our ongoing business operations because they exclude items that may not be indicative of our ongoing operating performance, help to identify operational trends and allow for greater transparency with respect to key metrics used by Management in our financial and operational decision making. Our non-GAAP measures may not be comparable to similarly titled measures used by other companies and have important limitations as analytical tools. These non-GAAP measures should not be considered in isolation or as substitutes for analysis of our results as reported under GAAP as they may not provide a complete understanding of our performance. These non-GAAP measures should be reviewed in conjunction with our consolidated financial statements prepared in accordance with GAAP. This presentation does not constitute an offer to sell or a solicitation of an offer to buy any securities. 2 CAUTIONARY NOTE ON FORWARD-LOOKING STATEMENTS AND NON-GAAP FINANCIAL MEASURES
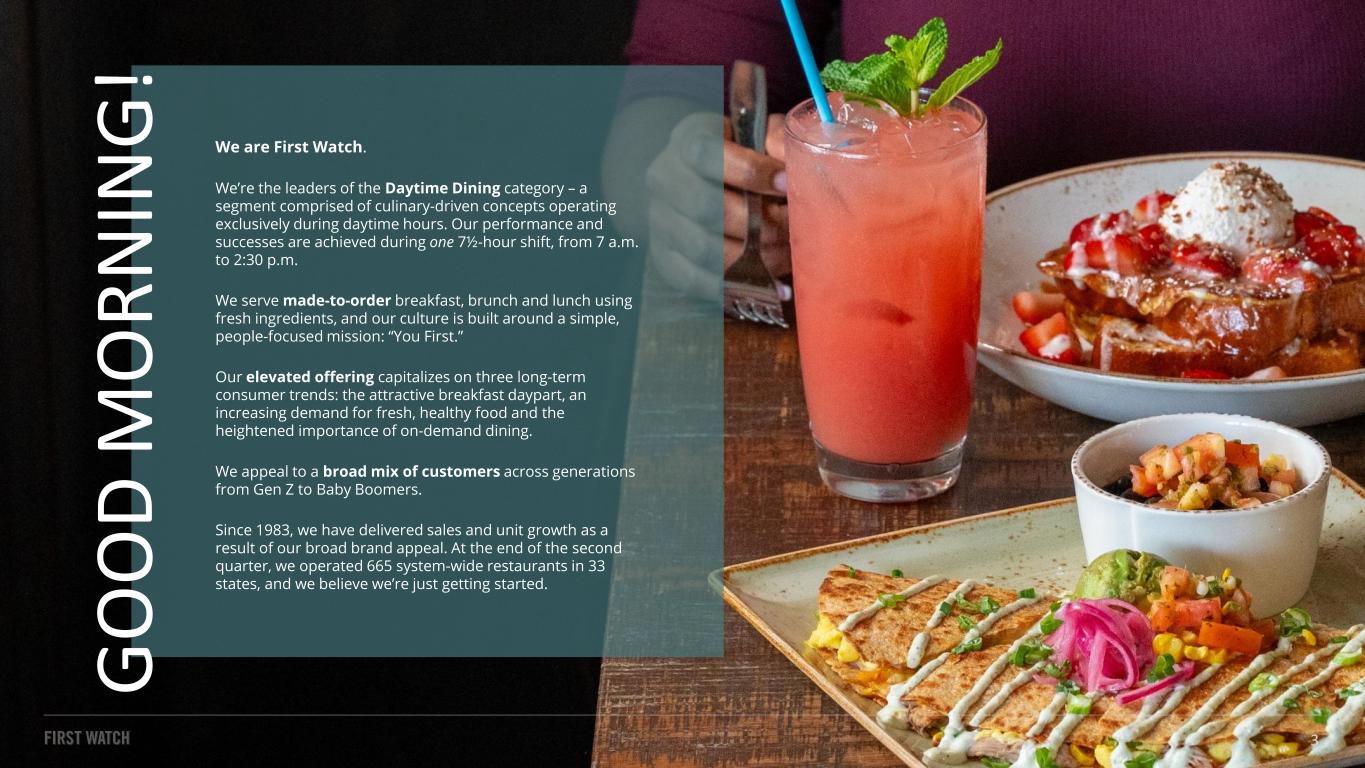
We are First Watch. We’re the leaders of the Daytime Dining category – a segment comprised of culinary-driven concepts operating exclusively during daytime hours. Our performance and successes are achieved during one 7½-hour shift, from 7 a.m. to 2:30 p.m. We serve made-to-order breakfast, brunch and lunch using fresh ingredients, and our culture is built around a simple, people-focused mission: “You First.” Our elevated offering capitalizes on three long-term consumer trends: the attractive breakfast daypart, an increasing demand for fresh, healthy food and the heightened importance of on-demand dining. We appeal to a broad mix of customers across generations from Gen Z to Baby Boomers. Since 1983, we have delivered sales and unit growth as a result of our broad brand appeal. At the end of the second quarter, we operated 665 system-wide restaurants in 33 states, and we believe we’re just getting started. G O O D M O R N IN G ! 3


PERFORMANCE & COMMENTARY Q2 2026
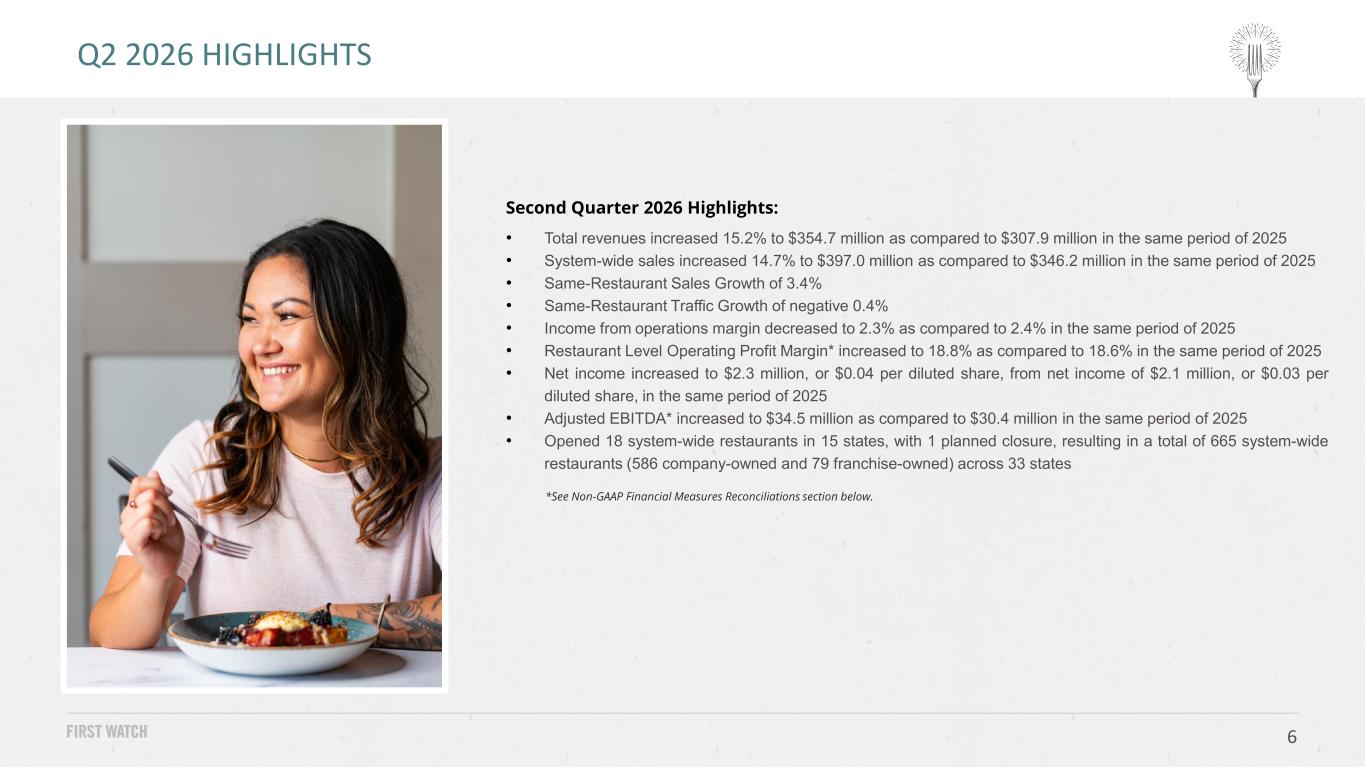
6 Q2 2026 HIGHLIGHTS Second Quarter 2026 Highlights: • Total revenues increased 15.2% to $354.7 million as compared to $307.9 million in the same period of 2025 • System-wide sales increased 14.7% to $397.0 million as compared to $346.2 million in the same period of 2025 • Same-Restaurant Sales Growth of 3.4% • Same-Restaurant Traffic Growth of negative 0.4% • Income from operations margin decreased to 2.3% as compared to 2.4% in the same period of 2025 • Restaurant Level Operating Profit Margin* increased to 18.8% as compared to 18.6% in the same period of 2025 • Net income increased to $2.3 million, or $0.04 per diluted share, from net income of $2.1 million, or $0.03 per diluted share, in the same period of 2025 • Adjusted EBITDA* increased to $34.5 million as compared to $30.4 million in the same period of 2025 • Opened 18 system-wide restaurants in 15 states, with 1 planned closure, resulting in a total of 665 system-wide restaurants (586 company-owned and 79 franchise-owned) across 33 states *See Non-GAAP Financial Measures Reconciliations section below.
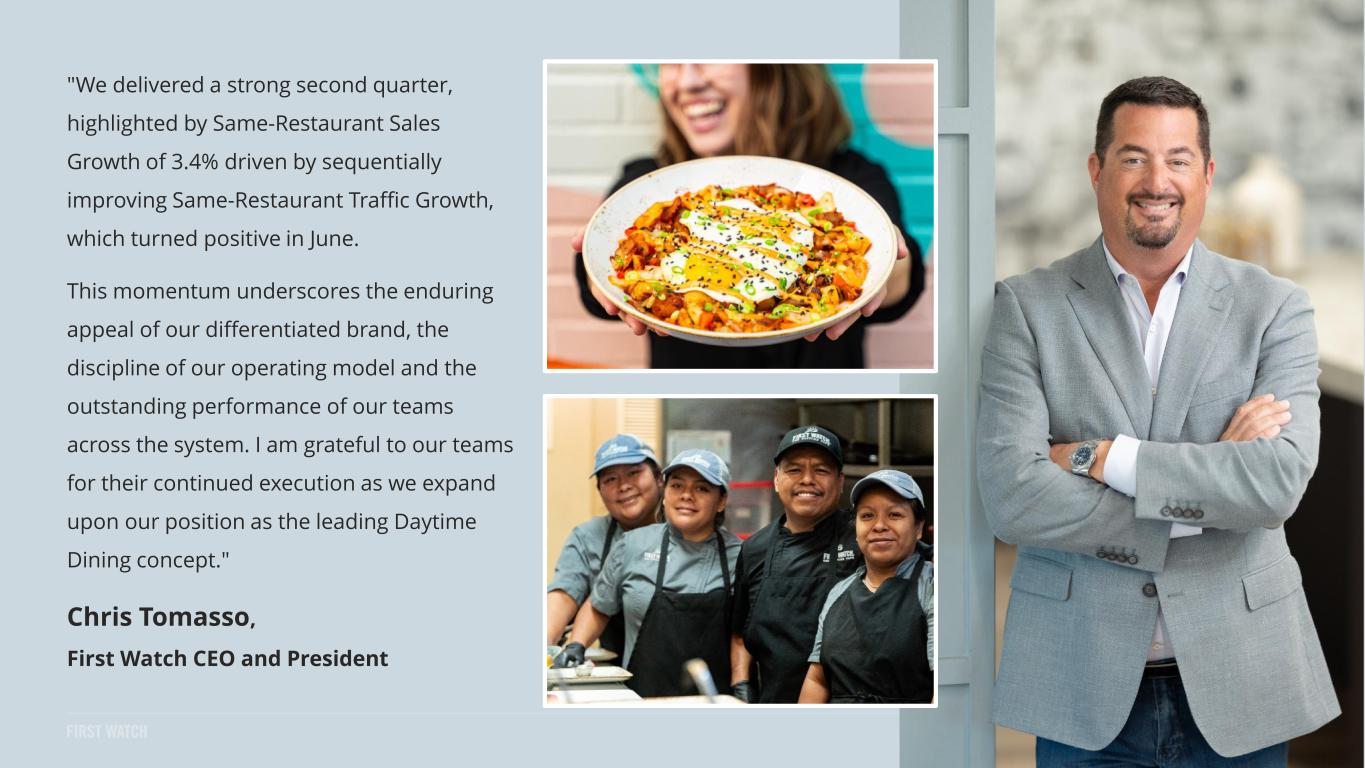
"We delivered a strong second quarter, highlighted by Same-Restaurant Sales Growth of 3.4% driven by sequentially improving Same-Restaurant Traffic Growth, which turned positive in June. This momentum underscores the enduring appeal of our differentiated brand, the discipline of our operating model and the outstanding performance of our teams across the system. I am grateful to our teams for their continued execution as we expand upon our position as the leading Daytime Dining concept." Chris Tomasso, First Watch CEO and President 7

Winter/Spring | January 6 – May 25, 2026 8 Bacon. Egg. Cheddar. Our twist on a traditional breakfast sandwich – hardwood smoked bacon, folded cage- free eggs, aged Cheddar, house-pickled sweet peppers and arugula with Calabrian chili aioli and roasted garlic aioli on griddled artisan sourdough bread. Served with lemon-dressed organic mixed greens. Seared steak, fresh spinach, Cheddar and Monterey Jack, diced red bell peppers and house-roasted onions in a potato hash, topped with two cage-free eggs any style, crumbled Feta cheese, house-pickled sweet peppers, roasted garlic aioli and a drizzle of chimichurri sauce. Thick-cut, custard-dipped, griddled challah bread, fresh glazed strawberries, warm dulce de leche, whipped cream and spiced gingerbread cookie crumbles. Lightly dusted with powdered cinnamon sugar. BLUEBERRY LEMON CORNBREAD Freshly baked cornbread with sweet blueberries. Topped with house- whipped lemon butter and lightly dusted with powdered cinnamon sugar. THE B.E.C. CHIMICHURRI STEAK & EGGS HASH STRAWBERRY TRES LECHES FRENCH TOAST A TASTE OF Q1 + Q2
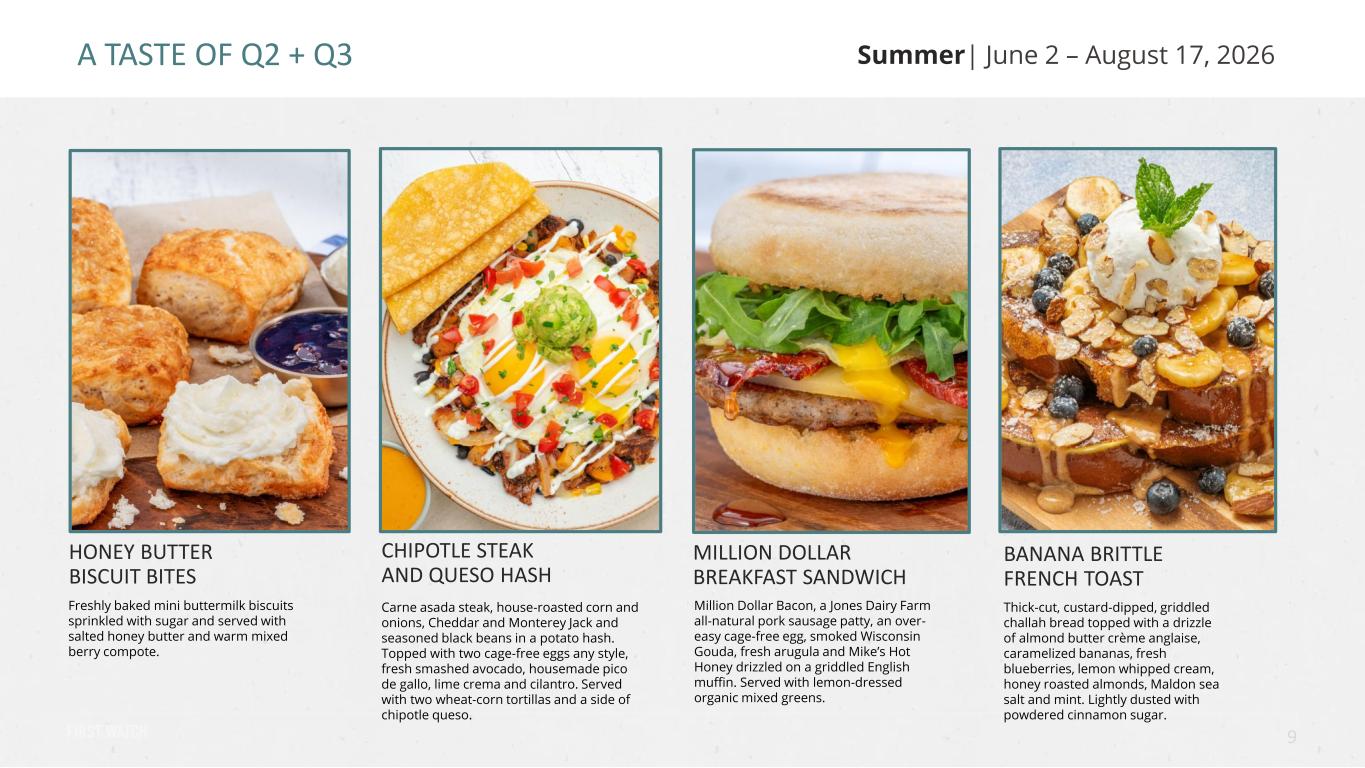
Summer| June 2 – August 17, 2026 9 Freshly baked mini buttermilk biscuits sprinkled with sugar and served with salted honey butter and warm mixed berry compote. Carne asada steak, house-roasted corn and onions, Cheddar and Monterey Jack and seasoned black beans in a potato hash. Topped with two cage-free eggs any style, fresh smashed avocado, housemade pico de gallo, lime crema and cilantro. Served with two wheat-corn tortillas and a side of chipotle queso. Million Dollar Bacon, a Jones Dairy Farm all-natural pork sausage patty, an over- easy cage-free egg, smoked Wisconsin Gouda, fresh arugula and Mike’s Hot Honey drizzled on a griddled English muffin. Served with lemon-dressed organic mixed greens. BANANA BRITTLE FRENCH TOAST Thick-cut, custard-dipped, griddled challah bread topped with a drizzle of almond butter crème anglaise, caramelized bananas, fresh blueberries, lemon whipped cream, honey roasted almonds, Maldon sea salt and mint. Lightly dusted with powdered cinnamon sugar. HONEY BUTTER BISCUIT BITES CHIPOTLE STEAK AND QUESO HASH MILLION DOLLAR BREAKFAST SANDWICH A TASTE OF Q2 + Q3
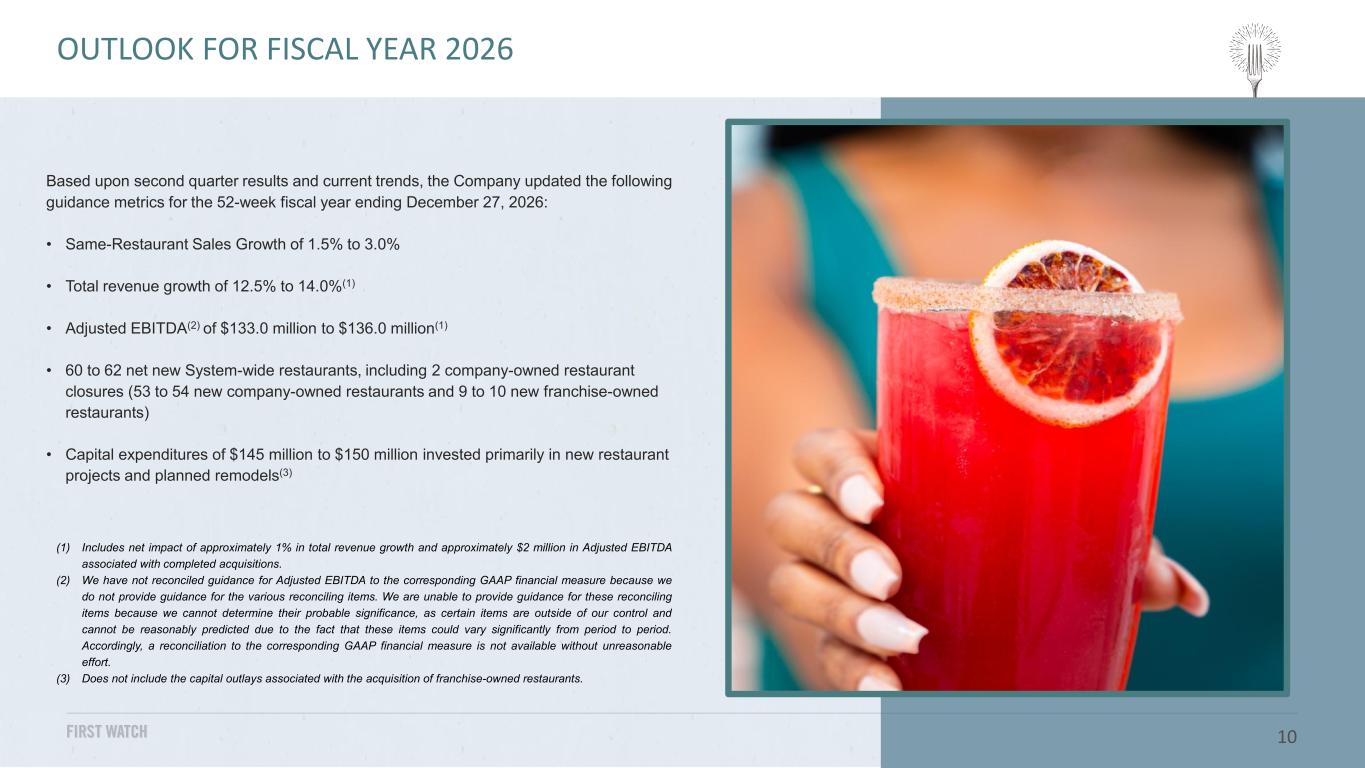
Based upon second quarter results and current trends, the Company updated the following guidance metrics for the 52-week fiscal year ending December 27, 2026: • Same-Restaurant Sales Growth of 1.5% to 3.0% • Total revenue growth of 12.5% to 14.0%(1) • Adjusted EBITDA(2) of $133.0 million to $136.0 million(1) • 60 to 62 net new System-wide restaurants, including 2 company-owned restaurant closures (53 to 54 new company-owned restaurants and 9 to 10 new franchise-owned restaurants) • Capital expenditures of $145 million to $150 million invested primarily in new restaurant projects and planned remodels(3) 10 OUTLOOK (1) Includes net impact of approximately 1% in total revenue growth and approximately $2 million in Adjusted EBITDA associated with completed acquisitions. (2) We have not reconciled guidance for Adjusted EBITDA to the corresponding GAAP financial measure because we do not provide guidance for the various reconciling items. We are unable to provide guidance for these reconciling items because we cannot determine their probable significance, as certain items are outside of our control and cannot be reasonably predicted due to the fact that these items could vary significantly from period to period. Accordingly, a reconciliation to the corresponding GAAP financial measure is not available without unreasonable effort. (3) Does not include the capital outlays associated with the acquisition of franchise-owned restaurants. OUTLOOK FOR FISCAL YEAR 2026
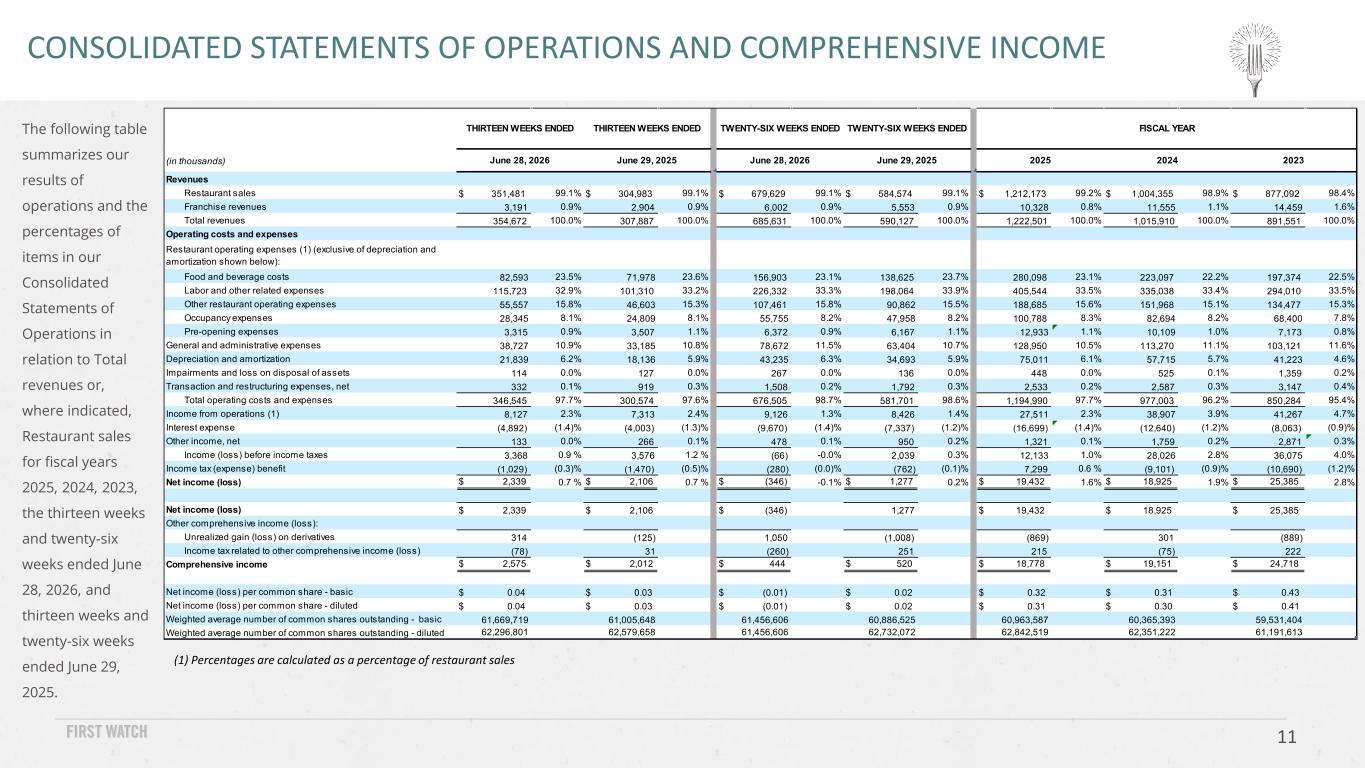
11 The following table summarizes our results of operations and the percentages of items in our Consolidated Statements of Operations in relation to Total revenues or, where indicated, Restaurant sales for fiscal years 2025, 2024, 2023, the thirteen weeks and twenty-six weeks ended June 28, 2026, and thirteen weeks and twenty-six weeks ended June 29, 2025. CONSOLIDATED STATEMENTS OF OPERATIONS AND COMPREHENSIVE INCOME (1) Percentages are calculated as a percentage of restaurant sales (in thousands) Revenues Restaurant sales $ 351,481 99.1% $ 304,983 99.1% $ 679,629 99.1% $ 584,574 99.1% $ 1,212,173 99.2% $ 1,004,355 98.9% $ 877,092 98.4% Franchise revenues 3,191 0.9% 2,904 0.9% 6,002 0.9% 5,553 0.9% 10,328 0.8% 11,555 1.1% 14,459 1.6% Total revenues 354,672 100.0% 307,887 100.0% 685,631 100.0% 590,127 100.0% 1,222,501 100.0% 1,015,910 100.0% 891,551 100.0% Operating costs and expenses Restaurant operating expenses (1) (exclusive of depreciation and amortization shown below): Food and beverage costs 82,593 23.5% 71,978 23.6% 156,903 23.1% 138,625 23.7% 280,098 23.1% 223,097 22.2% 197,374 22.5% Labor and other related expenses 115,723 32.9% 101,310 33.2% 226,332 33.3% 198,064 33.9% 405,544 33.5% 335,038 33.4% 294,010 33.5% Other restaurant operating expenses 55,557 15.8% 46,603 15.3% 107,461 15.8% 90,862 15.5% 188,685 15.6% 151,968 15.1% 134,477 15.3% Occupancy expenses 28,345 8.1% 24,809 8.1% 55,755 8.2% 47,958 8.2% 100,788 8.3% 82,694 8.2% 68,400 7.8% Pre-opening expenses 3,315 0.9% 3,507 1.1% 6,372 0.9% 6,167 1.1% 12,933 1.1% 10,109 1.0% 7,173 0.8% General and administrative expenses 38,727 10.9% 33,185 10.8% 78,672 11.5% 63,404 10.7% 128,950 10.5% 113,270 11.1% 103,121 11.6% Depreciation and amortization 21,839 6.2% 18,136 5.9% 43,235 6.3% 34,693 5.9% 75,011 6.1% 57,715 5.7% 41,223 4.6% Impairments and loss on disposal of assets 114 0.0% 127 0.0% 267 0.0% 136 0.0% 448 0.0% 525 0.1% 1,359 0.2% Transaction and restructuring expenses, net 332 0.1% 919 0.3% 1,508 0.2% 1,792 0.3% 2,533 0.2% 2,587 0.3% 3,147 0.4% Total operating costs and expenses 346,545 97.7% 300,574 97.6% 676,505 98.7% 581,701 98.6% 1,194,990 97.7% 977,003 96.2% 850,284 95.4% Income from operations (1) 8,127 2.3% 7,313 2.4% 9,126 1.3% 8,426 1.4% 27,511 2.3% 38,907 3.9% 41,267 4.7% Interest expense (4,892) (1.4)% (4,003) (1.3)% (9,670) (1.4)% (7,337) (1.2)% (16,699) (1.4)% (12,640) (1.2)% (8,063) (0.9)% Other income, net 133 0.0% 266 0.1% 478 0.1% 950 0.2% 1,321 0.1% 1,759 0.2% 2,871 0.3% Income (loss) before income taxes 3,368 0.9 % 3,576 1.2 % (66) -0.0% 2,039 0.3% 12,133 1.0% 28,026 2.8% 36,075 4.0% Income tax (expense) benefit (1,029) (0.3)% (1,470) (0.5)% (280) (0.0)% (762) (0.1)% 7,299 0.6 % (9,101) (0.9)% (10,690) (1.2)% Net income (loss) $ 2,339 0.7 % $ 2,106 0.7 % $ (346) -0.1% $ 1,277 0.2% $ 19,432 1.6% $ 18,925 1.9% $ 25,385 2.8% Net income (loss) $ 2,339 $ 2,106 $ (346) 1,277 $ 19,432 $ 18,925 $ 25,385 Other comprehensive income (loss): Unrealized gain (loss) on derivatives 314 (125) 1,050 (1,008) (869) 301 (889) Income tax related to other comprehensive income (loss) (78) 31 (260) 251 215 (75) 222 Comprehensive income $ 2,575 $ 2,012 $ 444 $ 520 $ 18,778 $ 19,151 $ 24,718 Net income (loss) per common share - basic $ 0.04 $ 0.03 $ (0.01) $ 0.02 $ 0.32 $ 0.31 $ 0.43 Net income (loss) per common share - diluted $ 0.04 $ 0.03 $ (0.01) $ 0.02 $ 0.31 $ 0.30 $ 0.41 Weighted average number of common shares outstanding - basic 61,669,719 61,005,648 61,456,606 60,886,525 60,963,587 60,365,393 59,531,404 Weighted average number of common shares outstanding - diluted 62,296,801 62,579,658 61,456,606 62,732,072 62,842,519 62,351,222 61,191,613 THIRTEEN WEEKS ENDED June 28, 2026 June 29, 2025 THIRTEEN WEEKS ENDED June 28, 2026 TWENTY-SIX WEEKS ENDED TWENTY-SIX WEEKS ENDED June 29, 2025 2025 2024 FISCAL YEAR 2023
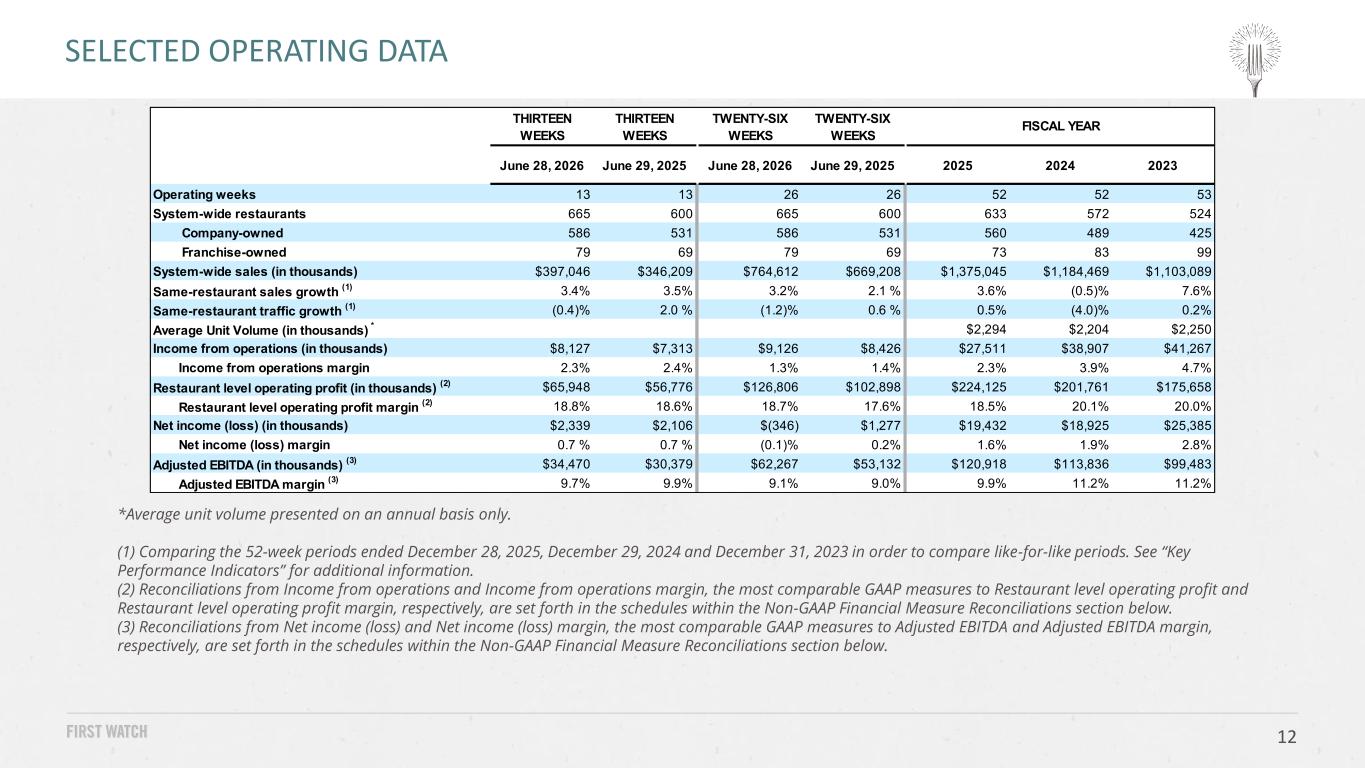
12 SELECTED OPERATING DATA *Average unit volume presented on an annual basis only. (1) Comparing the 52-week periods ended December 28, 2025, December 29, 2024 and December 31, 2023 in order to compare like-for-like periods. See “Key Performance Indicators” for additional information. (2) Reconciliations from Income from operations and Income from operations margin, the most comparable GAAP measures to Restaurant level operating profit and Restaurant level operating profit margin, respectively, are set forth in the schedules within the Non-GAAP Financial Measure Reconciliations section below. (3) Reconciliations from Net income (loss) and Net income (loss) margin, the most comparable GAAP measures to Adjusted EBITDA and Adjusted EBITDA margin, respectively, are set forth in the schedules within the Non-GAAP Financial Measure Reconciliations section below. THIRTEEN WEEKS THIRTEEN WEEKS TWENTY-SIX WEEKS TWENTY-SIX WEEKS June 28, 2026 June 29, 2025 June 28, 2026 June 29, 2025 2025 2024 2023 Operating weeks 13 13 26 26 52 52 53 System-wide restaurants 665 600 665 600 633 572 524 Company-owned 586 531 586 531 560 489 425 Franchise-owned 79 69 79 69 73 83 99 System-wide sales (in thousands) $397,046 $346,209 $764,612 $669,208 $1,375,045 $1,184,469 $1,103,089 Same-restaurant sales growth (1) 3.4% 3.5% 3.2% 2.1 % 3.6% (0.5)% 7.6% Same-restaurant traffic growth (1) (0.4)% 2.0 % (1.2)% 0.6 % 0.5% (4.0)% 0.2% Average Unit Volume (in thousands) * $2,294 $2,204 $2,250 Income from operations (in thousands) $8,127 $7,313 $9,126 $8,426 $27,511 $38,907 $41,267 Income from operations margin 2.3% 2.4% 1.3% 1.4% 2.3% 3.9% 4.7% Restaurant level operating profit (in thousands) (2) $65,948 $56,776 $126,806 $102,898 $224,125 $201,761 $175,658 Restaurant level operating profit margin (2) 18.8% 18.6% 18.7% 17.6% 18.5% 20.1% 20.0% Net income (loss) (in thousands) $2,339 $2,106 $(346) $1,277 $19,432 $18,925 $25,385 Net income (loss) margin 0.7 % 0.7 % (0.1)% 0.2% 1.6% 1.9% 2.8% Adjusted EBITDA (in thousands) (3) $34,470 $30,379 $62,267 $53,132 $120,918 $113,836 $99,483 Adjusted EBITDA margin (3) 9.7% 9.9% 9.1% 9.0% 9.9% 11.2% 11.2% FISCAL YEAR

APPENDIX
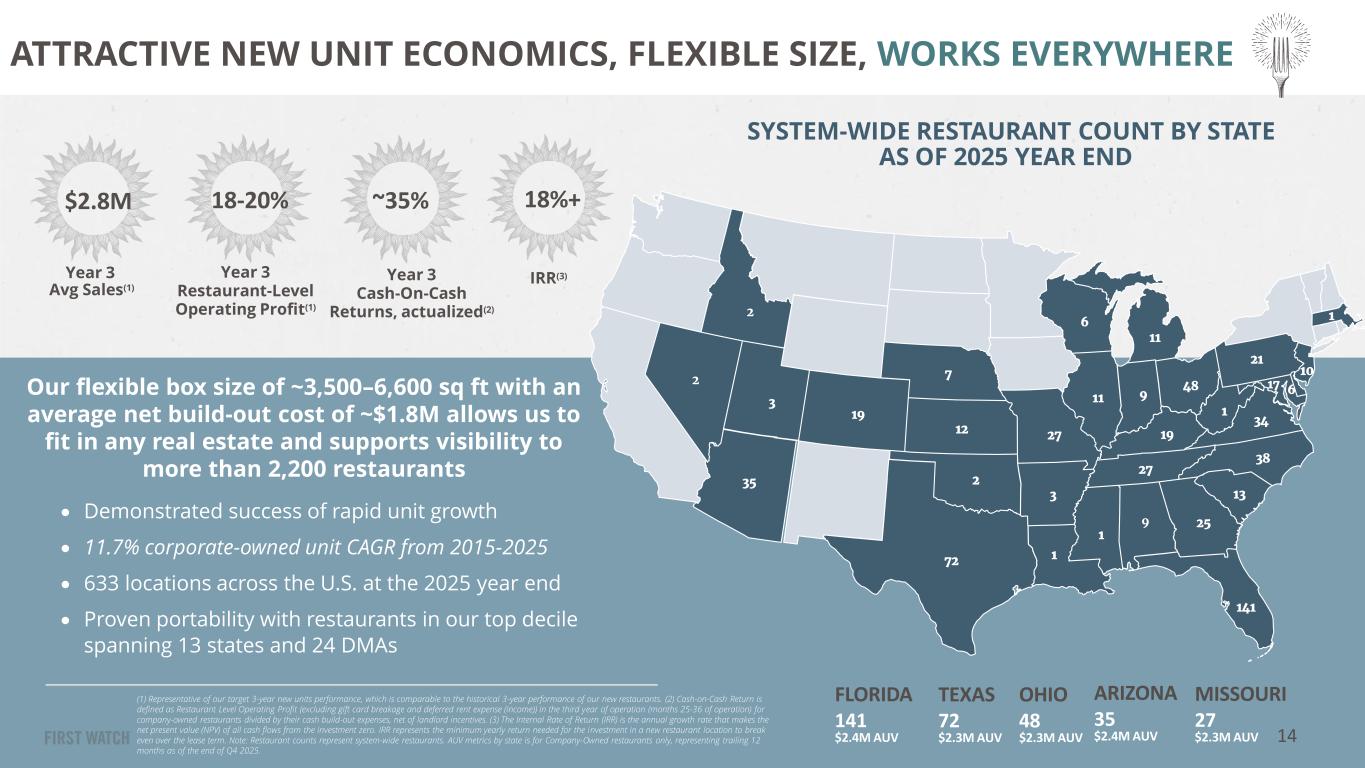
SYSTEM-WIDE RESTAURANT COUNT BY STATE AS OF 2025 YEAR END Our flexible box size of ~3,500–6,600 sq ft with an average net build-out cost of ~$1.8M allows us to fit in any real estate and supports visibility to more than 2,200 restaurants (1) Representative of our target 3-year new units performance, which is comparable to the historical 3-year performance of our new restaurants. (2) Cash-on-Cash Return is defined as Restaurant Level Operating Profit (excluding gift card breakage and deferred rent expense (income)) in the third year of operation (months 25-36 of operation) for company-owned restaurants divided by their cash build-out expenses, net of landlord incentives. (3) The Internal Rate of Return (IRR) is the annual growth rate that makes the net present value (NPV) of all cash flows from the investment zero. IRR represents the minimum yearly return needed for the investment in a new restaurant location to break even over the lease term. Note: Restaurant counts represent system-wide restaurants. AUV metrics by state is for Company-Owned restaurants only, representing trailing 12 months as of the end of Q4 2025. 3 19 12 7 27 3 72 1 1 9 25 141 13 38 27 19 11 6 11 48 1 34 21 10 17 69 35 2 • Demonstrated success of rapid unit growth • 11.7% corporate-owned unit CAGR from 2015-2025 • 633 locations across the U.S. at the 2025 year end • Proven portability with restaurants in our top decile spanning 13 states and 24 DMAs $2.8M 18-20% ~35% 18%+ Year 3 Avg Sales(1) Year 3 Restaurant-Level Operating Profit(1) Year 3 Cash-On-Cash Returns, actualized(2) IRR(3) ATTRACTIVE NEW UNIT ECONOMICS, FLEXIBLE SIZE, WORKS EVERYWHERE FLORIDA 141 $2.4M AUV OHIO 48 $2.3M AUV MISSOURI 27 $2.3M AUV ARIZONA 35 $2.4M AUV TEXAS 72 $2.3M AUV 2 12 14
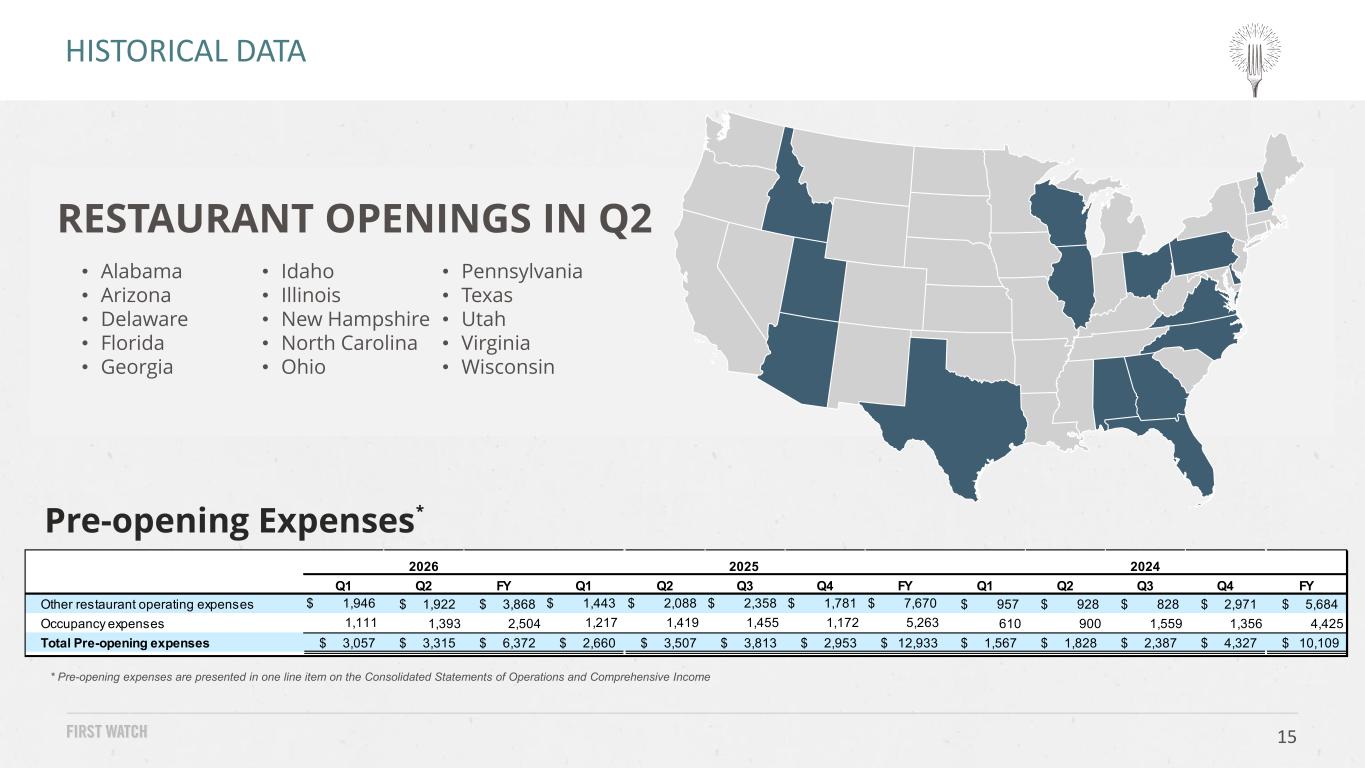
15 * Pre-opening expenses are presented in one line item on the Consolidated Statements of Operations and Comprehensive Income Pre-opening Expenses* HISTORICAL DATA Q1 Q2 FY Q1 Q2 Q3 Q4 FY Q1 Q2 Q3 Q4 FY Other restaurant operating expenses $ 1,946 $ 1,922 $ 3,868 $ 1,443 $ 2,088 $ 2,358 $ 1,781 $ 7,670 $ 957 $ 928 $ 828 $ 2,971 $ 5,684 Occupancy expenses 1,111 1,393 2,504 1,217 1,419 1,455 1,172 5,263 610 900 1,559 1,356 4,425 Total Pre-opening expenses $ 3,057 $ 3,315 $ 6,372 $ 2,660 $ 3,507 $ 3,813 $ 2,953 $ 12,933 $ 1,567 $ 1,828 $ 2,387 $ 4,327 $ 10,109 2026 2025 2024 RESTAURANT OPENINGS IN Q2 • Alabama • Arizona • Delaware • Florida • Georgia • Idaho • Illinois • New Hampshire • North Carolina • Ohio • Pennsylvania • Texas • Utah • Virginia • Wisconsin
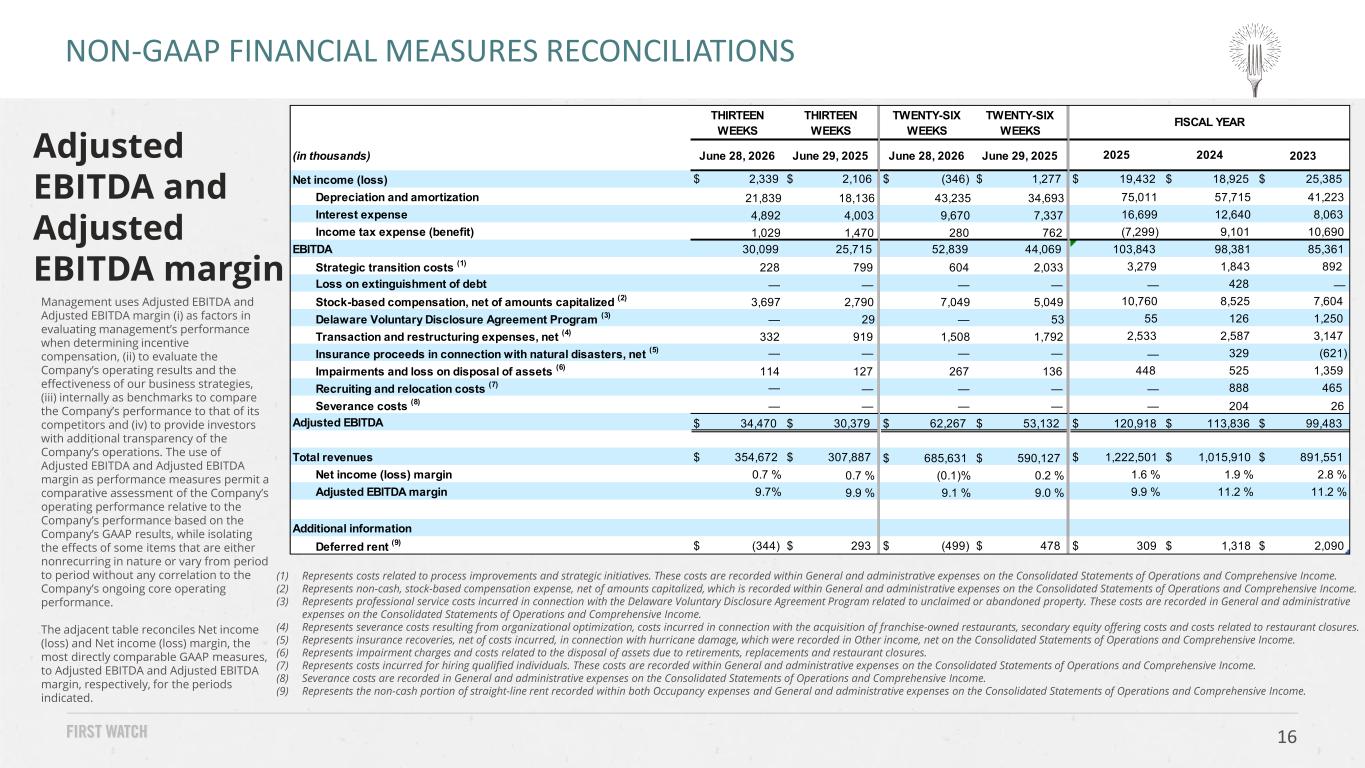
16 Management uses Adjusted EBITDA and Adjusted EBITDA margin (i) as factors in evaluating management’s performance when determining incentive compensation, (ii) to evaluate the Company’s operating results and the effectiveness of our business strategies, (iii) internally as benchmarks to compare the Company’s performance to that of its competitors and (iv) to provide investors with additional transparency of the Company’s operations. The use of Adjusted EBITDA and Adjusted EBITDA margin as performance measures permit a comparative assessment of the Company’s operating performance relative to the Company’s performance based on the Company’s GAAP results, while isolating the effects of some items that are either nonrecurring in nature or vary from period to period without any correlation to the Company’s ongoing core operating performance. The adjacent table reconciles Net income (loss) and Net income (loss) margin, the most directly comparable GAAP measures, to Adjusted EBITDA and Adjusted EBITDA margin, respectively, for the periods indicated. NON-GAAP FINANCIAL MEASURES RECONCILIATIONS Adjusted EBITDA and Adjusted EBITDA margin (1) Represents costs related to process improvements and strategic initiatives. These costs are recorded within General and administrative expenses on the Consolidated Statements of Operations and Comprehensive Income. (2) Represents non-cash, stock-based compensation expense, net of amounts capitalized, which is recorded within General and administrative expenses on the Consolidated Statements of Operations and Comprehensive Income. (3) Represents professional service costs incurred in connection with the Delaware Voluntary Disclosure Agreement Program related to unclaimed or abandoned property. These costs are recorded in General and administrative expenses on the Consolidated Statements of Operations and Comprehensive Income. (4) Represents severance costs resulting from organizational optimization, costs incurred in connection with the acquisition of franchise-owned restaurants, secondary equity offering costs and costs related to restaurant closures. (5) Represents insurance recoveries, net of costs incurred, in connection with hurricane damage, which were recorded in Other income, net on the Consolidated Statements of Operations and Comprehensive Income. (6) Represents impairment charges and costs related to the disposal of assets due to retirements, replacements and restaurant closures. (7) Represents costs incurred for hiring qualified individuals. These costs are recorded within General and administrative expenses on the Consolidated Statements of Operations and Comprehensive Income. (8) Severance costs are recorded in General and administrative expenses on the Consolidated Statements of Operations and Comprehensive Income. (9) Represents the non-cash portion of straight-line rent recorded within both Occupancy expenses and General and administrative expenses on the Consolidated Statements of Operations and Comprehensive Income. THIRTEEN WEEKS THIRTEEN WEEKS TWENTY-SIX WEEKS TWENTY-SIX WEEKS (in thousands) June 28, 2026 June 29, 2025 June 28, 2026 June 29, 2025 2023 Net income (loss) $ 2,339 $ 2,106 $ (346) $ 1,277 $ 19,432 $ 18,925 $ 25,385 Depreciation and amortization 21,839 18,136 43,235 34,693 75,011 57,715 41,223 Interest expense 4,892 4,003 9,670 7,337 16,699 12,640 8,063 Income tax expense (benefit) 1,029 1,470 280 762 (7,299) 9,101 10,690 EBITDA 30,099 25,715 52,839 44,069 103,843 98,381 85,361 Strategic transition costs (1) 228 799 604 2,033 3,279 1,843 892 Loss on extinguishment of debt — — — — — 428 — Stock-based compensation, net of amounts capitalized (2) 3,697 2,790 7,049 5,049 10,760 8,525 7,604 Delaware Voluntary Disclosure Agreement Program (3) — 29 — 53 55 126 1,250 Transaction and restructuring expenses, net (4) 332 919 1,508 1,792 2,533 2,587 3,147 Insurance proceeds in connection with natural disasters, net (5) — — — — — 329 (621) Impairments and loss on disposal of assets (6) 114 127 267 136 448 525 1,359 Recruiting and relocation costs (7) — — — — — 888 465 Severance costs (8) — — — — — 204 26 Adjusted EBITDA $ 34,470 $ 30,379 $ 62,267 $ 53,132 $ 120,918 $ 113,836 $ 99,483 Total revenues $ 354,672 $ 307,887 $ 685,631 $ 590,127 $ 1,222,501 $ 1,015,910 $ 891,551 Net income (loss) margin 0.7 % 0.7 % (0.1)% 0.2 % 1.6 % 1.9 % 2.8 % Adjusted EBITDA margin 9.7% 9.9 % 9.1 % 9.0 % 9.9 % 11.2 % 11.2 % Additional information Deferred rent (9) $ (344) $ 293 $ (499) $ 478 $ 309 $ 1,318 $ 2,090 2025 FISCAL YEAR 2024
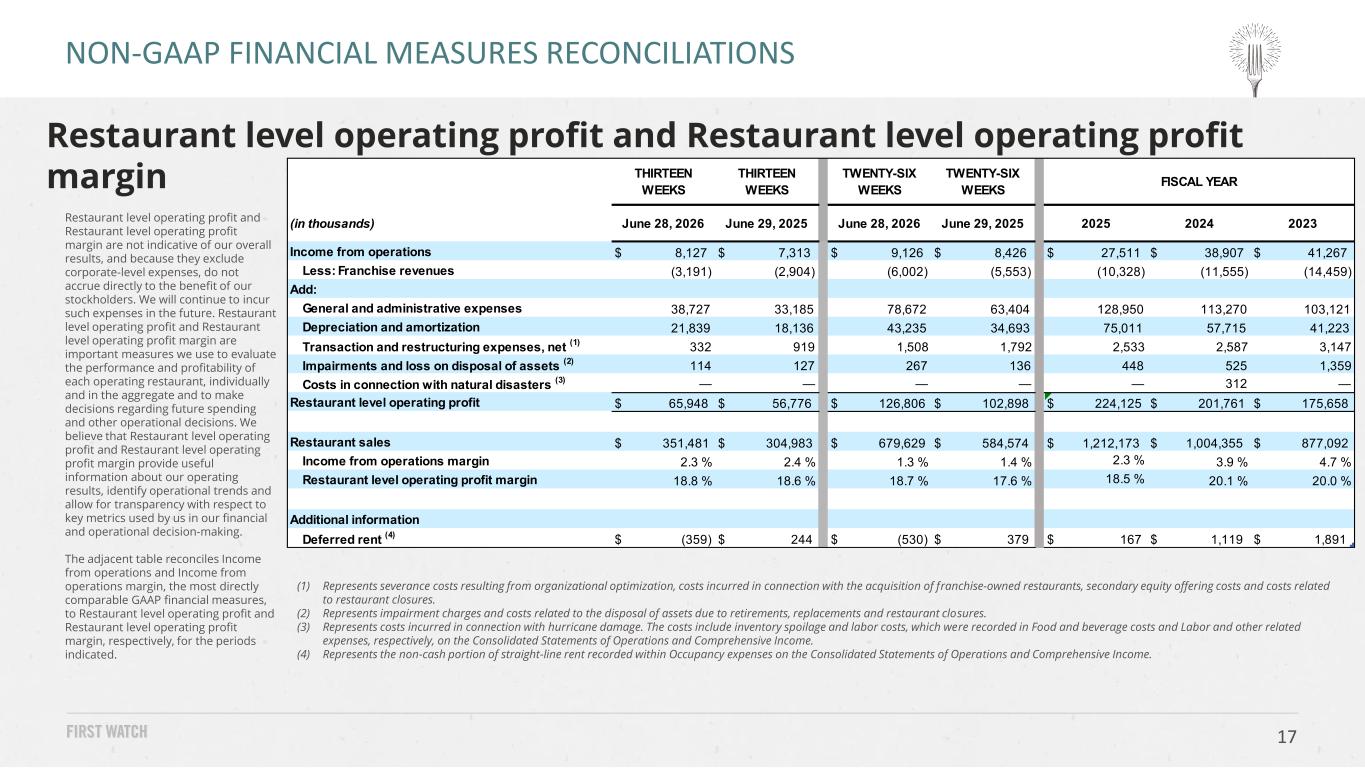
17 Restaurant level operating profit and Restaurant level operating profit margin are not indicative of our overall results, and because they exclude corporate-level expenses, do not accrue directly to the benefit of our stockholders. We will continue to incur such expenses in the future. Restaurant level operating profit and Restaurant level operating profit margin are important measures we use to evaluate the performance and profitability of each operating restaurant, individually and in the aggregate and to make decisions regarding future spending and other operational decisions. We believe that Restaurant level operating profit and Restaurant level operating profit margin provide useful information about our operating results, identify operational trends and allow for transparency with respect to key metrics used by us in our financial and operational decision-making. The adjacent table reconciles Income from operations and Income from operations margin, the most directly comparable GAAP financial measures, to Restaurant level operating profit and Restaurant level operating profit margin, respectively, for the periods indicated. Restaurant level operating profit and Restaurant level operating profit margin NON-GAAP FINANCIAL MEASURES RECONCILIATIONS (1) Represents severance costs resulting from organizational optimization, costs incurred in connection with the acquisition of franchise-owned restaurants, secondary equity offering costs and costs related to restaurant closures. (2) Represents impairment charges and costs related to the disposal of assets due to retirements, replacements and restaurant closures. (3) Represents costs incurred in connection with hurricane damage. The costs include inventory spoilage and labor costs, which were recorded in Food and beverage costs and Labor and other related expenses, respectively, on the Consolidated Statements of Operations and Comprehensive Income. (4) Represents the non-cash portion of straight-line rent recorded within Occupancy expenses on the Consolidated Statements of Operations and Comprehensive Income. THIRTEEN WEEKS THIRTEEN WEEKS TWENTY-SIX WEEKS TWENTY-SIX WEEKS (in thousands) June 28, 2026 June 29, 2025 June 28, 2026 June 29, 2025 2025 2024 2023 Income from operations $ 8,127 $ 7,313 $ 9,126 $ 8,426 $ 27,511 $ 38,907 $ 41,267 Less: Franchise revenues (3,191) (2,904) (6,002) (5,553) (10,328) (11,555) (14,459) Add: General and administrative expenses 38,727 33,185 78,672 63,404 128,950 113,270 103,121 Depreciation and amortization 21,839 18,136 43,235 34,693 75,011 57,715 41,223 Transaction and restructuring expenses, net (1) 332 919 1,508 1,792 2,533 2,587 3,147 Impairments and loss on disposal of assets (2) 114 127 267 136 448 525 1,359 Costs in connection with natural disasters (3) — — — — — 312 — Restaurant level operating profit $ 65,948 $ 56,776 $ 126,806 $ 102,898 $ 224,125 $ 201,761 $ 175,658 Restaurant sales $ 351,481 $ 304,983 $ 679,629 $ 584,574 $ 1,212,173 $ 1,004,355 $ 877,092 Income from operations margin 2.3 % 2.4 % 1.3 % 1.4 % 2.3 % 3.9 % 4.7 % Restaurant level operating profit margin 18.8 % 18.6 % 18.7 % 17.6 % 18.5 % 20.1 % 20.0 % Additional information Deferred rent (4) $ (359) $ 244 $ (530) $ 379 $ 167 $ 1,119 $ 1,891 FISCAL YEAR
18 Adjusted EBITDA: represents Net income (loss) before depreciation and amortization, interest expense, income taxes, and items that we do not consider in our evaluation of ongoing core operating performance as identified in the reconciliation of Net loss, the most directly comparable measure in accordance with GAAP, to Adjusted EBITDA, included in the section Non-GAAP Financial Measure Reconciliations above. Adjusted EBITDA Margin: represents Adjusted EBITDA as a percentage of total revenues. See Non-GAAP Financial Measure Reconciliations above for a reconciliation to Net loss margin, the most directly comparable GAAP measure. Average Unit Volume: the total restaurant sales (excluding gift card breakage) recognized in the comparable restaurant base, which is defined as the number of company-owned First Watch branded restaurants open for 18 months or longer as of the beginning of the fiscal year (“Comparable Restaurant Base”), divided by the number of restaurants in the Comparable Restaurant Base during the period. This measurement allows management to assess changes in consumer spending patterns at our restaurants and the overall performance of our restaurant base. Restaurant Level Operating Profit: represents restaurant sales, less restaurant operating expenses, which include food and beverage costs, labor and other related expenses, other restaurant operating expenses, pre- opening expenses and occupancy expenses. Restaurant level operating profit excludes corporate-level expenses and other items that we do not consider in the evaluation of the ongoing core operating performance of our restaurants as identified in the reconciliation of Income from operations, the most directly comparable GAAP measure, to Restaurant level operating profit, included in the section Non-GAAP Financial Measure Reconciliations above. Restaurant Level Operating Profit Margin: represents Restaurant level operating profit as a percentage of restaurant sales. See Non-GAAP Financial Measure Reconciliations above for a reconciliation to Income from operations margin, the most directly comparable GAAP measure. Same-Restaurant Sales Growth: the percentage change in year-over-year restaurant sales (excluding gift card breakage) for the comparable restaurant base, which we define as the number of company-owned First Watch branded restaurants open for 18 months or longer as of the beginning of the fiscal year (“Comparable Restaurant Base”). For the thirteen and twenty-six weeks ended June 28, 2026 and June 29, 2025, there were 454 restaurants and 382 restaurants, respectively, in our Comparable Restaurant Base. Measuring our same-restaurant sales growth allows management to evaluate the performance of our existing restaurant base. We believe this measure is useful for investors to provide a consistent comparison of restaurant sales results and trends across periods within our core, established restaurant base, unaffected by results of store openings, closings, and other transitional changes. Same-Restaurant Traffic Growth: the percentage change in year-over-year traffic counts using the Comparable Restaurant Base. Measuring our same- restaurant traffic growth allows Management to evaluate the performance of our existing restaurant base. We believe this measure is useful for investors because same-restaurant traffic provides an indicator as to the development of our brand and the effectiveness of our marketing strategy. System-wide restaurants: the total number of restaurants, including all company-owned and franchise-owned restaurants. System-wide sales: consists of restaurant sales from our company-owned restaurants and franchise-owned restaurants. We do not recognize the restaurant sales from our franchise-owned restaurants as revenue. DEFINITIONS USED IN PRESENTATION

For more information, visit investors.firstwatch.com or email investors@firstwatch.com