Shareholder Report
May 31, 2026
USD ($)
holding
This annual shareholder report contains important information about the Sparkline Intangible Value ETF (the “Fund”) for the period of June 1, 2025 to May 31, 2026 (the “Period”). You can find additional information about the Fund at https://etf.sparklinecapital.com/itan/. You can also request this information by contacting us at (215) 330-4476. For information regarding your Fund shares or account, including account balances, transactions, or distributions, please contact your financial intermediary. | |||||||||||
Availability of Additional Information
For additional information about the Fund, including its prospectus, financial information, holdings, and proxy information, visit https://etf.sparklinecapital.com/itan/. You can also request information by calling (215) 330-4476.
Householding
Householding is an option available to certain investors of the Fund. Householding is a method of delivery, based on the preference of the individual investor, in which a single copy of certain shareholder documents can be delivered to investors who share the same address, even if their accounts are registered under different names. Householding for the Fund is available through certain broker-dealers. If you are interested in enrolling in householding and receiving a single copy of prospectuses and other shareholder documents or you are currently enrolled in householding and wish to change your householding status, please contact your broker-dealer.
| WHAT WERE THE FUND COSTS FOR THE PERIOD? (based on a hypothetical $10,000 investment) | |||||||||||
| COST OF $10,000 INVESTMENT | COST PAID AS A PERCENTAGE OF $10,000 INVESTMENT | ||||||||||
| $60 | 0.50% | ||||||||||
| WHAT FACTORS INFLUENCED PERFORMANCE FOR THE PERIOD? | |||||||||||
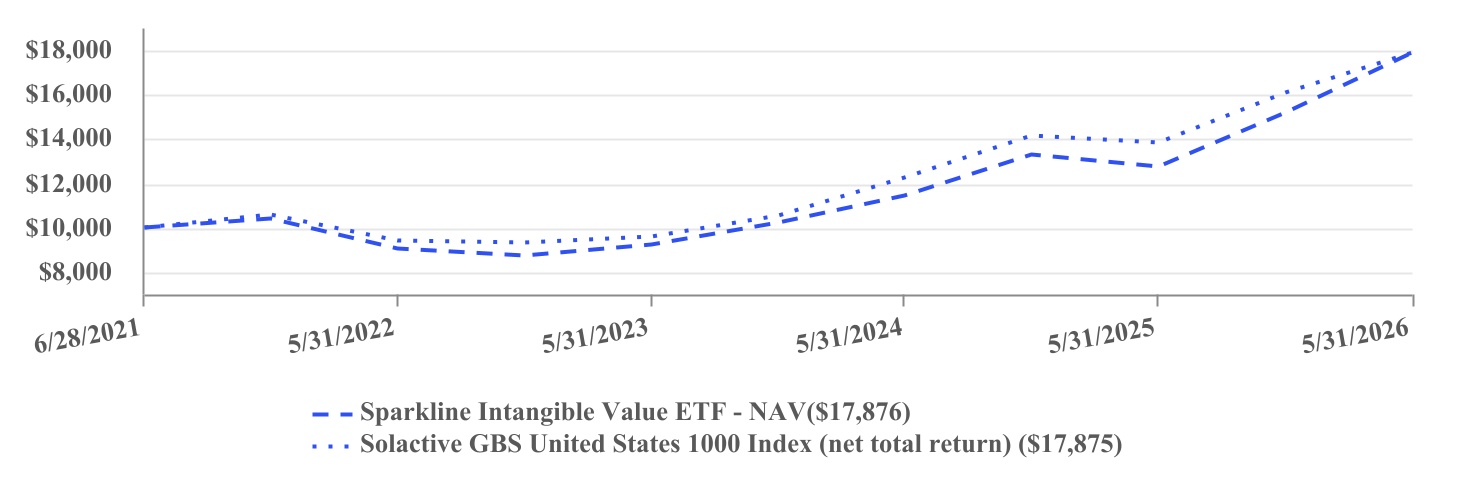
During the Period, ITAN returned 40.21% (on a NAV basis). This marked a strong year of performance, as the Fund’s focus on innovative firms with robust intangible assets continued to generate positive returns.
ITAN also outperformed in relative terms, with its 40.21% return exceeding the 28.99% return of the Solactive GBS United States 1000 Net Total Return Index by 11.22%. Outperformance was primarily fueled by strong security selection. For example, ITAN achieved this outperformance despite significantly lower exposure to AI infrastructure stocks, such as the Magnificent 7*, which the Fund has been rotating out of due to rising valuations and capital intensity.
* Amazon, Meta, Alphabet, Nvidia, Tesla, Microsoft, and Apple.
| HOW DID THE FUND PERFORM FOR THE PERIOD? | |||||||||||
| PERFORMANCE | |||||||||||
| One Year | Since Inception (6/28/2021) | ||||||||||
| Sparkline Intangible Value ETF - NAV | 40.21% | 12.52% | |||||||||
| Solactive GBS United States 1000 Index (net total return) | 28.99% | 12.52% | |||||||||
The Fund’s past performance is not a good predictor of how the Fund will perform in the future. The graph and table do not reflect the deduction of taxes that a shareholder would pay on fund distributions or redemption of fund shares. Net total return figures assume the reinvestment of dividends after deduction of withholding tax, applying the maximum rate to nonresident individual investors who do not benefit from double taxation treaties. | |||||||||||
Visit https://etf.sparklinecapital.com/itan/ for more recent performance information. | |||||||||||
| KEY FUND STATISTICS (as of Period End) | ||||||||||||||||||||
| Net Assets | $89,619,549 | Portfolio Turnover Rate* | 43% | |||||||||||||||||
| # of Portfolio Holdings | 159 | Fund Advisory Fees | $305,912 | |||||||||||||||||
| *Portfolio turnover is not annualized and is calculated without regard to short-term securities having a maturity of less than one year. Excludes impact of in-kind transactions. | ||||||||||||||||||||
| SECTOR WEIGHTING (as a % of Net Assets) | |||||
| Information Technology | 30.1% | ||||
| Health Care | 15.8% | ||||
| Industrials | 15.2% | ||||
| Communication Services | 13.9% | ||||
| Consumer Discretionary | 13.3% | ||||
| Financials | 5.1% | ||||
| Consumer Staples | 3.5% | ||||
| Materials | 1.5% | ||||
| Energy | 0.8% | ||||
| Real Estate | 0.3% | ||||
| Cash and Cash Equivalents | 0.5% | ||||
| TOP 10 HOLDINGS (as a % of Net Assets) | |||||
| Amazon.com, Inc. | 4.7% | ||||
| Intel Corp. | 2.7% | ||||
| Cisco Systems, Inc. | 2.3% | ||||
| International Business Machines Corp. | 2.2% | ||||
| Dell Technologies, Inc. | 2.2% | ||||
| QUALCOMM, Inc. | 2.2% | ||||
| Alphabet, Inc. - Class A | 1.9% | ||||
| Alphabet, Inc. - Class C | 1.9% | ||||
| Merck & Co, Inc. | 1.6% | ||||
| AT&T, Inc. | 1.4% | ||||
This annual shareholder report contains important information about the Sparkline International Intangible Value ETF (the “Fund”) for the period of June 1, 2025 to May 31, 2026 (the “Period). You can find additional information about the Fund at https://etf.sparklinecapital.com/dtan/. You can also request this information by contacting us at (215) 330-4476. For information regarding your Fund shares or account, including account balances, transactions, or distributions, please contact your financial intermediary. | |||||||||||
Availability of Additional Information
For additional information about the Fund, including its prospectus, financial information, holdings, and proxy information, visit https://etf.sparklinecapital.com/dtan/. You can also request information by calling (215) 330-4476.
Householding
Householding is an option available to certain investors of the Fund. Householding is a method of delivery, based on the preference of the individual investor, in which a single copy of certain shareholder documents can be delivered to investors who share the same address, even if their accounts are registered under different names. Householding for the Fund is available through certain broker-dealers. If you are interested in enrolling in householding and receiving a single copy of prospectuses and other shareholder documents or you are currently enrolled in householding and wish to change your householding status, please contact your broker-dealer.
| WHAT WERE THE FUND COSTS FOR THE PERIOD? (based on a hypothetical $10,000 investment) | |||||||||||
| COST OF $10,000 INVESTMENT | COST PAID AS A PERCENTAGE OF $10,000 INVESTMENT | ||||||||||
| $61 | 0.55% | ||||||||||
| WHAT FACTORS INFLUENCED PERFORMANCE FOR THE PERIOD? | |||||||||||
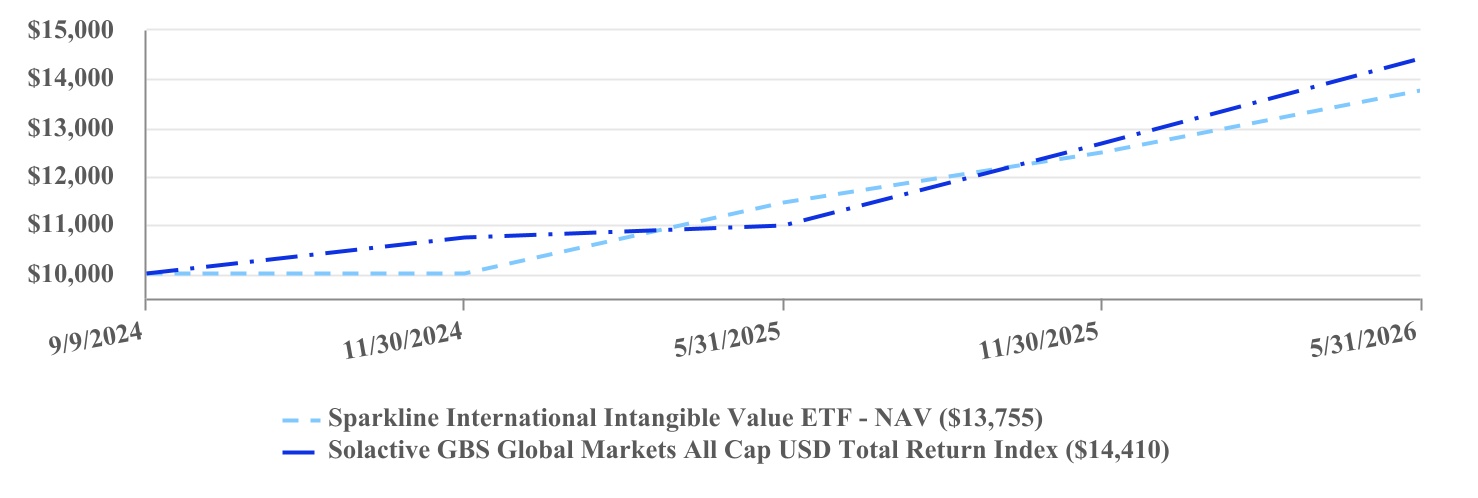
During the Period, DTAN returned 20.07% (on a NAV basis). This strong performance was driven by a resilient global stock market that largely shrugged off geopolitical risks, most notably in Iran.
Despite robust absolute returns, DTAN underperformed the Solactive GBS Global Markets All Cap USD Index, which returned 31.05%. This was primarily driven by DTAN’s focus on non-U.S. developed market stocks, which underperformed both U.S. and emerging market stocks, due mostly to their relative lack of AI infrastructure exposure. A secondary driver was DTAN’s underweight to non-U.S. developed market financial stocks, which surged despite scoring poorly on many intangible metrics. Despite these sector headwinds, DTAN actually produced strong security selection alpha, with the Fund’s holdings outperforming their respective sectors.
| HOW DID THE FUND PERFORM FOR THE PERIOD? | |||||||||||
| PERFORMANCE | |||||||||||
| One Year | Since Inception (9/9/24) | ||||||||||
| Sparkline International Intangible Value ETF - NAV | 20.07% | 20.32% | |||||||||
| Solactive GBS Global Markets All Cap USD Total Return Index | 31.05% | 23.62% | |||||||||
The Fund’s past performance is not a good predictor of how the Fund will perform in the future. The graph and table do not reflect the deduction of taxes that a shareholder would pay on fund distributions or redemption of fund shares. | |||||||||||
Visit https://etf.sparklinecapital.com/dtan/ for more recent performance information. | |||||||||||
| KEY FUND STATISTICS (as of Period End) | ||||||||||||||||||||
| Net Assets | $22,353,127 | Portfolio Turnover Rate* | 46% | |||||||||||||||||
| # of Portfolio Holdings | 120 | Fund Advisory Fees | $85,102 | |||||||||||||||||
| *Portfolio turnover is not annualized and is calculated without regard to short-term securities having a maturity of less than one year. Excludes impact of in-kind transactions. | ||||||||||||||||||||
| TOP 10 COUNTRY WEIGHTING (as a % of Net Assets) | |||||
| Japan | 20.7% | ||||
| Germany | 19.7% | ||||
| France | 11.7% | ||||
| United Kingdom | 11.5% | ||||
| Switzerland | 8.8% | ||||
| Netherlands | 7.0% | ||||
| Canada | 4.4% | ||||
| Sweden | 4.0% | ||||
| Denmark | 2.2% | ||||
| China | 1.7% | ||||
| TOP 10 HOLDINGS (as a % of Net Assets) | |||||
| Roche Holding AG | 3.4% | ||||
| Novartis AG | 3.2% | ||||
| L'Oreal SA | 2.8% | ||||
| Siemens AG | 2.7% | ||||
| Toyota Motor Corp. | 2.6% | ||||
| Shell PLC | 2.5% | ||||
| AstraZeneca PLC | 2.5% | ||||
| Hitachi Ltd | 2.3% | ||||
| Sanofi SA | 2.2% | ||||
| Sony Group Corp. | 2.0% | ||||